Moravia, NY Map & Demographics
Moravia Map
Moravia Overview
$28,084
PER CAPITA INCOME
$85,833
AVG FAMILY INCOME
$57,788
AVG HOUSEHOLD INCOME
25.0%
WAGE / INCOME GAP [ % ]
75.0¢/ $1
WAGE / INCOME GAP [ $ ]
0.41
INEQUALITY / GINI INDEX
1,398
TOTAL POPULATION
643
MALE POPULATION
755
FEMALE POPULATION
85.17
MALES / 100 FEMALES
117.42
FEMALES / 100 MALES
36.7
MEDIAN AGE
3.3
AVG FAMILY SIZE
2.7
AVG HOUSEHOLD SIZE
610
LABOR FORCE [ PEOPLE ]
57.2%
PERCENT IN LABOR FORCE
5.9%
UNEMPLOYMENT RATE
Moravia Zip Codes
Moravia Area Codes
Income in Moravia
Income Overview in Moravia
Per Capita Income in Moravia is $28,084, while median incomes of families and households are $85,833 and $57,788 respectively.
| Characteristic | Number | Measure |
| Per Capita Income | 1,398 | $28,084 |
| Median Family Income | 328 | $85,833 |
| Mean Family Income | 328 | $88,272 |
| Median Household Income | 513 | $57,788 |
| Mean Household Income | 513 | $73,341 |
| Income Deficit | 328 | $0 |
| Wage / Income Gap (%) | 1,398 | 24.95% |
| Wage / Income Gap ($) | 1,398 | 75.05¢ per $1 |
| Gini / Inequality Index | 1,398 | 0.41 |
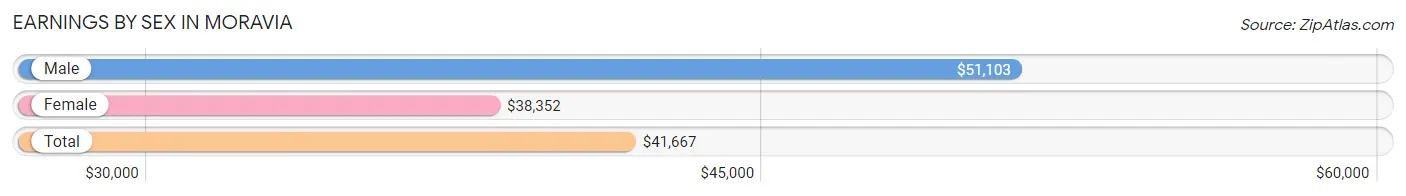
Earnings by Sex in Moravia
Average Earnings in Moravia are $41,667, $51,103 for men and $38,352 for women, a difference of 24.9%.
| Sex | Number | Average Earnings |
| Male | 301 (46.2%) | $51,103 |
| Female | 351 (53.8%) | $38,352 |
| Total | 652 (100.0%) | $41,667 |
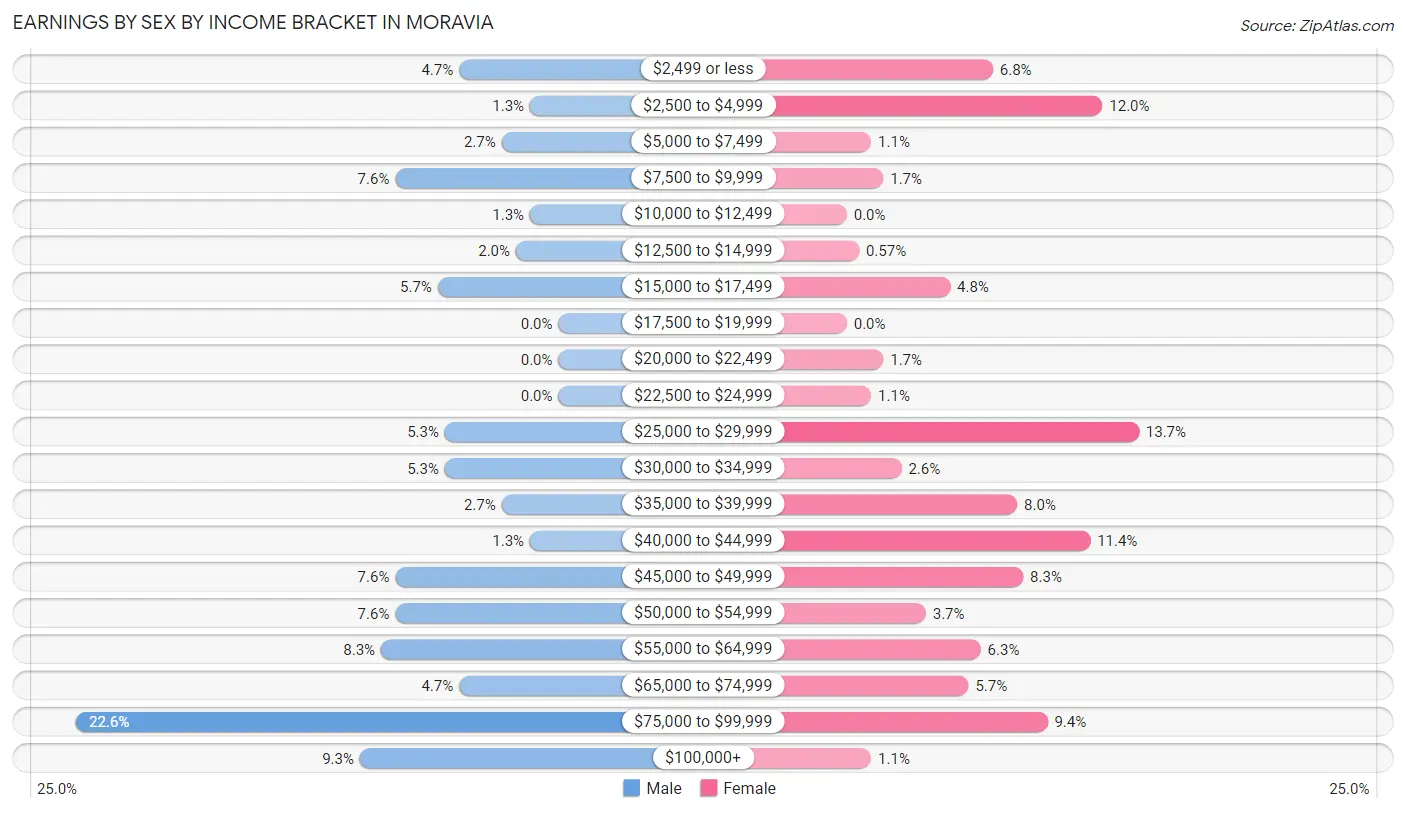
Earnings by Sex by Income Bracket in Moravia
The most common earnings brackets in Moravia are $75,000 to $99,999 for men (68 | 22.6%) and $25,000 to $29,999 for women (48 | 13.7%).
| Income | Male | Female |
| $2,499 or less | 14 (4.6%) | 24 (6.8%) |
| $2,500 to $4,999 | 4 (1.3%) | 42 (12.0%) |
| $5,000 to $7,499 | 8 (2.7%) | 4 (1.1%) |
| $7,500 to $9,999 | 23 (7.6%) | 6 (1.7%) |
| $10,000 to $12,499 | 4 (1.3%) | 0 (0.0%) |
| $12,500 to $14,999 | 6 (2.0%) | 2 (0.6%) |
| $15,000 to $17,499 | 17 (5.7%) | 17 (4.8%) |
| $17,500 to $19,999 | 0 (0.0%) | 0 (0.0%) |
| $20,000 to $22,499 | 0 (0.0%) | 6 (1.7%) |
| $22,500 to $24,999 | 0 (0.0%) | 4 (1.1%) |
| $25,000 to $29,999 | 16 (5.3%) | 48 (13.7%) |
| $30,000 to $34,999 | 16 (5.3%) | 9 (2.6%) |
| $35,000 to $39,999 | 8 (2.7%) | 28 (8.0%) |
| $40,000 to $44,999 | 4 (1.3%) | 40 (11.4%) |
| $45,000 to $49,999 | 23 (7.6%) | 29 (8.3%) |
| $50,000 to $54,999 | 23 (7.6%) | 13 (3.7%) |
| $55,000 to $64,999 | 25 (8.3%) | 22 (6.3%) |
| $65,000 to $74,999 | 14 (4.6%) | 20 (5.7%) |
| $75,000 to $99,999 | 68 (22.6%) | 33 (9.4%) |
| $100,000+ | 28 (9.3%) | 4 (1.1%) |
| Total | 301 (100.0%) | 351 (100.0%) |
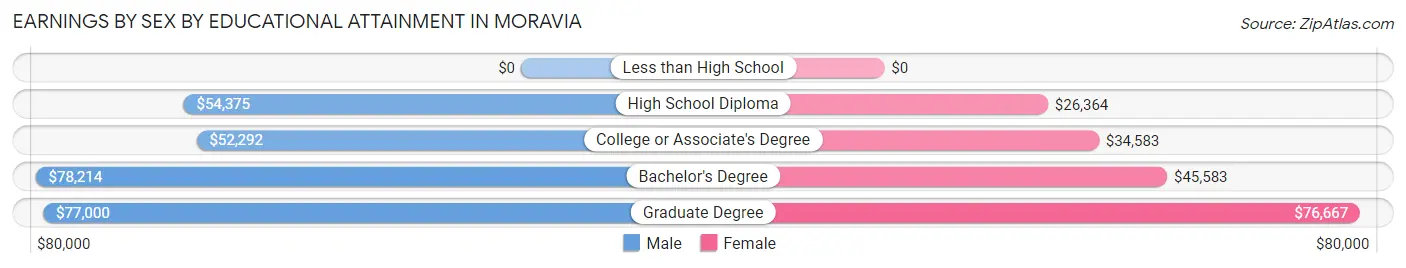
Earnings by Sex by Educational Attainment in Moravia
Average earnings in Moravia are $58,750 for men and $41,708 for women, a difference of 29.0%. Men with an educational attainment of bachelor's degree enjoy the highest average annual earnings of $78,214, while those with college or associate's degree education earn the least with $52,292. Women with an educational attainment of graduate degree earn the most with the average annual earnings of $76,667, while those with high school diploma education have the smallest earnings of $26,364.
| Educational Attainment | Male Income | Female Income |
| Less than High School | - | - |
| High School Diploma | $54,375 | $26,364 |
| College or Associate's Degree | $52,292 | $34,583 |
| Bachelor's Degree | $78,214 | $45,583 |
| Graduate Degree | $77,000 | $76,667 |
| Total | $58,750 | $41,708 |
Family Income in Moravia
Family Income Brackets in Moravia
According to the Moravia family income data, there are 75 families falling into the $75,000 to $99,999 income range, which is the most common income bracket and makes up 22.9% of all families.
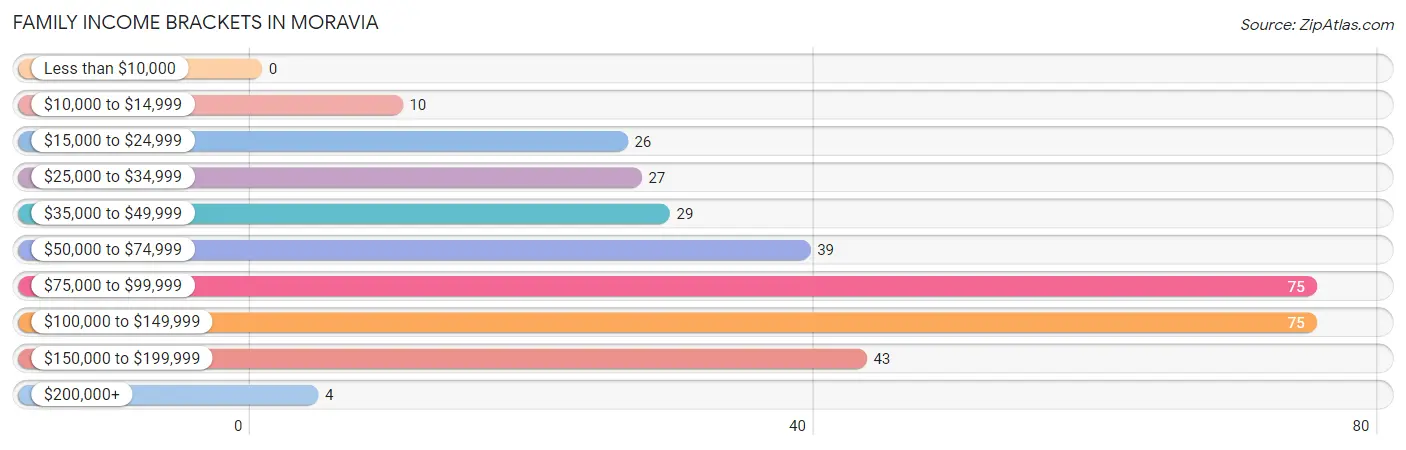
| Income Bracket | # Families | % Families |
| Less than $10,000 | 0 | 0.0% |
| $10,000 to $14,999 | 10 | 3.0% |
| $15,000 to $24,999 | 26 | 7.9% |
| $25,000 to $34,999 | 27 | 8.2% |
| $35,000 to $49,999 | 29 | 8.8% |
| $50,000 to $74,999 | 39 | 11.9% |
| $75,000 to $99,999 | 75 | 22.9% |
| $100,000 to $149,999 | 75 | 22.9% |
| $150,000 to $199,999 | 43 | 13.1% |
| $200,000+ | 4 | 1.2% |
Family Income by Famaliy Size in Moravia
4-person families (46 | 14.0%) account for the highest median family income in Moravia with $121,500 per family, while 2-person families (152 | 46.3%) have the highest median income of $37,250 per family member.
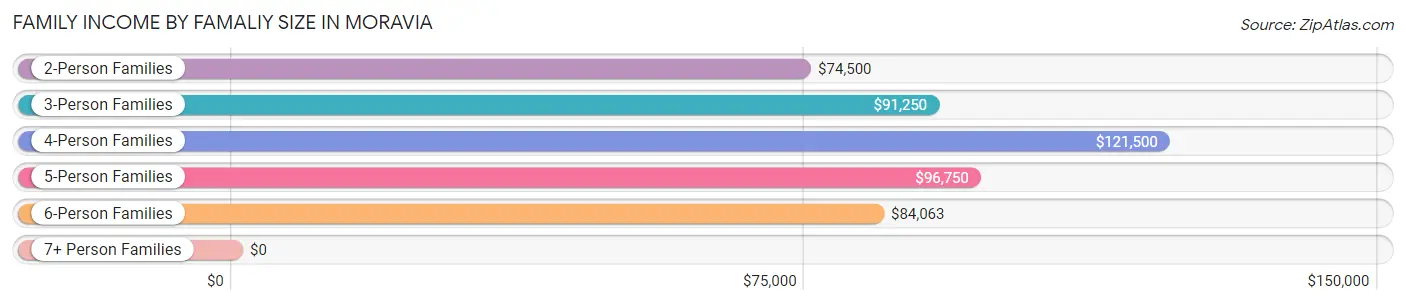
| Income Bracket | # Families | Median Income |
| 2-Person Families | 152 (46.3%) | $74,500 |
| 3-Person Families | 64 (19.5%) | $91,250 |
| 4-Person Families | 46 (14.0%) | $121,500 |
| 5-Person Families | 51 (15.5%) | $96,750 |
| 6-Person Families | 11 (3.4%) | $84,063 |
| 7+ Person Families | 4 (1.2%) | $0 |
| Total | 328 (100.0%) | $85,833 |
Family Income by Number of Earners in Moravia
The median family income in Moravia is $85,833, with families comprising 3+ earners (46) having the highest median family income of $138,500, while families with no earners (56) have the lowest median family income of $32,955, accounting for 14.0% and 17.1% of families, respectively.
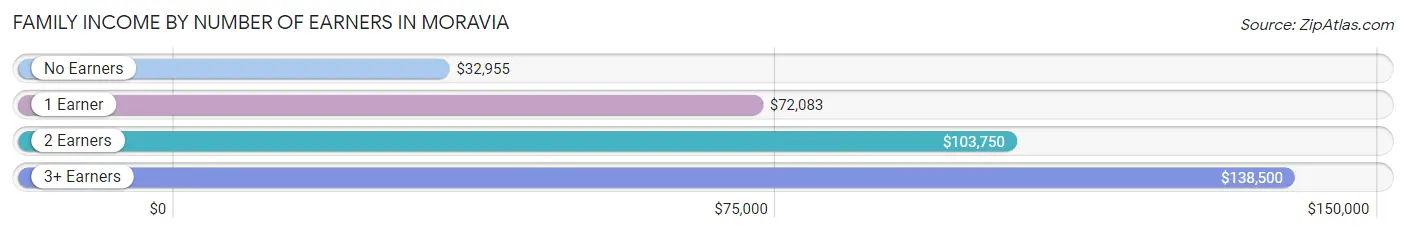
| Number of Earners | # Families | Median Income |
| No Earners | 56 (17.1%) | $32,955 |
| 1 Earner | 99 (30.2%) | $72,083 |
| 2 Earners | 127 (38.7%) | $103,750 |
| 3+ Earners | 46 (14.0%) | $138,500 |
| Total | 328 (100.0%) | $85,833 |
Household Income in Moravia
Household Income Brackets in Moravia
With 96 households falling in the category, the $35,000 to $49,999 income range is the most frequent in Moravia, accounting for 18.7% of all households. In contrast, only 16 households (3.1%) fall into the $200,000+ income bracket, making it the least populous group.
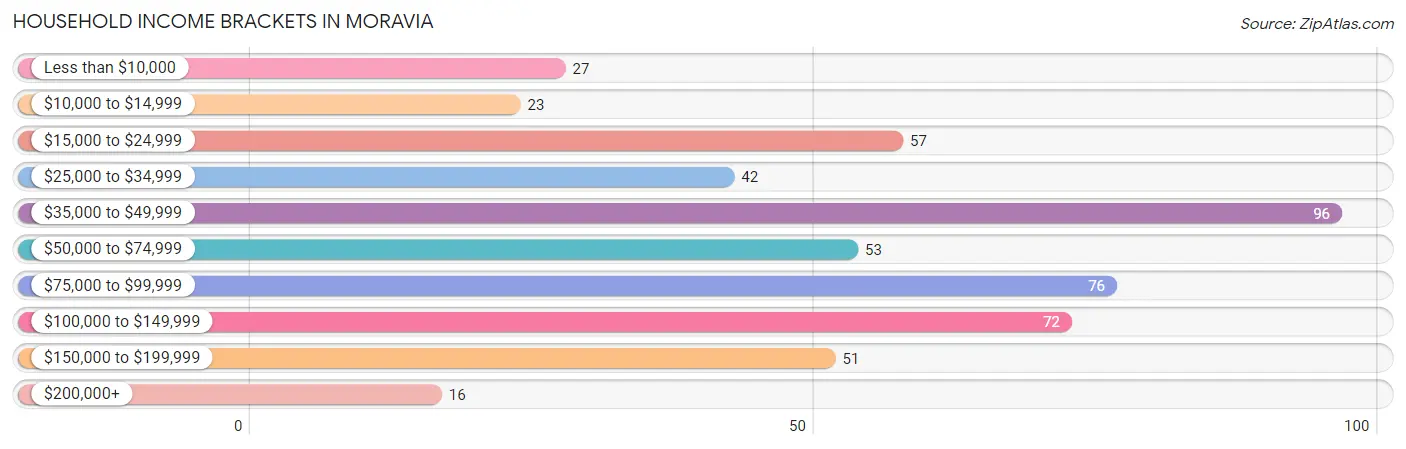
| Income Bracket | # Households | % Households |
| Less than $10,000 | 27 | 5.3% |
| $10,000 to $14,999 | 23 | 4.5% |
| $15,000 to $24,999 | 57 | 11.1% |
| $25,000 to $34,999 | 42 | 8.2% |
| $35,000 to $49,999 | 96 | 18.7% |
| $50,000 to $74,999 | 53 | 10.3% |
| $75,000 to $99,999 | 76 | 14.8% |
| $100,000 to $149,999 | 72 | 14.0% |
| $150,000 to $199,999 | 51 | 9.9% |
| $200,000+ | 16 | 3.1% |
Household Income by Householder Age in Moravia
The median household income in Moravia is $57,788, with the highest median household income of $119,219 found in the 45 to 64 years age bracket for the primary householder. A total of 149 households (29.0%) fall into this category. Meanwhile, the 15 to 24 years age bracket for the primary householder has the lowest median household income of $0, with 20 households (3.9%) in this group.
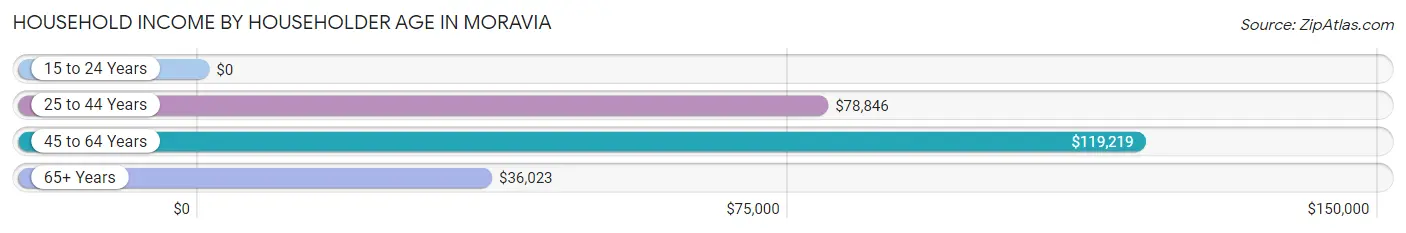
| Income Bracket | # Households | Median Income |
| 15 to 24 Years | 20 (3.9%) | $0 |
| 25 to 44 Years | 148 (28.8%) | $78,846 |
| 45 to 64 Years | 149 (29.0%) | $119,219 |
| 65+ Years | 196 (38.2%) | $36,023 |
| Total | 513 (100.0%) | $57,788 |
Poverty in Moravia
Income Below Poverty by Sex and Age in Moravia
With 10.1% poverty level for males and 13.9% for females among the residents of Moravia, 25 to 34 year old males and under 5 year old females are the most vulnerable to poverty, with 23 males (44.2%) and 17 females (29.8%) in their respective age groups living below the poverty level.
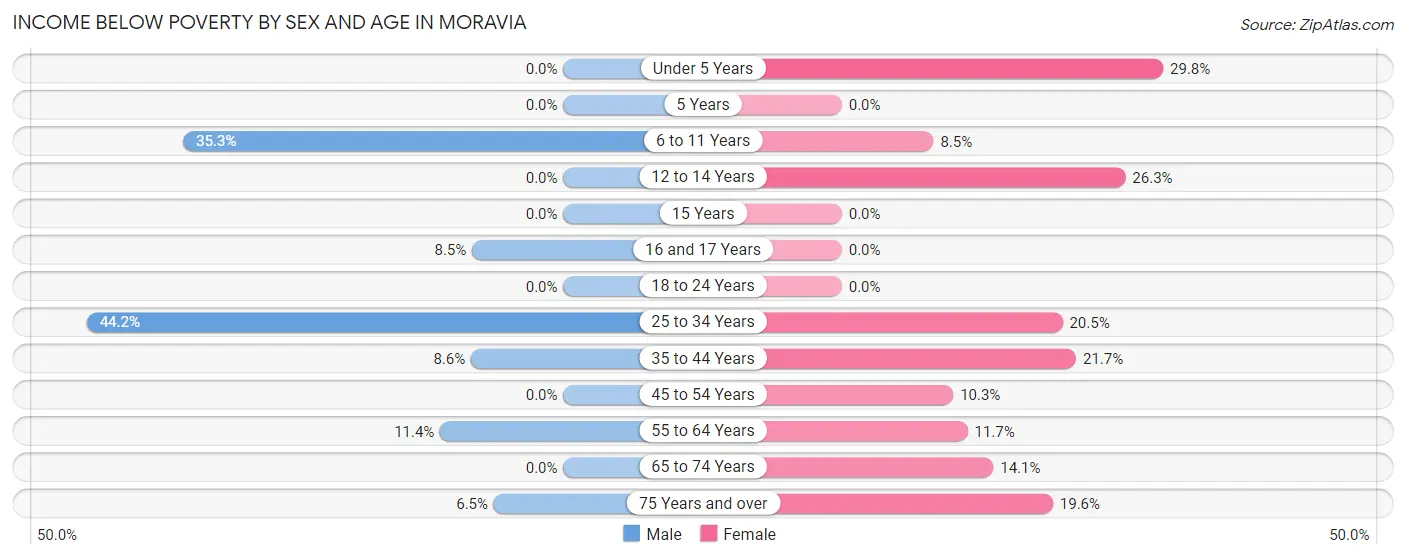
| Age Bracket | Male | Female |
| Under 5 Years | 0 (0.0%) | 17 (29.8%) |
| 5 Years | 0 (0.0%) | 0 (0.0%) |
| 6 to 11 Years | 18 (35.3%) | 4 (8.5%) |
| 12 to 14 Years | 0 (0.0%) | 5 (26.3%) |
| 15 Years | 0 (0.0%) | 0 (0.0%) |
| 16 and 17 Years | 5 (8.5%) | 0 (0.0%) |
| 18 to 24 Years | 0 (0.0%) | 0 (0.0%) |
| 25 to 34 Years | 23 (44.2%) | 17 (20.5%) |
| 35 to 44 Years | 6 (8.6%) | 15 (21.7%) |
| 45 to 54 Years | 0 (0.0%) | 9 (10.3%) |
| 55 to 64 Years | 8 (11.4%) | 7 (11.7%) |
| 65 to 74 Years | 0 (0.0%) | 9 (14.1%) |
| 75 Years and over | 4 (6.5%) | 19 (19.6%) |
| Total | 64 (10.1%) | 102 (13.9%) |
Income Above Poverty by Sex and Age in Moravia
According to the poverty statistics in Moravia, males aged under 5 years and females aged 5 years are the age groups that are most secure financially, with 100.0% of males and 100.0% of females in these age groups living above the poverty line.
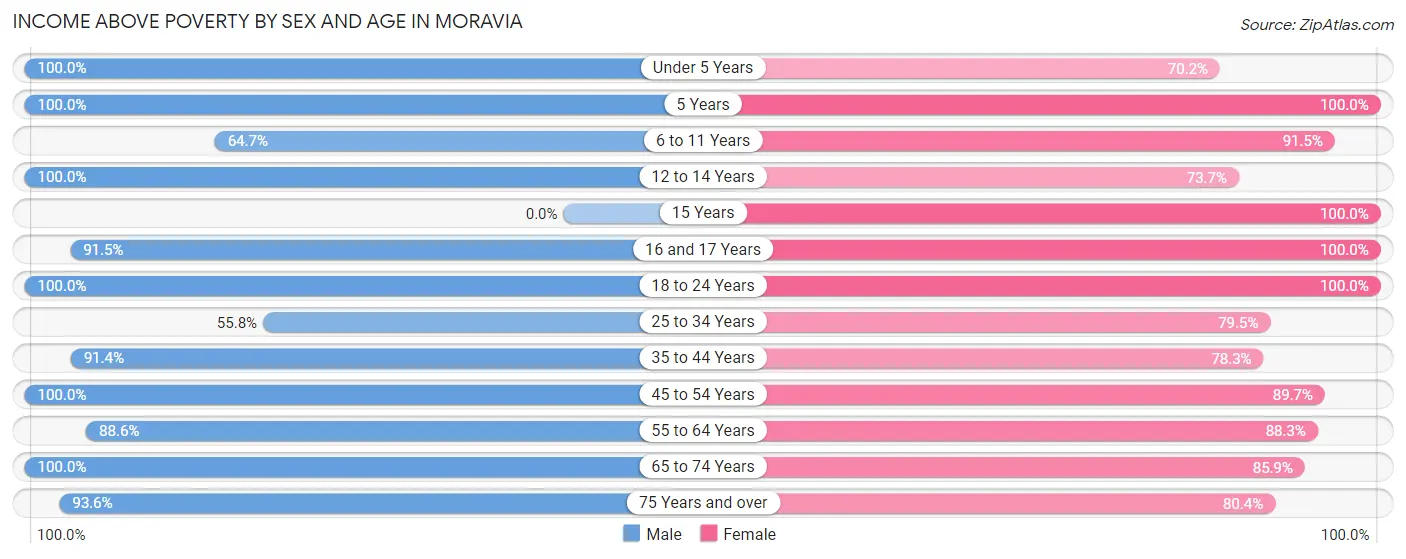
| Age Bracket | Male | Female |
| Under 5 Years | 36 (100.0%) | 40 (70.2%) |
| 5 Years | 18 (100.0%) | 4 (100.0%) |
| 6 to 11 Years | 33 (64.7%) | 43 (91.5%) |
| 12 to 14 Years | 73 (100.0%) | 14 (73.7%) |
| 15 Years | 0 (0.0%) | 26 (100.0%) |
| 16 and 17 Years | 54 (91.5%) | 36 (100.0%) |
| 18 to 24 Years | 32 (100.0%) | 83 (100.0%) |
| 25 to 34 Years | 29 (55.8%) | 66 (79.5%) |
| 35 to 44 Years | 64 (91.4%) | 54 (78.3%) |
| 45 to 54 Years | 87 (100.0%) | 78 (89.7%) |
| 55 to 64 Years | 62 (88.6%) | 53 (88.3%) |
| 65 to 74 Years | 27 (100.0%) | 55 (85.9%) |
| 75 Years and over | 58 (93.5%) | 78 (80.4%) |
| Total | 573 (89.9%) | 630 (86.1%) |
Income Below Poverty Among Married-Couple Families in Moravia
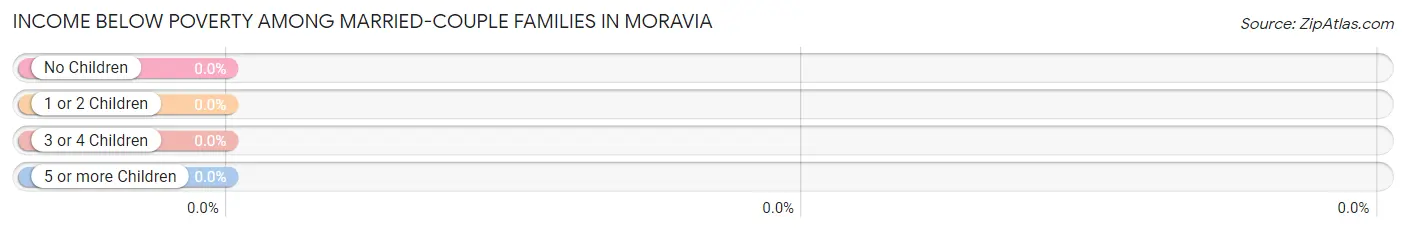
| Children | Above Poverty | Below Poverty |
| No Children | 110 (100.0%) | 0 (0.0%) |
| 1 or 2 Children | 50 (100.0%) | 0 (0.0%) |
| 3 or 4 Children | 33 (100.0%) | 0 (0.0%) |
| 5 or more Children | 0 (0.0%) | 0 (0.0%) |
| Total | 193 (100.0%) | 0 (0.0%) |
Income Below Poverty Among Single-Parent Households in Moravia
According to the poverty data in Moravia, 10.3% or 6 single-father households and 26.0% or 20 single-mother households are living below the poverty line. Among single-father households, those with 1 or 2 children have the highest poverty rate, with 6 households (13.6%) experiencing poverty. Likewise, among single-mother households, those with 1 or 2 children have the highest poverty rate, with 20 households (41.7%) falling below the poverty line.
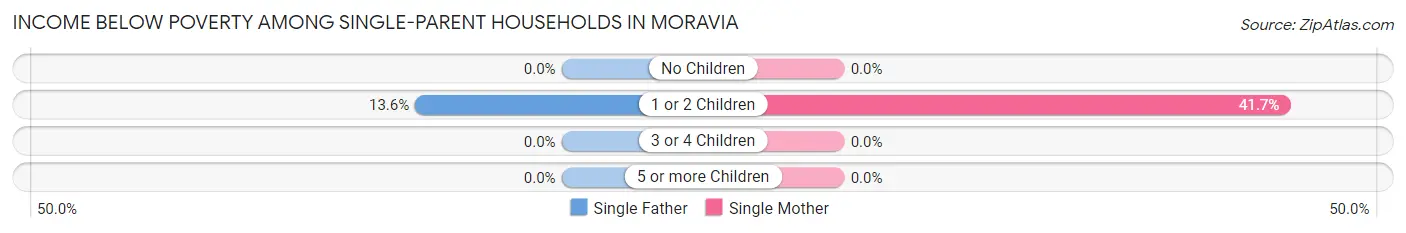
| Children | Single Father | Single Mother |
| No Children | 0 (0.0%) | 0 (0.0%) |
| 1 or 2 Children | 6 (13.6%) | 20 (41.7%) |
| 3 or 4 Children | 0 (0.0%) | 0 (0.0%) |
| 5 or more Children | 0 (0.0%) | 0 (0.0%) |
| Total | 6 (10.3%) | 20 (26.0%) |
Income Below Poverty Among Married-Couple vs Single-Parent Households in Moravia
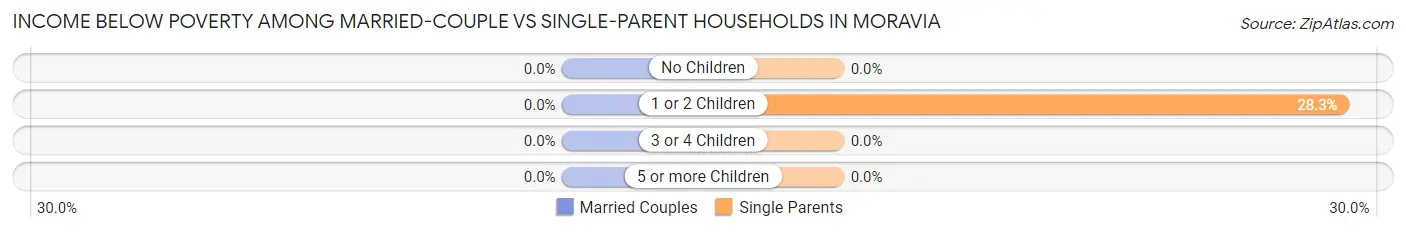
| Children | Married-Couple Families | Single-Parent Households |
| No Children | 0 (0.0%) | 0 (0.0%) |
| 1 or 2 Children | 0 (0.0%) | 26 (28.3%) |
| 3 or 4 Children | 0 (0.0%) | 0 (0.0%) |
| 5 or more Children | 0 (0.0%) | 0 (0.0%) |
| Total | 0 (0.0%) | 26 (19.3%) |
Race in Moravia
The most populous races in Moravia are White / Caucasian (1,295 | 92.6%), Two or more Races (78 | 5.6%), and Some other Race (23 | 1.7%).
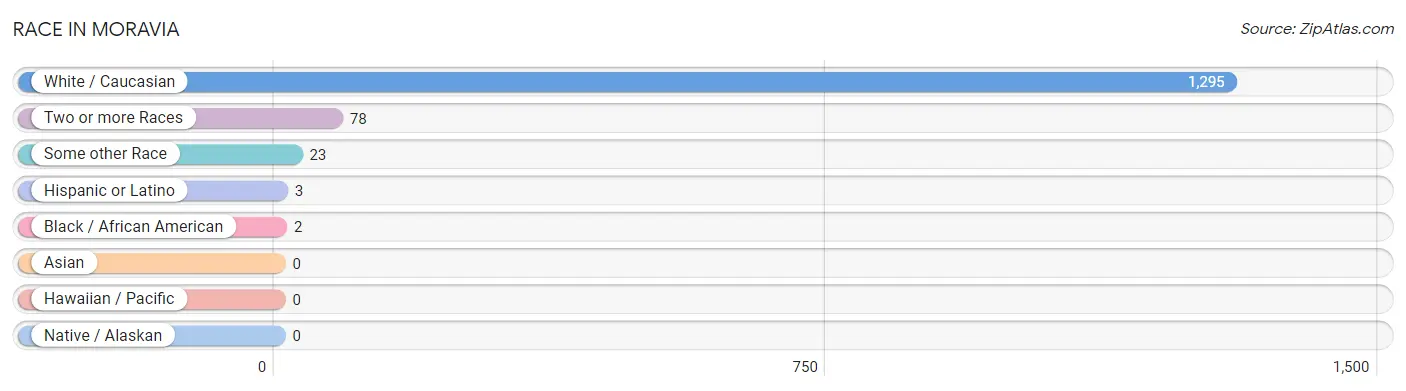
| Race | # Population | % Population |
| Asian | 0 | 0.0% |
| Black / African American | 2 | 0.1% |
| Hawaiian / Pacific | 0 | 0.0% |
| Hispanic or Latino | 3 | 0.2% |
| Native / Alaskan | 0 | 0.0% |
| White / Caucasian | 1,295 | 92.6% |
| Two or more Races | 78 | 5.6% |
| Some other Race | 23 | 1.7% |
| Total | 1,398 | 100.0% |
Ancestry in Moravia
The most populous ancestries reported in Moravia are German (289 | 20.7%), English (249 | 17.8%), Irish (176 | 12.6%), Italian (132 | 9.4%), and Polish (56 | 4.0%), together accounting for 64.5% of all Moravia residents.

| Ancestry | # Population | % Population |
| American | 50 | 3.6% |
| Canadian | 3 | 0.2% |
| Central American | 3 | 0.2% |
| Czech | 7 | 0.5% |
| Dutch | 51 | 3.6% |
| Eastern European | 4 | 0.3% |
| English | 249 | 17.8% |
| European | 26 | 1.9% |
| French | 38 | 2.7% |
| French Canadian | 8 | 0.6% |
| German | 289 | 20.7% |
| Hungarian | 12 | 0.9% |
| Irish | 176 | 12.6% |
| Italian | 132 | 9.4% |
| Nicaraguan | 3 | 0.2% |
| Pennsylvania German | 6 | 0.4% |
| Polish | 56 | 4.0% |
| Portuguese | 8 | 0.6% |
| Russian | 3 | 0.2% |
| Scotch-Irish | 3 | 0.2% |
| Scottish | 10 | 0.7% |
| Swedish | 2 | 0.1% |
| Ukrainian | 5 | 0.4% |
| Welsh | 3 | 0.2% | View All 24 Rows |
Immigrants in Moravia
The most numerous immigrant groups reported in Moravia came from England (10 | 0.7%), Europe (10 | 0.7%), Northern Europe (10 | 0.7%), Colombia (2 | 0.1%), and Latin America (2 | 0.1%), together accounting for 2.4% of all Moravia residents.
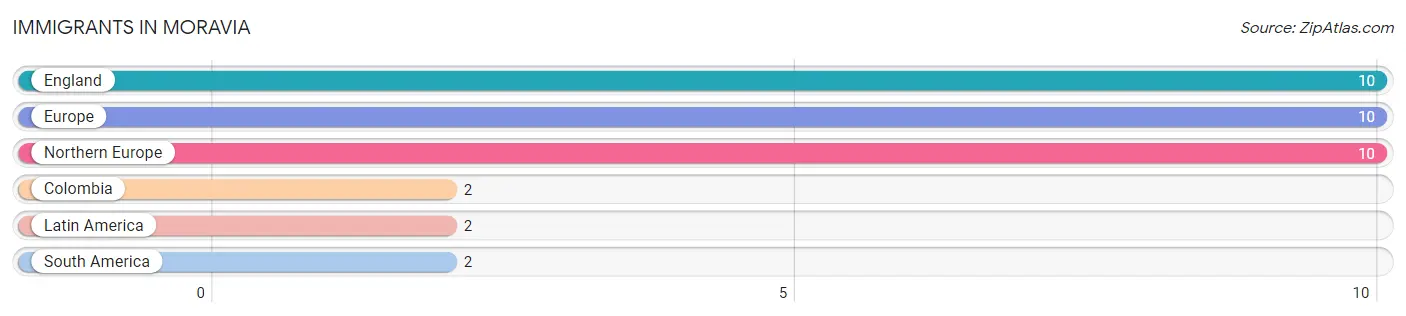
| Immigration Origin | # Population | % Population |
| Colombia | 2 | 0.1% |
| England | 10 | 0.7% |
| Europe | 10 | 0.7% |
| Latin America | 2 | 0.1% |
| Northern Europe | 10 | 0.7% |
| South America | 2 | 0.1% | View All 6 Rows |
Sex and Age in Moravia
Sex and Age in Moravia
The most populous age groups in Moravia are 10 to 14 Years (83 | 12.9%) for men and 15 to 19 Years (81 | 10.7%) for women.
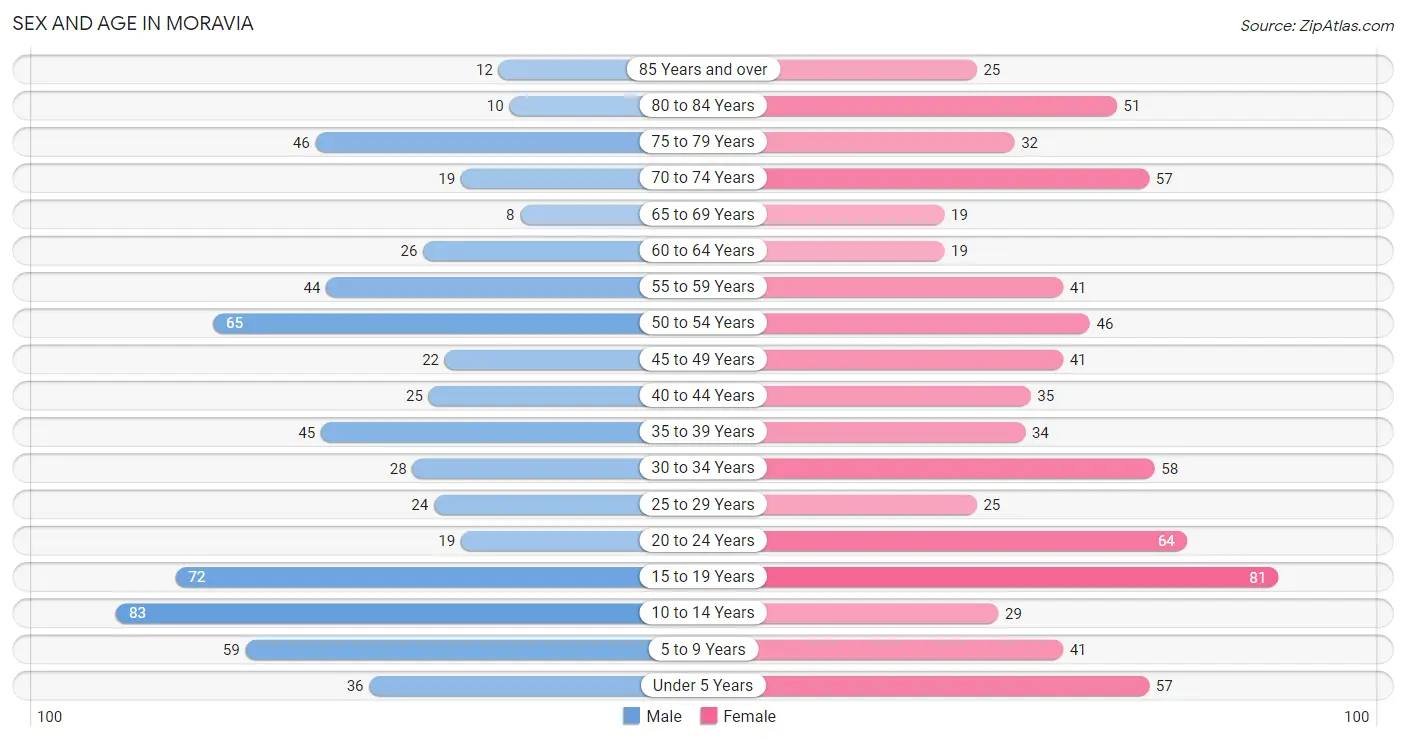
| Age Bracket | Male | Female |
| Under 5 Years | 36 (5.6%) | 57 (7.5%) |
| 5 to 9 Years | 59 (9.2%) | 41 (5.4%) |
| 10 to 14 Years | 83 (12.9%) | 29 (3.8%) |
| 15 to 19 Years | 72 (11.2%) | 81 (10.7%) |
| 20 to 24 Years | 19 (2.9%) | 64 (8.5%) |
| 25 to 29 Years | 24 (3.7%) | 25 (3.3%) |
| 30 to 34 Years | 28 (4.3%) | 58 (7.7%) |
| 35 to 39 Years | 45 (7.0%) | 34 (4.5%) |
| 40 to 44 Years | 25 (3.9%) | 35 (4.6%) |
| 45 to 49 Years | 22 (3.4%) | 41 (5.4%) |
| 50 to 54 Years | 65 (10.1%) | 46 (6.1%) |
| 55 to 59 Years | 44 (6.8%) | 41 (5.4%) |
| 60 to 64 Years | 26 (4.0%) | 19 (2.5%) |
| 65 to 69 Years | 8 (1.2%) | 19 (2.5%) |
| 70 to 74 Years | 19 (2.9%) | 57 (7.5%) |
| 75 to 79 Years | 46 (7.1%) | 32 (4.2%) |
| 80 to 84 Years | 10 (1.6%) | 51 (6.8%) |
| 85 Years and over | 12 (1.9%) | 25 (3.3%) |
| Total | 643 (100.0%) | 755 (100.0%) |
Families and Households in Moravia
Median Family Size in Moravia
The median family size in Moravia is 3.32 persons per family, with single female/mother families (77 | 23.5%) accounting for the largest median family size of 3.91 persons per family. On the other hand, single male/father families (58 | 17.7%) represent the smallest median family size with 2.52 persons per family.
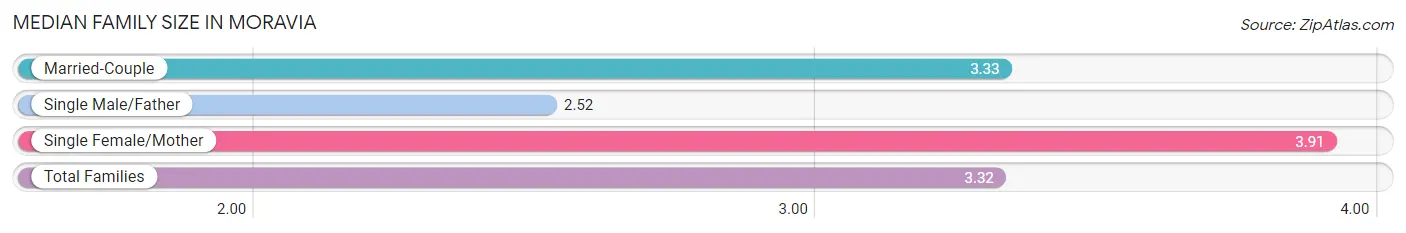
| Family Type | # Families | Family Size |
| Married-Couple | 193 (58.8%) | 3.33 |
| Single Male/Father | 58 (17.7%) | 2.52 |
| Single Female/Mother | 77 (23.5%) | 3.91 |
| Total Families | 328 (100.0%) | 3.32 |
Median Household Size in Moravia
The median household size in Moravia is 2.67 persons per household, with single female/mother households (77 | 15.0%) accounting for the largest median household size of 4.42 persons per household. non-family households (185 | 36.1%) represent the smallest median household size with 1.16 persons per household.
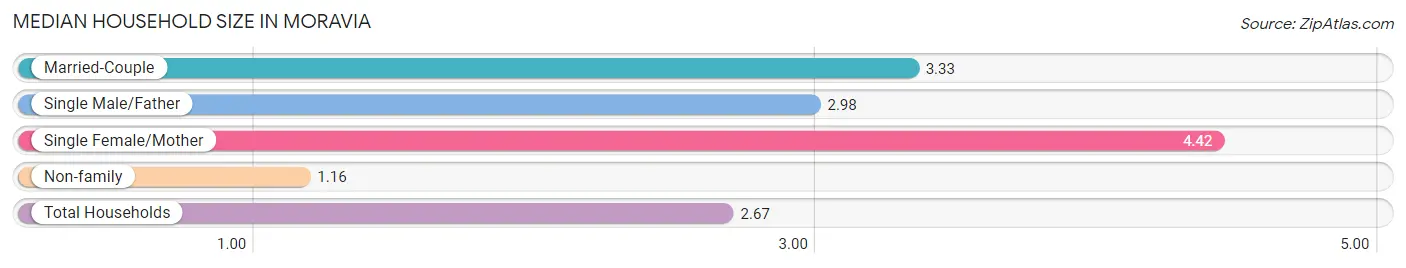
| Household Type | # Households | Household Size |
| Married-Couple | 193 (37.6%) | 3.33 |
| Single Male/Father | 58 (11.3%) | 2.98 |
| Single Female/Mother | 77 (15.0%) | 4.42 |
| Non-family | 185 (36.1%) | 1.16 |
| Total Households | 513 (100.0%) | 2.67 |
Household Size by Marriage Status in Moravia
Out of a total of 513 households in Moravia, 328 (63.9%) are family households, while 185 (36.1%) are nonfamily households. The most numerous type of family households are 2-person households, comprising 142, and the most common type of nonfamily households are 1-person households, comprising 158.
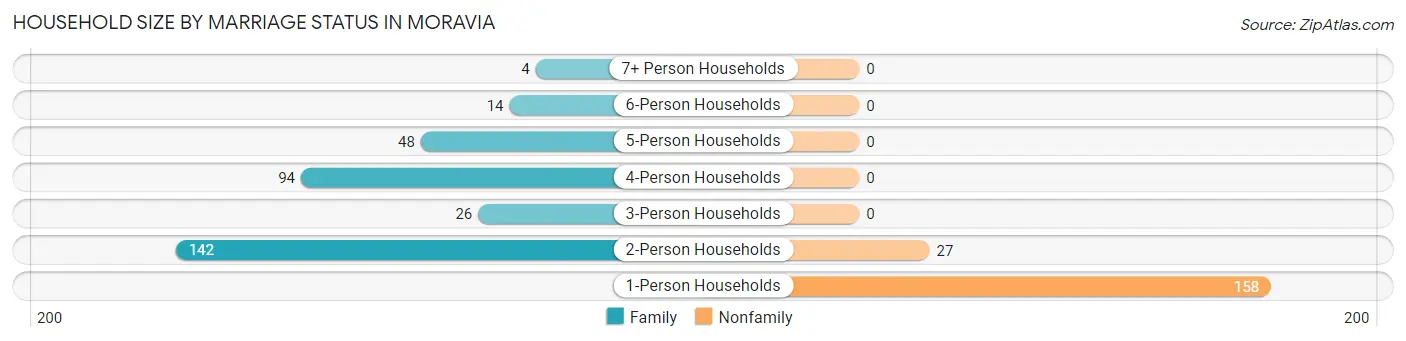
| Household Size | Family Households | Nonfamily Households |
| 1-Person Households | - | 158 (30.8%) |
| 2-Person Households | 142 (27.7%) | 27 (5.3%) |
| 3-Person Households | 26 (5.1%) | 0 (0.0%) |
| 4-Person Households | 94 (18.3%) | 0 (0.0%) |
| 5-Person Households | 48 (9.4%) | 0 (0.0%) |
| 6-Person Households | 14 (2.7%) | 0 (0.0%) |
| 7+ Person Households | 4 (0.8%) | 0 (0.0%) |
| Total | 328 (63.9%) | 185 (36.1%) |
Female Fertility in Moravia
Fertility by Age in Moravia
Average fertility rate in Moravia is 96.0 births per 1,000 women. Women in the age bracket of 20 to 34 years have the highest fertility rate with 143.0 births per 1,000 women. Women in the age bracket of 20 to 34 years acount for 63.6% of all women with births.
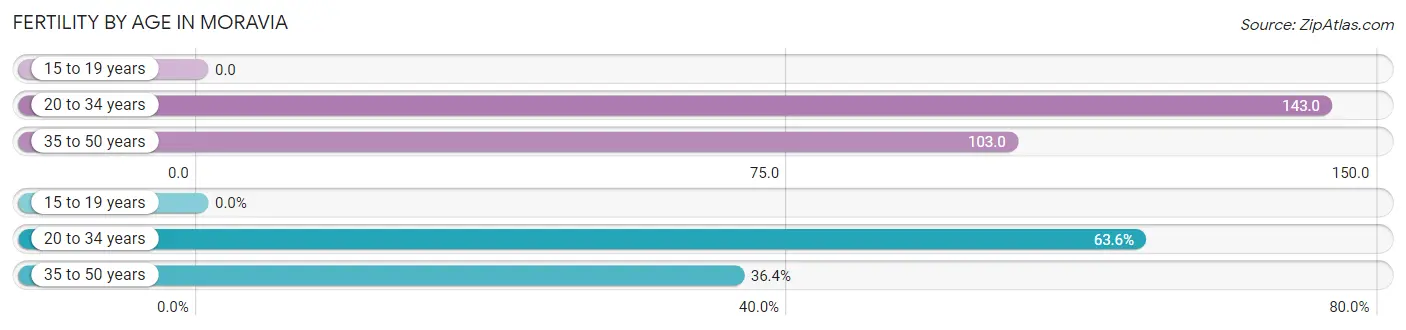
| Age Bracket | Women with Births | Births / 1,000 Women |
| 15 to 19 years | 0 (0.0%) | 0.0 |
| 20 to 34 years | 21 (63.6%) | 143.0 |
| 35 to 50 years | 12 (36.4%) | 103.0 |
| Total | 33 (100.0%) | 96.0 |
Fertility by Age by Marriage Status in Moravia
60.6% of women with births (33) in Moravia are married. The highest percentage of unmarried women with births falls into 35 to 50 years age bracket with 75.0% of them unmarried at the time of birth, while the lowest percentage of unmarried women with births belong to 20 to 34 years age bracket with 19.1% of them unmarried.
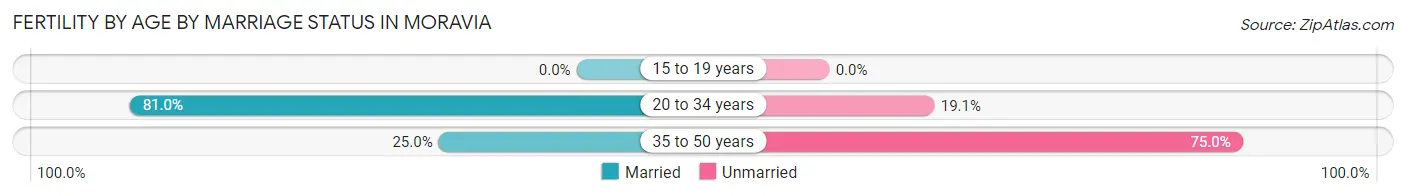
| Age Bracket | Married | Unmarried |
| 15 to 19 years | 0 (0.0%) | 0 (0.0%) |
| 20 to 34 years | 17 (80.9%) | 4 (19.1%) |
| 35 to 50 years | 3 (25.0%) | 9 (75.0%) |
| Total | 20 (60.6%) | 13 (39.4%) |
Fertility by Education in Moravia
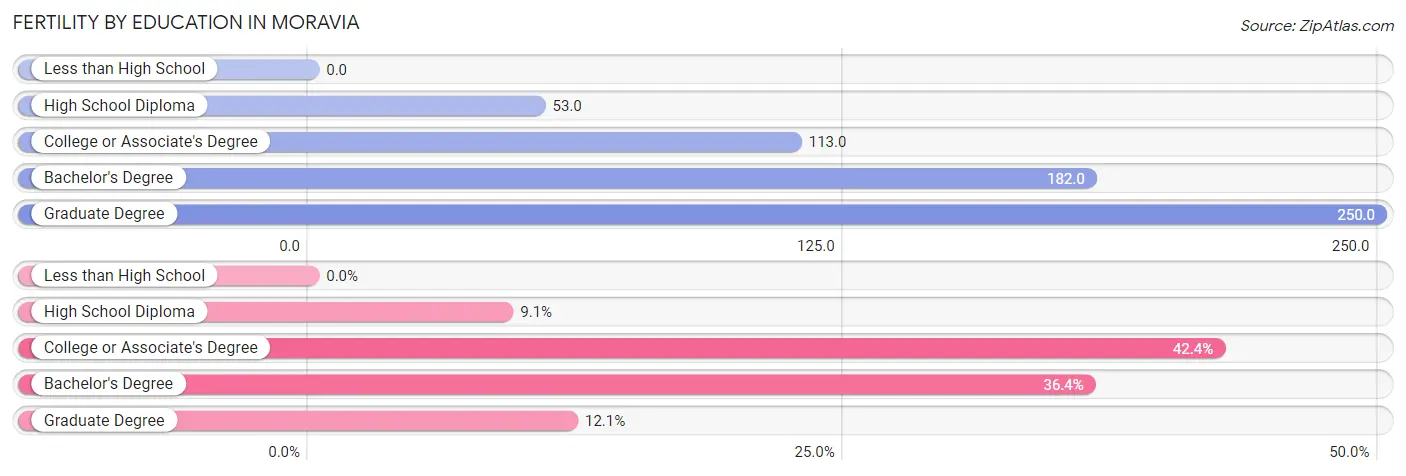
| Educational Attainment | Women with Births | Births / 1,000 Women |
| Less than High School | 0 (0.0%) | 0.0 |
| High School Diploma | 3 (9.1%) | 53.0 |
| College or Associate's Degree | 14 (42.4%) | 113.0 |
| Bachelor's Degree | 12 (36.4%) | 182.0 |
| Graduate Degree | 4 (12.1%) | 250.0 |
| Total | 33 (100.0%) | 96.0 |
Fertility by Education by Marriage Status in Moravia
39.4% of women with births in Moravia are unmarried. Women with the educational attainment of high school diploma are most likely to be married with 100.0% of them married at childbirth, while women with the educational attainment of bachelor's degree are least likely to be married with 75.0% of them unmarried at childbirth.
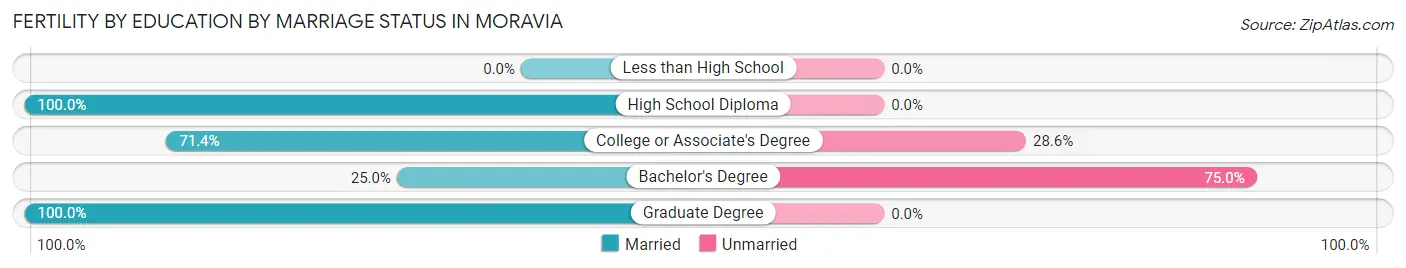
| Educational Attainment | Married | Unmarried |
| Less than High School | 0 (0.0%) | 0 (0.0%) |
| High School Diploma | 3 (100.0%) | 0 (0.0%) |
| College or Associate's Degree | 10 (71.4%) | 4 (28.6%) |
| Bachelor's Degree | 3 (25.0%) | 9 (75.0%) |
| Graduate Degree | 4 (100.0%) | 0 (0.0%) |
| Total | 20 (60.6%) | 13 (39.4%) |
Employment Characteristics in Moravia
Employment by Class of Employer in Moravia
Among the 558 employed individuals in Moravia, private company employees (343 | 61.5%), local government employees (70 | 12.5%), and state government employees (66 | 11.8%) make up the most common classes of employment.
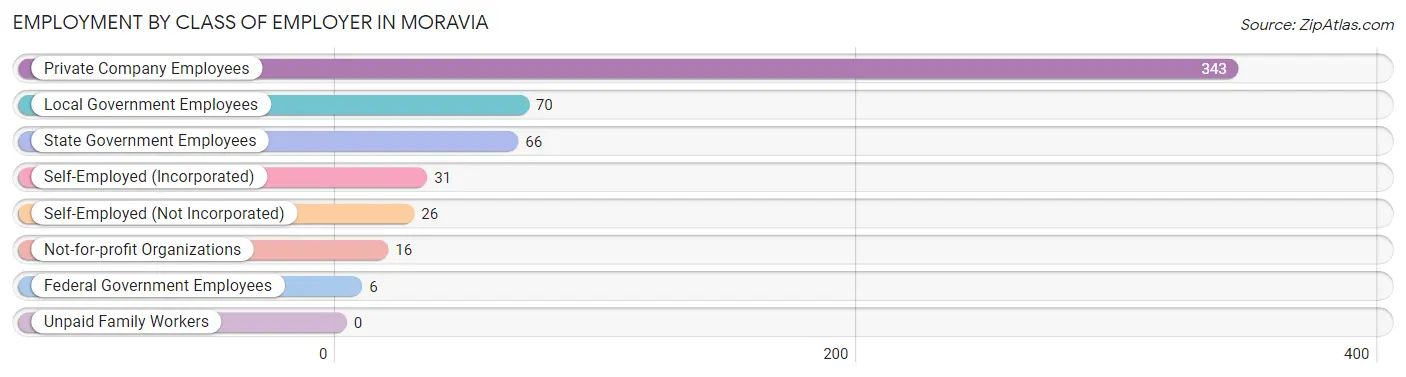
| Employer Class | # Employees | % Employees |
| Private Company Employees | 343 | 61.5% |
| Self-Employed (Incorporated) | 31 | 5.6% |
| Self-Employed (Not Incorporated) | 26 | 4.7% |
| Not-for-profit Organizations | 16 | 2.9% |
| Local Government Employees | 70 | 12.5% |
| State Government Employees | 66 | 11.8% |
| Federal Government Employees | 6 | 1.1% |
| Unpaid Family Workers | 0 | 0.0% |
| Total | 558 | 100.0% |
Employment Status by Age in Moravia
According to the labor force statistics for Moravia, out of the total population over 16 years of age (1,067), 57.2% or 610 individuals are in the labor force, with 5.9% or 36 of them unemployed. The age group with the highest labor force participation rate is 55 to 59 years, with 91.8% or 78 individuals in the labor force. Within the labor force, the 20 to 24 years age range has the highest percentage of unemployed individuals, with 21.4% or 15 of them being unemployed.
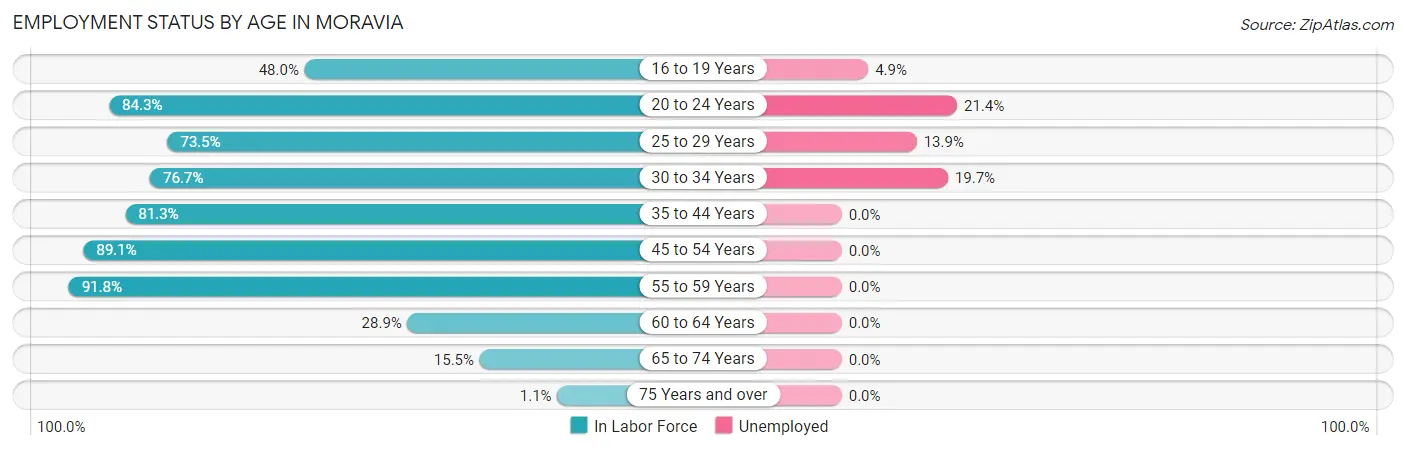
| Age Bracket | In Labor Force | Unemployed |
| 16 to 19 Years | 61 (48.0%) | 3 (4.9%) |
| 20 to 24 Years | 70 (84.3%) | 15 (21.4%) |
| 25 to 29 Years | 36 (73.5%) | 5 (13.9%) |
| 30 to 34 Years | 66 (76.7%) | 13 (19.7%) |
| 35 to 44 Years | 113 (81.3%) | 0 (0.0%) |
| 45 to 54 Years | 155 (89.1%) | 0 (0.0%) |
| 55 to 59 Years | 78 (91.8%) | 0 (0.0%) |
| 60 to 64 Years | 13 (28.9%) | 0 (0.0%) |
| 65 to 74 Years | 16 (15.5%) | 0 (0.0%) |
| 75 Years and over | 2 (1.1%) | 0 (0.0%) |
| Total | 610 (57.2%) | 36 (5.9%) |
Employment Status by Educational Attainment in Moravia
According to labor force statistics for Moravia, 79.8% of individuals (461) out of the total population between 25 and 64 years of age (578) are in the labor force, with 3.9% or 18 of them being unemployed. The group with the highest labor force participation rate are those with the educational attainment of bachelor's degree or higher, with 95.9% or 139 individuals in the labor force. Within the labor force, individuals with college / associate degree education have the highest percentage of unemployment, with 7.2% or 13 of them being unemployed.
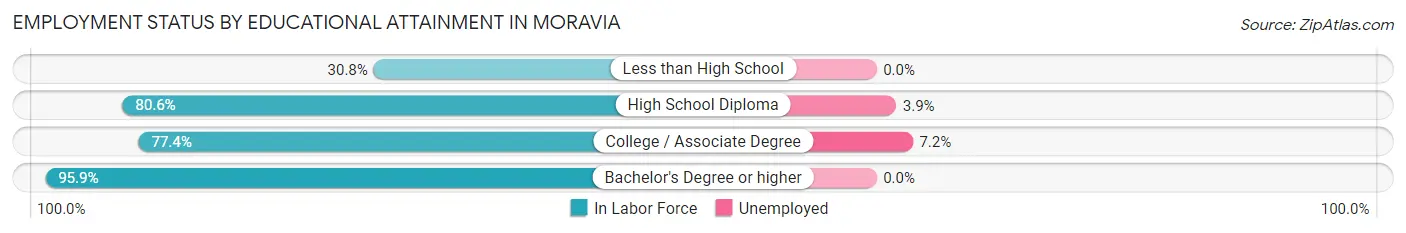
| Educational Attainment | In Labor Force | Unemployed |
| Less than High School | 12 (30.8%) | 0 (0.0%) |
| High School Diploma | 129 (80.6%) | 6 (3.9%) |
| College / Associate Degree | 181 (77.4%) | 17 (7.2%) |
| Bachelor's Degree or higher | 139 (95.9%) | 0 (0.0%) |
| Total | 461 (79.8%) | 23 (3.9%) |
Employment Occupations by Sex in Moravia
Management, Business, Science and Arts Occupations
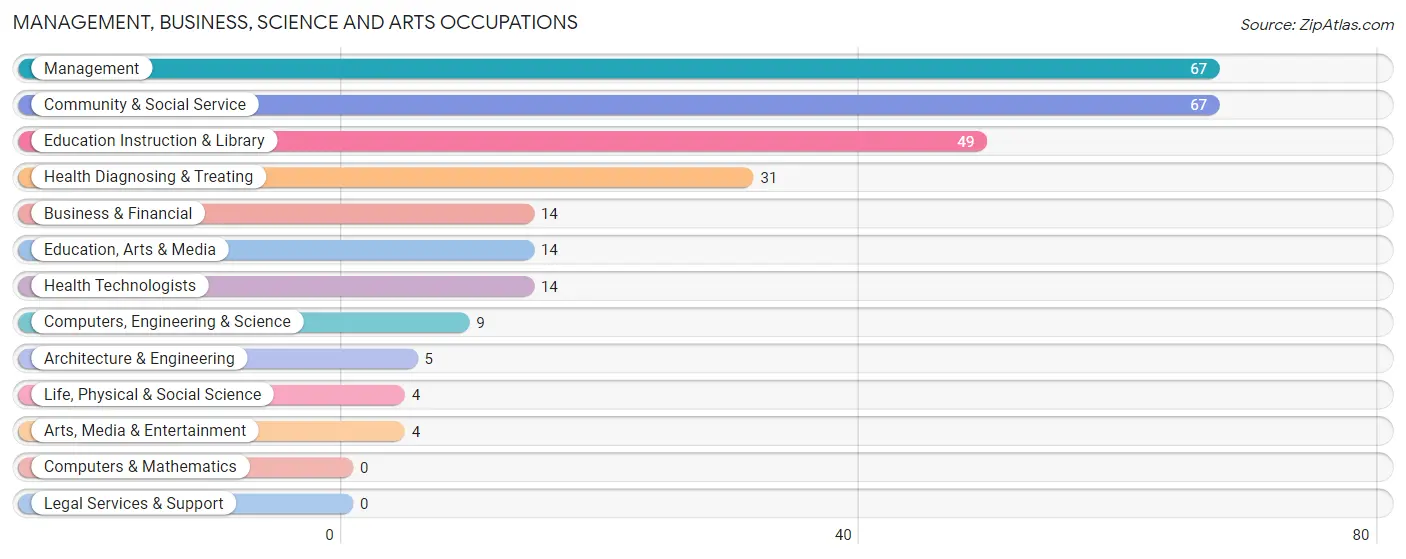
The most common Management, Business, Science and Arts occupations in Moravia are Management (67 | 11.7%), Community & Social Service (67 | 11.7%), Education Instruction & Library (49 | 8.5%), Health Diagnosing & Treating (31 | 5.4%), and Business & Financial (14 | 2.4%).
Management, Business, Science and Arts Occupations by Sex
Within the Management, Business, Science and Arts occupations in Moravia, the most male-oriented occupations are Computers, Engineering & Science (100.0%), Architecture & Engineering (100.0%), and Life, Physical & Social Science (100.0%), while the most female-oriented occupations are Arts, Media & Entertainment (100.0%), Health Diagnosing & Treating (100.0%), and Health Technologists (100.0%).
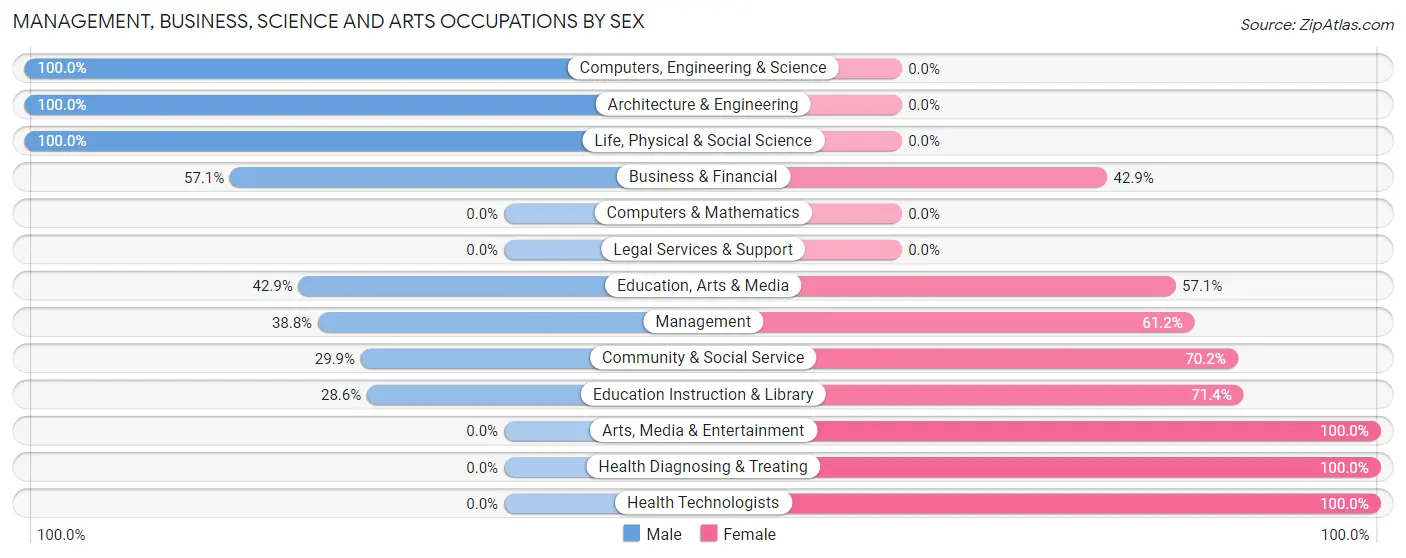
| Occupation | Male | Female |
| Management | 26 (38.8%) | 41 (61.2%) |
| Business & Financial | 8 (57.1%) | 6 (42.9%) |
| Computers, Engineering & Science | 9 (100.0%) | 0 (0.0%) |
| Computers & Mathematics | 0 (0.0%) | 0 (0.0%) |
| Architecture & Engineering | 5 (100.0%) | 0 (0.0%) |
| Life, Physical & Social Science | 4 (100.0%) | 0 (0.0%) |
| Community & Social Service | 20 (29.8%) | 47 (70.2%) |
| Education, Arts & Media | 6 (42.9%) | 8 (57.1%) |
| Legal Services & Support | 0 (0.0%) | 0 (0.0%) |
| Education Instruction & Library | 14 (28.6%) | 35 (71.4%) |
| Arts, Media & Entertainment | 0 (0.0%) | 4 (100.0%) |
| Health Diagnosing & Treating | 0 (0.0%) | 31 (100.0%) |
| Health Technologists | 0 (0.0%) | 14 (100.0%) |
| Total (Category) | 63 (33.5%) | 125 (66.5%) |
| Total (Overall) | 269 (46.9%) | 305 (53.1%) |
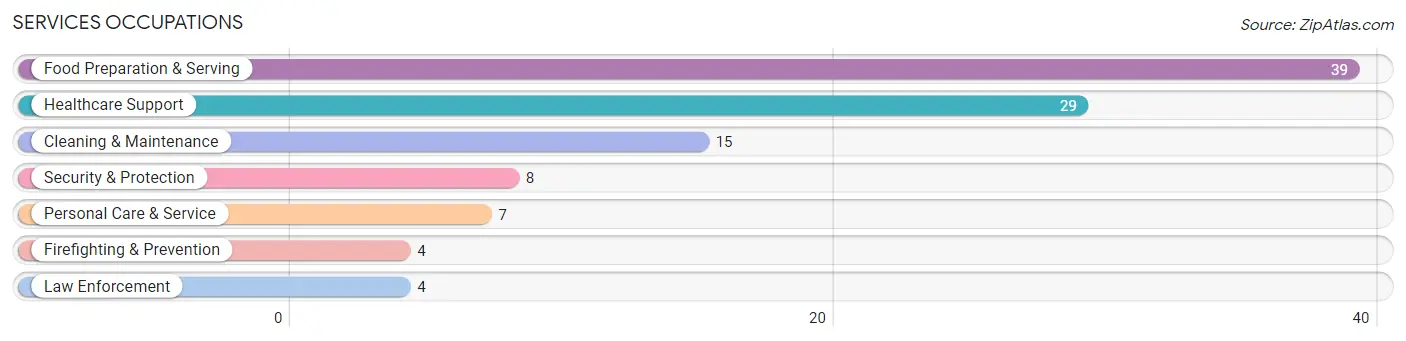
Services Occupations
The most common Services occupations in Moravia are Food Preparation & Serving (39 | 6.8%), Healthcare Support (29 | 5.1%), Cleaning & Maintenance (15 | 2.6%), Security & Protection (8 | 1.4%), and Personal Care & Service (7 | 1.2%).
Services Occupations by Sex
Within the Services occupations in Moravia, the most male-oriented occupations are Security & Protection (100.0%), Firefighting & Prevention (100.0%), and Law Enforcement (100.0%), while the most female-oriented occupations are Healthcare Support (100.0%), Food Preparation & Serving (66.7%), and Personal Care & Service (42.9%).
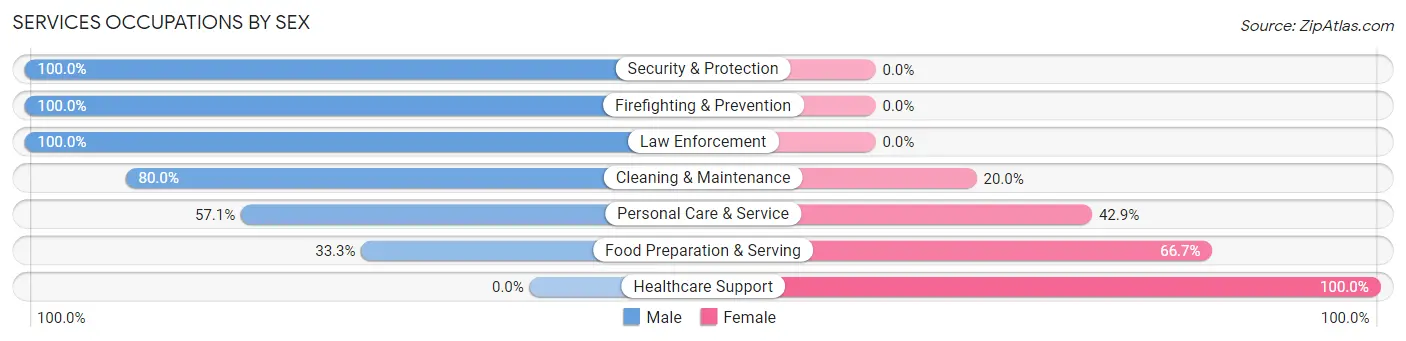
| Occupation | Male | Female |
| Healthcare Support | 0 (0.0%) | 29 (100.0%) |
| Security & Protection | 8 (100.0%) | 0 (0.0%) |
| Firefighting & Prevention | 4 (100.0%) | 0 (0.0%) |
| Law Enforcement | 4 (100.0%) | 0 (0.0%) |
| Food Preparation & Serving | 13 (33.3%) | 26 (66.7%) |
| Cleaning & Maintenance | 12 (80.0%) | 3 (20.0%) |
| Personal Care & Service | 4 (57.1%) | 3 (42.9%) |
| Total (Category) | 37 (37.8%) | 61 (62.2%) |
| Total (Overall) | 269 (46.9%) | 305 (53.1%) |
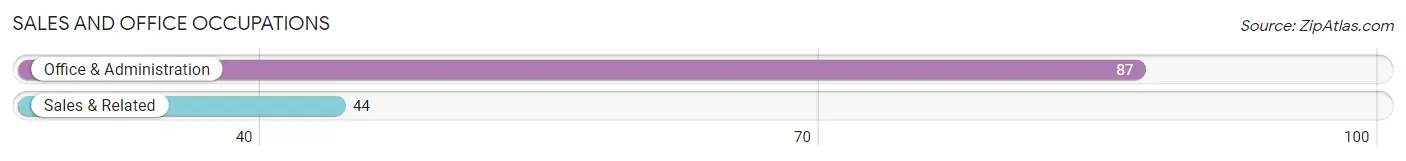
Sales and Office Occupations
The most common Sales and Office occupations in Moravia are Office & Administration (87 | 15.2%), and Sales & Related (44 | 7.7%).
Sales and Office Occupations by Sex
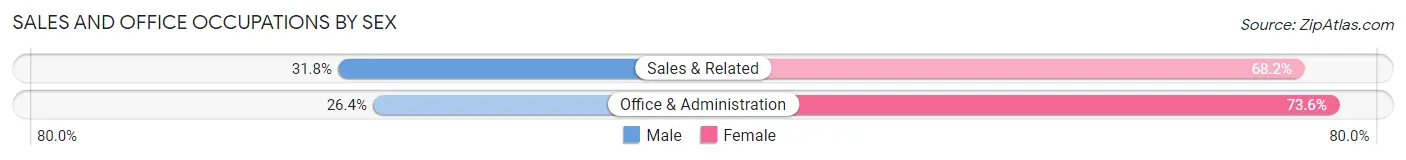
| Occupation | Male | Female |
| Sales & Related | 14 (31.8%) | 30 (68.2%) |
| Office & Administration | 23 (26.4%) | 64 (73.6%) |
| Total (Category) | 37 (28.2%) | 94 (71.8%) |
| Total (Overall) | 269 (46.9%) | 305 (53.1%) |
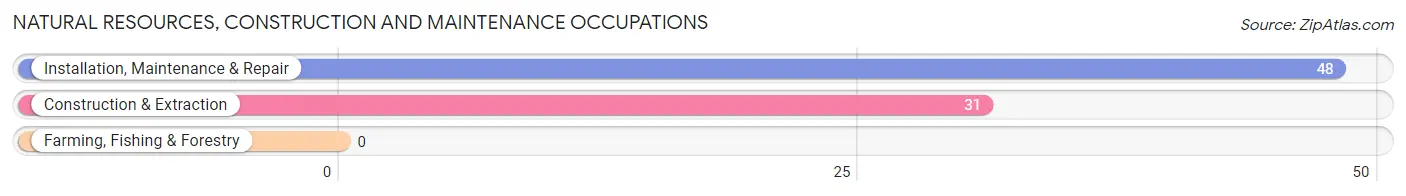
Natural Resources, Construction and Maintenance Occupations
The most common Natural Resources, Construction and Maintenance occupations in Moravia are Installation, Maintenance & Repair (48 | 8.4%), and Construction & Extraction (31 | 5.4%).
Natural Resources, Construction and Maintenance Occupations by Sex
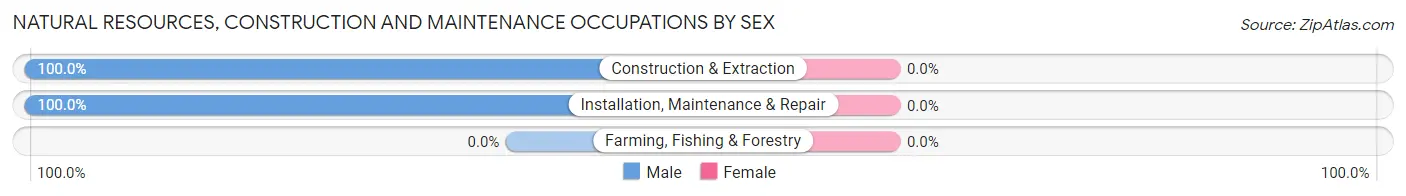
| Occupation | Male | Female |
| Farming, Fishing & Forestry | 0 (0.0%) | 0 (0.0%) |
| Construction & Extraction | 31 (100.0%) | 0 (0.0%) |
| Installation, Maintenance & Repair | 48 (100.0%) | 0 (0.0%) |
| Total (Category) | 79 (100.0%) | 0 (0.0%) |
| Total (Overall) | 269 (46.9%) | 305 (53.1%) |
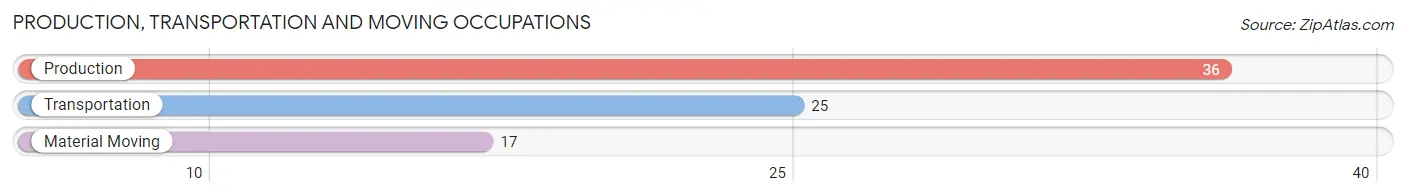
Production, Transportation and Moving Occupations
The most common Production, Transportation and Moving occupations in Moravia are Production (36 | 6.3%), Transportation (25 | 4.4%), and Material Moving (17 | 3.0%).
Production, Transportation and Moving Occupations by Sex
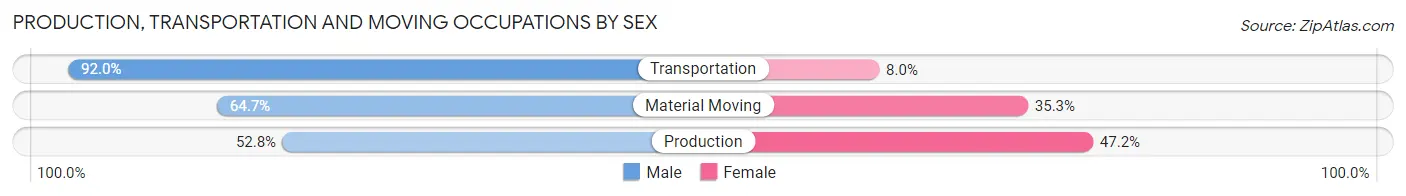
| Occupation | Male | Female |
| Production | 19 (52.8%) | 17 (47.2%) |
| Transportation | 23 (92.0%) | 2 (8.0%) |
| Material Moving | 11 (64.7%) | 6 (35.3%) |
| Total (Category) | 53 (67.9%) | 25 (32.1%) |
| Total (Overall) | 269 (46.9%) | 305 (53.1%) |
Employment Industries by Sex in Moravia
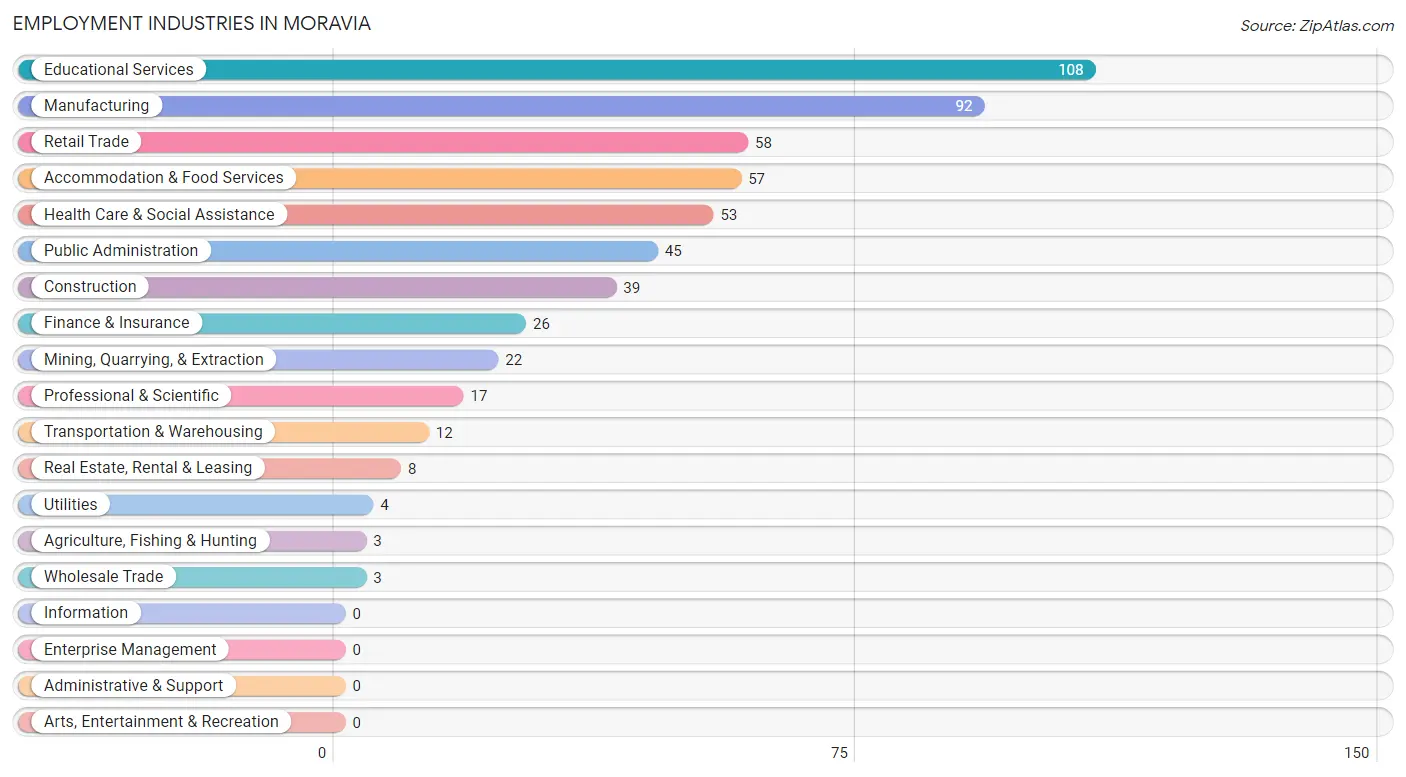
Employment Industries in Moravia
The major employment industries in Moravia include Educational Services (108 | 18.8%), Manufacturing (92 | 16.0%), Retail Trade (58 | 10.1%), Accommodation & Food Services (57 | 9.9%), and Health Care & Social Assistance (53 | 9.2%).
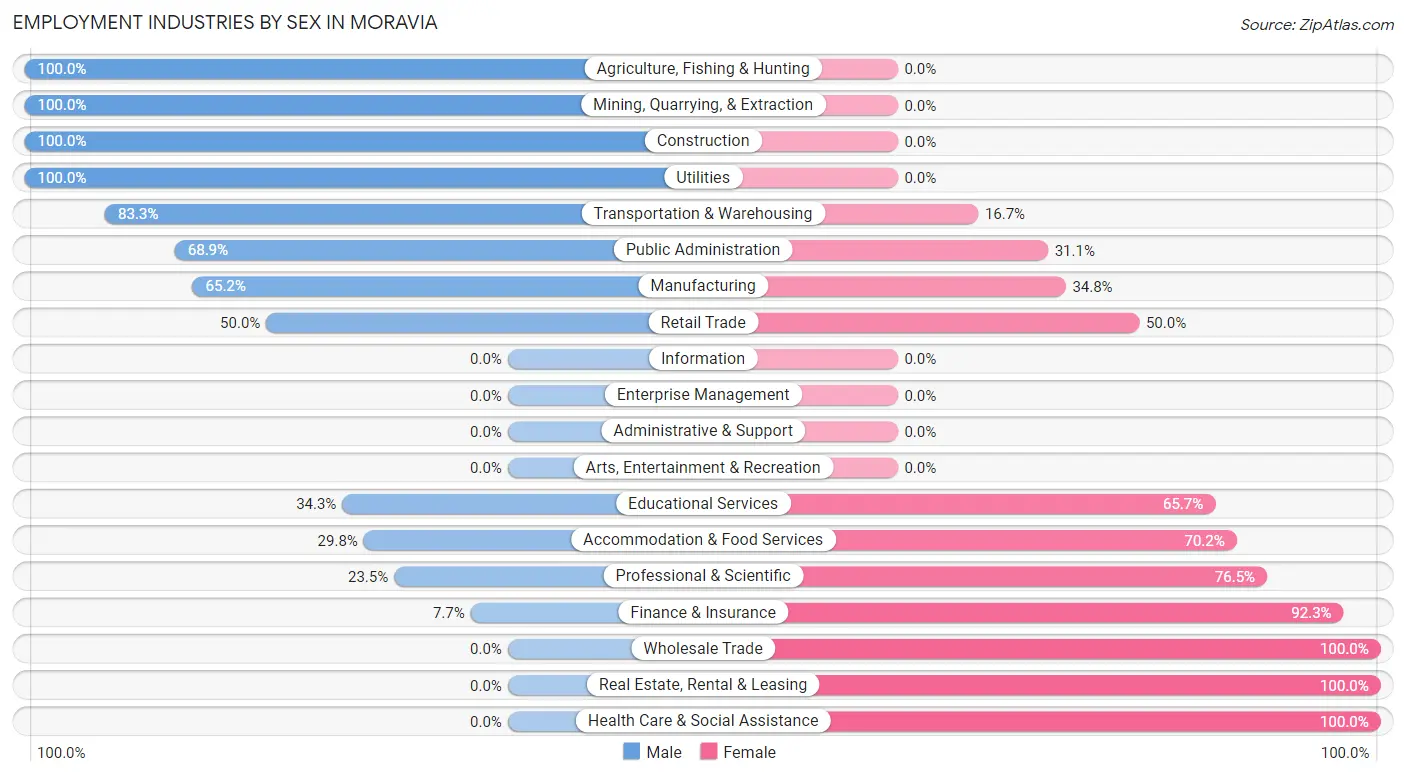
Employment Industries by Sex in Moravia
The Moravia industries that see more men than women are Agriculture, Fishing & Hunting (100.0%), Mining, Quarrying, & Extraction (100.0%), and Construction (100.0%), whereas the industries that tend to have a higher number of women are Wholesale Trade (100.0%), Real Estate, Rental & Leasing (100.0%), and Health Care & Social Assistance (100.0%).
| Industry | Male | Female |
| Agriculture, Fishing & Hunting | 3 (100.0%) | 0 (0.0%) |
| Mining, Quarrying, & Extraction | 22 (100.0%) | 0 (0.0%) |
| Construction | 39 (100.0%) | 0 (0.0%) |
| Manufacturing | 60 (65.2%) | 32 (34.8%) |
| Wholesale Trade | 0 (0.0%) | 3 (100.0%) |
| Retail Trade | 29 (50.0%) | 29 (50.0%) |
| Transportation & Warehousing | 10 (83.3%) | 2 (16.7%) |
| Utilities | 4 (100.0%) | 0 (0.0%) |
| Information | 0 (0.0%) | 0 (0.0%) |
| Finance & Insurance | 2 (7.7%) | 24 (92.3%) |
| Real Estate, Rental & Leasing | 0 (0.0%) | 8 (100.0%) |
| Professional & Scientific | 4 (23.5%) | 13 (76.5%) |
| Enterprise Management | 0 (0.0%) | 0 (0.0%) |
| Administrative & Support | 0 (0.0%) | 0 (0.0%) |
| Educational Services | 37 (34.3%) | 71 (65.7%) |
| Health Care & Social Assistance | 0 (0.0%) | 53 (100.0%) |
| Arts, Entertainment & Recreation | 0 (0.0%) | 0 (0.0%) |
| Accommodation & Food Services | 17 (29.8%) | 40 (70.2%) |
| Public Administration | 31 (68.9%) | 14 (31.1%) |
| Total | 269 (46.9%) | 305 (53.1%) |
Education in Moravia
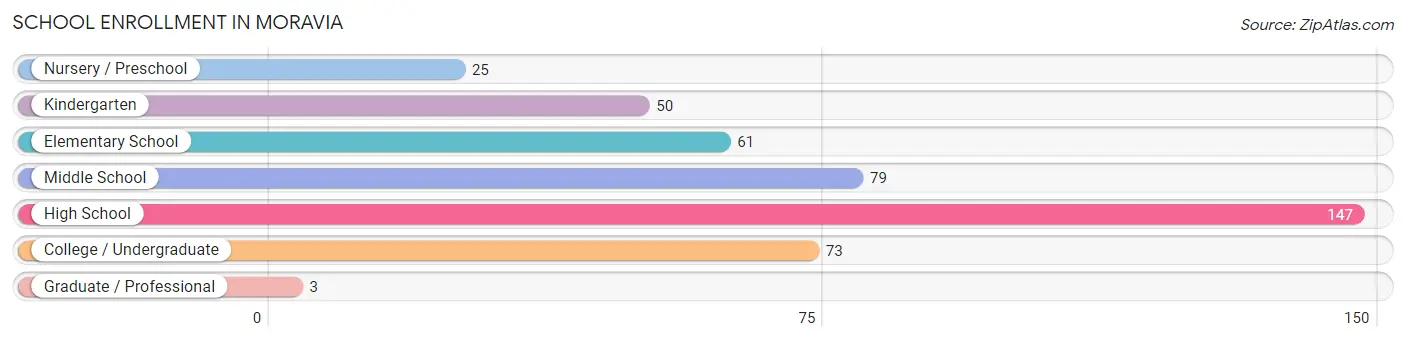
School Enrollment in Moravia
The most common levels of schooling among the 438 students in Moravia are high school (147 | 33.6%), middle school (79 | 18.0%), and college / undergraduate (73 | 16.7%).
| School Level | # Students | % Students |
| Nursery / Preschool | 25 | 5.7% |
| Kindergarten | 50 | 11.4% |
| Elementary School | 61 | 13.9% |
| Middle School | 79 | 18.0% |
| High School | 147 | 33.6% |
| College / Undergraduate | 73 | 16.7% |
| Graduate / Professional | 3 | 0.7% |
| Total | 438 | 100.0% |
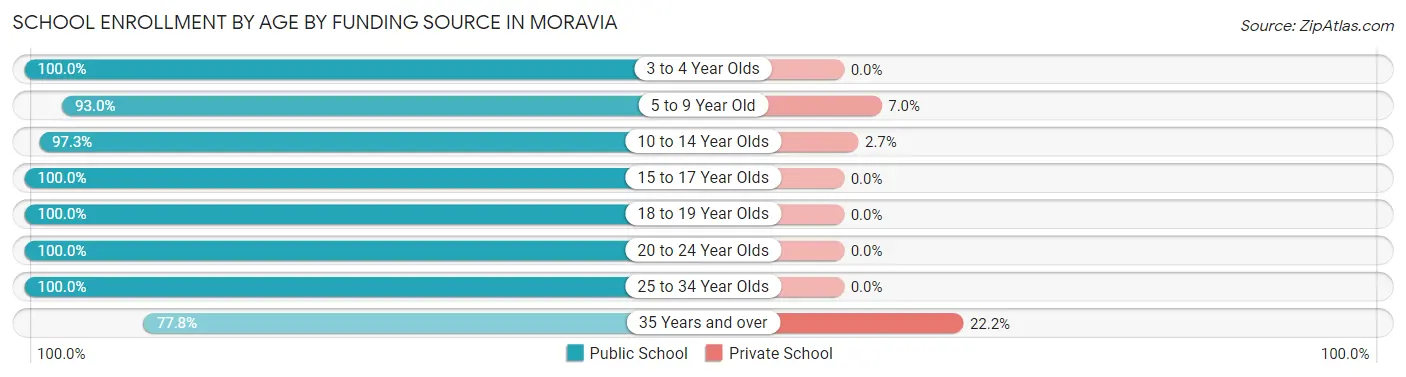
School Enrollment by Age by Funding Source in Moravia
Out of a total of 438 students who are enrolled in schools in Moravia, 12 (2.7%) attend a private institution, while the remaining 426 (97.3%) are enrolled in public schools. The age group of 35 years and over has the highest likelihood of being enrolled in private schools, with 2 (22.2% in the age bracket) enrolled. Conversely, the age group of 3 to 4 year olds has the lowest likelihood of being enrolled in a private school, with 29 (100.0% in the age bracket) attending a public institution.
| Age Bracket | Public School | Private School |
| 3 to 4 Year Olds | 29 (100.0%) | 0 (0.0%) |
| 5 to 9 Year Old | 93 (93.0%) | 7 (7.0%) |
| 10 to 14 Year Olds | 109 (97.3%) | 3 (2.7%) |
| 15 to 17 Year Olds | 121 (100.0%) | 0 (0.0%) |
| 18 to 19 Year Olds | 24 (100.0%) | 0 (0.0%) |
| 20 to 24 Year Olds | 19 (100.0%) | 0 (0.0%) |
| 25 to 34 Year Olds | 24 (100.0%) | 0 (0.0%) |
| 35 Years and over | 7 (77.8%) | 2 (22.2%) |
| Total | 426 (97.3%) | 12 (2.7%) |
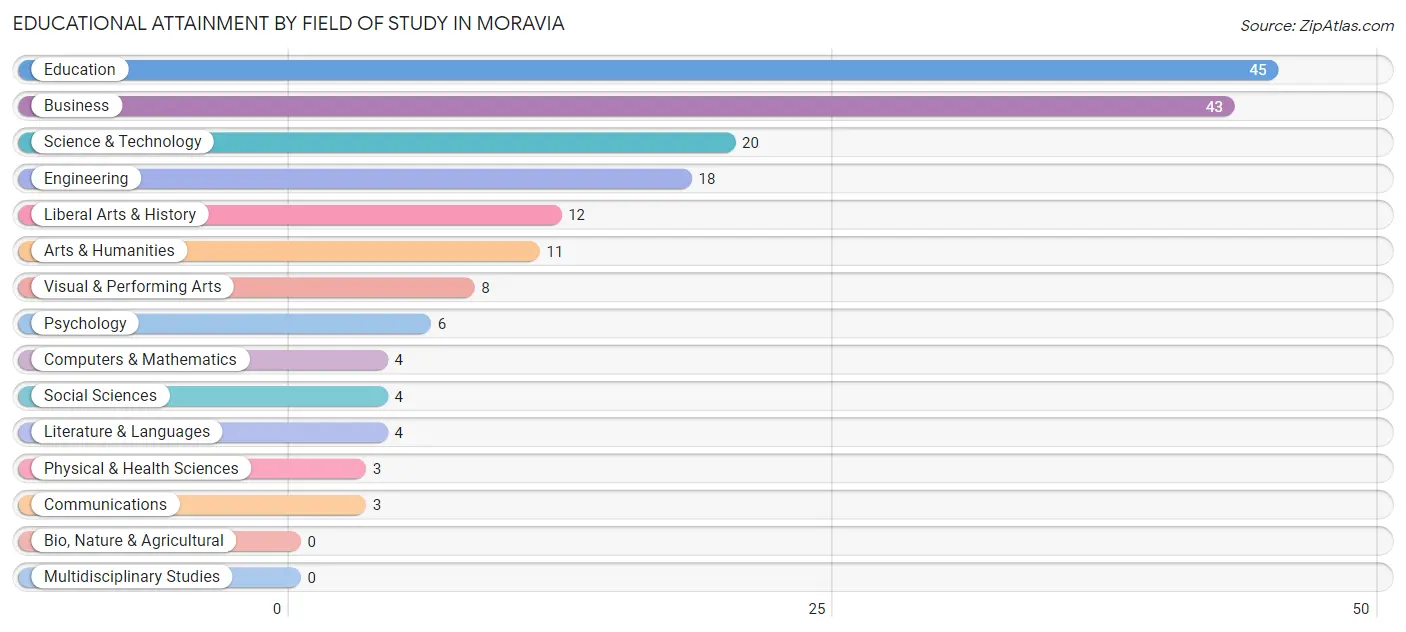
Educational Attainment by Field of Study in Moravia
Education (45 | 24.9%), business (43 | 23.8%), science & technology (20 | 11.1%), engineering (18 | 9.9%), and liberal arts & history (12 | 6.6%) are the most common fields of study among 181 individuals in Moravia who have obtained a bachelor's degree or higher.
| Field of Study | # Graduates | % Graduates |
| Computers & Mathematics | 4 | 2.2% |
| Bio, Nature & Agricultural | 0 | 0.0% |
| Physical & Health Sciences | 3 | 1.7% |
| Psychology | 6 | 3.3% |
| Social Sciences | 4 | 2.2% |
| Engineering | 18 | 9.9% |
| Multidisciplinary Studies | 0 | 0.0% |
| Science & Technology | 20 | 11.1% |
| Business | 43 | 23.8% |
| Education | 45 | 24.9% |
| Literature & Languages | 4 | 2.2% |
| Liberal Arts & History | 12 | 6.6% |
| Visual & Performing Arts | 8 | 4.4% |
| Communications | 3 | 1.7% |
| Arts & Humanities | 11 | 6.1% |
| Total | 181 | 100.0% |
Transportation & Commute in Moravia
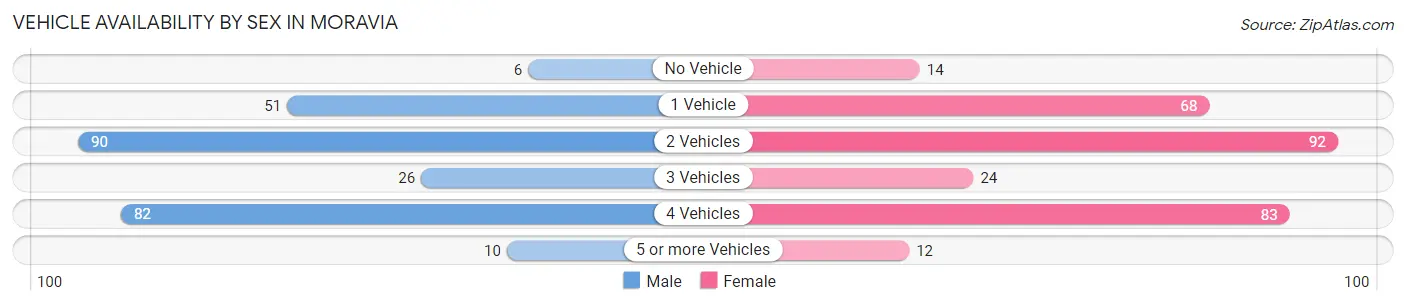
Vehicle Availability by Sex in Moravia
The most prevalent vehicle ownership categories in Moravia are males with 2 vehicles (90, accounting for 34.0%) and females with 2 vehicles (92, making up 30.7%).
| Vehicles Available | Male | Female |
| No Vehicle | 6 (2.3%) | 14 (4.8%) |
| 1 Vehicle | 51 (19.3%) | 68 (23.2%) |
| 2 Vehicles | 90 (34.0%) | 92 (31.4%) |
| 3 Vehicles | 26 (9.8%) | 24 (8.2%) |
| 4 Vehicles | 82 (30.9%) | 83 (28.3%) |
| 5 or more Vehicles | 10 (3.8%) | 12 (4.1%) |
| Total | 265 (100.0%) | 293 (100.0%) |
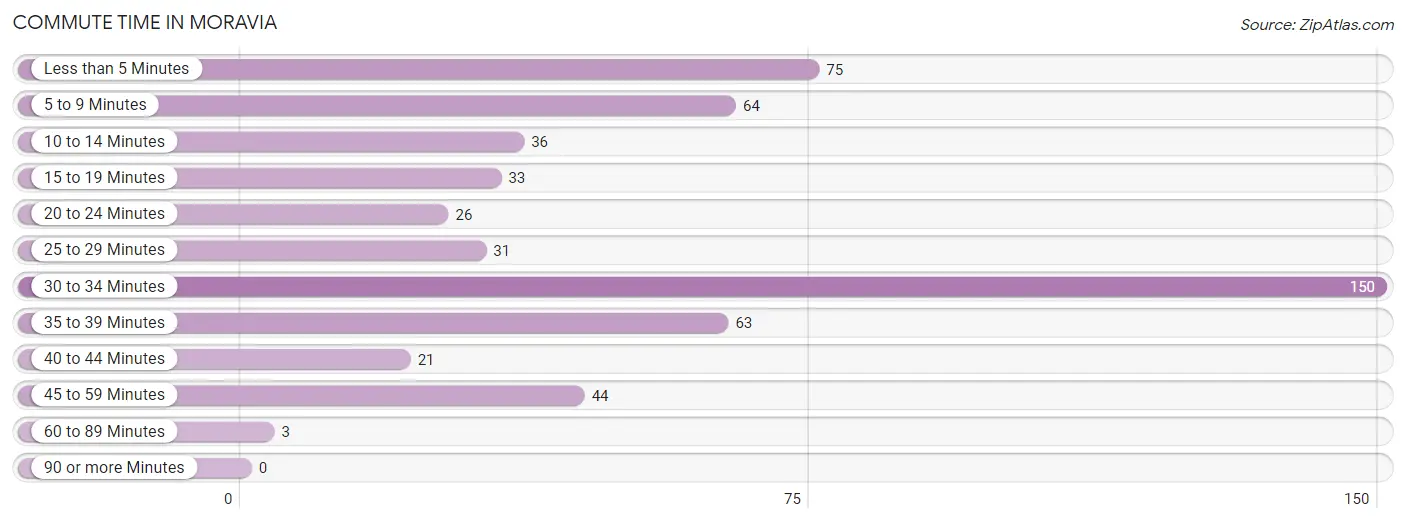
Commute Time in Moravia
The most frequently occuring commute durations in Moravia are 30 to 34 minutes (150 commuters, 27.5%), less than 5 minutes (75 commuters, 13.7%), and 5 to 9 minutes (64 commuters, 11.7%).
| Commute Time | # Commuters | % Commuters |
| Less than 5 Minutes | 75 | 13.7% |
| 5 to 9 Minutes | 64 | 11.7% |
| 10 to 14 Minutes | 36 | 6.6% |
| 15 to 19 Minutes | 33 | 6.0% |
| 20 to 24 Minutes | 26 | 4.8% |
| 25 to 29 Minutes | 31 | 5.7% |
| 30 to 34 Minutes | 150 | 27.5% |
| 35 to 39 Minutes | 63 | 11.5% |
| 40 to 44 Minutes | 21 | 3.8% |
| 45 to 59 Minutes | 44 | 8.1% |
| 60 to 89 Minutes | 3 | 0.5% |
| 90 or more Minutes | 0 | 0.0% |
Commute Time by Sex in Moravia
The most common commute times in Moravia are 30 to 34 minutes (56 commuters, 21.1%) for males and 30 to 34 minutes (94 commuters, 33.5%) for females.
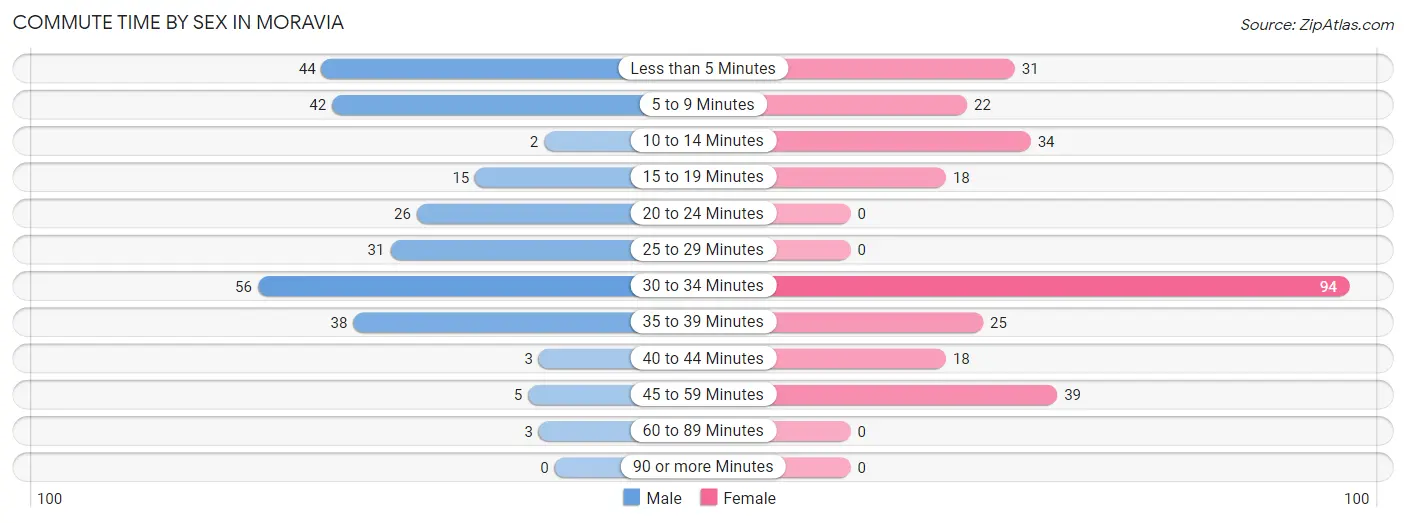
| Commute Time | Male | Female |
| Less than 5 Minutes | 44 (16.6%) | 31 (11.0%) |
| 5 to 9 Minutes | 42 (15.9%) | 22 (7.8%) |
| 10 to 14 Minutes | 2 (0.7%) | 34 (12.1%) |
| 15 to 19 Minutes | 15 (5.7%) | 18 (6.4%) |
| 20 to 24 Minutes | 26 (9.8%) | 0 (0.0%) |
| 25 to 29 Minutes | 31 (11.7%) | 0 (0.0%) |
| 30 to 34 Minutes | 56 (21.1%) | 94 (33.5%) |
| 35 to 39 Minutes | 38 (14.3%) | 25 (8.9%) |
| 40 to 44 Minutes | 3 (1.1%) | 18 (6.4%) |
| 45 to 59 Minutes | 5 (1.9%) | 39 (13.9%) |
| 60 to 89 Minutes | 3 (1.1%) | 0 (0.0%) |
| 90 or more Minutes | 0 (0.0%) | 0 (0.0%) |
Time of Departure to Work by Sex in Moravia
The most frequent times of departure to work in Moravia are 6:00 AM to 6:29 AM (59, 22.3%) for males and 7:00 AM to 7:29 AM (84, 29.9%) for females.
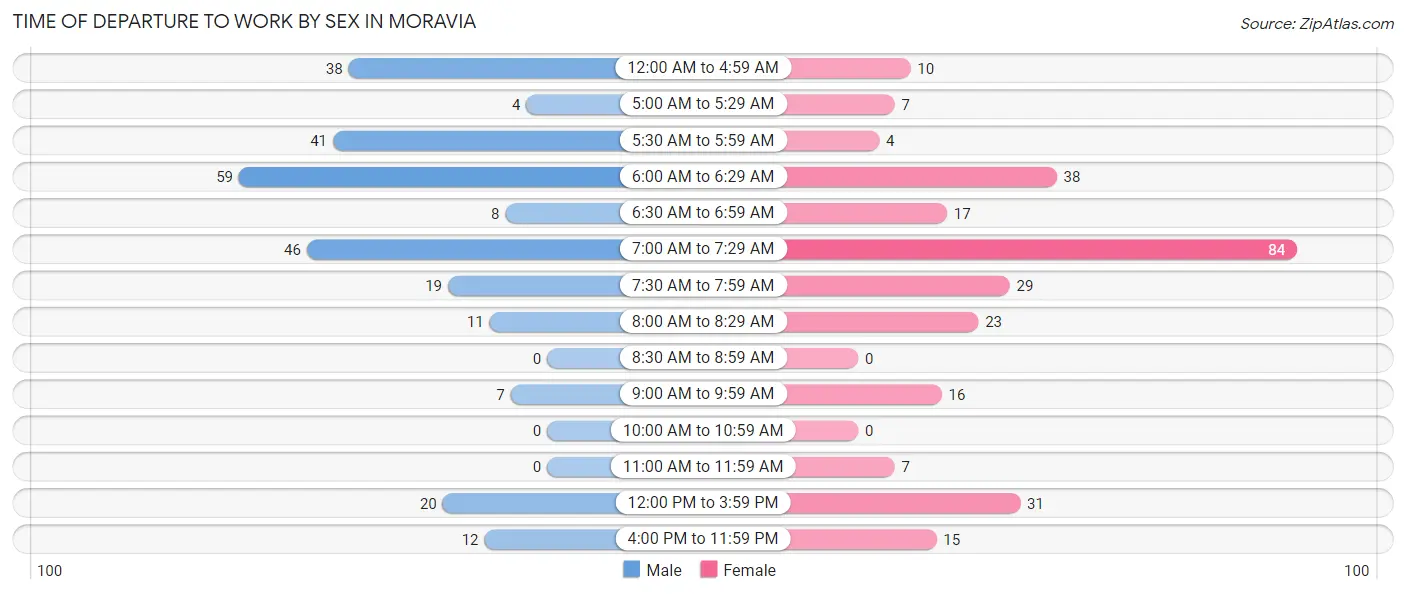
| Time of Departure | Male | Female |
| 12:00 AM to 4:59 AM | 38 (14.3%) | 10 (3.6%) |
| 5:00 AM to 5:29 AM | 4 (1.5%) | 7 (2.5%) |
| 5:30 AM to 5:59 AM | 41 (15.5%) | 4 (1.4%) |
| 6:00 AM to 6:29 AM | 59 (22.3%) | 38 (13.5%) |
| 6:30 AM to 6:59 AM | 8 (3.0%) | 17 (6.0%) |
| 7:00 AM to 7:29 AM | 46 (17.4%) | 84 (29.9%) |
| 7:30 AM to 7:59 AM | 19 (7.2%) | 29 (10.3%) |
| 8:00 AM to 8:29 AM | 11 (4.2%) | 23 (8.2%) |
| 8:30 AM to 8:59 AM | 0 (0.0%) | 0 (0.0%) |
| 9:00 AM to 9:59 AM | 7 (2.6%) | 16 (5.7%) |
| 10:00 AM to 10:59 AM | 0 (0.0%) | 0 (0.0%) |
| 11:00 AM to 11:59 AM | 0 (0.0%) | 7 (2.5%) |
| 12:00 PM to 3:59 PM | 20 (7.5%) | 31 (11.0%) |
| 4:00 PM to 11:59 PM | 12 (4.5%) | 15 (5.3%) |
| Total | 265 (100.0%) | 281 (100.0%) |
Housing Occupancy in Moravia
Occupancy by Ownership in Moravia
Of the total 513 dwellings in Moravia, owner-occupied units account for 358 (69.8%), while renter-occupied units make up 155 (30.2%).
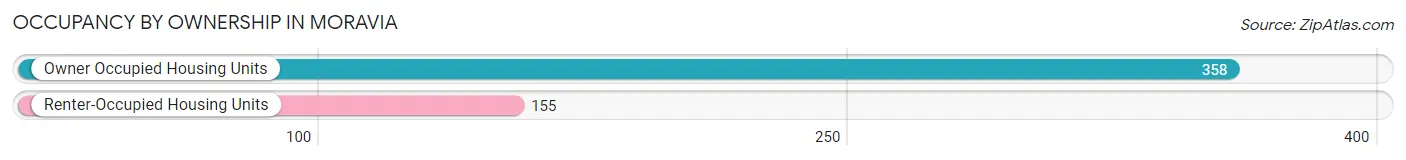
| Occupancy | # Housing Units | % Housing Units |
| Owner Occupied Housing Units | 358 | 69.8% |
| Renter-Occupied Housing Units | 155 | 30.2% |
| Total Occupied Housing Units | 513 | 100.0% |
Occupancy by Household Size in Moravia
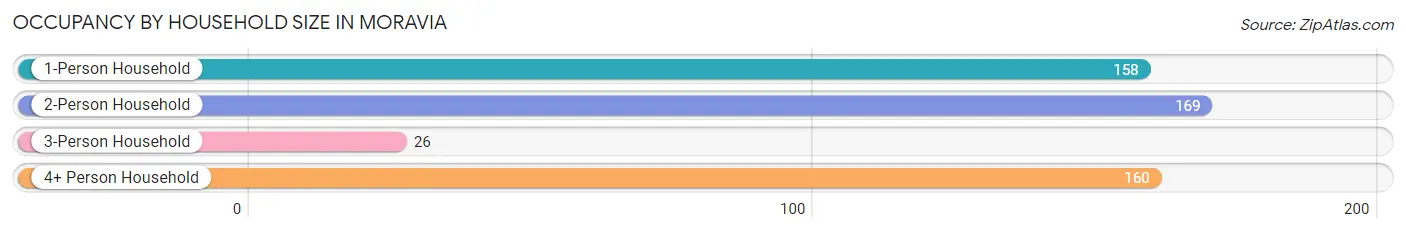
| Household Size | # Housing Units | % Housing Units |
| 1-Person Household | 158 | 30.8% |
| 2-Person Household | 169 | 32.9% |
| 3-Person Household | 26 | 5.1% |
| 4+ Person Household | 160 | 31.2% |
| Total Housing Units | 513 | 100.0% |
Occupancy by Ownership by Household Size in Moravia
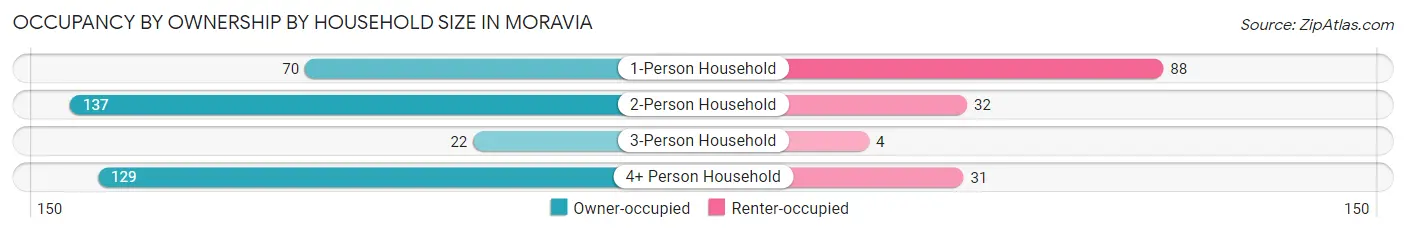
| Household Size | Owner-occupied | Renter-occupied |
| 1-Person Household | 70 (44.3%) | 88 (55.7%) |
| 2-Person Household | 137 (81.1%) | 32 (18.9%) |
| 3-Person Household | 22 (84.6%) | 4 (15.4%) |
| 4+ Person Household | 129 (80.6%) | 31 (19.4%) |
| Total Housing Units | 358 (69.8%) | 155 (30.2%) |
Occupancy by Educational Attainment in Moravia
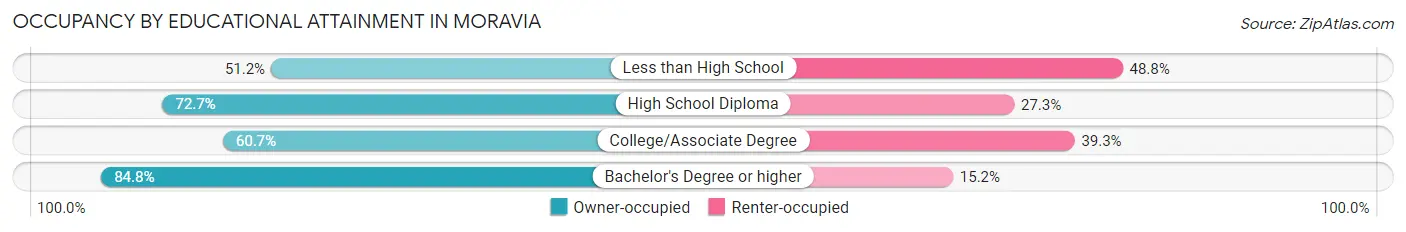
| Household Size | Owner-occupied | Renter-occupied |
| Less than High School | 22 (51.2%) | 21 (48.8%) |
| High School Diploma | 125 (72.7%) | 47 (27.3%) |
| College/Associate Degree | 105 (60.7%) | 68 (39.3%) |
| Bachelor's Degree or higher | 106 (84.8%) | 19 (15.2%) |
Occupancy by Age of Householder in Moravia
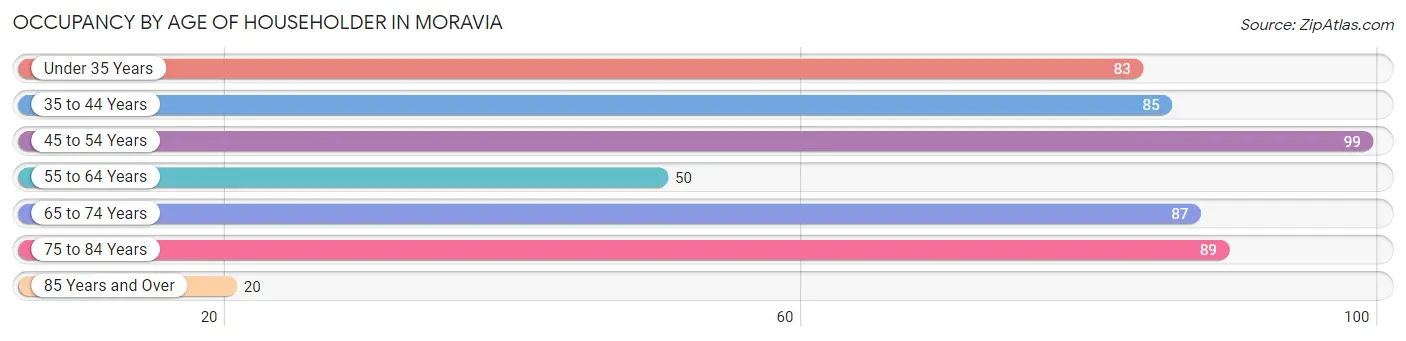
| Age Bracket | # Households | % Households |
| Under 35 Years | 83 | 16.2% |
| 35 to 44 Years | 85 | 16.6% |
| 45 to 54 Years | 99 | 19.3% |
| 55 to 64 Years | 50 | 9.8% |
| 65 to 74 Years | 87 | 17.0% |
| 75 to 84 Years | 89 | 17.3% |
| 85 Years and Over | 20 | 3.9% |
| Total | 513 | 100.0% |
Housing Finances in Moravia
Median Income by Occupancy in Moravia
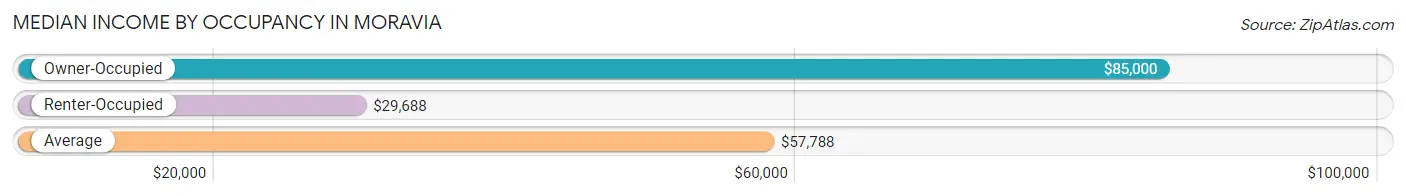
| Occupancy Type | # Households | Median Income |
| Owner-Occupied | 358 (69.8%) | $85,000 |
| Renter-Occupied | 155 (30.2%) | $29,688 |
| Average | 513 (100.0%) | $57,788 |
Occupancy by Householder Income Bracket in Moravia
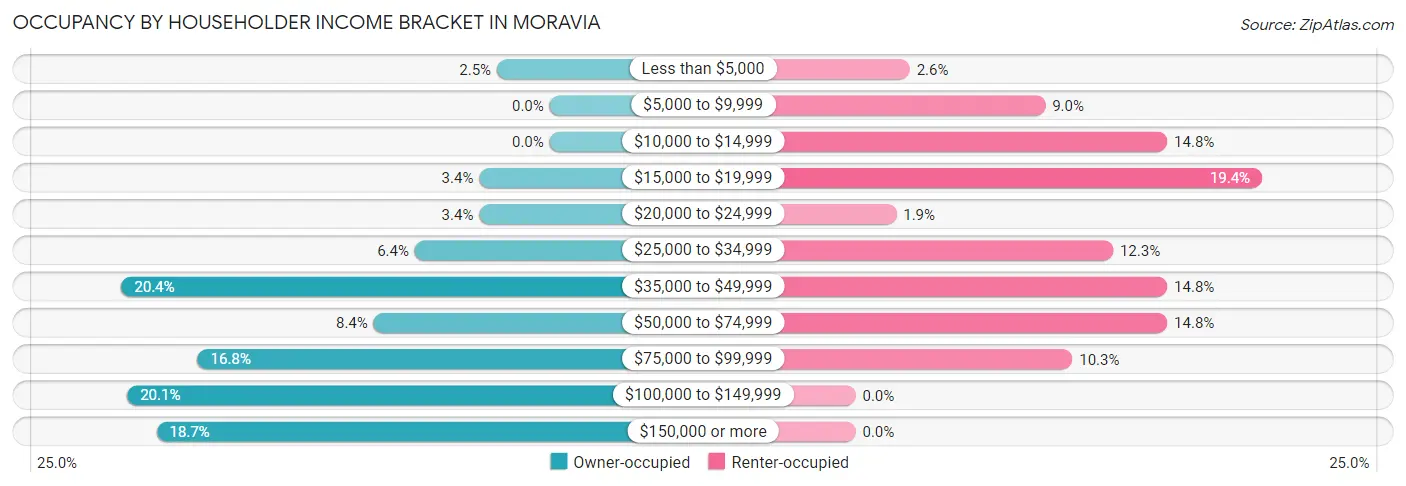
| Income Bracket | Owner-occupied | Renter-occupied |
| Less than $5,000 | 9 (2.5%) | 4 (2.6%) |
| $5,000 to $9,999 | 0 (0.0%) | 14 (9.0%) |
| $10,000 to $14,999 | 0 (0.0%) | 23 (14.8%) |
| $15,000 to $19,999 | 12 (3.4%) | 30 (19.4%) |
| $20,000 to $24,999 | 12 (3.4%) | 3 (1.9%) |
| $25,000 to $34,999 | 23 (6.4%) | 19 (12.3%) |
| $35,000 to $49,999 | 73 (20.4%) | 23 (14.8%) |
| $50,000 to $74,999 | 30 (8.4%) | 23 (14.8%) |
| $75,000 to $99,999 | 60 (16.8%) | 16 (10.3%) |
| $100,000 to $149,999 | 72 (20.1%) | 0 (0.0%) |
| $150,000 or more | 67 (18.7%) | 0 (0.0%) |
| Total | 358 (100.0%) | 155 (100.0%) |
Monthly Housing Cost Tiers in Moravia
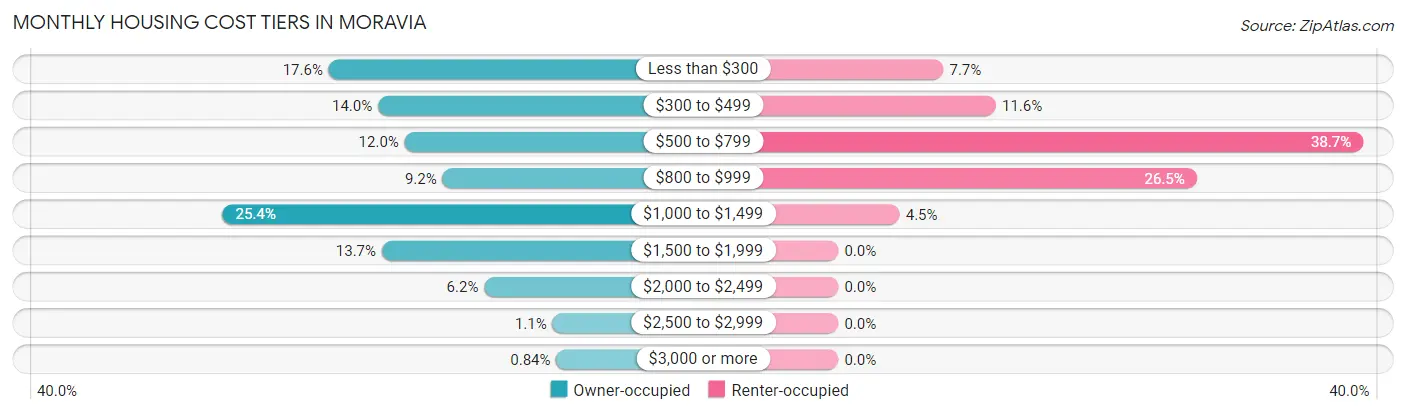
| Monthly Cost | Owner-occupied | Renter-occupied |
| Less than $300 | 63 (17.6%) | 12 (7.7%) |
| $300 to $499 | 50 (14.0%) | 18 (11.6%) |
| $500 to $799 | 43 (12.0%) | 60 (38.7%) |
| $800 to $999 | 33 (9.2%) | 41 (26.5%) |
| $1,000 to $1,499 | 91 (25.4%) | 7 (4.5%) |
| $1,500 to $1,999 | 49 (13.7%) | 0 (0.0%) |
| $2,000 to $2,499 | 22 (6.1%) | 0 (0.0%) |
| $2,500 to $2,999 | 4 (1.1%) | 0 (0.0%) |
| $3,000 or more | 3 (0.8%) | 0 (0.0%) |
| Total | 358 (100.0%) | 155 (100.0%) |
Physical Housing Characteristics in Moravia
Housing Structures in Moravia
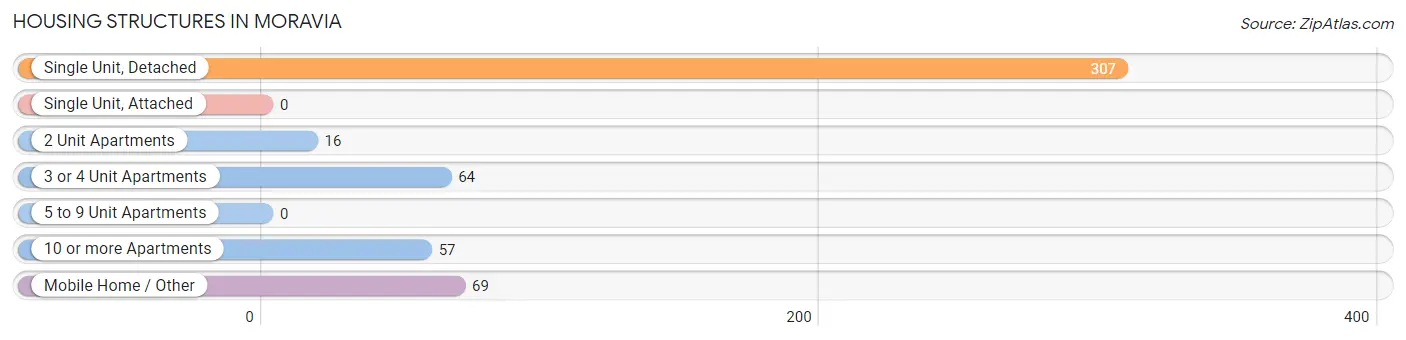
| Structure Type | # Housing Units | % Housing Units |
| Single Unit, Detached | 307 | 59.8% |
| Single Unit, Attached | 0 | 0.0% |
| 2 Unit Apartments | 16 | 3.1% |
| 3 or 4 Unit Apartments | 64 | 12.5% |
| 5 to 9 Unit Apartments | 0 | 0.0% |
| 10 or more Apartments | 57 | 11.1% |
| Mobile Home / Other | 69 | 13.5% |
| Total | 513 | 100.0% |
Housing Structures by Occupancy in Moravia
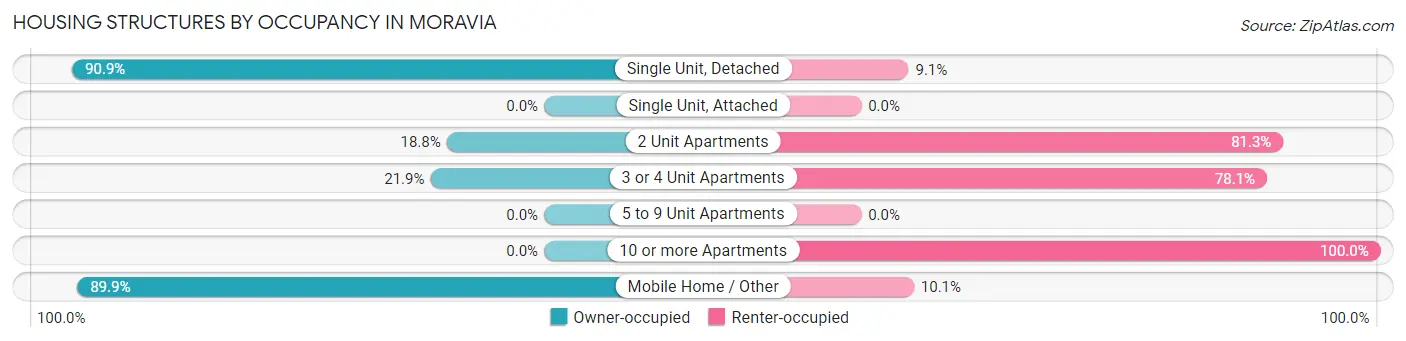
| Structure Type | Owner-occupied | Renter-occupied |
| Single Unit, Detached | 279 (90.9%) | 28 (9.1%) |
| Single Unit, Attached | 0 (0.0%) | 0 (0.0%) |
| 2 Unit Apartments | 3 (18.8%) | 13 (81.2%) |
| 3 or 4 Unit Apartments | 14 (21.9%) | 50 (78.1%) |
| 5 to 9 Unit Apartments | 0 (0.0%) | 0 (0.0%) |
| 10 or more Apartments | 0 (0.0%) | 57 (100.0%) |
| Mobile Home / Other | 62 (89.9%) | 7 (10.1%) |
| Total | 358 (69.8%) | 155 (30.2%) |
Housing Structures by Number of Rooms in Moravia
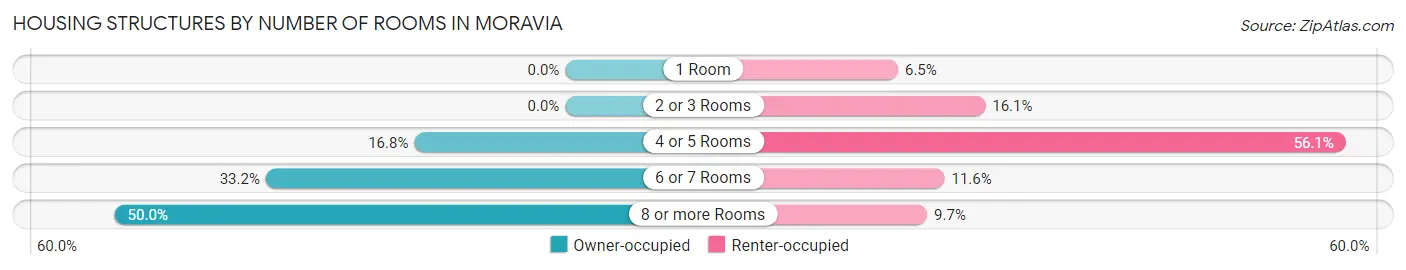
| Number of Rooms | Owner-occupied | Renter-occupied |
| 1 Room | 0 (0.0%) | 10 (6.5%) |
| 2 or 3 Rooms | 0 (0.0%) | 25 (16.1%) |
| 4 or 5 Rooms | 60 (16.8%) | 87 (56.1%) |
| 6 or 7 Rooms | 119 (33.2%) | 18 (11.6%) |
| 8 or more Rooms | 179 (50.0%) | 15 (9.7%) |
| Total | 358 (100.0%) | 155 (100.0%) |
Housing Structure by Heating Type in Moravia
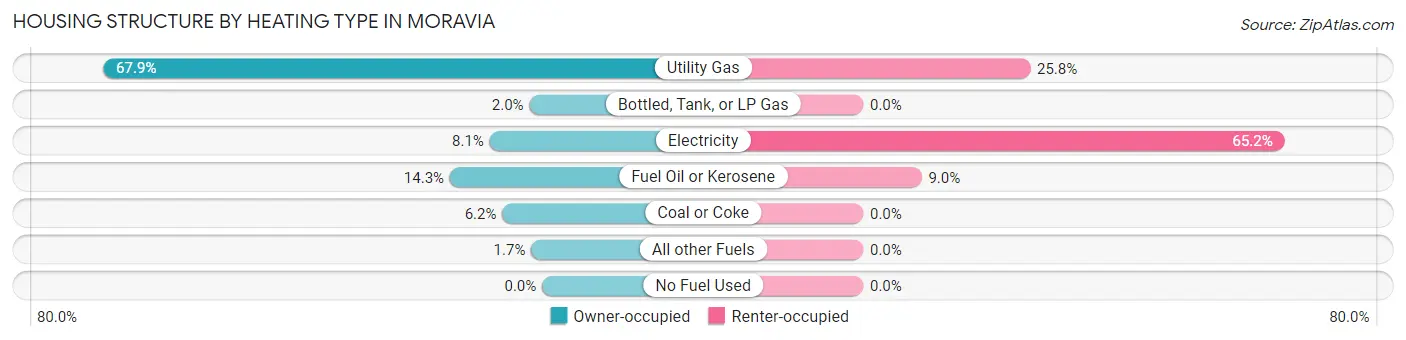
| Heating Type | Owner-occupied | Renter-occupied |
| Utility Gas | 243 (67.9%) | 40 (25.8%) |
| Bottled, Tank, or LP Gas | 7 (2.0%) | 0 (0.0%) |
| Electricity | 29 (8.1%) | 101 (65.2%) |
| Fuel Oil or Kerosene | 51 (14.2%) | 14 (9.0%) |
| Coal or Coke | 22 (6.1%) | 0 (0.0%) |
| All other Fuels | 6 (1.7%) | 0 (0.0%) |
| No Fuel Used | 0 (0.0%) | 0 (0.0%) |
| Total | 358 (100.0%) | 155 (100.0%) |
Household Vehicle Usage in Moravia
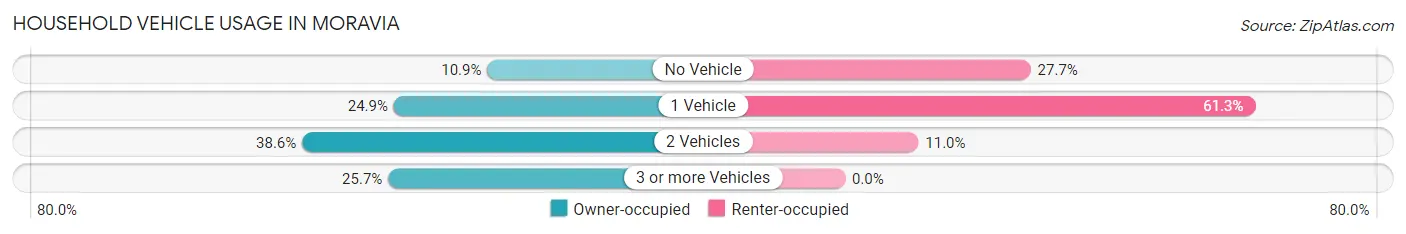
| Vehicles per Household | Owner-occupied | Renter-occupied |
| No Vehicle | 39 (10.9%) | 43 (27.7%) |
| 1 Vehicle | 89 (24.9%) | 95 (61.3%) |
| 2 Vehicles | 138 (38.6%) | 17 (11.0%) |
| 3 or more Vehicles | 92 (25.7%) | 0 (0.0%) |
| Total | 358 (100.0%) | 155 (100.0%) |
Real Estate & Mortgages in Moravia
Real Estate and Mortgage Overview in Moravia
| Characteristic | Without Mortgage | With Mortgage |
| Housing Units | 175 | 183 |
| Median Property Value | $89,900 | $145,300 |
| Median Household Income | $48,456 | $48 |
| Monthly Housing Costs | $425 | $3 |
| Real Estate Taxes | $2,296 | $6 |
Property Value by Mortgage Status in Moravia
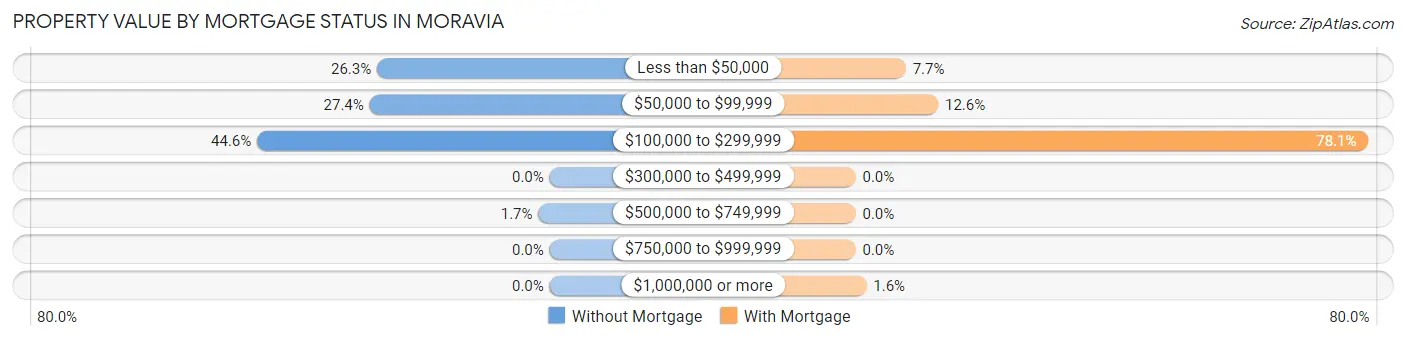
| Property Value | Without Mortgage | With Mortgage |
| Less than $50,000 | 46 (26.3%) | 14 (7.6%) |
| $50,000 to $99,999 | 48 (27.4%) | 23 (12.6%) |
| $100,000 to $299,999 | 78 (44.6%) | 143 (78.1%) |
| $300,000 to $499,999 | 0 (0.0%) | 0 (0.0%) |
| $500,000 to $749,999 | 3 (1.7%) | 0 (0.0%) |
| $750,000 to $999,999 | 0 (0.0%) | 0 (0.0%) |
| $1,000,000 or more | 0 (0.0%) | 3 (1.6%) |
| Total | 175 (100.0%) | 183 (100.0%) |
Household Income by Mortgage Status in Moravia
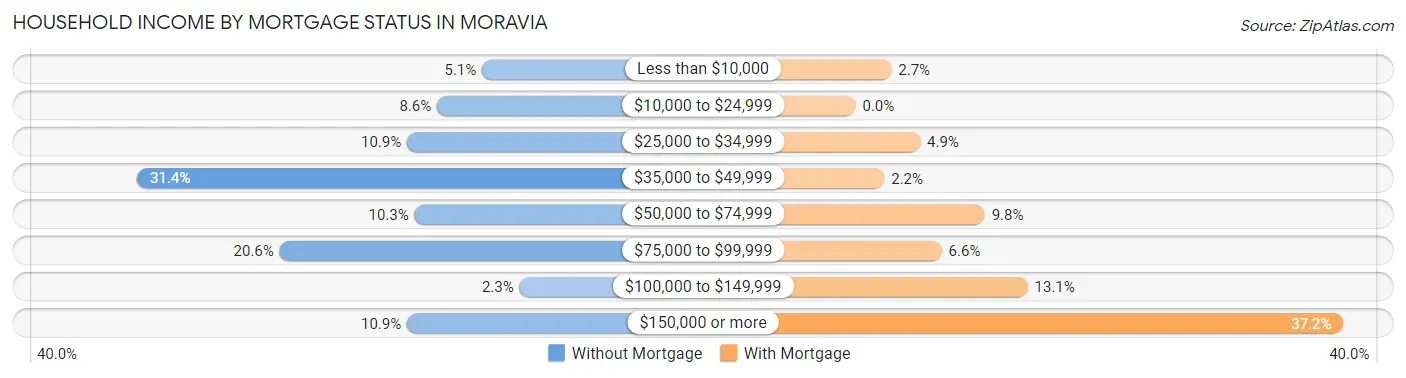
| Household Income | Without Mortgage | With Mortgage |
| Less than $10,000 | 9 (5.1%) | 5 (2.7%) |
| $10,000 to $24,999 | 15 (8.6%) | 0 (0.0%) |
| $25,000 to $34,999 | 19 (10.9%) | 9 (4.9%) |
| $35,000 to $49,999 | 55 (31.4%) | 4 (2.2%) |
| $50,000 to $74,999 | 18 (10.3%) | 18 (9.8%) |
| $75,000 to $99,999 | 36 (20.6%) | 12 (6.6%) |
| $100,000 to $149,999 | 4 (2.3%) | 24 (13.1%) |
| $150,000 or more | 19 (10.9%) | 68 (37.2%) |
| Total | 175 (100.0%) | 183 (100.0%) |
Property Value to Household Income Ratio in Moravia
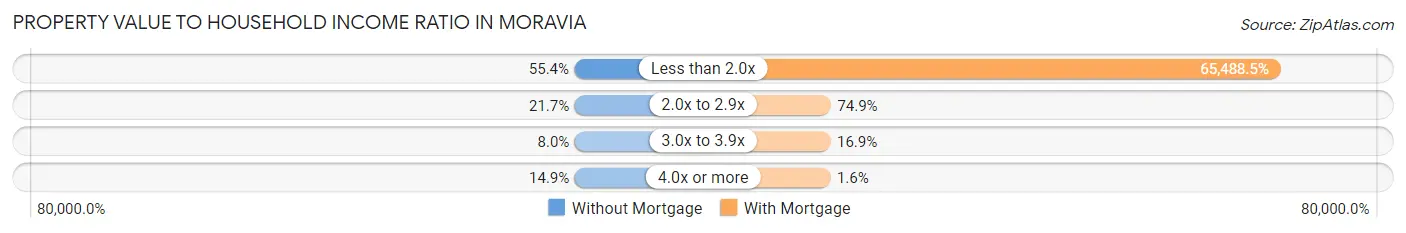
| Value-to-Income Ratio | Without Mortgage | With Mortgage |
| Less than 2.0x | 97 (55.4%) | 119,844 (65,488.5%) |
| 2.0x to 2.9x | 38 (21.7%) | 137 (74.9%) |
| 3.0x to 3.9x | 14 (8.0%) | 31 (16.9%) |
| 4.0x or more | 26 (14.9%) | 3 (1.6%) |
| Total | 175 (100.0%) | 183 (100.0%) |
Real Estate Taxes by Mortgage Status in Moravia
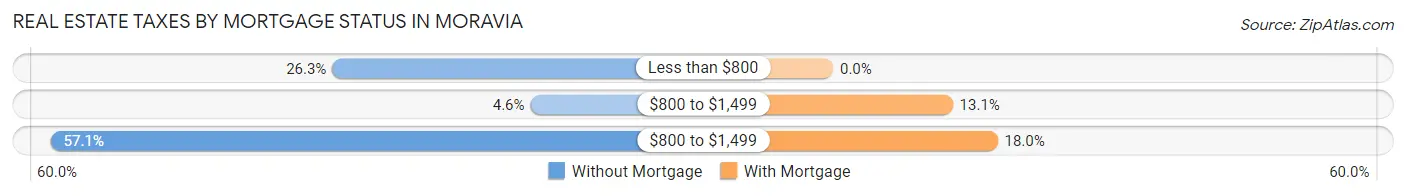
| Property Taxes | Without Mortgage | With Mortgage |
| Less than $800 | 46 (26.3%) | 0 (0.0%) |
| $800 to $1,499 | 8 (4.6%) | 24 (13.1%) |
| $800 to $1,499 | 100 (57.1%) | 33 (18.0%) |
| Total | 175 (100.0%) | 183 (100.0%) |
Health & Disability in Moravia
Health Insurance Coverage by Age in Moravia
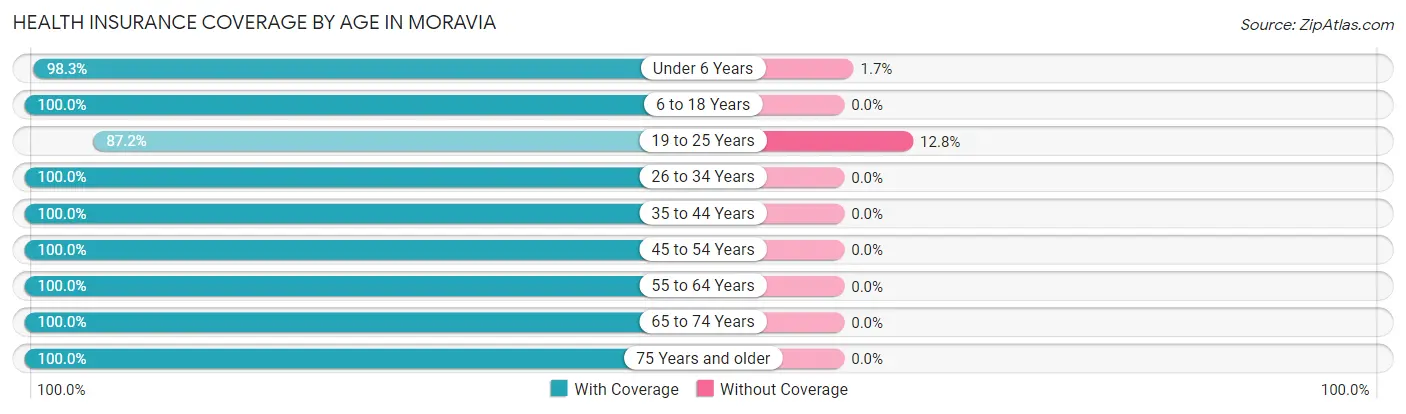
| Age Bracket | With Coverage | Without Coverage |
| Under 6 Years | 113 (98.3%) | 2 (1.7%) |
| 6 to 18 Years | 319 (100.0%) | 0 (0.0%) |
| 19 to 25 Years | 95 (87.2%) | 14 (12.8%) |
| 26 to 34 Years | 133 (100.0%) | 0 (0.0%) |
| 35 to 44 Years | 139 (100.0%) | 0 (0.0%) |
| 45 to 54 Years | 174 (100.0%) | 0 (0.0%) |
| 55 to 64 Years | 130 (100.0%) | 0 (0.0%) |
| 65 to 74 Years | 91 (100.0%) | 0 (0.0%) |
| 75 Years and older | 159 (100.0%) | 0 (0.0%) |
| Total | 1,353 (98.8%) | 16 (1.2%) |
Health Insurance Coverage by Citizenship Status in Moravia
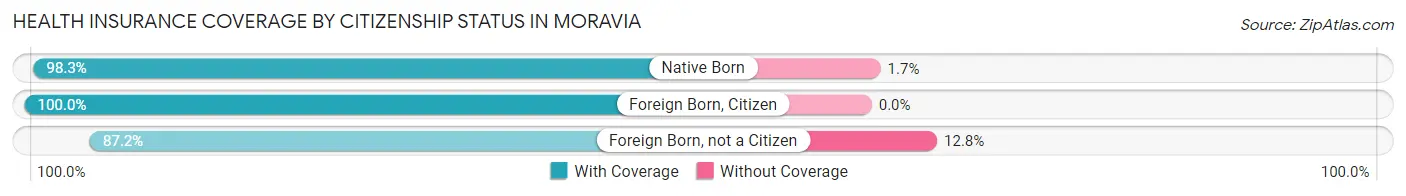
| Citizenship Status | With Coverage | Without Coverage |
| Native Born | 113 (98.3%) | 2 (1.7%) |
| Foreign Born, Citizen | 319 (100.0%) | 0 (0.0%) |
| Foreign Born, not a Citizen | 95 (87.2%) | 14 (12.8%) |
Health Insurance Coverage by Household Income in Moravia
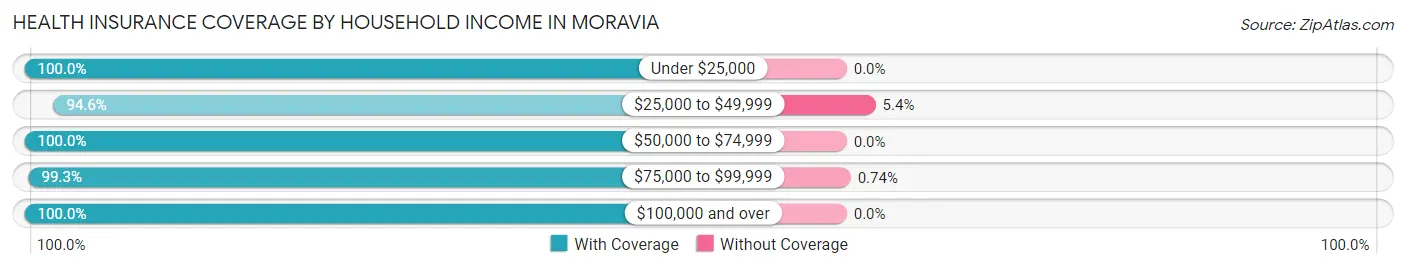
| Household Income | With Coverage | Without Coverage |
| Under $25,000 | 199 (100.0%) | 0 (0.0%) |
| $25,000 to $49,999 | 245 (94.6%) | 14 (5.4%) |
| $50,000 to $74,999 | 126 (100.0%) | 0 (0.0%) |
| $75,000 to $99,999 | 270 (99.3%) | 2 (0.7%) |
| $100,000 and over | 513 (100.0%) | 0 (0.0%) |
Public vs Private Health Insurance Coverage by Age in Moravia
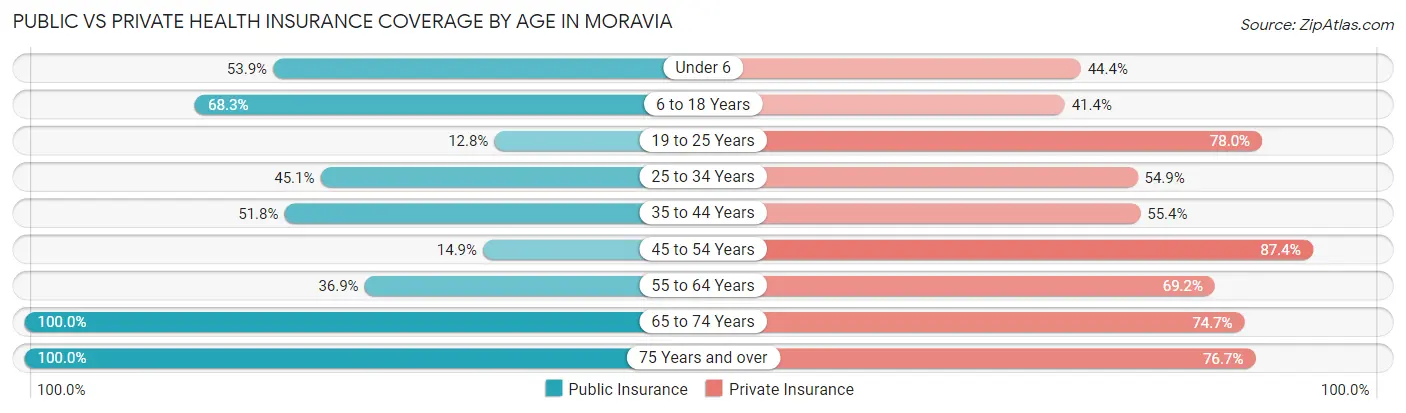
| Age Bracket | Public Insurance | Private Insurance |
| Under 6 | 62 (53.9%) | 51 (44.4%) |
| 6 to 18 Years | 218 (68.3%) | 132 (41.4%) |
| 19 to 25 Years | 14 (12.8%) | 85 (78.0%) |
| 25 to 34 Years | 60 (45.1%) | 73 (54.9%) |
| 35 to 44 Years | 72 (51.8%) | 77 (55.4%) |
| 45 to 54 Years | 26 (14.9%) | 152 (87.4%) |
| 55 to 64 Years | 48 (36.9%) | 90 (69.2%) |
| 65 to 74 Years | 91 (100.0%) | 68 (74.7%) |
| 75 Years and over | 159 (100.0%) | 122 (76.7%) |
| Total | 750 (54.8%) | 850 (62.1%) |
Disability Status by Sex by Age in Moravia
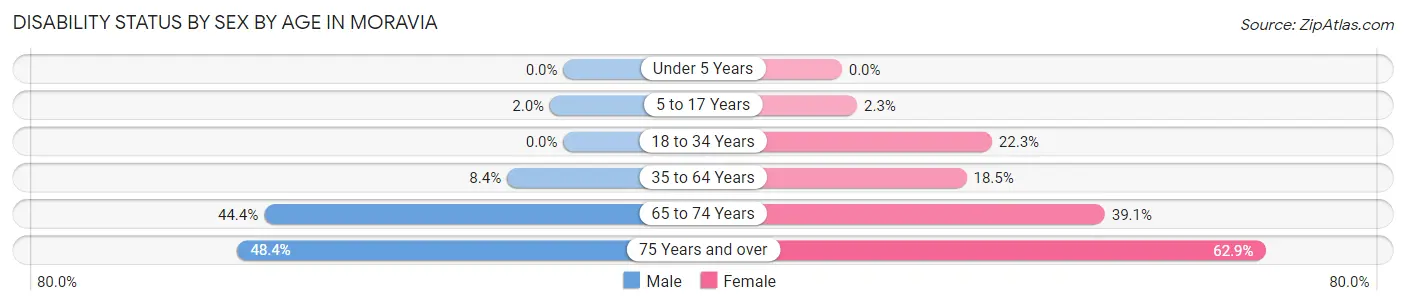
| Age Bracket | Male | Female |
| Under 5 Years | 0 (0.0%) | 0 (0.0%) |
| 5 to 17 Years | 4 (2.0%) | 3 (2.3%) |
| 18 to 34 Years | 0 (0.0%) | 37 (22.3%) |
| 35 to 64 Years | 19 (8.4%) | 40 (18.5%) |
| 65 to 74 Years | 12 (44.4%) | 25 (39.1%) |
| 75 Years and over | 30 (48.4%) | 61 (62.9%) |
Disability Class by Sex by Age in Moravia
Disability Class: Hearing Difficulty
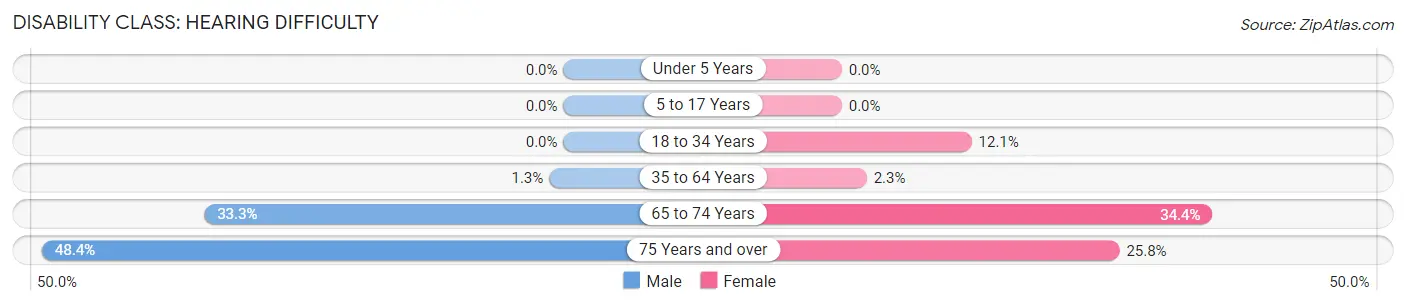
| Age Bracket | Male | Female |
| Under 5 Years | 0 (0.0%) | 0 (0.0%) |
| 5 to 17 Years | 0 (0.0%) | 0 (0.0%) |
| 18 to 34 Years | 0 (0.0%) | 20 (12.0%) |
| 35 to 64 Years | 3 (1.3%) | 5 (2.3%) |
| 65 to 74 Years | 9 (33.3%) | 22 (34.4%) |
| 75 Years and over | 30 (48.4%) | 25 (25.8%) |
Disability Class: Vision Difficulty
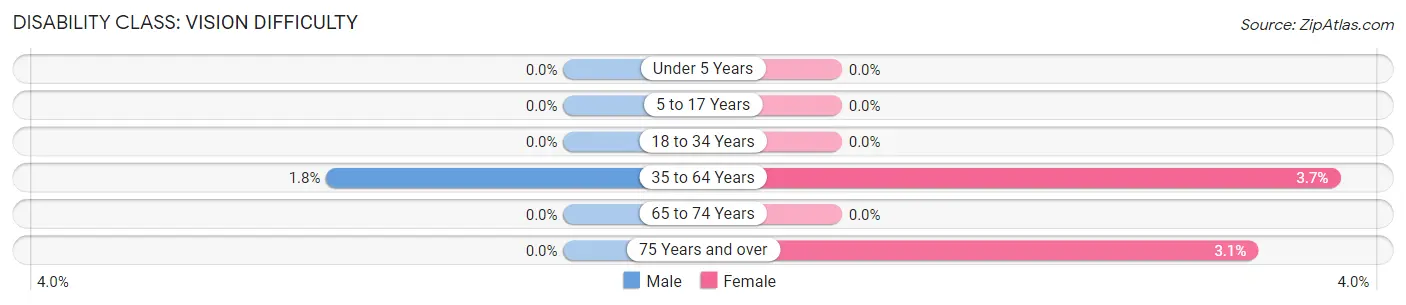
| Age Bracket | Male | Female |
| Under 5 Years | 0 (0.0%) | 0 (0.0%) |
| 5 to 17 Years | 0 (0.0%) | 0 (0.0%) |
| 18 to 34 Years | 0 (0.0%) | 0 (0.0%) |
| 35 to 64 Years | 4 (1.8%) | 8 (3.7%) |
| 65 to 74 Years | 0 (0.0%) | 0 (0.0%) |
| 75 Years and over | 0 (0.0%) | 3 (3.1%) |
Disability Class: Cognitive Difficulty
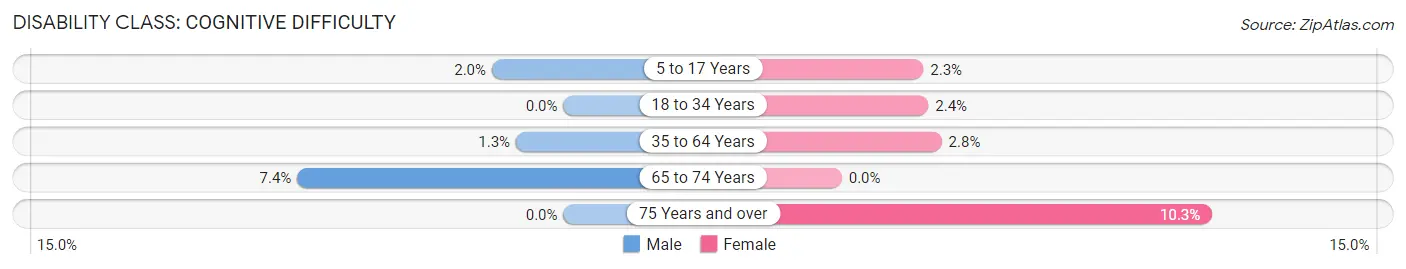
| Age Bracket | Male | Female |
| 5 to 17 Years | 4 (2.0%) | 3 (2.3%) |
| 18 to 34 Years | 0 (0.0%) | 4 (2.4%) |
| 35 to 64 Years | 3 (1.3%) | 6 (2.8%) |
| 65 to 74 Years | 2 (7.4%) | 0 (0.0%) |
| 75 Years and over | 0 (0.0%) | 10 (10.3%) |
Disability Class: Ambulatory Difficulty
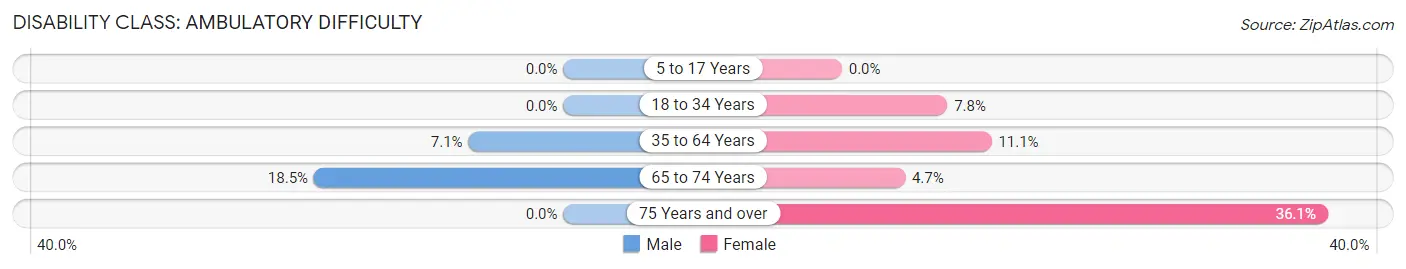
| Age Bracket | Male | Female |
| 5 to 17 Years | 0 (0.0%) | 0 (0.0%) |
| 18 to 34 Years | 0 (0.0%) | 13 (7.8%) |
| 35 to 64 Years | 16 (7.0%) | 24 (11.1%) |
| 65 to 74 Years | 5 (18.5%) | 3 (4.7%) |
| 75 Years and over | 0 (0.0%) | 35 (36.1%) |
Disability Class: Self-Care Difficulty
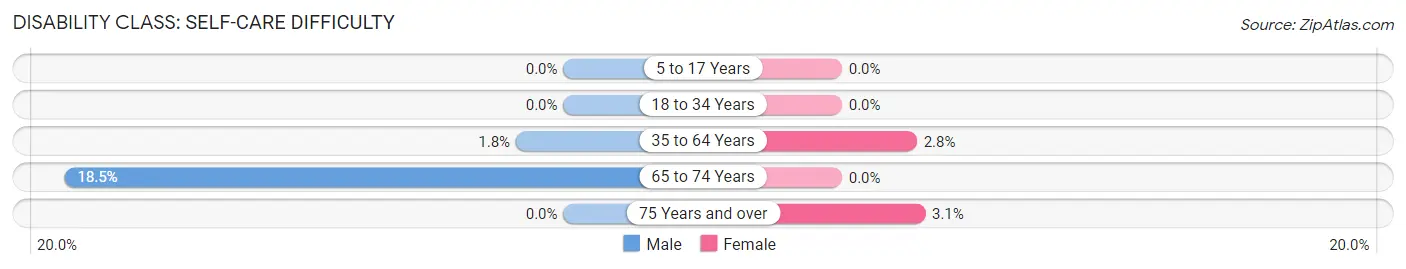
| Age Bracket | Male | Female |
| 5 to 17 Years | 0 (0.0%) | 0 (0.0%) |
| 18 to 34 Years | 0 (0.0%) | 0 (0.0%) |
| 35 to 64 Years | 4 (1.8%) | 6 (2.8%) |
| 65 to 74 Years | 5 (18.5%) | 0 (0.0%) |
| 75 Years and over | 0 (0.0%) | 3 (3.1%) |
Technology Access in Moravia
Computing Device Access in Moravia
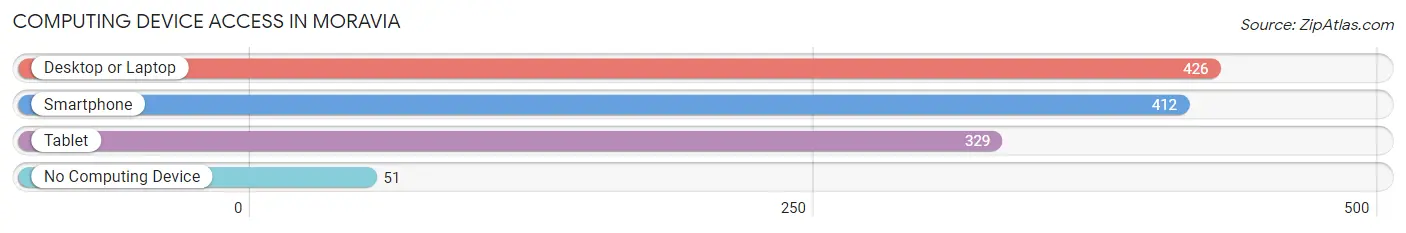
| Device Type | # Households | % Households |
| Desktop or Laptop | 426 | 83.0% |
| Smartphone | 412 | 80.3% |
| Tablet | 329 | 64.1% |
| No Computing Device | 51 | 9.9% |
| Total | 513 | 100.0% |
Internet Access in Moravia
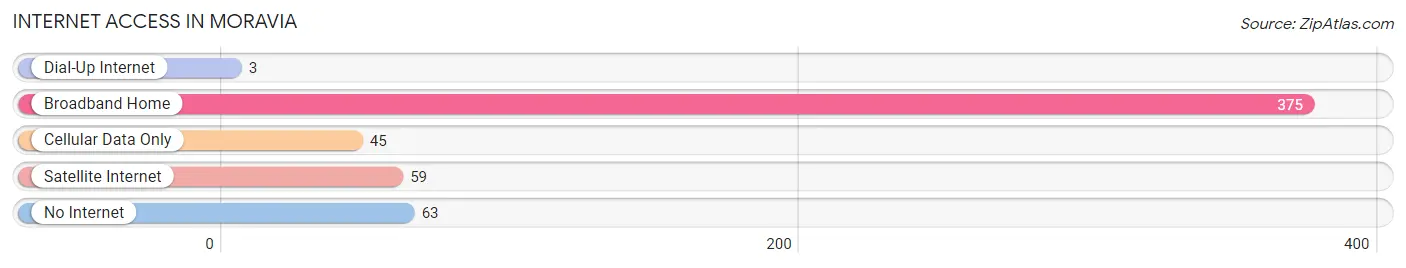
| Internet Type | # Households | % Households |
| Dial-Up Internet | 3 | 0.6% |
| Broadband Home | 375 | 73.1% |
| Cellular Data Only | 45 | 8.8% |
| Satellite Internet | 59 | 11.5% |
| No Internet | 63 | 12.3% |
| Total | 513 | 100.0% |
Moravia Summary
Moravia is a small town located in the Finger Lakes region of New York State. It is situated in the town of Sempronius in Cayuga County, approximately 20 miles south of Auburn and 30 miles north of Ithaca. The town has a population of approximately 1,500 people and is known for its rural charm and small-town atmosphere.
History
The area that is now Moravia was first settled in the late 1700s by a group of settlers from Connecticut. The town was originally known as “Sempronius” after the Roman general Sempronius Gracchus. The town was officially incorporated in 1817 and was renamed “Moravia” after the region of Moravia in the Czech Republic.
The town of Moravia was an important stop on the Underground Railroad, with many of the town’s residents helping to hide and transport escaped slaves. The town was also home to a number of prominent abolitionists, including the Reverend William H. Seward, who was a leader in the anti-slavery movement.
Geography
Moravia is located in the Finger Lakes region of New York State. The town is situated in the town of Sempronius in Cayuga County, approximately 20 miles south of Auburn and 30 miles north of Ithaca. The town is bordered by the towns of Owasco, Niles, and Scipio.
The terrain of Moravia is mostly flat, with some rolling hills. The town is located in the Finger Lakes region, which is known for its many lakes and rivers. The Owasco River runs through the town, and there are several small lakes in the area, including Owasco Lake, Otisco Lake, and Skaneateles Lake.
Economy
The economy of Moravia is largely based on agriculture and tourism. The town is home to several farms, which produce a variety of crops, including corn, soybeans, and hay. The town is also home to several wineries, which produce a variety of wines.
The town is also a popular tourist destination, with many visitors coming to enjoy the rural charm and small-town atmosphere. The town is home to several historic sites, including the Moravia Historical Society Museum, which houses artifacts from the town’s past.
Demographics
As of the 2010 census, the population of Moravia was 1,500 people. The racial makeup of the town was 97.3% White, 0.7% African American, 0.3% Native American, 0.3% Asian, and 1.3% from other races. The median household income was $41,250, and the median family income was $50,000.
The town is home to a number of churches, including the Moravia United Methodist Church, the Moravia Presbyterian Church, and the Moravia Baptist Church. The town is also home to a number of schools, including the Moravia Central School District, which serves students in grades K-12.
Conclusion
Moravia is a small town located in the Finger Lakes region of New York State. It is situated in the town of Sempronius in Cayuga County, approximately 20 miles south of Auburn and 30 miles north of Ithaca. The town has a population of approximately 1,500 people and is known for its rural charm and small-town atmosphere. The economy of Moravia is largely based on agriculture and tourism, and the town is home to several farms, wineries, and historic sites. The racial makeup of the town is mostly White, with a small percentage of African American, Native American, and Asian residents. The town is home to several churches and schools, and is a popular tourist destination.
Common Questions
What is Per Capita Income in Moravia?
Per Capita income in Moravia is $28,084.
What is the Median Family Income in Moravia?
Median Family Income in Moravia is $85,833.
What is the Median Household income in Moravia?
Median Household Income in Moravia is $57,788.
What is Income or Wage Gap in Moravia?
Income or Wage Gap in Moravia is 25.0%.
Women in Moravia earn 75.0 cents for every dollar earned by a man.
What is Inequality or Gini Index in Moravia?
Inequality or Gini Index in Moravia is 0.41.
What is the Total Population of Moravia?
Total Population of Moravia is 1,398.
What is the Total Male Population of Moravia?
Total Male Population of Moravia is 643.
What is the Total Female Population of Moravia?
Total Female Population of Moravia is 755.
What is the Ratio of Males per 100 Females in Moravia?
There are 85.17 Males per 100 Females in Moravia.
What is the Ratio of Females per 100 Males in Moravia?
There are 117.42 Females per 100 Males in Moravia.
What is the Median Population Age in Moravia?
Median Population Age in Moravia is 36.7 Years.
What is the Average Family Size in Moravia
Average Family Size in Moravia is 3.3 People.
What is the Average Household Size in Moravia
Average Household Size in Moravia is 2.7 People.
How Large is the Labor Force in Moravia?
There are 610 People in the Labor Forcein in Moravia.
What is the Percentage of People in the Labor Force in Moravia?
57.2% of People are in the Labor Force in Moravia.
What is the Unemployment Rate in Moravia?
Unemployment Rate in Moravia is 5.9%.