Kerhonkson, NY Map & Demographics
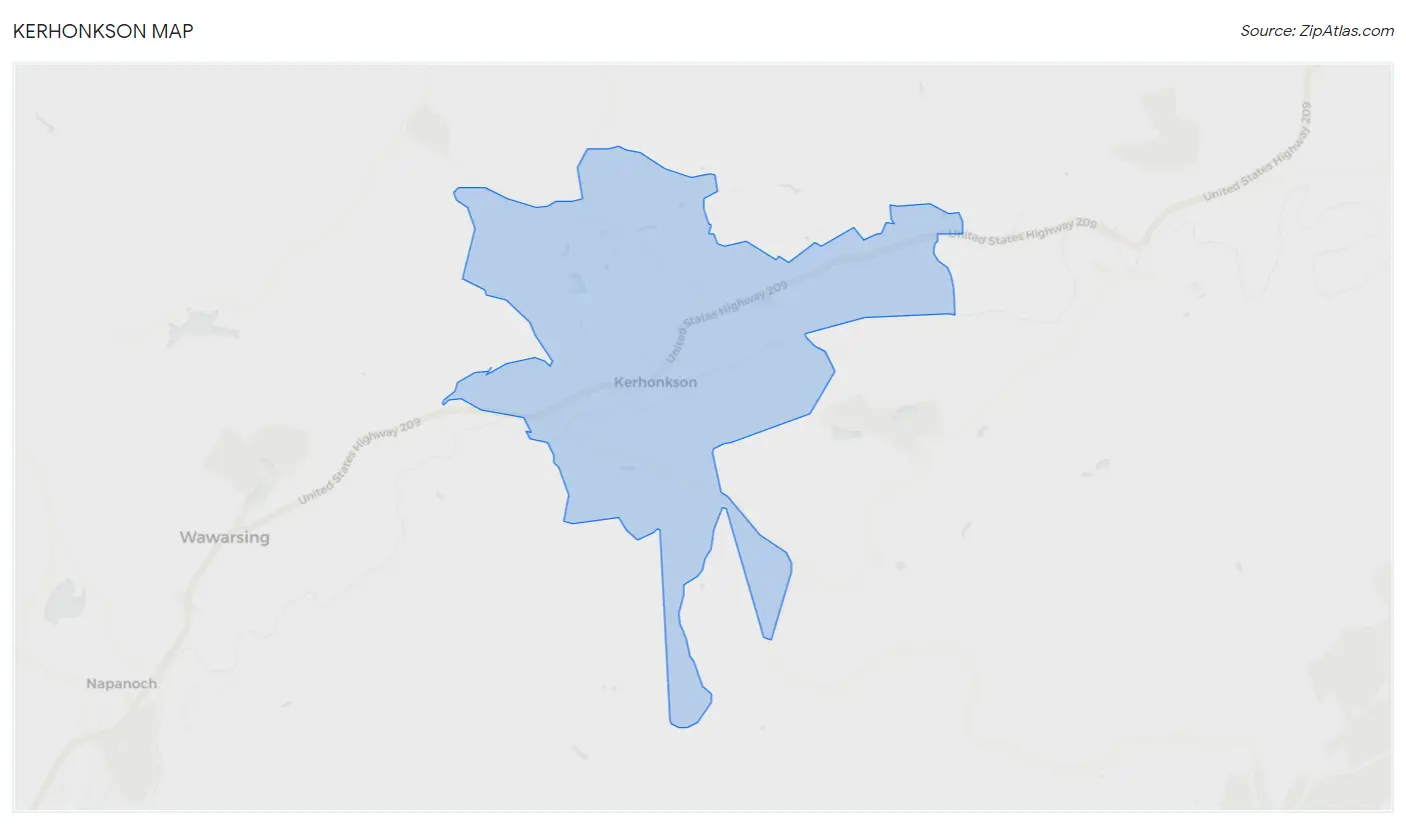
Kerhonkson Map
Kerhonkson Overview
$26,081
PER CAPITA INCOME
$66,588
AVG FAMILY INCOME
$68,500
AVG HOUSEHOLD INCOME
0.45
INEQUALITY / GINI INDEX
2,038
TOTAL POPULATION
979
MALE POPULATION
1,059
FEMALE POPULATION
92.45
MALES / 100 FEMALES
108.17
FEMALES / 100 MALES
30.2
MEDIAN AGE
3.2
AVG FAMILY SIZE
2.7
AVG HOUSEHOLD SIZE
1,101
LABOR FORCE [ PEOPLE ]
68.9%
PERCENT IN LABOR FORCE
8.3%
UNEMPLOYMENT RATE
Kerhonkson Zip Codes
Kerhonkson Area Codes
Income in Kerhonkson
Income Overview in Kerhonkson
Per Capita Income in Kerhonkson is $26,081, while median incomes of families and households are $66,588 and $68,500 respectively.
| Characteristic | Number | Measure |
| Per Capita Income | 2,038 | $26,081 |
| Median Family Income | 519 | $66,588 |
| Mean Family Income | 519 | $74,697 |
| Median Household Income | 754 | $68,500 |
| Mean Household Income | 754 | $74,372 |
| Income Deficit | 519 | $0 |
| Wage / Income Gap (%) | 2,038 | 0.00% |
| Wage / Income Gap ($) | 2,038 | 100.00¢ per $1 |
| Gini / Inequality Index | 2,038 | 0.45 |
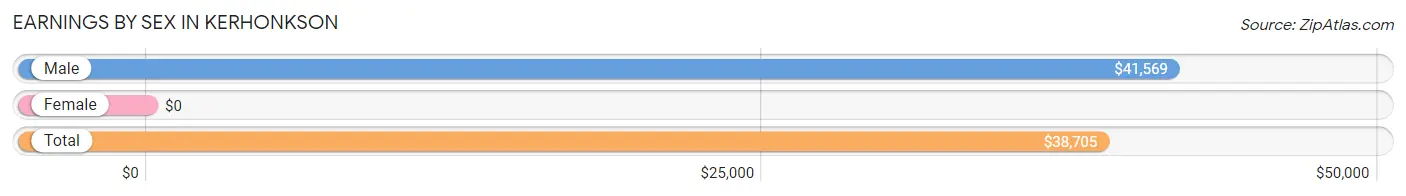
Earnings by Sex in Kerhonkson
| Sex | Number | Average Earnings |
| Male | 544 (48.5%) | $41,569 |
| Female | 578 (51.5%) | $0 |
| Total | 1,122 (100.0%) | $38,705 |
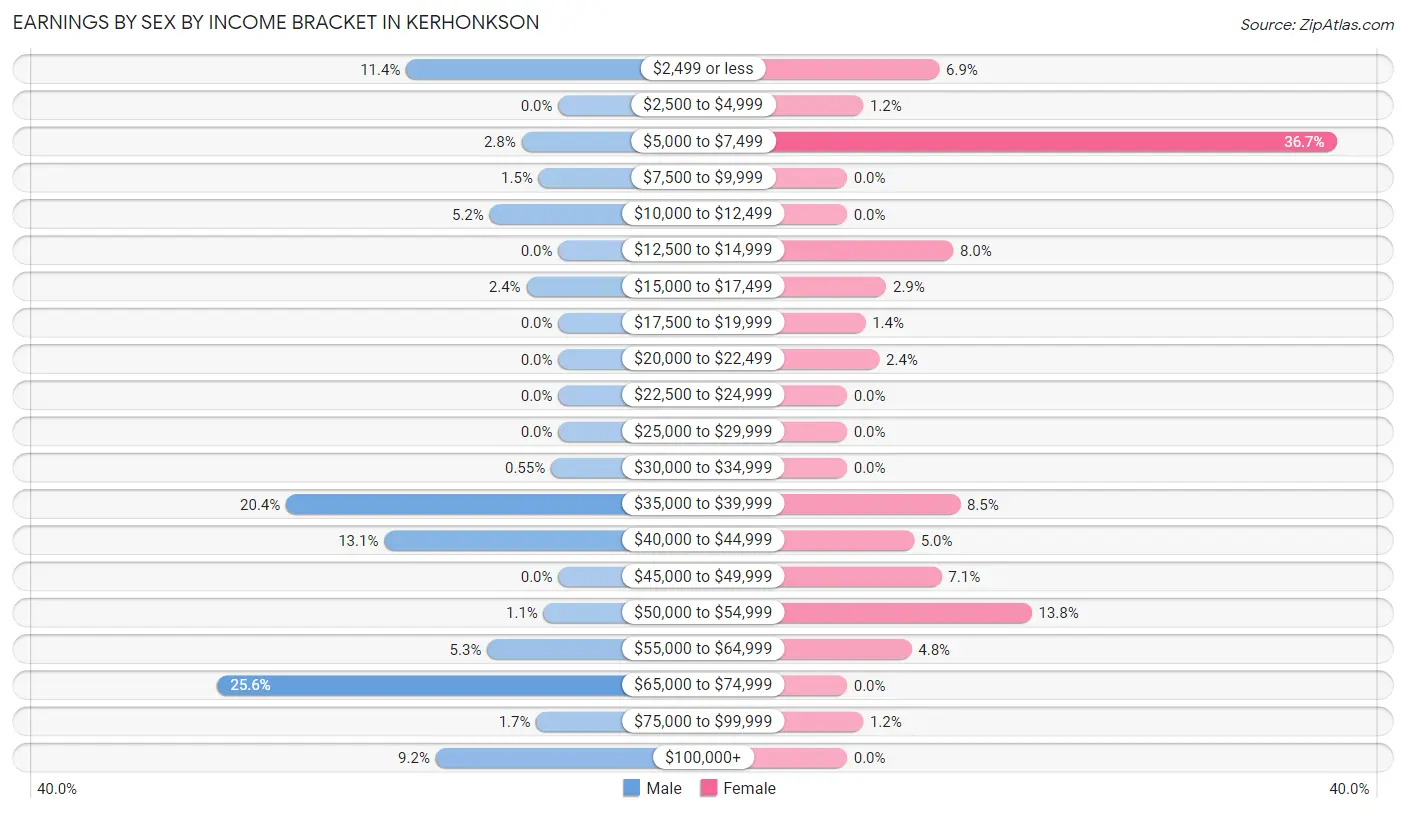
Earnings by Sex by Income Bracket in Kerhonkson
The most common earnings brackets in Kerhonkson are $65,000 to $74,999 for men (139 | 25.6%) and $5,000 to $7,499 for women (212 | 36.7%).
| Income | Male | Female |
| $2,499 or less | 62 (11.4%) | 40 (6.9%) |
| $2,500 to $4,999 | 0 (0.0%) | 7 (1.2%) |
| $5,000 to $7,499 | 15 (2.8%) | 212 (36.7%) |
| $7,500 to $9,999 | 8 (1.5%) | 0 (0.0%) |
| $10,000 to $12,499 | 28 (5.1%) | 0 (0.0%) |
| $12,500 to $14,999 | 0 (0.0%) | 46 (8.0%) |
| $15,000 to $17,499 | 13 (2.4%) | 17 (2.9%) |
| $17,500 to $19,999 | 0 (0.0%) | 8 (1.4%) |
| $20,000 to $22,499 | 0 (0.0%) | 14 (2.4%) |
| $22,500 to $24,999 | 0 (0.0%) | 0 (0.0%) |
| $25,000 to $29,999 | 0 (0.0%) | 0 (0.0%) |
| $30,000 to $34,999 | 3 (0.5%) | 0 (0.0%) |
| $35,000 to $39,999 | 111 (20.4%) | 49 (8.5%) |
| $40,000 to $44,999 | 71 (13.1%) | 29 (5.0%) |
| $45,000 to $49,999 | 0 (0.0%) | 41 (7.1%) |
| $50,000 to $54,999 | 6 (1.1%) | 80 (13.8%) |
| $55,000 to $64,999 | 29 (5.3%) | 28 (4.8%) |
| $65,000 to $74,999 | 139 (25.6%) | 0 (0.0%) |
| $75,000 to $99,999 | 9 (1.7%) | 7 (1.2%) |
| $100,000+ | 50 (9.2%) | 0 (0.0%) |
| Total | 544 (100.0%) | 578 (100.0%) |
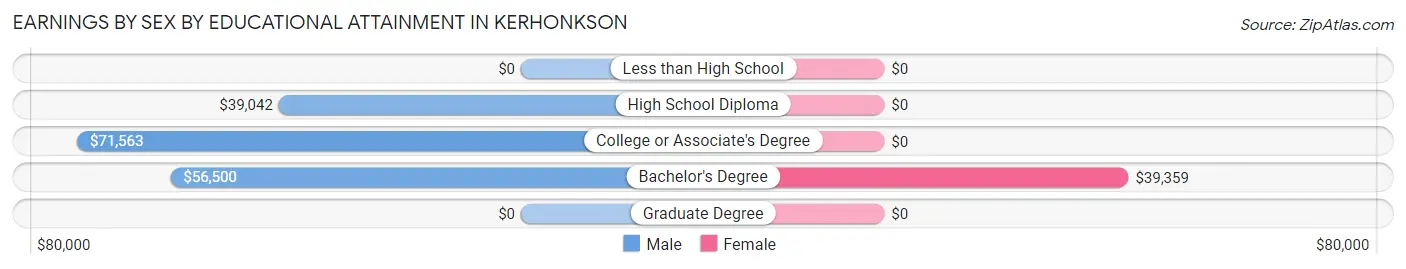
Earnings by Sex by Educational Attainment in Kerhonkson
Average earnings in Kerhonkson are $41,936 for men and $39,158 for women, a difference of 6.6%. Men with an educational attainment of college or associate's degree enjoy the highest average annual earnings of $71,563, while those with high school diploma education earn the least with $39,042. Women with an educational attainment of bachelor's degree earn the most with the average annual earnings of $39,359, while those with bachelor's degree education have the smallest earnings of $39,359.
| Educational Attainment | Male Income | Female Income |
| Less than High School | - | - |
| High School Diploma | $39,042 | $0 |
| College or Associate's Degree | $71,563 | $0 |
| Bachelor's Degree | $56,500 | $39,359 |
| Graduate Degree | - | - |
| Total | $41,936 | $39,158 |
Family Income in Kerhonkson
Family Income Brackets in Kerhonkson
According to the Kerhonkson family income data, there are 187 families falling into the $50,000 to $74,999 income range, which is the most common income bracket and makes up 36.0% of all families.
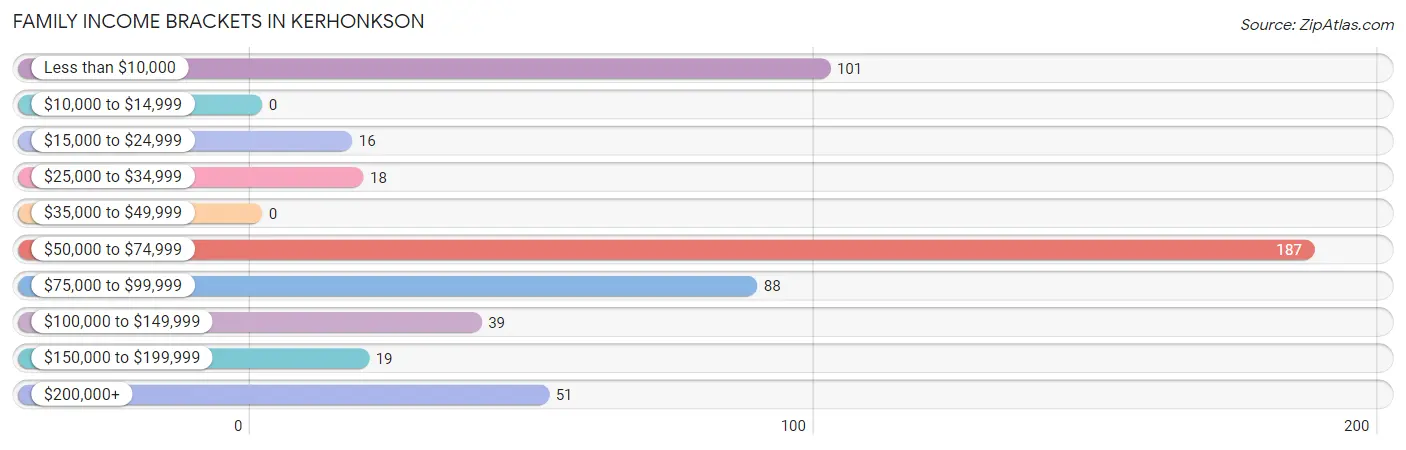
| Income Bracket | # Families | % Families |
| Less than $10,000 | 101 | 19.5% |
| $10,000 to $14,999 | 0 | 0.0% |
| $15,000 to $24,999 | 16 | 3.1% |
| $25,000 to $34,999 | 18 | 3.5% |
| $35,000 to $49,999 | 0 | 0.0% |
| $50,000 to $74,999 | 187 | 36.0% |
| $75,000 to $99,999 | 88 | 17.0% |
| $100,000 to $149,999 | 39 | 7.5% |
| $150,000 to $199,999 | 19 | 3.7% |
| $200,000+ | 51 | 9.8% |
Family Income by Famaliy Size in Kerhonkson
3-person families (107 | 20.6%) account for the highest median family income in Kerhonkson with $81,159 per family, while 3-person families (107 | 20.6%) have the highest median income of $27,053 per family member.
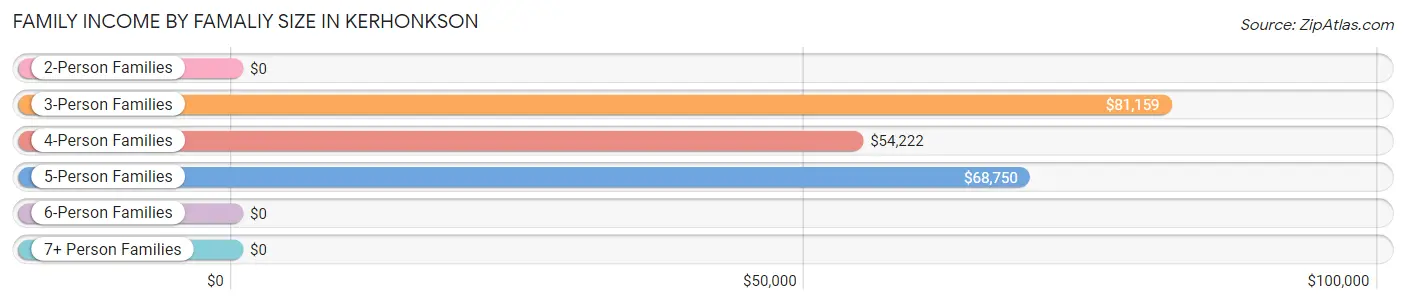
| Income Bracket | # Families | Median Income |
| 2-Person Families | 238 (45.9%) | $0 |
| 3-Person Families | 107 (20.6%) | $81,159 |
| 4-Person Families | 62 (11.9%) | $54,222 |
| 5-Person Families | 41 (7.9%) | $68,750 |
| 6-Person Families | 20 (3.8%) | $0 |
| 7+ Person Families | 51 (9.8%) | $0 |
| Total | 519 (100.0%) | $66,588 |
Family Income by Number of Earners in Kerhonkson
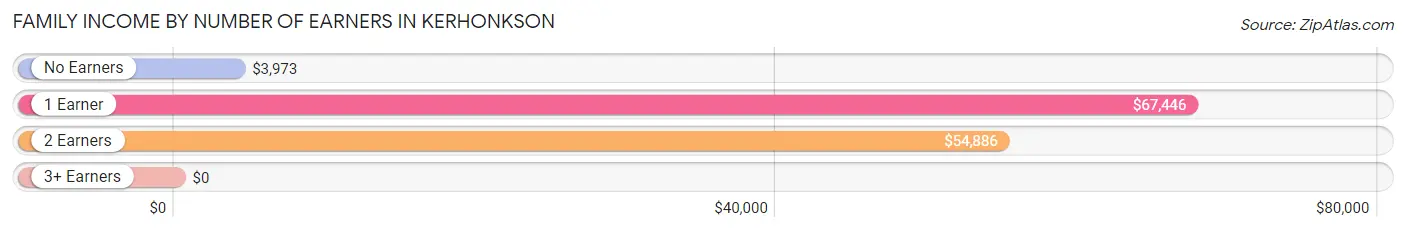
| Number of Earners | # Families | Median Income |
| No Earners | 119 (22.9%) | $3,973 |
| 1 Earner | 208 (40.1%) | $67,446 |
| 2 Earners | 141 (27.2%) | $54,886 |
| 3+ Earners | 51 (9.8%) | $0 |
| Total | 519 (100.0%) | $66,588 |
Household Income in Kerhonkson
Household Income Brackets in Kerhonkson
With 266 households falling in the category, the $50,000 to $74,999 income range is the most frequent in Kerhonkson, accounting for 35.3% of all households.
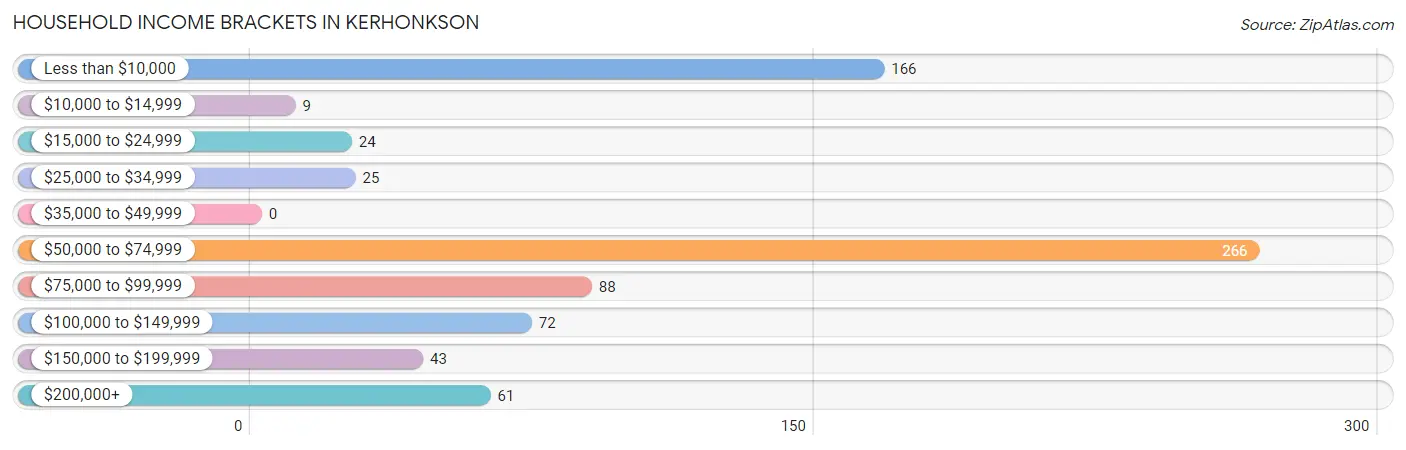
| Income Bracket | # Households | % Households |
| Less than $10,000 | 166 | 22.0% |
| $10,000 to $14,999 | 9 | 1.2% |
| $15,000 to $24,999 | 24 | 3.2% |
| $25,000 to $34,999 | 25 | 3.3% |
| $35,000 to $49,999 | 0 | 0.0% |
| $50,000 to $74,999 | 266 | 35.3% |
| $75,000 to $99,999 | 88 | 11.7% |
| $100,000 to $149,999 | 72 | 9.5% |
| $150,000 to $199,999 | 43 | 5.7% |
| $200,000+ | 61 | 8.1% |
Household Income by Householder Age in Kerhonkson
The median household income in Kerhonkson is $68,500, with the highest median household income of $80,227 found in the 45 to 64 years age bracket for the primary householder. A total of 304 households (40.3%) fall into this category. Meanwhile, the 15 to 24 years age bracket for the primary householder has the lowest median household income of $0, with 111 households (14.7%) in this group.
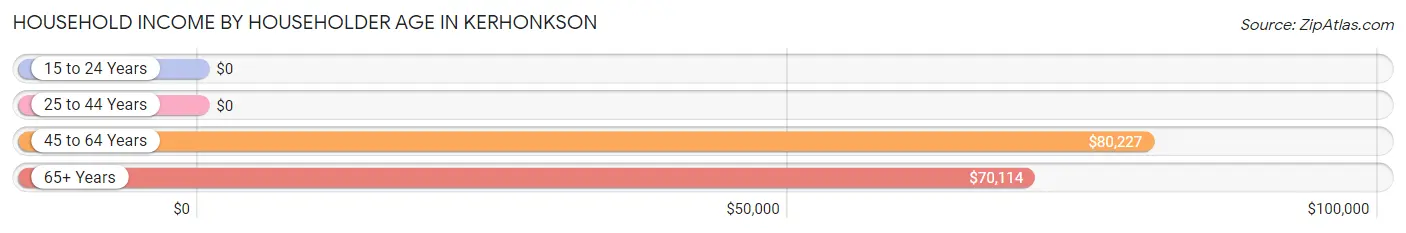
| Income Bracket | # Households | Median Income |
| 15 to 24 Years | 111 (14.7%) | $0 |
| 25 to 44 Years | 220 (29.2%) | $0 |
| 45 to 64 Years | 304 (40.3%) | $80,227 |
| 65+ Years | 119 (15.8%) | $70,114 |
| Total | 754 (100.0%) | $68,500 |
Poverty in Kerhonkson
Income Below Poverty by Sex and Age in Kerhonkson
With 8.1% poverty level for males and 26.9% for females among the residents of Kerhonkson, 75 year old and over males and 25 to 34 year old females are the most vulnerable to poverty, with 9 males (45.0%) and 101 females (58.1%) in their respective age groups living below the poverty level.
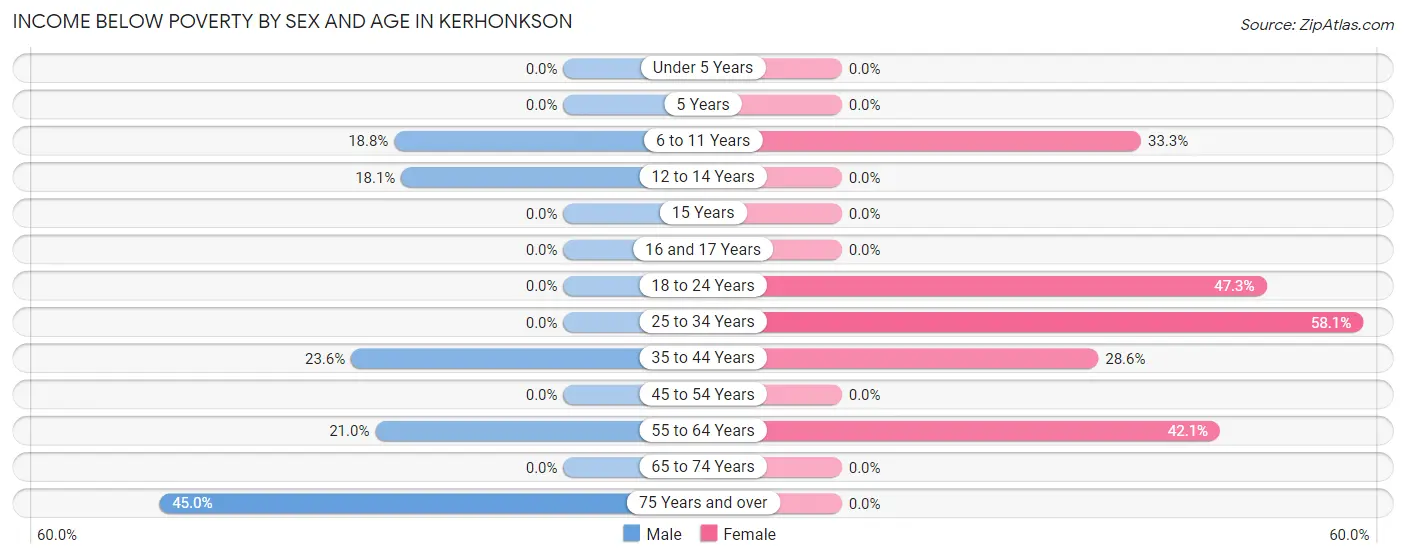
| Age Bracket | Male | Female |
| Under 5 Years | 0 (0.0%) | 0 (0.0%) |
| 5 Years | 0 (0.0%) | 0 (0.0%) |
| 6 to 11 Years | 13 (18.8%) | 14 (33.3%) |
| 12 to 14 Years | 13 (18.1%) | 0 (0.0%) |
| 15 Years | 0 (0.0%) | 0 (0.0%) |
| 16 and 17 Years | 0 (0.0%) | 0 (0.0%) |
| 18 to 24 Years | 0 (0.0%) | 78 (47.3%) |
| 25 to 34 Years | 0 (0.0%) | 101 (58.1%) |
| 35 to 44 Years | 13 (23.6%) | 20 (28.6%) |
| 45 to 54 Years | 0 (0.0%) | 0 (0.0%) |
| 55 to 64 Years | 31 (20.9%) | 72 (42.1%) |
| 65 to 74 Years | 0 (0.0%) | 0 (0.0%) |
| 75 Years and over | 9 (45.0%) | 0 (0.0%) |
| Total | 79 (8.1%) | 285 (26.9%) |
Income Above Poverty by Sex and Age in Kerhonkson
According to the poverty statistics in Kerhonkson, males aged under 5 years and females aged under 5 years are the age groups that are most secure financially, with 100.0% of males and 100.0% of females in these age groups living above the poverty line.
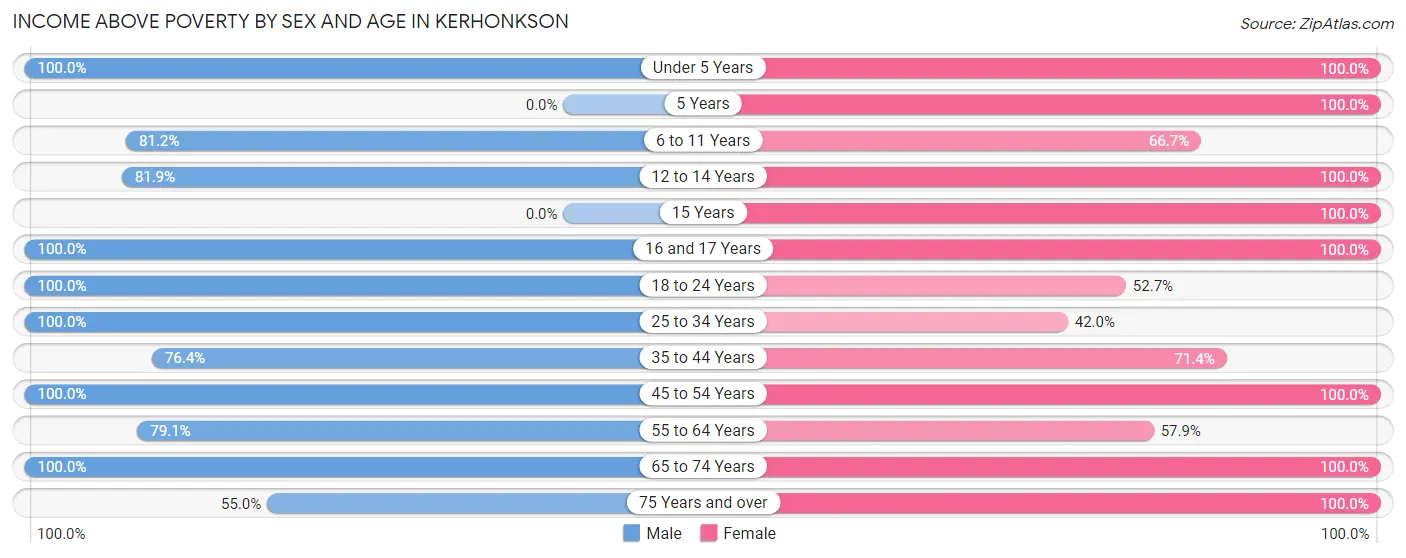
| Age Bracket | Male | Female |
| Under 5 Years | 118 (100.0%) | 75 (100.0%) |
| 5 Years | 0 (0.0%) | 17 (100.0%) |
| 6 to 11 Years | 56 (81.2%) | 28 (66.7%) |
| 12 to 14 Years | 59 (81.9%) | 3 (100.0%) |
| 15 Years | 0 (0.0%) | 44 (100.0%) |
| 16 and 17 Years | 60 (100.0%) | 55 (100.0%) |
| 18 to 24 Years | 214 (100.0%) | 87 (52.7%) |
| 25 to 34 Years | 145 (100.0%) | 73 (41.9%) |
| 35 to 44 Years | 42 (76.4%) | 50 (71.4%) |
| 45 to 54 Years | 24 (100.0%) | 131 (100.0%) |
| 55 to 64 Years | 117 (79.0%) | 99 (57.9%) |
| 65 to 74 Years | 54 (100.0%) | 88 (100.0%) |
| 75 Years and over | 11 (55.0%) | 24 (100.0%) |
| Total | 900 (91.9%) | 774 (73.1%) |
Income Below Poverty Among Married-Couple Families in Kerhonkson
The poverty statistics for married-couple families in Kerhonkson show that 5.4% or 13 of the total 241 families live below the poverty line. Families with 3 or 4 children have the highest poverty rate of 21.3%, comprising of 13 families. On the other hand, families with no children have the lowest poverty rate of 0.0%, which includes 0 families.
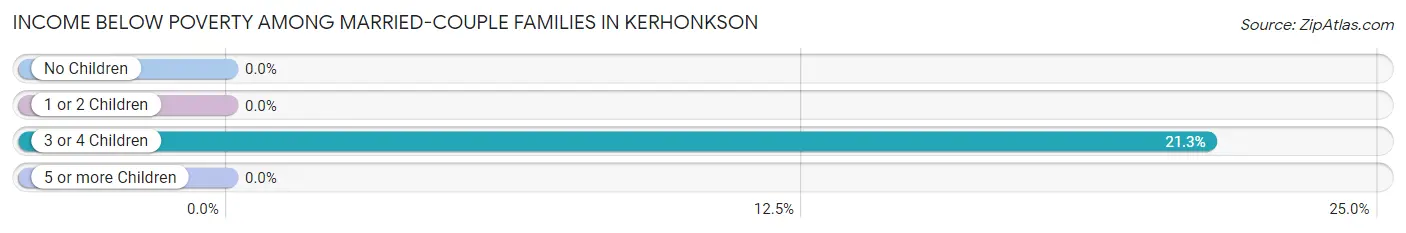
| Children | Above Poverty | Below Poverty |
| No Children | 70 (100.0%) | 0 (0.0%) |
| 1 or 2 Children | 110 (100.0%) | 0 (0.0%) |
| 3 or 4 Children | 48 (78.7%) | 13 (21.3%) |
| 5 or more Children | 0 (0.0%) | 0 (0.0%) |
| Total | 228 (94.6%) | 13 (5.4%) |
Income Below Poverty Among Single-Parent Households in Kerhonkson
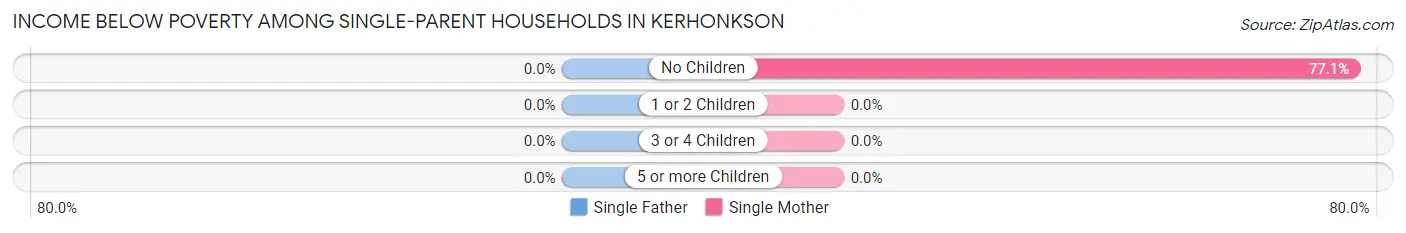
| Children | Single Father | Single Mother |
| No Children | 0 (0.0%) | 101 (77.1%) |
| 1 or 2 Children | 0 (0.0%) | 0 (0.0%) |
| 3 or 4 Children | 0 (0.0%) | 0 (0.0%) |
| 5 or more Children | 0 (0.0%) | 0 (0.0%) |
| Total | 0 (0.0%) | 101 (57.4%) |
Income Below Poverty Among Married-Couple vs Single-Parent Households in Kerhonkson
The poverty data for Kerhonkson shows that 13 of the married-couple family households (5.4%) and 101 of the single-parent households (36.3%) are living below the poverty level. Within the married-couple family households, those with 3 or 4 children have the highest poverty rate, with 13 households (21.3%) falling below the poverty line. Among the single-parent households, those with no children have the highest poverty rate, with 101 household (72.1%) living below poverty.
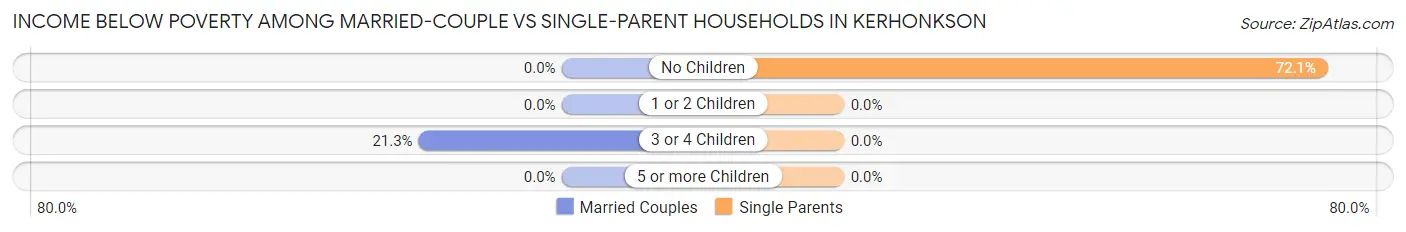
| Children | Married-Couple Families | Single-Parent Households |
| No Children | 0 (0.0%) | 101 (72.1%) |
| 1 or 2 Children | 0 (0.0%) | 0 (0.0%) |
| 3 or 4 Children | 13 (21.3%) | 0 (0.0%) |
| 5 or more Children | 0 (0.0%) | 0 (0.0%) |
| Total | 13 (5.4%) | 101 (36.3%) |
Race in Kerhonkson
The most populous races in Kerhonkson are White / Caucasian (1,431 | 70.2%), Two or more Races (579 | 28.4%), and Hispanic or Latino (305 | 15.0%).
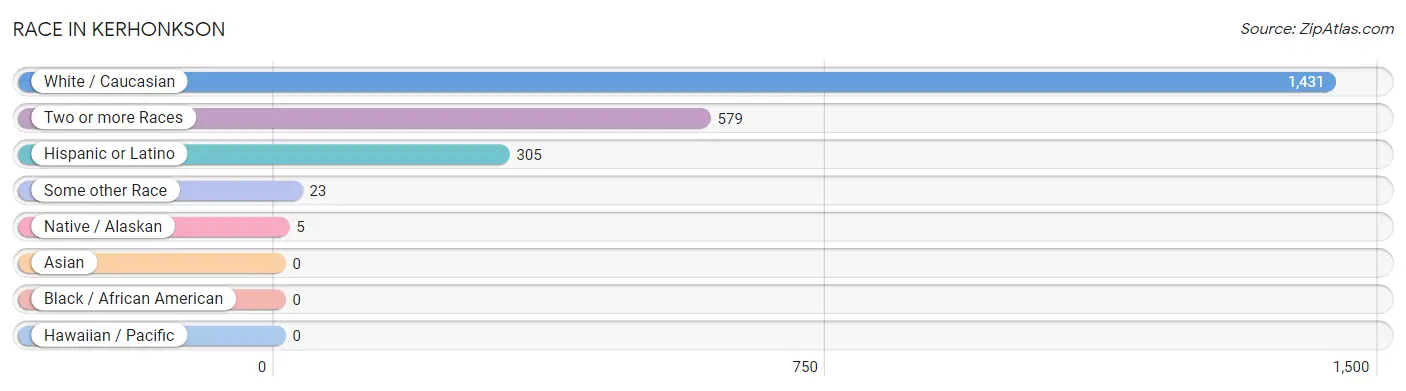
| Race | # Population | % Population |
| Asian | 0 | 0.0% |
| Black / African American | 0 | 0.0% |
| Hawaiian / Pacific | 0 | 0.0% |
| Hispanic or Latino | 305 | 15.0% |
| Native / Alaskan | 5 | 0.3% |
| White / Caucasian | 1,431 | 70.2% |
| Two or more Races | 579 | 28.4% |
| Some other Race | 23 | 1.1% |
| Total | 2,038 | 100.0% |
Ancestry in Kerhonkson
The most populous ancestries reported in Kerhonkson are Irish (509 | 25.0%), Armenian (323 | 15.9%), Central American (166 | 8.2%), Salvadoran (166 | 8.2%), and Dutch (160 | 7.9%), together accounting for 65.0% of all Kerhonkson residents.
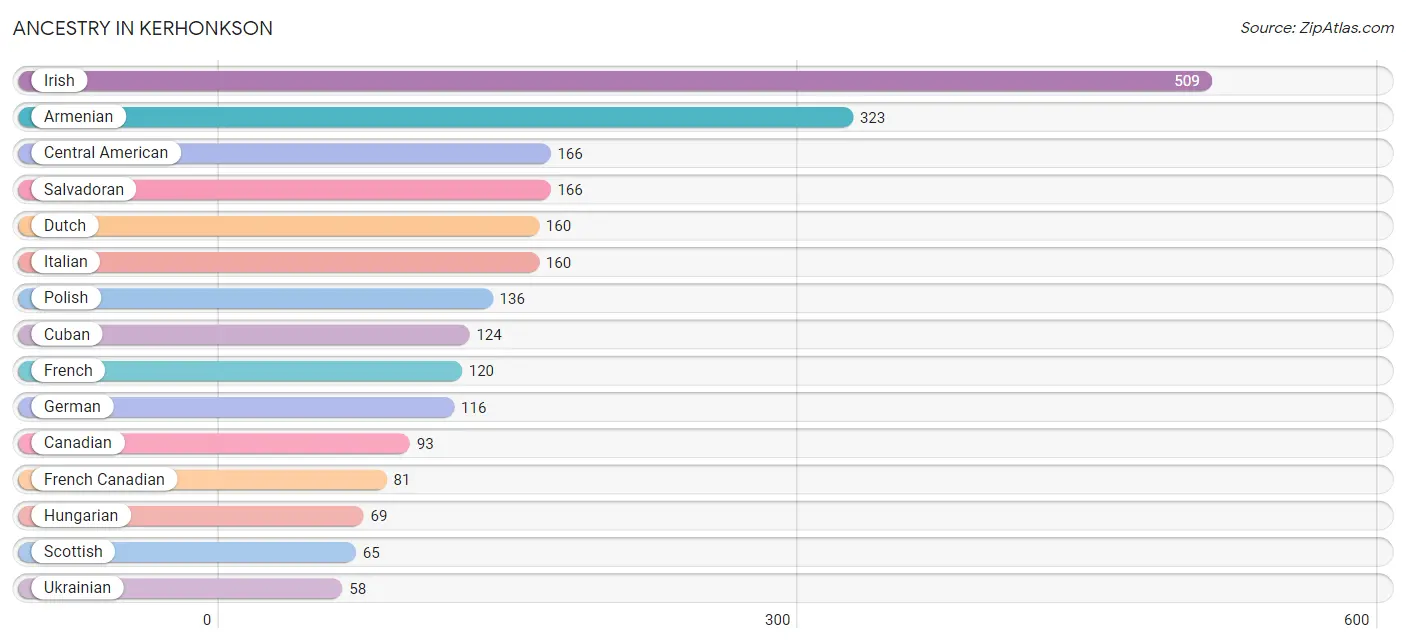
| Ancestry | # Population | % Population |
| American | 8 | 0.4% |
| Armenian | 323 | 15.9% |
| Austrian | 18 | 0.9% |
| Canadian | 93 | 4.6% |
| Central American | 166 | 8.2% |
| Cuban | 124 | 6.1% |
| Czech | 4 | 0.2% |
| Czechoslovakian | 3 | 0.2% |
| Dutch | 160 | 7.9% |
| Eastern European | 7 | 0.3% |
| English | 56 | 2.8% |
| European | 6 | 0.3% |
| French | 120 | 5.9% |
| French Canadian | 81 | 4.0% |
| German | 116 | 5.7% |
| Hungarian | 69 | 3.4% |
| Irish | 509 | 25.0% |
| Italian | 160 | 7.9% |
| Norwegian | 21 | 1.0% |
| Polish | 136 | 6.7% |
| Puerto Rican | 15 | 0.7% |
| Romanian | 55 | 2.7% |
| Russian | 17 | 0.8% |
| Salvadoran | 166 | 8.2% |
| Scotch-Irish | 23 | 1.1% |
| Scottish | 65 | 3.2% |
| Ukrainian | 58 | 2.9% |
| Welsh | 8 | 0.4% | View All 28 Rows |
Immigrants in Kerhonkson
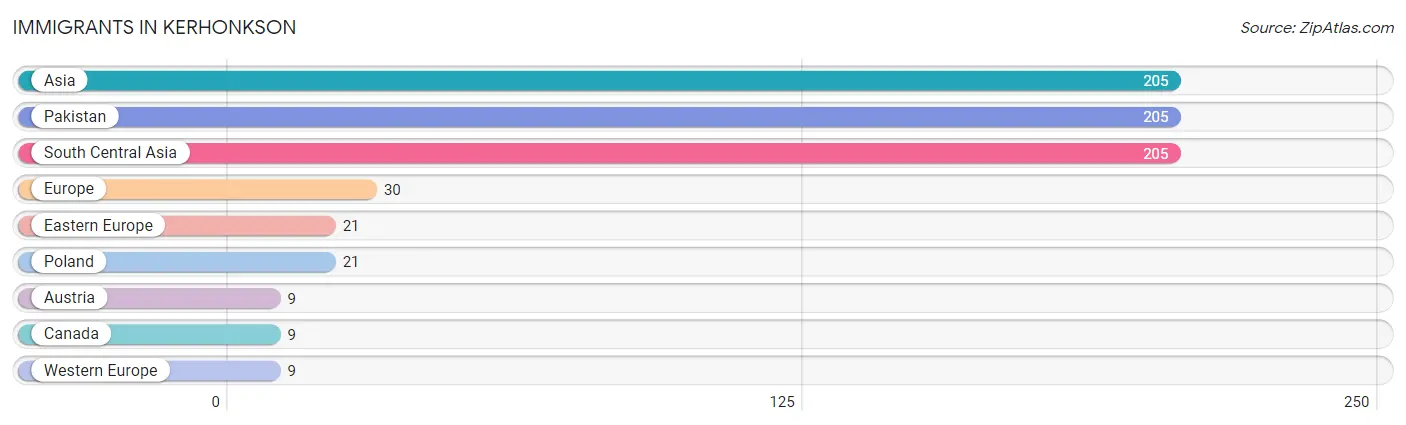
The most numerous immigrant groups reported in Kerhonkson came from Asia (205 | 10.1%), Pakistan (205 | 10.1%), South Central Asia (205 | 10.1%), Europe (30 | 1.5%), and Eastern Europe (21 | 1.0%), together accounting for 32.7% of all Kerhonkson residents.
| Immigration Origin | # Population | % Population |
| Asia | 205 | 10.1% |
| Austria | 9 | 0.4% |
| Canada | 9 | 0.4% |
| Eastern Europe | 21 | 1.0% |
| Europe | 30 | 1.5% |
| Pakistan | 205 | 10.1% |
| Poland | 21 | 1.0% |
| South Central Asia | 205 | 10.1% |
| Western Europe | 9 | 0.4% | View All 9 Rows |
Sex and Age in Kerhonkson
Sex and Age in Kerhonkson
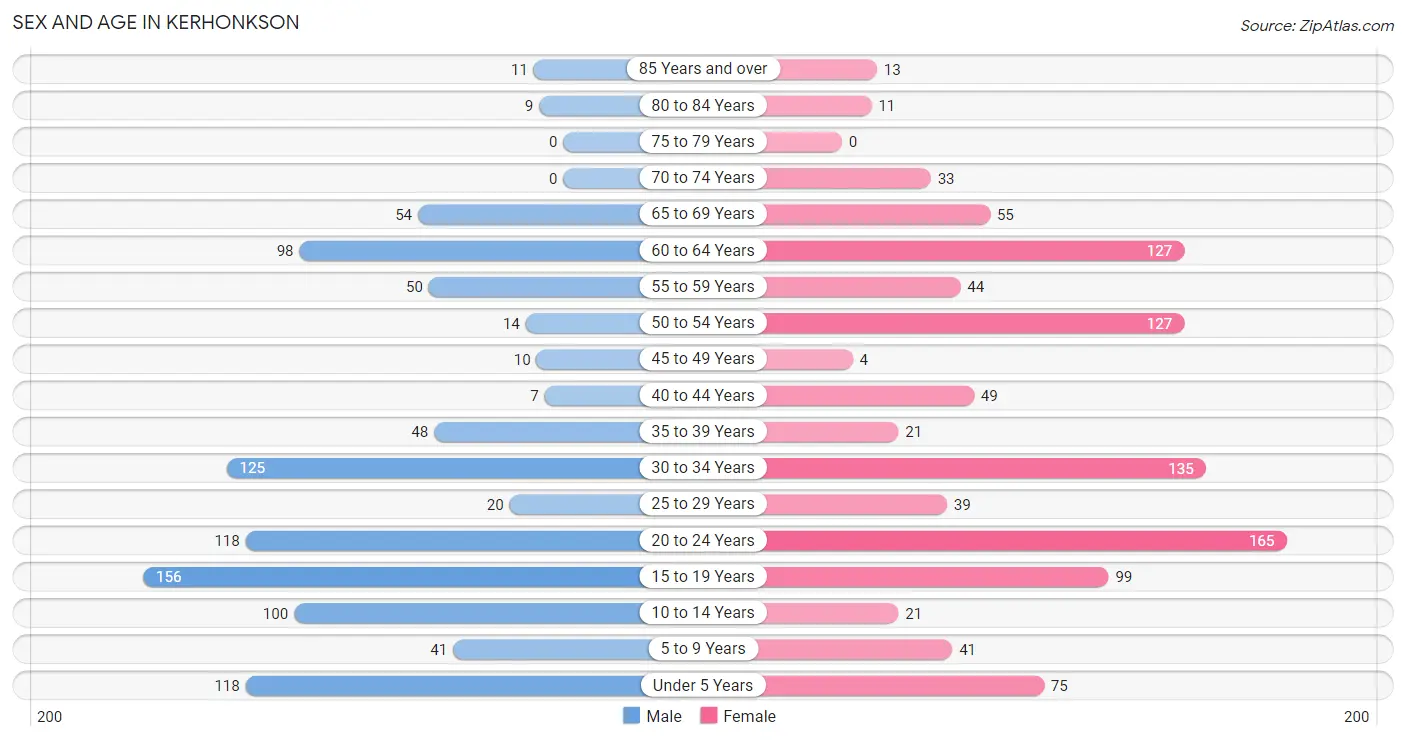
The most populous age groups in Kerhonkson are 15 to 19 Years (156 | 15.9%) for men and 20 to 24 Years (165 | 15.6%) for women.
| Age Bracket | Male | Female |
| Under 5 Years | 118 (12.0%) | 75 (7.1%) |
| 5 to 9 Years | 41 (4.2%) | 41 (3.9%) |
| 10 to 14 Years | 100 (10.2%) | 21 (2.0%) |
| 15 to 19 Years | 156 (15.9%) | 99 (9.3%) |
| 20 to 24 Years | 118 (12.0%) | 165 (15.6%) |
| 25 to 29 Years | 20 (2.0%) | 39 (3.7%) |
| 30 to 34 Years | 125 (12.8%) | 135 (12.8%) |
| 35 to 39 Years | 48 (4.9%) | 21 (2.0%) |
| 40 to 44 Years | 7 (0.7%) | 49 (4.6%) |
| 45 to 49 Years | 10 (1.0%) | 4 (0.4%) |
| 50 to 54 Years | 14 (1.4%) | 127 (12.0%) |
| 55 to 59 Years | 50 (5.1%) | 44 (4.2%) |
| 60 to 64 Years | 98 (10.0%) | 127 (12.0%) |
| 65 to 69 Years | 54 (5.5%) | 55 (5.2%) |
| 70 to 74 Years | 0 (0.0%) | 33 (3.1%) |
| 75 to 79 Years | 0 (0.0%) | 0 (0.0%) |
| 80 to 84 Years | 9 (0.9%) | 11 (1.0%) |
| 85 Years and over | 11 (1.1%) | 13 (1.2%) |
| Total | 979 (100.0%) | 1,059 (100.0%) |
Families and Households in Kerhonkson
Median Family Size in Kerhonkson
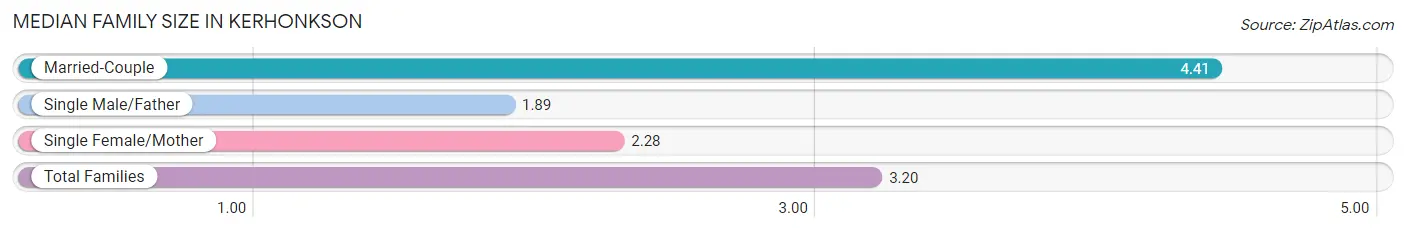
The median family size in Kerhonkson is 3.20 persons per family, with married-couple families (241 | 46.4%) accounting for the largest median family size of 4.41 persons per family. On the other hand, single male/father families (102 | 19.7%) represent the smallest median family size with 1.89 persons per family.
| Family Type | # Families | Family Size |
| Married-Couple | 241 (46.4%) | 4.41 |
| Single Male/Father | 102 (19.7%) | 1.89 |
| Single Female/Mother | 176 (33.9%) | 2.28 |
| Total Families | 519 (100.0%) | 3.20 |
Median Household Size in Kerhonkson
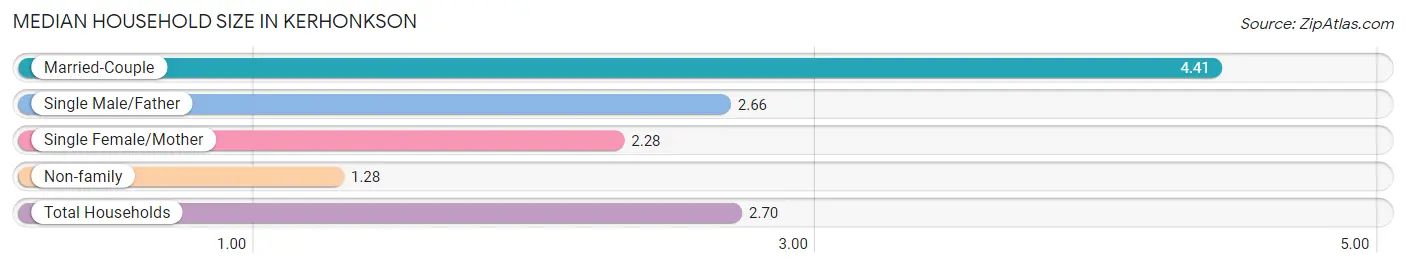
The median household size in Kerhonkson is 2.70 persons per household, with married-couple households (241 | 32.0%) accounting for the largest median household size of 4.41 persons per household. non-family households (235 | 31.2%) represent the smallest median household size with 1.28 persons per household.
| Household Type | # Households | Household Size |
| Married-Couple | 241 (32.0%) | 4.41 |
| Single Male/Father | 102 (13.5%) | 2.66 |
| Single Female/Mother | 176 (23.3%) | 2.28 |
| Non-family | 235 (31.2%) | 1.28 |
| Total Households | 754 (100.0%) | 2.70 |
Household Size by Marriage Status in Kerhonkson
Out of a total of 754 households in Kerhonkson, 519 (68.8%) are family households, while 235 (31.2%) are nonfamily households. The most numerous type of family households are 3-person households, comprising 200, and the most common type of nonfamily households are 1-person households, comprising 182.
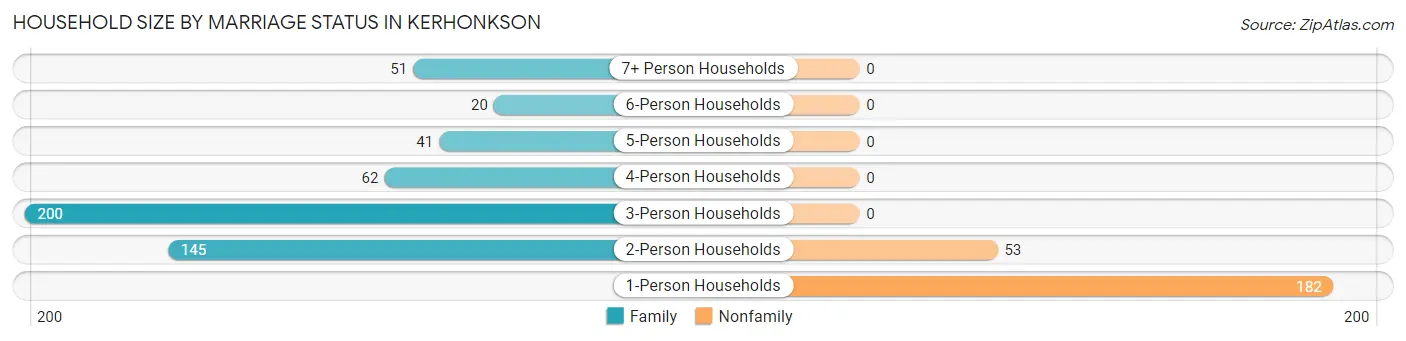
| Household Size | Family Households | Nonfamily Households |
| 1-Person Households | - | 182 (24.1%) |
| 2-Person Households | 145 (19.2%) | 53 (7.0%) |
| 3-Person Households | 200 (26.5%) | 0 (0.0%) |
| 4-Person Households | 62 (8.2%) | 0 (0.0%) |
| 5-Person Households | 41 (5.4%) | 0 (0.0%) |
| 6-Person Households | 20 (2.6%) | 0 (0.0%) |
| 7+ Person Households | 51 (6.8%) | 0 (0.0%) |
| Total | 519 (68.8%) | 235 (31.2%) |
Female Fertility in Kerhonkson
Fertility by Age in Kerhonkson
Average fertility rate in Kerhonkson is 64.0 births per 1,000 women. Women in the age bracket of 35 to 50 years have the highest fertility rate with 95.0 births per 1,000 women. Women in the age bracket of 20 to 34 years acount for 78.8% of all women with births.
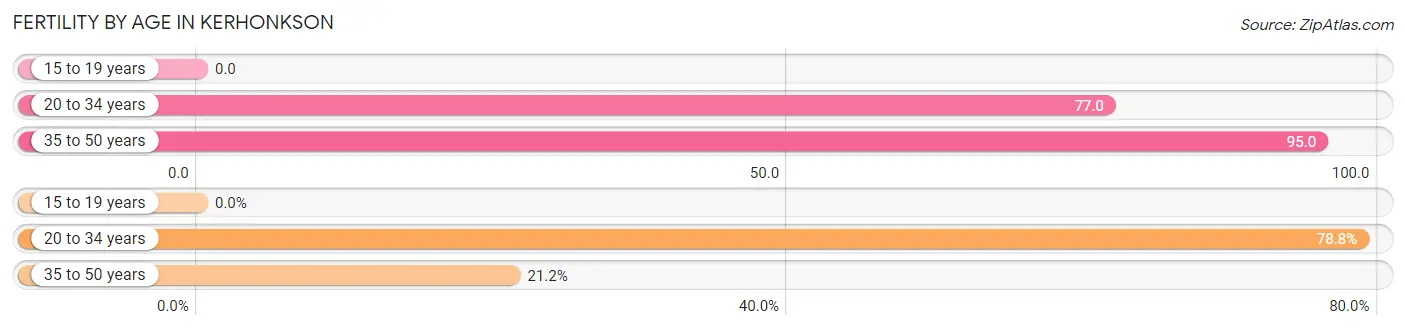
| Age Bracket | Women with Births | Births / 1,000 Women |
| 15 to 19 years | 0 (0.0%) | 0.0 |
| 20 to 34 years | 26 (78.8%) | 77.0 |
| 35 to 50 years | 7 (21.2%) | 95.0 |
| Total | 33 (100.0%) | 64.0 |
Fertility by Age by Marriage Status in Kerhonkson
78.8% of women with births (33) in Kerhonkson are married. The highest percentage of unmarried women with births falls into 35 to 50 years age bracket with 100.0% of them unmarried at the time of birth, while the lowest percentage of unmarried women with births belong to 20 to 34 years age bracket with 0.0% of them unmarried.
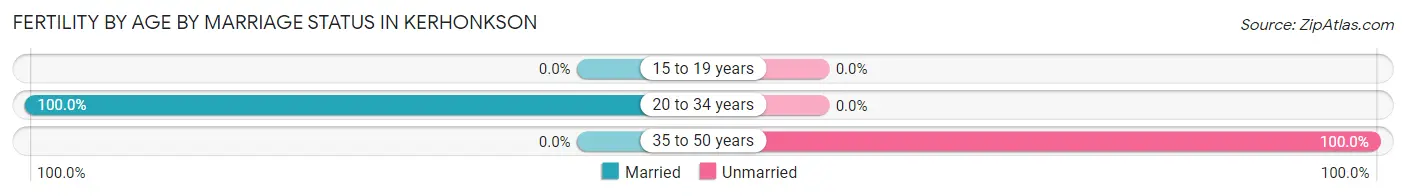
| Age Bracket | Married | Unmarried |
| 15 to 19 years | 0 (0.0%) | 0 (0.0%) |
| 20 to 34 years | 26 (100.0%) | 0 (0.0%) |
| 35 to 50 years | 0 (0.0%) | 7 (100.0%) |
| Total | 26 (78.8%) | 7 (21.2%) |
Fertility by Education in Kerhonkson
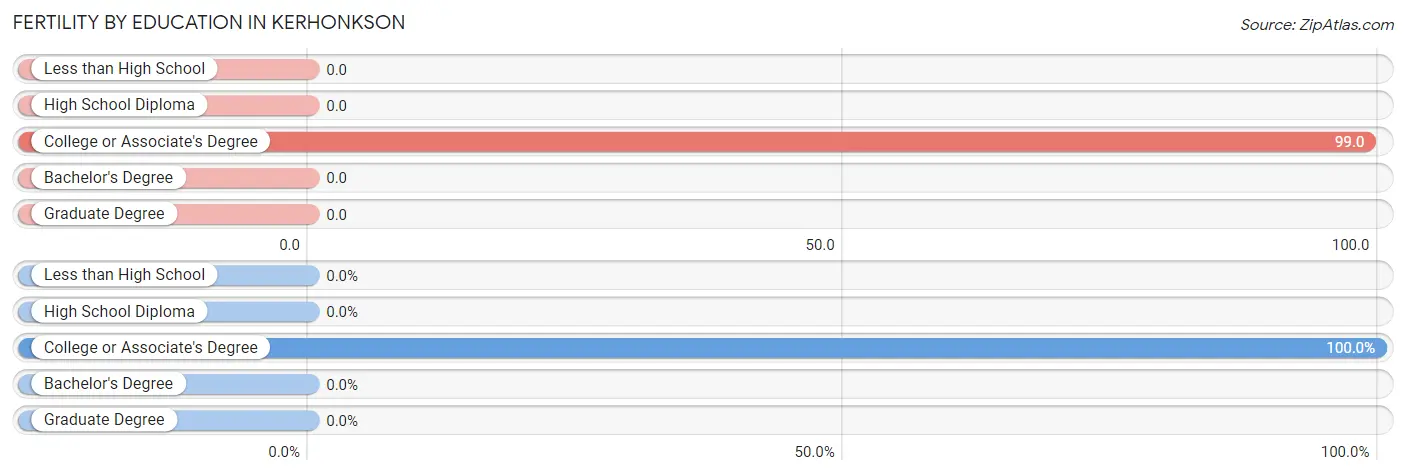
| Educational Attainment | Women with Births | Births / 1,000 Women |
| Less than High School | 0 (0.0%) | 0.0 |
| High School Diploma | 0 (0.0%) | 0.0 |
| College or Associate's Degree | 33 (100.0%) | 99.0 |
| Bachelor's Degree | 0 (0.0%) | 0.0 |
| Graduate Degree | 0 (0.0%) | 0.0 |
| Total | 33 (100.0%) | 64.0 |
Fertility by Education by Marriage Status in Kerhonkson
21.2% of women with births in Kerhonkson are unmarried. Women with the educational attainment of college or associate's degree are most likely to be married with 78.8% of them married at childbirth, while women with the educational attainment of college or associate's degree are least likely to be married with 21.2% of them unmarried at childbirth.
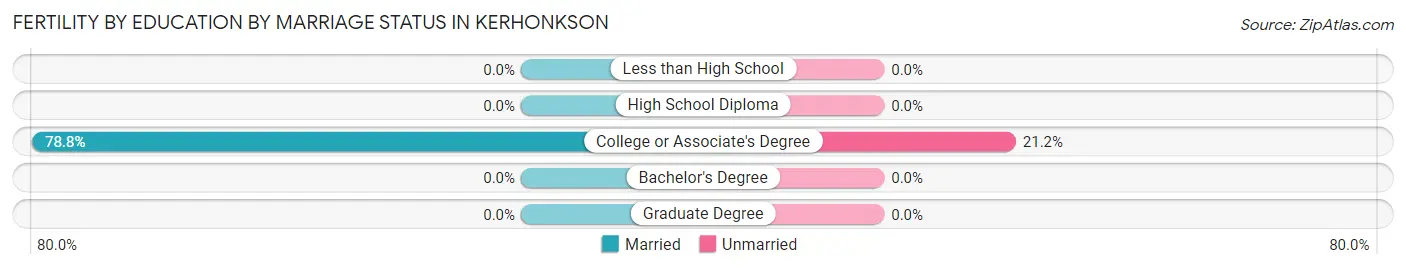
| Educational Attainment | Married | Unmarried |
| Less than High School | 0 (0.0%) | 0 (0.0%) |
| High School Diploma | 0 (0.0%) | 0 (0.0%) |
| College or Associate's Degree | 26 (78.8%) | 7 (21.2%) |
| Bachelor's Degree | 0 (0.0%) | 0 (0.0%) |
| Graduate Degree | 0 (0.0%) | 0 (0.0%) |
| Total | 26 (78.8%) | 7 (21.2%) |
Employment Characteristics in Kerhonkson
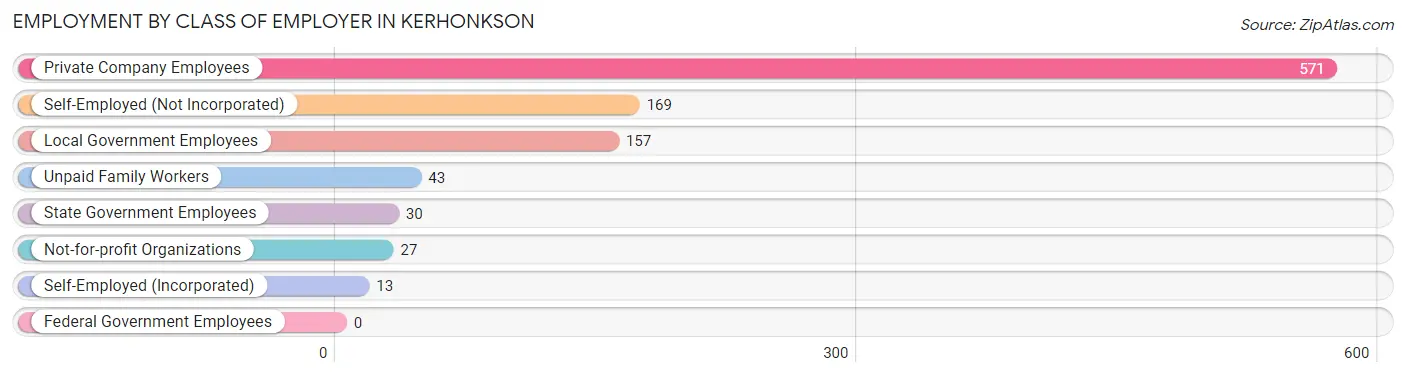
Employment by Class of Employer in Kerhonkson
Among the 1,010 employed individuals in Kerhonkson, private company employees (571 | 56.5%), self-employed (not incorporated) (169 | 16.7%), and local government employees (157 | 15.5%) make up the most common classes of employment.
| Employer Class | # Employees | % Employees |
| Private Company Employees | 571 | 56.5% |
| Self-Employed (Incorporated) | 13 | 1.3% |
| Self-Employed (Not Incorporated) | 169 | 16.7% |
| Not-for-profit Organizations | 27 | 2.7% |
| Local Government Employees | 157 | 15.5% |
| State Government Employees | 30 | 3.0% |
| Federal Government Employees | 0 | 0.0% |
| Unpaid Family Workers | 43 | 4.3% |
| Total | 1,010 | 100.0% |
Employment Status by Age in Kerhonkson
According to the labor force statistics for Kerhonkson, out of the total population over 16 years of age (1,598), 68.9% or 1,101 individuals are in the labor force, with 8.3% or 91 of them unemployed. The age group with the highest labor force participation rate is 25 to 29 years, with 100.0% or 59 individuals in the labor force. Within the labor force, the 20 to 24 years age range has the highest percentage of unemployed individuals, with 30.4% or 78 of them being unemployed.
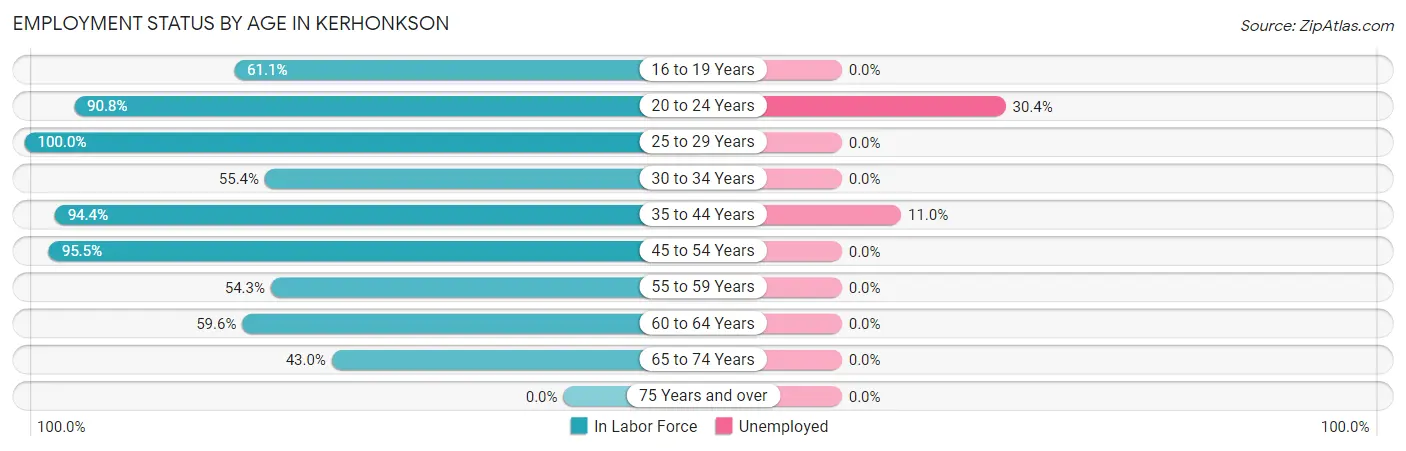
| Age Bracket | In Labor Force | Unemployed |
| 16 to 19 Years | 129 (61.1%) | 0 (0.0%) |
| 20 to 24 Years | 257 (90.8%) | 78 (30.4%) |
| 25 to 29 Years | 59 (100.0%) | 0 (0.0%) |
| 30 to 34 Years | 144 (55.4%) | 0 (0.0%) |
| 35 to 44 Years | 118 (94.4%) | 13 (11.0%) |
| 45 to 54 Years | 148 (95.5%) | 0 (0.0%) |
| 55 to 59 Years | 51 (54.3%) | 0 (0.0%) |
| 60 to 64 Years | 134 (59.6%) | 0 (0.0%) |
| 65 to 74 Years | 61 (43.0%) | 0 (0.0%) |
| 75 Years and over | 0 (0.0%) | 0 (0.0%) |
| Total | 1,101 (68.9%) | 91 (8.3%) |
Employment Status by Educational Attainment in Kerhonkson
According to labor force statistics for Kerhonkson, 71.2% of individuals (654) out of the total population between 25 and 64 years of age (918) are in the labor force, with 2.0% or 13 of them being unemployed. The group with the highest labor force participation rate are those with the educational attainment of bachelor's degree or higher, with 100.0% or 250 individuals in the labor force. Within the labor force, individuals with college / associate degree education have the highest percentage of unemployment, with 5.7% or 13 of them being unemployed.
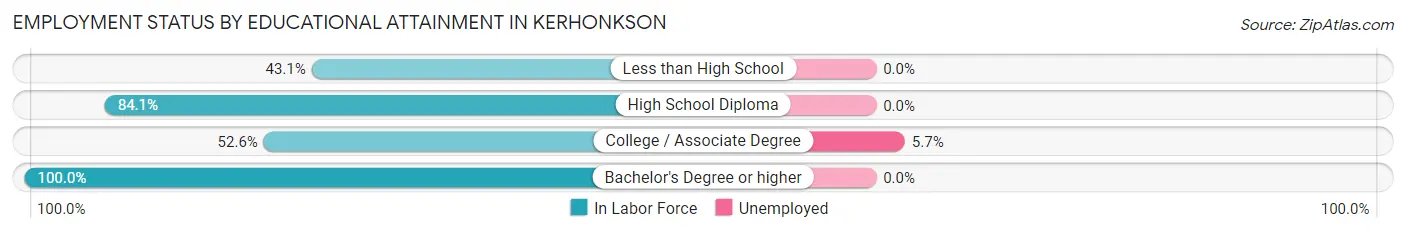
| Educational Attainment | In Labor Force | Unemployed |
| Less than High School | 22 (43.1%) | 0 (0.0%) |
| High School Diploma | 153 (84.1%) | 0 (0.0%) |
| College / Associate Degree | 229 (52.6%) | 25 (5.7%) |
| Bachelor's Degree or higher | 250 (100.0%) | 0 (0.0%) |
| Total | 654 (71.2%) | 18 (2.0%) |
Employment Occupations by Sex in Kerhonkson
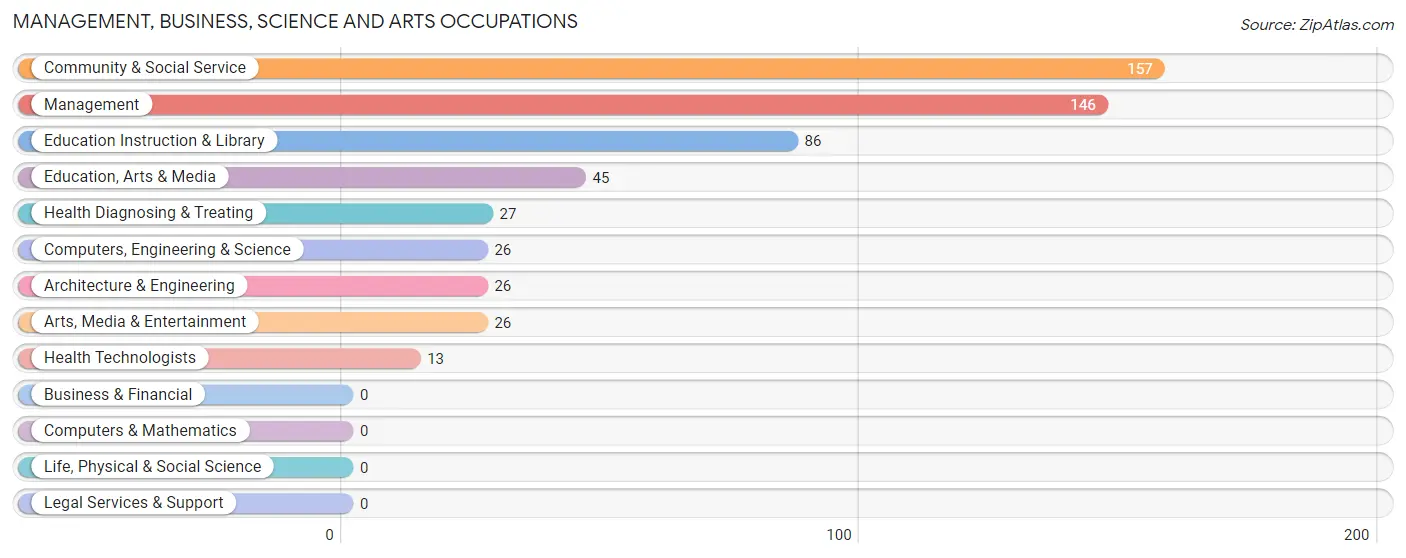
Management, Business, Science and Arts Occupations
The most common Management, Business, Science and Arts occupations in Kerhonkson are Community & Social Service (157 | 15.5%), Management (146 | 14.5%), Education Instruction & Library (86 | 8.5%), Education, Arts & Media (45 | 4.5%), and Health Diagnosing & Treating (27 | 2.7%).
Management, Business, Science and Arts Occupations by Sex
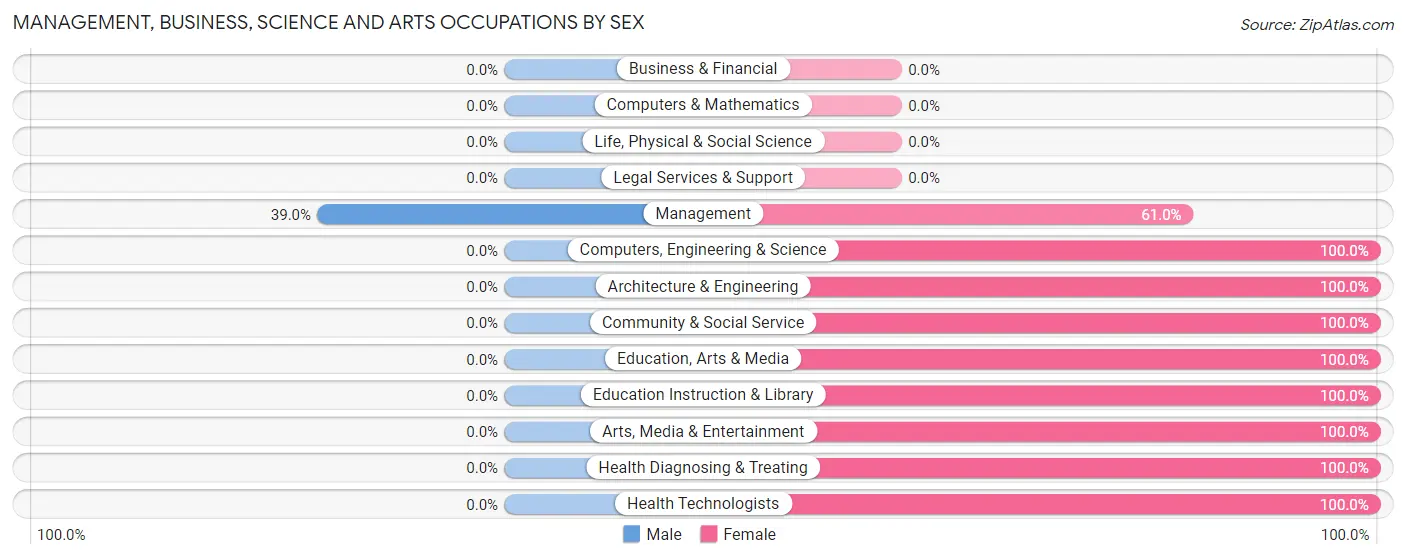
| Occupation | Male | Female |
| Management | 57 (39.0%) | 89 (61.0%) |
| Business & Financial | 0 (0.0%) | 0 (0.0%) |
| Computers, Engineering & Science | 0 (0.0%) | 26 (100.0%) |
| Computers & Mathematics | 0 (0.0%) | 0 (0.0%) |
| Architecture & Engineering | 0 (0.0%) | 26 (100.0%) |
| Life, Physical & Social Science | 0 (0.0%) | 0 (0.0%) |
| Community & Social Service | 0 (0.0%) | 157 (100.0%) |
| Education, Arts & Media | 0 (0.0%) | 45 (100.0%) |
| Legal Services & Support | 0 (0.0%) | 0 (0.0%) |
| Education Instruction & Library | 0 (0.0%) | 86 (100.0%) |
| Arts, Media & Entertainment | 0 (0.0%) | 26 (100.0%) |
| Health Diagnosing & Treating | 0 (0.0%) | 27 (100.0%) |
| Health Technologists | 0 (0.0%) | 13 (100.0%) |
| Total (Category) | 57 (16.0%) | 299 (84.0%) |
| Total (Overall) | 536 (53.1%) | 474 (46.9%) |
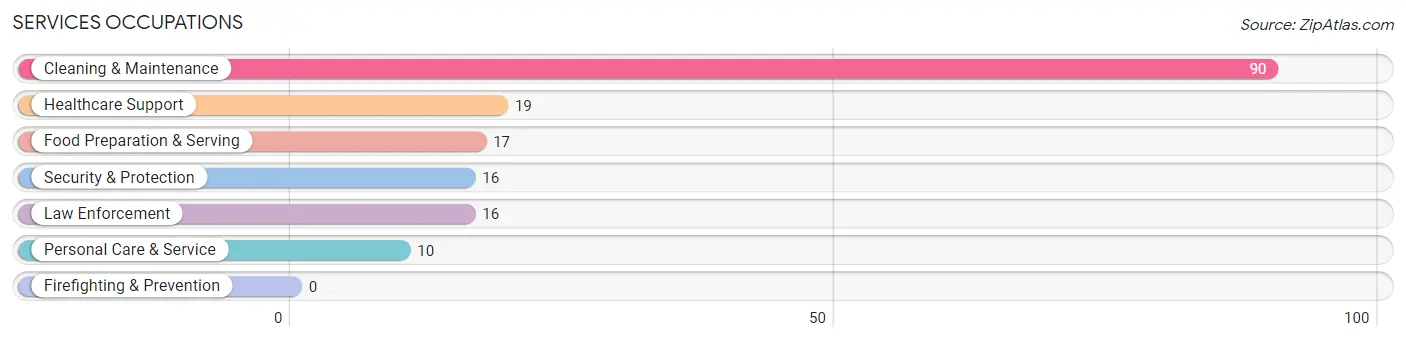
Services Occupations
The most common Services occupations in Kerhonkson are Cleaning & Maintenance (90 | 8.9%), Healthcare Support (19 | 1.9%), Food Preparation & Serving (17 | 1.7%), Security & Protection (16 | 1.6%), and Law Enforcement (16 | 1.6%).
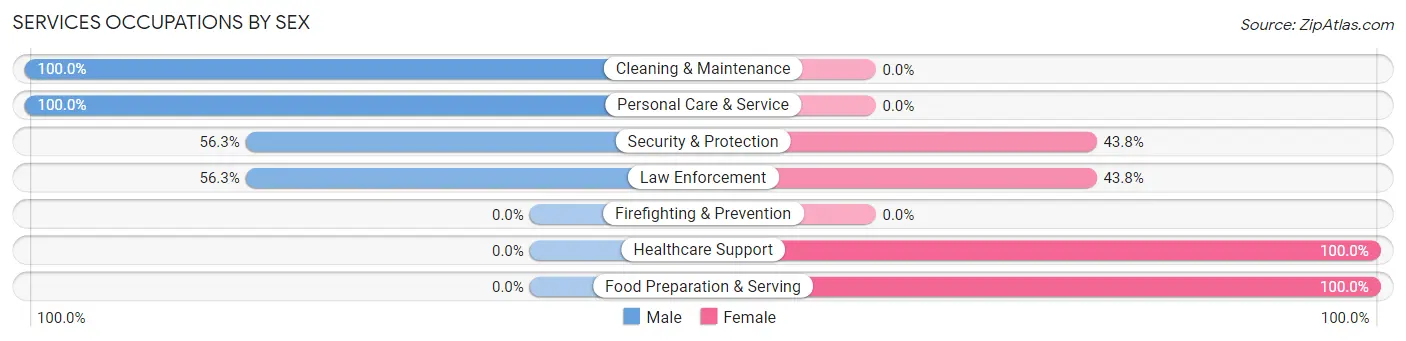
Services Occupations by Sex
Within the Services occupations in Kerhonkson, the most male-oriented occupations are Cleaning & Maintenance (100.0%), Personal Care & Service (100.0%), and Security & Protection (56.2%), while the most female-oriented occupations are Healthcare Support (100.0%), Food Preparation & Serving (100.0%), and Security & Protection (43.8%).
| Occupation | Male | Female |
| Healthcare Support | 0 (0.0%) | 19 (100.0%) |
| Security & Protection | 9 (56.2%) | 7 (43.8%) |
| Firefighting & Prevention | 0 (0.0%) | 0 (0.0%) |
| Law Enforcement | 9 (56.2%) | 7 (43.8%) |
| Food Preparation & Serving | 0 (0.0%) | 17 (100.0%) |
| Cleaning & Maintenance | 90 (100.0%) | 0 (0.0%) |
| Personal Care & Service | 10 (100.0%) | 0 (0.0%) |
| Total (Category) | 109 (71.7%) | 43 (28.3%) |
| Total (Overall) | 536 (53.1%) | 474 (46.9%) |
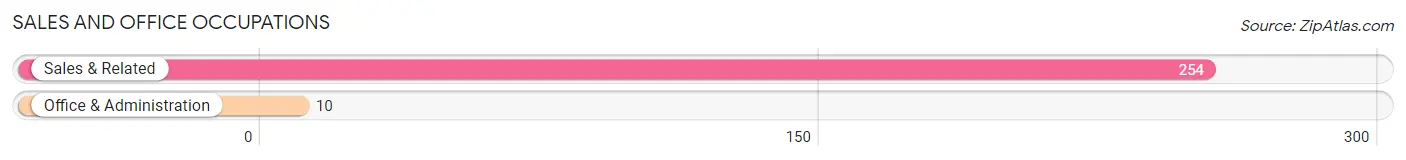
Sales and Office Occupations
The most common Sales and Office occupations in Kerhonkson are Sales & Related (254 | 25.2%), and Office & Administration (10 | 1.0%).
Sales and Office Occupations by Sex
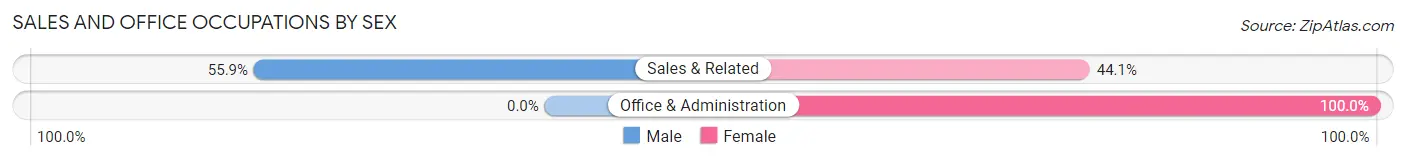
| Occupation | Male | Female |
| Sales & Related | 142 (55.9%) | 112 (44.1%) |
| Office & Administration | 0 (0.0%) | 10 (100.0%) |
| Total (Category) | 142 (53.8%) | 122 (46.2%) |
| Total (Overall) | 536 (53.1%) | 474 (46.9%) |
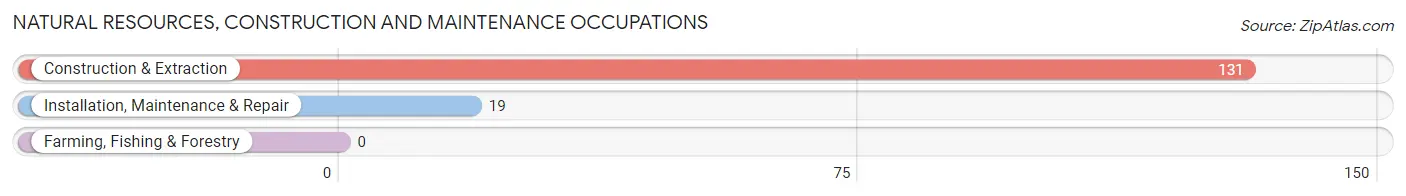
Natural Resources, Construction and Maintenance Occupations
The most common Natural Resources, Construction and Maintenance occupations in Kerhonkson are Construction & Extraction (131 | 13.0%), and Installation, Maintenance & Repair (19 | 1.9%).
Natural Resources, Construction and Maintenance Occupations by Sex
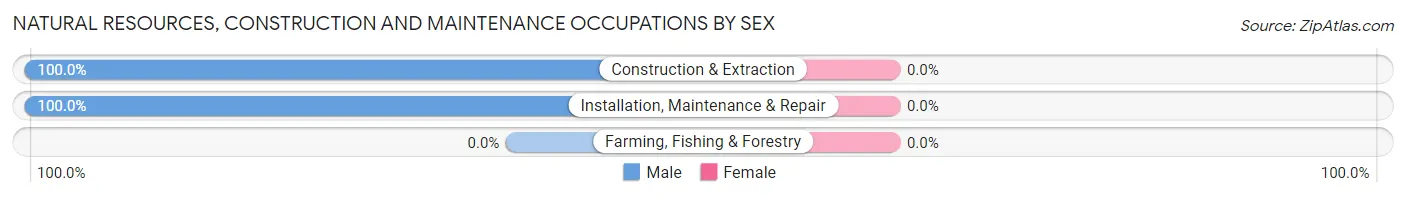
| Occupation | Male | Female |
| Farming, Fishing & Forestry | 0 (0.0%) | 0 (0.0%) |
| Construction & Extraction | 131 (100.0%) | 0 (0.0%) |
| Installation, Maintenance & Repair | 19 (100.0%) | 0 (0.0%) |
| Total (Category) | 150 (100.0%) | 0 (0.0%) |
| Total (Overall) | 536 (53.1%) | 474 (46.9%) |
Production, Transportation and Moving Occupations
The most common Production, Transportation and Moving occupations in Kerhonkson are Production (41 | 4.1%), Material Moving (25 | 2.5%), and Transportation (22 | 2.2%).
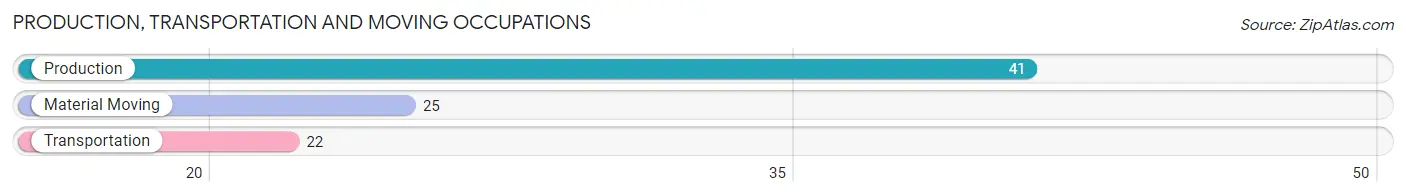
Production, Transportation and Moving Occupations by Sex
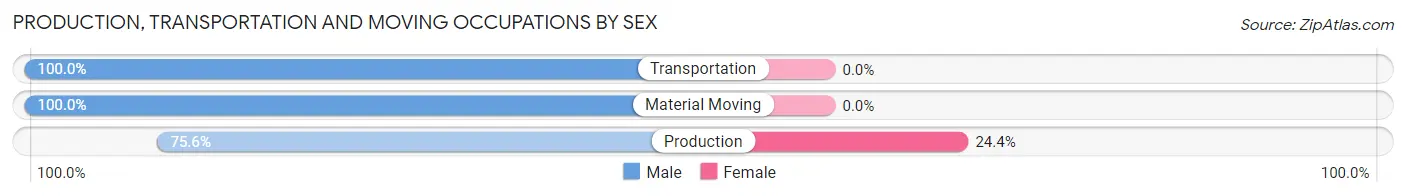
| Occupation | Male | Female |
| Production | 31 (75.6%) | 10 (24.4%) |
| Transportation | 22 (100.0%) | 0 (0.0%) |
| Material Moving | 25 (100.0%) | 0 (0.0%) |
| Total (Category) | 78 (88.6%) | 10 (11.4%) |
| Total (Overall) | 536 (53.1%) | 474 (46.9%) |
Employment Industries by Sex in Kerhonkson
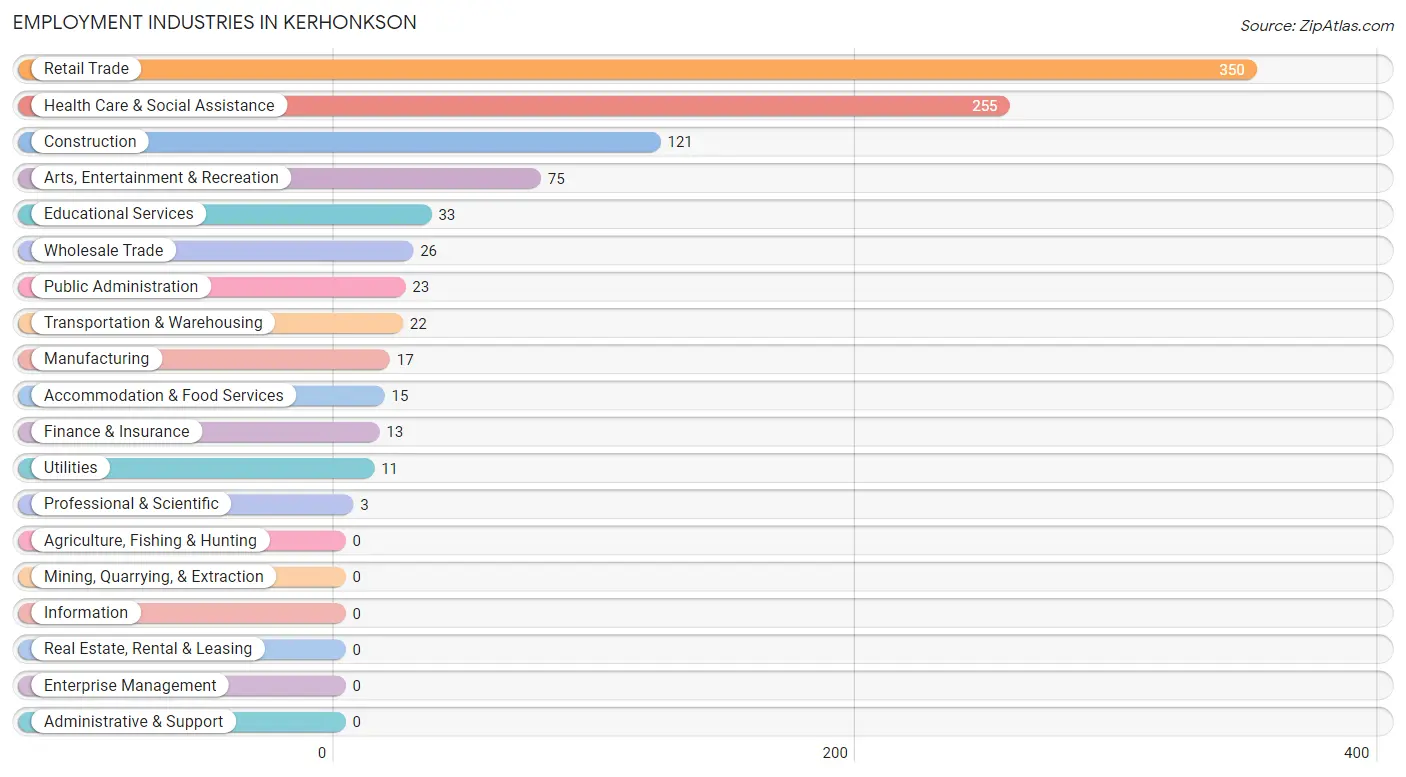
Employment Industries in Kerhonkson
The major employment industries in Kerhonkson include Retail Trade (350 | 34.6%), Health Care & Social Assistance (255 | 25.3%), Construction (121 | 12.0%), Arts, Entertainment & Recreation (75 | 7.4%), and Educational Services (33 | 3.3%).
Employment Industries by Sex in Kerhonkson
The Kerhonkson industries that see more men than women are Construction (100.0%), Transportation & Warehousing (100.0%), and Utilities (100.0%), whereas the industries that tend to have a higher number of women are Manufacturing (100.0%), Wholesale Trade (100.0%), and Educational Services (100.0%).
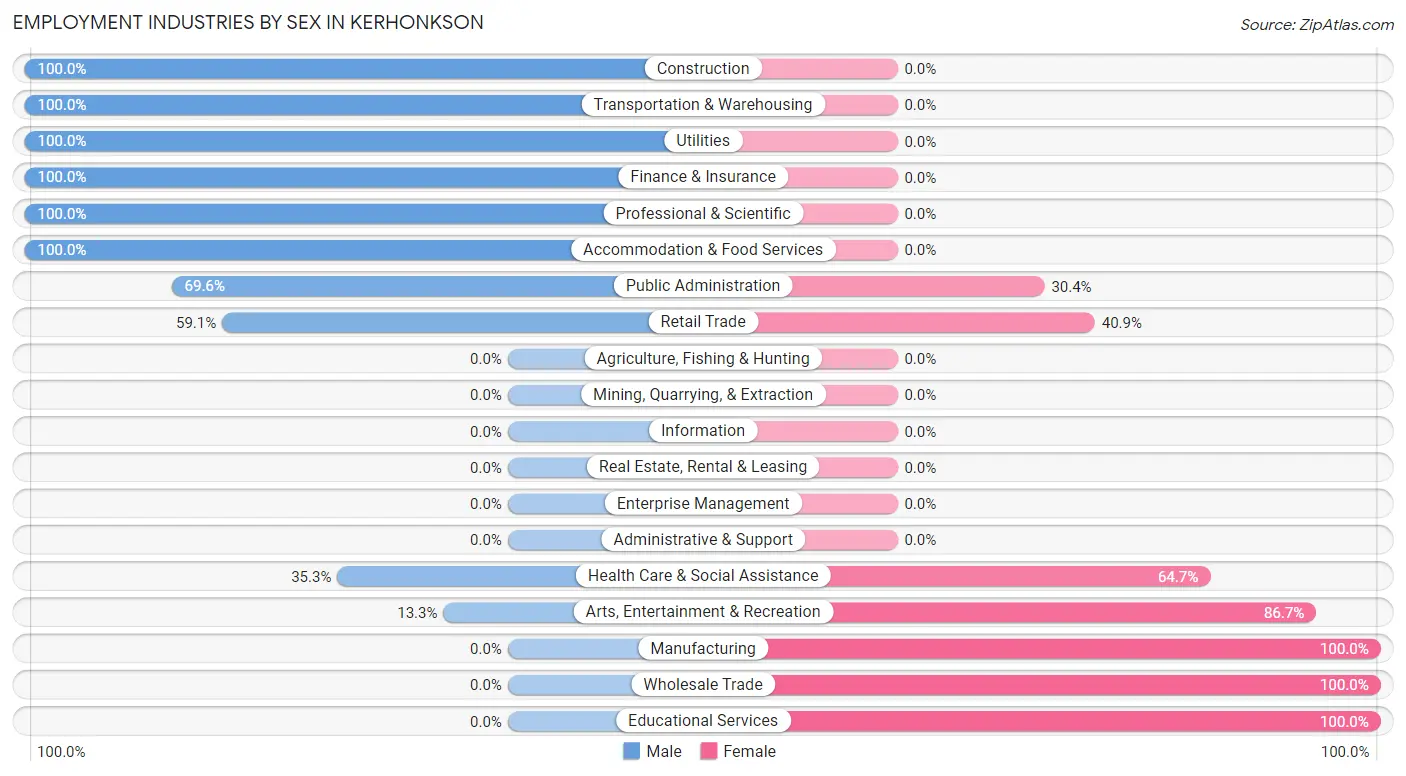
| Industry | Male | Female |
| Agriculture, Fishing & Hunting | 0 (0.0%) | 0 (0.0%) |
| Mining, Quarrying, & Extraction | 0 (0.0%) | 0 (0.0%) |
| Construction | 121 (100.0%) | 0 (0.0%) |
| Manufacturing | 0 (0.0%) | 17 (100.0%) |
| Wholesale Trade | 0 (0.0%) | 26 (100.0%) |
| Retail Trade | 207 (59.1%) | 143 (40.9%) |
| Transportation & Warehousing | 22 (100.0%) | 0 (0.0%) |
| Utilities | 11 (100.0%) | 0 (0.0%) |
| Information | 0 (0.0%) | 0 (0.0%) |
| Finance & Insurance | 13 (100.0%) | 0 (0.0%) |
| Real Estate, Rental & Leasing | 0 (0.0%) | 0 (0.0%) |
| Professional & Scientific | 3 (100.0%) | 0 (0.0%) |
| Enterprise Management | 0 (0.0%) | 0 (0.0%) |
| Administrative & Support | 0 (0.0%) | 0 (0.0%) |
| Educational Services | 0 (0.0%) | 33 (100.0%) |
| Health Care & Social Assistance | 90 (35.3%) | 165 (64.7%) |
| Arts, Entertainment & Recreation | 10 (13.3%) | 65 (86.7%) |
| Accommodation & Food Services | 15 (100.0%) | 0 (0.0%) |
| Public Administration | 16 (69.6%) | 7 (30.4%) |
| Total | 536 (53.1%) | 474 (46.9%) |
Education in Kerhonkson
School Enrollment in Kerhonkson
The most common levels of schooling among the 530 students in Kerhonkson are high school (230 | 43.4%), middle school (112 | 21.1%), and college / undergraduate (67 | 12.6%).
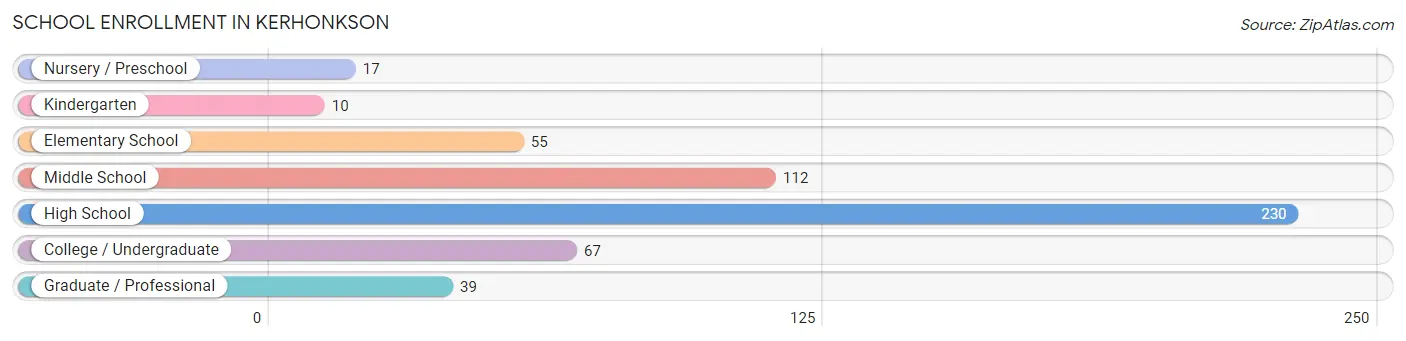
| School Level | # Students | % Students |
| Nursery / Preschool | 17 | 3.2% |
| Kindergarten | 10 | 1.9% |
| Elementary School | 55 | 10.4% |
| Middle School | 112 | 21.1% |
| High School | 230 | 43.4% |
| College / Undergraduate | 67 | 12.6% |
| Graduate / Professional | 39 | 7.4% |
| Total | 530 | 100.0% |
School Enrollment by Age by Funding Source in Kerhonkson
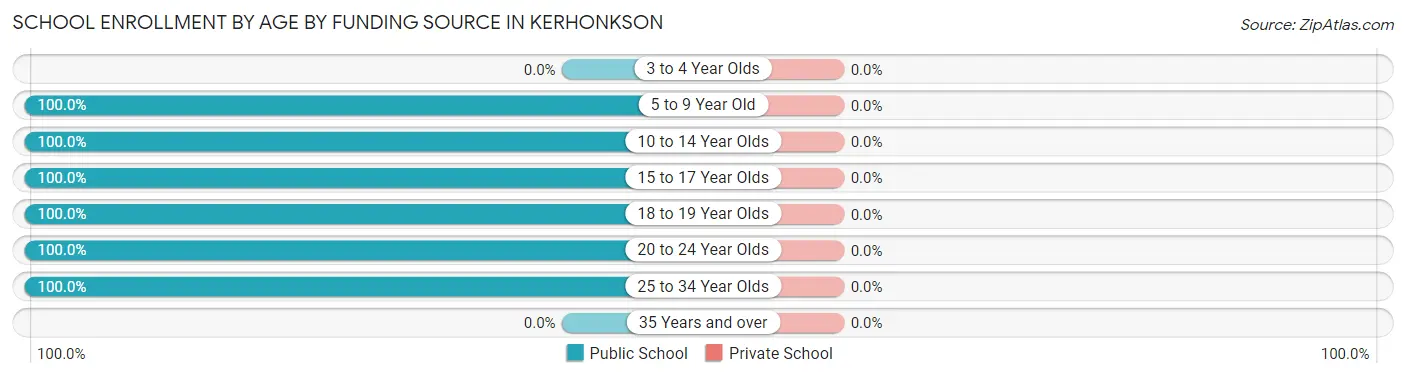
| Age Bracket | Public School | Private School |
| 3 to 4 Year Olds | 0 (0.0%) | 0 (0.0%) |
| 5 to 9 Year Old | 82 (100.0%) | 0 (0.0%) |
| 10 to 14 Year Olds | 121 (100.0%) | 0 (0.0%) |
| 15 to 17 Year Olds | 159 (100.0%) | 0 (0.0%) |
| 18 to 19 Year Olds | 96 (100.0%) | 0 (0.0%) |
| 20 to 24 Year Olds | 33 (100.0%) | 0 (0.0%) |
| 25 to 34 Year Olds | 39 (100.0%) | 0 (0.0%) |
| 35 Years and over | 0 (0.0%) | 0 (0.0%) |
| Total | 530 (100.0%) | 0 (0.0%) |
Educational Attainment by Field of Study in Kerhonkson
Science & technology (101 | 33.3%), psychology (60 | 19.8%), arts & humanities (45 | 14.8%), social sciences (25 | 8.3%), and liberal arts & history (23 | 7.6%) are the most common fields of study among 303 individuals in Kerhonkson who have obtained a bachelor's degree or higher.
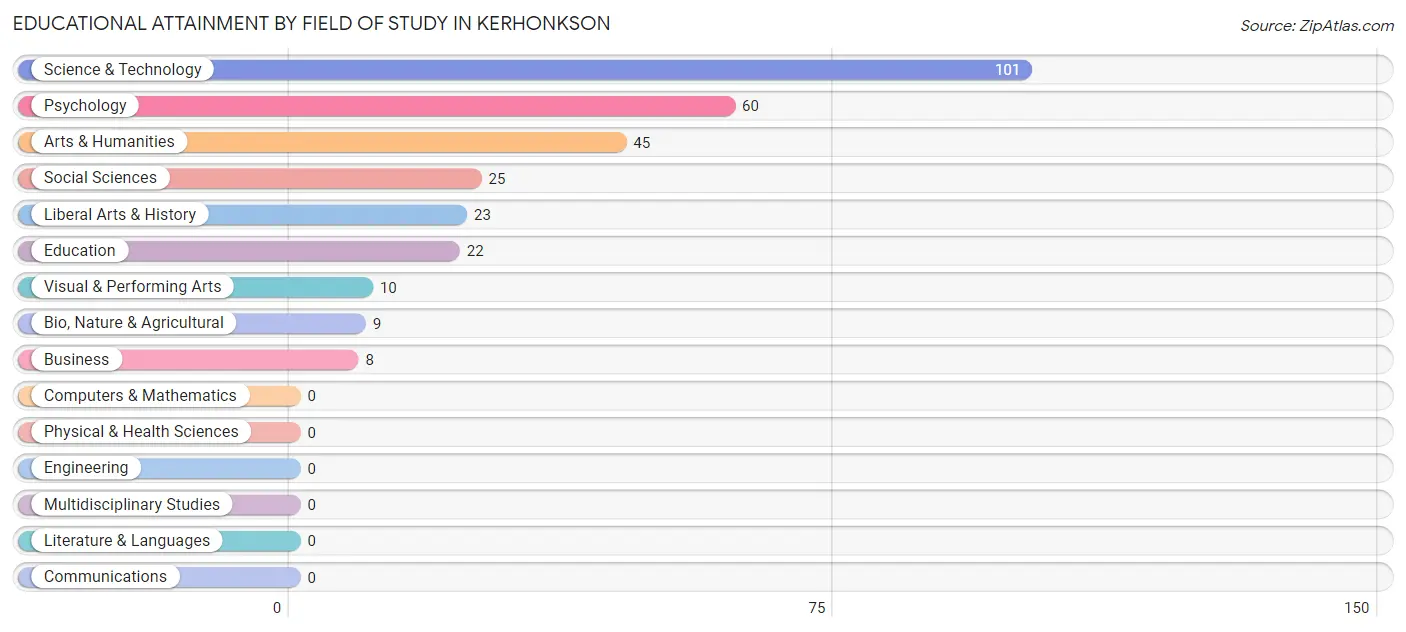
| Field of Study | # Graduates | % Graduates |
| Computers & Mathematics | 0 | 0.0% |
| Bio, Nature & Agricultural | 9 | 3.0% |
| Physical & Health Sciences | 0 | 0.0% |
| Psychology | 60 | 19.8% |
| Social Sciences | 25 | 8.3% |
| Engineering | 0 | 0.0% |
| Multidisciplinary Studies | 0 | 0.0% |
| Science & Technology | 101 | 33.3% |
| Business | 8 | 2.6% |
| Education | 22 | 7.3% |
| Literature & Languages | 0 | 0.0% |
| Liberal Arts & History | 23 | 7.6% |
| Visual & Performing Arts | 10 | 3.3% |
| Communications | 0 | 0.0% |
| Arts & Humanities | 45 | 14.8% |
| Total | 303 | 100.0% |
Transportation & Commute in Kerhonkson
Vehicle Availability by Sex in Kerhonkson
The most prevalent vehicle ownership categories in Kerhonkson are males with 2 vehicles (313, accounting for 58.4%) and females with 2 vehicles (161, making up 66.0%).
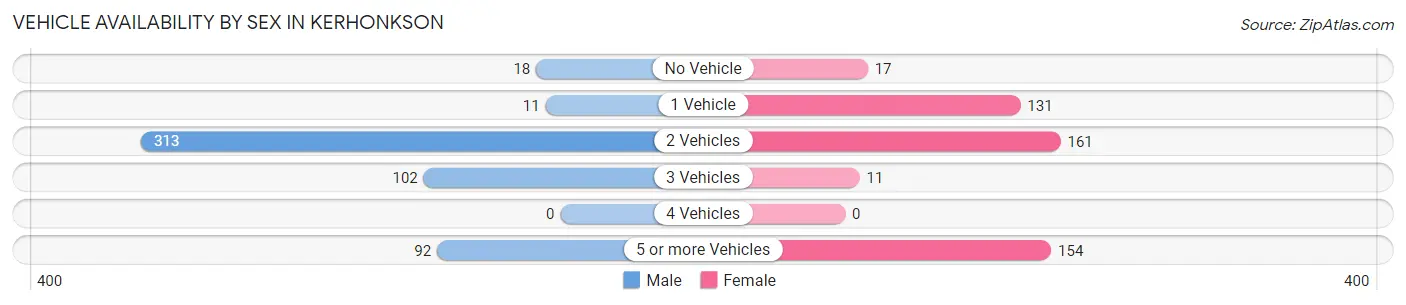
| Vehicles Available | Male | Female |
| No Vehicle | 18 (3.4%) | 17 (3.6%) |
| 1 Vehicle | 11 (2.1%) | 131 (27.6%) |
| 2 Vehicles | 313 (58.4%) | 161 (34.0%) |
| 3 Vehicles | 102 (19.0%) | 11 (2.3%) |
| 4 Vehicles | 0 (0.0%) | 0 (0.0%) |
| 5 or more Vehicles | 92 (17.2%) | 154 (32.5%) |
| Total | 536 (100.0%) | 474 (100.0%) |
Commute Time in Kerhonkson
The most frequently occuring commute durations in Kerhonkson are less than 5 minutes (217 commuters, 24.9%), 10 to 14 minutes (126 commuters, 14.5%), and 25 to 29 minutes (97 commuters, 11.2%).
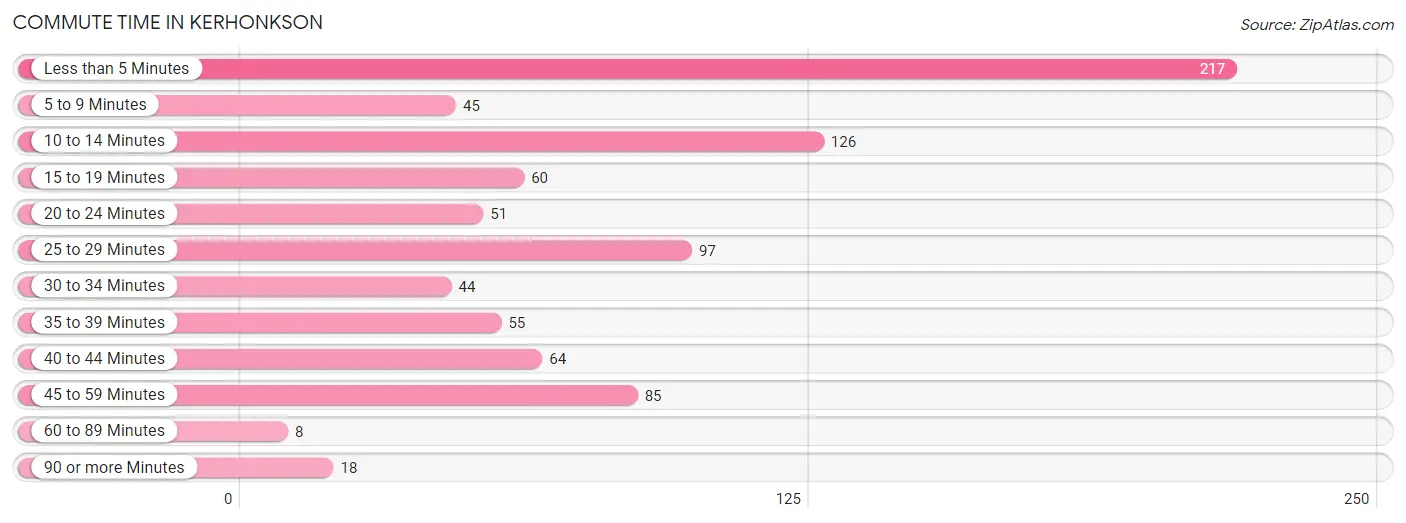
| Commute Time | # Commuters | % Commuters |
| Less than 5 Minutes | 217 | 24.9% |
| 5 to 9 Minutes | 45 | 5.2% |
| 10 to 14 Minutes | 126 | 14.5% |
| 15 to 19 Minutes | 60 | 6.9% |
| 20 to 24 Minutes | 51 | 5.9% |
| 25 to 29 Minutes | 97 | 11.2% |
| 30 to 34 Minutes | 44 | 5.1% |
| 35 to 39 Minutes | 55 | 6.3% |
| 40 to 44 Minutes | 64 | 7.4% |
| 45 to 59 Minutes | 85 | 9.8% |
| 60 to 89 Minutes | 8 | 0.9% |
| 90 or more Minutes | 18 | 2.1% |
Commute Time by Sex in Kerhonkson
The most common commute times in Kerhonkson are less than 5 minutes (133 commuters, 25.9%) for males and less than 5 minutes (84 commuters, 23.5%) for females.
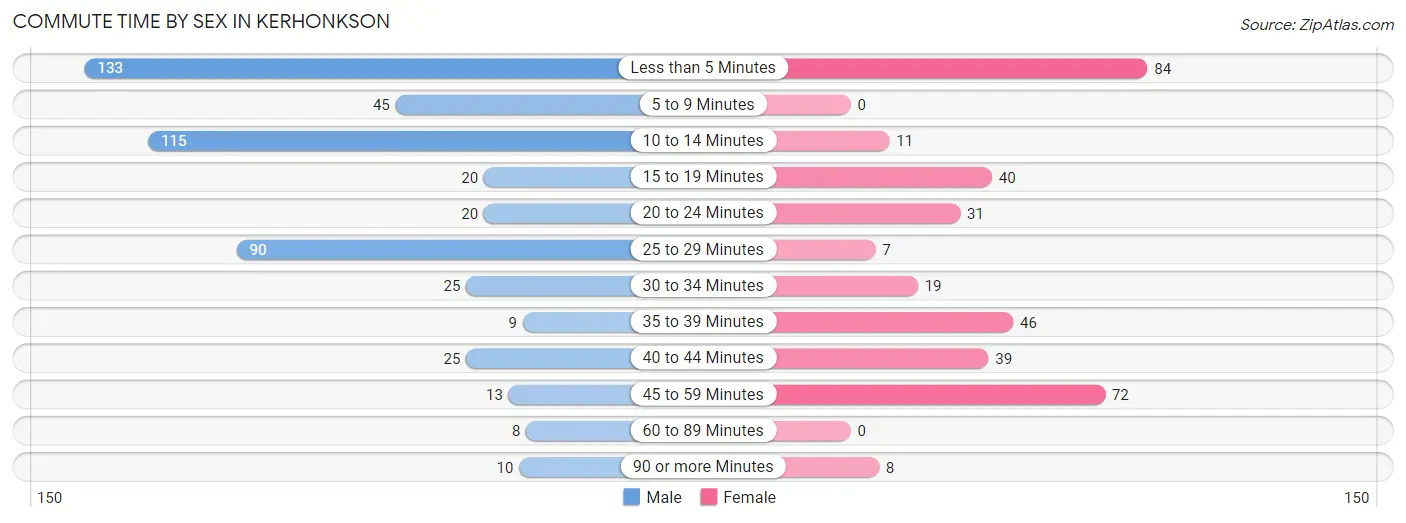
| Commute Time | Male | Female |
| Less than 5 Minutes | 133 (25.9%) | 84 (23.5%) |
| 5 to 9 Minutes | 45 (8.8%) | 0 (0.0%) |
| 10 to 14 Minutes | 115 (22.4%) | 11 (3.1%) |
| 15 to 19 Minutes | 20 (3.9%) | 40 (11.2%) |
| 20 to 24 Minutes | 20 (3.9%) | 31 (8.7%) |
| 25 to 29 Minutes | 90 (17.5%) | 7 (2.0%) |
| 30 to 34 Minutes | 25 (4.9%) | 19 (5.3%) |
| 35 to 39 Minutes | 9 (1.8%) | 46 (12.9%) |
| 40 to 44 Minutes | 25 (4.9%) | 39 (10.9%) |
| 45 to 59 Minutes | 13 (2.5%) | 72 (20.2%) |
| 60 to 89 Minutes | 8 (1.6%) | 0 (0.0%) |
| 90 or more Minutes | 10 (1.9%) | 8 (2.2%) |
Time of Departure to Work by Sex in Kerhonkson
The most frequent times of departure to work in Kerhonkson are 6:30 AM to 6:59 AM (135, 26.3%) for males and 7:30 AM to 7:59 AM (72, 20.2%) for females.
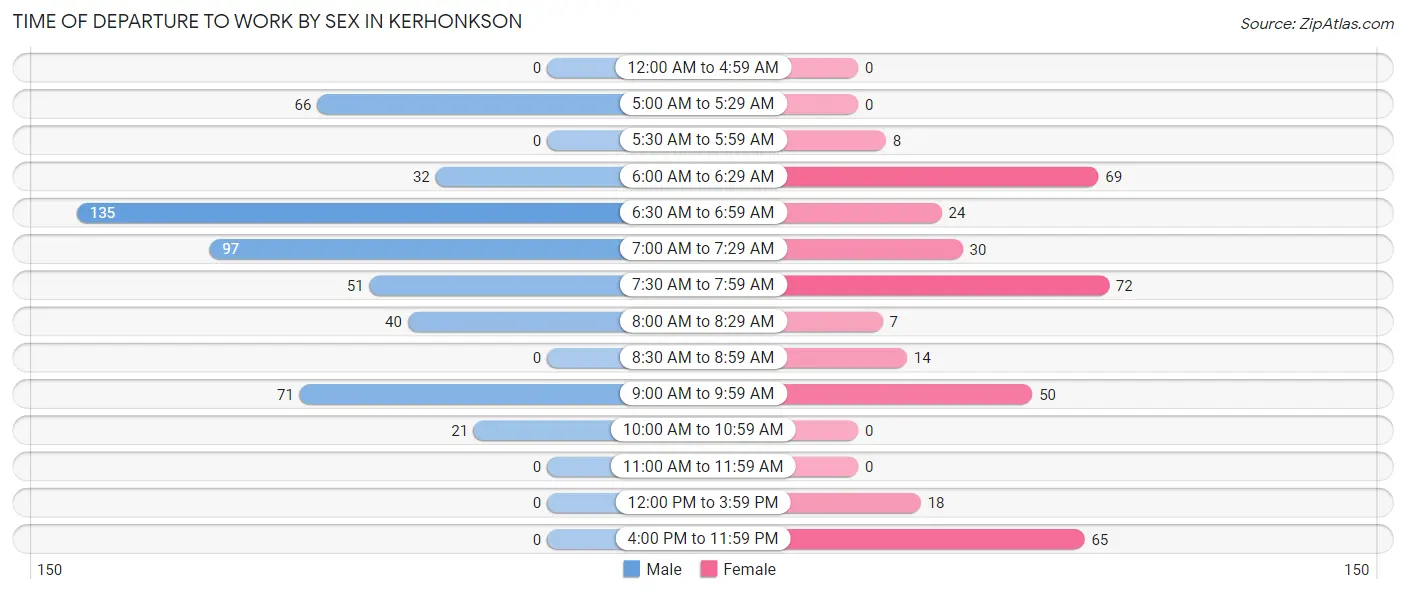
| Time of Departure | Male | Female |
| 12:00 AM to 4:59 AM | 0 (0.0%) | 0 (0.0%) |
| 5:00 AM to 5:29 AM | 66 (12.9%) | 0 (0.0%) |
| 5:30 AM to 5:59 AM | 0 (0.0%) | 8 (2.2%) |
| 6:00 AM to 6:29 AM | 32 (6.2%) | 69 (19.3%) |
| 6:30 AM to 6:59 AM | 135 (26.3%) | 24 (6.7%) |
| 7:00 AM to 7:29 AM | 97 (18.9%) | 30 (8.4%) |
| 7:30 AM to 7:59 AM | 51 (9.9%) | 72 (20.2%) |
| 8:00 AM to 8:29 AM | 40 (7.8%) | 7 (2.0%) |
| 8:30 AM to 8:59 AM | 0 (0.0%) | 14 (3.9%) |
| 9:00 AM to 9:59 AM | 71 (13.8%) | 50 (14.0%) |
| 10:00 AM to 10:59 AM | 21 (4.1%) | 0 (0.0%) |
| 11:00 AM to 11:59 AM | 0 (0.0%) | 0 (0.0%) |
| 12:00 PM to 3:59 PM | 0 (0.0%) | 18 (5.0%) |
| 4:00 PM to 11:59 PM | 0 (0.0%) | 65 (18.2%) |
| Total | 513 (100.0%) | 357 (100.0%) |
Housing Occupancy in Kerhonkson
Occupancy by Ownership in Kerhonkson
Of the total 754 dwellings in Kerhonkson, owner-occupied units account for 425 (56.4%), while renter-occupied units make up 329 (43.6%).
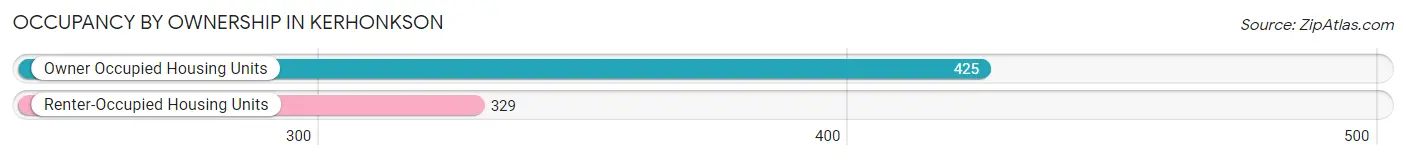
| Occupancy | # Housing Units | % Housing Units |
| Owner Occupied Housing Units | 425 | 56.4% |
| Renter-Occupied Housing Units | 329 | 43.6% |
| Total Occupied Housing Units | 754 | 100.0% |
Occupancy by Household Size in Kerhonkson
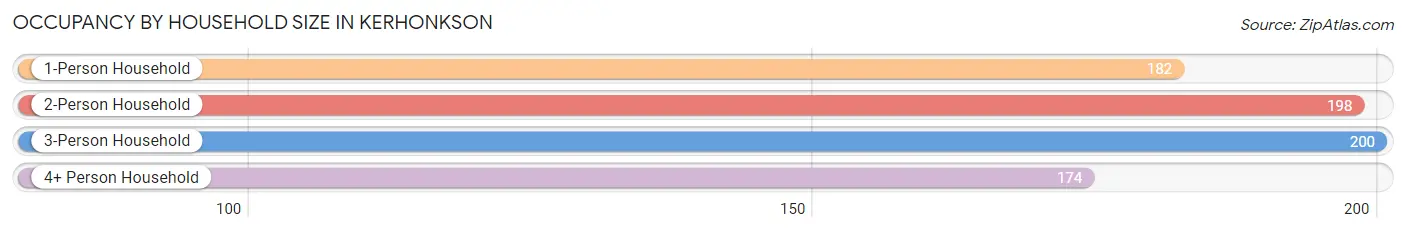
| Household Size | # Housing Units | % Housing Units |
| 1-Person Household | 182 | 24.1% |
| 2-Person Household | 198 | 26.3% |
| 3-Person Household | 200 | 26.5% |
| 4+ Person Household | 174 | 23.1% |
| Total Housing Units | 754 | 100.0% |
Occupancy by Ownership by Household Size in Kerhonkson
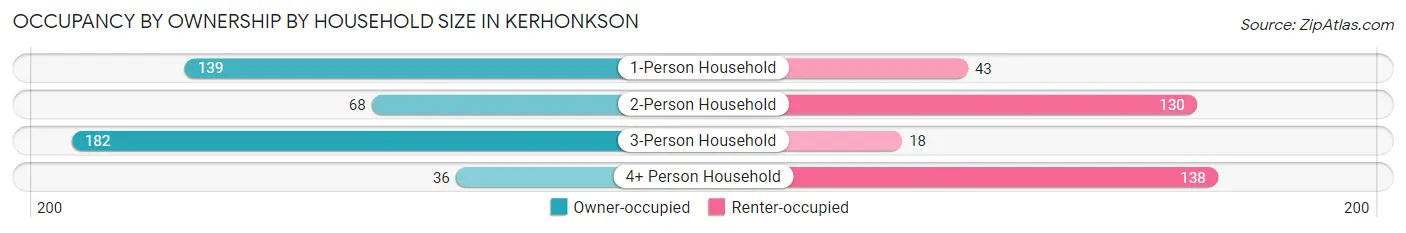
| Household Size | Owner-occupied | Renter-occupied |
| 1-Person Household | 139 (76.4%) | 43 (23.6%) |
| 2-Person Household | 68 (34.3%) | 130 (65.7%) |
| 3-Person Household | 182 (91.0%) | 18 (9.0%) |
| 4+ Person Household | 36 (20.7%) | 138 (79.3%) |
| Total Housing Units | 425 (56.4%) | 329 (43.6%) |
Occupancy by Educational Attainment in Kerhonkson
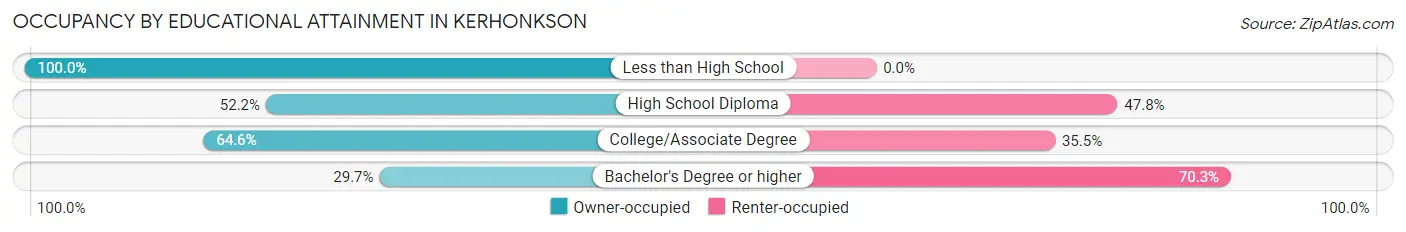
| Household Size | Owner-occupied | Renter-occupied |
| Less than High School | 21 (100.0%) | 0 (0.0%) |
| High School Diploma | 24 (52.2%) | 22 (47.8%) |
| College/Associate Degree | 326 (64.5%) | 179 (35.4%) |
| Bachelor's Degree or higher | 54 (29.7%) | 128 (70.3%) |
Occupancy by Age of Householder in Kerhonkson
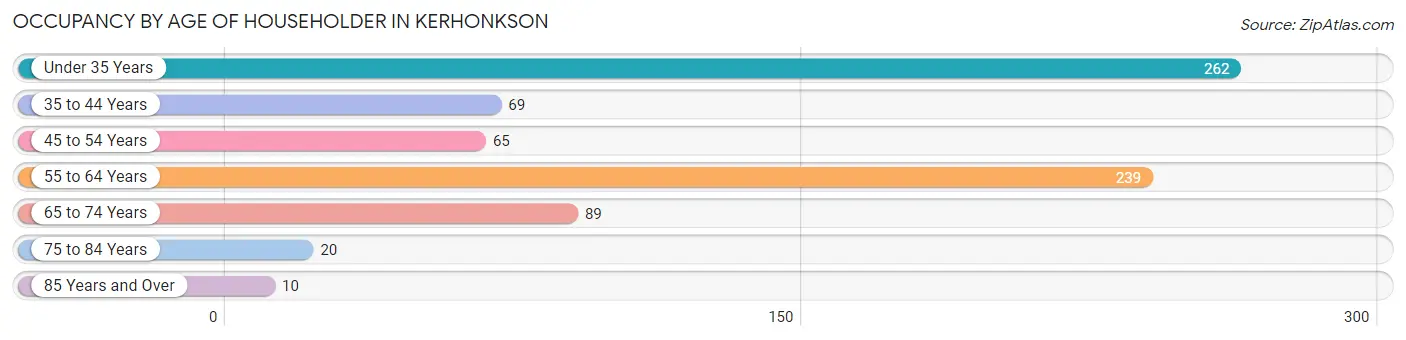
| Age Bracket | # Households | % Households |
| Under 35 Years | 262 | 34.7% |
| 35 to 44 Years | 69 | 9.1% |
| 45 to 54 Years | 65 | 8.6% |
| 55 to 64 Years | 239 | 31.7% |
| 65 to 74 Years | 89 | 11.8% |
| 75 to 84 Years | 20 | 2.6% |
| 85 Years and Over | 10 | 1.3% |
| Total | 754 | 100.0% |
Housing Finances in Kerhonkson
Median Income by Occupancy in Kerhonkson
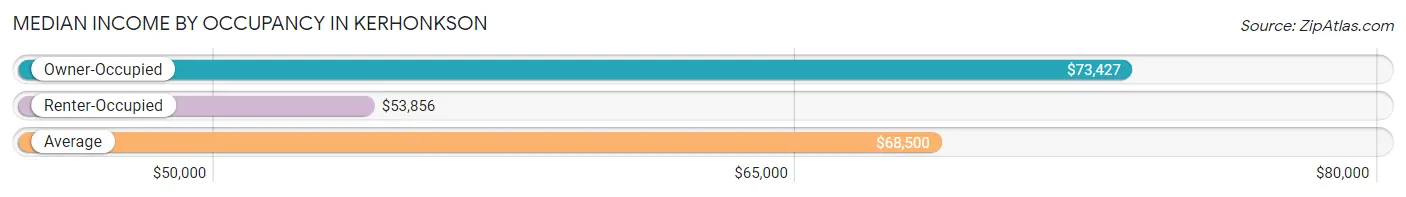
| Occupancy Type | # Households | Median Income |
| Owner-Occupied | 425 (56.4%) | $73,427 |
| Renter-Occupied | 329 (43.6%) | $53,856 |
| Average | 754 (100.0%) | $68,500 |
Occupancy by Householder Income Bracket in Kerhonkson
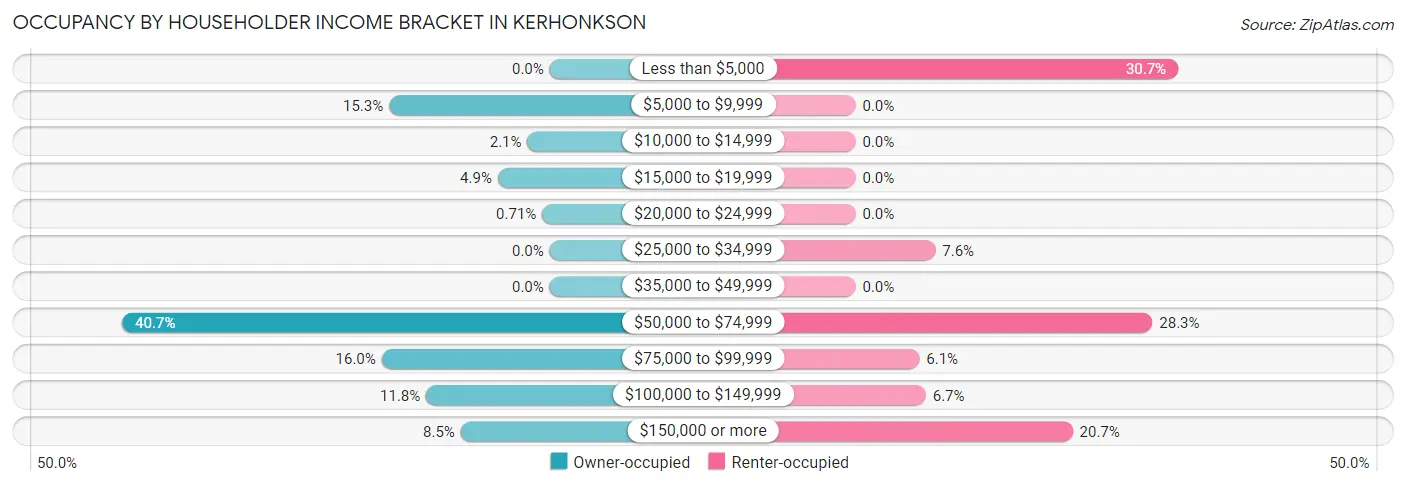
| Income Bracket | Owner-occupied | Renter-occupied |
| Less than $5,000 | 0 (0.0%) | 101 (30.7%) |
| $5,000 to $9,999 | 65 (15.3%) | 0 (0.0%) |
| $10,000 to $14,999 | 9 (2.1%) | 0 (0.0%) |
| $15,000 to $19,999 | 21 (4.9%) | 0 (0.0%) |
| $20,000 to $24,999 | 3 (0.7%) | 0 (0.0%) |
| $25,000 to $34,999 | 0 (0.0%) | 25 (7.6%) |
| $35,000 to $49,999 | 0 (0.0%) | 0 (0.0%) |
| $50,000 to $74,999 | 173 (40.7%) | 93 (28.3%) |
| $75,000 to $99,999 | 68 (16.0%) | 20 (6.1%) |
| $100,000 to $149,999 | 50 (11.8%) | 22 (6.7%) |
| $150,000 or more | 36 (8.5%) | 68 (20.7%) |
| Total | 425 (100.0%) | 329 (100.0%) |
Monthly Housing Cost Tiers in Kerhonkson
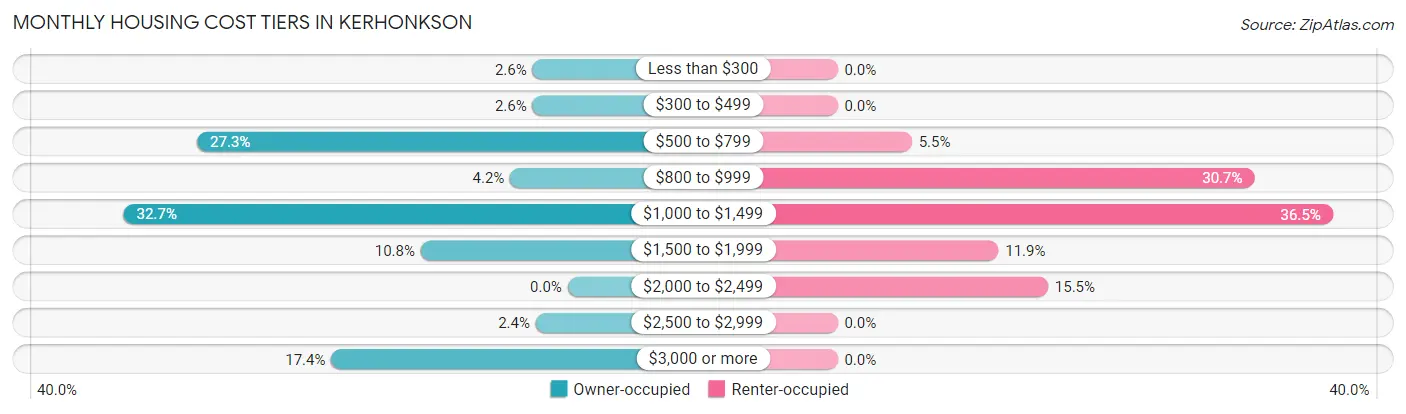
| Monthly Cost | Owner-occupied | Renter-occupied |
| Less than $300 | 11 (2.6%) | 0 (0.0%) |
| $300 to $499 | 11 (2.6%) | 0 (0.0%) |
| $500 to $799 | 116 (27.3%) | 18 (5.5%) |
| $800 to $999 | 18 (4.2%) | 101 (30.7%) |
| $1,000 to $1,499 | 139 (32.7%) | 120 (36.5%) |
| $1,500 to $1,999 | 46 (10.8%) | 39 (11.8%) |
| $2,000 to $2,499 | 0 (0.0%) | 51 (15.5%) |
| $2,500 to $2,999 | 10 (2.4%) | 0 (0.0%) |
| $3,000 or more | 74 (17.4%) | 0 (0.0%) |
| Total | 425 (100.0%) | 329 (100.0%) |
Physical Housing Characteristics in Kerhonkson
Housing Structures in Kerhonkson
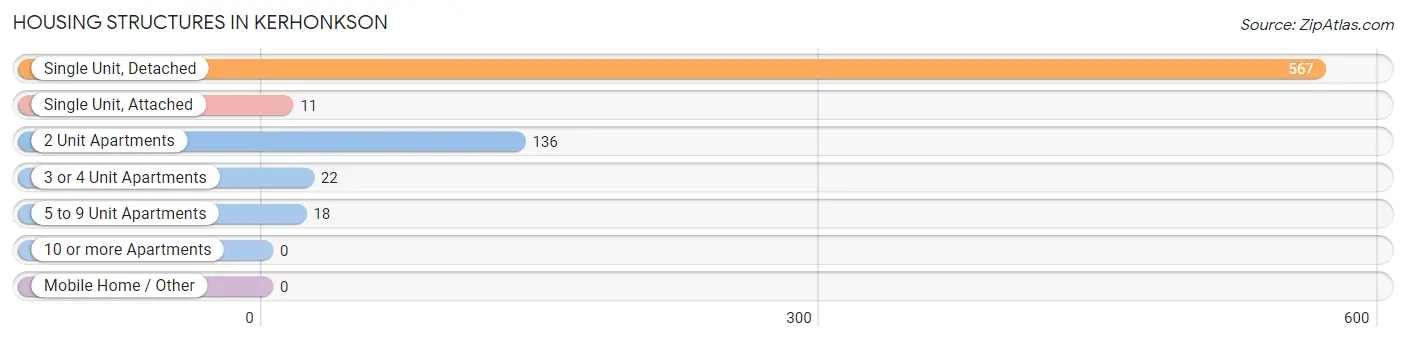
| Structure Type | # Housing Units | % Housing Units |
| Single Unit, Detached | 567 | 75.2% |
| Single Unit, Attached | 11 | 1.5% |
| 2 Unit Apartments | 136 | 18.0% |
| 3 or 4 Unit Apartments | 22 | 2.9% |
| 5 to 9 Unit Apartments | 18 | 2.4% |
| 10 or more Apartments | 0 | 0.0% |
| Mobile Home / Other | 0 | 0.0% |
| Total | 754 | 100.0% |
Housing Structures by Occupancy in Kerhonkson
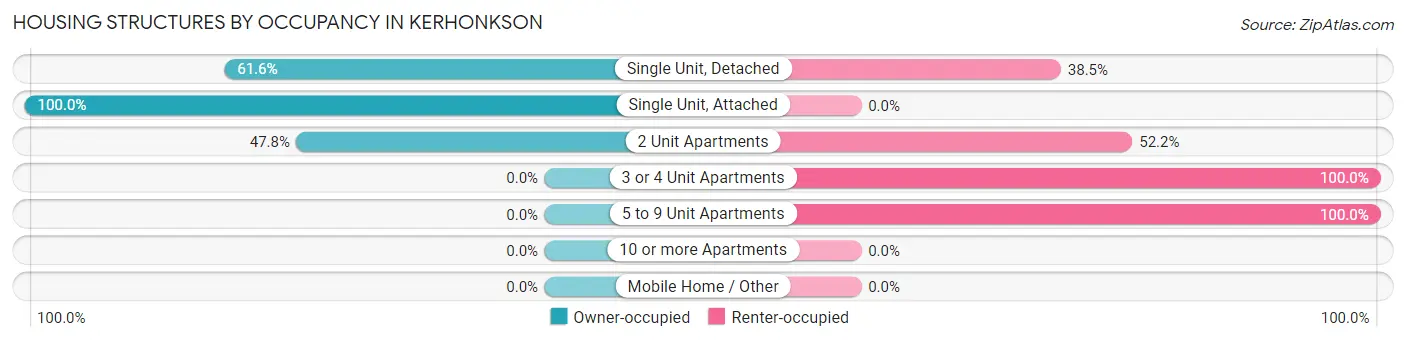
| Structure Type | Owner-occupied | Renter-occupied |
| Single Unit, Detached | 349 (61.6%) | 218 (38.5%) |
| Single Unit, Attached | 11 (100.0%) | 0 (0.0%) |
| 2 Unit Apartments | 65 (47.8%) | 71 (52.2%) |
| 3 or 4 Unit Apartments | 0 (0.0%) | 22 (100.0%) |
| 5 to 9 Unit Apartments | 0 (0.0%) | 18 (100.0%) |
| 10 or more Apartments | 0 (0.0%) | 0 (0.0%) |
| Mobile Home / Other | 0 (0.0%) | 0 (0.0%) |
| Total | 425 (56.4%) | 329 (43.6%) |
Housing Structures by Number of Rooms in Kerhonkson
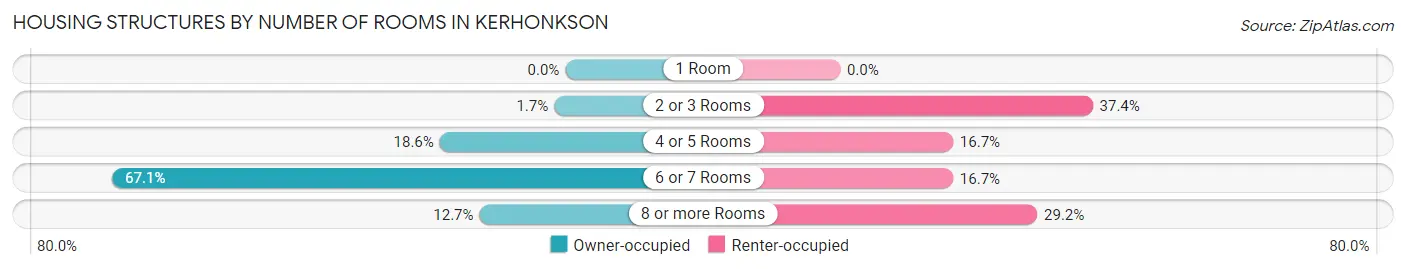
| Number of Rooms | Owner-occupied | Renter-occupied |
| 1 Room | 0 (0.0%) | 0 (0.0%) |
| 2 or 3 Rooms | 7 (1.7%) | 123 (37.4%) |
| 4 or 5 Rooms | 79 (18.6%) | 55 (16.7%) |
| 6 or 7 Rooms | 285 (67.1%) | 55 (16.7%) |
| 8 or more Rooms | 54 (12.7%) | 96 (29.2%) |
| Total | 425 (100.0%) | 329 (100.0%) |
Housing Structure by Heating Type in Kerhonkson
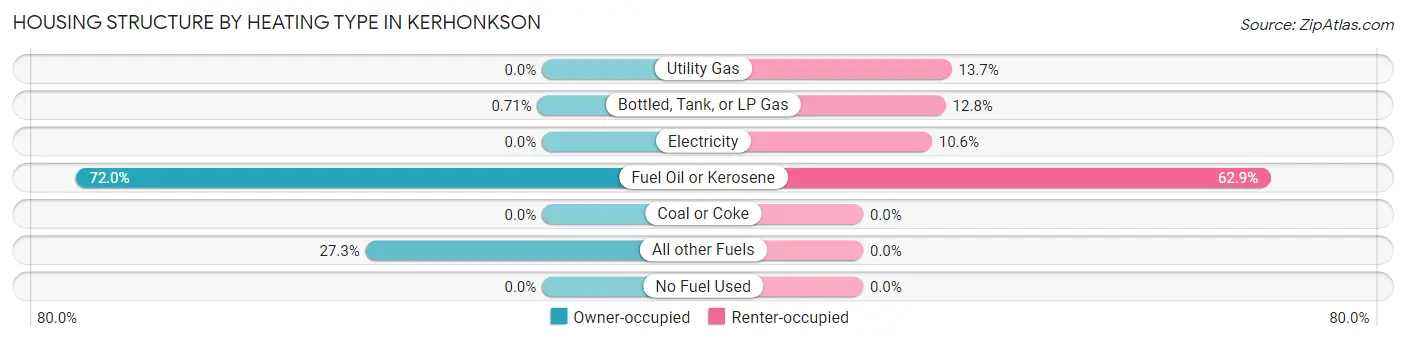
| Heating Type | Owner-occupied | Renter-occupied |
| Utility Gas | 0 (0.0%) | 45 (13.7%) |
| Bottled, Tank, or LP Gas | 3 (0.7%) | 42 (12.8%) |
| Electricity | 0 (0.0%) | 35 (10.6%) |
| Fuel Oil or Kerosene | 306 (72.0%) | 207 (62.9%) |
| Coal or Coke | 0 (0.0%) | 0 (0.0%) |
| All other Fuels | 116 (27.3%) | 0 (0.0%) |
| No Fuel Used | 0 (0.0%) | 0 (0.0%) |
| Total | 425 (100.0%) | 329 (100.0%) |
Household Vehicle Usage in Kerhonkson
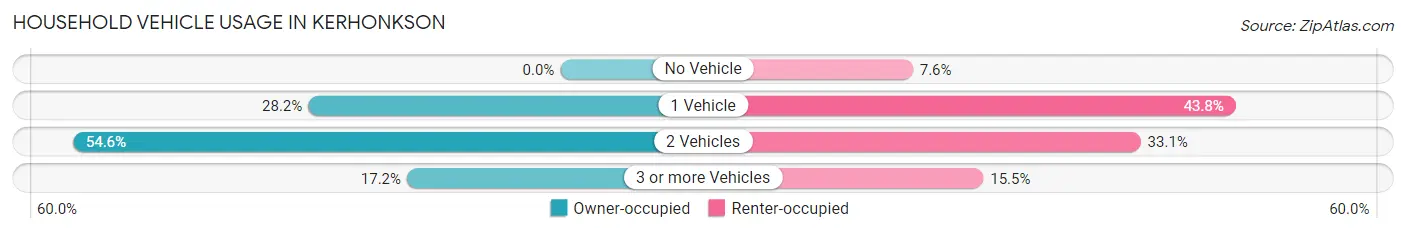
| Vehicles per Household | Owner-occupied | Renter-occupied |
| No Vehicle | 0 (0.0%) | 25 (7.6%) |
| 1 Vehicle | 120 (28.2%) | 144 (43.8%) |
| 2 Vehicles | 232 (54.6%) | 109 (33.1%) |
| 3 or more Vehicles | 73 (17.2%) | 51 (15.5%) |
| Total | 425 (100.0%) | 329 (100.0%) |
Real Estate & Mortgages in Kerhonkson
Real Estate and Mortgage Overview in Kerhonkson
| Characteristic | Without Mortgage | With Mortgage |
| Housing Units | 133 | 292 |
| Median Property Value | $222,000 | $230,200 |
| Median Household Income | $80,841 | $17 |
| Monthly Housing Costs | $682 | $74 |
| Real Estate Taxes | $3,492 | $0 |
Property Value by Mortgage Status in Kerhonkson
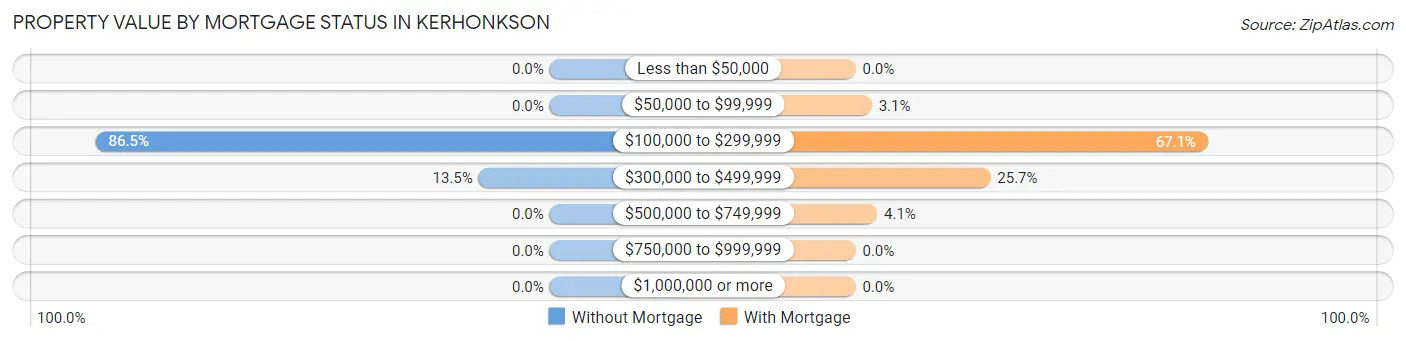
| Property Value | Without Mortgage | With Mortgage |
| Less than $50,000 | 0 (0.0%) | 0 (0.0%) |
| $50,000 to $99,999 | 0 (0.0%) | 9 (3.1%) |
| $100,000 to $299,999 | 115 (86.5%) | 196 (67.1%) |
| $300,000 to $499,999 | 18 (13.5%) | 75 (25.7%) |
| $500,000 to $749,999 | 0 (0.0%) | 12 (4.1%) |
| $750,000 to $999,999 | 0 (0.0%) | 0 (0.0%) |
| $1,000,000 or more | 0 (0.0%) | 0 (0.0%) |
| Total | 133 (100.0%) | 292 (100.0%) |
Household Income by Mortgage Status in Kerhonkson
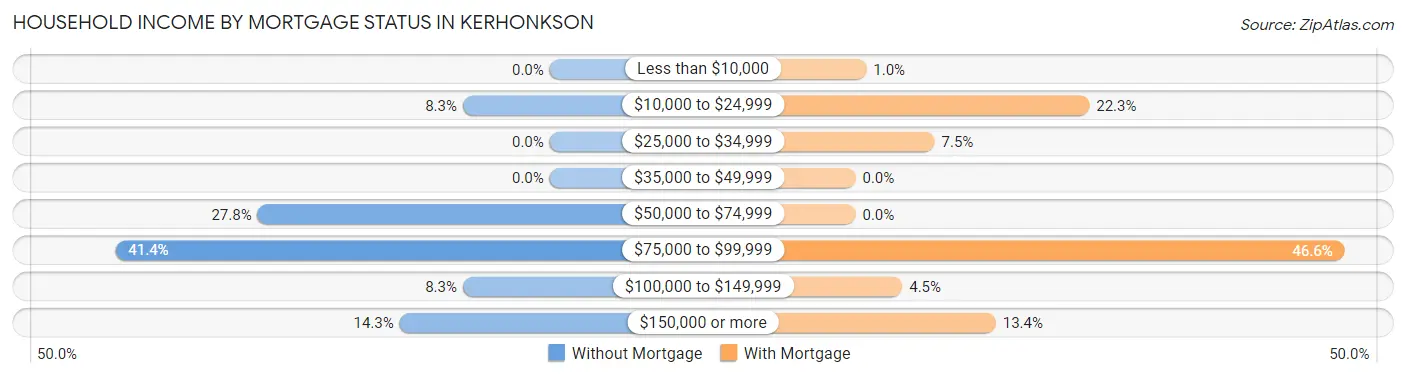
| Household Income | Without Mortgage | With Mortgage |
| Less than $10,000 | 0 (0.0%) | 3 (1.0%) |
| $10,000 to $24,999 | 11 (8.3%) | 65 (22.3%) |
| $25,000 to $34,999 | 0 (0.0%) | 22 (7.5%) |
| $35,000 to $49,999 | 0 (0.0%) | 0 (0.0%) |
| $50,000 to $74,999 | 37 (27.8%) | 0 (0.0%) |
| $75,000 to $99,999 | 55 (41.3%) | 136 (46.6%) |
| $100,000 to $149,999 | 11 (8.3%) | 13 (4.4%) |
| $150,000 or more | 19 (14.3%) | 39 (13.4%) |
| Total | 133 (100.0%) | 292 (100.0%) |
Property Value to Household Income Ratio in Kerhonkson
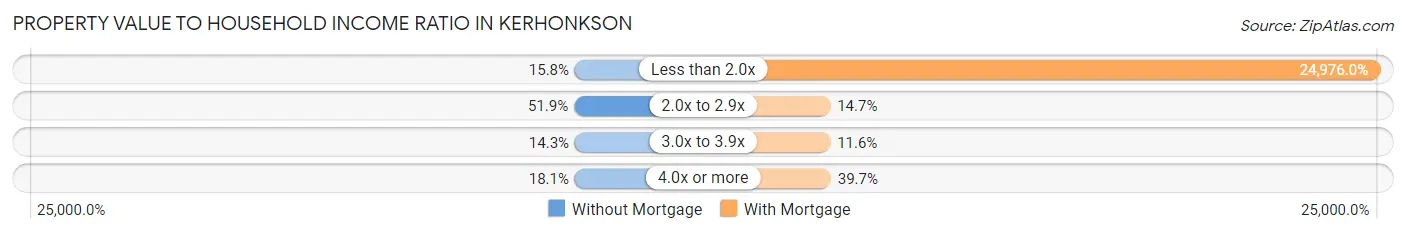
| Value-to-Income Ratio | Without Mortgage | With Mortgage |
| Less than 2.0x | 21 (15.8%) | 72,930 (24,976.0%) |
| 2.0x to 2.9x | 69 (51.9%) | 43 (14.7%) |
| 3.0x to 3.9x | 19 (14.3%) | 34 (11.6%) |
| 4.0x or more | 24 (18.0%) | 116 (39.7%) |
| Total | 133 (100.0%) | 292 (100.0%) |
Real Estate Taxes by Mortgage Status in Kerhonkson
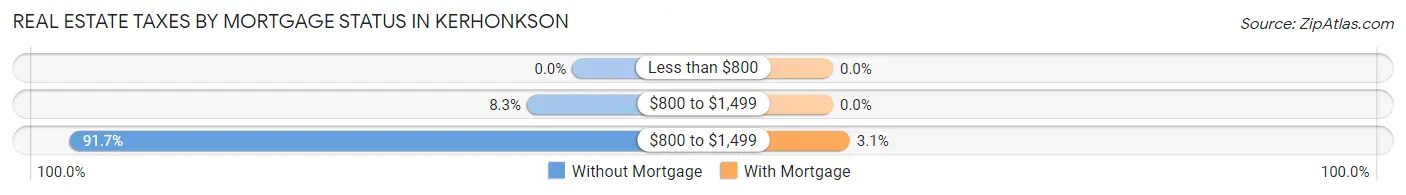
| Property Taxes | Without Mortgage | With Mortgage |
| Less than $800 | 0 (0.0%) | 0 (0.0%) |
| $800 to $1,499 | 11 (8.3%) | 0 (0.0%) |
| $800 to $1,499 | 122 (91.7%) | 9 (3.1%) |
| Total | 133 (100.0%) | 292 (100.0%) |
Health & Disability in Kerhonkson
Health Insurance Coverage by Age in Kerhonkson
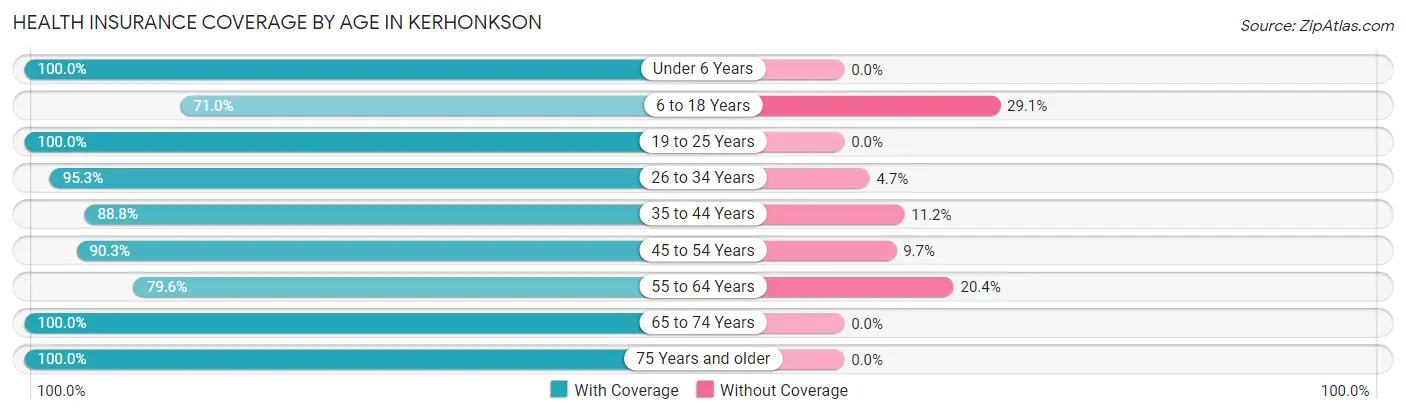
| Age Bracket | With Coverage | Without Coverage |
| Under 6 Years | 210 (100.0%) | 0 (0.0%) |
| 6 to 18 Years | 298 (71.0%) | 122 (29.0%) |
| 19 to 25 Years | 304 (100.0%) | 0 (0.0%) |
| 26 to 34 Years | 304 (95.3%) | 15 (4.7%) |
| 35 to 44 Years | 111 (88.8%) | 14 (11.2%) |
| 45 to 54 Years | 140 (90.3%) | 15 (9.7%) |
| 55 to 64 Years | 254 (79.6%) | 65 (20.4%) |
| 65 to 74 Years | 142 (100.0%) | 0 (0.0%) |
| 75 Years and older | 44 (100.0%) | 0 (0.0%) |
| Total | 1,807 (88.7%) | 231 (11.3%) |
Health Insurance Coverage by Citizenship Status in Kerhonkson
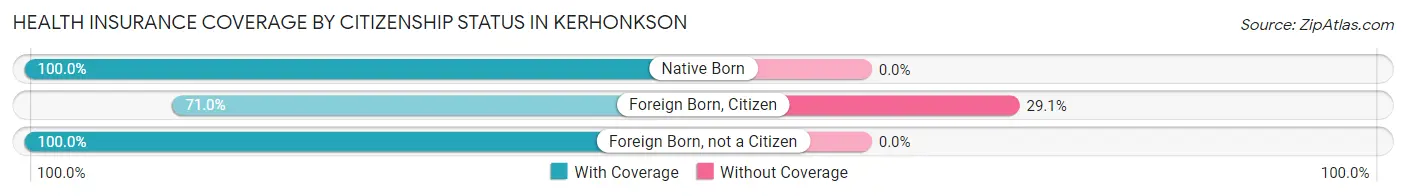
| Citizenship Status | With Coverage | Without Coverage |
| Native Born | 210 (100.0%) | 0 (0.0%) |
| Foreign Born, Citizen | 298 (71.0%) | 122 (29.0%) |
| Foreign Born, not a Citizen | 304 (100.0%) | 0 (0.0%) |
Health Insurance Coverage by Household Income in Kerhonkson
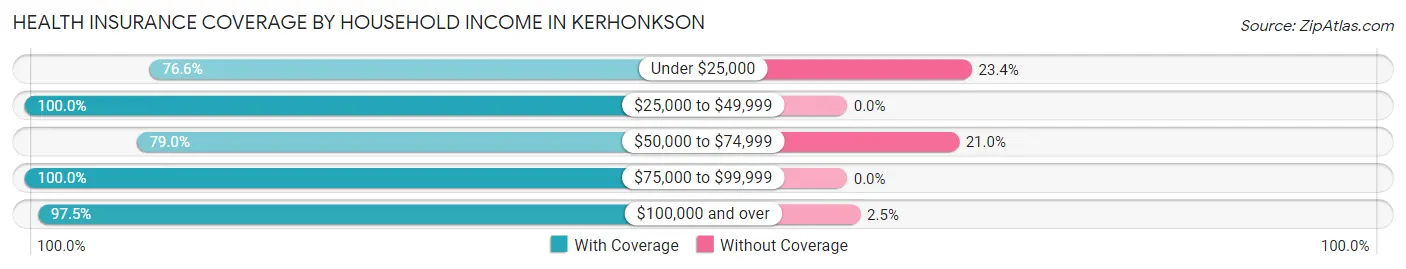
| Household Income | With Coverage | Without Coverage |
| Under $25,000 | 213 (76.6%) | 65 (23.4%) |
| $25,000 to $49,999 | 71 (100.0%) | 0 (0.0%) |
| $50,000 to $74,999 | 569 (79.0%) | 151 (21.0%) |
| $75,000 to $99,999 | 368 (100.0%) | 0 (0.0%) |
| $100,000 and over | 586 (97.5%) | 15 (2.5%) |
Public vs Private Health Insurance Coverage by Age in Kerhonkson
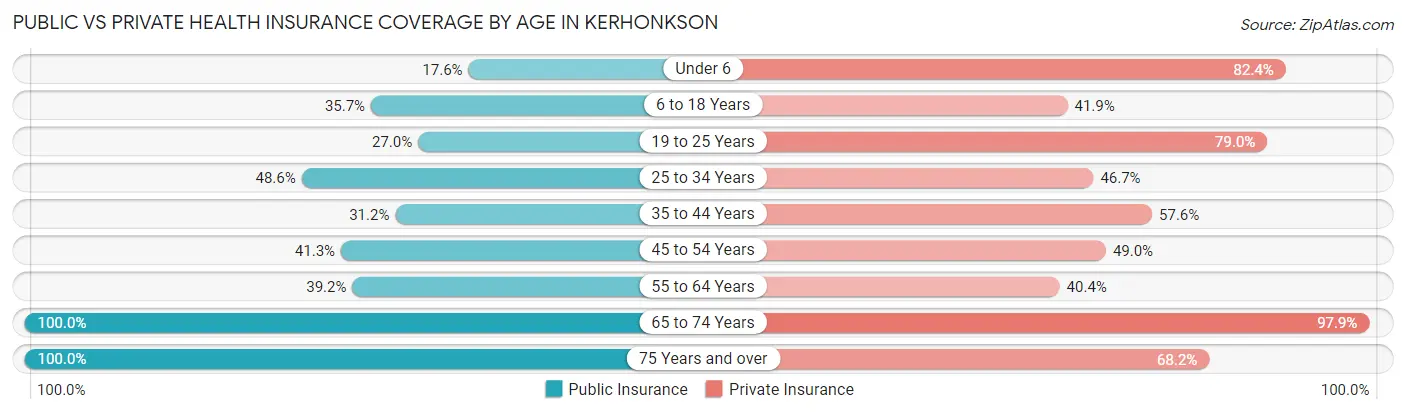
| Age Bracket | Public Insurance | Private Insurance |
| Under 6 | 37 (17.6%) | 173 (82.4%) |
| 6 to 18 Years | 150 (35.7%) | 176 (41.9%) |
| 19 to 25 Years | 82 (27.0%) | 240 (78.9%) |
| 25 to 34 Years | 155 (48.6%) | 149 (46.7%) |
| 35 to 44 Years | 39 (31.2%) | 72 (57.6%) |
| 45 to 54 Years | 64 (41.3%) | 76 (49.0%) |
| 55 to 64 Years | 125 (39.2%) | 129 (40.4%) |
| 65 to 74 Years | 142 (100.0%) | 139 (97.9%) |
| 75 Years and over | 44 (100.0%) | 30 (68.2%) |
| Total | 838 (41.1%) | 1,184 (58.1%) |
Disability Status by Sex by Age in Kerhonkson
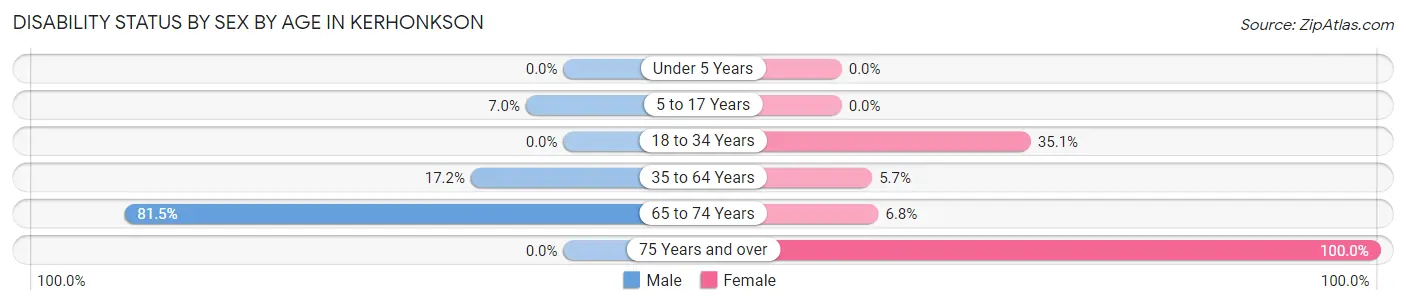
| Age Bracket | Male | Female |
| Under 5 Years | 0 (0.0%) | 0 (0.0%) |
| 5 to 17 Years | 14 (7.0%) | 0 (0.0%) |
| 18 to 34 Years | 0 (0.0%) | 119 (35.1%) |
| 35 to 64 Years | 39 (17.2%) | 21 (5.7%) |
| 65 to 74 Years | 44 (81.5%) | 6 (6.8%) |
| 75 Years and over | 0 (0.0%) | 24 (100.0%) |
Disability Class by Sex by Age in Kerhonkson
Disability Class: Hearing Difficulty
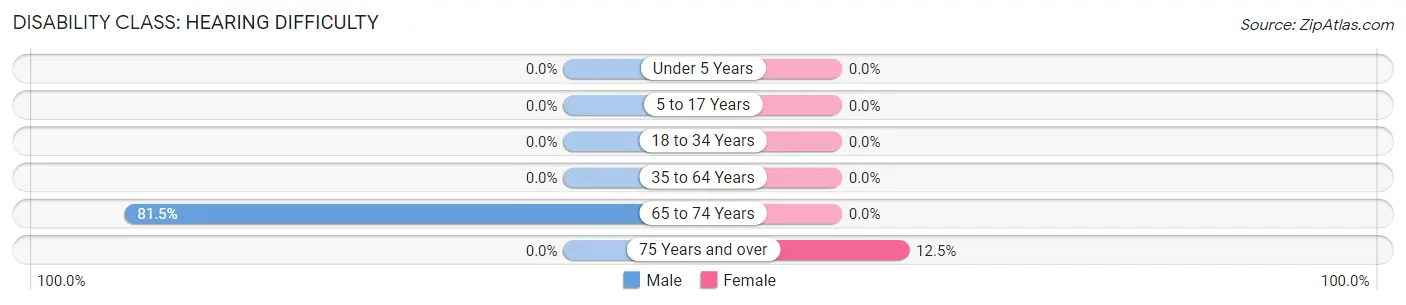
| Age Bracket | Male | Female |
| Under 5 Years | 0 (0.0%) | 0 (0.0%) |
| 5 to 17 Years | 0 (0.0%) | 0 (0.0%) |
| 18 to 34 Years | 0 (0.0%) | 0 (0.0%) |
| 35 to 64 Years | 0 (0.0%) | 0 (0.0%) |
| 65 to 74 Years | 44 (81.5%) | 0 (0.0%) |
| 75 Years and over | 0 (0.0%) | 3 (12.5%) |
Disability Class: Vision Difficulty
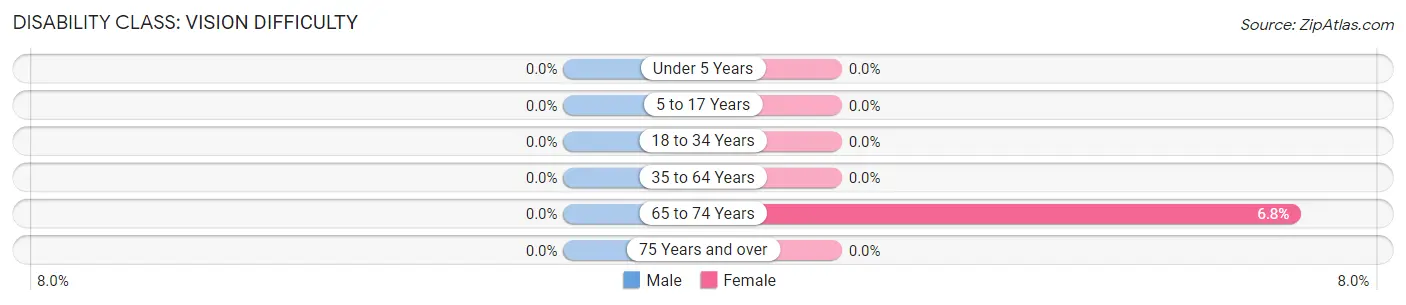
| Age Bracket | Male | Female |
| Under 5 Years | 0 (0.0%) | 0 (0.0%) |
| 5 to 17 Years | 0 (0.0%) | 0 (0.0%) |
| 18 to 34 Years | 0 (0.0%) | 0 (0.0%) |
| 35 to 64 Years | 0 (0.0%) | 0 (0.0%) |
| 65 to 74 Years | 0 (0.0%) | 6 (6.8%) |
| 75 Years and over | 0 (0.0%) | 0 (0.0%) |
Disability Class: Cognitive Difficulty
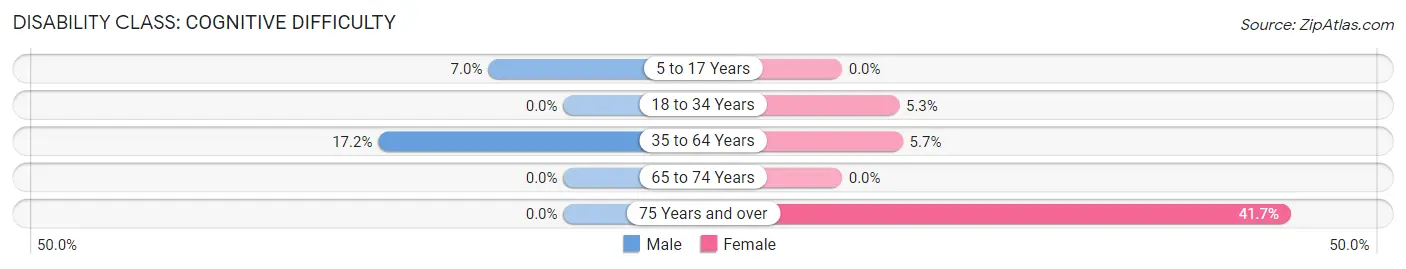
| Age Bracket | Male | Female |
| 5 to 17 Years | 14 (7.0%) | 0 (0.0%) |
| 18 to 34 Years | 0 (0.0%) | 18 (5.3%) |
| 35 to 64 Years | 39 (17.2%) | 21 (5.7%) |
| 65 to 74 Years | 0 (0.0%) | 0 (0.0%) |
| 75 Years and over | 0 (0.0%) | 10 (41.7%) |
Disability Class: Ambulatory Difficulty
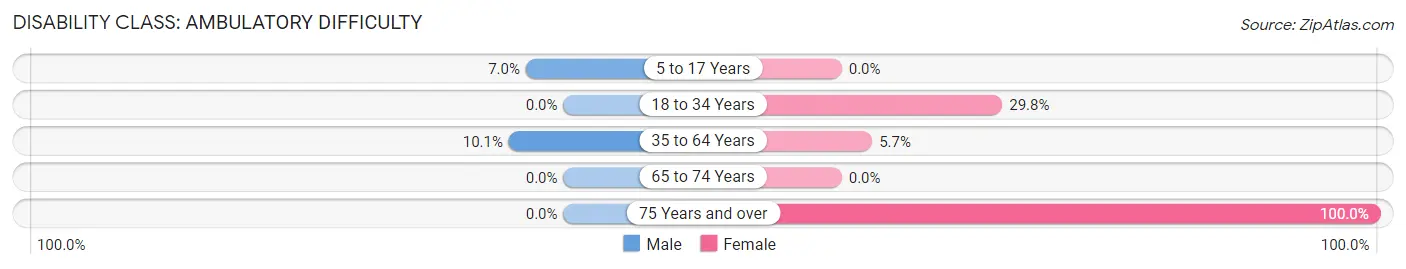
| Age Bracket | Male | Female |
| 5 to 17 Years | 14 (7.0%) | 0 (0.0%) |
| 18 to 34 Years | 0 (0.0%) | 101 (29.8%) |
| 35 to 64 Years | 23 (10.1%) | 21 (5.7%) |
| 65 to 74 Years | 0 (0.0%) | 0 (0.0%) |
| 75 Years and over | 0 (0.0%) | 24 (100.0%) |
Disability Class: Self-Care Difficulty
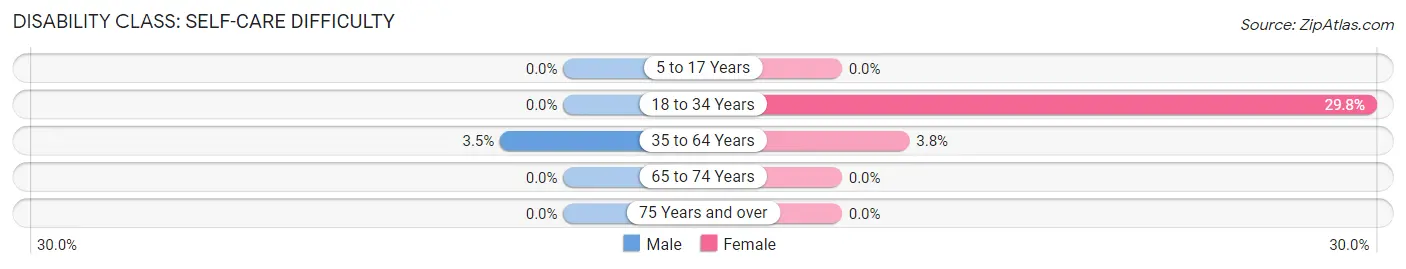
| Age Bracket | Male | Female |
| 5 to 17 Years | 0 (0.0%) | 0 (0.0%) |
| 18 to 34 Years | 0 (0.0%) | 101 (29.8%) |
| 35 to 64 Years | 8 (3.5%) | 14 (3.8%) |
| 65 to 74 Years | 0 (0.0%) | 0 (0.0%) |
| 75 Years and over | 0 (0.0%) | 0 (0.0%) |
Technology Access in Kerhonkson
Computing Device Access in Kerhonkson
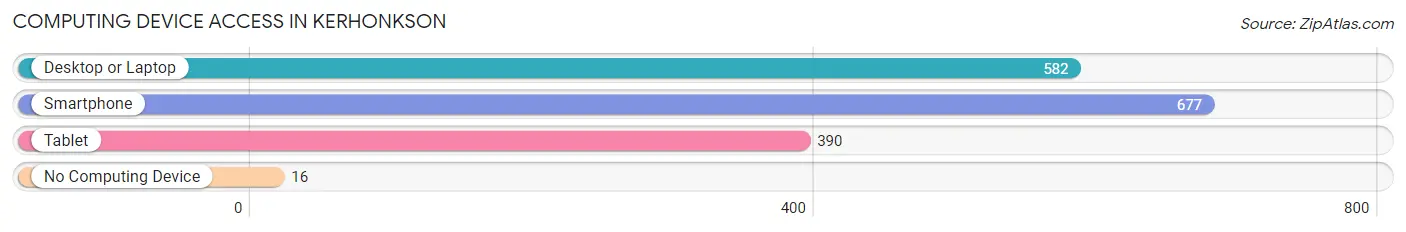
| Device Type | # Households | % Households |
| Desktop or Laptop | 582 | 77.2% |
| Smartphone | 677 | 89.8% |
| Tablet | 390 | 51.7% |
| No Computing Device | 16 | 2.1% |
| Total | 754 | 100.0% |
Internet Access in Kerhonkson
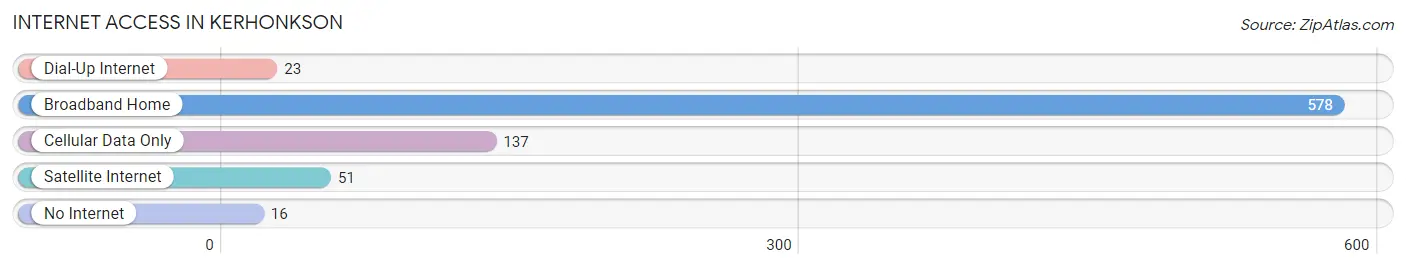
| Internet Type | # Households | % Households |
| Dial-Up Internet | 23 | 3.0% |
| Broadband Home | 578 | 76.7% |
| Cellular Data Only | 137 | 18.2% |
| Satellite Internet | 51 | 6.8% |
| No Internet | 16 | 2.1% |
| Total | 754 | 100.0% |
Kerhonkson Summary
Kerhonkson is a hamlet located in the town of Wawarsing in Ulster County, New York. It is situated in the foothills of the Shawangunk Mountains, and is part of the Hudson Valley region. The hamlet is located on the Rondout Creek, and is home to a population of approximately 1,500 people.
Geography
Kerhonkson is located in the foothills of the Shawangunk Mountains, and is part of the Hudson Valley region. The hamlet is located on the Rondout Creek, and is home to a population of approximately 1,500 people. The hamlet is situated in the town of Wawarsing, and is bordered by the towns of Rochester, Marbletown, and Shawangunk. The hamlet is located approximately 70 miles north of New York City, and is accessible via the New York State Thruway.
History
Kerhonkson was first settled in the late 1700s by Dutch and German immigrants. The hamlet was originally known as “Kerhonkson’s Corners”, and was named after the Kerhonkson family, who were among the first settlers in the area. The hamlet was officially incorporated in 1848, and was home to a variety of industries, including a grist mill, a saw mill, and a tannery.
In the late 1800s, the hamlet was home to a thriving agricultural industry, and was known for its production of apples, peaches, and other fruits. The hamlet was also home to a number of small businesses, including a general store, a blacksmith shop, and a post office.
Economy
Kerhonkson’s economy is largely based on tourism and agriculture. The hamlet is home to a number of small businesses, including restaurants, antique shops, and art galleries. The hamlet is also home to a number of farms, which produce a variety of fruits and vegetables.
The hamlet is also home to a number of wineries, which produce a variety of wines. The hamlet is also home to a number of bed and breakfasts, which cater to tourists visiting the area.
Demographics
As of the 2010 census, the population of Kerhonkson was 1,521. The racial makeup of the hamlet was 94.2% White, 1.2% African American, 0.3% Native American, 0.7% Asian, 0.1% Pacific Islander, 1.2% from other races, and 2.3% from two or more races. Hispanic or Latino of any race were 4.2% of the population.
The median household income in Kerhonkson was $50,972, and the median family income was $60,972. The per capita income for the hamlet was $25,972. About 8.2% of families and 10.2% of the population were below the poverty line, including 14.2% of those under age 18 and 5.2% of those age 65 or over.
Kerhonkson is a small hamlet located in the town of Wawarsing in Ulster County, New York. It is situated in the foothills of the Shawangunk Mountains, and is part of the Hudson Valley region. The hamlet is located on the Rondout Creek, and is home to a population of approximately 1,500 people. The hamlet’s economy is largely based on tourism and agriculture, and is home to a number of small businesses, farms, wineries, and bed and breakfasts. The hamlet’s population is largely white, with a small percentage of African American, Native American, Asian, and Pacific Islander residents. The median household income in Kerhonkson is $50,972, and the median family income is $60,972.
Common Questions
What is Per Capita Income in Kerhonkson?
Per Capita income in Kerhonkson is $26,081.
What is the Median Family Income in Kerhonkson?
Median Family Income in Kerhonkson is $66,588.
What is the Median Household income in Kerhonkson?
Median Household Income in Kerhonkson is $68,500.
What is Inequality or Gini Index in Kerhonkson?
Inequality or Gini Index in Kerhonkson is 0.45.
What is the Total Population of Kerhonkson?
Total Population of Kerhonkson is 2,038.
What is the Total Male Population of Kerhonkson?
Total Male Population of Kerhonkson is 979.
What is the Total Female Population of Kerhonkson?
Total Female Population of Kerhonkson is 1,059.
What is the Ratio of Males per 100 Females in Kerhonkson?
There are 92.45 Males per 100 Females in Kerhonkson.
What is the Ratio of Females per 100 Males in Kerhonkson?
There are 108.17 Females per 100 Males in Kerhonkson.
What is the Median Population Age in Kerhonkson?
Median Population Age in Kerhonkson is 30.2 Years.
What is the Average Family Size in Kerhonkson
Average Family Size in Kerhonkson is 3.2 People.
What is the Average Household Size in Kerhonkson
Average Household Size in Kerhonkson is 2.7 People.
How Large is the Labor Force in Kerhonkson?
There are 1,101 People in the Labor Forcein in Kerhonkson.
What is the Percentage of People in the Labor Force in Kerhonkson?
68.9% of People are in the Labor Force in Kerhonkson.
What is the Unemployment Rate in Kerhonkson?
Unemployment Rate in Kerhonkson is 8.3%.