Richfield Springs, NY Map & Demographics
Richfield Springs Map
Richfield Springs Overview
$27,504
PER CAPITA INCOME
$54,821
AVG FAMILY INCOME
$54,643
AVG HOUSEHOLD INCOME
26.4%
WAGE / INCOME GAP [ % ]
73.6¢/ $1
WAGE / INCOME GAP [ $ ]
0.41
INEQUALITY / GINI INDEX
1,240
TOTAL POPULATION
629
MALE POPULATION
611
FEMALE POPULATION
102.95
MALES / 100 FEMALES
97.14
FEMALES / 100 MALES
33.7
MEDIAN AGE
3.6
AVG FAMILY SIZE
3.2
AVG HOUSEHOLD SIZE
585
LABOR FORCE [ PEOPLE ]
59.5%
PERCENT IN LABOR FORCE
1.4%
UNEMPLOYMENT RATE
Richfield Springs Zip Codes
Richfield Springs Area Codes
Income in Richfield Springs
Income Overview in Richfield Springs
Per Capita Income in Richfield Springs is $27,504, while median incomes of families and households are $54,821 and $54,643 respectively.
| Characteristic | Number | Measure |
| Per Capita Income | 1,240 | $27,504 |
| Median Family Income | 264 | $54,821 |
| Mean Family Income | 264 | $81,271 |
| Median Household Income | 380 | $54,643 |
| Mean Household Income | 380 | $77,144 |
| Income Deficit | 264 | $0 |
| Wage / Income Gap (%) | 1,240 | 26.36% |
| Wage / Income Gap ($) | 1,240 | 73.64¢ per $1 |
| Gini / Inequality Index | 1,240 | 0.41 |
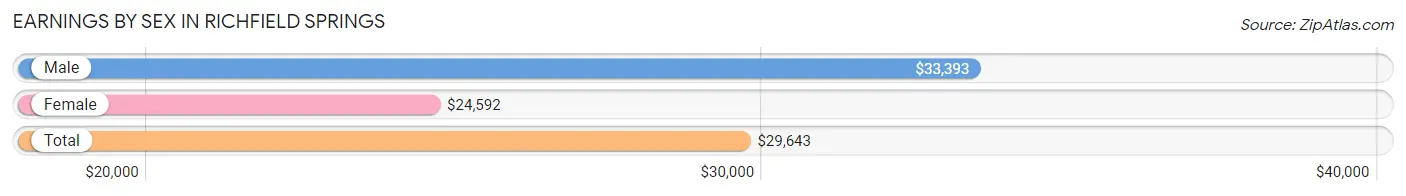
Earnings by Sex in Richfield Springs
Average Earnings in Richfield Springs are $29,643, $33,393 for men and $24,592 for women, a difference of 26.4%.
| Sex | Number | Average Earnings |
| Male | 335 (50.6%) | $33,393 |
| Female | 327 (49.4%) | $24,592 |
| Total | 662 (100.0%) | $29,643 |
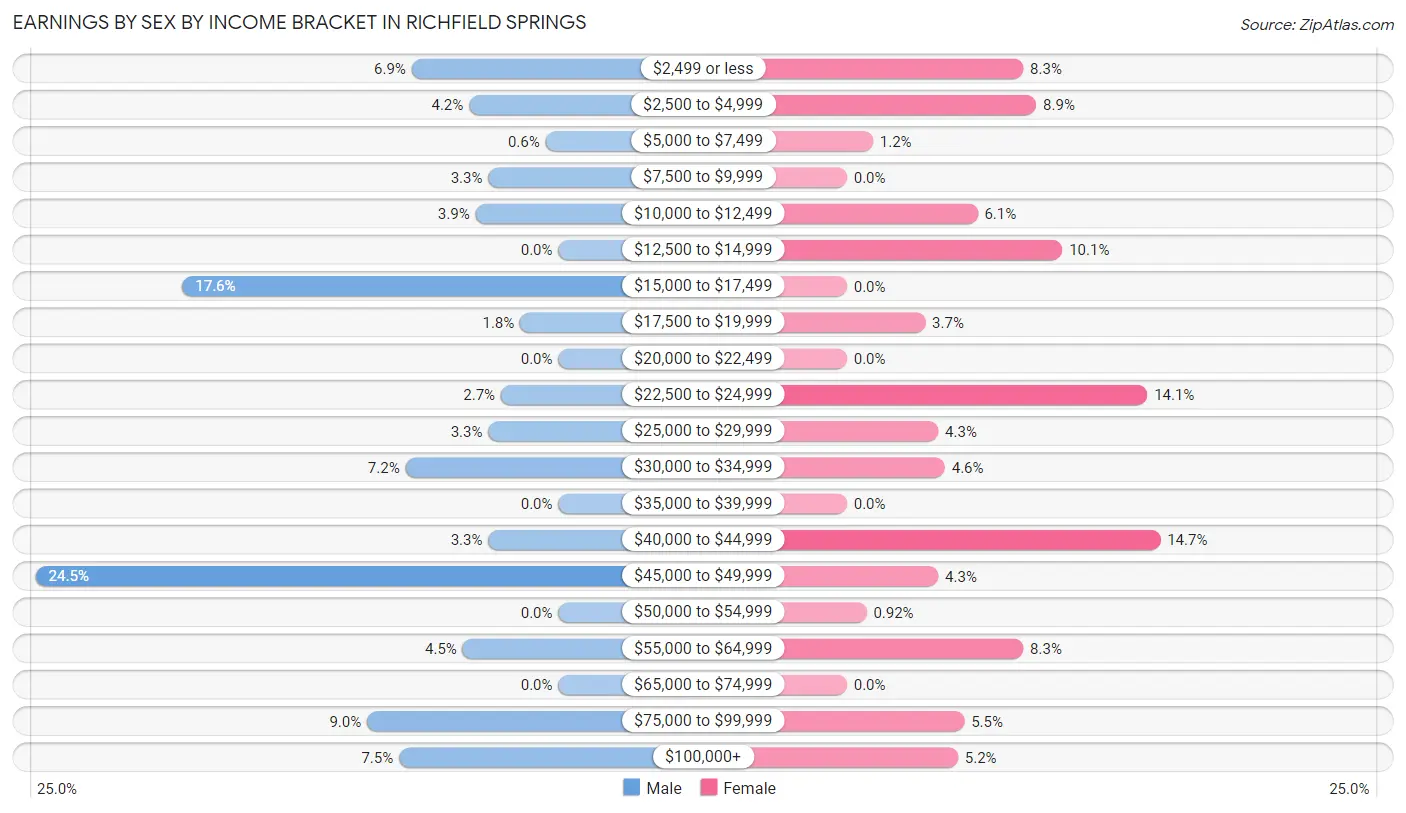
Earnings by Sex by Income Bracket in Richfield Springs
The most common earnings brackets in Richfield Springs are $45,000 to $49,999 for men (82 | 24.5%) and $40,000 to $44,999 for women (48 | 14.7%).
| Income | Male | Female |
| $2,499 or less | 23 (6.9%) | 27 (8.3%) |
| $2,500 to $4,999 | 14 (4.2%) | 29 (8.9%) |
| $5,000 to $7,499 | 2 (0.6%) | 4 (1.2%) |
| $7,500 to $9,999 | 11 (3.3%) | 0 (0.0%) |
| $10,000 to $12,499 | 13 (3.9%) | 20 (6.1%) |
| $12,500 to $14,999 | 0 (0.0%) | 33 (10.1%) |
| $15,000 to $17,499 | 59 (17.6%) | 0 (0.0%) |
| $17,500 to $19,999 | 6 (1.8%) | 12 (3.7%) |
| $20,000 to $22,499 | 0 (0.0%) | 0 (0.0%) |
| $22,500 to $24,999 | 9 (2.7%) | 46 (14.1%) |
| $25,000 to $29,999 | 11 (3.3%) | 14 (4.3%) |
| $30,000 to $34,999 | 24 (7.2%) | 15 (4.6%) |
| $35,000 to $39,999 | 0 (0.0%) | 0 (0.0%) |
| $40,000 to $44,999 | 11 (3.3%) | 48 (14.7%) |
| $45,000 to $49,999 | 82 (24.5%) | 14 (4.3%) |
| $50,000 to $54,999 | 0 (0.0%) | 3 (0.9%) |
| $55,000 to $64,999 | 15 (4.5%) | 27 (8.3%) |
| $65,000 to $74,999 | 0 (0.0%) | 0 (0.0%) |
| $75,000 to $99,999 | 30 (9.0%) | 18 (5.5%) |
| $100,000+ | 25 (7.5%) | 17 (5.2%) |
| Total | 335 (100.0%) | 327 (100.0%) |
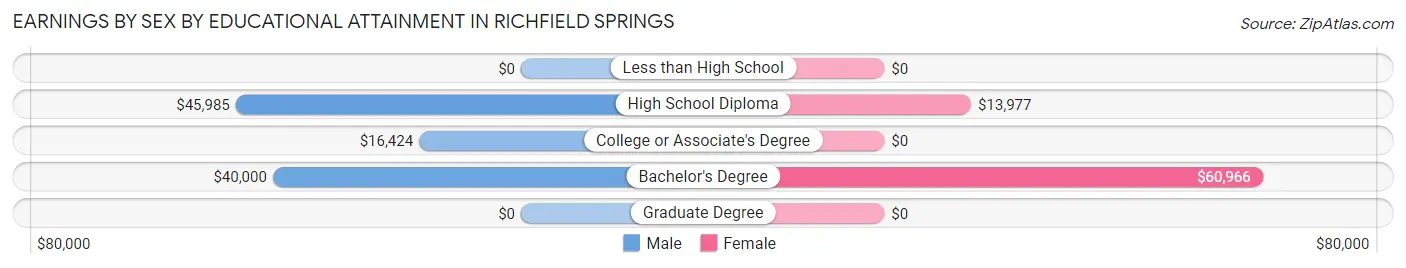
Earnings by Sex by Educational Attainment in Richfield Springs
Average earnings in Richfield Springs are $34,464 for men and $30,156 for women, a difference of 12.5%. Men with an educational attainment of high school diploma enjoy the highest average annual earnings of $45,985, while those with college or associate's degree education earn the least with $16,424. Women with an educational attainment of bachelor's degree earn the most with the average annual earnings of $60,966, while those with high school diploma education have the smallest earnings of $13,977.
| Educational Attainment | Male Income | Female Income |
| Less than High School | - | - |
| High School Diploma | $45,985 | $13,977 |
| College or Associate's Degree | $16,424 | $0 |
| Bachelor's Degree | $40,000 | $60,966 |
| Graduate Degree | - | - |
| Total | $34,464 | $30,156 |
Family Income in Richfield Springs
Family Income Brackets in Richfield Springs
According to the Richfield Springs family income data, there are 55 families falling into the $35,000 to $49,999 income range, which is the most common income bracket and makes up 20.8% of all families.
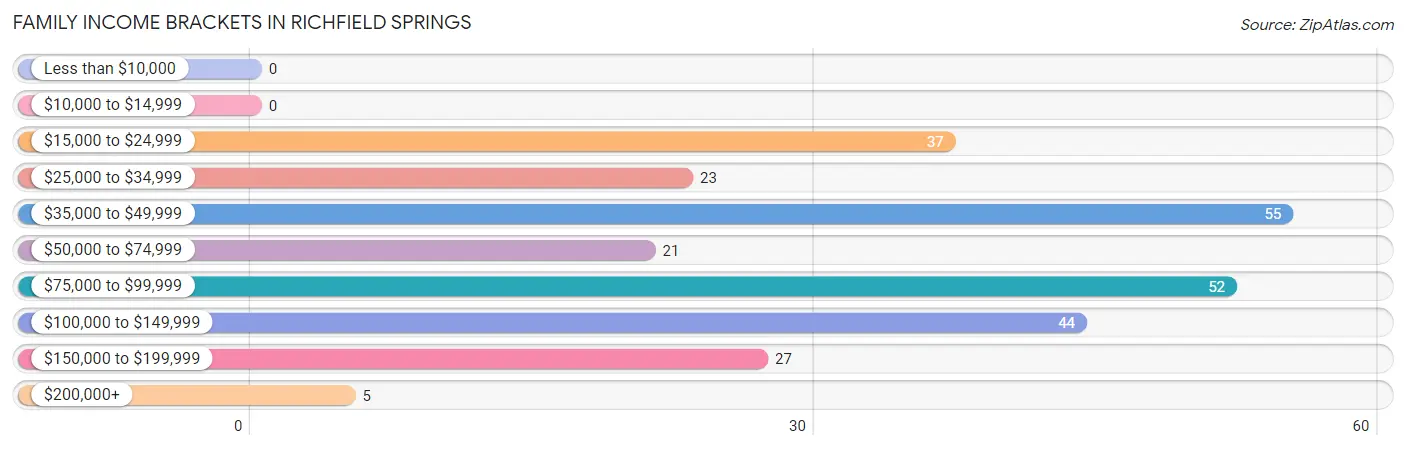
| Income Bracket | # Families | % Families |
| Less than $10,000 | 0 | 0.0% |
| $10,000 to $14,999 | 0 | 0.0% |
| $15,000 to $24,999 | 37 | 14.0% |
| $25,000 to $34,999 | 23 | 8.7% |
| $35,000 to $49,999 | 55 | 20.8% |
| $50,000 to $74,999 | 21 | 8.0% |
| $75,000 to $99,999 | 52 | 19.7% |
| $100,000 to $149,999 | 44 | 16.7% |
| $150,000 to $199,999 | 27 | 10.2% |
| $200,000+ | 5 | 1.9% |
Family Income by Famaliy Size in Richfield Springs
3-person families (59 | 22.4%) account for the highest median family income in Richfield Springs with $145,089 per family, while 3-person families (59 | 22.4%) have the highest median income of $48,363 per family member.
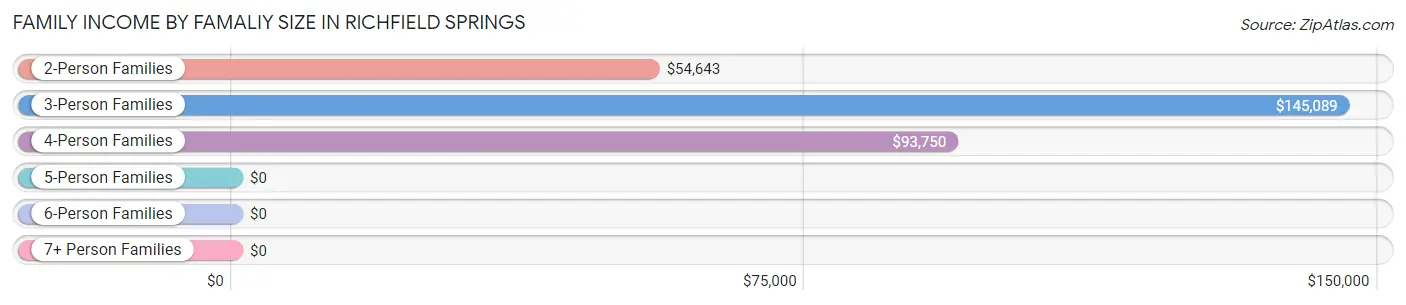
| Income Bracket | # Families | Median Income |
| 2-Person Families | 130 (49.2%) | $54,643 |
| 3-Person Families | 59 (22.4%) | $145,089 |
| 4-Person Families | 22 (8.3%) | $93,750 |
| 5-Person Families | 15 (5.7%) | $0 |
| 6-Person Families | 3 (1.1%) | $0 |
| 7+ Person Families | 35 (13.3%) | $0 |
| Total | 264 (100.0%) | $54,821 |
Family Income by Number of Earners in Richfield Springs
The median family income in Richfield Springs is $54,821, with families comprising 3+ earners (21) having the highest median family income of $163,672, while families with 1 earner (119) have the lowest median family income of $41,827, accounting for 8.0% and 45.1% of families, respectively.
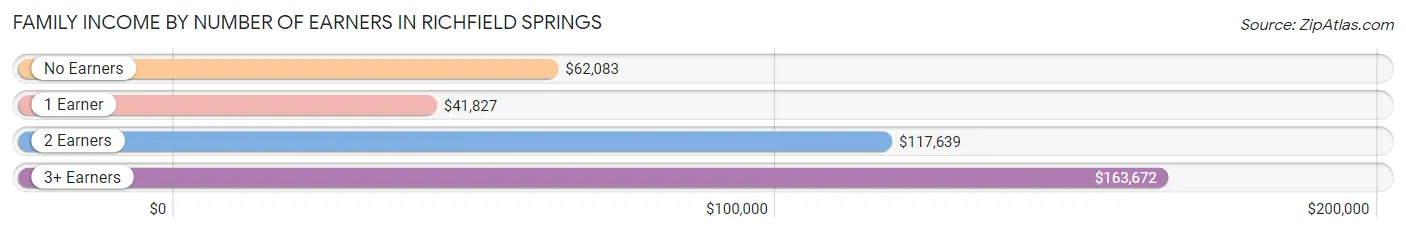
| Number of Earners | # Families | Median Income |
| No Earners | 41 (15.5%) | $62,083 |
| 1 Earner | 119 (45.1%) | $41,827 |
| 2 Earners | 83 (31.4%) | $117,639 |
| 3+ Earners | 21 (8.0%) | $163,672 |
| Total | 264 (100.0%) | $54,821 |
Household Income in Richfield Springs
Household Income Brackets in Richfield Springs
With 76 households falling in the category, the $15,000 to $24,999 income range is the most frequent in Richfield Springs, accounting for 20.0% of all households.
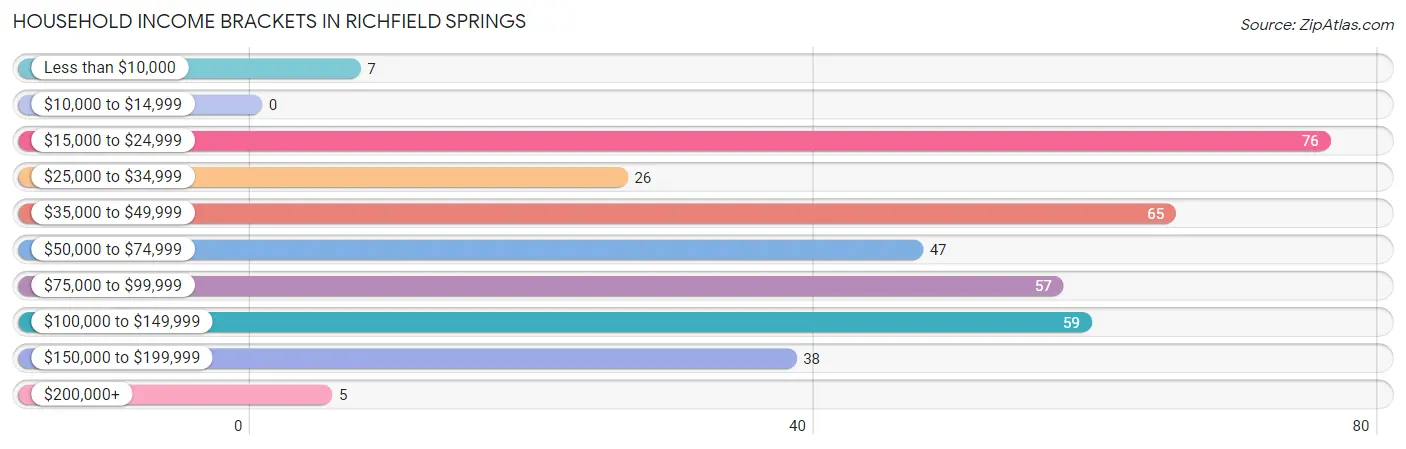
| Income Bracket | # Households | % Households |
| Less than $10,000 | 7 | 1.8% |
| $10,000 to $14,999 | 0 | 0.0% |
| $15,000 to $24,999 | 76 | 20.0% |
| $25,000 to $34,999 | 26 | 6.8% |
| $35,000 to $49,999 | 65 | 17.1% |
| $50,000 to $74,999 | 47 | 12.4% |
| $75,000 to $99,999 | 57 | 15.0% |
| $100,000 to $149,999 | 59 | 15.5% |
| $150,000 to $199,999 | 38 | 10.0% |
| $200,000+ | 5 | 1.3% |
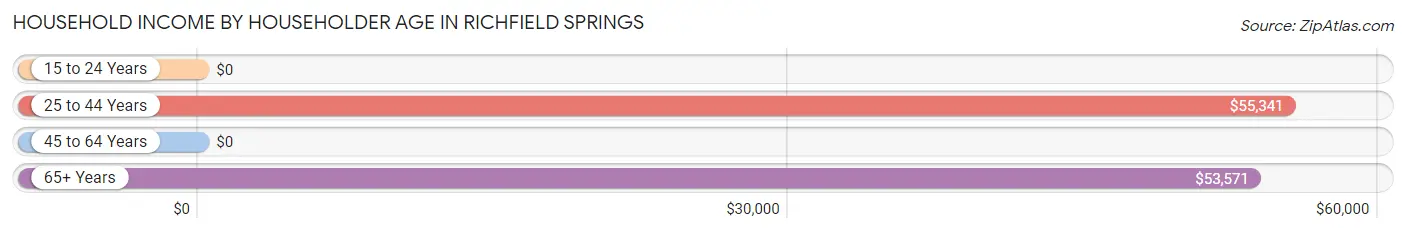
Household Income by Householder Age in Richfield Springs
The median household income in Richfield Springs is $54,643, with the highest median household income of $55,341 found in the 25 to 44 years age bracket for the primary householder. A total of 131 households (34.5%) fall into this category.
| Income Bracket | # Households | Median Income |
| 15 to 24 Years | 0 (0.0%) | $0 |
| 25 to 44 Years | 131 (34.5%) | $55,341 |
| 45 to 64 Years | 121 (31.8%) | $0 |
| 65+ Years | 128 (33.7%) | $53,571 |
| Total | 380 (100.0%) | $54,643 |
Poverty in Richfield Springs
Income Below Poverty by Sex and Age in Richfield Springs
With 25.3% poverty level for males and 25.7% for females among the residents of Richfield Springs, 16 and 17 year old males and 15 year old females are the most vulnerable to poverty, with 35 males (89.7%) and 12 females (100.0%) in their respective age groups living below the poverty level.
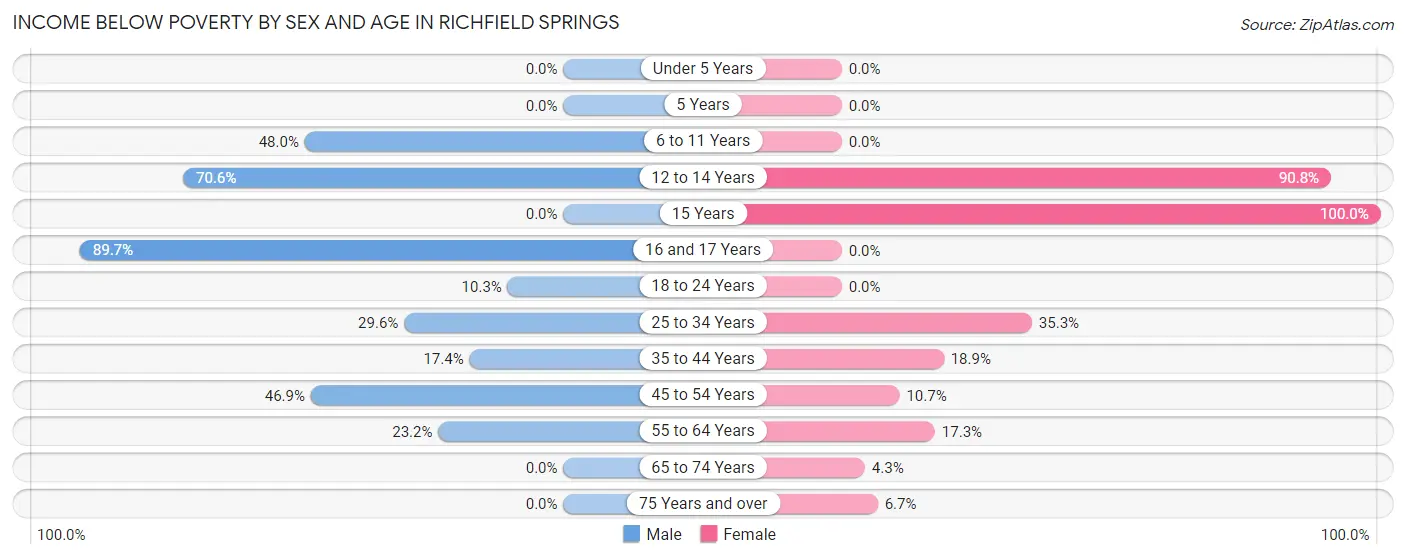
| Age Bracket | Male | Female |
| Under 5 Years | 0 (0.0%) | 0 (0.0%) |
| 5 Years | 0 (0.0%) | 0 (0.0%) |
| 6 to 11 Years | 24 (48.0%) | 0 (0.0%) |
| 12 to 14 Years | 24 (70.6%) | 69 (90.8%) |
| 15 Years | 0 (0.0%) | 12 (100.0%) |
| 16 and 17 Years | 35 (89.7%) | 0 (0.0%) |
| 18 to 24 Years | 12 (10.3%) | 0 (0.0%) |
| 25 to 34 Years | 13 (29.5%) | 42 (35.3%) |
| 35 to 44 Years | 23 (17.4%) | 7 (18.9%) |
| 45 to 54 Years | 15 (46.9%) | 6 (10.7%) |
| 55 to 64 Years | 13 (23.2%) | 14 (17.3%) |
| 65 to 74 Years | 0 (0.0%) | 3 (4.3%) |
| 75 Years and over | 0 (0.0%) | 4 (6.7%) |
| Total | 159 (25.3%) | 157 (25.7%) |
Income Above Poverty by Sex and Age in Richfield Springs
According to the poverty statistics in Richfield Springs, males aged under 5 years and females aged under 5 years are the age groups that are most secure financially, with 100.0% of males and 100.0% of females in these age groups living above the poverty line.
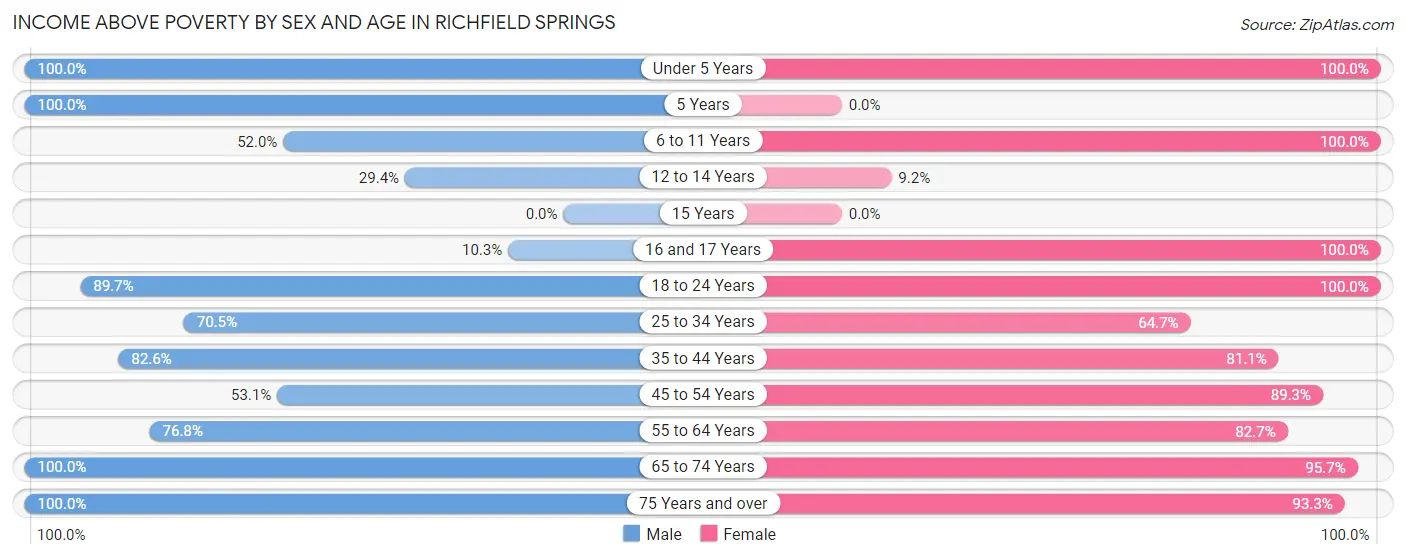
| Age Bracket | Male | Female |
| Under 5 Years | 46 (100.0%) | 22 (100.0%) |
| 5 Years | 10 (100.0%) | 0 (0.0%) |
| 6 to 11 Years | 26 (52.0%) | 7 (100.0%) |
| 12 to 14 Years | 10 (29.4%) | 7 (9.2%) |
| 15 Years | 0 (0.0%) | 0 (0.0%) |
| 16 and 17 Years | 4 (10.3%) | 29 (100.0%) |
| 18 to 24 Years | 104 (89.7%) | 42 (100.0%) |
| 25 to 34 Years | 31 (70.5%) | 77 (64.7%) |
| 35 to 44 Years | 109 (82.6%) | 30 (81.1%) |
| 45 to 54 Years | 17 (53.1%) | 50 (89.3%) |
| 55 to 64 Years | 43 (76.8%) | 67 (82.7%) |
| 65 to 74 Years | 28 (100.0%) | 67 (95.7%) |
| 75 Years and over | 42 (100.0%) | 56 (93.3%) |
| Total | 470 (74.7%) | 454 (74.3%) |
Income Below Poverty Among Married-Couple Families in Richfield Springs
The poverty statistics for married-couple families in Richfield Springs show that 1.5% or 2 of the total 131 families live below the poverty line. Families with 1 or 2 children have the highest poverty rate of 5.9%, comprising of 2 families. On the other hand, families with no children have the lowest poverty rate of 0.0%, which includes 0 families.
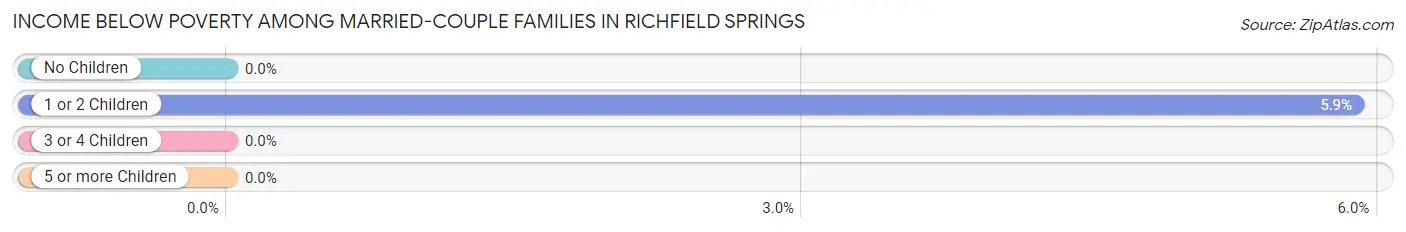
| Children | Above Poverty | Below Poverty |
| No Children | 89 (100.0%) | 0 (0.0%) |
| 1 or 2 Children | 32 (94.1%) | 2 (5.9%) |
| 3 or 4 Children | 0 (0.0%) | 0 (0.0%) |
| 5 or more Children | 8 (100.0%) | 0 (0.0%) |
| Total | 129 (98.5%) | 2 (1.5%) |
Income Below Poverty Among Single-Parent Households in Richfield Springs
According to the poverty data in Richfield Springs, 54.2% or 13 single-father households and 24.8% or 27 single-mother households are living below the poverty line. Among single-father households, those with 3 or 4 children have the highest poverty rate, with 13 households (100.0%) experiencing poverty. Likewise, among single-mother households, those with 5 or more children have the highest poverty rate, with 24 households (100.0%) falling below the poverty line.
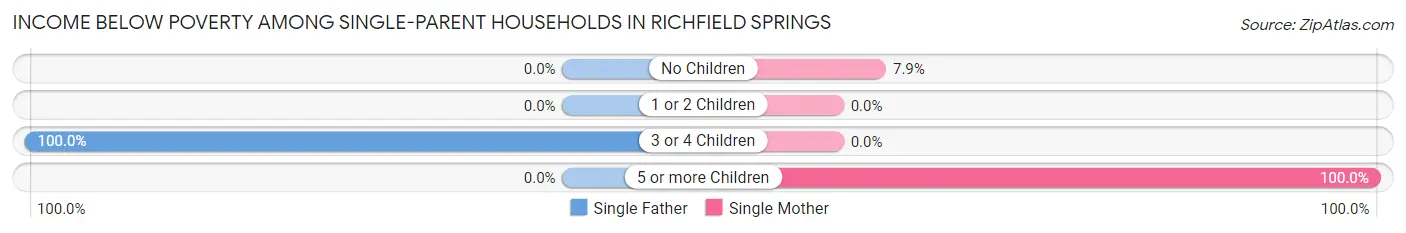
| Children | Single Father | Single Mother |
| No Children | 0 (0.0%) | 3 (7.9%) |
| 1 or 2 Children | 0 (0.0%) | 0 (0.0%) |
| 3 or 4 Children | 13 (100.0%) | 0 (0.0%) |
| 5 or more Children | 0 (0.0%) | 24 (100.0%) |
| Total | 13 (54.2%) | 27 (24.8%) |
Income Below Poverty Among Married-Couple vs Single-Parent Households in Richfield Springs
The poverty data for Richfield Springs shows that 2 of the married-couple family households (1.5%) and 40 of the single-parent households (30.1%) are living below the poverty level. Within the married-couple family households, those with 1 or 2 children have the highest poverty rate, with 2 households (5.9%) falling below the poverty line. Among the single-parent households, those with 5 or more children have the highest poverty rate, with 24 household (88.9%) living below poverty.
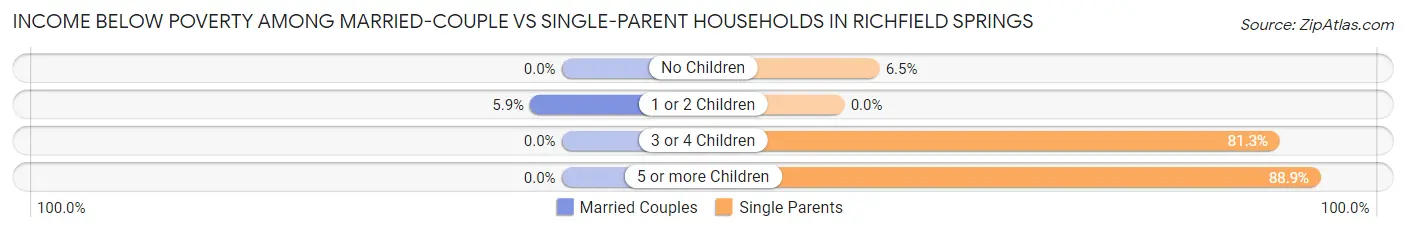
| Children | Married-Couple Families | Single-Parent Households |
| No Children | 0 (0.0%) | 3 (6.5%) |
| 1 or 2 Children | 2 (5.9%) | 0 (0.0%) |
| 3 or 4 Children | 0 (0.0%) | 13 (81.2%) |
| 5 or more Children | 0 (0.0%) | 24 (88.9%) |
| Total | 2 (1.5%) | 40 (30.1%) |
Race in Richfield Springs
The most populous races in Richfield Springs are White / Caucasian (1,173 | 94.6%), Hispanic or Latino (74 | 6.0%), and Two or more Races (47 | 3.8%).
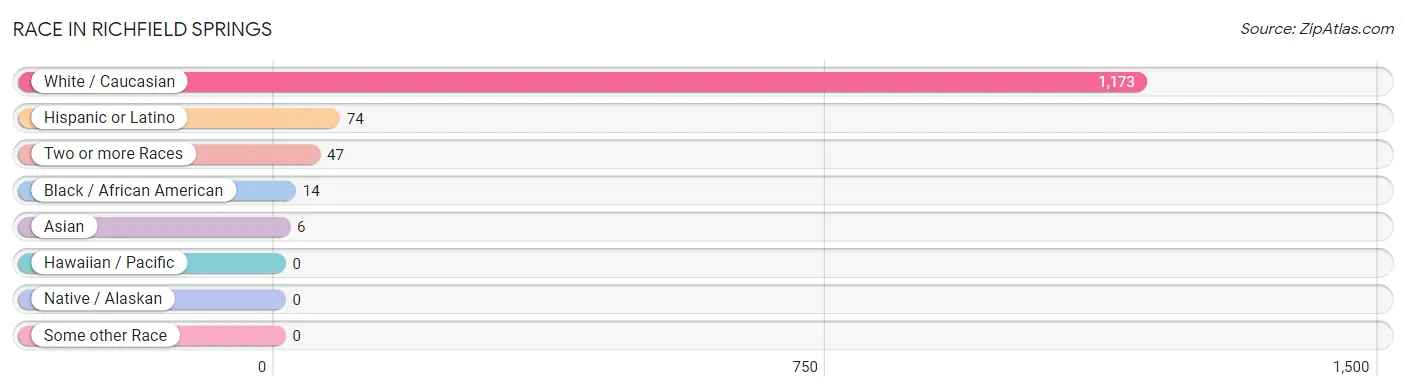
| Race | # Population | % Population |
| Asian | 6 | 0.5% |
| Black / African American | 14 | 1.1% |
| Hawaiian / Pacific | 0 | 0.0% |
| Hispanic or Latino | 74 | 6.0% |
| Native / Alaskan | 0 | 0.0% |
| White / Caucasian | 1,173 | 94.6% |
| Two or more Races | 47 | 3.8% |
| Some other Race | 0 | 0.0% |
| Total | 1,240 | 100.0% |
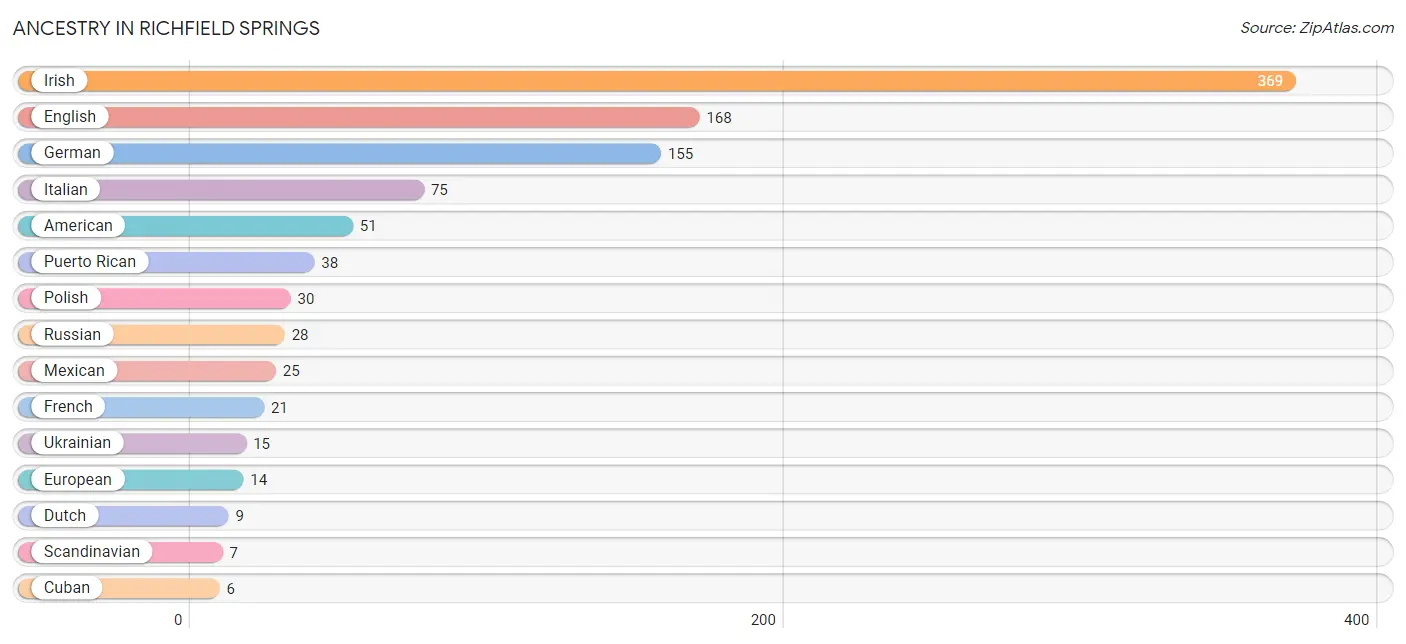
Ancestry in Richfield Springs
The most populous ancestries reported in Richfield Springs are Irish (369 | 29.8%), English (168 | 13.6%), German (155 | 12.5%), Italian (75 | 6.0%), and American (51 | 4.1%), together accounting for 66.0% of all Richfield Springs residents.
| Ancestry | # Population | % Population |
| American | 51 | 4.1% |
| Cherokee | 1 | 0.1% |
| Cuban | 6 | 0.5% |
| Czechoslovakian | 3 | 0.2% |
| Danish | 6 | 0.5% |
| Dutch | 9 | 0.7% |
| Eastern European | 1 | 0.1% |
| Ecuadorian | 2 | 0.2% |
| English | 168 | 13.6% |
| European | 14 | 1.1% |
| French | 21 | 1.7% |
| German | 155 | 12.5% |
| Indian (Asian) | 6 | 0.5% |
| Irish | 369 | 29.8% |
| Italian | 75 | 6.0% |
| Mexican | 25 | 2.0% |
| Pennsylvania German | 5 | 0.4% |
| Polish | 30 | 2.4% |
| Puerto Rican | 38 | 3.1% |
| Romanian | 5 | 0.4% |
| Russian | 28 | 2.3% |
| Scandinavian | 7 | 0.6% |
| Scottish | 5 | 0.4% |
| Sioux | 1 | 0.1% |
| Slavic | 2 | 0.2% |
| Slovak | 5 | 0.4% |
| South American | 2 | 0.2% |
| Spanish | 3 | 0.2% |
| Swedish | 6 | 0.5% |
| Ukrainian | 15 | 1.2% |
| West Indian | 6 | 0.5% | View All 31 Rows |
Immigrants in Richfield Springs
The most numerous immigrant groups reported in Richfield Springs came from Eastern Europe (11 | 0.9%), Europe (11 | 0.9%), Asia (6 | 0.5%), Belarus (6 | 0.5%), and China (6 | 0.5%), together accounting for 3.2% of all Richfield Springs residents.
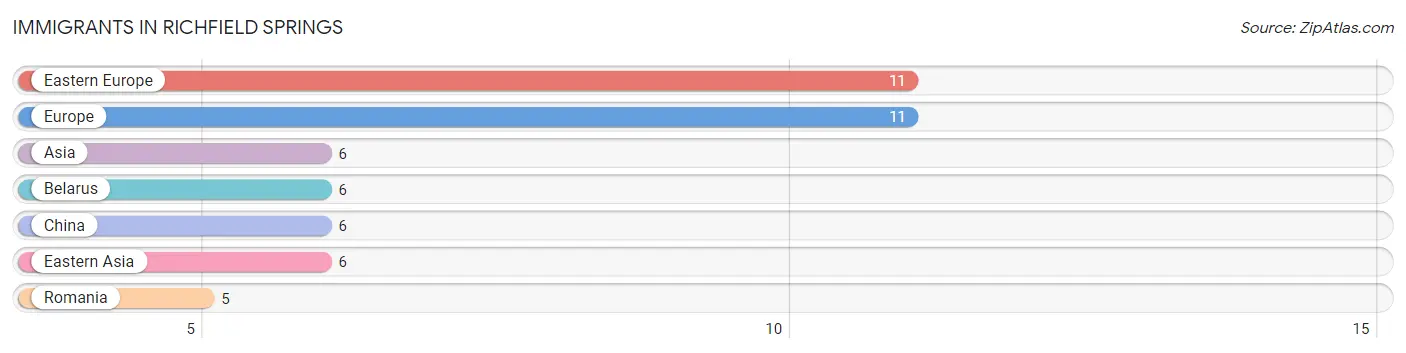
| Immigration Origin | # Population | % Population |
| Asia | 6 | 0.5% |
| Belarus | 6 | 0.5% |
| China | 6 | 0.5% |
| Eastern Asia | 6 | 0.5% |
| Eastern Europe | 11 | 0.9% |
| Europe | 11 | 0.9% |
| Romania | 5 | 0.4% | View All 7 Rows |
Sex and Age in Richfield Springs
Sex and Age in Richfield Springs
The most populous age groups in Richfield Springs are 35 to 39 Years (89 | 14.1%) for men and 30 to 34 Years (90 | 14.7%) for women.
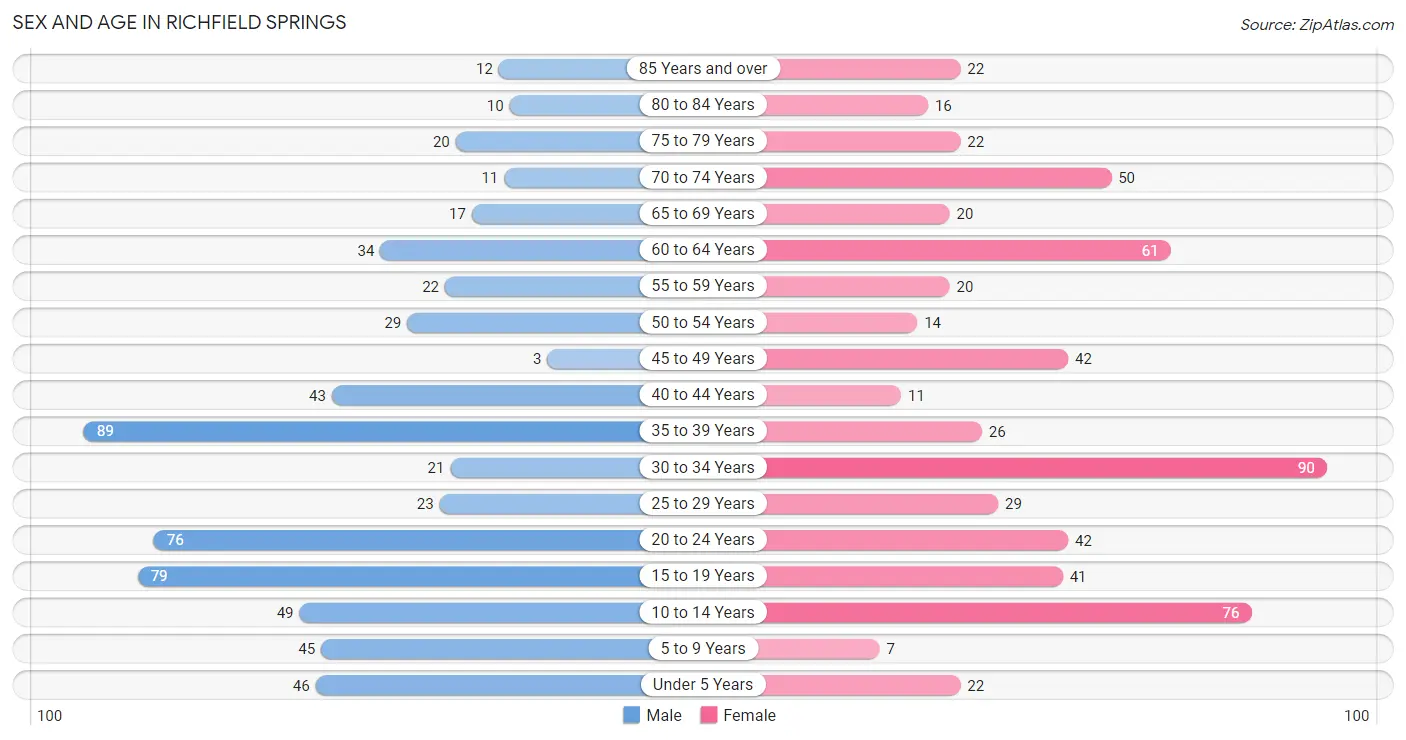
| Age Bracket | Male | Female |
| Under 5 Years | 46 (7.3%) | 22 (3.6%) |
| 5 to 9 Years | 45 (7.1%) | 7 (1.1%) |
| 10 to 14 Years | 49 (7.8%) | 76 (12.4%) |
| 15 to 19 Years | 79 (12.6%) | 41 (6.7%) |
| 20 to 24 Years | 76 (12.1%) | 42 (6.9%) |
| 25 to 29 Years | 23 (3.7%) | 29 (4.8%) |
| 30 to 34 Years | 21 (3.3%) | 90 (14.7%) |
| 35 to 39 Years | 89 (14.1%) | 26 (4.3%) |
| 40 to 44 Years | 43 (6.8%) | 11 (1.8%) |
| 45 to 49 Years | 3 (0.5%) | 42 (6.9%) |
| 50 to 54 Years | 29 (4.6%) | 14 (2.3%) |
| 55 to 59 Years | 22 (3.5%) | 20 (3.3%) |
| 60 to 64 Years | 34 (5.4%) | 61 (10.0%) |
| 65 to 69 Years | 17 (2.7%) | 20 (3.3%) |
| 70 to 74 Years | 11 (1.8%) | 50 (8.2%) |
| 75 to 79 Years | 20 (3.2%) | 22 (3.6%) |
| 80 to 84 Years | 10 (1.6%) | 16 (2.6%) |
| 85 Years and over | 12 (1.9%) | 22 (3.6%) |
| Total | 629 (100.0%) | 611 (100.0%) |
Families and Households in Richfield Springs
Median Family Size in Richfield Springs
The median family size in Richfield Springs is 3.63 persons per family, with single male/father families (24 | 9.1%) accounting for the largest median family size of 5 persons per family. On the other hand, married-couple families (131 | 49.6%) represent the smallest median family size with 3.17 persons per family.
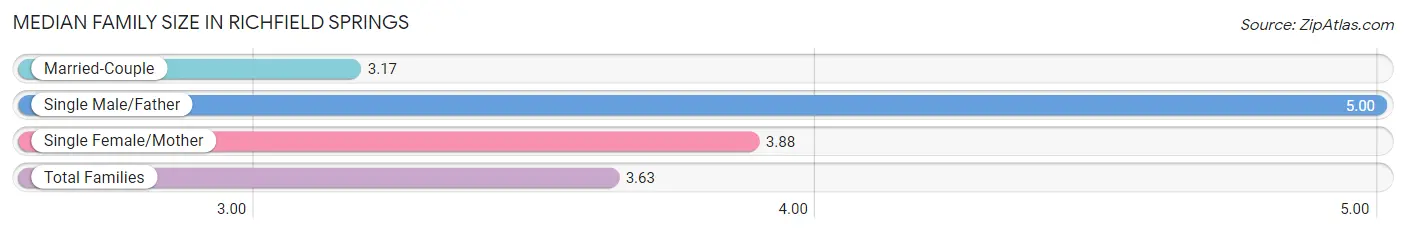
| Family Type | # Families | Family Size |
| Married-Couple | 131 (49.6%) | 3.17 |
| Single Male/Father | 24 (9.1%) | 5.00 |
| Single Female/Mother | 109 (41.3%) | 3.88 |
| Total Families | 264 (100.0%) | 3.63 |
Median Household Size in Richfield Springs
The median household size in Richfield Springs is 3.20 persons per household, with single male/father households (24 | 6.3%) accounting for the largest median household size of 6.13 persons per household. non-family households (116 | 30.5%) represent the smallest median household size with 1.21 persons per household.
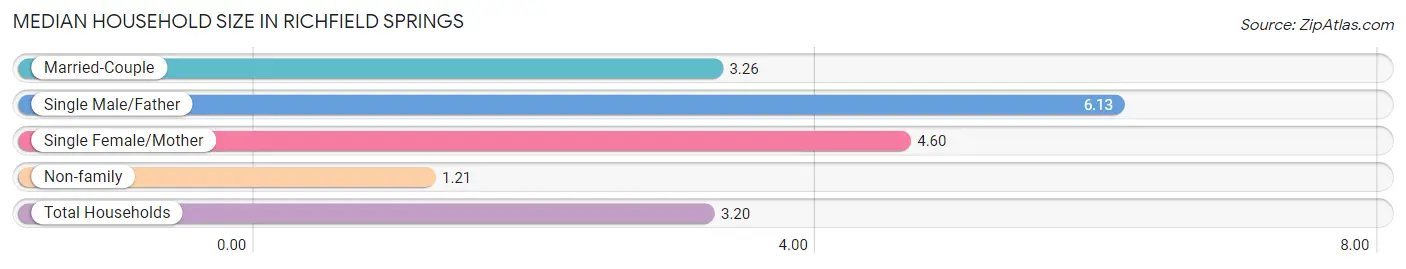
| Household Type | # Households | Household Size |
| Married-Couple | 131 (34.5%) | 3.26 |
| Single Male/Father | 24 (6.3%) | 6.13 |
| Single Female/Mother | 109 (28.7%) | 4.60 |
| Non-family | 116 (30.5%) | 1.21 |
| Total Households | 380 (100.0%) | 3.20 |
Household Size by Marriage Status in Richfield Springs
Out of a total of 380 households in Richfield Springs, 264 (69.5%) are family households, while 116 (30.5%) are nonfamily households. The most numerous type of family households are 2-person households, comprising 106, and the most common type of nonfamily households are 1-person households, comprising 99.
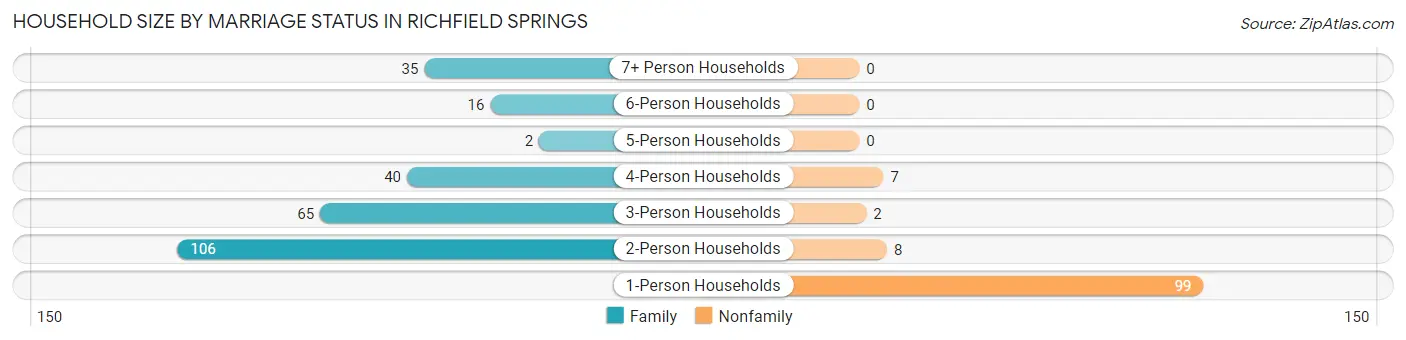
| Household Size | Family Households | Nonfamily Households |
| 1-Person Households | - | 99 (26.1%) |
| 2-Person Households | 106 (27.9%) | 8 (2.1%) |
| 3-Person Households | 65 (17.1%) | 2 (0.5%) |
| 4-Person Households | 40 (10.5%) | 7 (1.8%) |
| 5-Person Households | 2 (0.5%) | 0 (0.0%) |
| 6-Person Households | 16 (4.2%) | 0 (0.0%) |
| 7+ Person Households | 35 (9.2%) | 0 (0.0%) |
| Total | 264 (69.5%) | 116 (30.5%) |
Female Fertility in Richfield Springs
Fertility by Age in Richfield Springs
Average fertility rate in Richfield Springs is 17.0 births per 1,000 women. Women in the age bracket of 20 to 34 years have the highest fertility rate with 31.0 births per 1,000 women. Women in the age bracket of 20 to 34 years acount for 100.0% of all women with births.
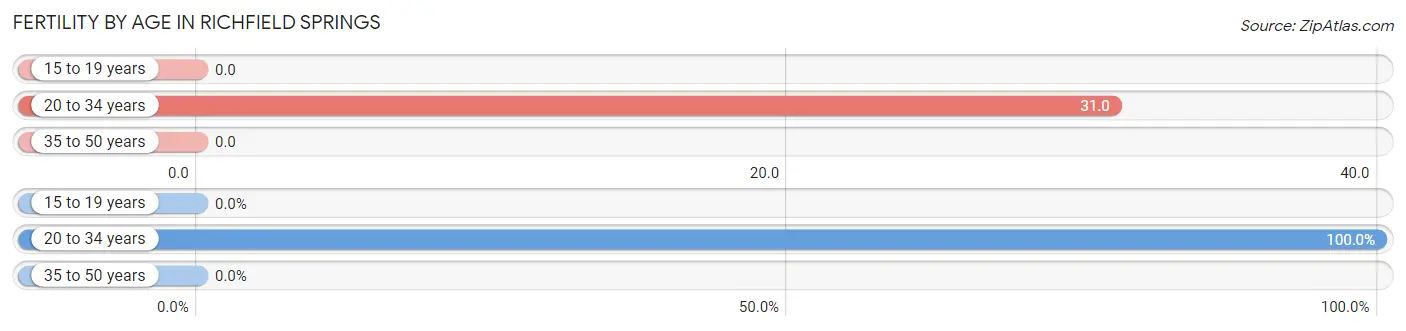
| Age Bracket | Women with Births | Births / 1,000 Women |
| 15 to 19 years | 0 (0.0%) | 0.0 |
| 20 to 34 years | 5 (100.0%) | 31.0 |
| 35 to 50 years | 0 (0.0%) | 0.0 |
| Total | 5 (100.0%) | 17.0 |
Fertility by Age by Marriage Status in Richfield Springs
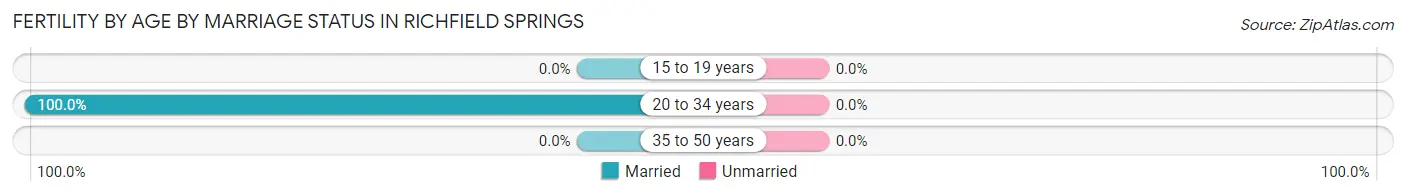
| Age Bracket | Married | Unmarried |
| 15 to 19 years | 0 (0.0%) | 0 (0.0%) |
| 20 to 34 years | 5 (100.0%) | 0 (0.0%) |
| 35 to 50 years | 0 (0.0%) | 0 (0.0%) |
| Total | 5 (100.0%) | 0 (0.0%) |
Fertility by Education in Richfield Springs
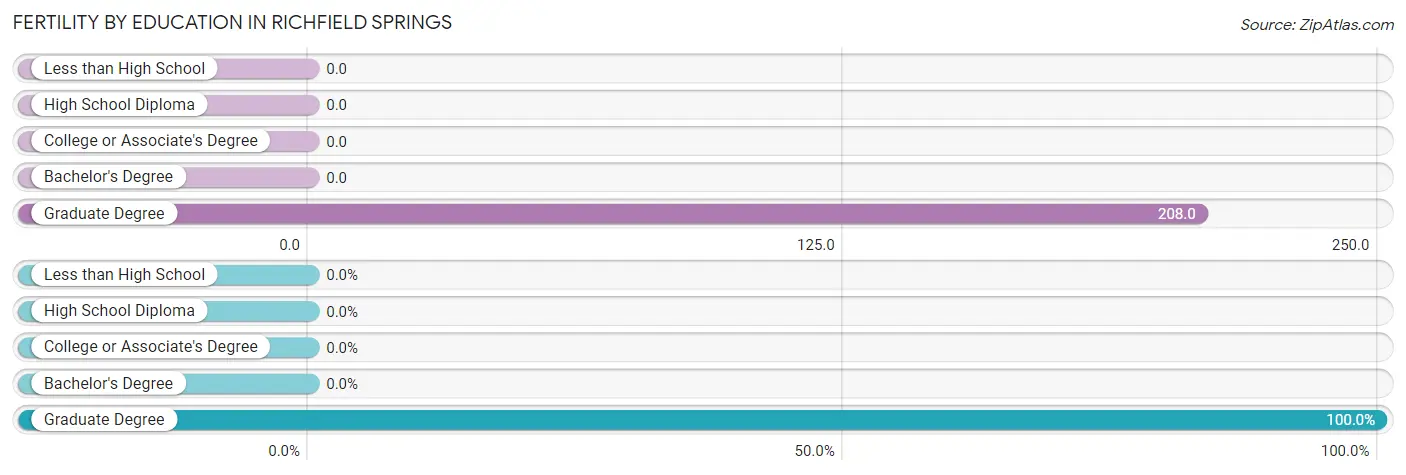
| Educational Attainment | Women with Births | Births / 1,000 Women |
| Less than High School | 0 (0.0%) | 0.0 |
| High School Diploma | 0 (0.0%) | 0.0 |
| College or Associate's Degree | 0 (0.0%) | 0.0 |
| Bachelor's Degree | 0 (0.0%) | 0.0 |
| Graduate Degree | 5 (100.0%) | 208.0 |
| Total | 5 (100.0%) | 17.0 |
Fertility by Education by Marriage Status in Richfield Springs
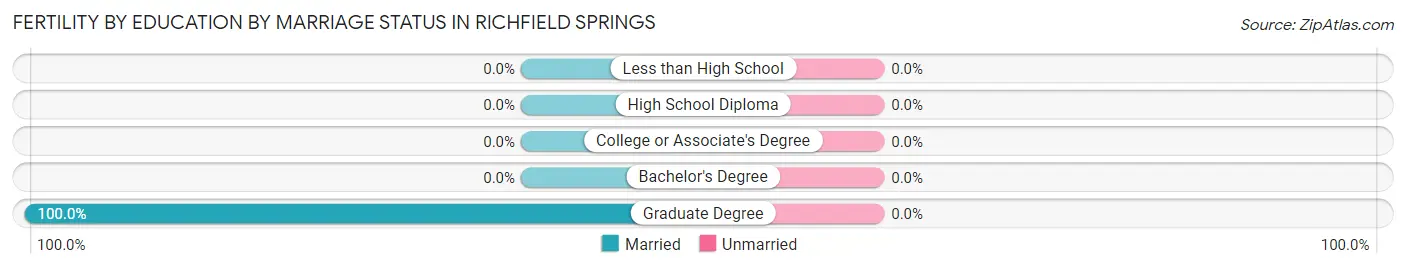
| Educational Attainment | Married | Unmarried |
| Less than High School | 0 (0.0%) | 0 (0.0%) |
| High School Diploma | 0 (0.0%) | 0 (0.0%) |
| College or Associate's Degree | 0 (0.0%) | 0 (0.0%) |
| Bachelor's Degree | 0 (0.0%) | 0 (0.0%) |
| Graduate Degree | 5 (100.0%) | 0 (0.0%) |
| Total | 5 (100.0%) | 0 (0.0%) |
Employment Characteristics in Richfield Springs
Employment by Class of Employer in Richfield Springs
Among the 555 employed individuals in Richfield Springs, private company employees (340 | 61.3%), not-for-profit organizations (96 | 17.3%), and local government employees (65 | 11.7%) make up the most common classes of employment.
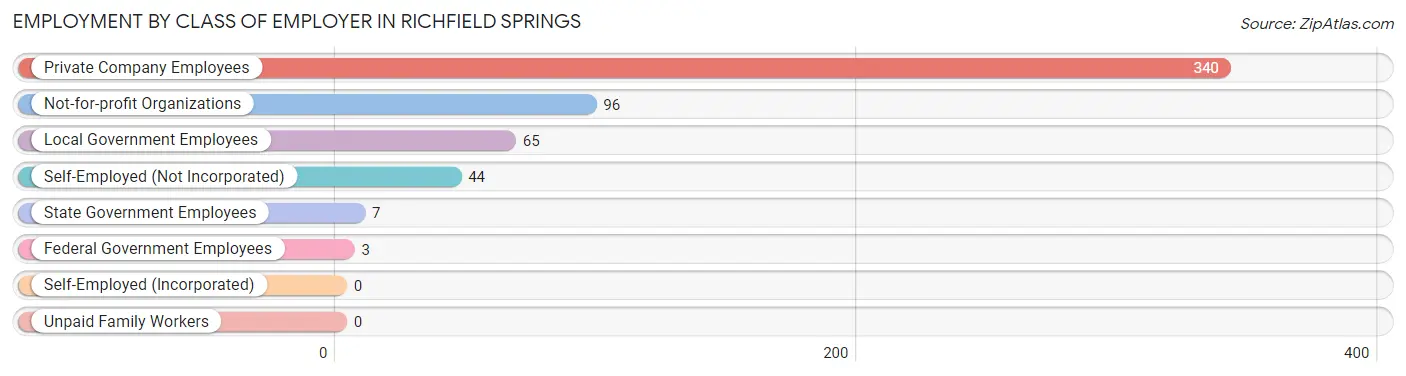
| Employer Class | # Employees | % Employees |
| Private Company Employees | 340 | 61.3% |
| Self-Employed (Incorporated) | 0 | 0.0% |
| Self-Employed (Not Incorporated) | 44 | 7.9% |
| Not-for-profit Organizations | 96 | 17.3% |
| Local Government Employees | 65 | 11.7% |
| State Government Employees | 7 | 1.3% |
| Federal Government Employees | 3 | 0.5% |
| Unpaid Family Workers | 0 | 0.0% |
| Total | 555 | 100.0% |
Employment Status by Age in Richfield Springs
According to the labor force statistics for Richfield Springs, out of the total population over 16 years of age (983), 59.5% or 585 individuals are in the labor force, with 1.4% or 8 of them unemployed. The age group with the highest labor force participation rate is 20 to 24 years, with 86.4% or 102 individuals in the labor force. Within the labor force, the 55 to 59 years age range has the highest percentage of unemployed individuals, with 28.6% or 8 of them being unemployed.
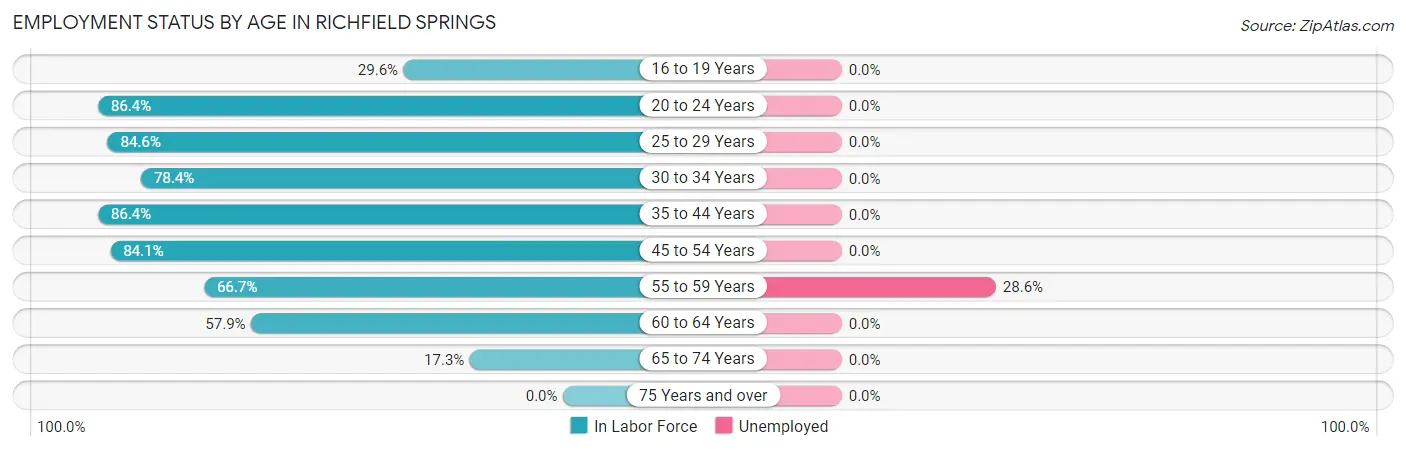
| Age Bracket | In Labor Force | Unemployed |
| 16 to 19 Years | 32 (29.6%) | 0 (0.0%) |
| 20 to 24 Years | 102 (86.4%) | 0 (0.0%) |
| 25 to 29 Years | 44 (84.6%) | 0 (0.0%) |
| 30 to 34 Years | 87 (78.4%) | 0 (0.0%) |
| 35 to 44 Years | 146 (86.4%) | 0 (0.0%) |
| 45 to 54 Years | 74 (84.1%) | 0 (0.0%) |
| 55 to 59 Years | 28 (66.7%) | 8 (28.6%) |
| 60 to 64 Years | 55 (57.9%) | 0 (0.0%) |
| 65 to 74 Years | 17 (17.3%) | 0 (0.0%) |
| 75 Years and over | 0 (0.0%) | 0 (0.0%) |
| Total | 585 (59.5%) | 8 (1.4%) |
Employment Status by Educational Attainment in Richfield Springs
According to labor force statistics for Richfield Springs, 77.9% of individuals (434) out of the total population between 25 and 64 years of age (557) are in the labor force, with 1.8% or 8 of them being unemployed. The group with the highest labor force participation rate are those with the educational attainment of bachelor's degree or higher, with 86.3% or 120 individuals in the labor force. Within the labor force, individuals with less than high school education have the highest percentage of unemployment, with 10.3% or 8 of them being unemployed.
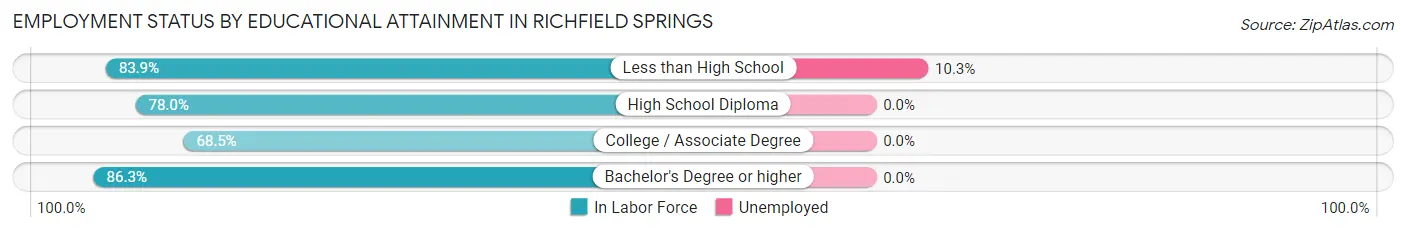
| Educational Attainment | In Labor Force | Unemployed |
| Less than High School | 78 (83.9%) | 10 (10.3%) |
| High School Diploma | 110 (78.0%) | 0 (0.0%) |
| College / Associate Degree | 126 (68.5%) | 0 (0.0%) |
| Bachelor's Degree or higher | 120 (86.3%) | 0 (0.0%) |
| Total | 434 (77.9%) | 10 (1.8%) |
Employment Occupations by Sex in Richfield Springs
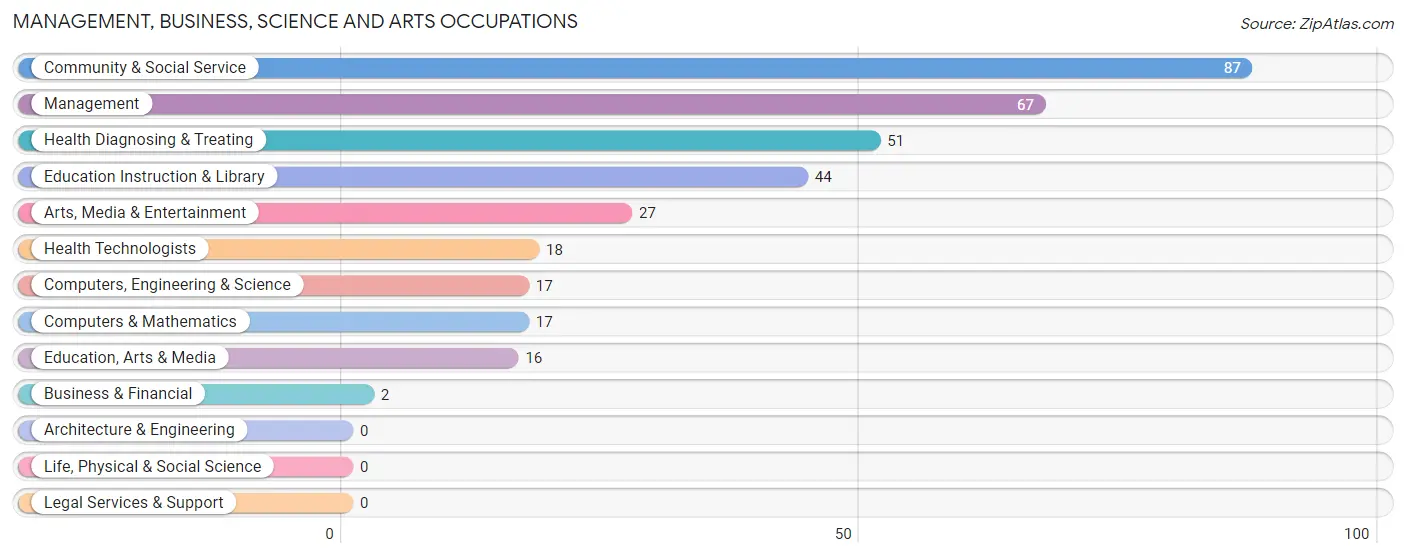
Management, Business, Science and Arts Occupations
The most common Management, Business, Science and Arts occupations in Richfield Springs are Community & Social Service (87 | 15.1%), Management (67 | 11.6%), Health Diagnosing & Treating (51 | 8.8%), Education Instruction & Library (44 | 7.6%), and Arts, Media & Entertainment (27 | 4.7%).
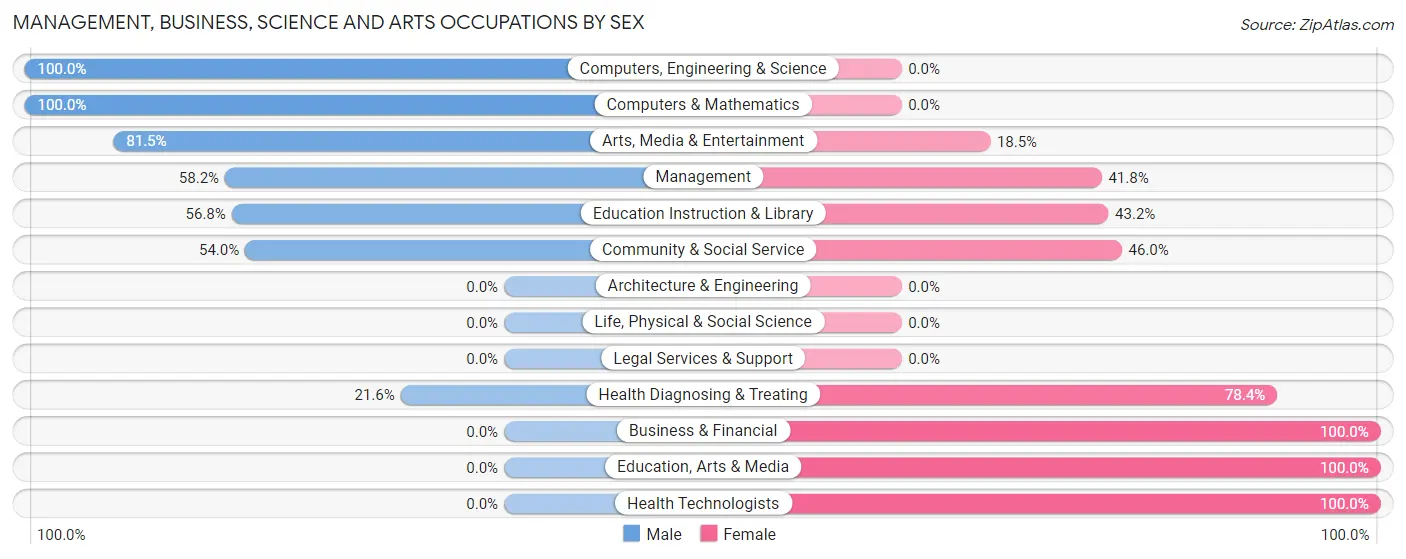
Management, Business, Science and Arts Occupations by Sex
Within the Management, Business, Science and Arts occupations in Richfield Springs, the most male-oriented occupations are Computers, Engineering & Science (100.0%), Computers & Mathematics (100.0%), and Arts, Media & Entertainment (81.5%), while the most female-oriented occupations are Business & Financial (100.0%), Education, Arts & Media (100.0%), and Health Technologists (100.0%).
| Occupation | Male | Female |
| Management | 39 (58.2%) | 28 (41.8%) |
| Business & Financial | 0 (0.0%) | 2 (100.0%) |
| Computers, Engineering & Science | 17 (100.0%) | 0 (0.0%) |
| Computers & Mathematics | 17 (100.0%) | 0 (0.0%) |
| Architecture & Engineering | 0 (0.0%) | 0 (0.0%) |
| Life, Physical & Social Science | 0 (0.0%) | 0 (0.0%) |
| Community & Social Service | 47 (54.0%) | 40 (46.0%) |
| Education, Arts & Media | 0 (0.0%) | 16 (100.0%) |
| Legal Services & Support | 0 (0.0%) | 0 (0.0%) |
| Education Instruction & Library | 25 (56.8%) | 19 (43.2%) |
| Arts, Media & Entertainment | 22 (81.5%) | 5 (18.5%) |
| Health Diagnosing & Treating | 11 (21.6%) | 40 (78.4%) |
| Health Technologists | 0 (0.0%) | 18 (100.0%) |
| Total (Category) | 114 (50.9%) | 110 (49.1%) |
| Total (Overall) | 302 (52.3%) | 275 (47.7%) |
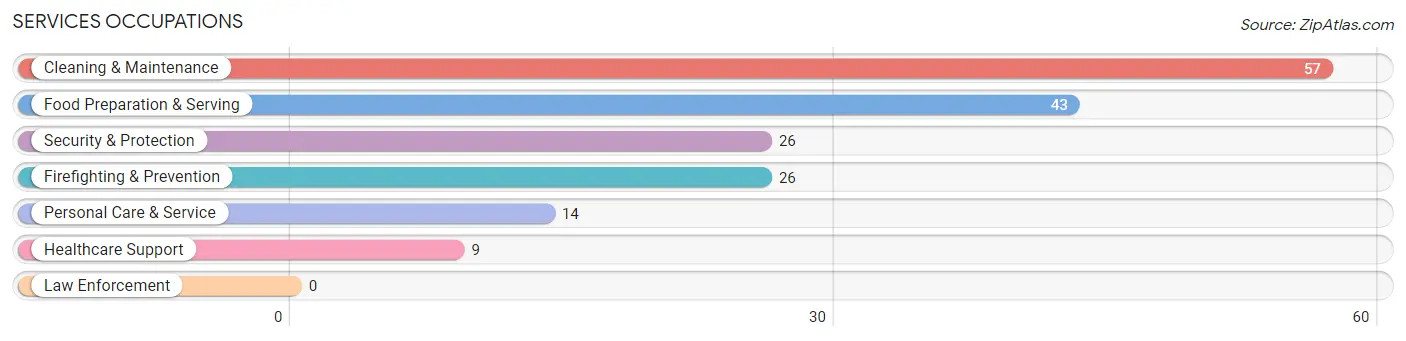
Services Occupations
The most common Services occupations in Richfield Springs are Cleaning & Maintenance (57 | 9.9%), Food Preparation & Serving (43 | 7.4%), Security & Protection (26 | 4.5%), Firefighting & Prevention (26 | 4.5%), and Personal Care & Service (14 | 2.4%).
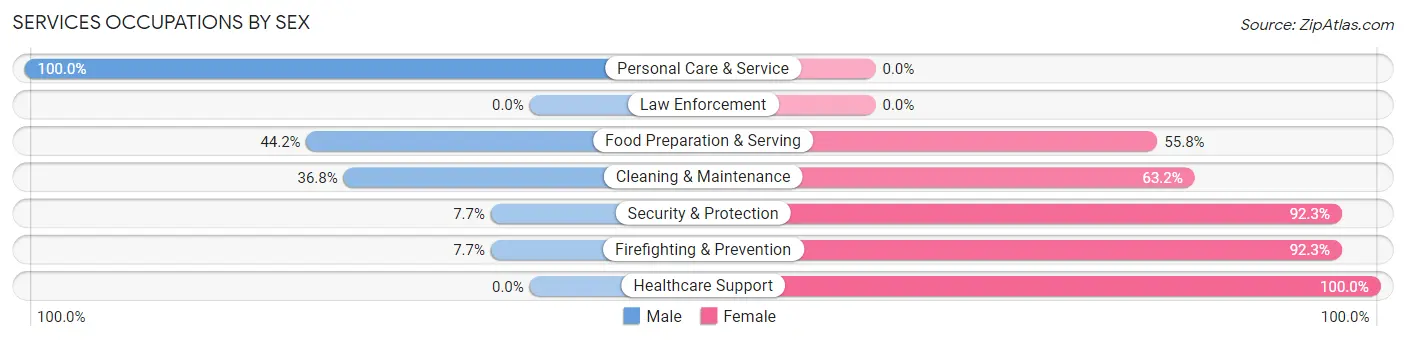
Services Occupations by Sex
Within the Services occupations in Richfield Springs, the most male-oriented occupations are Personal Care & Service (100.0%), Food Preparation & Serving (44.2%), and Cleaning & Maintenance (36.8%), while the most female-oriented occupations are Healthcare Support (100.0%), Security & Protection (92.3%), and Firefighting & Prevention (92.3%).
| Occupation | Male | Female |
| Healthcare Support | 0 (0.0%) | 9 (100.0%) |
| Security & Protection | 2 (7.7%) | 24 (92.3%) |
| Firefighting & Prevention | 2 (7.7%) | 24 (92.3%) |
| Law Enforcement | 0 (0.0%) | 0 (0.0%) |
| Food Preparation & Serving | 19 (44.2%) | 24 (55.8%) |
| Cleaning & Maintenance | 21 (36.8%) | 36 (63.2%) |
| Personal Care & Service | 14 (100.0%) | 0 (0.0%) |
| Total (Category) | 56 (37.6%) | 93 (62.4%) |
| Total (Overall) | 302 (52.3%) | 275 (47.7%) |
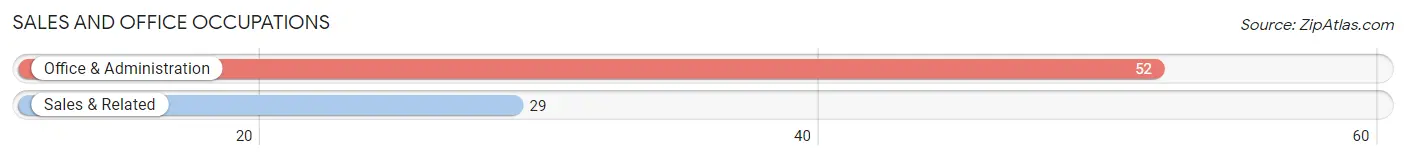
Sales and Office Occupations
The most common Sales and Office occupations in Richfield Springs are Office & Administration (52 | 9.0%), and Sales & Related (29 | 5.0%).
Sales and Office Occupations by Sex
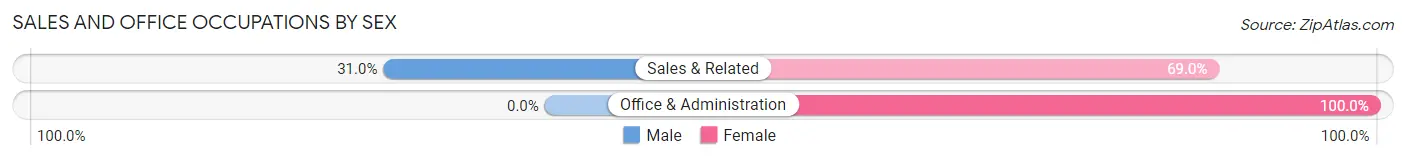
| Occupation | Male | Female |
| Sales & Related | 9 (31.0%) | 20 (69.0%) |
| Office & Administration | 0 (0.0%) | 52 (100.0%) |
| Total (Category) | 9 (11.1%) | 72 (88.9%) |
| Total (Overall) | 302 (52.3%) | 275 (47.7%) |
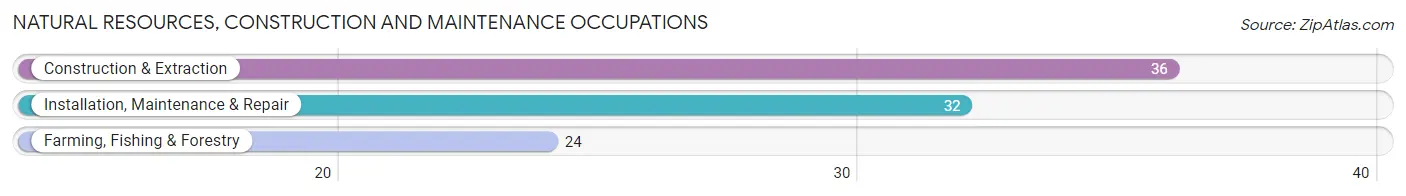
Natural Resources, Construction and Maintenance Occupations
The most common Natural Resources, Construction and Maintenance occupations in Richfield Springs are Construction & Extraction (36 | 6.2%), Installation, Maintenance & Repair (32 | 5.6%), and Farming, Fishing & Forestry (24 | 4.2%).
Natural Resources, Construction and Maintenance Occupations by Sex
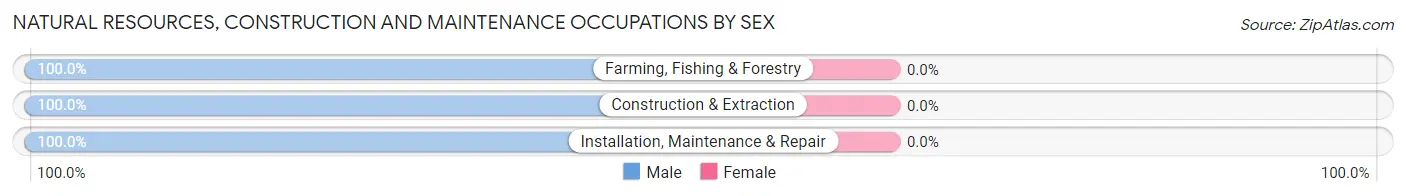
| Occupation | Male | Female |
| Farming, Fishing & Forestry | 24 (100.0%) | 0 (0.0%) |
| Construction & Extraction | 36 (100.0%) | 0 (0.0%) |
| Installation, Maintenance & Repair | 32 (100.0%) | 0 (0.0%) |
| Total (Category) | 92 (100.0%) | 0 (0.0%) |
| Total (Overall) | 302 (52.3%) | 275 (47.7%) |
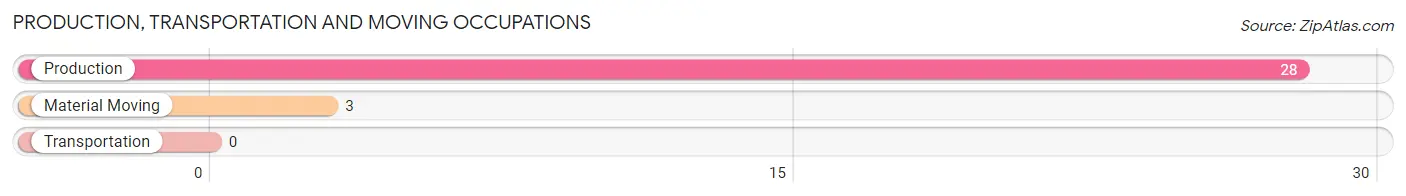
Production, Transportation and Moving Occupations
The most common Production, Transportation and Moving occupations in Richfield Springs are Production (28 | 4.9%), and Material Moving (3 | 0.5%).
Production, Transportation and Moving Occupations by Sex
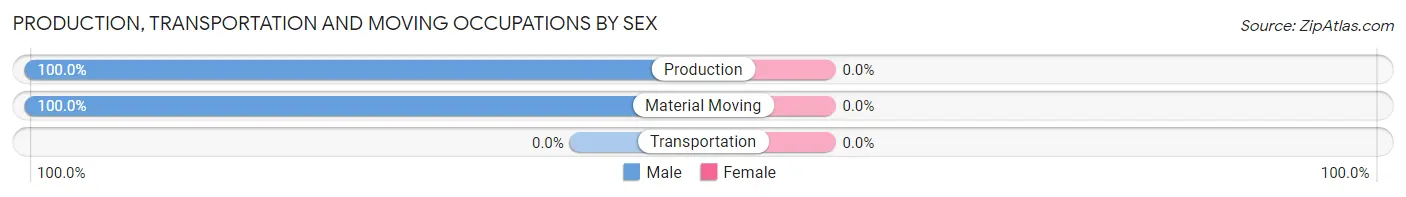
| Occupation | Male | Female |
| Production | 28 (100.0%) | 0 (0.0%) |
| Transportation | 0 (0.0%) | 0 (0.0%) |
| Material Moving | 3 (100.0%) | 0 (0.0%) |
| Total (Category) | 31 (100.0%) | 0 (0.0%) |
| Total (Overall) | 302 (52.3%) | 275 (47.7%) |
Employment Industries by Sex in Richfield Springs
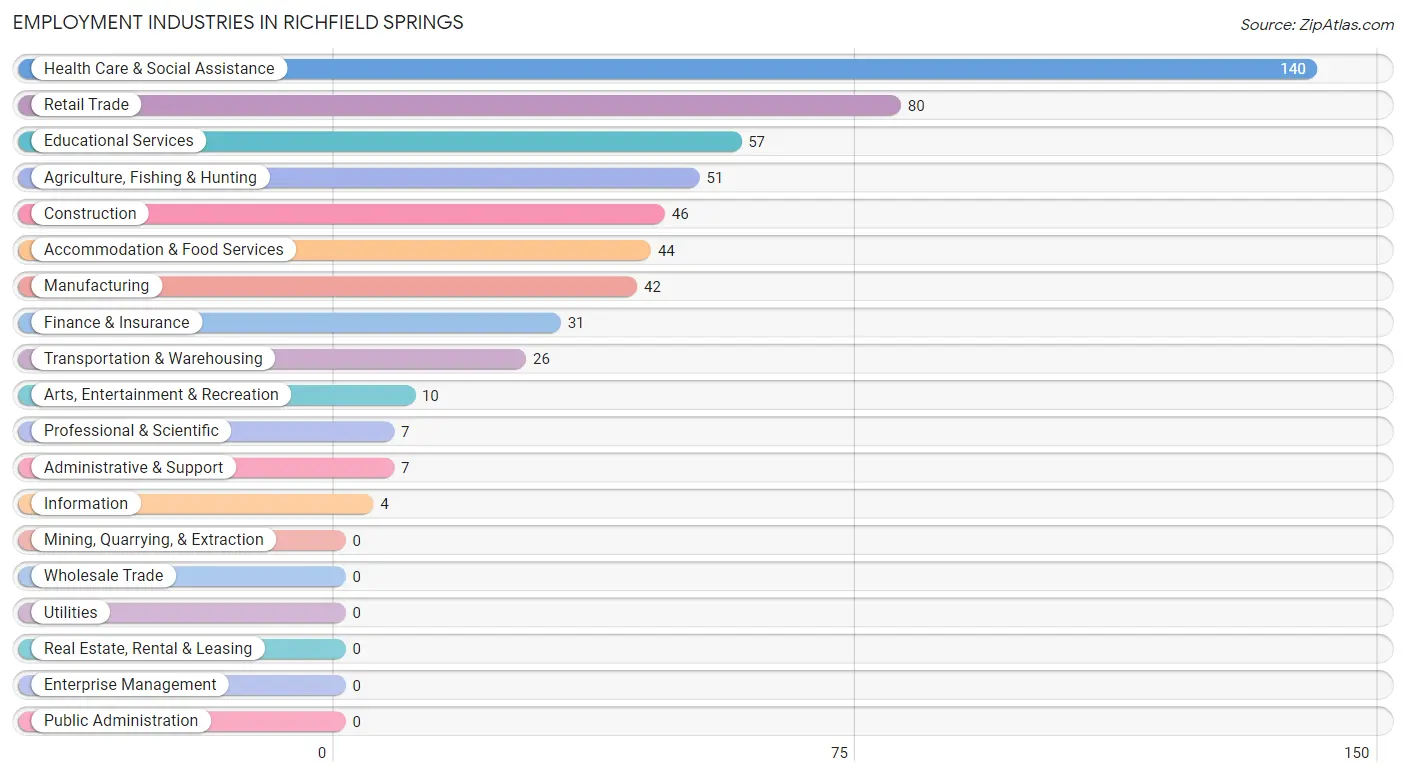
Employment Industries in Richfield Springs
The major employment industries in Richfield Springs include Health Care & Social Assistance (140 | 24.3%), Retail Trade (80 | 13.9%), Educational Services (57 | 9.9%), Agriculture, Fishing & Hunting (51 | 8.8%), and Construction (46 | 8.0%).
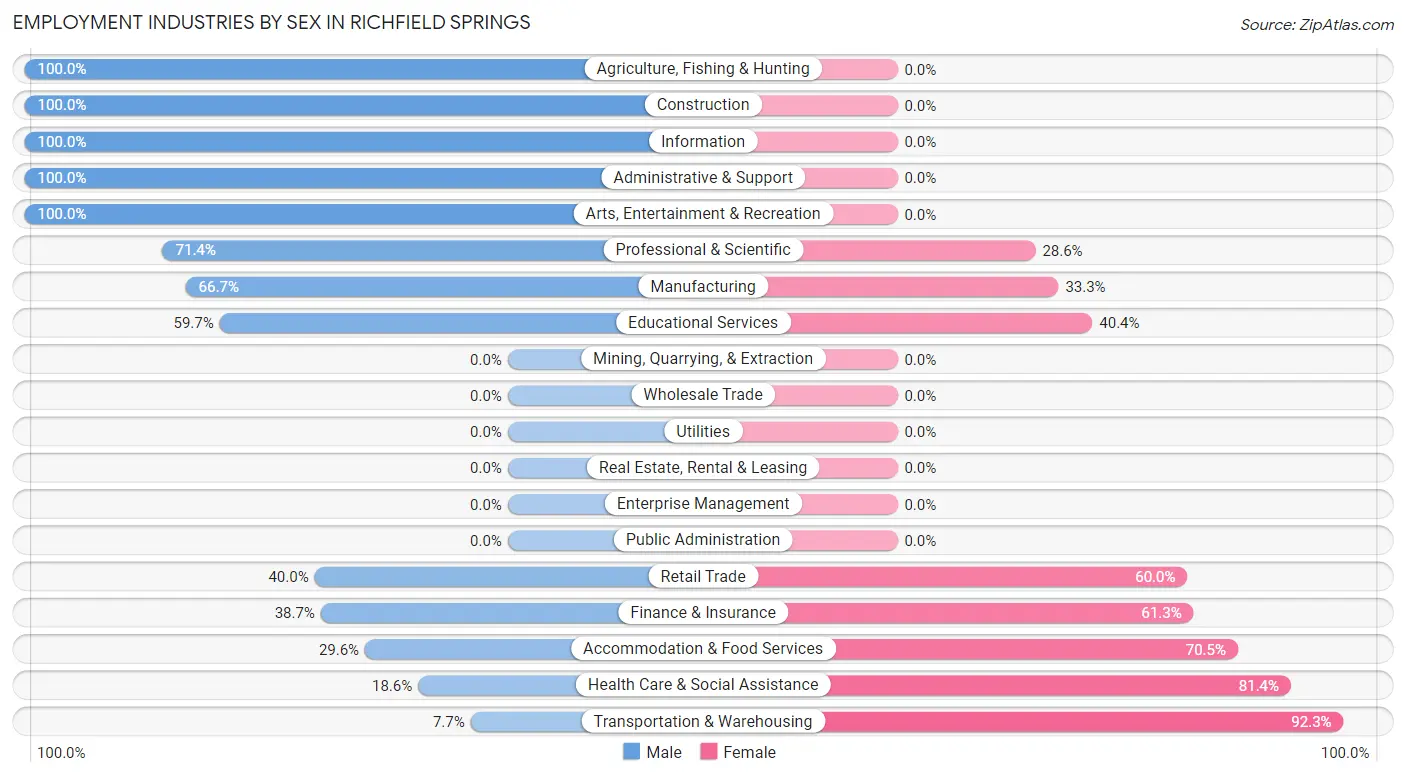
Employment Industries by Sex in Richfield Springs
The Richfield Springs industries that see more men than women are Agriculture, Fishing & Hunting (100.0%), Construction (100.0%), and Information (100.0%), whereas the industries that tend to have a higher number of women are Transportation & Warehousing (92.3%), Health Care & Social Assistance (81.4%), and Accommodation & Food Services (70.5%).
| Industry | Male | Female |
| Agriculture, Fishing & Hunting | 51 (100.0%) | 0 (0.0%) |
| Mining, Quarrying, & Extraction | 0 (0.0%) | 0 (0.0%) |
| Construction | 46 (100.0%) | 0 (0.0%) |
| Manufacturing | 28 (66.7%) | 14 (33.3%) |
| Wholesale Trade | 0 (0.0%) | 0 (0.0%) |
| Retail Trade | 32 (40.0%) | 48 (60.0%) |
| Transportation & Warehousing | 2 (7.7%) | 24 (92.3%) |
| Utilities | 0 (0.0%) | 0 (0.0%) |
| Information | 4 (100.0%) | 0 (0.0%) |
| Finance & Insurance | 12 (38.7%) | 19 (61.3%) |
| Real Estate, Rental & Leasing | 0 (0.0%) | 0 (0.0%) |
| Professional & Scientific | 5 (71.4%) | 2 (28.6%) |
| Enterprise Management | 0 (0.0%) | 0 (0.0%) |
| Administrative & Support | 7 (100.0%) | 0 (0.0%) |
| Educational Services | 34 (59.7%) | 23 (40.4%) |
| Health Care & Social Assistance | 26 (18.6%) | 114 (81.4%) |
| Arts, Entertainment & Recreation | 10 (100.0%) | 0 (0.0%) |
| Accommodation & Food Services | 13 (29.5%) | 31 (70.5%) |
| Public Administration | 0 (0.0%) | 0 (0.0%) |
| Total | 302 (52.3%) | 275 (47.7%) |
Education in Richfield Springs
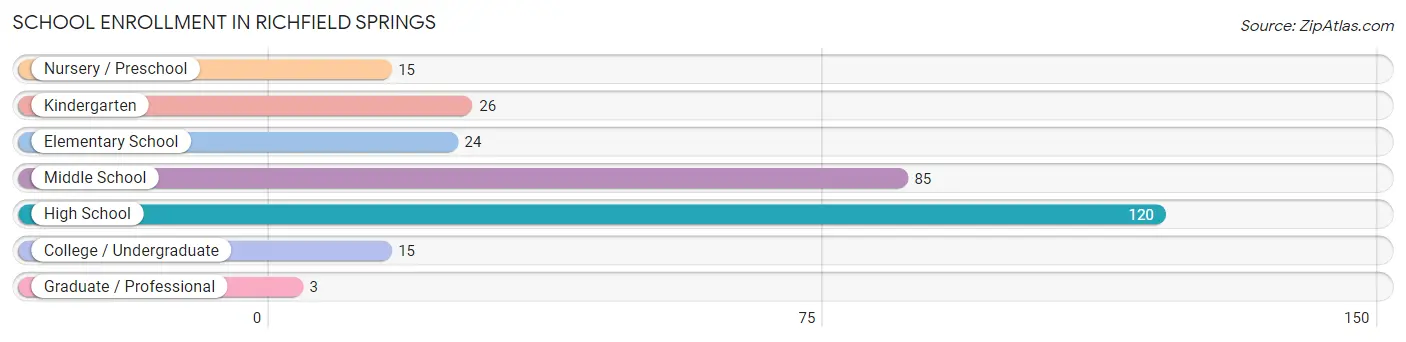
School Enrollment in Richfield Springs
The most common levels of schooling among the 288 students in Richfield Springs are high school (120 | 41.7%), middle school (85 | 29.5%), and kindergarten (26 | 9.0%).
| School Level | # Students | % Students |
| Nursery / Preschool | 15 | 5.2% |
| Kindergarten | 26 | 9.0% |
| Elementary School | 24 | 8.3% |
| Middle School | 85 | 29.5% |
| High School | 120 | 41.7% |
| College / Undergraduate | 15 | 5.2% |
| Graduate / Professional | 3 | 1.0% |
| Total | 288 | 100.0% |
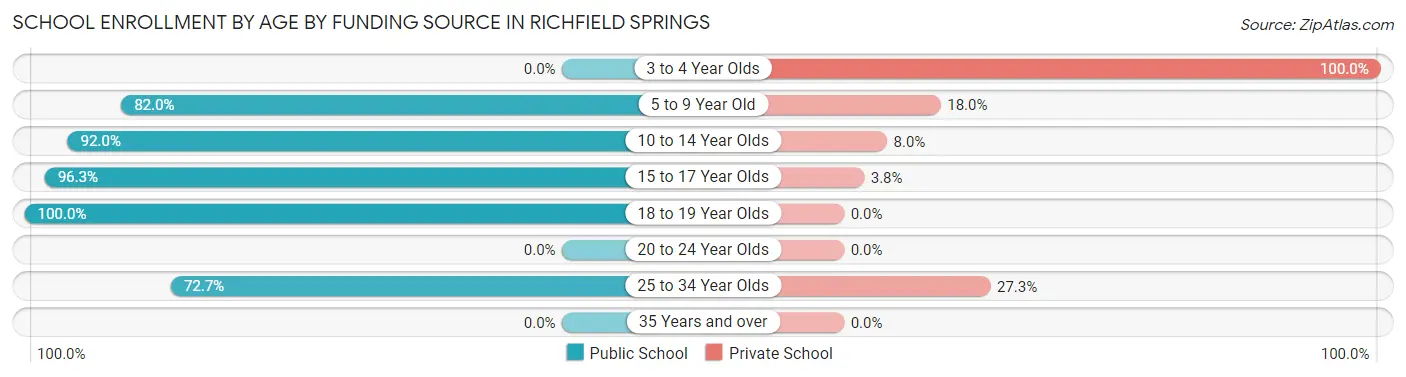
School Enrollment by Age by Funding Source in Richfield Springs
Out of a total of 288 students who are enrolled in schools in Richfield Springs, 40 (13.9%) attend a private institution, while the remaining 248 (86.1%) are enrolled in public schools. The age group of 3 to 4 year olds has the highest likelihood of being enrolled in private schools, with 15 (100.0% in the age bracket) enrolled. Conversely, the age group of 18 to 19 year olds has the lowest likelihood of being enrolled in a private school, with 7 (100.0% in the age bracket) attending a public institution.
| Age Bracket | Public School | Private School |
| 3 to 4 Year Olds | 0 (0.0%) | 15 (100.0%) |
| 5 to 9 Year Old | 41 (82.0%) | 9 (18.0%) |
| 10 to 14 Year Olds | 115 (92.0%) | 10 (8.0%) |
| 15 to 17 Year Olds | 77 (96.3%) | 3 (3.7%) |
| 18 to 19 Year Olds | 7 (100.0%) | 0 (0.0%) |
| 20 to 24 Year Olds | 0 (0.0%) | 0 (0.0%) |
| 25 to 34 Year Olds | 8 (72.7%) | 3 (27.3%) |
| 35 Years and over | 0 (0.0%) | 0 (0.0%) |
| Total | 248 (86.1%) | 40 (13.9%) |
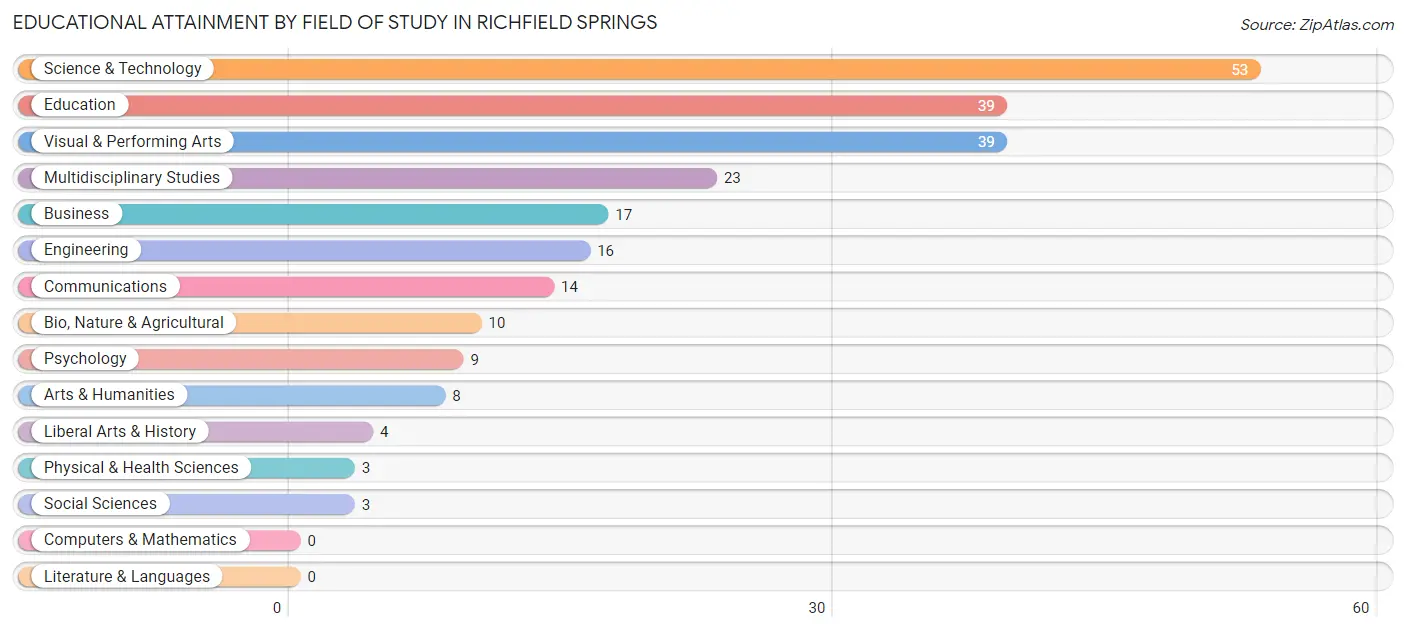
Educational Attainment by Field of Study in Richfield Springs
Science & technology (53 | 22.3%), education (39 | 16.4%), visual & performing arts (39 | 16.4%), multidisciplinary studies (23 | 9.7%), and business (17 | 7.1%) are the most common fields of study among 238 individuals in Richfield Springs who have obtained a bachelor's degree or higher.
| Field of Study | # Graduates | % Graduates |
| Computers & Mathematics | 0 | 0.0% |
| Bio, Nature & Agricultural | 10 | 4.2% |
| Physical & Health Sciences | 3 | 1.3% |
| Psychology | 9 | 3.8% |
| Social Sciences | 3 | 1.3% |
| Engineering | 16 | 6.7% |
| Multidisciplinary Studies | 23 | 9.7% |
| Science & Technology | 53 | 22.3% |
| Business | 17 | 7.1% |
| Education | 39 | 16.4% |
| Literature & Languages | 0 | 0.0% |
| Liberal Arts & History | 4 | 1.7% |
| Visual & Performing Arts | 39 | 16.4% |
| Communications | 14 | 5.9% |
| Arts & Humanities | 8 | 3.4% |
| Total | 238 | 100.0% |
Transportation & Commute in Richfield Springs
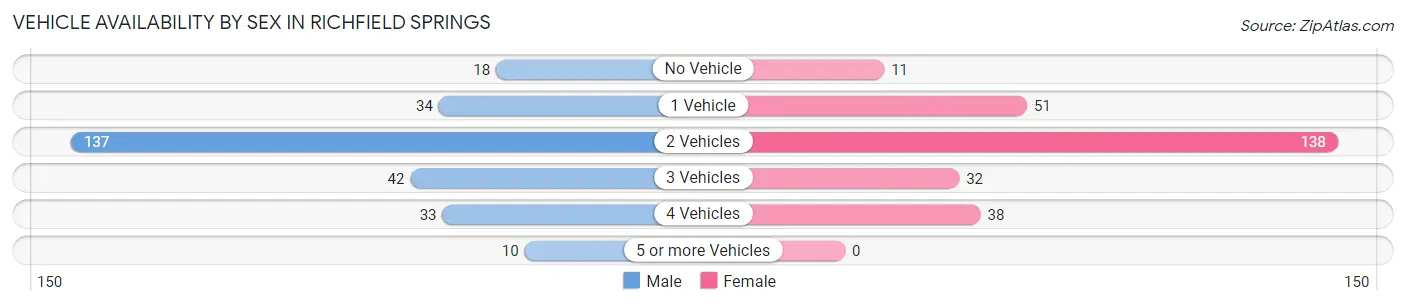
Vehicle Availability by Sex in Richfield Springs
The most prevalent vehicle ownership categories in Richfield Springs are males with 2 vehicles (137, accounting for 50.0%) and females with 2 vehicles (138, making up 50.7%).
| Vehicles Available | Male | Female |
| No Vehicle | 18 (6.6%) | 11 (4.1%) |
| 1 Vehicle | 34 (12.4%) | 51 (18.9%) |
| 2 Vehicles | 137 (50.0%) | 138 (51.1%) |
| 3 Vehicles | 42 (15.3%) | 32 (11.8%) |
| 4 Vehicles | 33 (12.0%) | 38 (14.1%) |
| 5 or more Vehicles | 10 (3.6%) | 0 (0.0%) |
| Total | 274 (100.0%) | 270 (100.0%) |
Commute Time in Richfield Springs
The most frequently occuring commute durations in Richfield Springs are 25 to 29 minutes (90 commuters, 17.6%), 15 to 19 minutes (88 commuters, 17.2%), and 5 to 9 minutes (67 commuters, 13.1%).
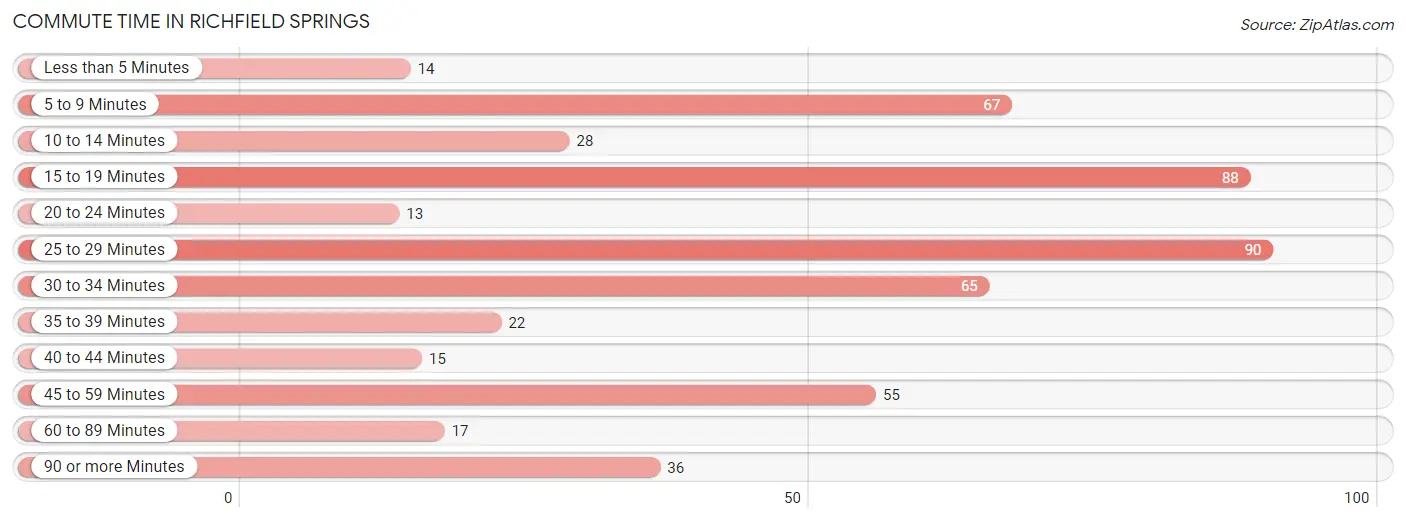
| Commute Time | # Commuters | % Commuters |
| Less than 5 Minutes | 14 | 2.8% |
| 5 to 9 Minutes | 67 | 13.1% |
| 10 to 14 Minutes | 28 | 5.5% |
| 15 to 19 Minutes | 88 | 17.2% |
| 20 to 24 Minutes | 13 | 2.5% |
| 25 to 29 Minutes | 90 | 17.6% |
| 30 to 34 Minutes | 65 | 12.8% |
| 35 to 39 Minutes | 22 | 4.3% |
| 40 to 44 Minutes | 15 | 2.9% |
| 45 to 59 Minutes | 55 | 10.8% |
| 60 to 89 Minutes | 17 | 3.3% |
| 90 or more Minutes | 36 | 7.1% |
Commute Time by Sex in Richfield Springs
The most common commute times in Richfield Springs are 15 to 19 minutes (75 commuters, 29.5%) for males and 5 to 9 minutes (56 commuters, 21.9%) for females.
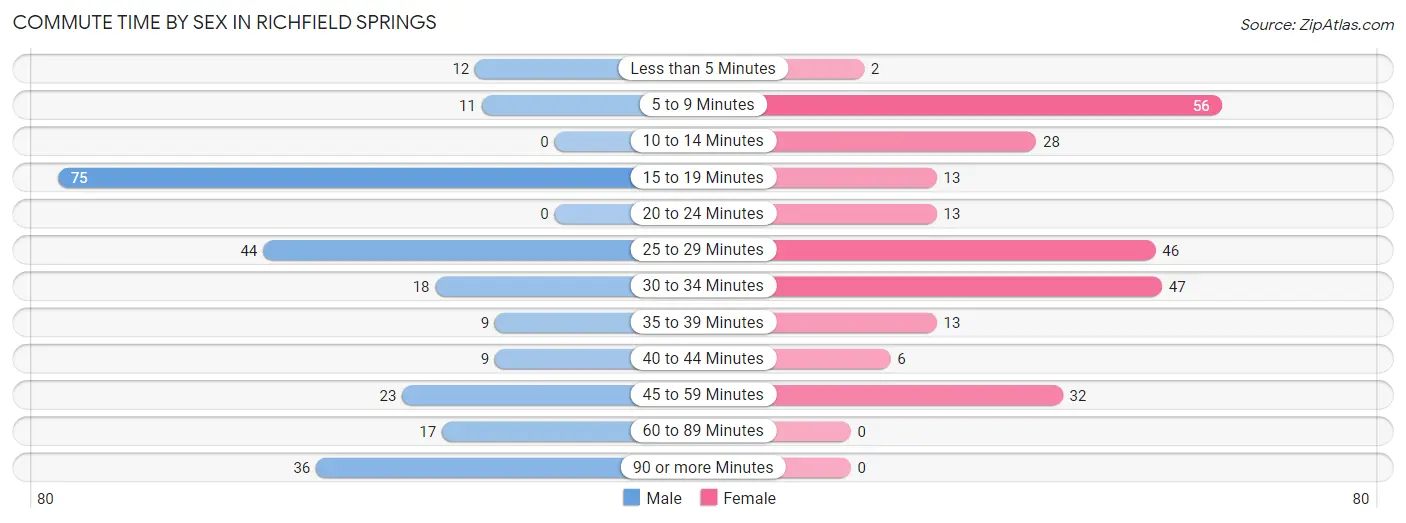
| Commute Time | Male | Female |
| Less than 5 Minutes | 12 (4.7%) | 2 (0.8%) |
| 5 to 9 Minutes | 11 (4.3%) | 56 (21.9%) |
| 10 to 14 Minutes | 0 (0.0%) | 28 (10.9%) |
| 15 to 19 Minutes | 75 (29.5%) | 13 (5.1%) |
| 20 to 24 Minutes | 0 (0.0%) | 13 (5.1%) |
| 25 to 29 Minutes | 44 (17.3%) | 46 (18.0%) |
| 30 to 34 Minutes | 18 (7.1%) | 47 (18.4%) |
| 35 to 39 Minutes | 9 (3.5%) | 13 (5.1%) |
| 40 to 44 Minutes | 9 (3.5%) | 6 (2.3%) |
| 45 to 59 Minutes | 23 (9.1%) | 32 (12.5%) |
| 60 to 89 Minutes | 17 (6.7%) | 0 (0.0%) |
| 90 or more Minutes | 36 (14.2%) | 0 (0.0%) |
Time of Departure to Work by Sex in Richfield Springs
The most frequent times of departure to work in Richfield Springs are 6:00 AM to 6:29 AM (69, 27.2%) for males and 7:00 AM to 7:29 AM (61, 23.8%) for females.
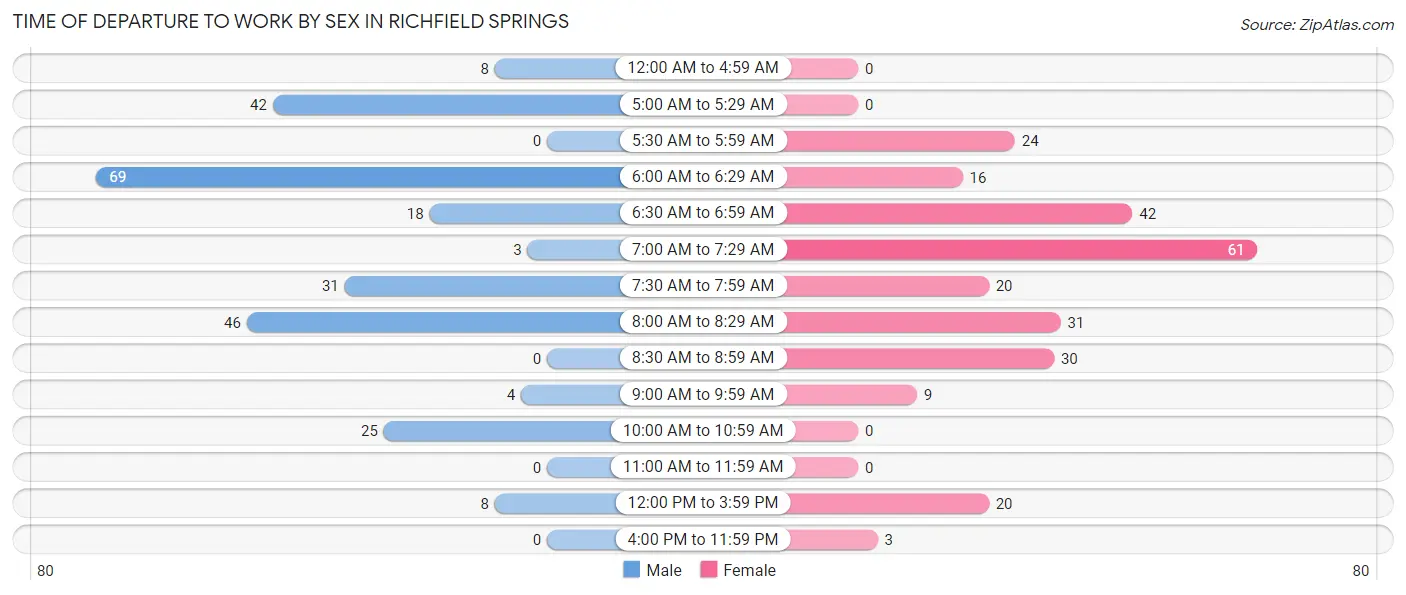
| Time of Departure | Male | Female |
| 12:00 AM to 4:59 AM | 8 (3.2%) | 0 (0.0%) |
| 5:00 AM to 5:29 AM | 42 (16.5%) | 0 (0.0%) |
| 5:30 AM to 5:59 AM | 0 (0.0%) | 24 (9.4%) |
| 6:00 AM to 6:29 AM | 69 (27.2%) | 16 (6.2%) |
| 6:30 AM to 6:59 AM | 18 (7.1%) | 42 (16.4%) |
| 7:00 AM to 7:29 AM | 3 (1.2%) | 61 (23.8%) |
| 7:30 AM to 7:59 AM | 31 (12.2%) | 20 (7.8%) |
| 8:00 AM to 8:29 AM | 46 (18.1%) | 31 (12.1%) |
| 8:30 AM to 8:59 AM | 0 (0.0%) | 30 (11.7%) |
| 9:00 AM to 9:59 AM | 4 (1.6%) | 9 (3.5%) |
| 10:00 AM to 10:59 AM | 25 (9.8%) | 0 (0.0%) |
| 11:00 AM to 11:59 AM | 0 (0.0%) | 0 (0.0%) |
| 12:00 PM to 3:59 PM | 8 (3.2%) | 20 (7.8%) |
| 4:00 PM to 11:59 PM | 0 (0.0%) | 3 (1.2%) |
| Total | 254 (100.0%) | 256 (100.0%) |
Housing Occupancy in Richfield Springs
Occupancy by Ownership in Richfield Springs
Of the total 380 dwellings in Richfield Springs, owner-occupied units account for 251 (66.0%), while renter-occupied units make up 129 (34.0%).
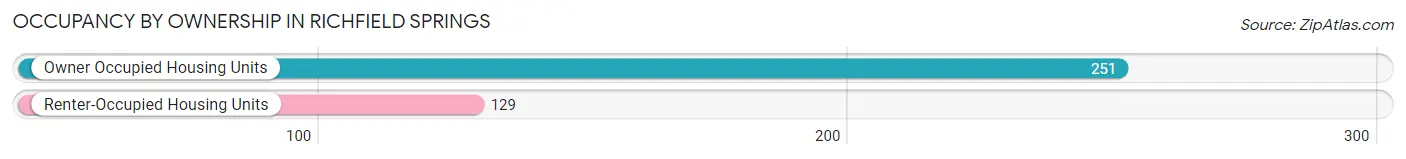
| Occupancy | # Housing Units | % Housing Units |
| Owner Occupied Housing Units | 251 | 66.0% |
| Renter-Occupied Housing Units | 129 | 34.0% |
| Total Occupied Housing Units | 380 | 100.0% |
Occupancy by Household Size in Richfield Springs
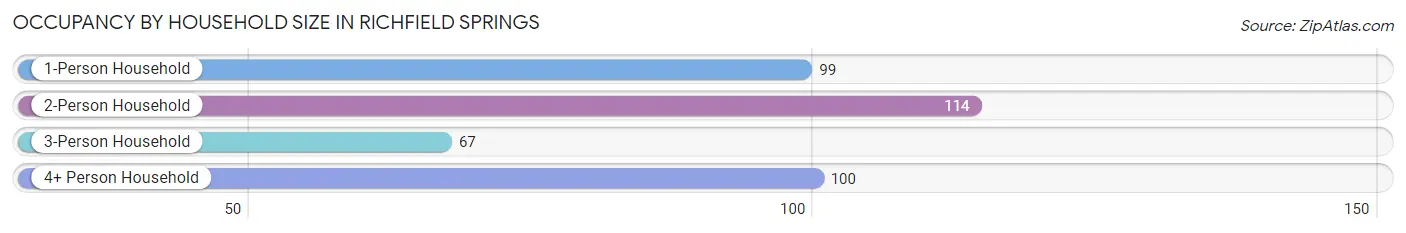
| Household Size | # Housing Units | % Housing Units |
| 1-Person Household | 99 | 26.1% |
| 2-Person Household | 114 | 30.0% |
| 3-Person Household | 67 | 17.6% |
| 4+ Person Household | 100 | 26.3% |
| Total Housing Units | 380 | 100.0% |
Occupancy by Ownership by Household Size in Richfield Springs
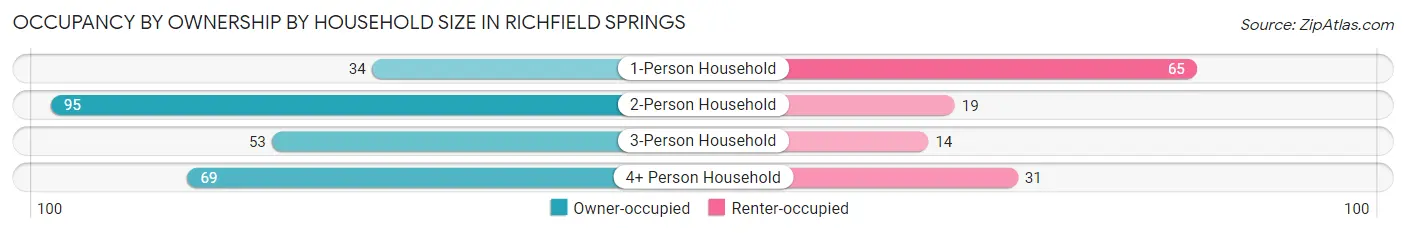
| Household Size | Owner-occupied | Renter-occupied |
| 1-Person Household | 34 (34.3%) | 65 (65.7%) |
| 2-Person Household | 95 (83.3%) | 19 (16.7%) |
| 3-Person Household | 53 (79.1%) | 14 (20.9%) |
| 4+ Person Household | 69 (69.0%) | 31 (31.0%) |
| Total Housing Units | 251 (66.0%) | 129 (34.0%) |
Occupancy by Educational Attainment in Richfield Springs
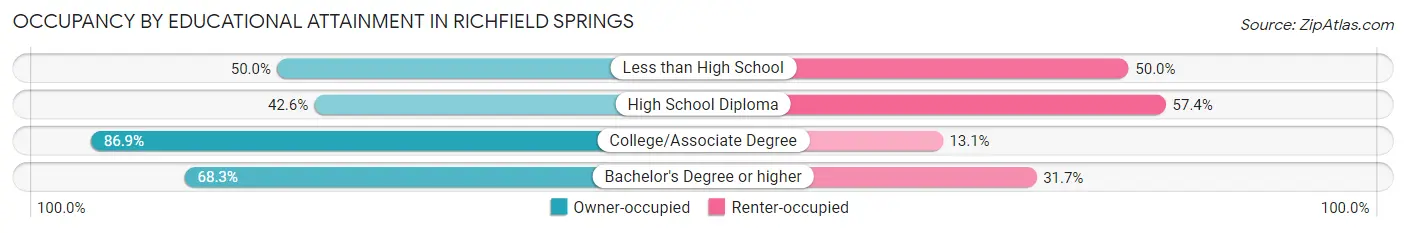
| Household Size | Owner-occupied | Renter-occupied |
| Less than High School | 12 (50.0%) | 12 (50.0%) |
| High School Diploma | 49 (42.6%) | 66 (57.4%) |
| College/Associate Degree | 119 (86.9%) | 18 (13.1%) |
| Bachelor's Degree or higher | 71 (68.3%) | 33 (31.7%) |
Occupancy by Age of Householder in Richfield Springs
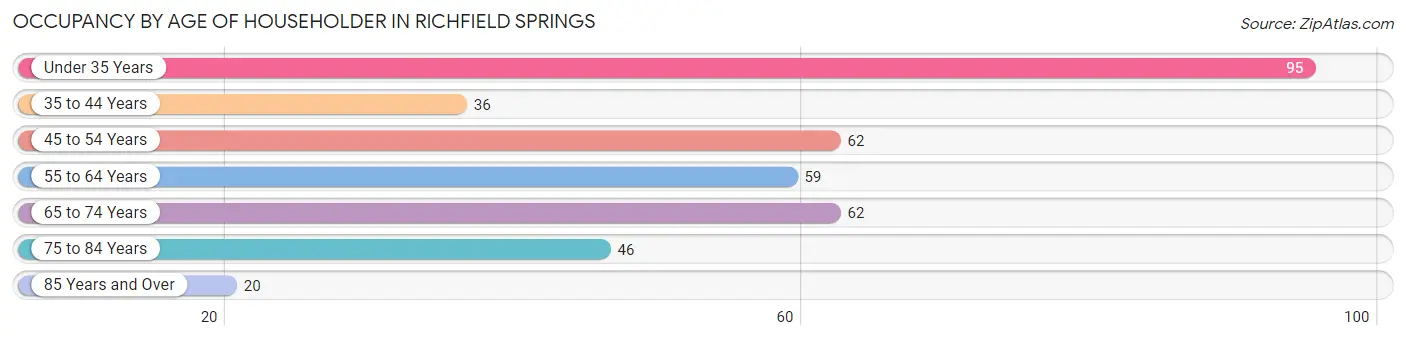
| Age Bracket | # Households | % Households |
| Under 35 Years | 95 | 25.0% |
| 35 to 44 Years | 36 | 9.5% |
| 45 to 54 Years | 62 | 16.3% |
| 55 to 64 Years | 59 | 15.5% |
| 65 to 74 Years | 62 | 16.3% |
| 75 to 84 Years | 46 | 12.1% |
| 85 Years and Over | 20 | 5.3% |
| Total | 380 | 100.0% |
Housing Finances in Richfield Springs
Median Income by Occupancy in Richfield Springs
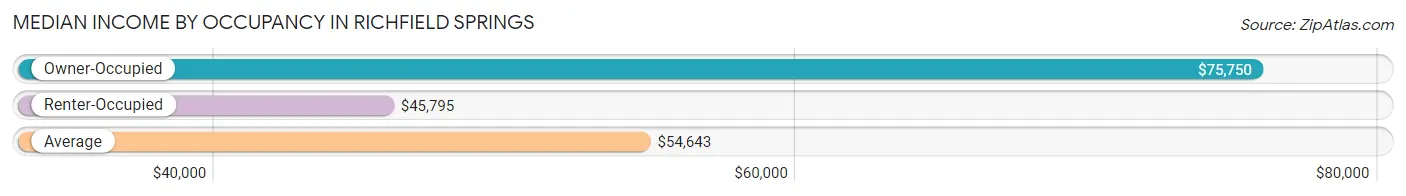
| Occupancy Type | # Households | Median Income |
| Owner-Occupied | 251 (66.0%) | $75,750 |
| Renter-Occupied | 129 (34.0%) | $45,795 |
| Average | 380 (100.0%) | $54,643 |
Occupancy by Householder Income Bracket in Richfield Springs
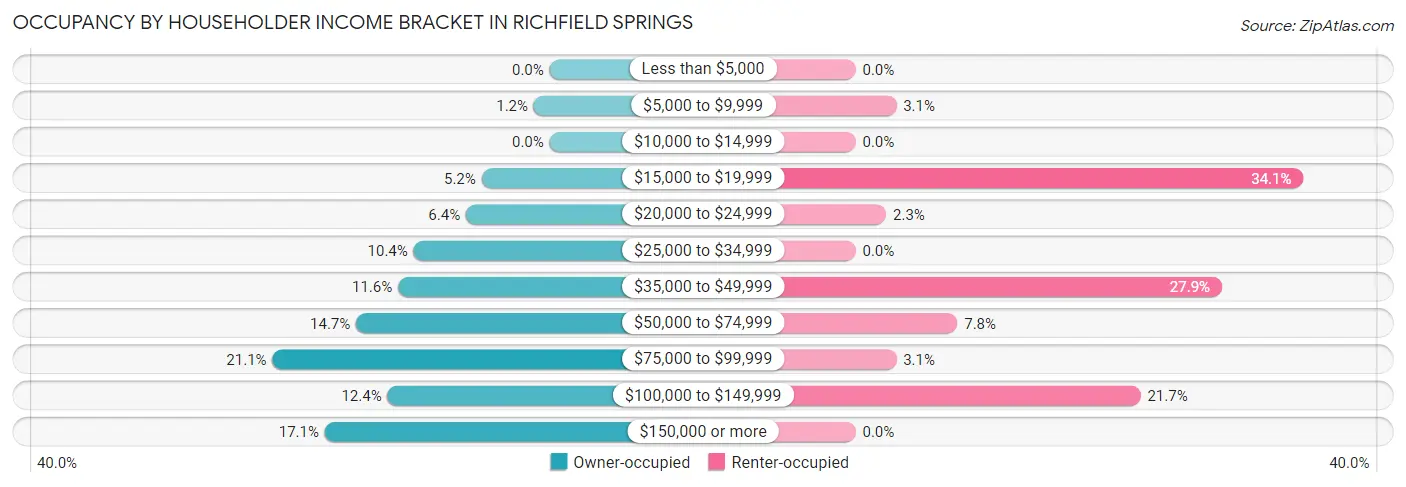
| Income Bracket | Owner-occupied | Renter-occupied |
| Less than $5,000 | 0 (0.0%) | 0 (0.0%) |
| $5,000 to $9,999 | 3 (1.2%) | 4 (3.1%) |
| $10,000 to $14,999 | 0 (0.0%) | 0 (0.0%) |
| $15,000 to $19,999 | 13 (5.2%) | 44 (34.1%) |
| $20,000 to $24,999 | 16 (6.4%) | 3 (2.3%) |
| $25,000 to $34,999 | 26 (10.4%) | 0 (0.0%) |
| $35,000 to $49,999 | 29 (11.6%) | 36 (27.9%) |
| $50,000 to $74,999 | 37 (14.7%) | 10 (7.7%) |
| $75,000 to $99,999 | 53 (21.1%) | 4 (3.1%) |
| $100,000 to $149,999 | 31 (12.3%) | 28 (21.7%) |
| $150,000 or more | 43 (17.1%) | 0 (0.0%) |
| Total | 251 (100.0%) | 129 (100.0%) |
Monthly Housing Cost Tiers in Richfield Springs
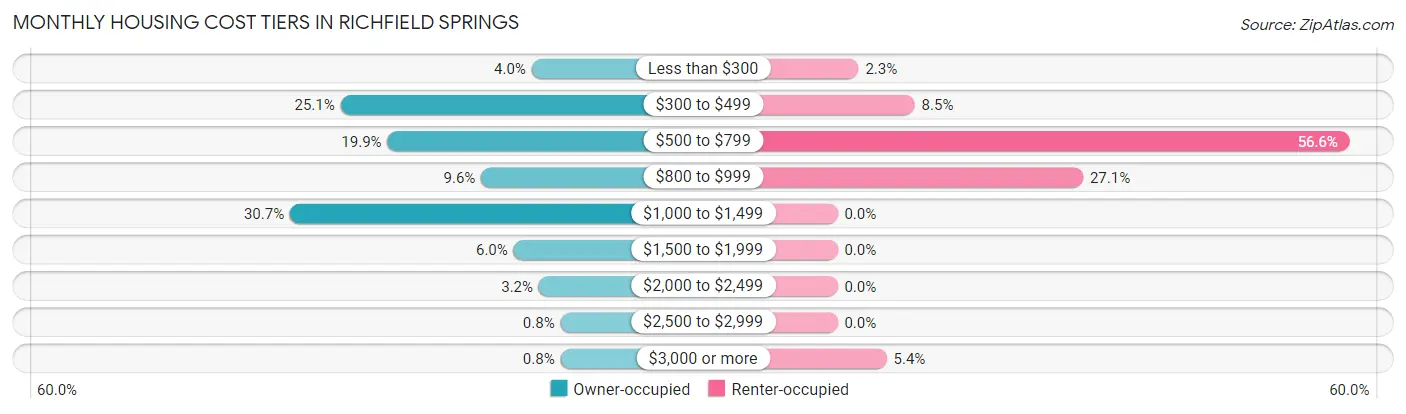
| Monthly Cost | Owner-occupied | Renter-occupied |
| Less than $300 | 10 (4.0%) | 3 (2.3%) |
| $300 to $499 | 63 (25.1%) | 11 (8.5%) |
| $500 to $799 | 50 (19.9%) | 73 (56.6%) |
| $800 to $999 | 24 (9.6%) | 35 (27.1%) |
| $1,000 to $1,499 | 77 (30.7%) | 0 (0.0%) |
| $1,500 to $1,999 | 15 (6.0%) | 0 (0.0%) |
| $2,000 to $2,499 | 8 (3.2%) | 0 (0.0%) |
| $2,500 to $2,999 | 2 (0.8%) | 0 (0.0%) |
| $3,000 or more | 2 (0.8%) | 7 (5.4%) |
| Total | 251 (100.0%) | 129 (100.0%) |
Physical Housing Characteristics in Richfield Springs
Housing Structures in Richfield Springs
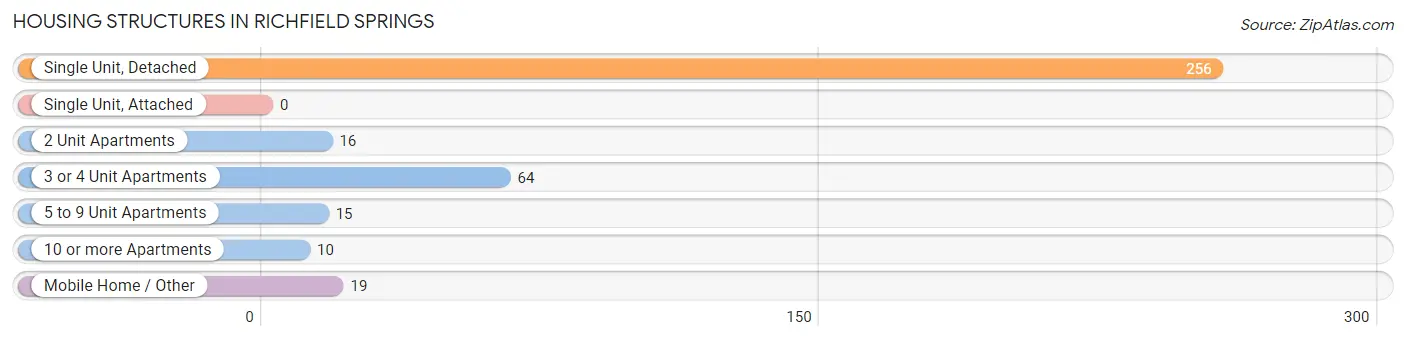
| Structure Type | # Housing Units | % Housing Units |
| Single Unit, Detached | 256 | 67.4% |
| Single Unit, Attached | 0 | 0.0% |
| 2 Unit Apartments | 16 | 4.2% |
| 3 or 4 Unit Apartments | 64 | 16.8% |
| 5 to 9 Unit Apartments | 15 | 4.0% |
| 10 or more Apartments | 10 | 2.6% |
| Mobile Home / Other | 19 | 5.0% |
| Total | 380 | 100.0% |
Housing Structures by Occupancy in Richfield Springs
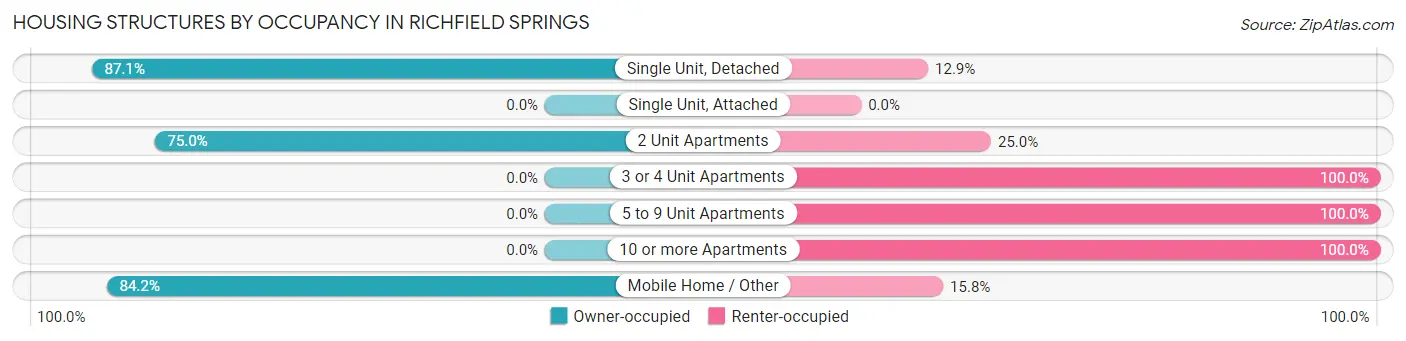
| Structure Type | Owner-occupied | Renter-occupied |
| Single Unit, Detached | 223 (87.1%) | 33 (12.9%) |
| Single Unit, Attached | 0 (0.0%) | 0 (0.0%) |
| 2 Unit Apartments | 12 (75.0%) | 4 (25.0%) |
| 3 or 4 Unit Apartments | 0 (0.0%) | 64 (100.0%) |
| 5 to 9 Unit Apartments | 0 (0.0%) | 15 (100.0%) |
| 10 or more Apartments | 0 (0.0%) | 10 (100.0%) |
| Mobile Home / Other | 16 (84.2%) | 3 (15.8%) |
| Total | 251 (66.0%) | 129 (34.0%) |
Housing Structures by Number of Rooms in Richfield Springs
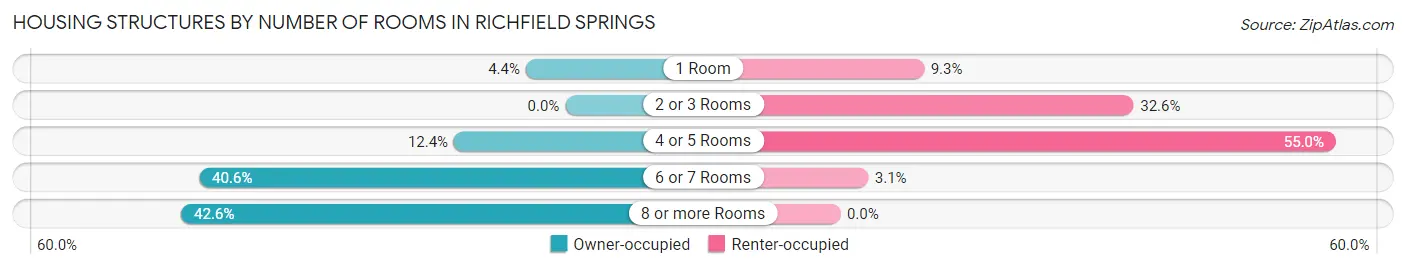
| Number of Rooms | Owner-occupied | Renter-occupied |
| 1 Room | 11 (4.4%) | 12 (9.3%) |
| 2 or 3 Rooms | 0 (0.0%) | 42 (32.6%) |
| 4 or 5 Rooms | 31 (12.3%) | 71 (55.0%) |
| 6 or 7 Rooms | 102 (40.6%) | 4 (3.1%) |
| 8 or more Rooms | 107 (42.6%) | 0 (0.0%) |
| Total | 251 (100.0%) | 129 (100.0%) |
Housing Structure by Heating Type in Richfield Springs
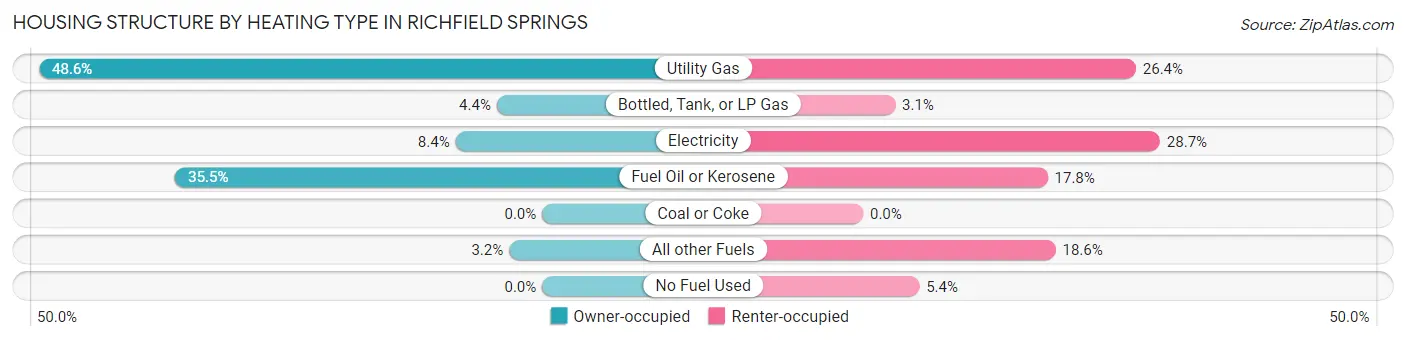
| Heating Type | Owner-occupied | Renter-occupied |
| Utility Gas | 122 (48.6%) | 34 (26.4%) |
| Bottled, Tank, or LP Gas | 11 (4.4%) | 4 (3.1%) |
| Electricity | 21 (8.4%) | 37 (28.7%) |
| Fuel Oil or Kerosene | 89 (35.5%) | 23 (17.8%) |
| Coal or Coke | 0 (0.0%) | 0 (0.0%) |
| All other Fuels | 8 (3.2%) | 24 (18.6%) |
| No Fuel Used | 0 (0.0%) | 7 (5.4%) |
| Total | 251 (100.0%) | 129 (100.0%) |
Household Vehicle Usage in Richfield Springs
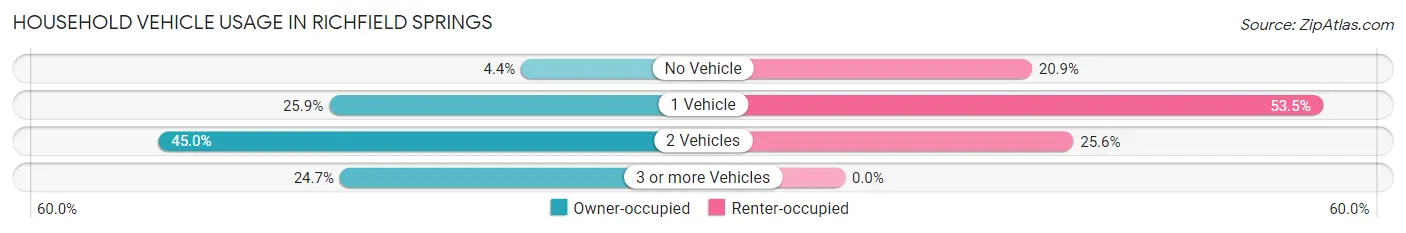
| Vehicles per Household | Owner-occupied | Renter-occupied |
| No Vehicle | 11 (4.4%) | 27 (20.9%) |
| 1 Vehicle | 65 (25.9%) | 69 (53.5%) |
| 2 Vehicles | 113 (45.0%) | 33 (25.6%) |
| 3 or more Vehicles | 62 (24.7%) | 0 (0.0%) |
| Total | 251 (100.0%) | 129 (100.0%) |
Real Estate & Mortgages in Richfield Springs
Real Estate and Mortgage Overview in Richfield Springs
| Characteristic | Without Mortgage | With Mortgage |
| Housing Units | 123 | 128 |
| Median Property Value | $126,400 | $115,200 |
| Median Household Income | $53,482 | $35 |
| Monthly Housing Costs | $464 | $2 |
| Real Estate Taxes | $2,198 | $7 |
Property Value by Mortgage Status in Richfield Springs
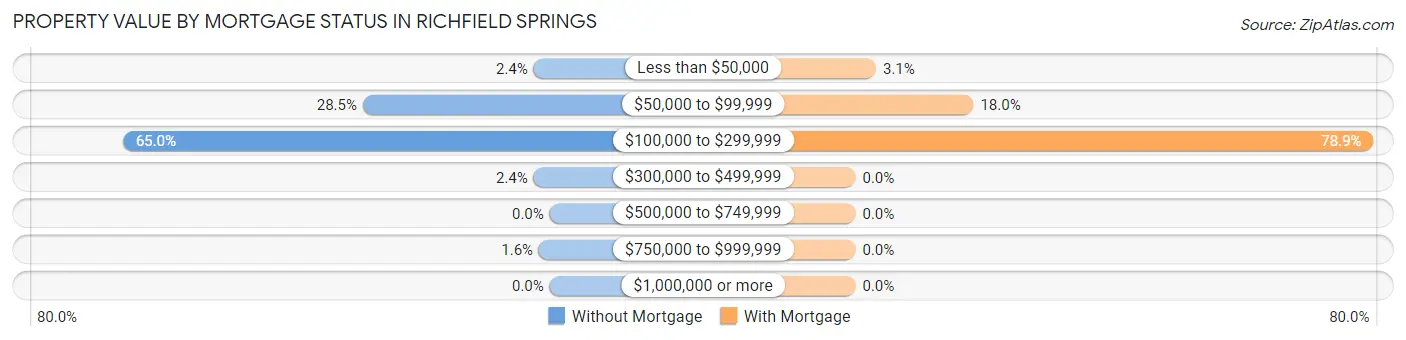
| Property Value | Without Mortgage | With Mortgage |
| Less than $50,000 | 3 (2.4%) | 4 (3.1%) |
| $50,000 to $99,999 | 35 (28.5%) | 23 (18.0%) |
| $100,000 to $299,999 | 80 (65.0%) | 101 (78.9%) |
| $300,000 to $499,999 | 3 (2.4%) | 0 (0.0%) |
| $500,000 to $749,999 | 0 (0.0%) | 0 (0.0%) |
| $750,000 to $999,999 | 2 (1.6%) | 0 (0.0%) |
| $1,000,000 or more | 0 (0.0%) | 0 (0.0%) |
| Total | 123 (100.0%) | 128 (100.0%) |
Household Income by Mortgage Status in Richfield Springs
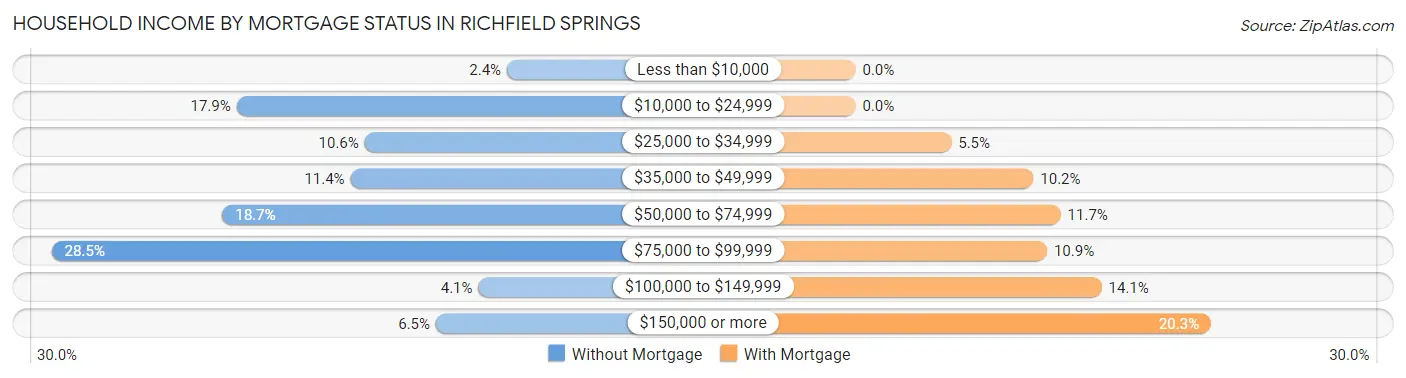
| Household Income | Without Mortgage | With Mortgage |
| Less than $10,000 | 3 (2.4%) | 0 (0.0%) |
| $10,000 to $24,999 | 22 (17.9%) | 0 (0.0%) |
| $25,000 to $34,999 | 13 (10.6%) | 7 (5.5%) |
| $35,000 to $49,999 | 14 (11.4%) | 13 (10.2%) |
| $50,000 to $74,999 | 23 (18.7%) | 15 (11.7%) |
| $75,000 to $99,999 | 35 (28.5%) | 14 (10.9%) |
| $100,000 to $149,999 | 5 (4.1%) | 18 (14.1%) |
| $150,000 or more | 8 (6.5%) | 26 (20.3%) |
| Total | 123 (100.0%) | 128 (100.0%) |
Property Value to Household Income Ratio in Richfield Springs
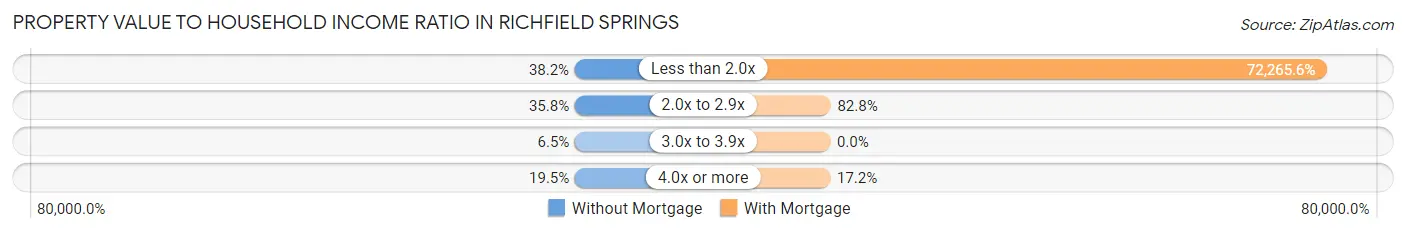
| Value-to-Income Ratio | Without Mortgage | With Mortgage |
| Less than 2.0x | 47 (38.2%) | 92,500 (72,265.6%) |
| 2.0x to 2.9x | 44 (35.8%) | 106 (82.8%) |
| 3.0x to 3.9x | 8 (6.5%) | 0 (0.0%) |
| 4.0x or more | 24 (19.5%) | 22 (17.2%) |
| Total | 123 (100.0%) | 128 (100.0%) |
Real Estate Taxes by Mortgage Status in Richfield Springs
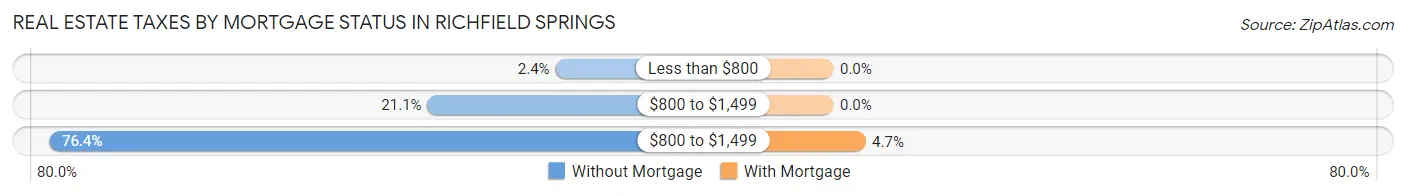
| Property Taxes | Without Mortgage | With Mortgage |
| Less than $800 | 3 (2.4%) | 0 (0.0%) |
| $800 to $1,499 | 26 (21.1%) | 0 (0.0%) |
| $800 to $1,499 | 94 (76.4%) | 6 (4.7%) |
| Total | 123 (100.0%) | 128 (100.0%) |
Health & Disability in Richfield Springs
Health Insurance Coverage by Age in Richfield Springs
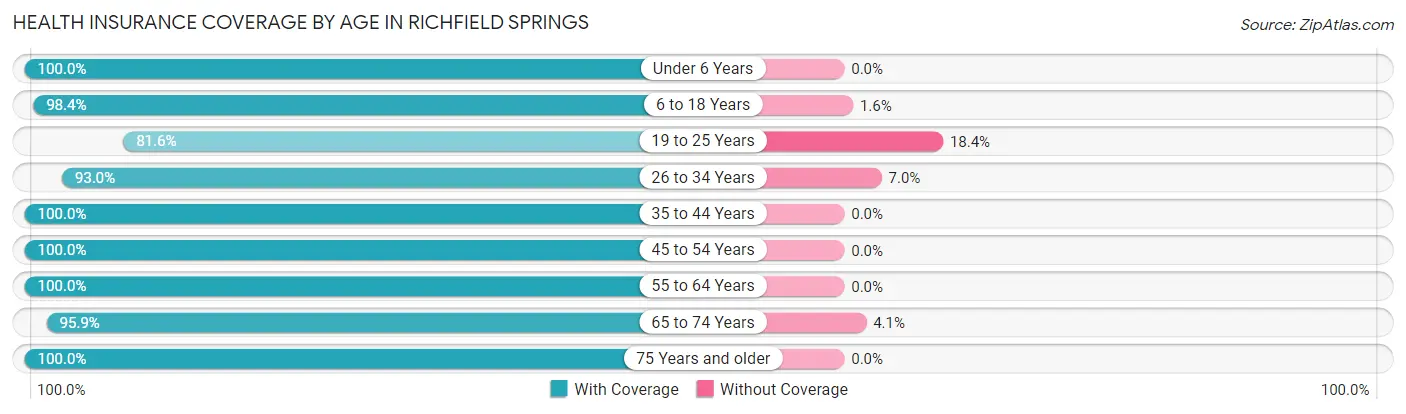
| Age Bracket | With Coverage | Without Coverage |
| Under 6 Years | 78 (100.0%) | 0 (0.0%) |
| 6 to 18 Years | 243 (98.4%) | 4 (1.6%) |
| 19 to 25 Years | 133 (81.6%) | 30 (18.4%) |
| 26 to 34 Years | 147 (93.0%) | 11 (7.0%) |
| 35 to 44 Years | 169 (100.0%) | 0 (0.0%) |
| 45 to 54 Years | 88 (100.0%) | 0 (0.0%) |
| 55 to 64 Years | 137 (100.0%) | 0 (0.0%) |
| 65 to 74 Years | 94 (95.9%) | 4 (4.1%) |
| 75 Years and older | 102 (100.0%) | 0 (0.0%) |
| Total | 1,191 (96.1%) | 49 (4.0%) |
Health Insurance Coverage by Citizenship Status in Richfield Springs
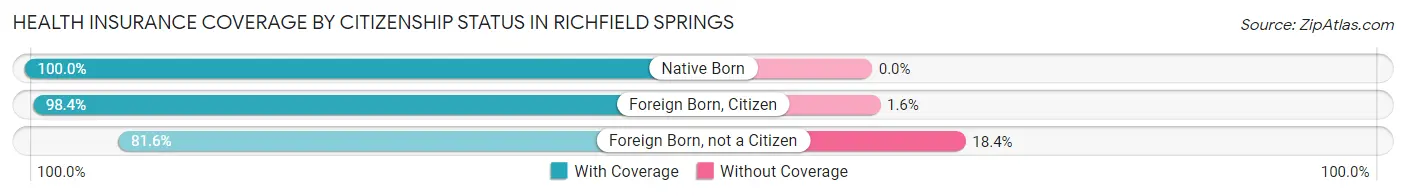
| Citizenship Status | With Coverage | Without Coverage |
| Native Born | 78 (100.0%) | 0 (0.0%) |
| Foreign Born, Citizen | 243 (98.4%) | 4 (1.6%) |
| Foreign Born, not a Citizen | 133 (81.6%) | 30 (18.4%) |
Health Insurance Coverage by Household Income in Richfield Springs
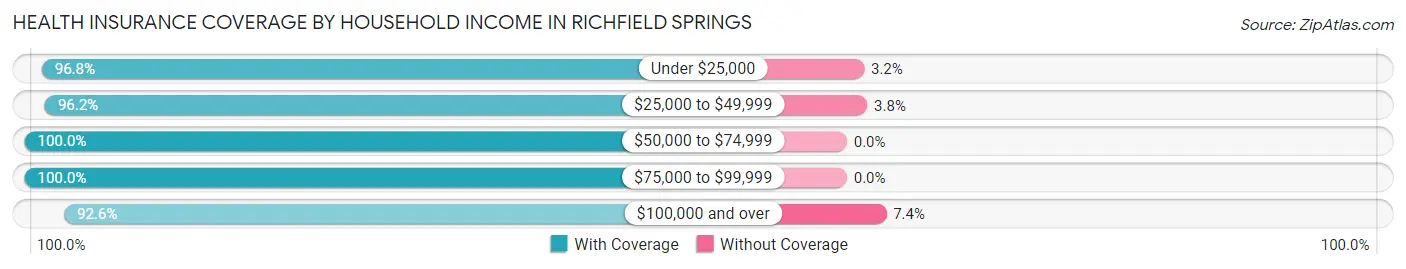
| Household Income | With Coverage | Without Coverage |
| Under $25,000 | 240 (96.8%) | 8 (3.2%) |
| $25,000 to $49,999 | 277 (96.2%) | 11 (3.8%) |
| $50,000 to $74,999 | 128 (100.0%) | 0 (0.0%) |
| $75,000 to $99,999 | 145 (100.0%) | 0 (0.0%) |
| $100,000 and over | 376 (92.6%) | 30 (7.4%) |
Public vs Private Health Insurance Coverage by Age in Richfield Springs
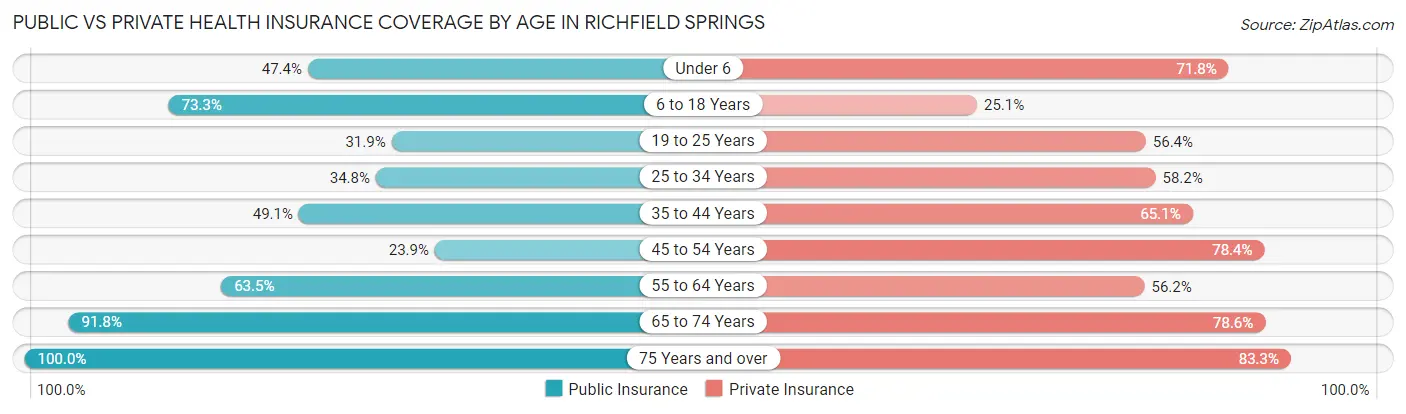
| Age Bracket | Public Insurance | Private Insurance |
| Under 6 | 37 (47.4%) | 56 (71.8%) |
| 6 to 18 Years | 181 (73.3%) | 62 (25.1%) |
| 19 to 25 Years | 52 (31.9%) | 92 (56.4%) |
| 25 to 34 Years | 55 (34.8%) | 92 (58.2%) |
| 35 to 44 Years | 83 (49.1%) | 110 (65.1%) |
| 45 to 54 Years | 21 (23.9%) | 69 (78.4%) |
| 55 to 64 Years | 87 (63.5%) | 77 (56.2%) |
| 65 to 74 Years | 90 (91.8%) | 77 (78.6%) |
| 75 Years and over | 102 (100.0%) | 85 (83.3%) |
| Total | 708 (57.1%) | 720 (58.1%) |
Disability Status by Sex by Age in Richfield Springs
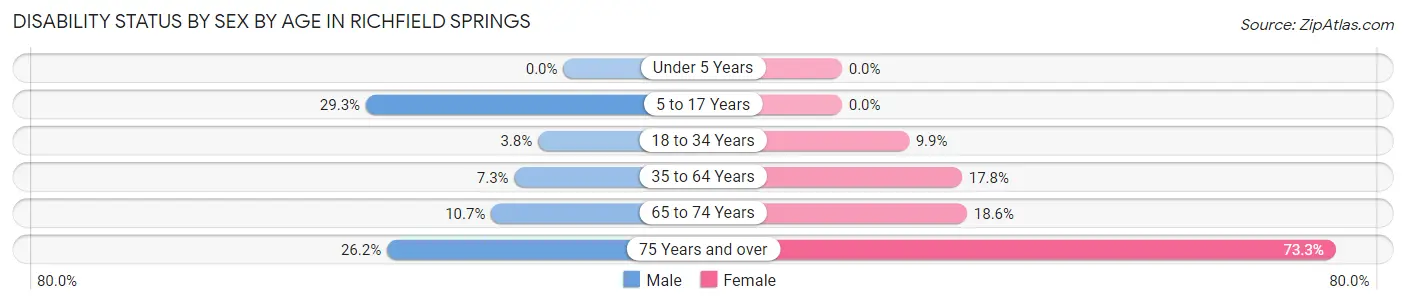
| Age Bracket | Male | Female |
| Under 5 Years | 0 (0.0%) | 0 (0.0%) |
| 5 to 17 Years | 39 (29.3%) | 0 (0.0%) |
| 18 to 34 Years | 6 (3.7%) | 16 (9.9%) |
| 35 to 64 Years | 16 (7.3%) | 31 (17.8%) |
| 65 to 74 Years | 3 (10.7%) | 13 (18.6%) |
| 75 Years and over | 11 (26.2%) | 44 (73.3%) |
Disability Class by Sex by Age in Richfield Springs
Disability Class: Hearing Difficulty
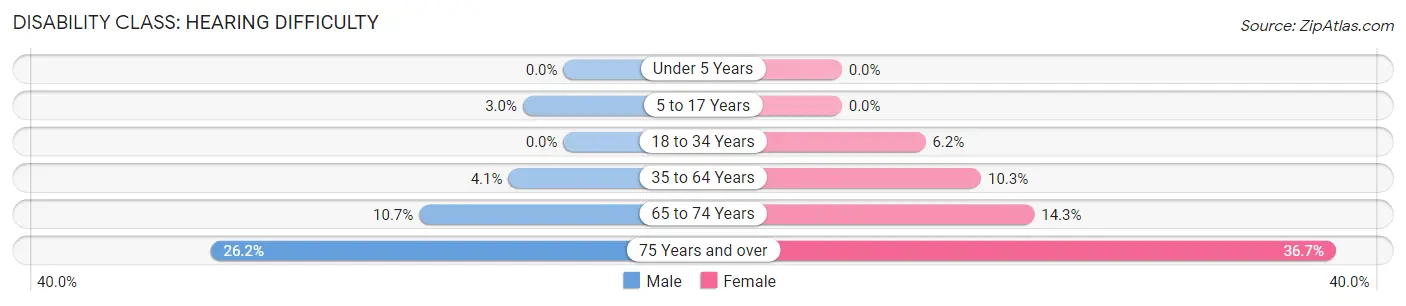
| Age Bracket | Male | Female |
| Under 5 Years | 0 (0.0%) | 0 (0.0%) |
| 5 to 17 Years | 4 (3.0%) | 0 (0.0%) |
| 18 to 34 Years | 0 (0.0%) | 10 (6.2%) |
| 35 to 64 Years | 9 (4.1%) | 18 (10.3%) |
| 65 to 74 Years | 3 (10.7%) | 10 (14.3%) |
| 75 Years and over | 11 (26.2%) | 22 (36.7%) |
Disability Class: Vision Difficulty
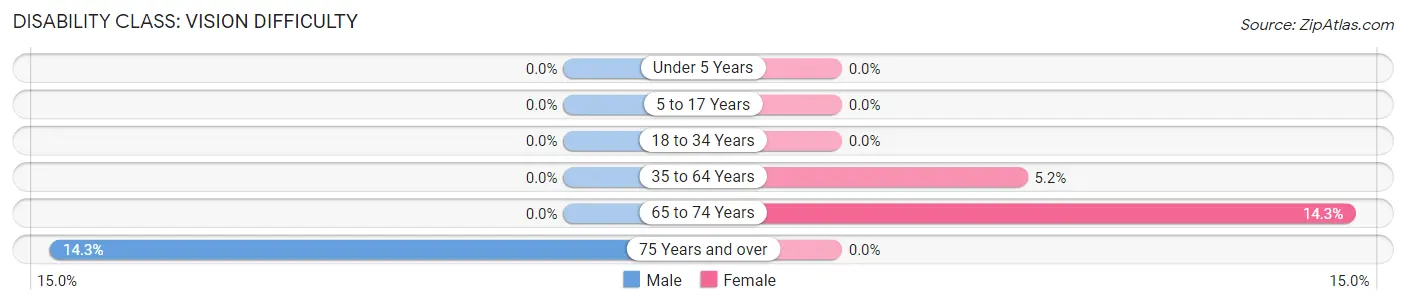
| Age Bracket | Male | Female |
| Under 5 Years | 0 (0.0%) | 0 (0.0%) |
| 5 to 17 Years | 0 (0.0%) | 0 (0.0%) |
| 18 to 34 Years | 0 (0.0%) | 0 (0.0%) |
| 35 to 64 Years | 0 (0.0%) | 9 (5.2%) |
| 65 to 74 Years | 0 (0.0%) | 10 (14.3%) |
| 75 Years and over | 6 (14.3%) | 0 (0.0%) |
Disability Class: Cognitive Difficulty
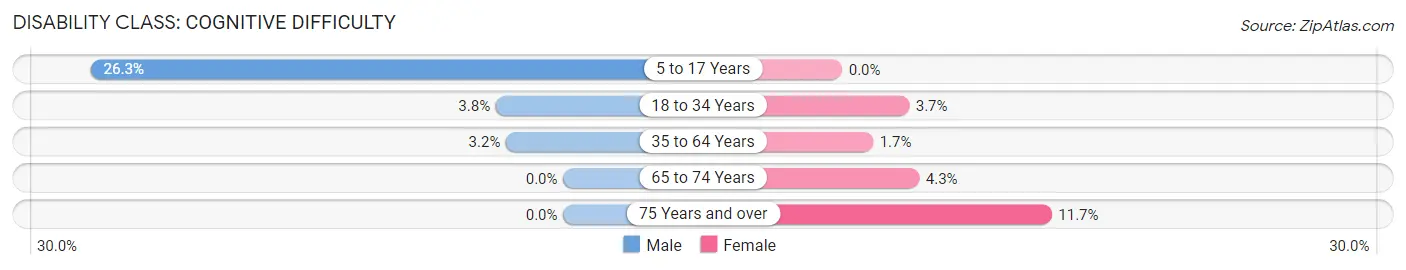
| Age Bracket | Male | Female |
| 5 to 17 Years | 35 (26.3%) | 0 (0.0%) |
| 18 to 34 Years | 6 (3.7%) | 6 (3.7%) |
| 35 to 64 Years | 7 (3.2%) | 3 (1.7%) |
| 65 to 74 Years | 0 (0.0%) | 3 (4.3%) |
| 75 Years and over | 0 (0.0%) | 7 (11.7%) |
Disability Class: Ambulatory Difficulty
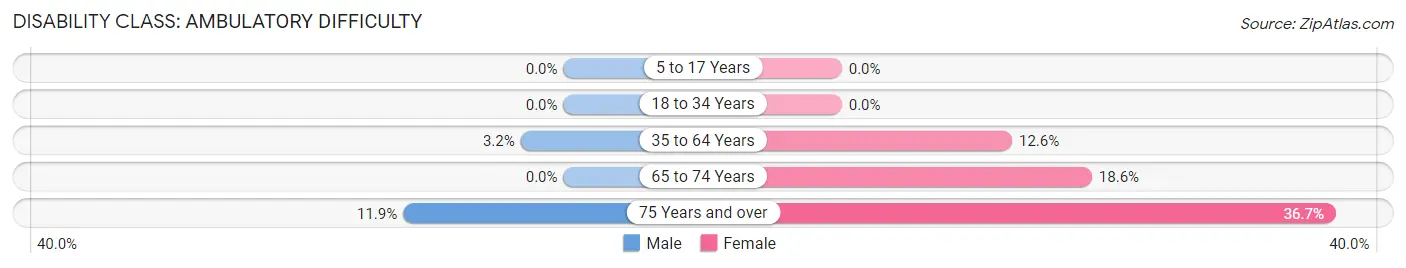
| Age Bracket | Male | Female |
| 5 to 17 Years | 0 (0.0%) | 0 (0.0%) |
| 18 to 34 Years | 0 (0.0%) | 0 (0.0%) |
| 35 to 64 Years | 7 (3.2%) | 22 (12.6%) |
| 65 to 74 Years | 0 (0.0%) | 13 (18.6%) |
| 75 Years and over | 5 (11.9%) | 22 (36.7%) |
Disability Class: Self-Care Difficulty
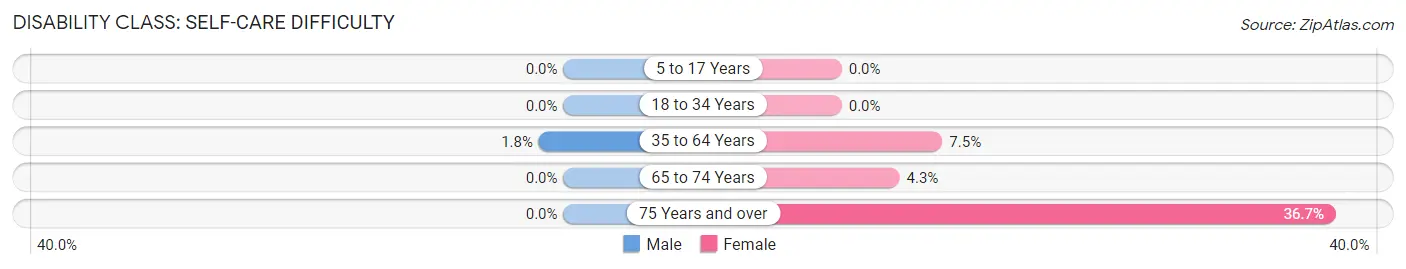
| Age Bracket | Male | Female |
| 5 to 17 Years | 0 (0.0%) | 0 (0.0%) |
| 18 to 34 Years | 0 (0.0%) | 0 (0.0%) |
| 35 to 64 Years | 4 (1.8%) | 13 (7.5%) |
| 65 to 74 Years | 0 (0.0%) | 3 (4.3%) |
| 75 Years and over | 0 (0.0%) | 22 (36.7%) |
Technology Access in Richfield Springs
Computing Device Access in Richfield Springs
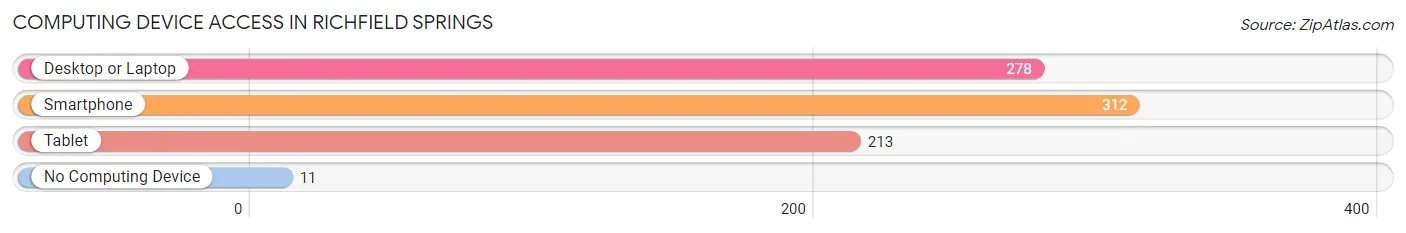
| Device Type | # Households | % Households |
| Desktop or Laptop | 278 | 73.2% |
| Smartphone | 312 | 82.1% |
| Tablet | 213 | 56.0% |
| No Computing Device | 11 | 2.9% |
| Total | 380 | 100.0% |
Internet Access in Richfield Springs
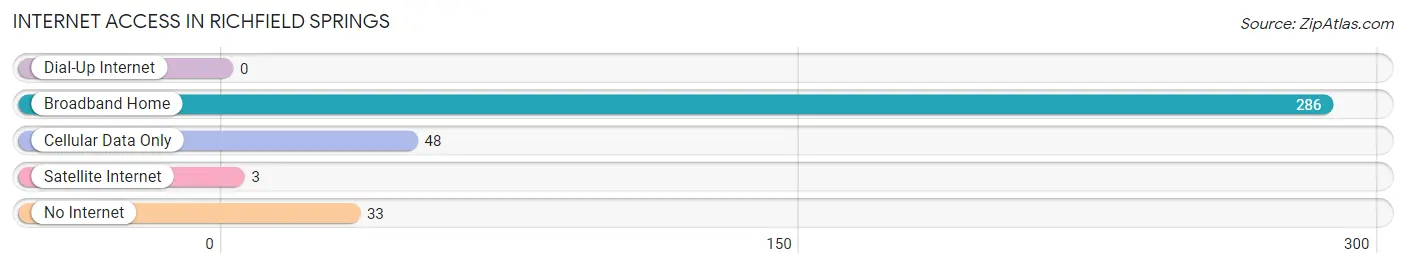
| Internet Type | # Households | % Households |
| Dial-Up Internet | 0 | 0.0% |
| Broadband Home | 286 | 75.3% |
| Cellular Data Only | 48 | 12.6% |
| Satellite Internet | 3 | 0.8% |
| No Internet | 33 | 8.7% |
| Total | 380 | 100.0% |
Richfield Springs Summary
Richfield Springs, New York is a small village located in the central part of the state, in Otsego County. It is situated on the western shore of Canadarago Lake, and is part of the Town of Richfield. The village has a population of 1,717 people, according to the 2010 census.
History
Richfield Springs was first settled in 1786 by a group of settlers from Connecticut. The village was originally known as "The Springs," due to the numerous natural springs in the area. In 1808, the village was officially incorporated as Richfield Springs. The name was chosen to honor the original settlers, who were from Richfield, Connecticut.
The village grew rapidly in the 19th century, due to its location on the Erie Canal. The canal provided a convenient transportation route for goods and people, and the village became a popular stop for travelers. The village also became a popular destination for tourists, due to its natural beauty and the numerous mineral springs in the area.
In the late 19th century, the village was home to several large industries, including a paper mill, a tannery, and a woolen mill. These industries provided employment for many of the village's residents.
Geography
Richfield Springs is located in the central part of New York State, in Otsego County. The village is situated on the western shore of Canadarago Lake, and is part of the Town of Richfield. The village is located approximately 25 miles south of Utica, and 50 miles west of Albany.
The village is located in a rural area, and is surrounded by rolling hills and forests. The village is located at an elevation of 1,100 feet above sea level.
Economy
The economy of Richfield Springs is largely based on tourism and agriculture. The village is a popular destination for tourists, due to its natural beauty and the numerous mineral springs in the area. The village is also home to several small businesses, including restaurants, shops, and lodging.
Agriculture is also an important part of the local economy. The surrounding area is home to several farms, which produce a variety of crops, including corn, soybeans, and hay.
Demographics
According to the 2010 census, the population of Richfield Springs is 1,717 people. The population is predominantly white (94.3%), with small percentages of African American (2.2%), Native American (0.7%), and Asian (0.6%) residents. The median household income is $41,944, and the median age is 43.7 years.
Common Questions
What is Per Capita Income in Richfield Springs?
Per Capita income in Richfield Springs is $27,504.
What is the Median Family Income in Richfield Springs?
Median Family Income in Richfield Springs is $54,821.
What is the Median Household income in Richfield Springs?
Median Household Income in Richfield Springs is $54,643.
What is Income or Wage Gap in Richfield Springs?
Income or Wage Gap in Richfield Springs is 26.4%.
Women in Richfield Springs earn 73.6 cents for every dollar earned by a man.
What is Inequality or Gini Index in Richfield Springs?
Inequality or Gini Index in Richfield Springs is 0.41.
What is the Total Population of Richfield Springs?
Total Population of Richfield Springs is 1,240.
What is the Total Male Population of Richfield Springs?
Total Male Population of Richfield Springs is 629.
What is the Total Female Population of Richfield Springs?
Total Female Population of Richfield Springs is 611.
What is the Ratio of Males per 100 Females in Richfield Springs?
There are 102.95 Males per 100 Females in Richfield Springs.
What is the Ratio of Females per 100 Males in Richfield Springs?
There are 97.14 Females per 100 Males in Richfield Springs.
What is the Median Population Age in Richfield Springs?
Median Population Age in Richfield Springs is 33.7 Years.
What is the Average Family Size in Richfield Springs
Average Family Size in Richfield Springs is 3.6 People.
What is the Average Household Size in Richfield Springs
Average Household Size in Richfield Springs is 3.2 People.
How Large is the Labor Force in Richfield Springs?
There are 585 People in the Labor Forcein in Richfield Springs.
What is the Percentage of People in the Labor Force in Richfield Springs?
59.5% of People are in the Labor Force in Richfield Springs.
What is the Unemployment Rate in Richfield Springs?
Unemployment Rate in Richfield Springs is 1.4%.