Theresa, NY Map & Demographics
Theresa Map
Theresa Overview
$29,431
PER CAPITA INCOME
$73,750
AVG FAMILY INCOME
$55,556
AVG HOUSEHOLD INCOME
8.3%
WAGE / INCOME GAP [ % ]
91.7¢/ $1
WAGE / INCOME GAP [ $ ]
0.34
INEQUALITY / GINI INDEX
919
TOTAL POPULATION
563
MALE POPULATION
356
FEMALE POPULATION
158.15
MALES / 100 FEMALES
63.23
FEMALES / 100 MALES
29.5
MEDIAN AGE
2.7
AVG FAMILY SIZE
2.9
AVG HOUSEHOLD SIZE
650
LABOR FORCE [ PEOPLE ]
82.9%
PERCENT IN LABOR FORCE
4.1%
UNEMPLOYMENT RATE
Theresa Zip Codes
Theresa Area Codes
Income in Theresa
Income Overview in Theresa
Per Capita Income in Theresa is $29,431, while median incomes of families and households are $73,750 and $55,556 respectively.
| Characteristic | Number | Measure |
| Per Capita Income | 919 | $29,431 |
| Median Family Income | 156 | $73,750 |
| Mean Family Income | 156 | $83,299 |
| Median Household Income | 316 | $55,556 |
| Mean Household Income | 316 | $71,478 |
| Income Deficit | 156 | $0 |
| Wage / Income Gap (%) | 919 | 8.34% |
| Wage / Income Gap ($) | 919 | 91.66¢ per $1 |
| Gini / Inequality Index | 919 | 0.34 |
Earnings by Sex in Theresa
Average Earnings in Theresa are $26,483, $26,687 for men and $24,460 for women, a difference of 8.3%.
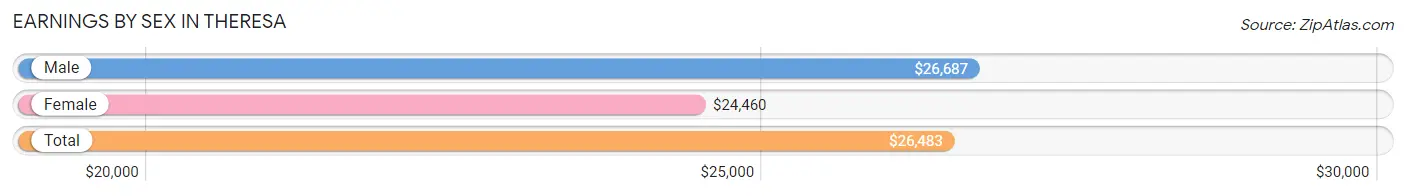
| Sex | Number | Average Earnings |
| Male | 418 (65.2%) | $26,687 |
| Female | 223 (34.8%) | $24,460 |
| Total | 641 (100.0%) | $26,483 |
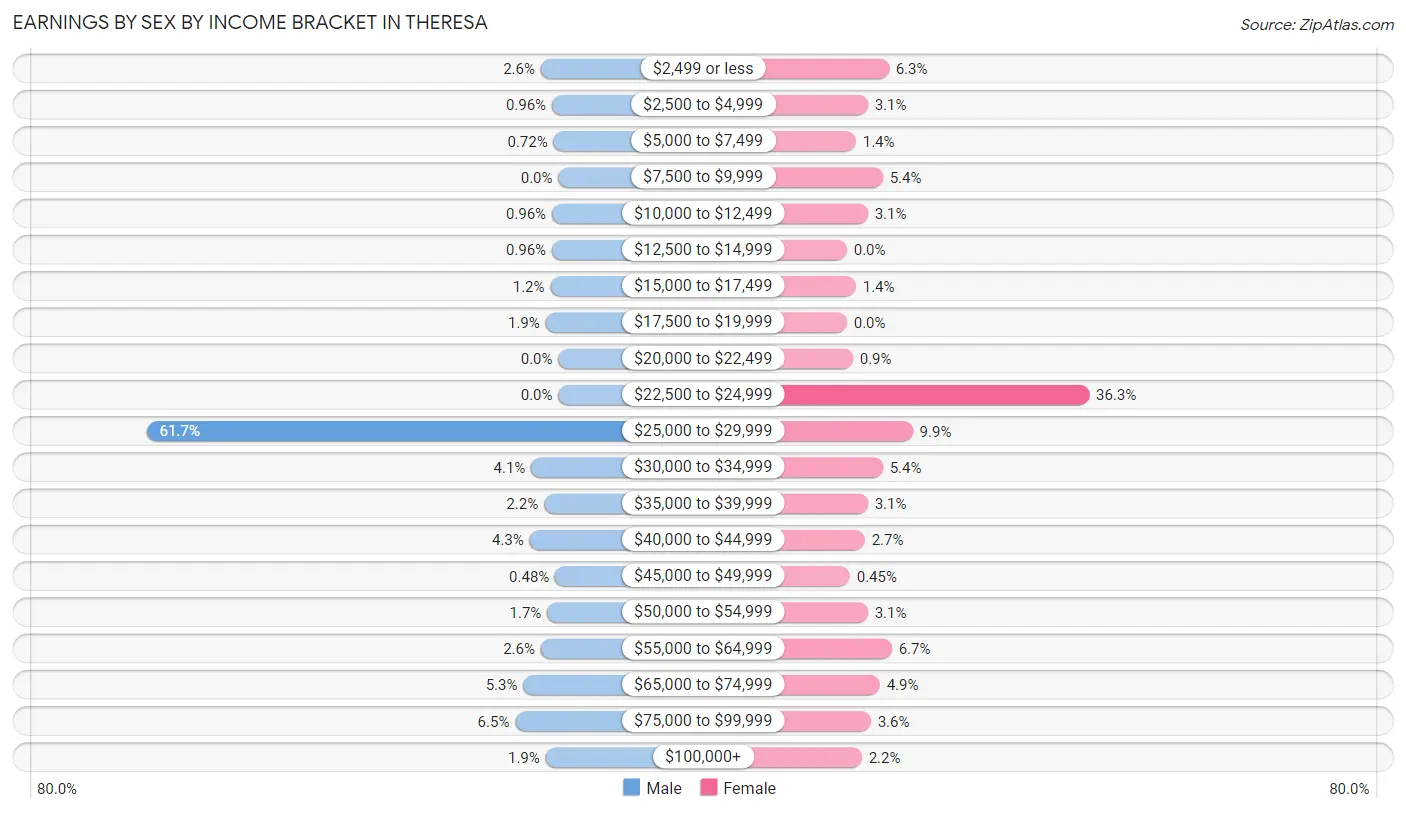
Earnings by Sex by Income Bracket in Theresa
The most common earnings brackets in Theresa are $25,000 to $29,999 for men (258 | 61.7%) and $22,500 to $24,999 for women (81 | 36.3%).
| Income | Male | Female |
| $2,499 or less | 11 (2.6%) | 14 (6.3%) |
| $2,500 to $4,999 | 4 (1.0%) | 7 (3.1%) |
| $5,000 to $7,499 | 3 (0.7%) | 3 (1.3%) |
| $7,500 to $9,999 | 0 (0.0%) | 12 (5.4%) |
| $10,000 to $12,499 | 4 (1.0%) | 7 (3.1%) |
| $12,500 to $14,999 | 4 (1.0%) | 0 (0.0%) |
| $15,000 to $17,499 | 5 (1.2%) | 3 (1.3%) |
| $17,500 to $19,999 | 8 (1.9%) | 0 (0.0%) |
| $20,000 to $22,499 | 0 (0.0%) | 2 (0.9%) |
| $22,500 to $24,999 | 0 (0.0%) | 81 (36.3%) |
| $25,000 to $29,999 | 258 (61.7%) | 22 (9.9%) |
| $30,000 to $34,999 | 17 (4.1%) | 12 (5.4%) |
| $35,000 to $39,999 | 9 (2.1%) | 7 (3.1%) |
| $40,000 to $44,999 | 18 (4.3%) | 6 (2.7%) |
| $45,000 to $49,999 | 2 (0.5%) | 1 (0.4%) |
| $50,000 to $54,999 | 7 (1.7%) | 7 (3.1%) |
| $55,000 to $64,999 | 11 (2.6%) | 15 (6.7%) |
| $65,000 to $74,999 | 22 (5.3%) | 11 (4.9%) |
| $75,000 to $99,999 | 27 (6.5%) | 8 (3.6%) |
| $100,000+ | 8 (1.9%) | 5 (2.2%) |
| Total | 418 (100.0%) | 223 (100.0%) |
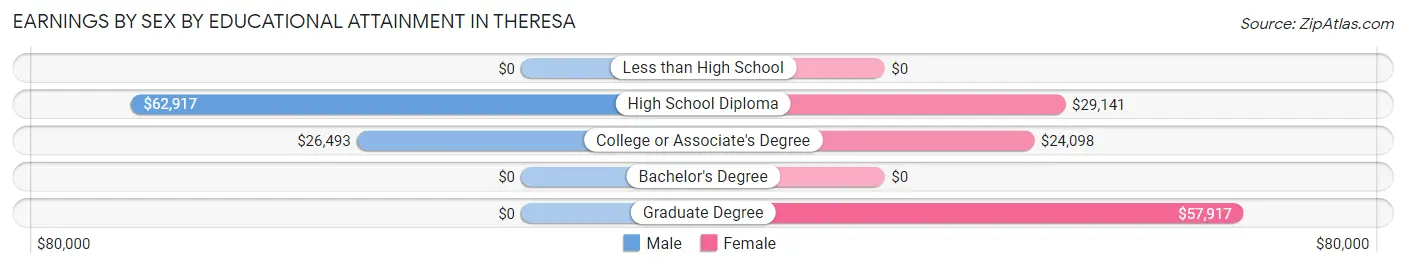
Earnings by Sex by Educational Attainment in Theresa
Average earnings in Theresa are $26,751 for men and $24,645 for women, a difference of 7.9%. Men with an educational attainment of high school diploma enjoy the highest average annual earnings of $62,917, while those with college or associate's degree education earn the least with $26,493. Women with an educational attainment of graduate degree earn the most with the average annual earnings of $57,917, while those with college or associate's degree education have the smallest earnings of $24,098.
| Educational Attainment | Male Income | Female Income |
| Less than High School | - | - |
| High School Diploma | $62,917 | $29,141 |
| College or Associate's Degree | $26,493 | $24,098 |
| Bachelor's Degree | - | - |
| Graduate Degree | - | - |
| Total | $26,751 | $24,645 |
Family Income in Theresa
Family Income Brackets in Theresa
According to the Theresa family income data, there are 40 families falling into the $50,000 to $74,999 income range, which is the most common income bracket and makes up 25.6% of all families.
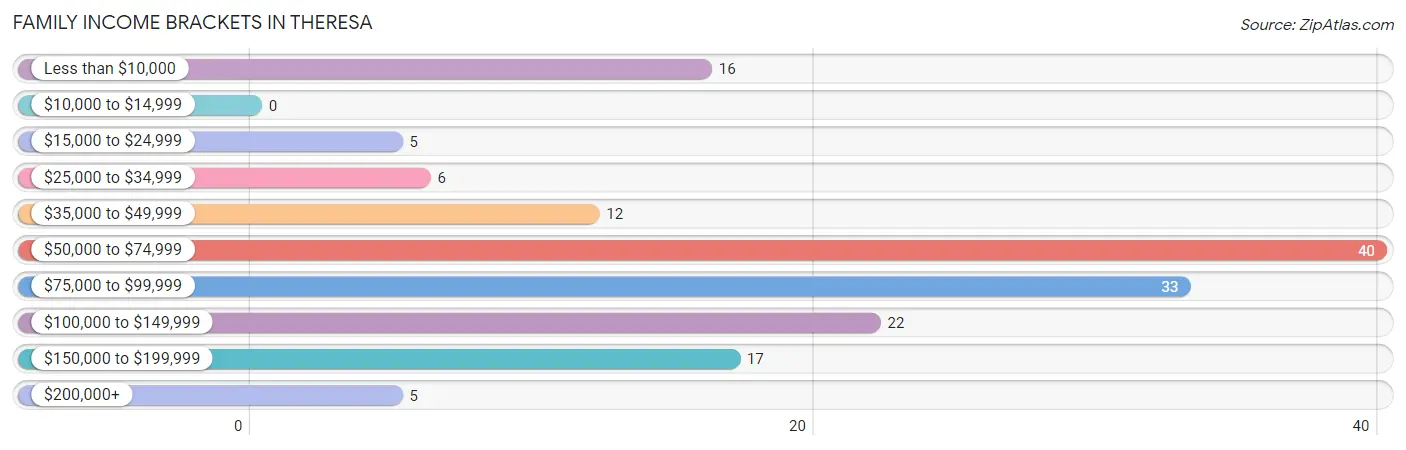
| Income Bracket | # Families | % Families |
| Less than $10,000 | 16 | 10.3% |
| $10,000 to $14,999 | 0 | 0.0% |
| $15,000 to $24,999 | 5 | 3.2% |
| $25,000 to $34,999 | 6 | 3.8% |
| $35,000 to $49,999 | 12 | 7.7% |
| $50,000 to $74,999 | 40 | 25.6% |
| $75,000 to $99,999 | 33 | 21.2% |
| $100,000 to $149,999 | 22 | 14.1% |
| $150,000 to $199,999 | 17 | 10.9% |
| $200,000+ | 5 | 3.2% |
Family Income by Famaliy Size in Theresa
2-person families (98 | 62.8%) account for the highest median family income in Theresa with $88,750 per family, while 2-person families (98 | 62.8%) have the highest median income of $44,375 per family member.
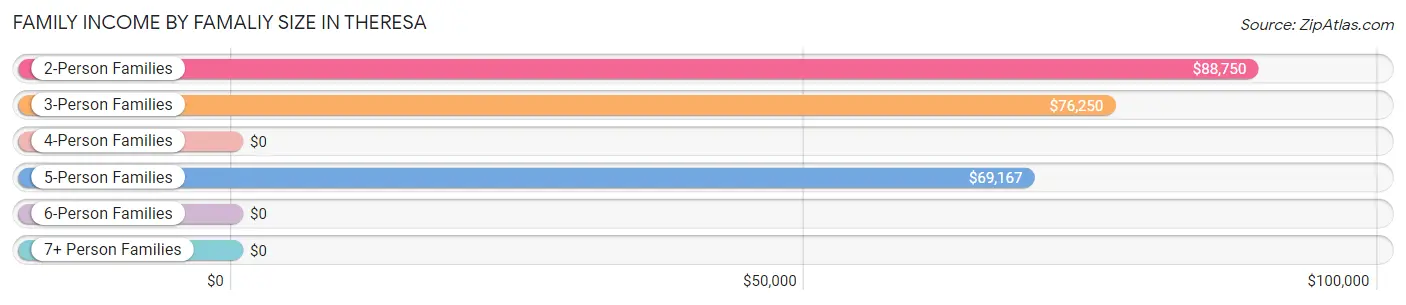
| Income Bracket | # Families | Median Income |
| 2-Person Families | 98 (62.8%) | $88,750 |
| 3-Person Families | 27 (17.3%) | $76,250 |
| 4-Person Families | 23 (14.7%) | $0 |
| 5-Person Families | 6 (3.8%) | $69,167 |
| 6-Person Families | 2 (1.3%) | $0 |
| 7+ Person Families | 0 (0.0%) | $0 |
| Total | 156 (100.0%) | $73,750 |
Family Income by Number of Earners in Theresa
The median family income in Theresa is $73,750, with families comprising 2 earners (59) having the highest median family income of $108,125, while families with no earners (42) have the lowest median family income of $56,250, accounting for 37.8% and 26.9% of families, respectively.
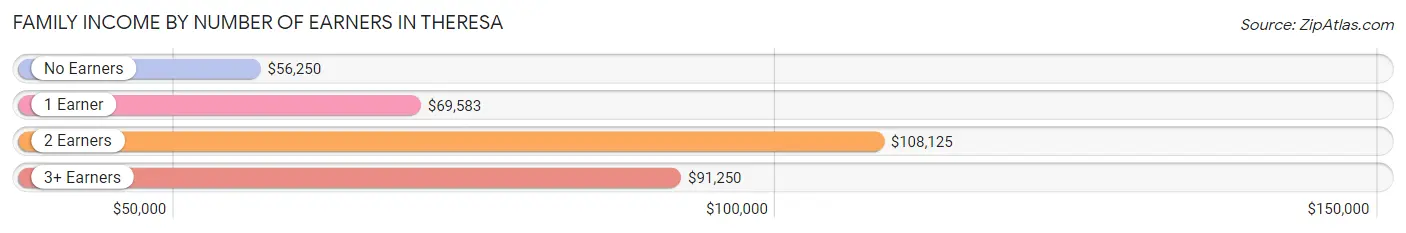
| Number of Earners | # Families | Median Income |
| No Earners | 42 (26.9%) | $56,250 |
| 1 Earner | 49 (31.4%) | $69,583 |
| 2 Earners | 59 (37.8%) | $108,125 |
| 3+ Earners | 6 (3.8%) | $91,250 |
| Total | 156 (100.0%) | $73,750 |
Household Income in Theresa
Household Income Brackets in Theresa
With 141 households falling in the category, the $50,000 to $74,999 income range is the most frequent in Theresa, accounting for 44.6% of all households. In contrast, only 5 households (1.6%) fall into the $10,000 to $14,999 income bracket, making it the least populous group.
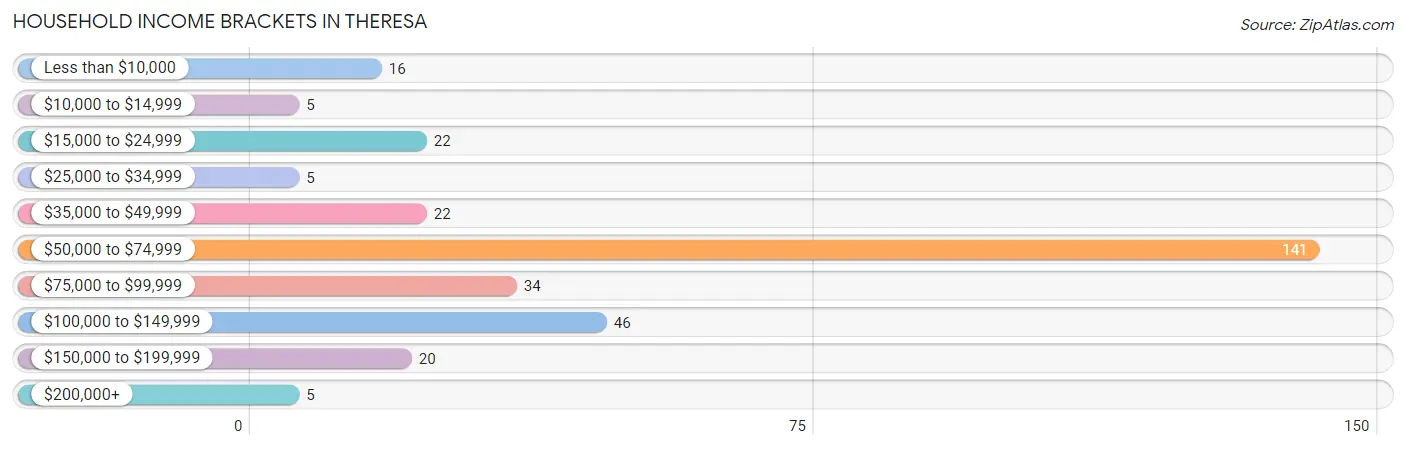
| Income Bracket | # Households | % Households |
| Less than $10,000 | 16 | 5.1% |
| $10,000 to $14,999 | 5 | 1.6% |
| $15,000 to $24,999 | 22 | 7.0% |
| $25,000 to $34,999 | 5 | 1.6% |
| $35,000 to $49,999 | 22 | 7.0% |
| $50,000 to $74,999 | 141 | 44.6% |
| $75,000 to $99,999 | 34 | 10.8% |
| $100,000 to $149,999 | 46 | 14.6% |
| $150,000 to $199,999 | 20 | 6.3% |
| $200,000+ | 5 | 1.6% |
Household Income by Householder Age in Theresa
The median household income in Theresa is $55,556, with the highest median household income of $93,438 found in the 45 to 64 years age bracket for the primary householder. A total of 74 households (23.4%) fall into this category. Meanwhile, the 15 to 24 years age bracket for the primary householder has the lowest median household income of $0, with 11 households (3.5%) in this group.
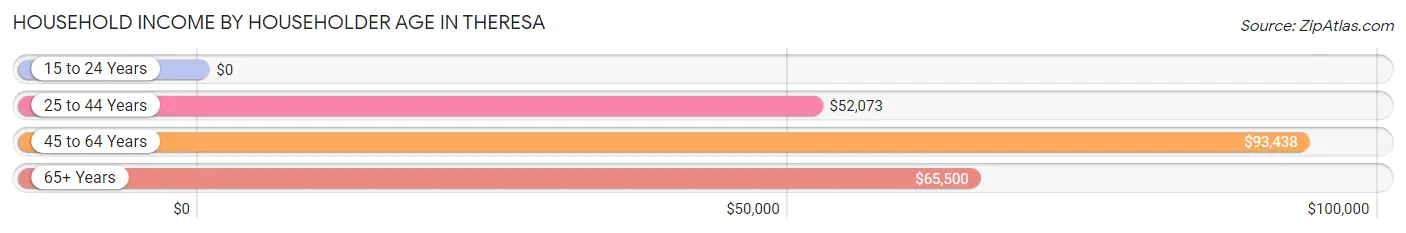
| Income Bracket | # Households | Median Income |
| 15 to 24 Years | 11 (3.5%) | $0 |
| 25 to 44 Years | 189 (59.8%) | $52,073 |
| 45 to 64 Years | 74 (23.4%) | $93,438 |
| 65+ Years | 42 (13.3%) | $65,500 |
| Total | 316 (100.0%) | $55,556 |
Poverty in Theresa
Income Below Poverty by Sex and Age in Theresa
With 13.9% poverty level for males and 8.7% for females among the residents of Theresa, under 5 year old males and 35 to 44 year old females are the most vulnerable to poverty, with 9 males (100.0%) and 9 females (34.6%) in their respective age groups living below the poverty level.
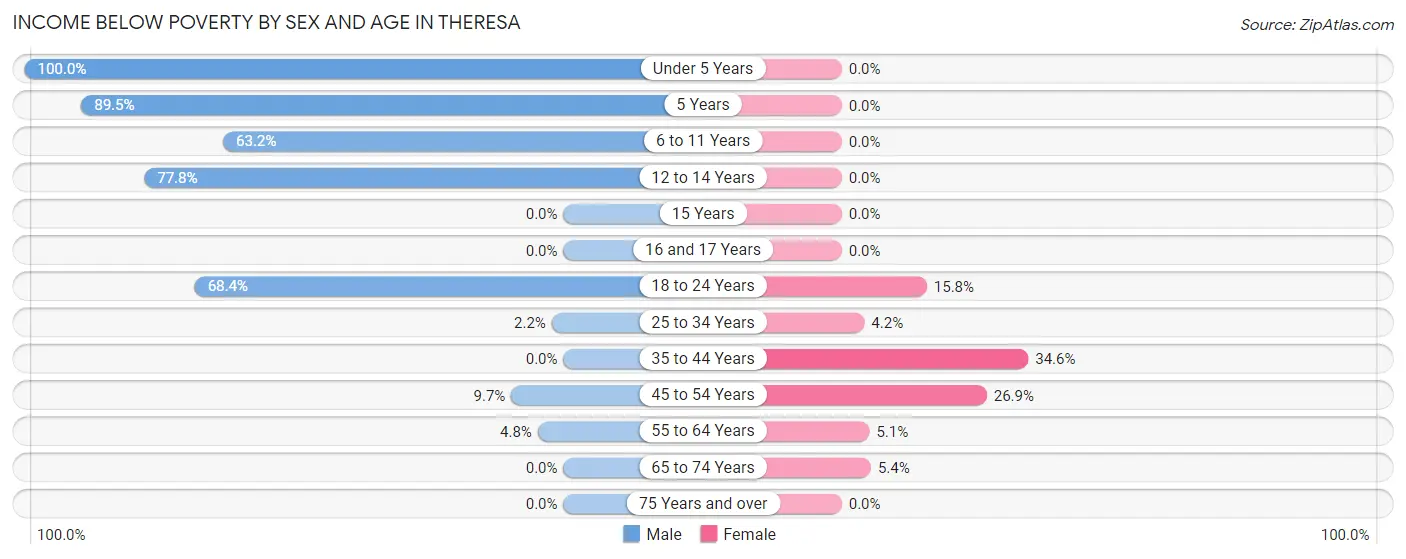
| Age Bracket | Male | Female |
| Under 5 Years | 9 (100.0%) | 0 (0.0%) |
| 5 Years | 17 (89.5%) | 0 (0.0%) |
| 6 to 11 Years | 12 (63.2%) | 0 (0.0%) |
| 12 to 14 Years | 14 (77.8%) | 0 (0.0%) |
| 15 Years | 0 (0.0%) | 0 (0.0%) |
| 16 and 17 Years | 0 (0.0%) | 0 (0.0%) |
| 18 to 24 Years | 13 (68.4%) | 3 (15.8%) |
| 25 to 34 Years | 7 (2.2%) | 6 (4.2%) |
| 35 to 44 Years | 0 (0.0%) | 9 (34.6%) |
| 45 to 54 Years | 3 (9.7%) | 7 (26.9%) |
| 55 to 64 Years | 2 (4.8%) | 2 (5.1%) |
| 65 to 74 Years | 0 (0.0%) | 2 (5.4%) |
| 75 Years and over | 0 (0.0%) | 0 (0.0%) |
| Total | 77 (13.9%) | 29 (8.7%) |
Income Above Poverty by Sex and Age in Theresa
According to the poverty statistics in Theresa, males aged 15 years and females aged under 5 years are the age groups that are most secure financially, with 100.0% of males and 100.0% of females in these age groups living above the poverty line.
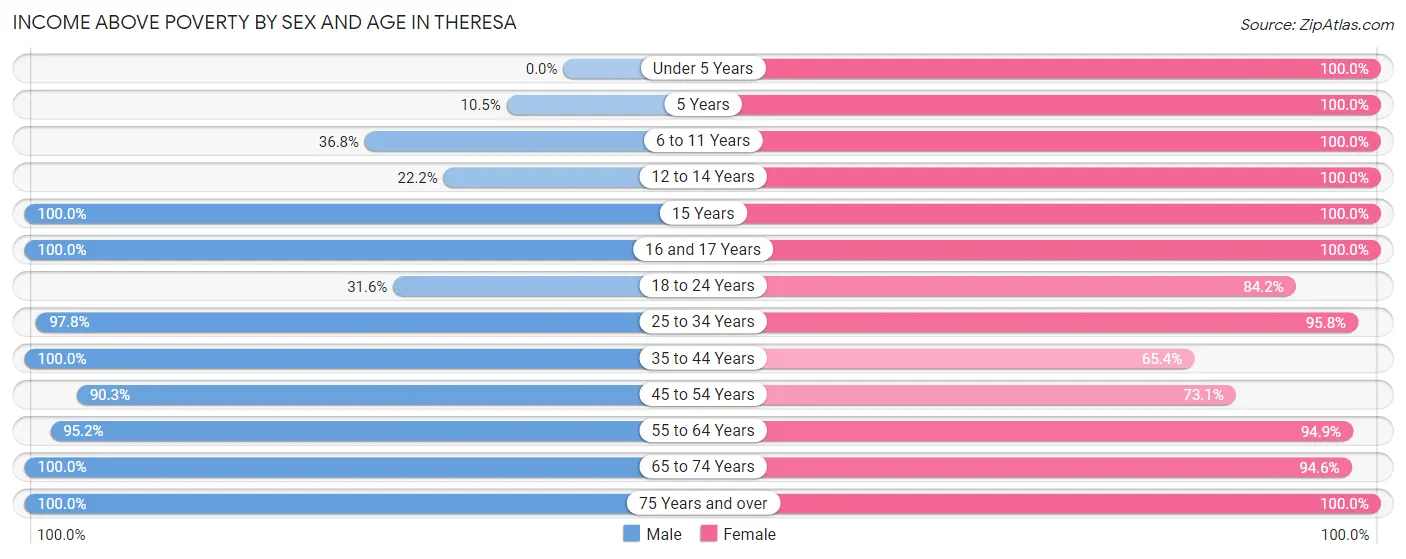
| Age Bracket | Male | Female |
| Under 5 Years | 0 (0.0%) | 19 (100.0%) |
| 5 Years | 2 (10.5%) | 5 (100.0%) |
| 6 to 11 Years | 7 (36.8%) | 5 (100.0%) |
| 12 to 14 Years | 4 (22.2%) | 6 (100.0%) |
| 15 Years | 2 (100.0%) | 2 (100.0%) |
| 16 and 17 Years | 4 (100.0%) | 2 (100.0%) |
| 18 to 24 Years | 6 (31.6%) | 16 (84.2%) |
| 25 to 34 Years | 316 (97.8%) | 137 (95.8%) |
| 35 to 44 Years | 39 (100.0%) | 17 (65.4%) |
| 45 to 54 Years | 28 (90.3%) | 19 (73.1%) |
| 55 to 64 Years | 40 (95.2%) | 37 (94.9%) |
| 65 to 74 Years | 21 (100.0%) | 35 (94.6%) |
| 75 Years and over | 8 (100.0%) | 5 (100.0%) |
| Total | 477 (86.1%) | 305 (91.3%) |
Income Below Poverty Among Married-Couple Families in Theresa
The poverty statistics for married-couple families in Theresa show that 2.7% or 3 of the total 110 families live below the poverty line. Families with 1 or 2 children have the highest poverty rate of 10.3%, comprising of 3 families. On the other hand, families with no children have the lowest poverty rate of 0.0%, which includes 0 families.
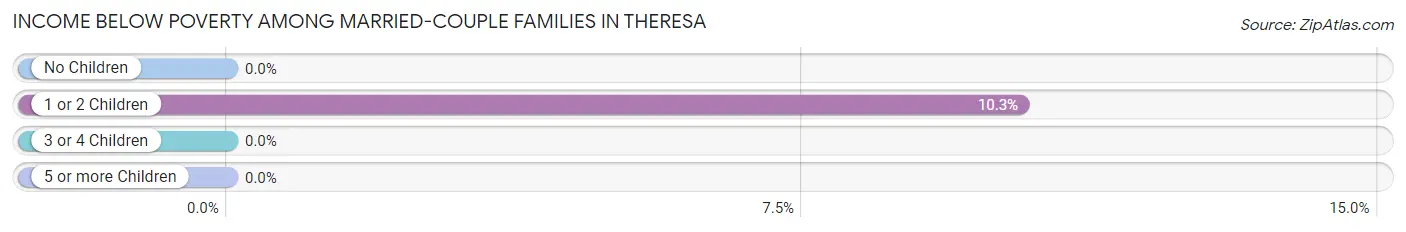
| Children | Above Poverty | Below Poverty |
| No Children | 79 (100.0%) | 0 (0.0%) |
| 1 or 2 Children | 26 (89.7%) | 3 (10.3%) |
| 3 or 4 Children | 2 (100.0%) | 0 (0.0%) |
| 5 or more Children | 0 (0.0%) | 0 (0.0%) |
| Total | 107 (97.3%) | 3 (2.7%) |
Income Below Poverty Among Single-Parent Households in Theresa
According to the poverty data in Theresa, 20.8% or 5 single-father households and 59.1% or 13 single-mother households are living below the poverty line. Among single-father households, those with 1 or 2 children have the highest poverty rate, with 5 households (31.2%) experiencing poverty. Likewise, among single-mother households, those with 3 or 4 children have the highest poverty rate, with 9 households (81.8%) falling below the poverty line.
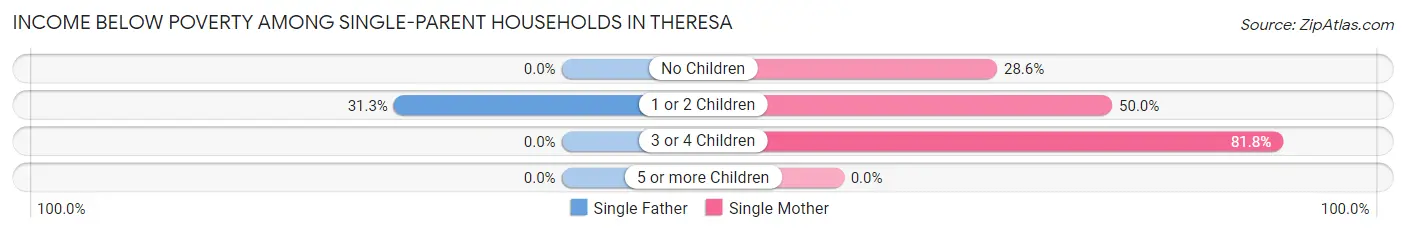
| Children | Single Father | Single Mother |
| No Children | 0 (0.0%) | 2 (28.6%) |
| 1 or 2 Children | 5 (31.2%) | 2 (50.0%) |
| 3 or 4 Children | 0 (0.0%) | 9 (81.8%) |
| 5 or more Children | 0 (0.0%) | 0 (0.0%) |
| Total | 5 (20.8%) | 13 (59.1%) |
Income Below Poverty Among Married-Couple vs Single-Parent Households in Theresa
The poverty data for Theresa shows that 3 of the married-couple family households (2.7%) and 18 of the single-parent households (39.1%) are living below the poverty level. Within the married-couple family households, those with 1 or 2 children have the highest poverty rate, with 3 households (10.3%) falling below the poverty line. Among the single-parent households, those with 3 or 4 children have the highest poverty rate, with 9 household (75.0%) living below poverty.
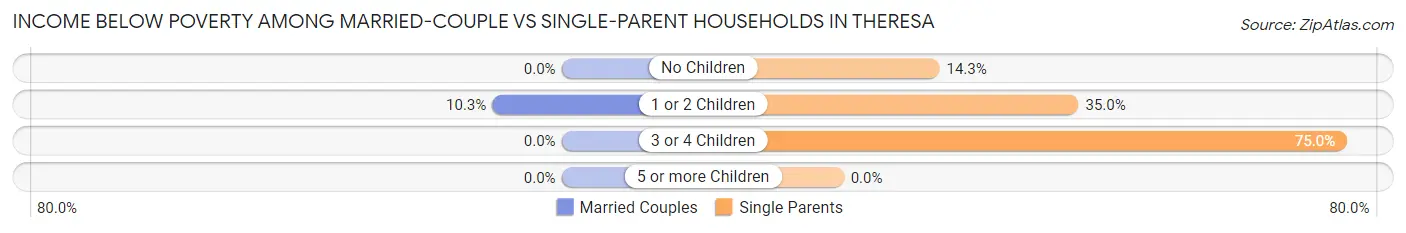
| Children | Married-Couple Families | Single-Parent Households |
| No Children | 0 (0.0%) | 2 (14.3%) |
| 1 or 2 Children | 3 (10.3%) | 7 (35.0%) |
| 3 or 4 Children | 0 (0.0%) | 9 (75.0%) |
| 5 or more Children | 0 (0.0%) | 0 (0.0%) |
| Total | 3 (2.7%) | 18 (39.1%) |
Race in Theresa
The most populous races in Theresa are White / Caucasian (629 | 68.4%), Two or more Races (286 | 31.1%), and Hispanic or Latino (35 | 3.8%).
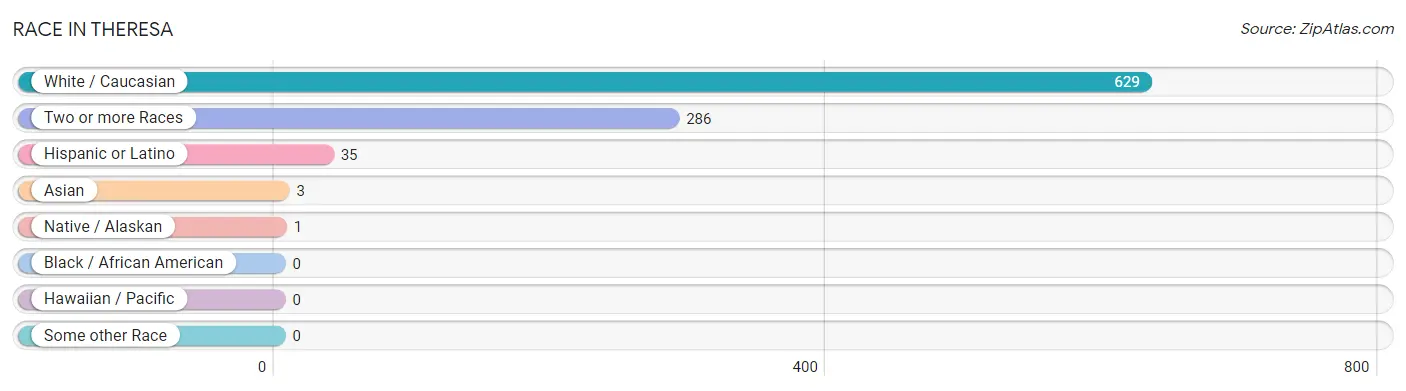
| Race | # Population | % Population |
| Asian | 3 | 0.3% |
| Black / African American | 0 | 0.0% |
| Hawaiian / Pacific | 0 | 0.0% |
| Hispanic or Latino | 35 | 3.8% |
| Native / Alaskan | 1 | 0.1% |
| White / Caucasian | 629 | 68.4% |
| Two or more Races | 286 | 31.1% |
| Some other Race | 0 | 0.0% |
| Total | 919 | 100.0% |
Ancestry in Theresa
The most populous ancestries reported in Theresa are English (363 | 39.5%), Irish (91 | 9.9%), American (85 | 9.2%), German (44 | 4.8%), and French (40 | 4.3%), together accounting for 67.8% of all Theresa residents.
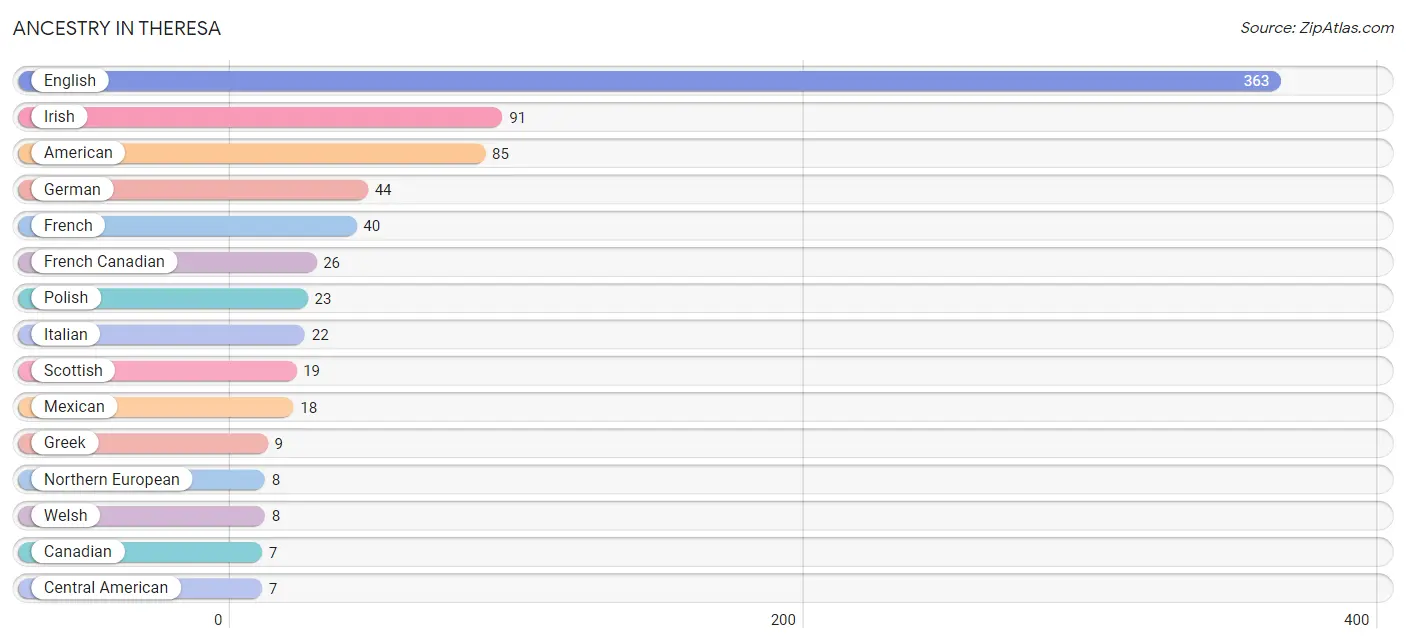
| Ancestry | # Population | % Population |
| American | 85 | 9.2% |
| British | 4 | 0.4% |
| Canadian | 7 | 0.8% |
| Central American | 7 | 0.8% |
| Colombian | 6 | 0.6% |
| Dutch | 5 | 0.5% |
| Eastern European | 2 | 0.2% |
| English | 363 | 39.5% |
| European | 6 | 0.6% |
| French | 40 | 4.3% |
| French Canadian | 26 | 2.8% |
| German | 44 | 4.8% |
| Greek | 9 | 1.0% |
| Indian (Asian) | 1 | 0.1% |
| Irish | 91 | 9.9% |
| Italian | 22 | 2.4% |
| Japanese | 5 | 0.5% |
| Korean | 2 | 0.2% |
| Mexican | 18 | 2.0% |
| Northern European | 8 | 0.9% |
| Norwegian | 4 | 0.4% |
| Panamanian | 7 | 0.8% |
| Polish | 23 | 2.5% |
| Puerto Rican | 4 | 0.4% |
| Scottish | 19 | 2.1% |
| South American | 6 | 0.6% |
| Swedish | 4 | 0.4% |
| Turkish | 5 | 0.5% |
| Welsh | 8 | 0.9% |
| West Indian | 4 | 0.4% | View All 30 Rows |
Immigrants in Theresa
The most numerous immigrant groups reported in Theresa came from Europe (9 | 1.0%), Greece (9 | 1.0%), Southern Europe (9 | 1.0%), Canada (7 | 0.8%), and Central America (2 | 0.2%), together accounting for 3.9% of all Theresa residents.
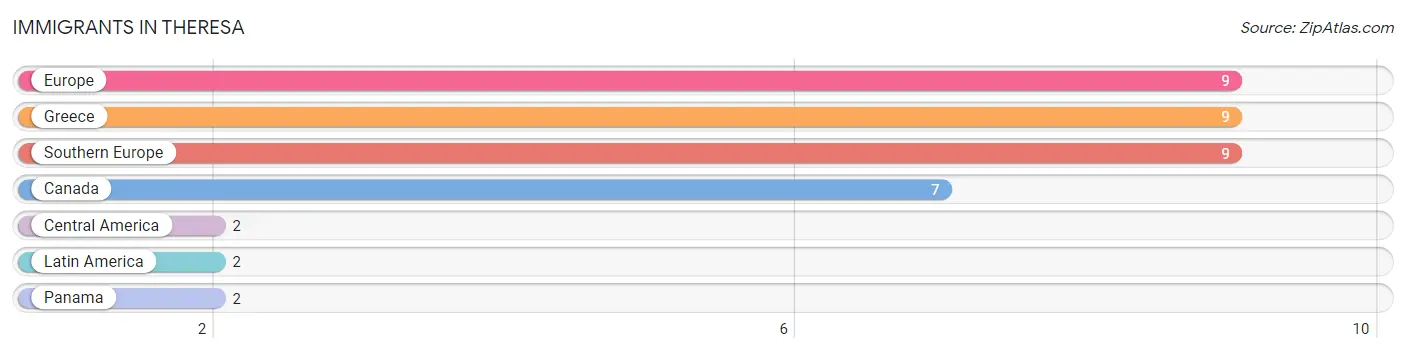
| Immigration Origin | # Population | % Population |
| Canada | 7 | 0.8% |
| Central America | 2 | 0.2% |
| Europe | 9 | 1.0% |
| Greece | 9 | 1.0% |
| Latin America | 2 | 0.2% |
| Panama | 2 | 0.2% |
| Southern Europe | 9 | 1.0% | View All 7 Rows |
Sex and Age in Theresa
Sex and Age in Theresa
The most populous age groups in Theresa are 25 to 29 Years (283 | 50.3%) for men and 25 to 29 Years (121 | 34.0%) for women.
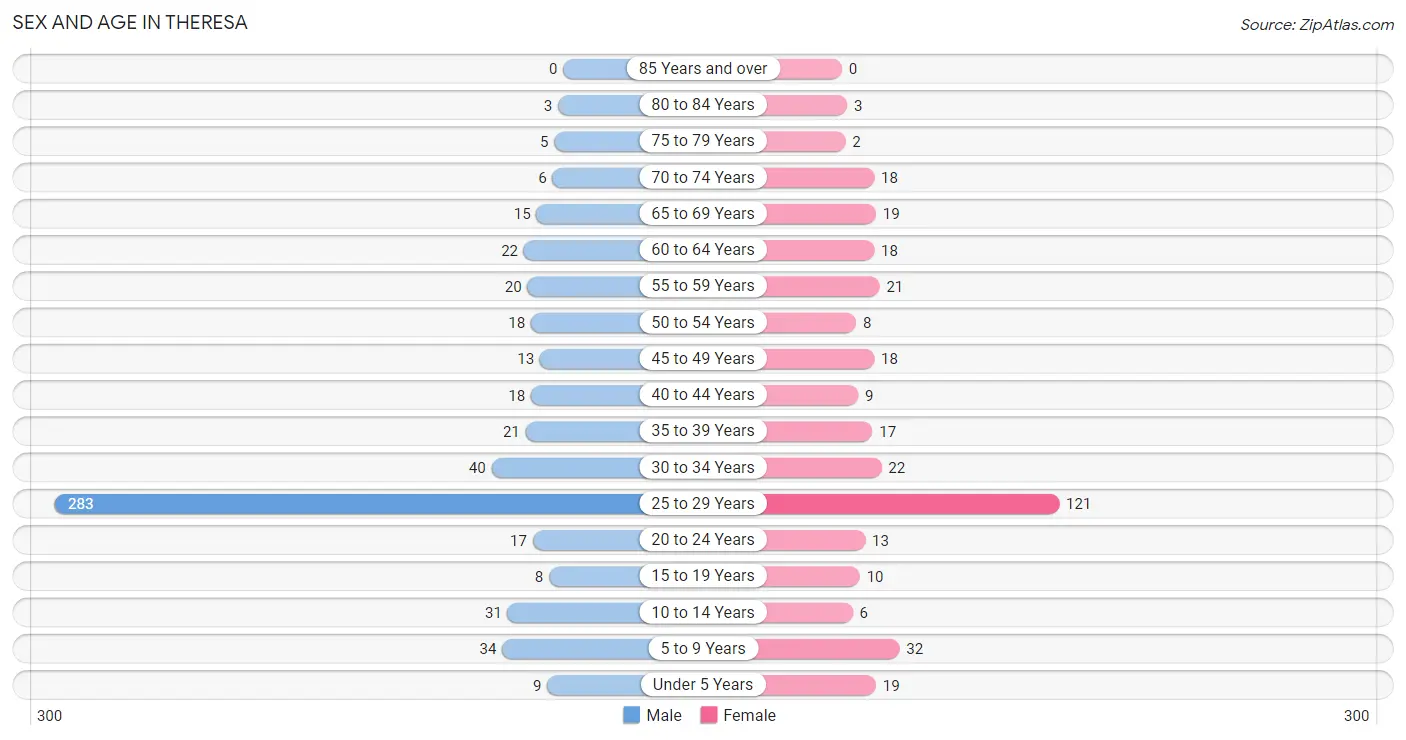
| Age Bracket | Male | Female |
| Under 5 Years | 9 (1.6%) | 19 (5.3%) |
| 5 to 9 Years | 34 (6.0%) | 32 (9.0%) |
| 10 to 14 Years | 31 (5.5%) | 6 (1.7%) |
| 15 to 19 Years | 8 (1.4%) | 10 (2.8%) |
| 20 to 24 Years | 17 (3.0%) | 13 (3.6%) |
| 25 to 29 Years | 283 (50.3%) | 121 (34.0%) |
| 30 to 34 Years | 40 (7.1%) | 22 (6.2%) |
| 35 to 39 Years | 21 (3.7%) | 17 (4.8%) |
| 40 to 44 Years | 18 (3.2%) | 9 (2.5%) |
| 45 to 49 Years | 13 (2.3%) | 18 (5.1%) |
| 50 to 54 Years | 18 (3.2%) | 8 (2.2%) |
| 55 to 59 Years | 20 (3.5%) | 21 (5.9%) |
| 60 to 64 Years | 22 (3.9%) | 18 (5.1%) |
| 65 to 69 Years | 15 (2.7%) | 19 (5.3%) |
| 70 to 74 Years | 6 (1.1%) | 18 (5.1%) |
| 75 to 79 Years | 5 (0.9%) | 2 (0.6%) |
| 80 to 84 Years | 3 (0.5%) | 3 (0.8%) |
| 85 Years and over | 0 (0.0%) | 0 (0.0%) |
| Total | 563 (100.0%) | 356 (100.0%) |
Families and Households in Theresa
Median Family Size in Theresa
The median family size in Theresa is 2.67 persons per family, with single female/mother families (22 | 14.1%) accounting for the largest median family size of 3.68 persons per family. On the other hand, single male/father families (24 | 15.4%) represent the smallest median family size with 2.46 persons per family.
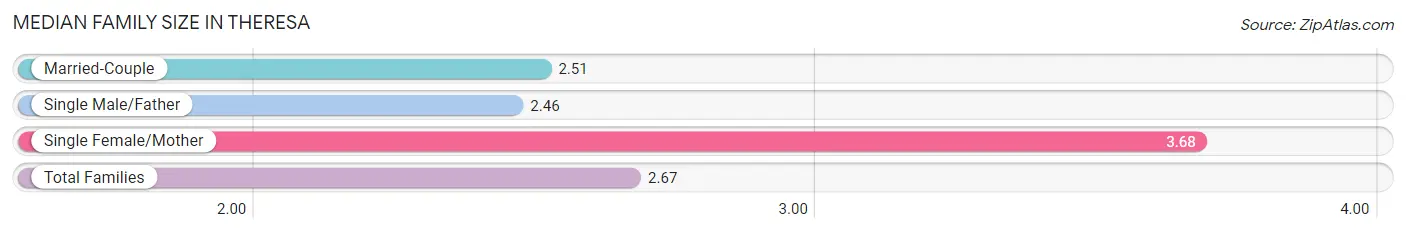
| Family Type | # Families | Family Size |
| Married-Couple | 110 (70.5%) | 2.51 |
| Single Male/Father | 24 (15.4%) | 2.46 |
| Single Female/Mother | 22 (14.1%) | 3.68 |
| Total Families | 156 (100.0%) | 2.67 |
Median Household Size in Theresa
The median household size in Theresa is 2.91 persons per household, with single female/mother households (22 | 7.0%) accounting for the largest median household size of 4.18 persons per household. married-couple households (110 | 34.8%) represent the smallest median household size with 2.51 persons per household.
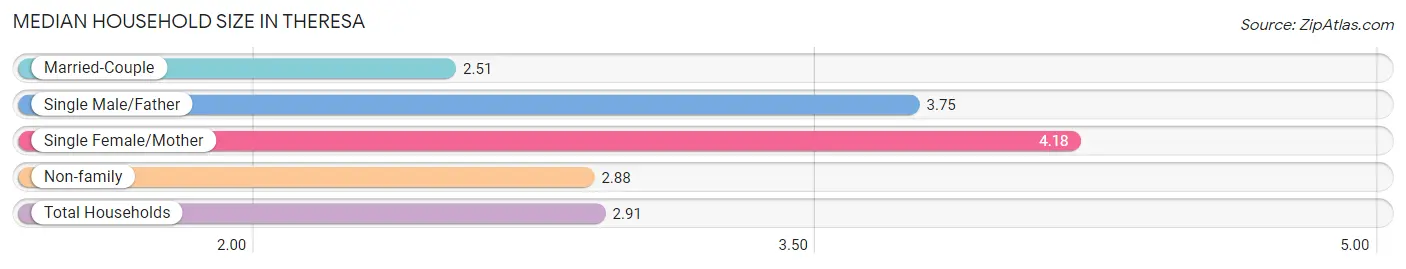
| Household Type | # Households | Household Size |
| Married-Couple | 110 (34.8%) | 2.51 |
| Single Male/Father | 24 (7.6%) | 3.75 |
| Single Female/Mother | 22 (7.0%) | 4.18 |
| Non-family | 160 (50.6%) | 2.88 |
| Total Households | 316 (100.0%) | 2.91 |
Household Size by Marriage Status in Theresa
Out of a total of 316 households in Theresa, 156 (49.4%) are family households, while 160 (50.6%) are nonfamily households. The most numerous type of family households are 2-person households, comprising 78, and the most common type of nonfamily households are 2-person households, comprising 97.
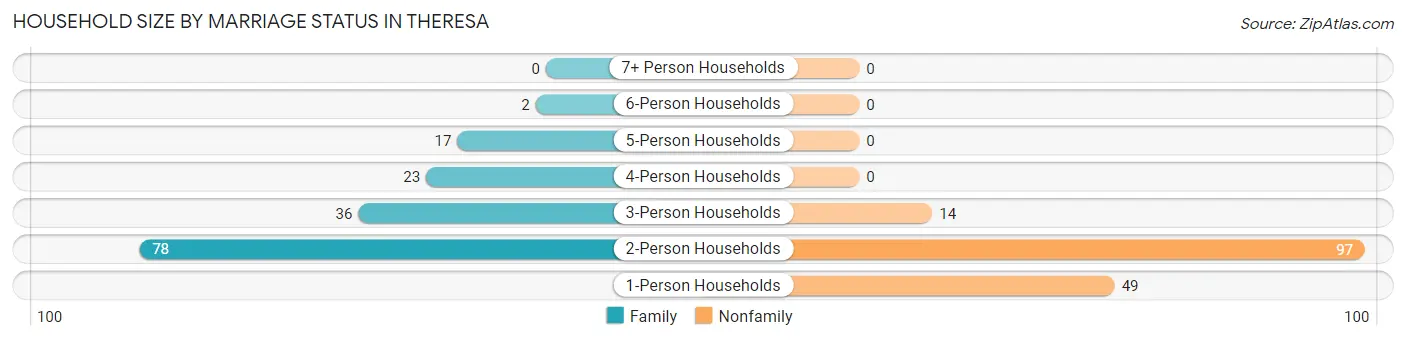
| Household Size | Family Households | Nonfamily Households |
| 1-Person Households | - | 49 (15.5%) |
| 2-Person Households | 78 (24.7%) | 97 (30.7%) |
| 3-Person Households | 36 (11.4%) | 14 (4.4%) |
| 4-Person Households | 23 (7.3%) | 0 (0.0%) |
| 5-Person Households | 17 (5.4%) | 0 (0.0%) |
| 6-Person Households | 2 (0.6%) | 0 (0.0%) |
| 7+ Person Households | 0 (0.0%) | 0 (0.0%) |
| Total | 156 (49.4%) | 160 (50.6%) |
Female Fertility in Theresa
Fertility by Age in Theresa
Average fertility rate in Theresa is 10.0 births per 1,000 women. Women in the age bracket of 20 to 34 years have the highest fertility rate with 13.0 births per 1,000 women. Women in the age bracket of 20 to 34 years acount for 100.0% of all women with births.
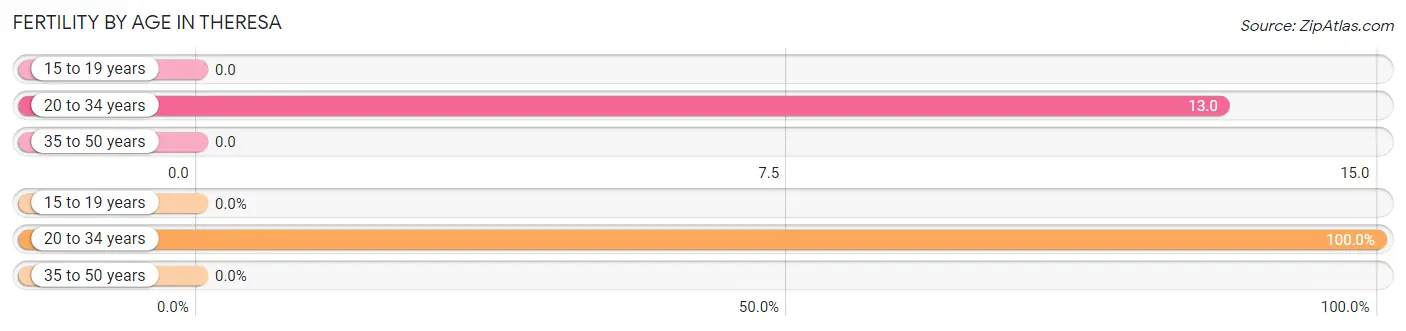
| Age Bracket | Women with Births | Births / 1,000 Women |
| 15 to 19 years | 0 (0.0%) | 0.0 |
| 20 to 34 years | 2 (100.0%) | 13.0 |
| 35 to 50 years | 0 (0.0%) | 0.0 |
| Total | 2 (100.0%) | 10.0 |
Fertility by Age by Marriage Status in Theresa
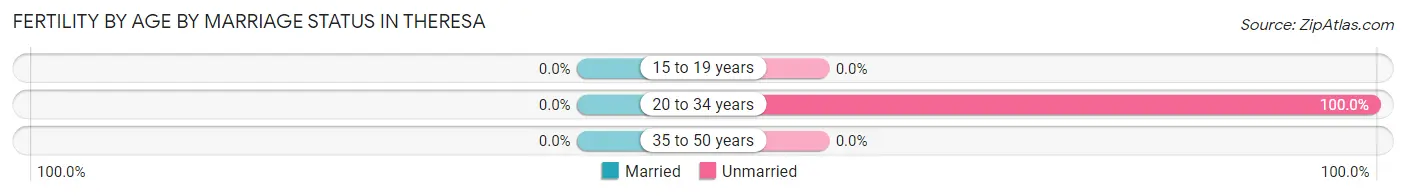
| Age Bracket | Married | Unmarried |
| 15 to 19 years | 0 (0.0%) | 0 (0.0%) |
| 20 to 34 years | 0 (0.0%) | 2 (100.0%) |
| 35 to 50 years | 0 (0.0%) | 0 (0.0%) |
| Total | 0 (0.0%) | 2 (100.0%) |
Fertility by Education in Theresa
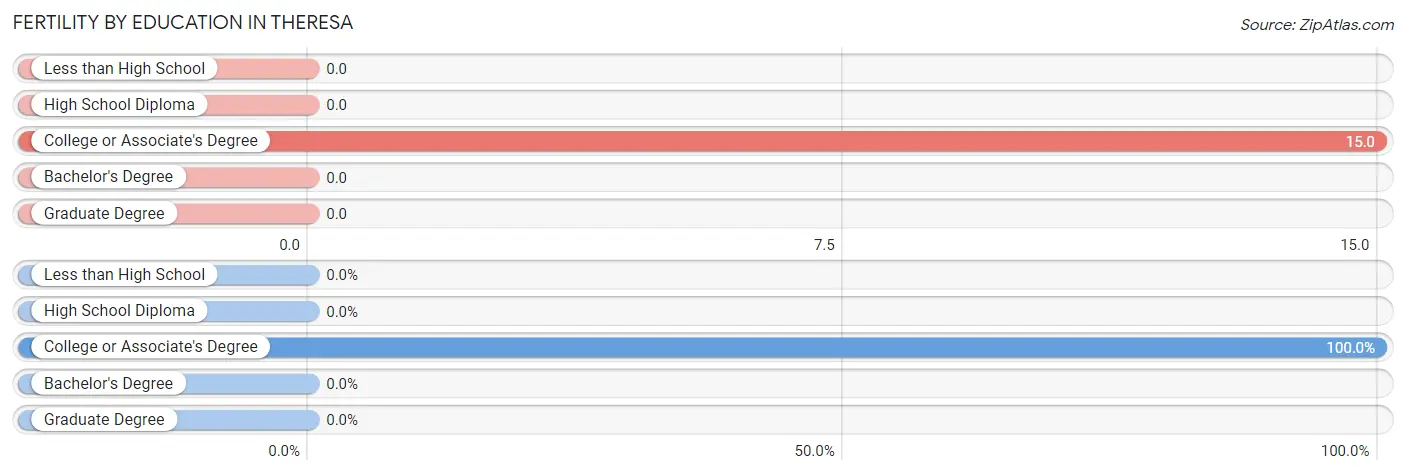
| Educational Attainment | Women with Births | Births / 1,000 Women |
| Less than High School | 0 (0.0%) | 0.0 |
| High School Diploma | 0 (0.0%) | 0.0 |
| College or Associate's Degree | 2 (100.0%) | 15.0 |
| Bachelor's Degree | 0 (0.0%) | 0.0 |
| Graduate Degree | 0 (0.0%) | 0.0 |
| Total | 2 (100.0%) | 10.0 |
Fertility by Education by Marriage Status in Theresa
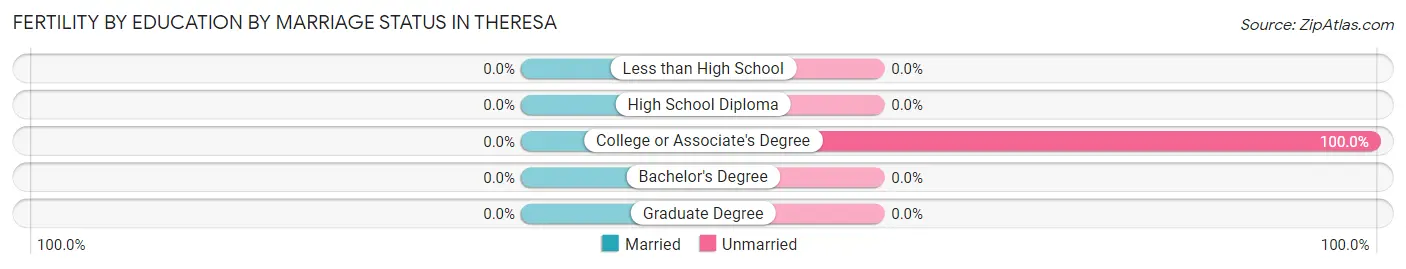
| Educational Attainment | Married | Unmarried |
| Less than High School | 0 (0.0%) | 0 (0.0%) |
| High School Diploma | 0 (0.0%) | 0 (0.0%) |
| College or Associate's Degree | 0 (0.0%) | 2 (100.0%) |
| Bachelor's Degree | 0 (0.0%) | 0 (0.0%) |
| Graduate Degree | 0 (0.0%) | 0 (0.0%) |
| Total | 0 (0.0%) | 2 (100.0%) |
Employment Characteristics in Theresa
Employment by Class of Employer in Theresa
Among the 620 employed individuals in Theresa, private company employees (502 | 81.0%), local government employees (38 | 6.1%), and federal government employees (32 | 5.2%) make up the most common classes of employment.
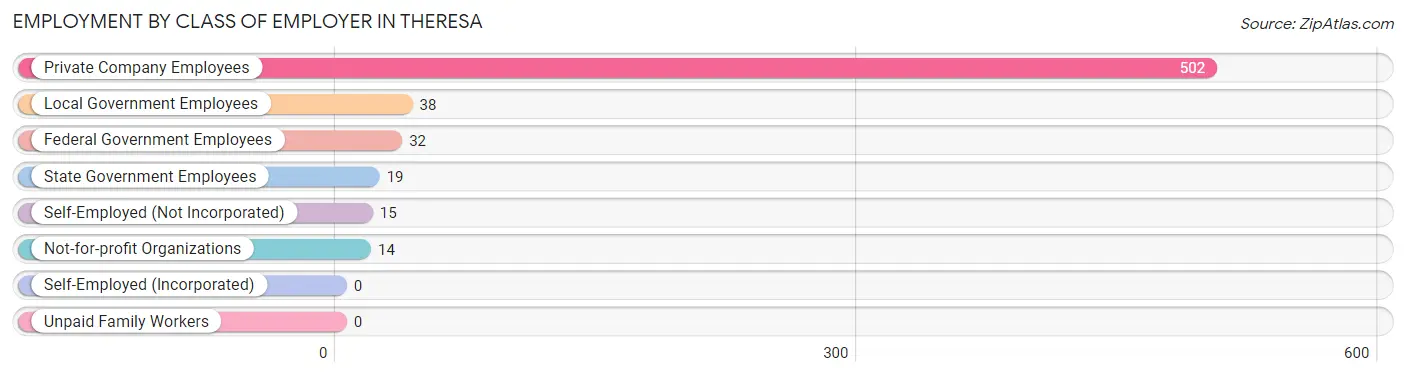
| Employer Class | # Employees | % Employees |
| Private Company Employees | 502 | 81.0% |
| Self-Employed (Incorporated) | 0 | 0.0% |
| Self-Employed (Not Incorporated) | 15 | 2.4% |
| Not-for-profit Organizations | 14 | 2.3% |
| Local Government Employees | 38 | 6.1% |
| State Government Employees | 19 | 3.1% |
| Federal Government Employees | 32 | 5.2% |
| Unpaid Family Workers | 0 | 0.0% |
| Total | 620 | 100.0% |
Employment Status by Age in Theresa
According to the labor force statistics for Theresa, out of the total population over 16 years of age (784), 82.9% or 650 individuals are in the labor force, with 4.1% or 27 of them unemployed. The age group with the highest labor force participation rate is 20 to 24 years, with 100.0% or 30 individuals in the labor force. Within the labor force, the 55 to 59 years age range has the highest percentage of unemployed individuals, with 42.3% or 11 of them being unemployed.
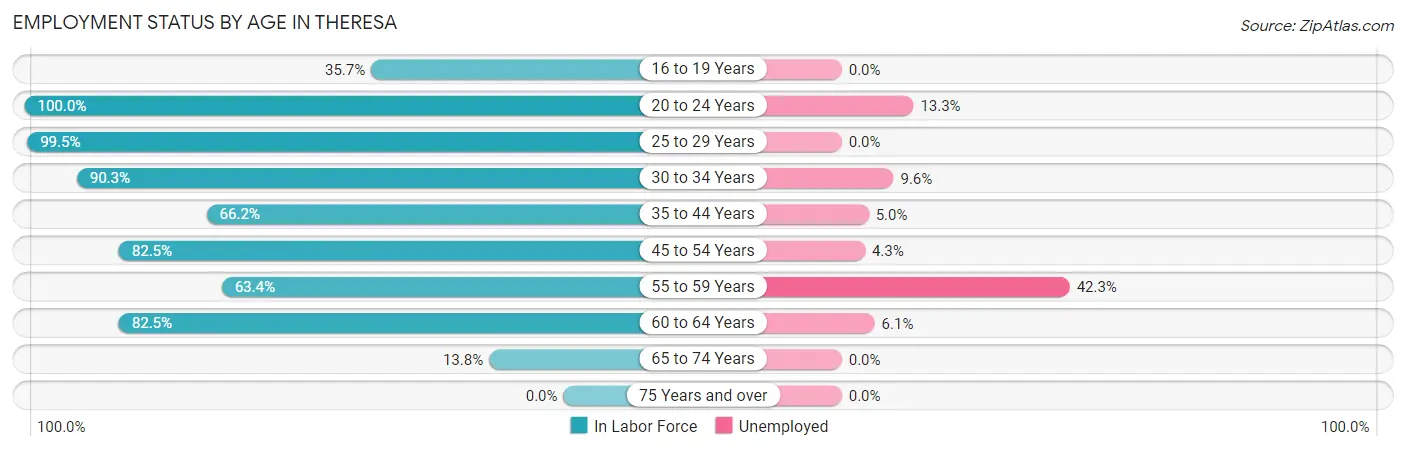
| Age Bracket | In Labor Force | Unemployed |
| 16 to 19 Years | 5 (35.7%) | 0 (0.0%) |
| 20 to 24 Years | 30 (100.0%) | 4 (13.3%) |
| 25 to 29 Years | 402 (99.5%) | 0 (0.0%) |
| 30 to 34 Years | 56 (90.3%) | 5 (9.6%) |
| 35 to 44 Years | 43 (66.2%) | 2 (5.0%) |
| 45 to 54 Years | 47 (82.5%) | 2 (4.3%) |
| 55 to 59 Years | 26 (63.4%) | 11 (42.3%) |
| 60 to 64 Years | 33 (82.5%) | 2 (6.1%) |
| 65 to 74 Years | 8 (13.8%) | 0 (0.0%) |
| 75 Years and over | 0 (0.0%) | 0 (0.0%) |
| Total | 650 (82.9%) | 27 (4.1%) |
Employment Status by Educational Attainment in Theresa
According to labor force statistics for Theresa, 90.7% of individuals (607) out of the total population between 25 and 64 years of age (669) are in the labor force, with 3.7% or 22 of them being unemployed. The group with the highest labor force participation rate are those with the educational attainment of college / associate degree, with 95.5% or 467 individuals in the labor force. Within the labor force, individuals with less than high school education have the highest percentage of unemployment, with 100.0% or 3 of them being unemployed.
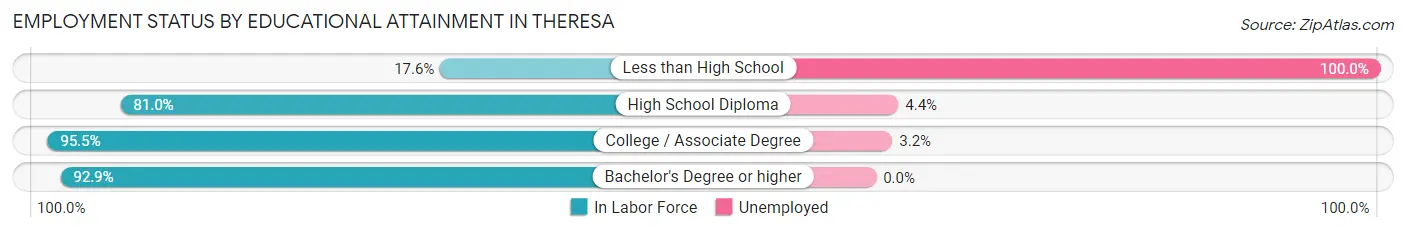
| Educational Attainment | In Labor Force | Unemployed |
| Less than High School | 3 (17.6%) | 17 (100.0%) |
| High School Diploma | 98 (81.0%) | 5 (4.4%) |
| College / Associate Degree | 467 (95.5%) | 16 (3.2%) |
| Bachelor's Degree or higher | 39 (92.9%) | 0 (0.0%) |
| Total | 607 (90.7%) | 25 (3.7%) |
Employment Occupations by Sex in Theresa
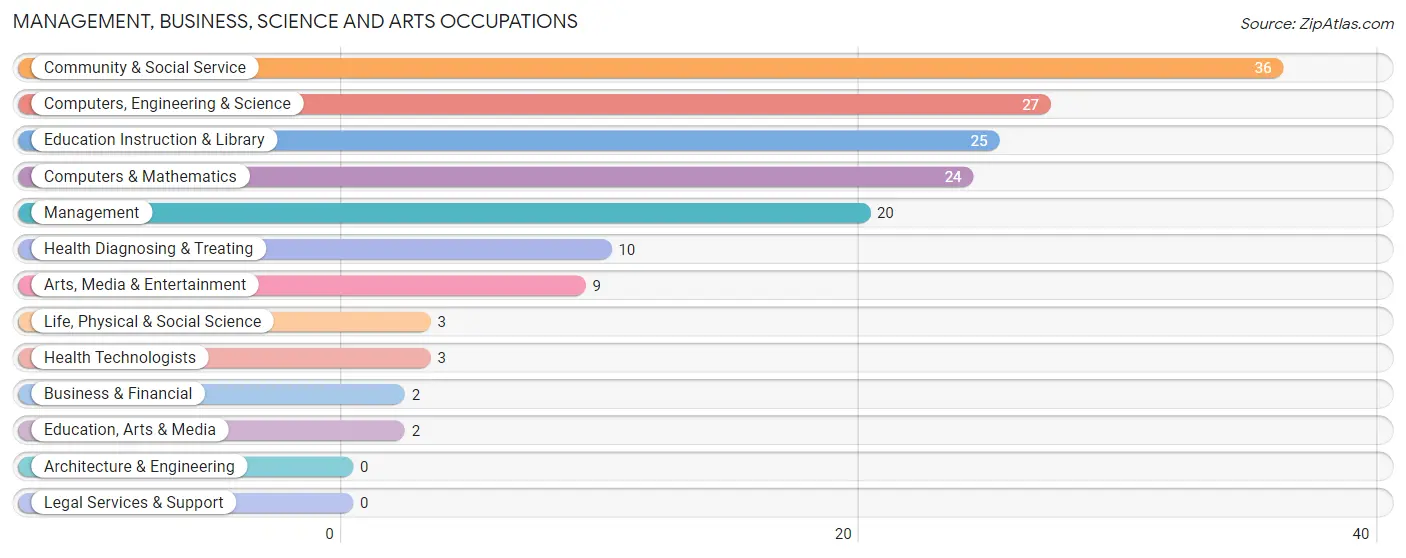
Management, Business, Science and Arts Occupations
The most common Management, Business, Science and Arts occupations in Theresa are Community & Social Service (36 | 5.9%), Computers, Engineering & Science (27 | 4.4%), Education Instruction & Library (25 | 4.1%), Computers & Mathematics (24 | 3.9%), and Management (20 | 3.3%).
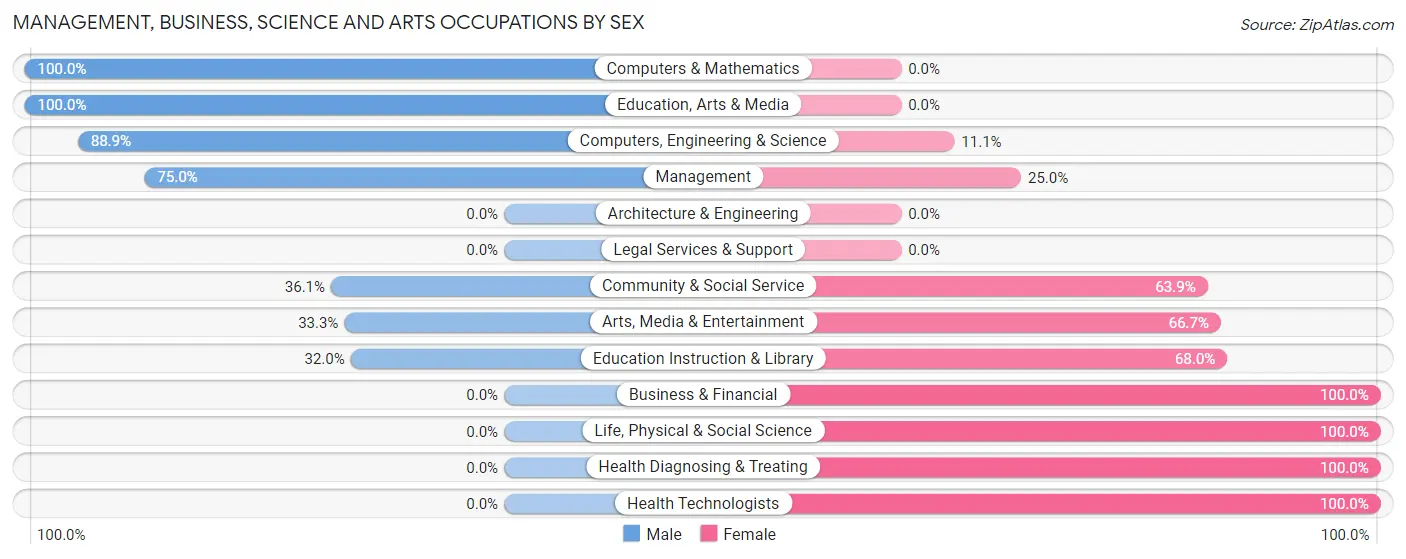
Management, Business, Science and Arts Occupations by Sex
Within the Management, Business, Science and Arts occupations in Theresa, the most male-oriented occupations are Computers & Mathematics (100.0%), Education, Arts & Media (100.0%), and Computers, Engineering & Science (88.9%), while the most female-oriented occupations are Business & Financial (100.0%), Life, Physical & Social Science (100.0%), and Health Diagnosing & Treating (100.0%).
| Occupation | Male | Female |
| Management | 15 (75.0%) | 5 (25.0%) |
| Business & Financial | 0 (0.0%) | 2 (100.0%) |
| Computers, Engineering & Science | 24 (88.9%) | 3 (11.1%) |
| Computers & Mathematics | 24 (100.0%) | 0 (0.0%) |
| Architecture & Engineering | 0 (0.0%) | 0 (0.0%) |
| Life, Physical & Social Science | 0 (0.0%) | 3 (100.0%) |
| Community & Social Service | 13 (36.1%) | 23 (63.9%) |
| Education, Arts & Media | 2 (100.0%) | 0 (0.0%) |
| Legal Services & Support | 0 (0.0%) | 0 (0.0%) |
| Education Instruction & Library | 8 (32.0%) | 17 (68.0%) |
| Arts, Media & Entertainment | 3 (33.3%) | 6 (66.7%) |
| Health Diagnosing & Treating | 0 (0.0%) | 10 (100.0%) |
| Health Technologists | 0 (0.0%) | 3 (100.0%) |
| Total (Category) | 52 (54.7%) | 43 (45.3%) |
| Total (Overall) | 400 (65.4%) | 212 (34.6%) |
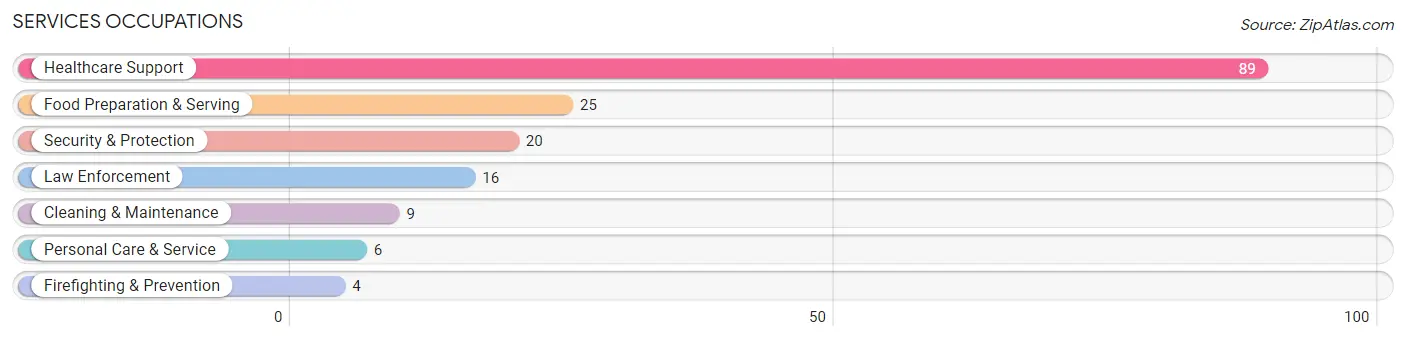
Services Occupations
The most common Services occupations in Theresa are Healthcare Support (89 | 14.5%), Food Preparation & Serving (25 | 4.1%), Security & Protection (20 | 3.3%), Law Enforcement (16 | 2.6%), and Cleaning & Maintenance (9 | 1.5%).
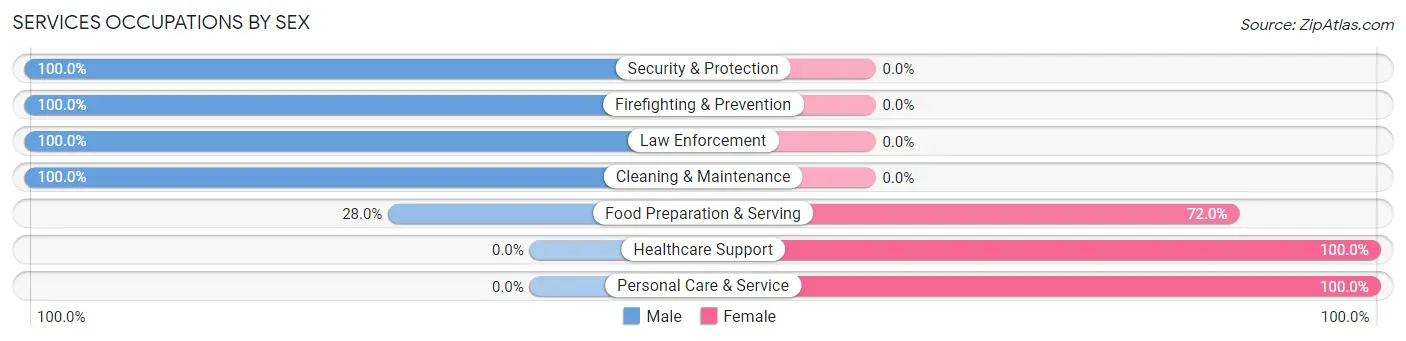
Services Occupations by Sex
Within the Services occupations in Theresa, the most male-oriented occupations are Security & Protection (100.0%), Firefighting & Prevention (100.0%), and Law Enforcement (100.0%), while the most female-oriented occupations are Healthcare Support (100.0%), Personal Care & Service (100.0%), and Food Preparation & Serving (72.0%).
| Occupation | Male | Female |
| Healthcare Support | 0 (0.0%) | 89 (100.0%) |
| Security & Protection | 20 (100.0%) | 0 (0.0%) |
| Firefighting & Prevention | 4 (100.0%) | 0 (0.0%) |
| Law Enforcement | 16 (100.0%) | 0 (0.0%) |
| Food Preparation & Serving | 7 (28.0%) | 18 (72.0%) |
| Cleaning & Maintenance | 9 (100.0%) | 0 (0.0%) |
| Personal Care & Service | 0 (0.0%) | 6 (100.0%) |
| Total (Category) | 36 (24.2%) | 113 (75.8%) |
| Total (Overall) | 400 (65.4%) | 212 (34.6%) |
Sales and Office Occupations
The most common Sales and Office occupations in Theresa are Office & Administration (41 | 6.7%), and Sales & Related (24 | 3.9%).
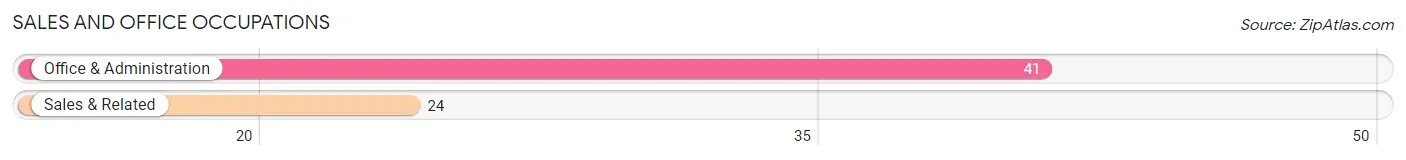
Sales and Office Occupations by Sex
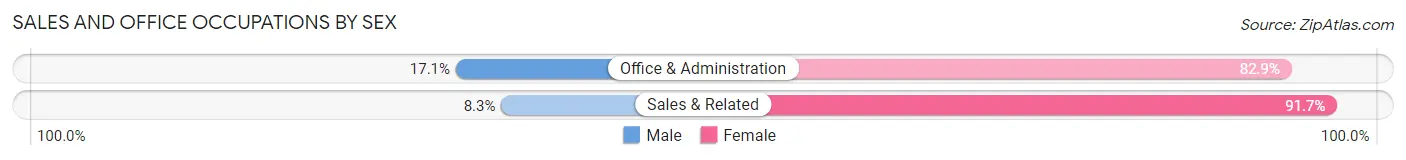
| Occupation | Male | Female |
| Sales & Related | 2 (8.3%) | 22 (91.7%) |
| Office & Administration | 7 (17.1%) | 34 (82.9%) |
| Total (Category) | 9 (13.9%) | 56 (86.2%) |
| Total (Overall) | 400 (65.4%) | 212 (34.6%) |
Natural Resources, Construction and Maintenance Occupations
The most common Natural Resources, Construction and Maintenance occupations in Theresa are Installation, Maintenance & Repair (264 | 43.1%), Construction & Extraction (6 | 1.0%), and Farming, Fishing & Forestry (3 | 0.5%).
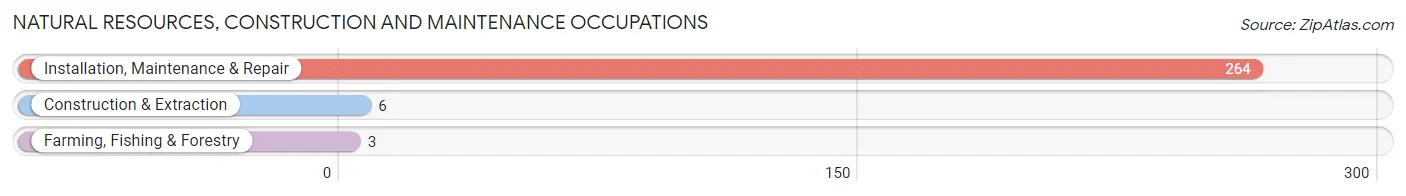
Natural Resources, Construction and Maintenance Occupations by Sex
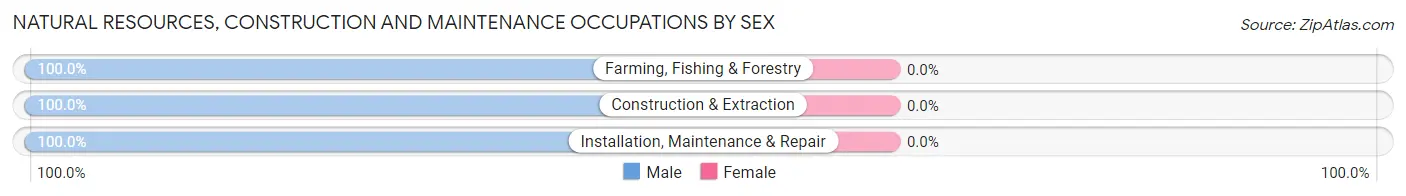
| Occupation | Male | Female |
| Farming, Fishing & Forestry | 3 (100.0%) | 0 (0.0%) |
| Construction & Extraction | 6 (100.0%) | 0 (0.0%) |
| Installation, Maintenance & Repair | 264 (100.0%) | 0 (0.0%) |
| Total (Category) | 273 (100.0%) | 0 (0.0%) |
| Total (Overall) | 400 (65.4%) | 212 (34.6%) |
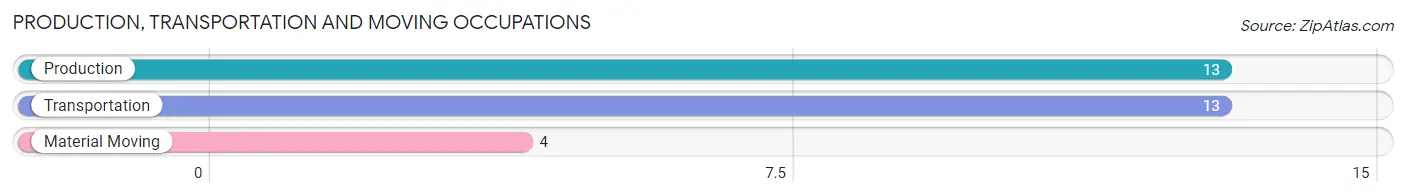
Production, Transportation and Moving Occupations
The most common Production, Transportation and Moving occupations in Theresa are Production (13 | 2.1%), Transportation (13 | 2.1%), and Material Moving (4 | 0.6%).
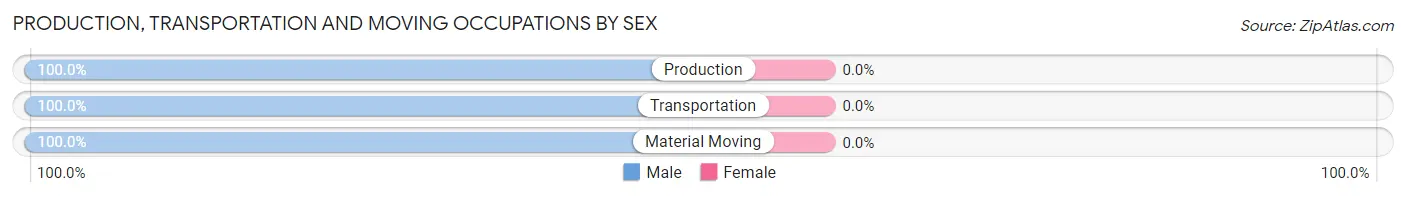
Production, Transportation and Moving Occupations by Sex
| Occupation | Male | Female |
| Production | 13 (100.0%) | 0 (0.0%) |
| Transportation | 13 (100.0%) | 0 (0.0%) |
| Material Moving | 4 (100.0%) | 0 (0.0%) |
| Total (Category) | 30 (100.0%) | 0 (0.0%) |
| Total (Overall) | 400 (65.4%) | 212 (34.6%) |
Employment Industries by Sex in Theresa
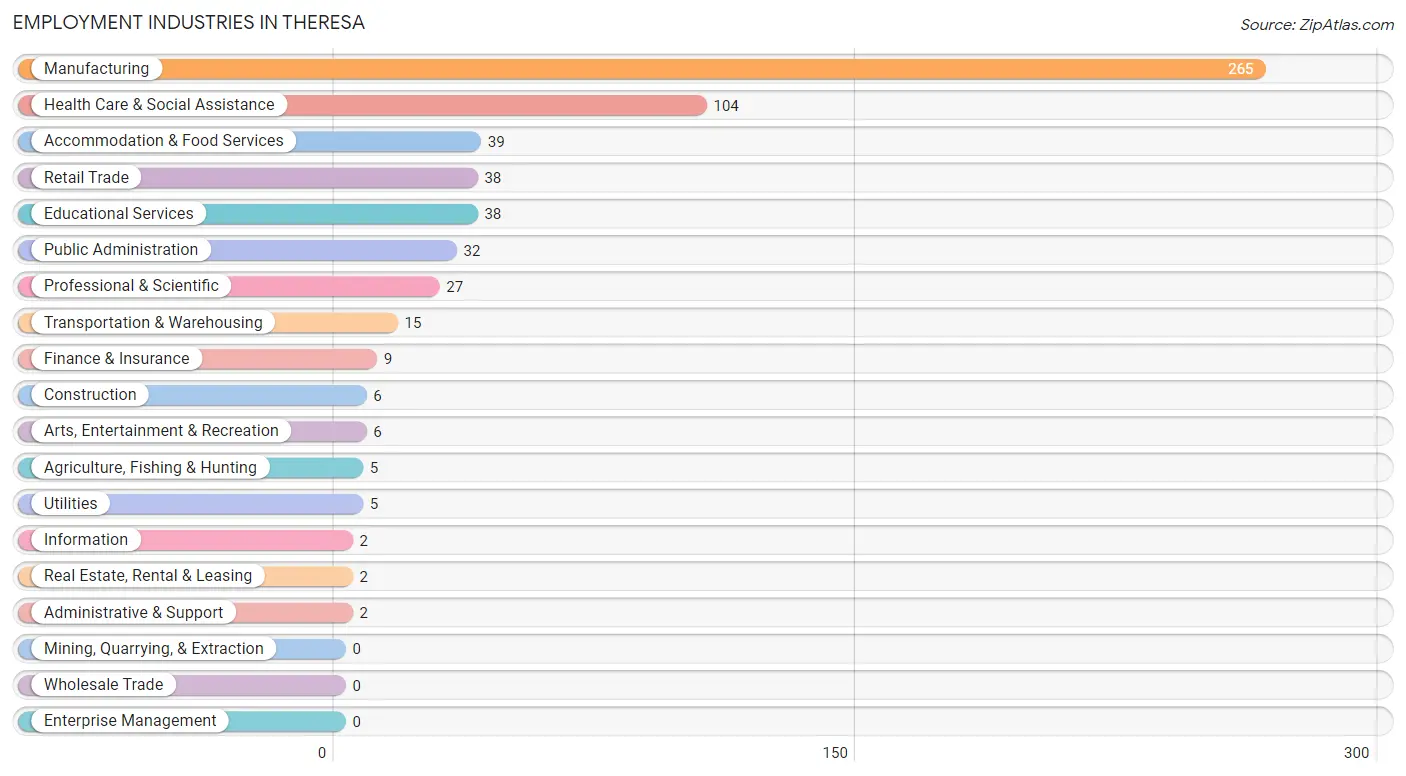
Employment Industries in Theresa
The major employment industries in Theresa include Manufacturing (265 | 43.3%), Health Care & Social Assistance (104 | 17.0%), Accommodation & Food Services (39 | 6.4%), Retail Trade (38 | 6.2%), and Educational Services (38 | 6.2%).
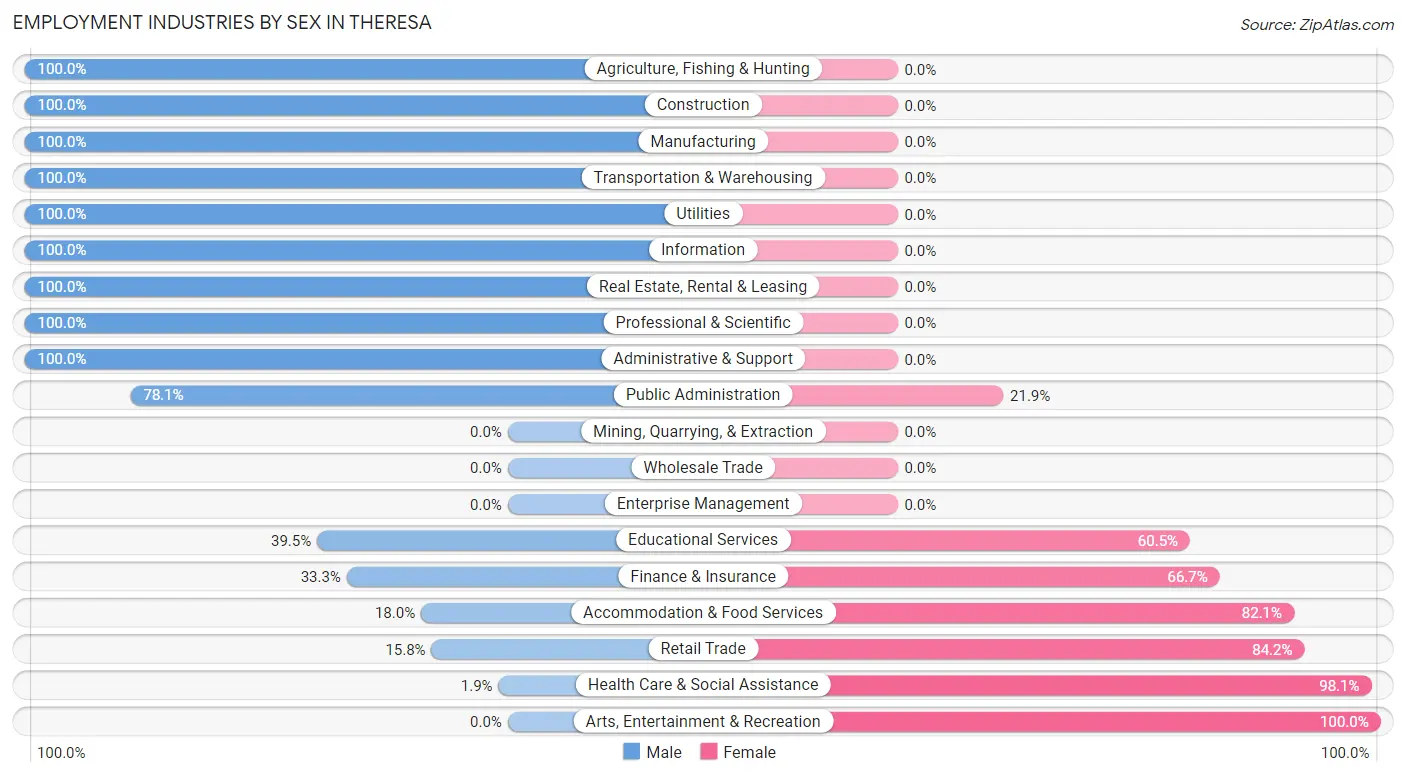
Employment Industries by Sex in Theresa
The Theresa industries that see more men than women are Agriculture, Fishing & Hunting (100.0%), Construction (100.0%), and Manufacturing (100.0%), whereas the industries that tend to have a higher number of women are Arts, Entertainment & Recreation (100.0%), Health Care & Social Assistance (98.1%), and Retail Trade (84.2%).
| Industry | Male | Female |
| Agriculture, Fishing & Hunting | 5 (100.0%) | 0 (0.0%) |
| Mining, Quarrying, & Extraction | 0 (0.0%) | 0 (0.0%) |
| Construction | 6 (100.0%) | 0 (0.0%) |
| Manufacturing | 265 (100.0%) | 0 (0.0%) |
| Wholesale Trade | 0 (0.0%) | 0 (0.0%) |
| Retail Trade | 6 (15.8%) | 32 (84.2%) |
| Transportation & Warehousing | 15 (100.0%) | 0 (0.0%) |
| Utilities | 5 (100.0%) | 0 (0.0%) |
| Information | 2 (100.0%) | 0 (0.0%) |
| Finance & Insurance | 3 (33.3%) | 6 (66.7%) |
| Real Estate, Rental & Leasing | 2 (100.0%) | 0 (0.0%) |
| Professional & Scientific | 27 (100.0%) | 0 (0.0%) |
| Enterprise Management | 0 (0.0%) | 0 (0.0%) |
| Administrative & Support | 2 (100.0%) | 0 (0.0%) |
| Educational Services | 15 (39.5%) | 23 (60.5%) |
| Health Care & Social Assistance | 2 (1.9%) | 102 (98.1%) |
| Arts, Entertainment & Recreation | 0 (0.0%) | 6 (100.0%) |
| Accommodation & Food Services | 7 (17.9%) | 32 (82.1%) |
| Public Administration | 25 (78.1%) | 7 (21.9%) |
| Total | 400 (65.4%) | 212 (34.6%) |
Education in Theresa
School Enrollment in Theresa
The most common levels of schooling among the 248 students in Theresa are college / undergraduate (131 | 52.8%), elementary school (40 | 16.1%), and middle school (37 | 14.9%).
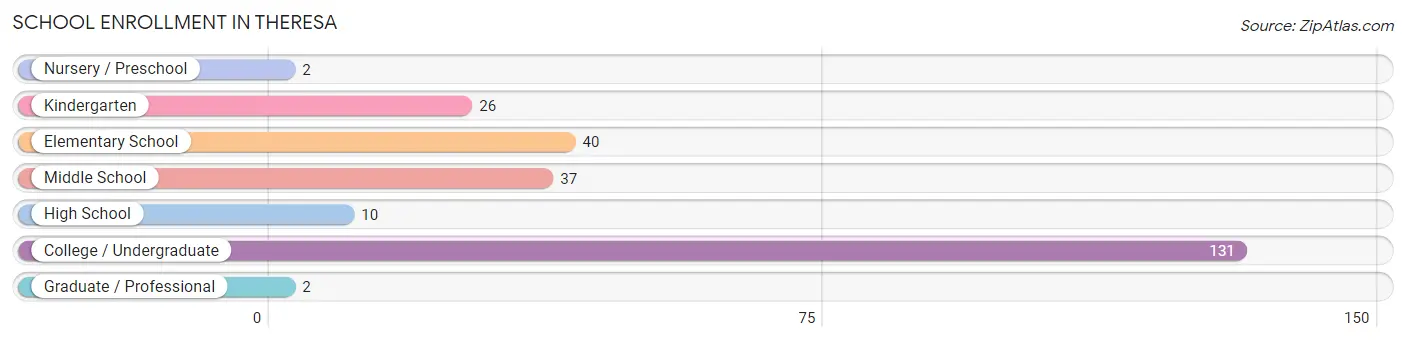
| School Level | # Students | % Students |
| Nursery / Preschool | 2 | 0.8% |
| Kindergarten | 26 | 10.5% |
| Elementary School | 40 | 16.1% |
| Middle School | 37 | 14.9% |
| High School | 10 | 4.0% |
| College / Undergraduate | 131 | 52.8% |
| Graduate / Professional | 2 | 0.8% |
| Total | 248 | 100.0% |
School Enrollment by Age by Funding Source in Theresa
Out of a total of 248 students who are enrolled in schools in Theresa, 23 (9.3%) attend a private institution, while the remaining 225 (90.7%) are enrolled in public schools. The age group of 35 years and over has the highest likelihood of being enrolled in private schools, with 4 (57.1% in the age bracket) enrolled. Conversely, the age group of 3 to 4 year olds has the lowest likelihood of being enrolled in a private school, with 2 (100.0% in the age bracket) attending a public institution.
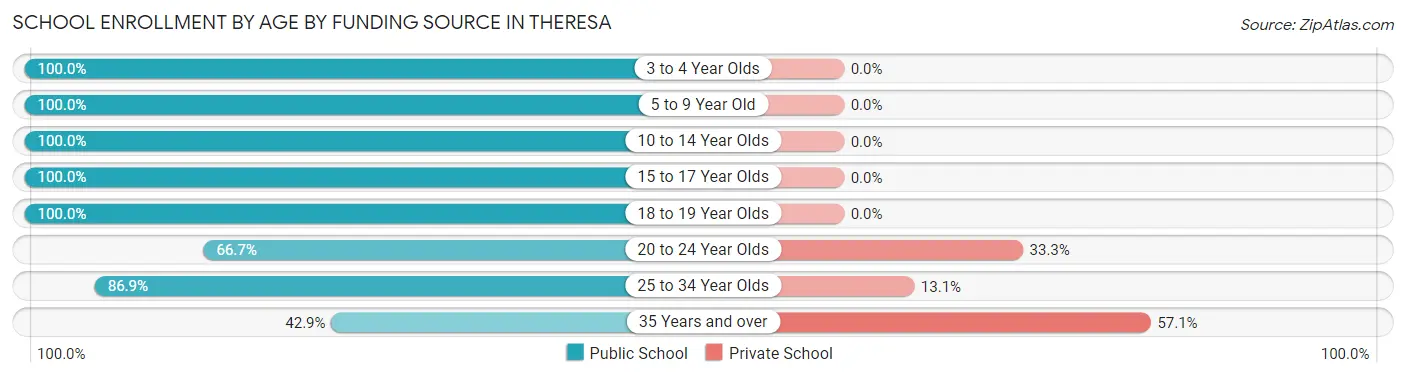
| Age Bracket | Public School | Private School |
| 3 to 4 Year Olds | 2 (100.0%) | 0 (0.0%) |
| 5 to 9 Year Old | 66 (100.0%) | 0 (0.0%) |
| 10 to 14 Year Olds | 37 (100.0%) | 0 (0.0%) |
| 15 to 17 Year Olds | 10 (100.0%) | 0 (0.0%) |
| 18 to 19 Year Olds | 4 (100.0%) | 0 (0.0%) |
| 20 to 24 Year Olds | 10 (66.7%) | 5 (33.3%) |
| 25 to 34 Year Olds | 93 (86.9%) | 14 (13.1%) |
| 35 Years and over | 3 (42.9%) | 4 (57.1%) |
| Total | 225 (90.7%) | 23 (9.3%) |
Educational Attainment by Field of Study in Theresa
Education (15 | 24.6%), liberal arts & history (14 | 23.0%), bio, nature & agricultural (8 | 13.1%), science & technology (7 | 11.5%), and psychology (4 | 6.6%) are the most common fields of study among 61 individuals in Theresa who have obtained a bachelor's degree or higher.
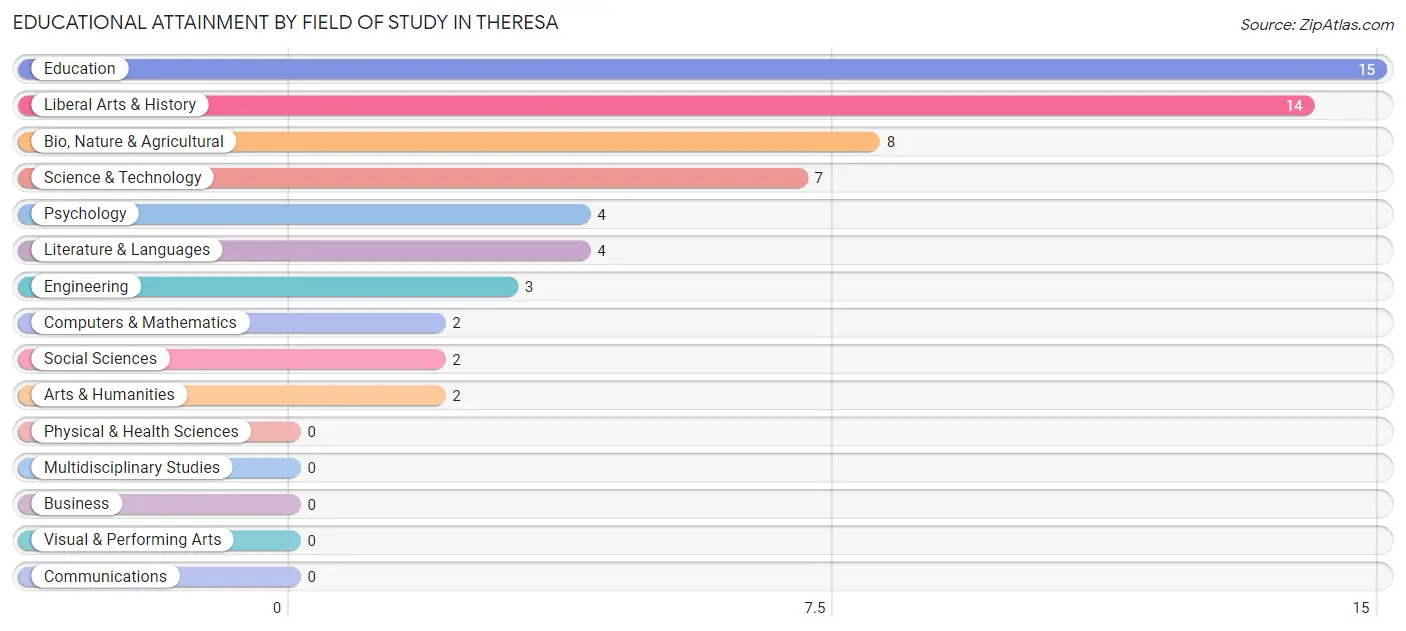
| Field of Study | # Graduates | % Graduates |
| Computers & Mathematics | 2 | 3.3% |
| Bio, Nature & Agricultural | 8 | 13.1% |
| Physical & Health Sciences | 0 | 0.0% |
| Psychology | 4 | 6.6% |
| Social Sciences | 2 | 3.3% |
| Engineering | 3 | 4.9% |
| Multidisciplinary Studies | 0 | 0.0% |
| Science & Technology | 7 | 11.5% |
| Business | 0 | 0.0% |
| Education | 15 | 24.6% |
| Literature & Languages | 4 | 6.6% |
| Liberal Arts & History | 14 | 23.0% |
| Visual & Performing Arts | 0 | 0.0% |
| Communications | 0 | 0.0% |
| Arts & Humanities | 2 | 3.3% |
| Total | 61 | 100.0% |
Transportation & Commute in Theresa
Vehicle Availability by Sex in Theresa
The most prevalent vehicle ownership categories in Theresa are males with 2 vehicles (371, accounting for 90.5%) and females with 2 vehicles (165, making up 176.7%).
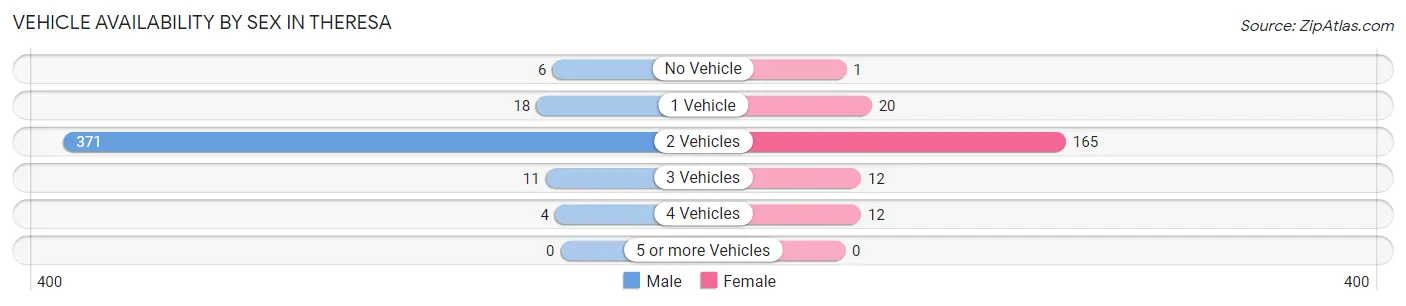
| Vehicles Available | Male | Female |
| No Vehicle | 6 (1.5%) | 1 (0.5%) |
| 1 Vehicle | 18 (4.4%) | 20 (9.5%) |
| 2 Vehicles | 371 (90.5%) | 165 (78.6%) |
| 3 Vehicles | 11 (2.7%) | 12 (5.7%) |
| 4 Vehicles | 4 (1.0%) | 12 (5.7%) |
| 5 or more Vehicles | 0 (0.0%) | 0 (0.0%) |
| Total | 410 (100.0%) | 210 (100.0%) |
Commute Time in Theresa
The most frequently occuring commute durations in Theresa are 30 to 34 minutes (381 commuters, 63.7%), 25 to 29 minutes (65 commuters, 10.9%), and 35 to 39 minutes (33 commuters, 5.5%).
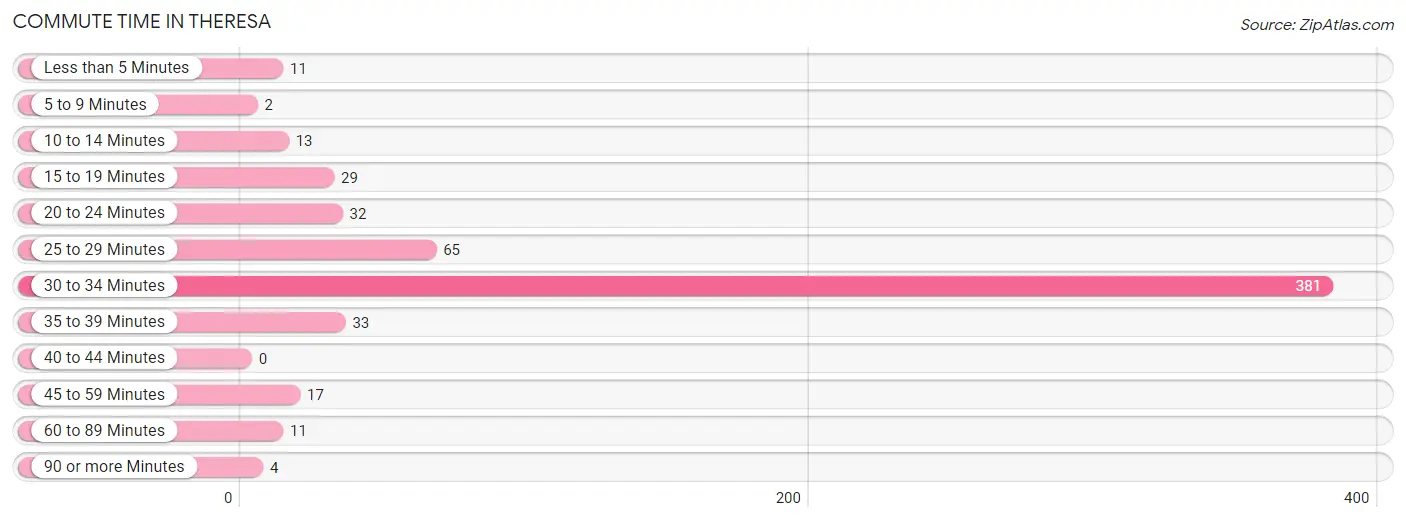
| Commute Time | # Commuters | % Commuters |
| Less than 5 Minutes | 11 | 1.8% |
| 5 to 9 Minutes | 2 | 0.3% |
| 10 to 14 Minutes | 13 | 2.2% |
| 15 to 19 Minutes | 29 | 4.9% |
| 20 to 24 Minutes | 32 | 5.3% |
| 25 to 29 Minutes | 65 | 10.9% |
| 30 to 34 Minutes | 381 | 63.7% |
| 35 to 39 Minutes | 33 | 5.5% |
| 40 to 44 Minutes | 0 | 0.0% |
| 45 to 59 Minutes | 17 | 2.8% |
| 60 to 89 Minutes | 11 | 1.8% |
| 90 or more Minutes | 4 | 0.7% |
Commute Time by Sex in Theresa
The most common commute times in Theresa are 30 to 34 minutes (278 commuters, 70.7%) for males and 30 to 34 minutes (103 commuters, 50.2%) for females.
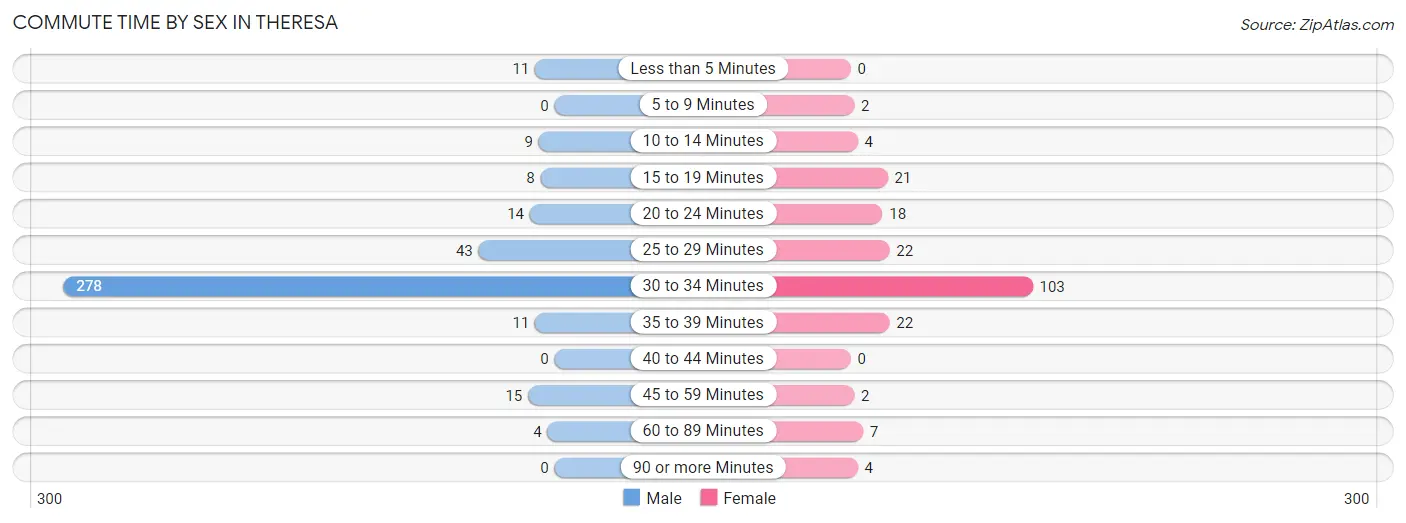
| Commute Time | Male | Female |
| Less than 5 Minutes | 11 (2.8%) | 0 (0.0%) |
| 5 to 9 Minutes | 0 (0.0%) | 2 (1.0%) |
| 10 to 14 Minutes | 9 (2.3%) | 4 (1.9%) |
| 15 to 19 Minutes | 8 (2.0%) | 21 (10.2%) |
| 20 to 24 Minutes | 14 (3.6%) | 18 (8.8%) |
| 25 to 29 Minutes | 43 (10.9%) | 22 (10.7%) |
| 30 to 34 Minutes | 278 (70.7%) | 103 (50.2%) |
| 35 to 39 Minutes | 11 (2.8%) | 22 (10.7%) |
| 40 to 44 Minutes | 0 (0.0%) | 0 (0.0%) |
| 45 to 59 Minutes | 15 (3.8%) | 2 (1.0%) |
| 60 to 89 Minutes | 4 (1.0%) | 7 (3.4%) |
| 90 or more Minutes | 0 (0.0%) | 4 (1.9%) |
Time of Departure to Work by Sex in Theresa
The most frequent times of departure to work in Theresa are 6:00 AM to 6:29 AM (293, 74.6%) for males and 6:30 AM to 6:59 AM (90, 43.9%) for females.
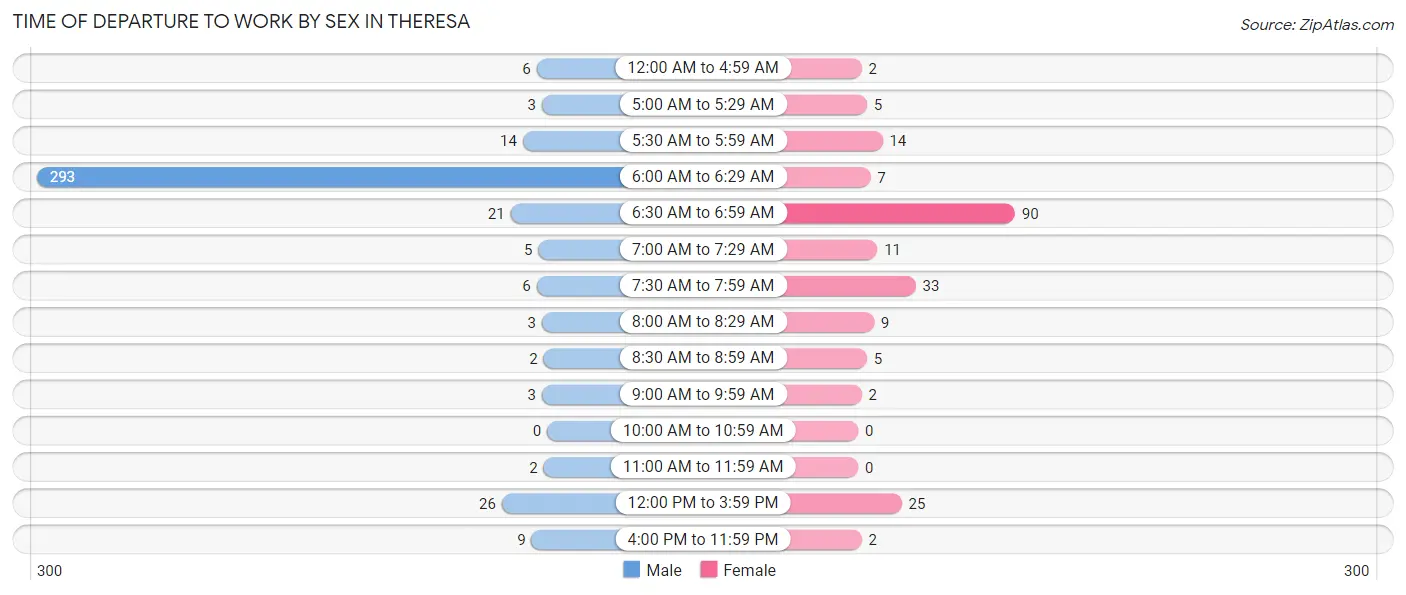
| Time of Departure | Male | Female |
| 12:00 AM to 4:59 AM | 6 (1.5%) | 2 (1.0%) |
| 5:00 AM to 5:29 AM | 3 (0.8%) | 5 (2.4%) |
| 5:30 AM to 5:59 AM | 14 (3.6%) | 14 (6.8%) |
| 6:00 AM to 6:29 AM | 293 (74.6%) | 7 (3.4%) |
| 6:30 AM to 6:59 AM | 21 (5.3%) | 90 (43.9%) |
| 7:00 AM to 7:29 AM | 5 (1.3%) | 11 (5.4%) |
| 7:30 AM to 7:59 AM | 6 (1.5%) | 33 (16.1%) |
| 8:00 AM to 8:29 AM | 3 (0.8%) | 9 (4.4%) |
| 8:30 AM to 8:59 AM | 2 (0.5%) | 5 (2.4%) |
| 9:00 AM to 9:59 AM | 3 (0.8%) | 2 (1.0%) |
| 10:00 AM to 10:59 AM | 0 (0.0%) | 0 (0.0%) |
| 11:00 AM to 11:59 AM | 2 (0.5%) | 0 (0.0%) |
| 12:00 PM to 3:59 PM | 26 (6.6%) | 25 (12.2%) |
| 4:00 PM to 11:59 PM | 9 (2.3%) | 2 (1.0%) |
| Total | 393 (100.0%) | 205 (100.0%) |
Housing Occupancy in Theresa
Occupancy by Ownership in Theresa
Of the total 316 dwellings in Theresa, owner-occupied units account for 173 (54.7%), while renter-occupied units make up 143 (45.3%).
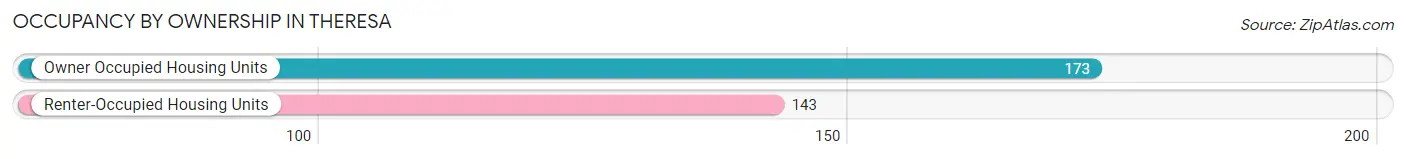
| Occupancy | # Housing Units | % Housing Units |
| Owner Occupied Housing Units | 173 | 54.7% |
| Renter-Occupied Housing Units | 143 | 45.3% |
| Total Occupied Housing Units | 316 | 100.0% |
Occupancy by Household Size in Theresa
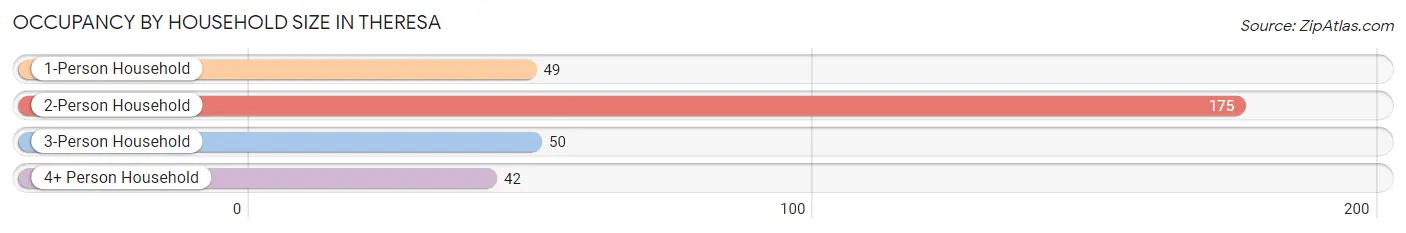
| Household Size | # Housing Units | % Housing Units |
| 1-Person Household | 49 | 15.5% |
| 2-Person Household | 175 | 55.4% |
| 3-Person Household | 50 | 15.8% |
| 4+ Person Household | 42 | 13.3% |
| Total Housing Units | 316 | 100.0% |
Occupancy by Ownership by Household Size in Theresa
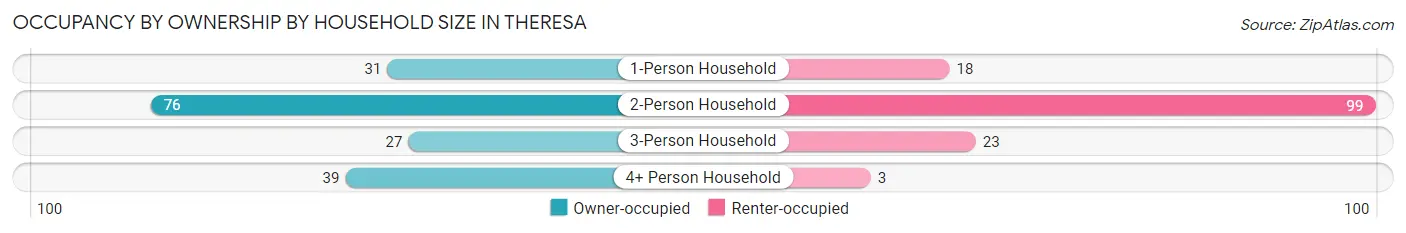
| Household Size | Owner-occupied | Renter-occupied |
| 1-Person Household | 31 (63.3%) | 18 (36.7%) |
| 2-Person Household | 76 (43.4%) | 99 (56.6%) |
| 3-Person Household | 27 (54.0%) | 23 (46.0%) |
| 4+ Person Household | 39 (92.9%) | 3 (7.1%) |
| Total Housing Units | 173 (54.7%) | 143 (45.3%) |
Occupancy by Educational Attainment in Theresa
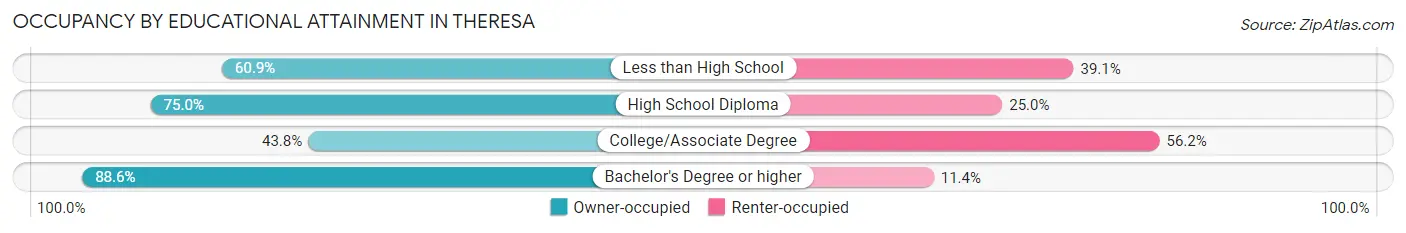
| Household Size | Owner-occupied | Renter-occupied |
| Less than High School | 14 (60.9%) | 9 (39.1%) |
| High School Diploma | 36 (75.0%) | 12 (25.0%) |
| College/Associate Degree | 92 (43.8%) | 118 (56.2%) |
| Bachelor's Degree or higher | 31 (88.6%) | 4 (11.4%) |
Occupancy by Age of Householder in Theresa
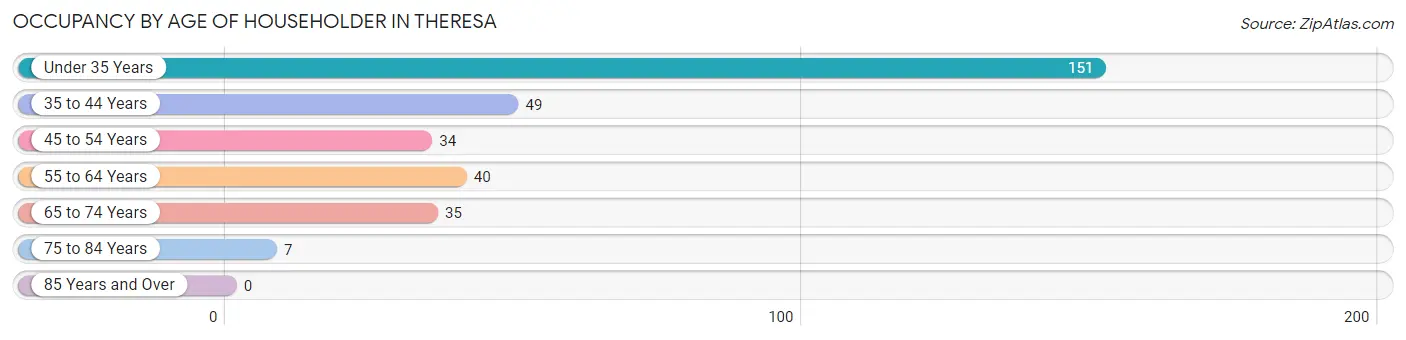
| Age Bracket | # Households | % Households |
| Under 35 Years | 151 | 47.8% |
| 35 to 44 Years | 49 | 15.5% |
| 45 to 54 Years | 34 | 10.8% |
| 55 to 64 Years | 40 | 12.7% |
| 65 to 74 Years | 35 | 11.1% |
| 75 to 84 Years | 7 | 2.2% |
| 85 Years and Over | 0 | 0.0% |
| Total | 316 | 100.0% |
Housing Finances in Theresa
Median Income by Occupancy in Theresa
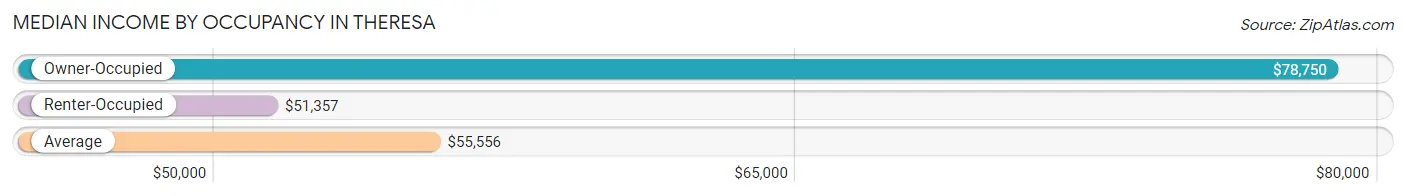
| Occupancy Type | # Households | Median Income |
| Owner-Occupied | 173 (54.7%) | $78,750 |
| Renter-Occupied | 143 (45.3%) | $51,357 |
| Average | 316 (100.0%) | $55,556 |
Occupancy by Householder Income Bracket in Theresa
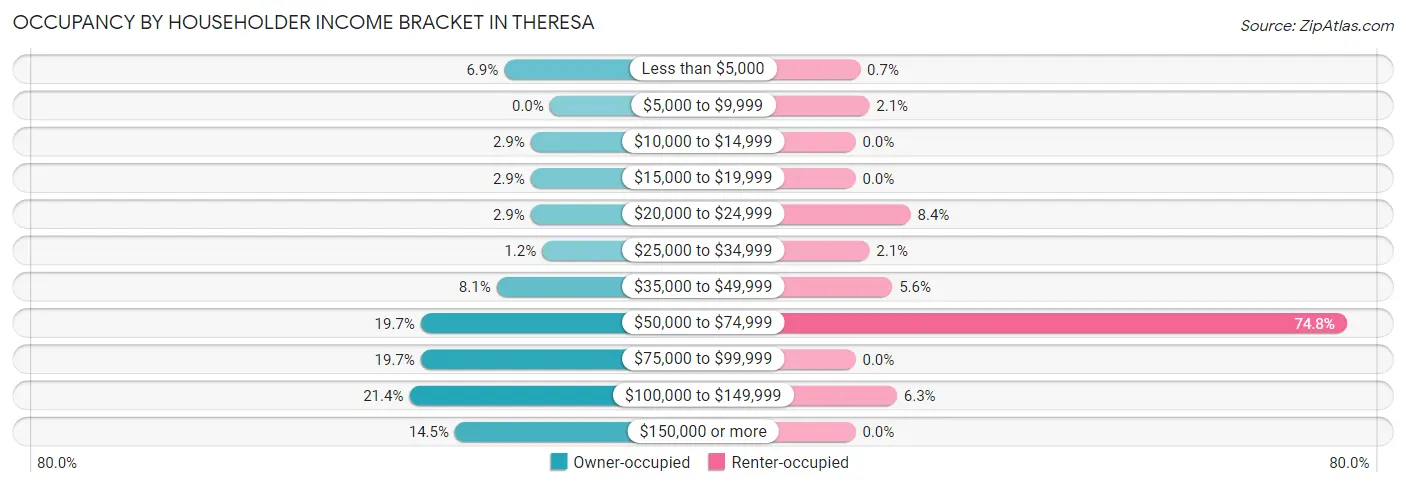
| Income Bracket | Owner-occupied | Renter-occupied |
| Less than $5,000 | 12 (6.9%) | 1 (0.7%) |
| $5,000 to $9,999 | 0 (0.0%) | 3 (2.1%) |
| $10,000 to $14,999 | 5 (2.9%) | 0 (0.0%) |
| $15,000 to $19,999 | 5 (2.9%) | 0 (0.0%) |
| $20,000 to $24,999 | 5 (2.9%) | 12 (8.4%) |
| $25,000 to $34,999 | 2 (1.2%) | 3 (2.1%) |
| $35,000 to $49,999 | 14 (8.1%) | 8 (5.6%) |
| $50,000 to $74,999 | 34 (19.7%) | 107 (74.8%) |
| $75,000 to $99,999 | 34 (19.7%) | 0 (0.0%) |
| $100,000 to $149,999 | 37 (21.4%) | 9 (6.3%) |
| $150,000 or more | 25 (14.4%) | 0 (0.0%) |
| Total | 173 (100.0%) | 143 (100.0%) |
Monthly Housing Cost Tiers in Theresa
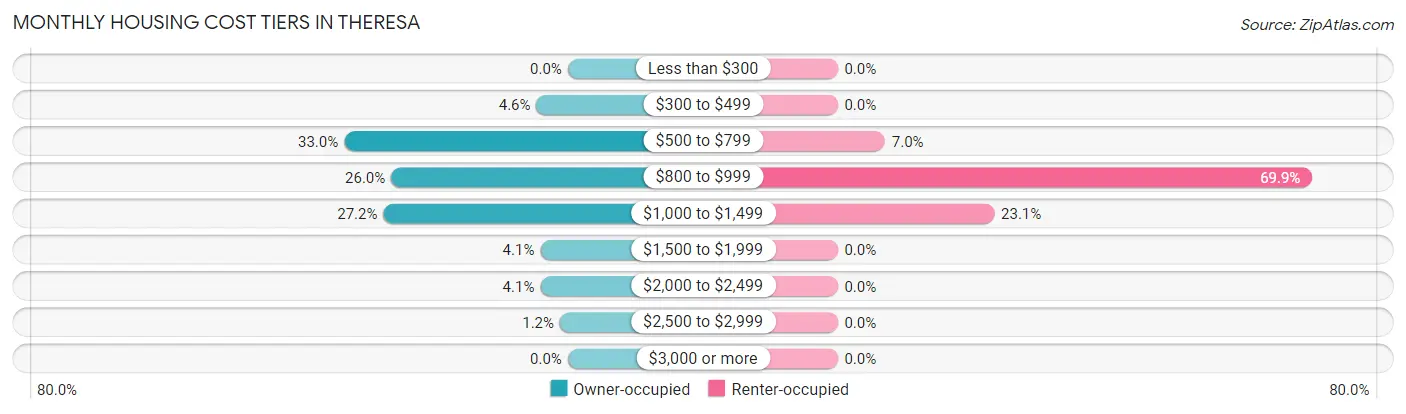
| Monthly Cost | Owner-occupied | Renter-occupied |
| Less than $300 | 0 (0.0%) | 0 (0.0%) |
| $300 to $499 | 8 (4.6%) | 0 (0.0%) |
| $500 to $799 | 57 (33.0%) | 10 (7.0%) |
| $800 to $999 | 45 (26.0%) | 100 (69.9%) |
| $1,000 to $1,499 | 47 (27.2%) | 33 (23.1%) |
| $1,500 to $1,999 | 7 (4.1%) | 0 (0.0%) |
| $2,000 to $2,499 | 7 (4.1%) | 0 (0.0%) |
| $2,500 to $2,999 | 2 (1.2%) | 0 (0.0%) |
| $3,000 or more | 0 (0.0%) | 0 (0.0%) |
| Total | 173 (100.0%) | 143 (100.0%) |
Physical Housing Characteristics in Theresa
Housing Structures in Theresa
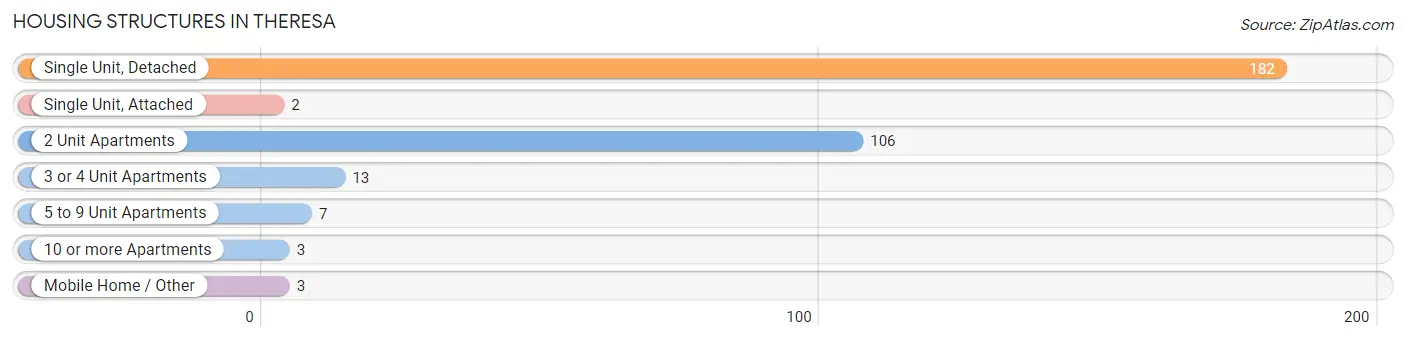
| Structure Type | # Housing Units | % Housing Units |
| Single Unit, Detached | 182 | 57.6% |
| Single Unit, Attached | 2 | 0.6% |
| 2 Unit Apartments | 106 | 33.5% |
| 3 or 4 Unit Apartments | 13 | 4.1% |
| 5 to 9 Unit Apartments | 7 | 2.2% |
| 10 or more Apartments | 3 | 0.9% |
| Mobile Home / Other | 3 | 0.9% |
| Total | 316 | 100.0% |
Housing Structures by Occupancy in Theresa
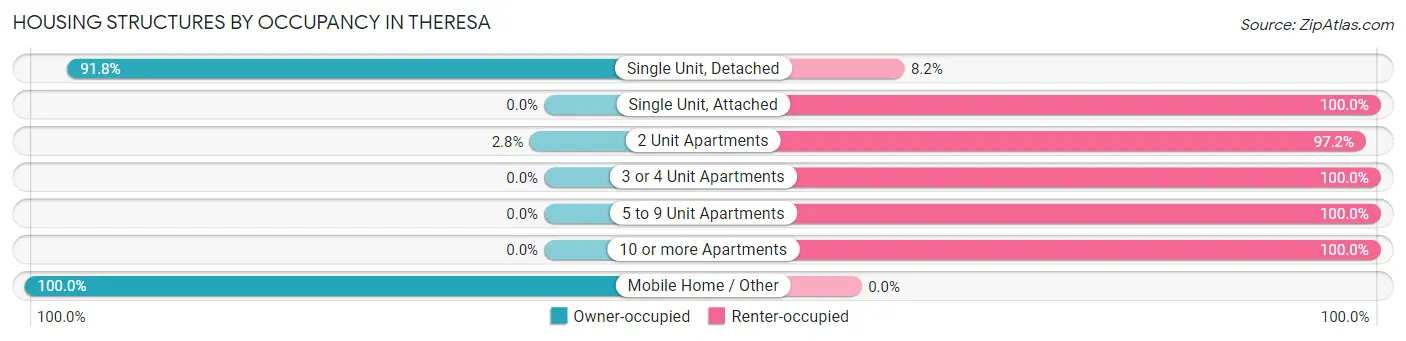
| Structure Type | Owner-occupied | Renter-occupied |
| Single Unit, Detached | 167 (91.8%) | 15 (8.2%) |
| Single Unit, Attached | 0 (0.0%) | 2 (100.0%) |
| 2 Unit Apartments | 3 (2.8%) | 103 (97.2%) |
| 3 or 4 Unit Apartments | 0 (0.0%) | 13 (100.0%) |
| 5 to 9 Unit Apartments | 0 (0.0%) | 7 (100.0%) |
| 10 or more Apartments | 0 (0.0%) | 3 (100.0%) |
| Mobile Home / Other | 3 (100.0%) | 0 (0.0%) |
| Total | 173 (54.7%) | 143 (45.3%) |
Housing Structures by Number of Rooms in Theresa
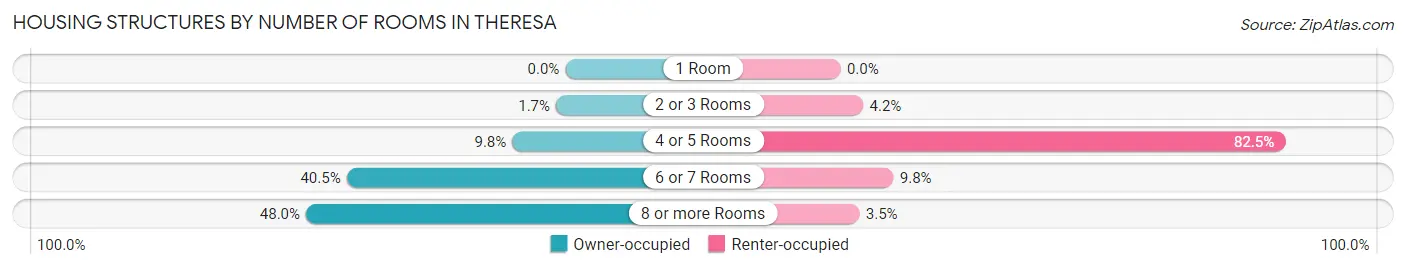
| Number of Rooms | Owner-occupied | Renter-occupied |
| 1 Room | 0 (0.0%) | 0 (0.0%) |
| 2 or 3 Rooms | 3 (1.7%) | 6 (4.2%) |
| 4 or 5 Rooms | 17 (9.8%) | 118 (82.5%) |
| 6 or 7 Rooms | 70 (40.5%) | 14 (9.8%) |
| 8 or more Rooms | 83 (48.0%) | 5 (3.5%) |
| Total | 173 (100.0%) | 143 (100.0%) |
Housing Structure by Heating Type in Theresa
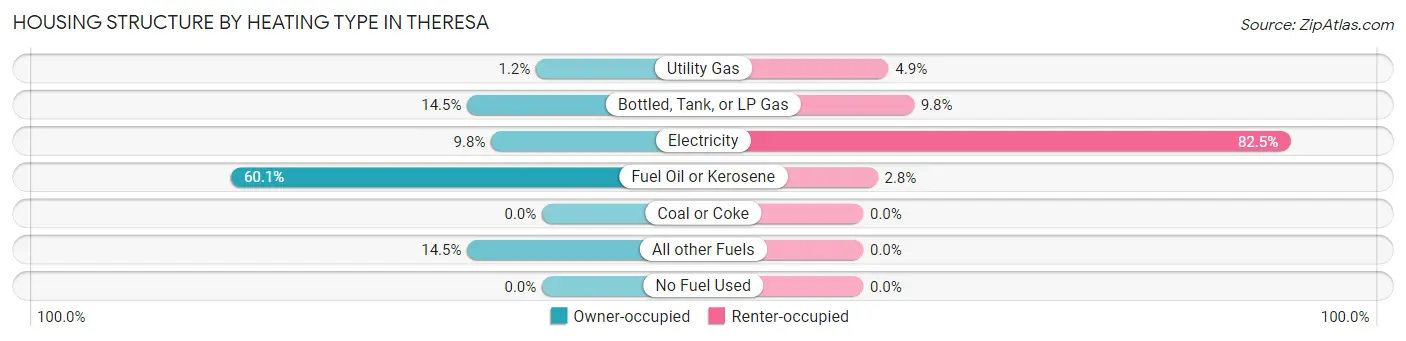
| Heating Type | Owner-occupied | Renter-occupied |
| Utility Gas | 2 (1.2%) | 7 (4.9%) |
| Bottled, Tank, or LP Gas | 25 (14.4%) | 14 (9.8%) |
| Electricity | 17 (9.8%) | 118 (82.5%) |
| Fuel Oil or Kerosene | 104 (60.1%) | 4 (2.8%) |
| Coal or Coke | 0 (0.0%) | 0 (0.0%) |
| All other Fuels | 25 (14.4%) | 0 (0.0%) |
| No Fuel Used | 0 (0.0%) | 0 (0.0%) |
| Total | 173 (100.0%) | 143 (100.0%) |
Household Vehicle Usage in Theresa
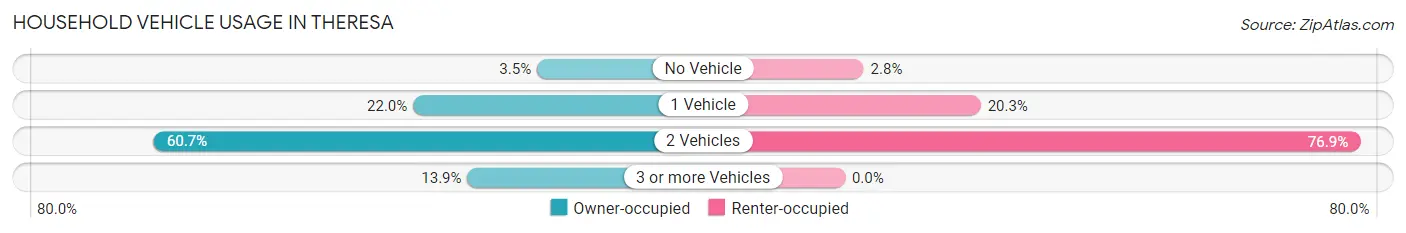
| Vehicles per Household | Owner-occupied | Renter-occupied |
| No Vehicle | 6 (3.5%) | 4 (2.8%) |
| 1 Vehicle | 38 (22.0%) | 29 (20.3%) |
| 2 Vehicles | 105 (60.7%) | 110 (76.9%) |
| 3 or more Vehicles | 24 (13.9%) | 0 (0.0%) |
| Total | 173 (100.0%) | 143 (100.0%) |
Real Estate & Mortgages in Theresa
Real Estate and Mortgage Overview in Theresa
| Characteristic | Without Mortgage | With Mortgage |
| Housing Units | 77 | 96 |
| Median Property Value | $149,200 | $142,500 |
| Median Household Income | $92,656 | $11 |
| Monthly Housing Costs | $731 | $0 |
| Real Estate Taxes | $2,420 | $2 |
Property Value by Mortgage Status in Theresa
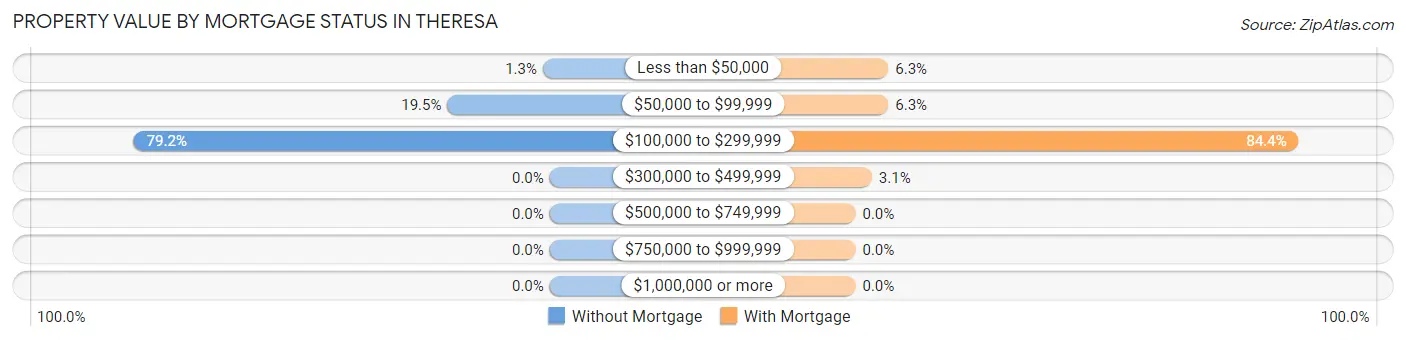
| Property Value | Without Mortgage | With Mortgage |
| Less than $50,000 | 1 (1.3%) | 6 (6.2%) |
| $50,000 to $99,999 | 15 (19.5%) | 6 (6.2%) |
| $100,000 to $299,999 | 61 (79.2%) | 81 (84.4%) |
| $300,000 to $499,999 | 0 (0.0%) | 3 (3.1%) |
| $500,000 to $749,999 | 0 (0.0%) | 0 (0.0%) |
| $750,000 to $999,999 | 0 (0.0%) | 0 (0.0%) |
| $1,000,000 or more | 0 (0.0%) | 0 (0.0%) |
| Total | 77 (100.0%) | 96 (100.0%) |
Household Income by Mortgage Status in Theresa
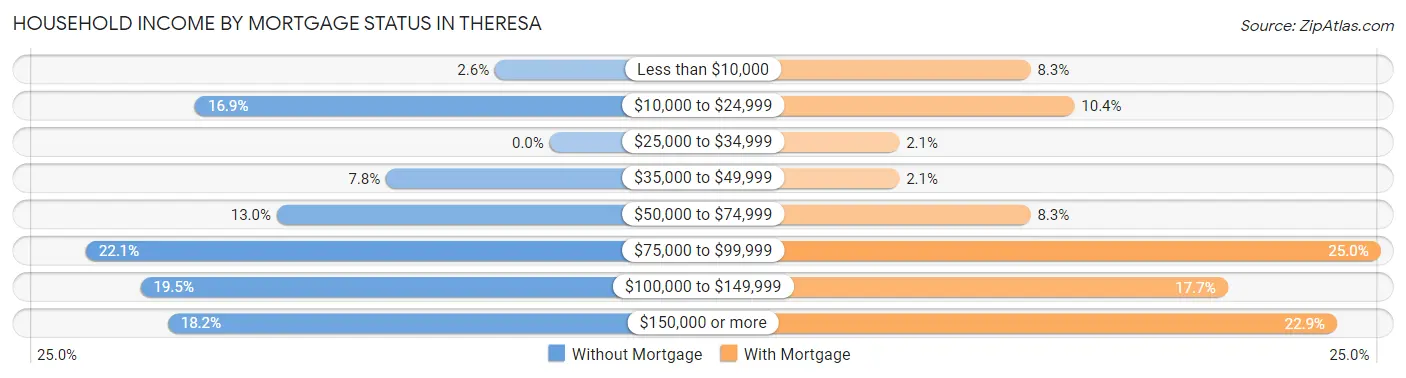
| Household Income | Without Mortgage | With Mortgage |
| Less than $10,000 | 2 (2.6%) | 8 (8.3%) |
| $10,000 to $24,999 | 13 (16.9%) | 10 (10.4%) |
| $25,000 to $34,999 | 0 (0.0%) | 2 (2.1%) |
| $35,000 to $49,999 | 6 (7.8%) | 2 (2.1%) |
| $50,000 to $74,999 | 10 (13.0%) | 8 (8.3%) |
| $75,000 to $99,999 | 17 (22.1%) | 24 (25.0%) |
| $100,000 to $149,999 | 15 (19.5%) | 17 (17.7%) |
| $150,000 or more | 14 (18.2%) | 22 (22.9%) |
| Total | 77 (100.0%) | 96 (100.0%) |
Property Value to Household Income Ratio in Theresa
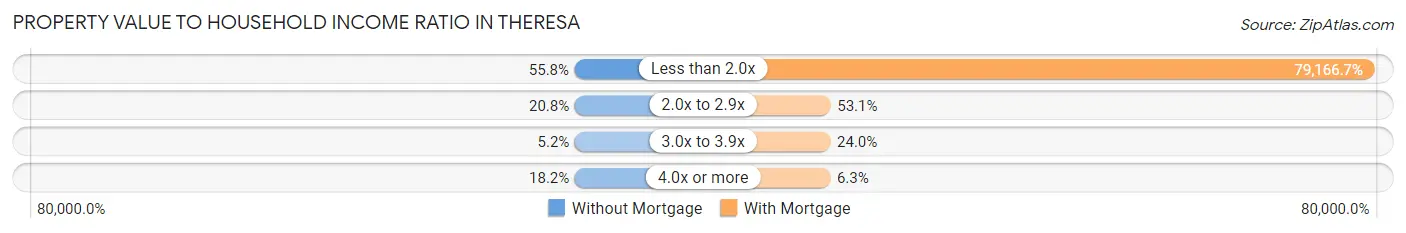
| Value-to-Income Ratio | Without Mortgage | With Mortgage |
| Less than 2.0x | 43 (55.8%) | 76,000 (79,166.7%) |
| 2.0x to 2.9x | 16 (20.8%) | 51 (53.1%) |
| 3.0x to 3.9x | 4 (5.2%) | 23 (24.0%) |
| 4.0x or more | 14 (18.2%) | 6 (6.2%) |
| Total | 77 (100.0%) | 96 (100.0%) |
Real Estate Taxes by Mortgage Status in Theresa
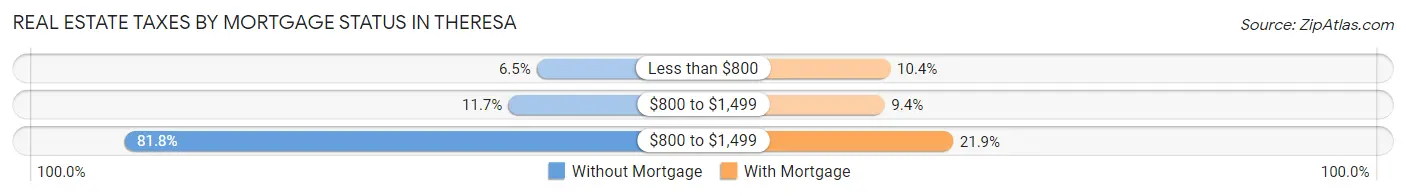
| Property Taxes | Without Mortgage | With Mortgage |
| Less than $800 | 5 (6.5%) | 10 (10.4%) |
| $800 to $1,499 | 9 (11.7%) | 9 (9.4%) |
| $800 to $1,499 | 63 (81.8%) | 21 (21.9%) |
| Total | 77 (100.0%) | 96 (100.0%) |
Health & Disability in Theresa
Health Insurance Coverage by Age in Theresa
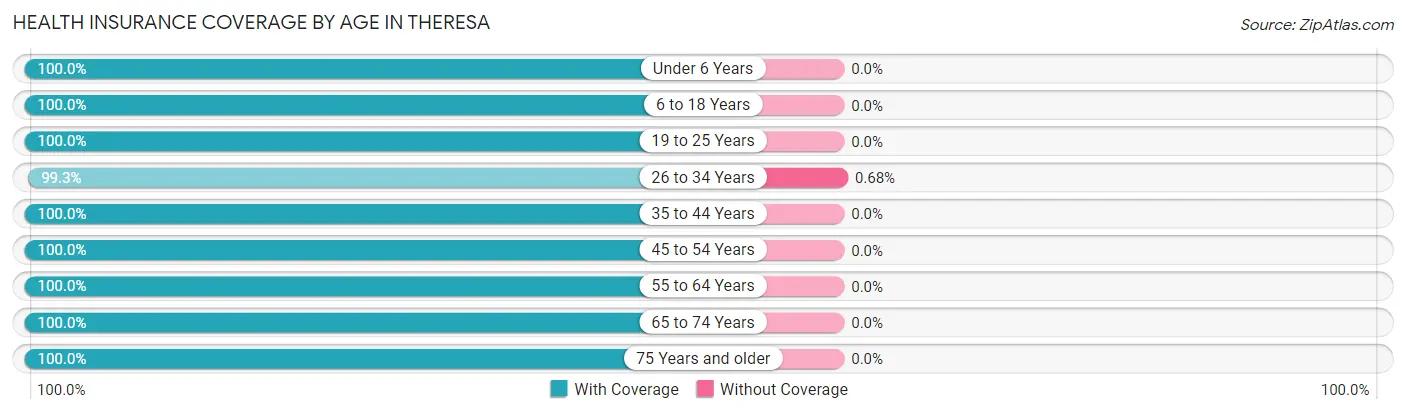
| Age Bracket | With Coverage | Without Coverage |
| Under 6 Years | 52 (100.0%) | 0 (0.0%) |
| 6 to 18 Years | 93 (100.0%) | 0 (0.0%) |
| 19 to 25 Years | 52 (100.0%) | 0 (0.0%) |
| 26 to 34 Years | 436 (99.3%) | 3 (0.7%) |
| 35 to 44 Years | 62 (100.0%) | 0 (0.0%) |
| 45 to 54 Years | 57 (100.0%) | 0 (0.0%) |
| 55 to 64 Years | 81 (100.0%) | 0 (0.0%) |
| 65 to 74 Years | 58 (100.0%) | 0 (0.0%) |
| 75 Years and older | 13 (100.0%) | 0 (0.0%) |
| Total | 904 (99.7%) | 3 (0.3%) |
Health Insurance Coverage by Citizenship Status in Theresa
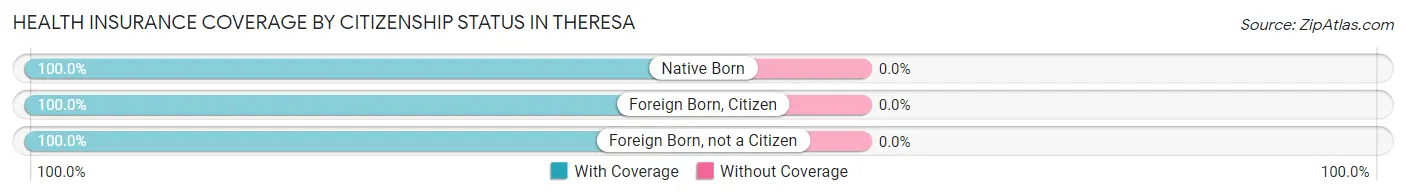
| Citizenship Status | With Coverage | Without Coverage |
| Native Born | 52 (100.0%) | 0 (0.0%) |
| Foreign Born, Citizen | 93 (100.0%) | 0 (0.0%) |
| Foreign Born, not a Citizen | 52 (100.0%) | 0 (0.0%) |
Health Insurance Coverage by Household Income in Theresa
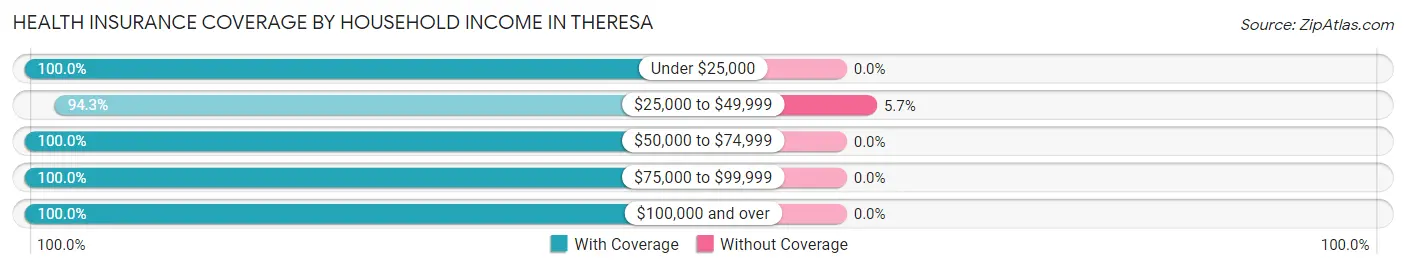
| Household Income | With Coverage | Without Coverage |
| Under $25,000 | 113 (100.0%) | 0 (0.0%) |
| $25,000 to $49,999 | 50 (94.3%) | 3 (5.7%) |
| $50,000 to $74,999 | 472 (100.0%) | 0 (0.0%) |
| $75,000 to $99,999 | 89 (100.0%) | 0 (0.0%) |
| $100,000 and over | 180 (100.0%) | 0 (0.0%) |
Public vs Private Health Insurance Coverage by Age in Theresa
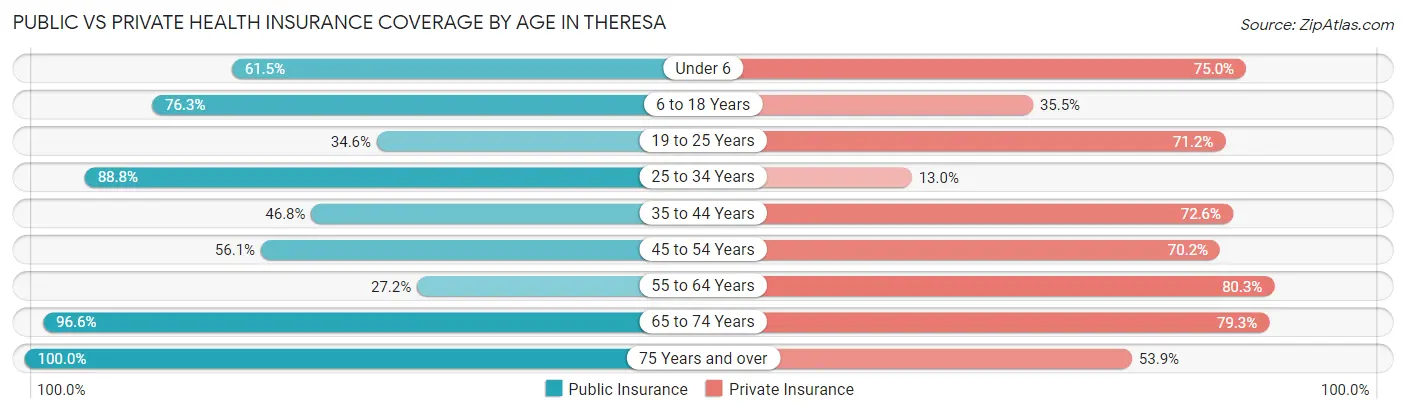
| Age Bracket | Public Insurance | Private Insurance |
| Under 6 | 32 (61.5%) | 39 (75.0%) |
| 6 to 18 Years | 71 (76.3%) | 33 (35.5%) |
| 19 to 25 Years | 18 (34.6%) | 37 (71.2%) |
| 25 to 34 Years | 390 (88.8%) | 57 (13.0%) |
| 35 to 44 Years | 29 (46.8%) | 45 (72.6%) |
| 45 to 54 Years | 32 (56.1%) | 40 (70.2%) |
| 55 to 64 Years | 22 (27.2%) | 65 (80.2%) |
| 65 to 74 Years | 56 (96.6%) | 46 (79.3%) |
| 75 Years and over | 13 (100.0%) | 7 (53.8%) |
| Total | 663 (73.1%) | 369 (40.7%) |
Disability Status by Sex by Age in Theresa
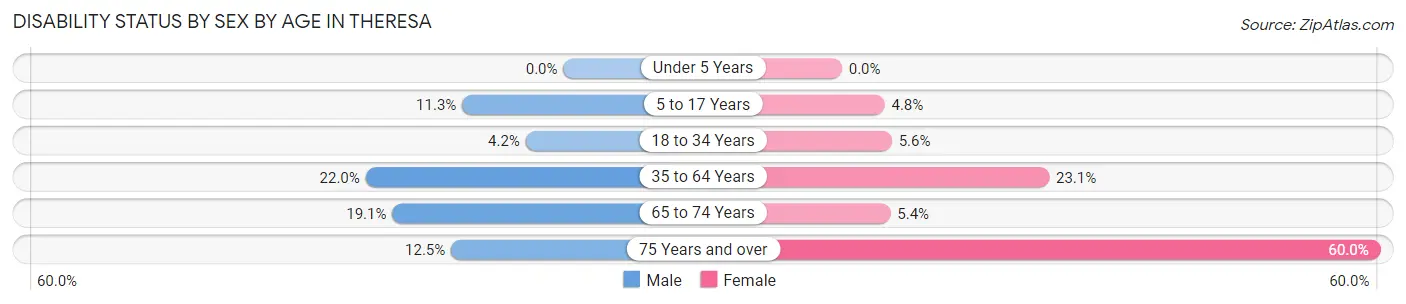
| Age Bracket | Male | Female |
| Under 5 Years | 0 (0.0%) | 0 (0.0%) |
| 5 to 17 Years | 8 (11.3%) | 2 (4.8%) |
| 18 to 34 Years | 14 (4.2%) | 9 (5.6%) |
| 35 to 64 Years | 24 (22.0%) | 21 (23.1%) |
| 65 to 74 Years | 4 (19.1%) | 2 (5.4%) |
| 75 Years and over | 1 (12.5%) | 3 (60.0%) |
Disability Class by Sex by Age in Theresa
Disability Class: Hearing Difficulty
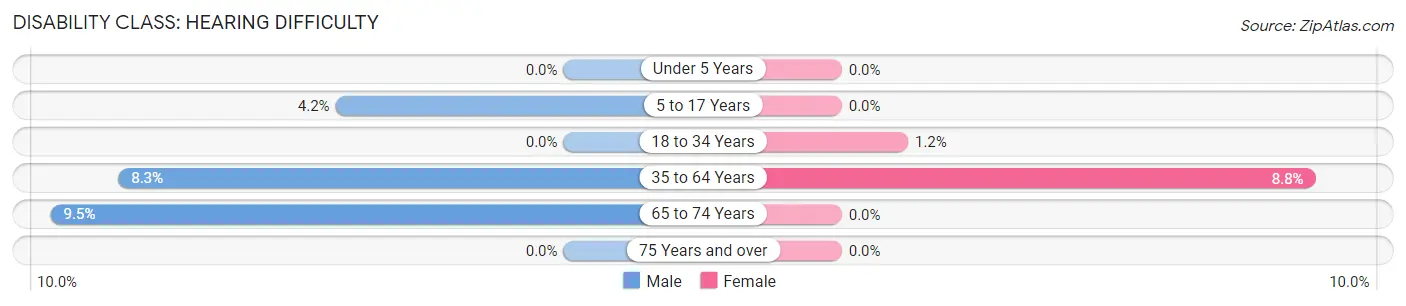
| Age Bracket | Male | Female |
| Under 5 Years | 0 (0.0%) | 0 (0.0%) |
| 5 to 17 Years | 3 (4.2%) | 0 (0.0%) |
| 18 to 34 Years | 0 (0.0%) | 2 (1.2%) |
| 35 to 64 Years | 9 (8.3%) | 8 (8.8%) |
| 65 to 74 Years | 2 (9.5%) | 0 (0.0%) |
| 75 Years and over | 0 (0.0%) | 0 (0.0%) |
Disability Class: Vision Difficulty
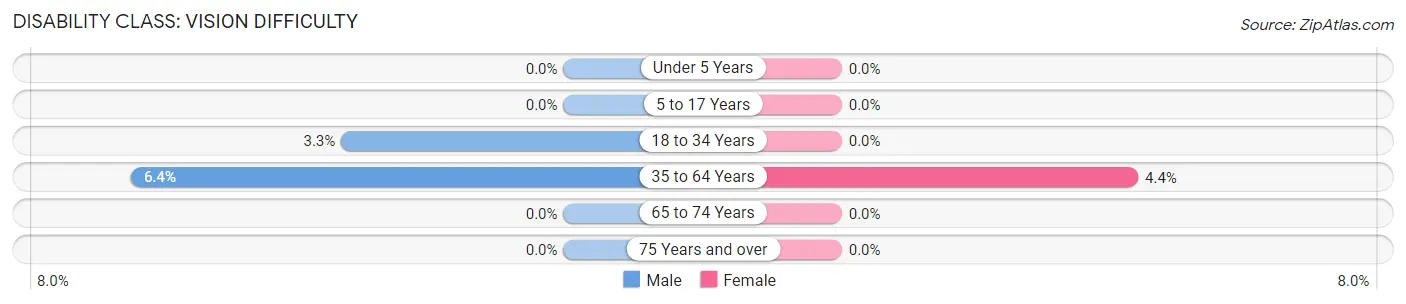
| Age Bracket | Male | Female |
| Under 5 Years | 0 (0.0%) | 0 (0.0%) |
| 5 to 17 Years | 0 (0.0%) | 0 (0.0%) |
| 18 to 34 Years | 11 (3.3%) | 0 (0.0%) |
| 35 to 64 Years | 7 (6.4%) | 4 (4.4%) |
| 65 to 74 Years | 0 (0.0%) | 0 (0.0%) |
| 75 Years and over | 0 (0.0%) | 0 (0.0%) |
Disability Class: Cognitive Difficulty
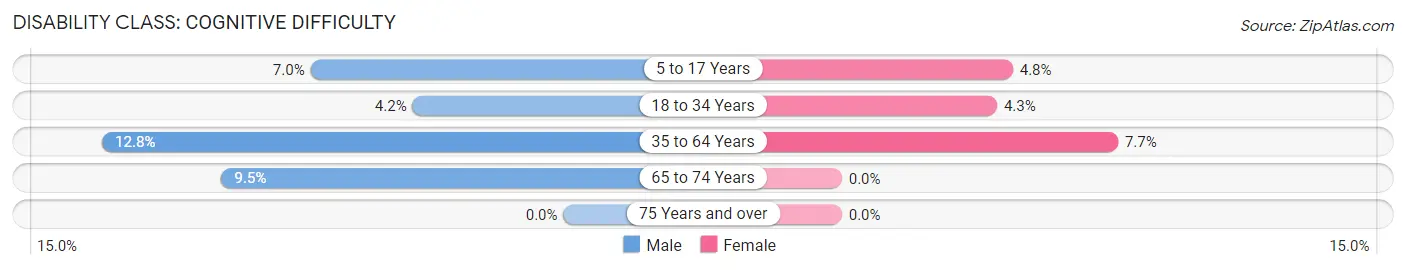
| Age Bracket | Male | Female |
| 5 to 17 Years | 5 (7.0%) | 2 (4.8%) |
| 18 to 34 Years | 14 (4.2%) | 7 (4.3%) |
| 35 to 64 Years | 14 (12.8%) | 7 (7.7%) |
| 65 to 74 Years | 2 (9.5%) | 0 (0.0%) |
| 75 Years and over | 0 (0.0%) | 0 (0.0%) |
Disability Class: Ambulatory Difficulty
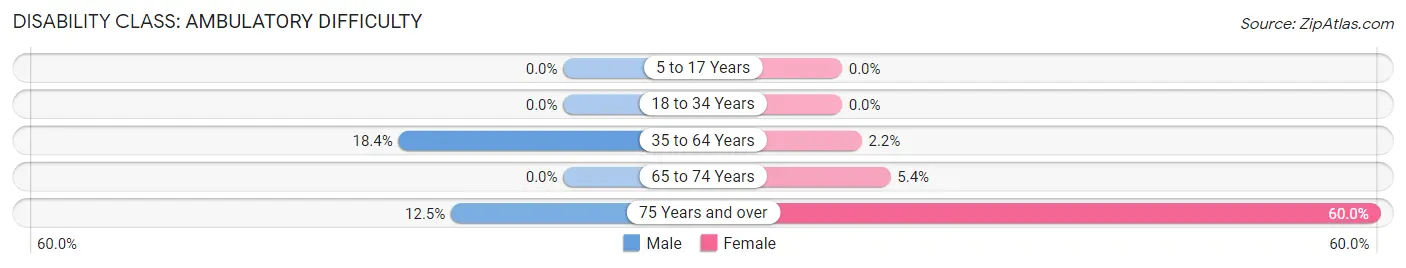
| Age Bracket | Male | Female |
| 5 to 17 Years | 0 (0.0%) | 0 (0.0%) |
| 18 to 34 Years | 0 (0.0%) | 0 (0.0%) |
| 35 to 64 Years | 20 (18.3%) | 2 (2.2%) |
| 65 to 74 Years | 0 (0.0%) | 2 (5.4%) |
| 75 Years and over | 1 (12.5%) | 3 (60.0%) |
Disability Class: Self-Care Difficulty
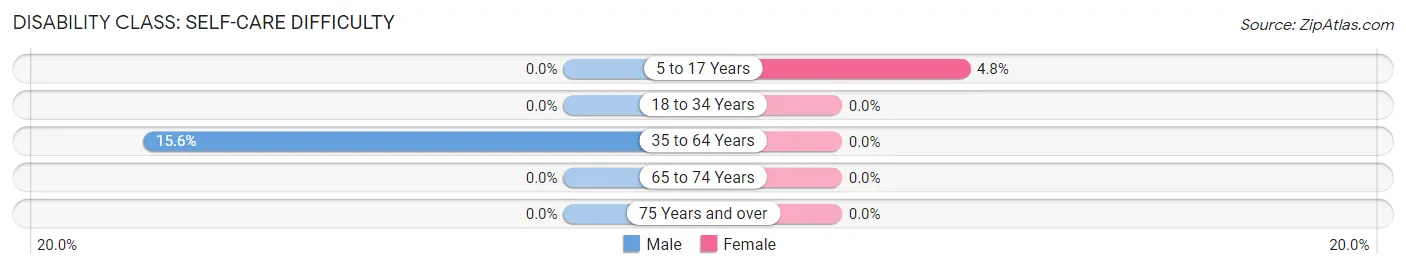
| Age Bracket | Male | Female |
| 5 to 17 Years | 0 (0.0%) | 2 (4.8%) |
| 18 to 34 Years | 0 (0.0%) | 0 (0.0%) |
| 35 to 64 Years | 17 (15.6%) | 0 (0.0%) |
| 65 to 74 Years | 0 (0.0%) | 0 (0.0%) |
| 75 Years and over | 0 (0.0%) | 0 (0.0%) |
Technology Access in Theresa
Computing Device Access in Theresa
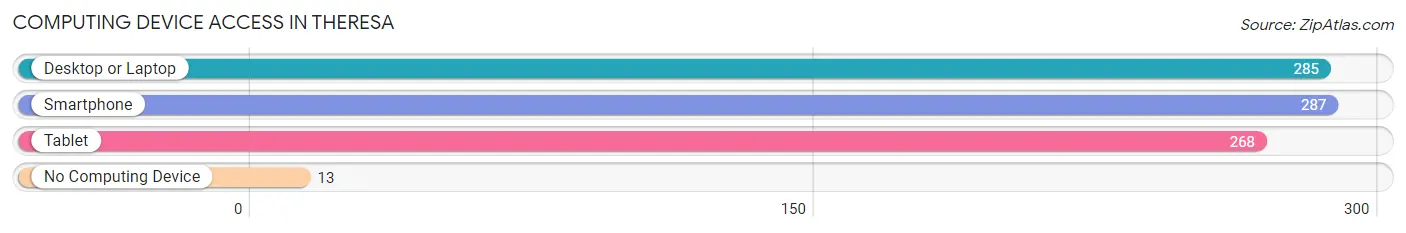
| Device Type | # Households | % Households |
| Desktop or Laptop | 285 | 90.2% |
| Smartphone | 287 | 90.8% |
| Tablet | 268 | 84.8% |
| No Computing Device | 13 | 4.1% |
| Total | 316 | 100.0% |
Internet Access in Theresa
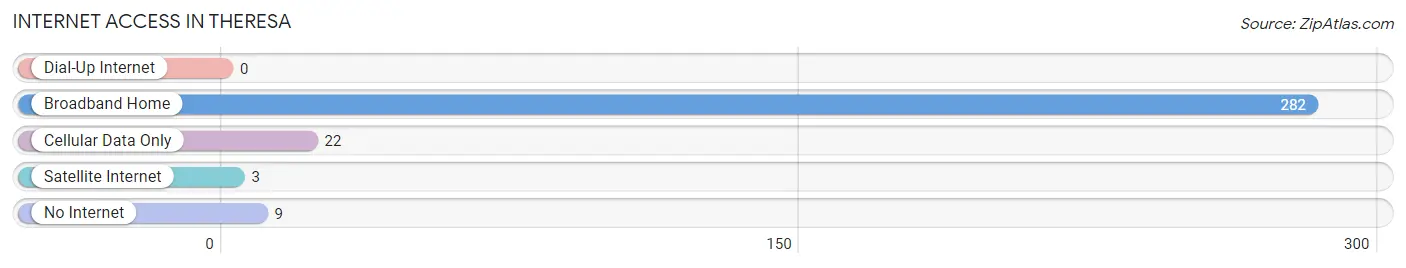
| Internet Type | # Households | % Households |
| Dial-Up Internet | 0 | 0.0% |
| Broadband Home | 282 | 89.2% |
| Cellular Data Only | 22 | 7.0% |
| Satellite Internet | 3 | 0.9% |
| No Internet | 9 | 2.9% |
| Total | 316 | 100.0% |
Theresa Summary
New York is a state located in the Northeastern United States. It is bordered by New Jersey and Pennsylvania to the south, and by Connecticut, Massachusetts, and Vermont to the east. New York is the 27th largest state in the United States, with an area of 54,556 square miles (141,300 km2). It is also the fourth most populous state, with a population of 19.45 million people in 2019.
History
The history of New York dates back to the early 17th century, when the Dutch established the colony of New Netherland. The colony was taken over by the British in 1664, and renamed New York after the Duke of York. During the American Revolution, New York was a major center of activity, and was the site of several major battles. After the war, New York became the 11th state to ratify the United States Constitution in 1788.
In the 19th century, New York was a major center of immigration, and the state was home to many of the nation’s most important industrial centers. The state was also the site of several major labor disputes, including the 1877 Great Railroad Strike and the 1911 Triangle Shirtwaist Factory Fire.
In the 20th century, New York was a major center of finance and culture. The state was home to the headquarters of many major corporations, and was the site of the United Nations headquarters. New York was also the site of the September 11, 2001 terrorist attacks, which had a major impact on the state and the nation.
Geography
New York is located in the Northeastern United States, and is bordered by New Jersey and Pennsylvania to the south, and by Connecticut, Massachusetts, and Vermont to the east. The state is divided into two distinct regions: the Hudson Valley and the Adirondack Mountains. The Hudson Valley is a region of rolling hills and valleys, while the Adirondack Mountains are a rugged, mountainous region.
The state is home to several major rivers, including the Hudson River, the Mohawk River, and the Genesee River. The state also has several major lakes, including Lake Ontario, Lake Erie, and Lake Champlain.
Economy
New York’s economy is one of the largest and most diverse in the United States. The state is home to several major industries, including finance, manufacturing, and tourism.
The state is home to several major financial centers, including Wall Street in New York City. The state is also home to several major manufacturing centers, including the Buffalo-Niagara Falls region and the Rochester-Finger Lakes region.
The state is also a major tourist destination, with attractions such as the Statue of Liberty, the Empire State Building, and Niagara Falls. Tourism is a major source of revenue for the state, and is estimated to contribute over $100 billion to the state’s economy each year.
Demographics
New York is the fourth most populous state in the United States, with a population of 19.45 million people in 2019. The state is home to a diverse population, with large populations of African Americans, Hispanics, and Asians.
New York City is the most populous city in the state, with a population of 8.4 million people. Other major cities in the state include Buffalo, Rochester, and Syracuse.
New York is also home to a large number of immigrants, with over 3 million foreign-born residents in the state. The largest immigrant groups in the state are from the Dominican Republic, China, and Jamaica.
Common Questions
What is Per Capita Income in Theresa?
Per Capita income in Theresa is $29,431.
What is the Median Family Income in Theresa?
Median Family Income in Theresa is $73,750.
What is the Median Household income in Theresa?
Median Household Income in Theresa is $55,556.
What is Income or Wage Gap in Theresa?
Income or Wage Gap in Theresa is 8.3%.
Women in Theresa earn 91.7 cents for every dollar earned by a man.
What is Inequality or Gini Index in Theresa?
Inequality or Gini Index in Theresa is 0.34.
What is the Total Population of Theresa?
Total Population of Theresa is 919.
What is the Total Male Population of Theresa?
Total Male Population of Theresa is 563.
What is the Total Female Population of Theresa?
Total Female Population of Theresa is 356.
What is the Ratio of Males per 100 Females in Theresa?
There are 158.15 Males per 100 Females in Theresa.
What is the Ratio of Females per 100 Males in Theresa?
There are 63.23 Females per 100 Males in Theresa.
What is the Median Population Age in Theresa?
Median Population Age in Theresa is 29.5 Years.
What is the Average Family Size in Theresa
Average Family Size in Theresa is 2.7 People.
What is the Average Household Size in Theresa
Average Household Size in Theresa is 2.9 People.
How Large is the Labor Force in Theresa?
There are 650 People in the Labor Forcein in Theresa.
What is the Percentage of People in the Labor Force in Theresa?
82.9% of People are in the Labor Force in Theresa.
What is the Unemployment Rate in Theresa?
Unemployment Rate in Theresa is 4.1%.