Sunset Bay, NY Map & Demographics
Sunset Bay Map
Sunset Bay Overview
$26,115
PER CAPITA INCOME
$132,188
AVG FAMILY INCOME
0.36
INEQUALITY / GINI INDEX
366
TOTAL POPULATION
196
MALE POPULATION
170
FEMALE POPULATION
115.29
MALES / 100 FEMALES
86.73
FEMALES / 100 MALES
59.8
MEDIAN AGE
3.0
AVG FAMILY SIZE
2.0
AVG HOUSEHOLD SIZE
97
LABOR FORCE [ PEOPLE ]
29.0%
PERCENT IN LABOR FORCE
12.4%
UNEMPLOYMENT RATE
Income in Sunset Bay
Income Overview in Sunset Bay
| Characteristic | Number | Measure |
| Per Capita Income | 366 | $26,115 |
| Median Family Income | 50 | $132,188 |
| Mean Family Income | 50 | $108,842 |
| Median Household Income | 104 | $0 |
| Mean Household Income | 104 | $74,033 |
| Income Deficit | 50 | $0 |
| Wage / Income Gap (%) | 366 | 0.00% |
| Wage / Income Gap ($) | 366 | 100.00¢ per $1 |
| Gini / Inequality Index | 366 | 0.36 |
Earnings by Sex in Sunset Bay
| Sex | Number | Average Earnings |
| Male | 51 (53.7%) | $0 |
| Female | 44 (46.3%) | $0 |
| Total | 95 (100.0%) | $0 |
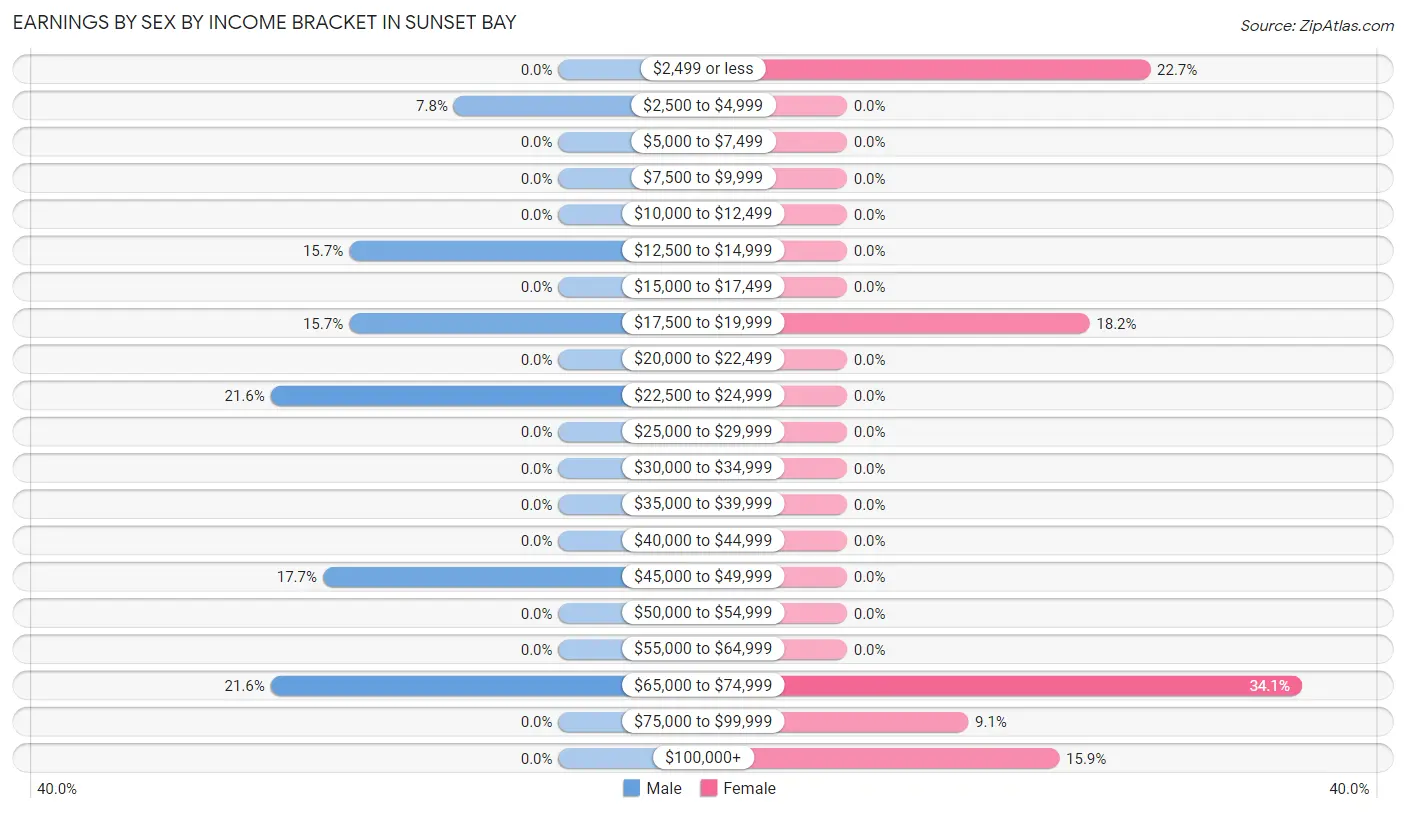
Earnings by Sex by Income Bracket in Sunset Bay
The most common earnings brackets in Sunset Bay are $22,500 to $24,999 for men (11 | 21.6%) and $65,000 to $74,999 for women (15 | 34.1%).
| Income | Male | Female |
| $2,499 or less | 0 (0.0%) | 10 (22.7%) |
| $2,500 to $4,999 | 4 (7.8%) | 0 (0.0%) |
| $5,000 to $7,499 | 0 (0.0%) | 0 (0.0%) |
| $7,500 to $9,999 | 0 (0.0%) | 0 (0.0%) |
| $10,000 to $12,499 | 0 (0.0%) | 0 (0.0%) |
| $12,500 to $14,999 | 8 (15.7%) | 0 (0.0%) |
| $15,000 to $17,499 | 0 (0.0%) | 0 (0.0%) |
| $17,500 to $19,999 | 8 (15.7%) | 8 (18.2%) |
| $20,000 to $22,499 | 0 (0.0%) | 0 (0.0%) |
| $22,500 to $24,999 | 11 (21.6%) | 0 (0.0%) |
| $25,000 to $29,999 | 0 (0.0%) | 0 (0.0%) |
| $30,000 to $34,999 | 0 (0.0%) | 0 (0.0%) |
| $35,000 to $39,999 | 0 (0.0%) | 0 (0.0%) |
| $40,000 to $44,999 | 0 (0.0%) | 0 (0.0%) |
| $45,000 to $49,999 | 9 (17.6%) | 0 (0.0%) |
| $50,000 to $54,999 | 0 (0.0%) | 0 (0.0%) |
| $55,000 to $64,999 | 0 (0.0%) | 0 (0.0%) |
| $65,000 to $74,999 | 11 (21.6%) | 15 (34.1%) |
| $75,000 to $99,999 | 0 (0.0%) | 4 (9.1%) |
| $100,000+ | 0 (0.0%) | 7 (15.9%) |
| Total | 51 (100.0%) | 44 (100.0%) |
Earnings by Sex by Educational Attainment in Sunset Bay
| Educational Attainment | Male Income | Female Income |
| Less than High School | - | - |
| High School Diploma | - | - |
| College or Associate's Degree | - | - |
| Bachelor's Degree | - | - |
| Graduate Degree | - | - |
| Total | - | - |
Family Income in Sunset Bay
Family Income Brackets in Sunset Bay
According to the Sunset Bay family income data, there are 28 families falling into the $100,000 to $149,999 income range, which is the most common income bracket and makes up 56.0% of all families.
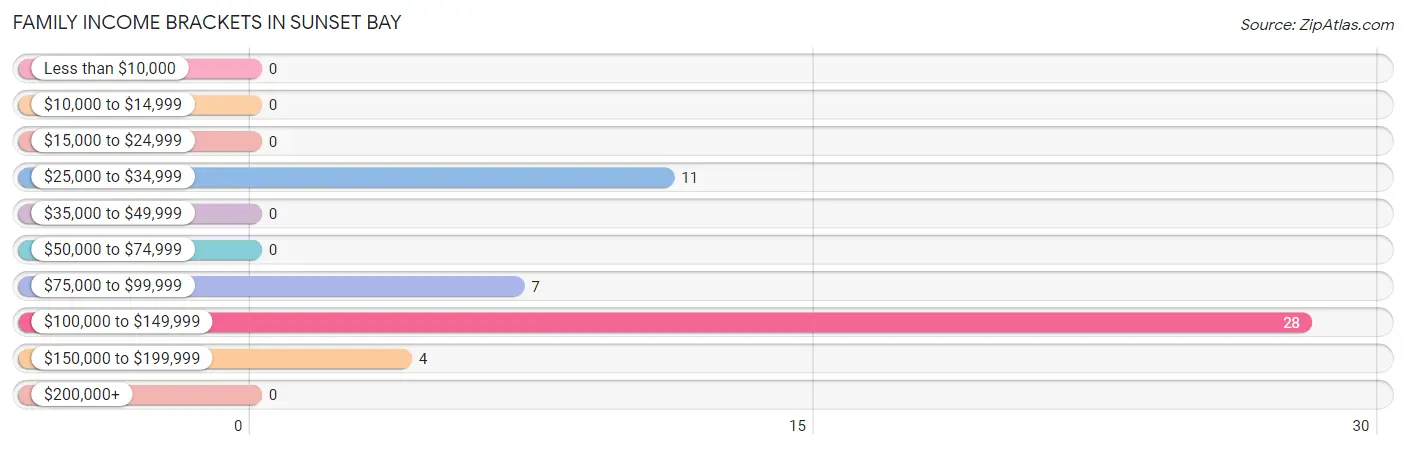
| Income Bracket | # Families | % Families |
| Less than $10,000 | 0 | 0.0% |
| $10,000 to $14,999 | 0 | 0.0% |
| $15,000 to $24,999 | 0 | 0.0% |
| $25,000 to $34,999 | 11 | 22.0% |
| $35,000 to $49,999 | 0 | 0.0% |
| $50,000 to $74,999 | 0 | 0.0% |
| $75,000 to $99,999 | 7 | 14.0% |
| $100,000 to $149,999 | 28 | 56.0% |
| $150,000 to $199,999 | 4 | 8.0% |
| $200,000+ | 0 | 0.0% |
Family Income by Famaliy Size in Sunset Bay
2-person families (28 | 56.0%) account for the highest median family income in Sunset Bay with $132,188 per family, while 2-person families (28 | 56.0%) have the highest median income of $66,094 per family member.
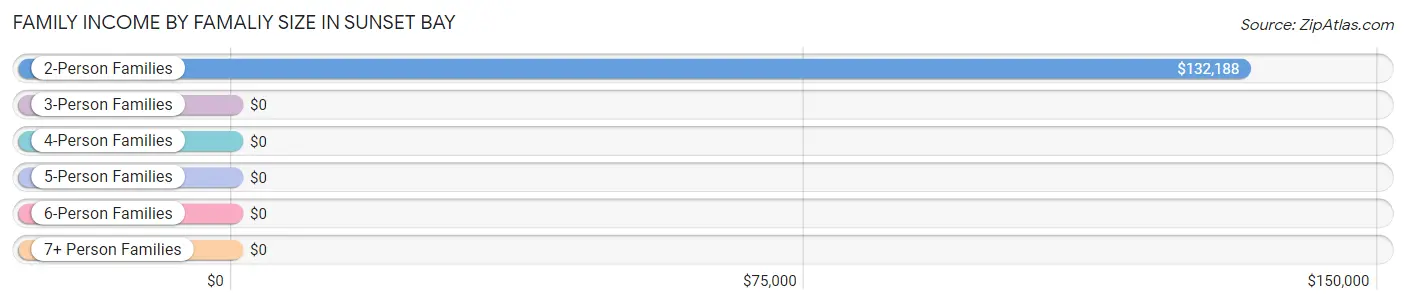
| Income Bracket | # Families | Median Income |
| 2-Person Families | 28 (56.0%) | $132,188 |
| 3-Person Families | 11 (22.0%) | $0 |
| 4-Person Families | 0 (0.0%) | $0 |
| 5-Person Families | 0 (0.0%) | $0 |
| 6-Person Families | 11 (22.0%) | $0 |
| 7+ Person Families | 0 (0.0%) | $0 |
| Total | 50 (100.0%) | $132,188 |
Family Income by Number of Earners in Sunset Bay
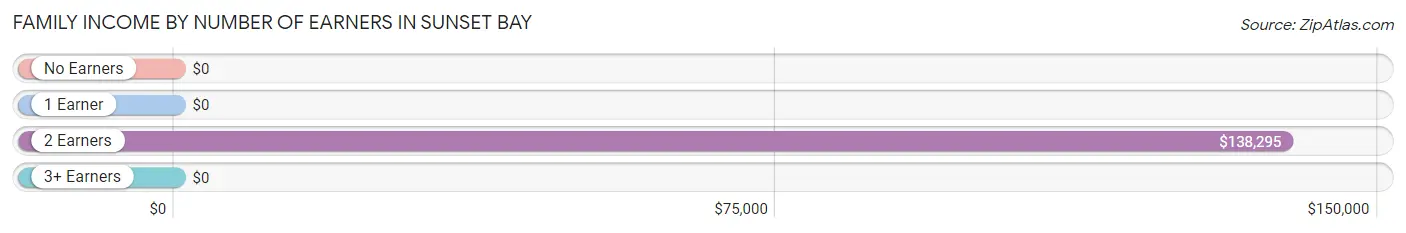
| Number of Earners | # Families | Median Income |
| No Earners | 0 (0.0%) | $0 |
| 1 Earner | 27 (54.0%) | $0 |
| 2 Earners | 23 (46.0%) | $138,295 |
| 3+ Earners | 0 (0.0%) | $0 |
| Total | 50 (100.0%) | $132,188 |
Household Income in Sunset Bay
Household Income Brackets in Sunset Bay
With 32 households falling in the category, the $35,000 to $49,999 income range is the most frequent in Sunset Bay, accounting for 30.8% of all households.
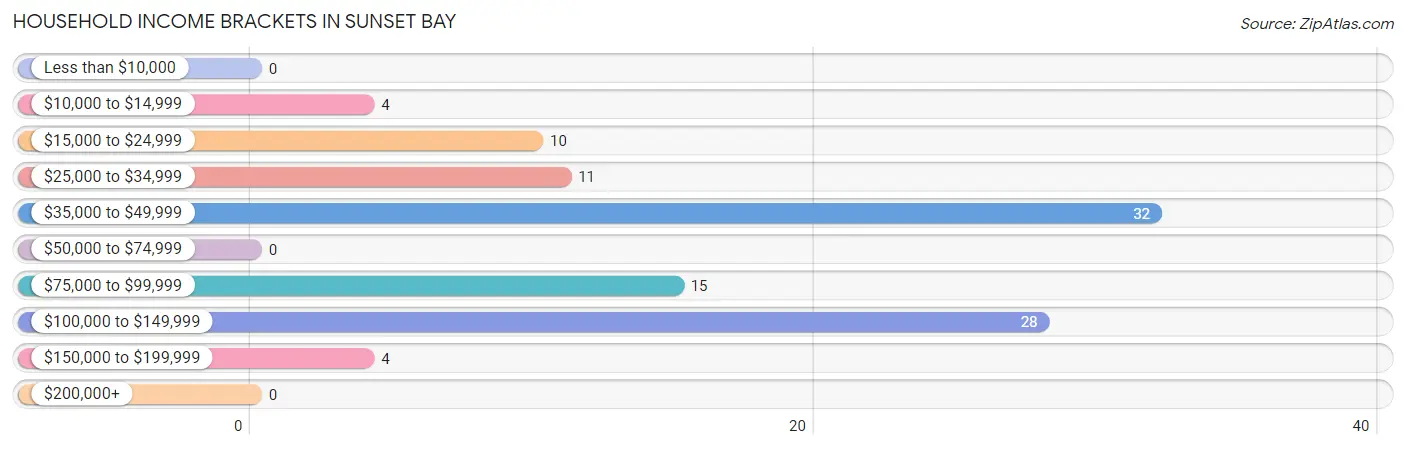
| Income Bracket | # Households | % Households |
| Less than $10,000 | 0 | 0.0% |
| $10,000 to $14,999 | 4 | 3.8% |
| $15,000 to $24,999 | 10 | 9.6% |
| $25,000 to $34,999 | 11 | 10.6% |
| $35,000 to $49,999 | 32 | 30.8% |
| $50,000 to $74,999 | 0 | 0.0% |
| $75,000 to $99,999 | 15 | 14.4% |
| $100,000 to $149,999 | 28 | 26.9% |
| $150,000 to $199,999 | 4 | 3.8% |
| $200,000+ | 0 | 0.0% |
Household Income by Householder Age in Sunset Bay
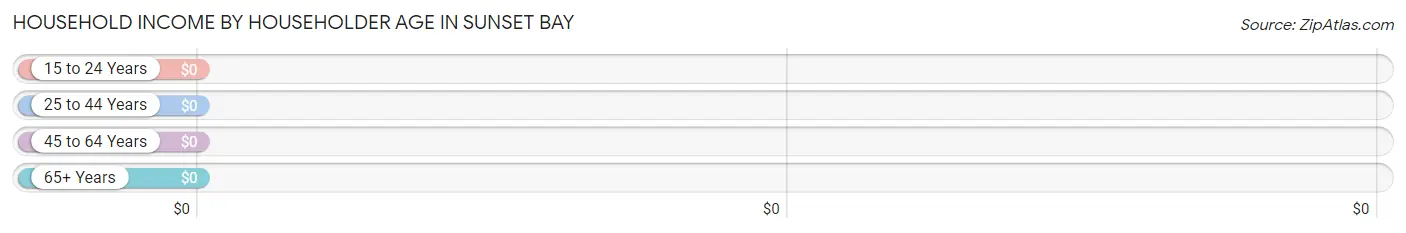
| Income Bracket | # Households | Median Income |
| 15 to 24 Years | 0 (0.0%) | $0 |
| 25 to 44 Years | 8 (7.7%) | $0 |
| 45 to 64 Years | 69 (66.3%) | $0 |
| 65+ Years | 27 (26.0%) | $0 |
| Total | 104 (100.0%) | $0 |
Poverty in Sunset Bay
Income Below Poverty by Sex and Age in Sunset Bay
With 42.2% poverty level for males and 10.7% for females among the residents of Sunset Bay, 6 to 11 year old males and 35 to 44 year old females are the most vulnerable to poverty, with 10 males (100.0%) and 11 females (100.0%) in their respective age groups living below the poverty level.
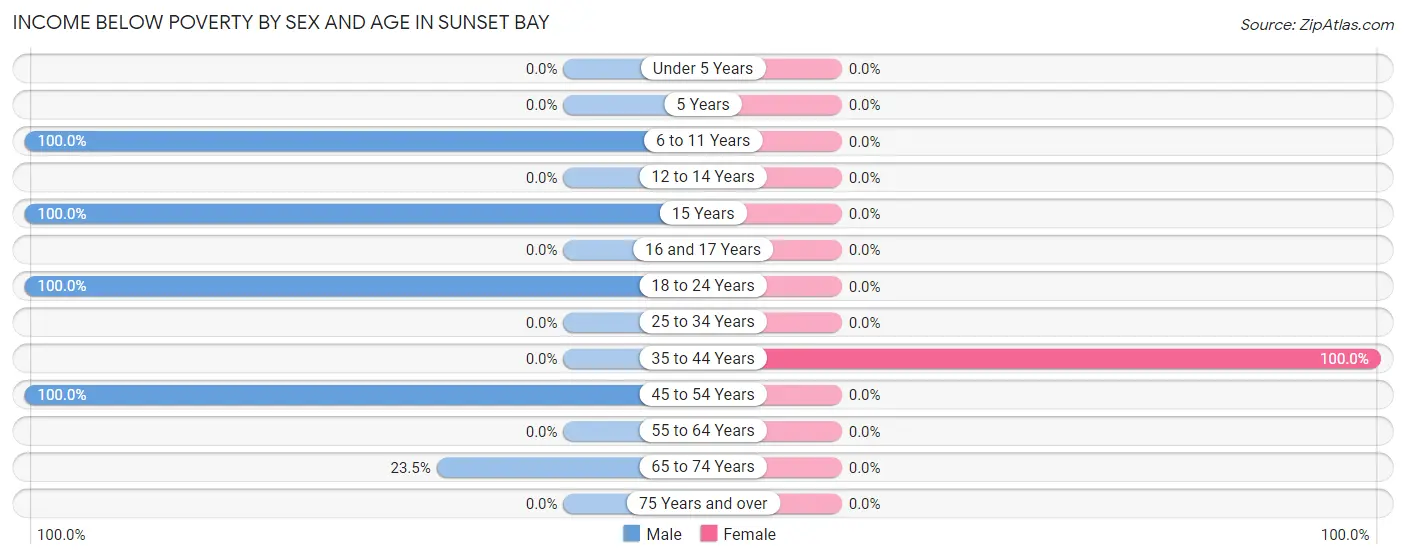
| Age Bracket | Male | Female |
| Under 5 Years | 0 (0.0%) | 0 (0.0%) |
| 5 Years | 0 (0.0%) | 0 (0.0%) |
| 6 to 11 Years | 10 (100.0%) | 0 (0.0%) |
| 12 to 14 Years | 0 (0.0%) | 0 (0.0%) |
| 15 Years | 10 (100.0%) | 0 (0.0%) |
| 16 and 17 Years | 0 (0.0%) | 0 (0.0%) |
| 18 to 24 Years | 10 (100.0%) | 0 (0.0%) |
| 25 to 34 Years | 0 (0.0%) | 0 (0.0%) |
| 35 to 44 Years | 0 (0.0%) | 11 (100.0%) |
| 45 to 54 Years | 23 (100.0%) | 0 (0.0%) |
| 55 to 64 Years | 0 (0.0%) | 0 (0.0%) |
| 65 to 74 Years | 4 (23.5%) | 0 (0.0%) |
| 75 Years and over | 0 (0.0%) | 0 (0.0%) |
| Total | 57 (42.2%) | 11 (10.7%) |
Income Above Poverty by Sex and Age in Sunset Bay
According to the poverty statistics in Sunset Bay, males aged 25 to 34 years and females aged 12 to 14 years are the age groups that are most secure financially, with 100.0% of males and 100.0% of females in these age groups living above the poverty line.
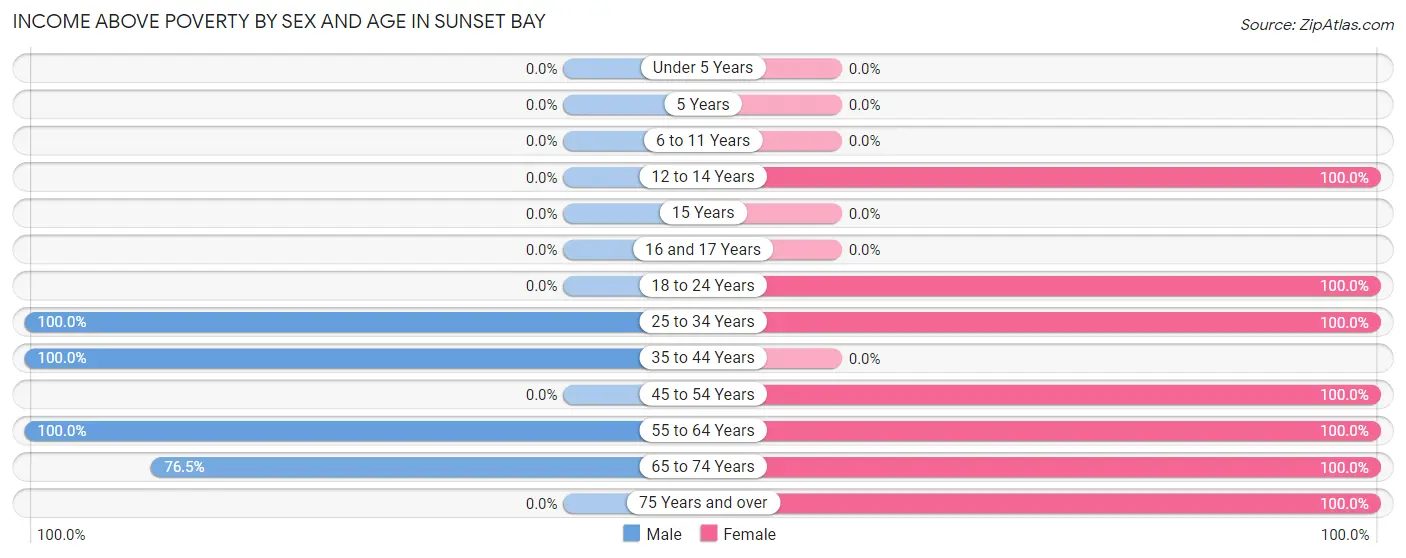
| Age Bracket | Male | Female |
| Under 5 Years | 0 (0.0%) | 0 (0.0%) |
| 5 Years | 0 (0.0%) | 0 (0.0%) |
| 6 to 11 Years | 0 (0.0%) | 0 (0.0%) |
| 12 to 14 Years | 0 (0.0%) | 11 (100.0%) |
| 15 Years | 0 (0.0%) | 0 (0.0%) |
| 16 and 17 Years | 0 (0.0%) | 0 (0.0%) |
| 18 to 24 Years | 0 (0.0%) | 8 (100.0%) |
| 25 to 34 Years | 8 (100.0%) | 11 (100.0%) |
| 35 to 44 Years | 7 (100.0%) | 0 (0.0%) |
| 45 to 54 Years | 0 (0.0%) | 10 (100.0%) |
| 55 to 64 Years | 50 (100.0%) | 26 (100.0%) |
| 65 to 74 Years | 13 (76.5%) | 16 (100.0%) |
| 75 Years and over | 0 (0.0%) | 10 (100.0%) |
| Total | 78 (57.8%) | 92 (89.3%) |
Income Below Poverty Among Married-Couple Families in Sunset Bay
The poverty statistics for married-couple families in Sunset Bay show that 22.0% or 11 of the total 50 families live below the poverty line. Families with 1 or 2 children have the highest poverty rate of 50.0%, comprising of 11 families. On the other hand, families with no children have the lowest poverty rate of 0.0%, which includes 0 families.
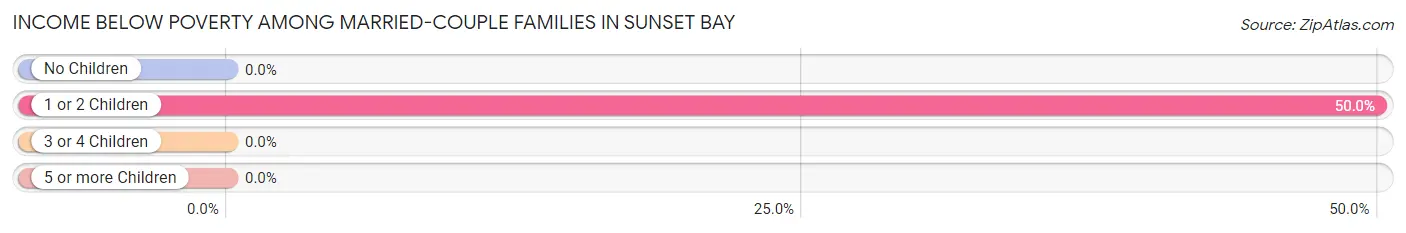
| Children | Above Poverty | Below Poverty |
| No Children | 28 (100.0%) | 0 (0.0%) |
| 1 or 2 Children | 11 (50.0%) | 11 (50.0%) |
| 3 or 4 Children | 0 (0.0%) | 0 (0.0%) |
| 5 or more Children | 0 (0.0%) | 0 (0.0%) |
| Total | 39 (78.0%) | 11 (22.0%) |
Income Below Poverty Among Single-Parent Households in Sunset Bay
| Children | Single Father | Single Mother |
| No Children | 0 (0.0%) | 0 (0.0%) |
| 1 or 2 Children | 0 (0.0%) | 0 (0.0%) |
| 3 or 4 Children | 0 (0.0%) | 0 (0.0%) |
| 5 or more Children | 0 (0.0%) | 0 (0.0%) |
| Total | 0 (0.0%) | 0 (0.0%) |
Income Below Poverty Among Married-Couple vs Single-Parent Households in Sunset Bay
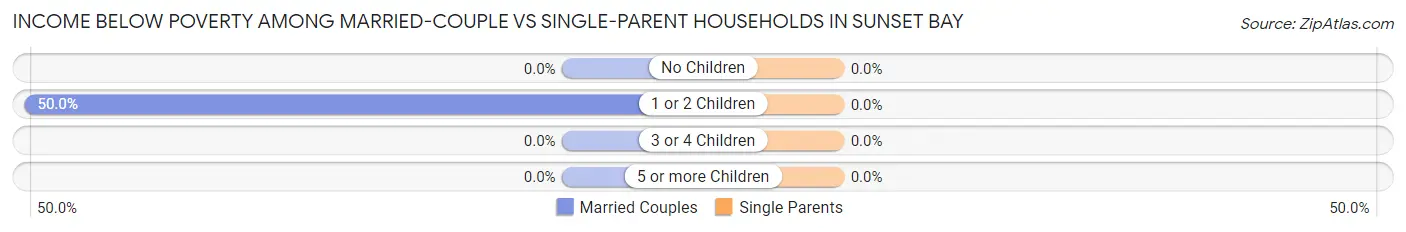
| Children | Married-Couple Families | Single-Parent Households |
| No Children | 0 (0.0%) | 0 (0.0%) |
| 1 or 2 Children | 11 (50.0%) | 0 (0.0%) |
| 3 or 4 Children | 0 (0.0%) | 0 (0.0%) |
| 5 or more Children | 0 (0.0%) | 0 (0.0%) |
| Total | 11 (22.0%) | 0 (0.0%) |
Race in Sunset Bay
The most populous races in Sunset Bay are White / Caucasian (327 | 89.3%), Hispanic or Latino (28 | 7.6%), and Black / African American (16 | 4.4%).
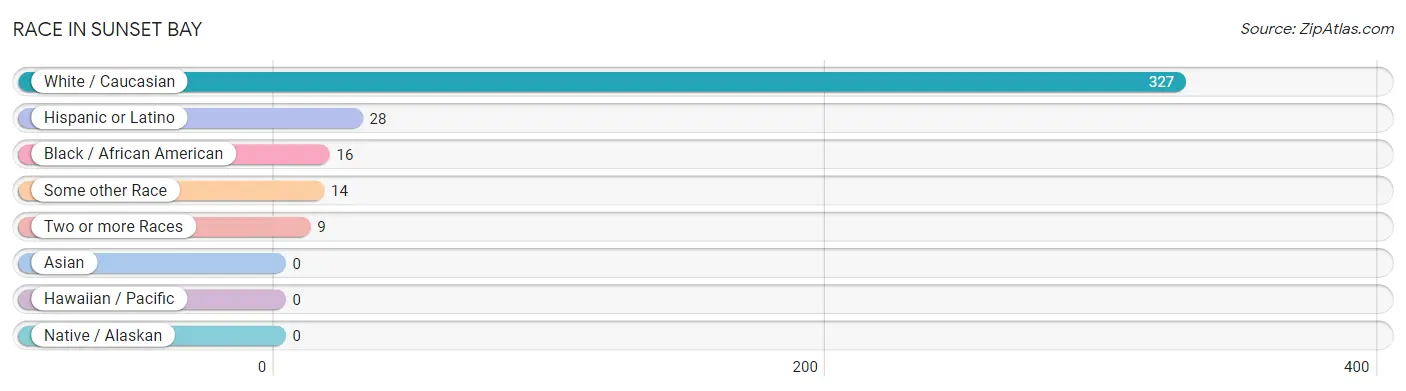
| Race | # Population | % Population |
| Asian | 0 | 0.0% |
| Black / African American | 16 | 4.4% |
| Hawaiian / Pacific | 0 | 0.0% |
| Hispanic or Latino | 28 | 7.6% |
| Native / Alaskan | 0 | 0.0% |
| White / Caucasian | 327 | 89.3% |
| Two or more Races | 9 | 2.5% |
| Some other Race | 14 | 3.8% |
| Total | 366 | 100.0% |
Ancestry in Sunset Bay
The most populous ancestries reported in Sunset Bay are German (69 | 18.9%), Dutch (53 | 14.5%), English (50 | 13.7%), Irish (40 | 10.9%), and Slovak (22 | 6.0%), together accounting for 63.9% of all Sunset Bay residents.
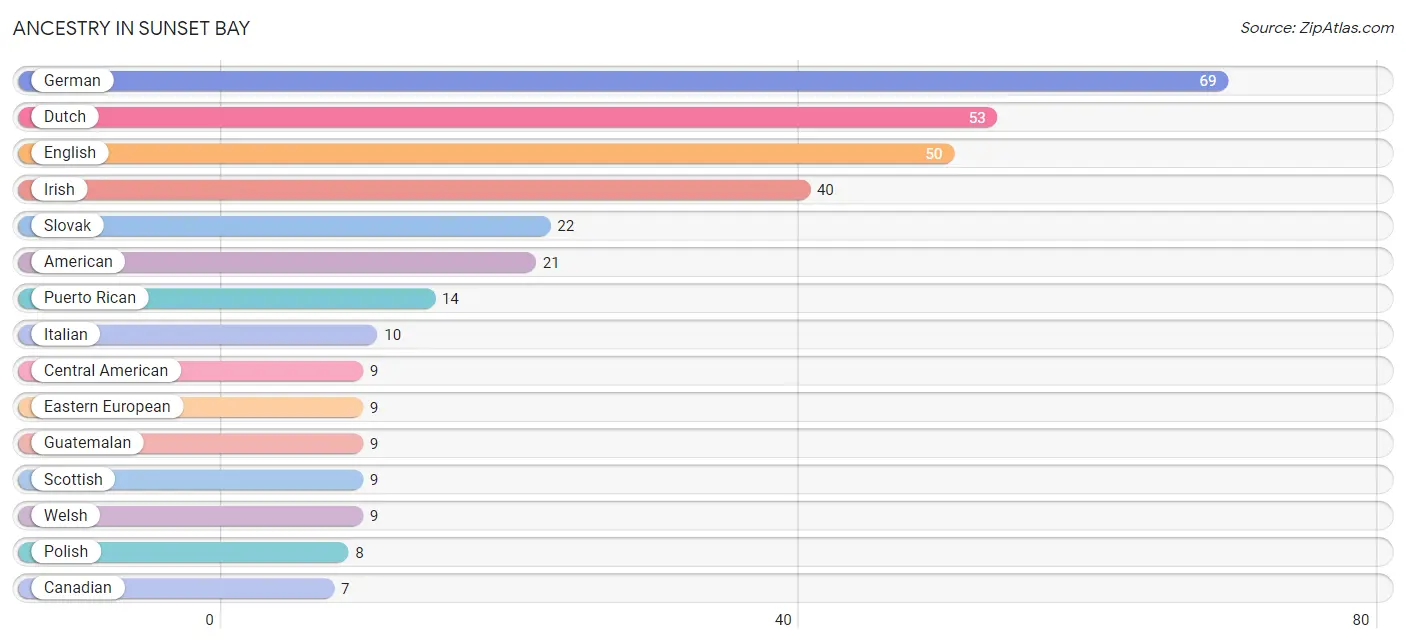
| Ancestry | # Population | % Population |
| American | 21 | 5.7% |
| Canadian | 7 | 1.9% |
| Central American | 9 | 2.5% |
| Dutch | 53 | 14.5% |
| Eastern European | 9 | 2.5% |
| English | 50 | 13.7% |
| German | 69 | 18.9% |
| Guatemalan | 9 | 2.5% |
| Irish | 40 | 10.9% |
| Italian | 10 | 2.7% |
| Polish | 8 | 2.2% |
| Puerto Rican | 14 | 3.8% |
| Scottish | 9 | 2.5% |
| Slovak | 22 | 6.0% |
| Swedish | 4 | 1.1% |
| Swiss | 5 | 1.4% |
| Trinidadian and Tobagonian | 2 | 0.5% |
| Welsh | 9 | 2.5% | View All 18 Rows |
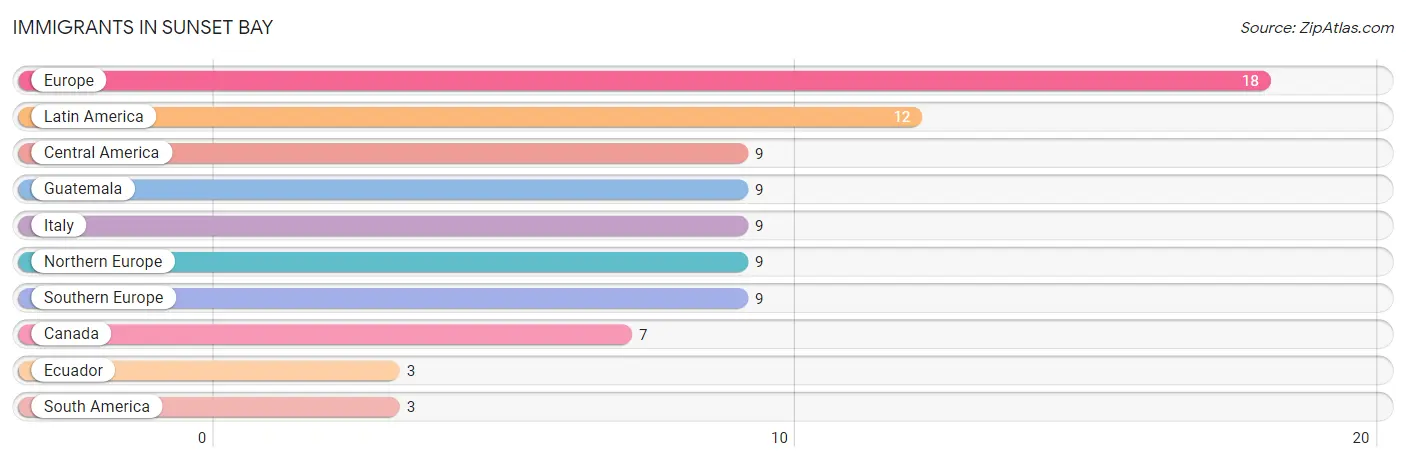
Immigrants in Sunset Bay
The most numerous immigrant groups reported in Sunset Bay came from Europe (18 | 4.9%), Latin America (12 | 3.3%), Central America (9 | 2.5%), Guatemala (9 | 2.5%), and Italy (9 | 2.5%), together accounting for 15.6% of all Sunset Bay residents.
| Immigration Origin | # Population | % Population |
| Canada | 7 | 1.9% |
| Central America | 9 | 2.5% |
| Ecuador | 3 | 0.8% |
| Europe | 18 | 4.9% |
| Guatemala | 9 | 2.5% |
| Italy | 9 | 2.5% |
| Latin America | 12 | 3.3% |
| Northern Europe | 9 | 2.5% |
| South America | 3 | 0.8% |
| Southern Europe | 9 | 2.5% | View All 10 Rows |
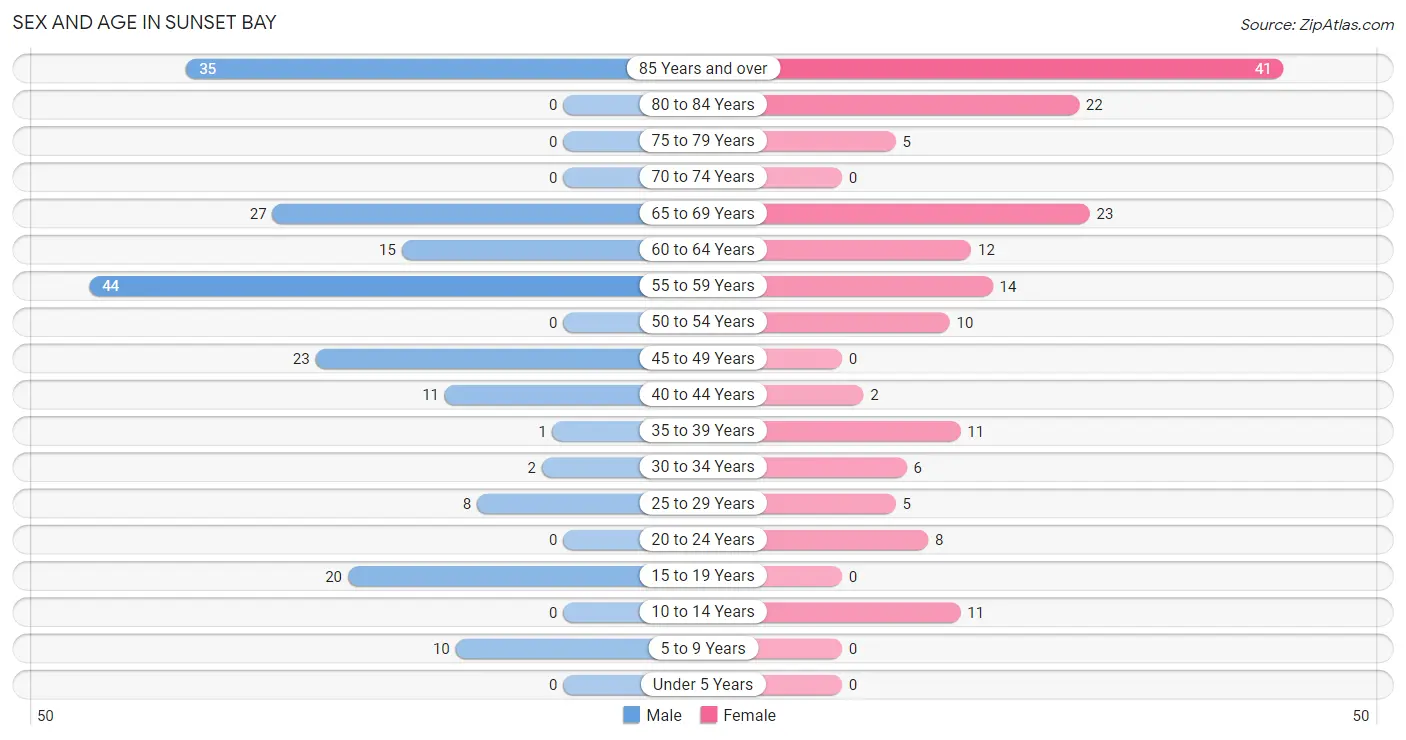
Sex and Age in Sunset Bay
Sex and Age in Sunset Bay
The most populous age groups in Sunset Bay are 55 to 59 Years (44 | 22.5%) for men and 85 Years and over (41 | 24.1%) for women.
| Age Bracket | Male | Female |
| Under 5 Years | 0 (0.0%) | 0 (0.0%) |
| 5 to 9 Years | 10 (5.1%) | 0 (0.0%) |
| 10 to 14 Years | 0 (0.0%) | 11 (6.5%) |
| 15 to 19 Years | 20 (10.2%) | 0 (0.0%) |
| 20 to 24 Years | 0 (0.0%) | 8 (4.7%) |
| 25 to 29 Years | 8 (4.1%) | 5 (2.9%) |
| 30 to 34 Years | 2 (1.0%) | 6 (3.5%) |
| 35 to 39 Years | 1 (0.5%) | 11 (6.5%) |
| 40 to 44 Years | 11 (5.6%) | 2 (1.2%) |
| 45 to 49 Years | 23 (11.7%) | 0 (0.0%) |
| 50 to 54 Years | 0 (0.0%) | 10 (5.9%) |
| 55 to 59 Years | 44 (22.5%) | 14 (8.2%) |
| 60 to 64 Years | 15 (7.6%) | 12 (7.1%) |
| 65 to 69 Years | 27 (13.8%) | 23 (13.5%) |
| 70 to 74 Years | 0 (0.0%) | 0 (0.0%) |
| 75 to 79 Years | 0 (0.0%) | 5 (2.9%) |
| 80 to 84 Years | 0 (0.0%) | 22 (12.9%) |
| 85 Years and over | 35 (17.9%) | 41 (24.1%) |
| Total | 196 (100.0%) | 170 (100.0%) |
Families and Households in Sunset Bay
Median Family Size in Sunset Bay
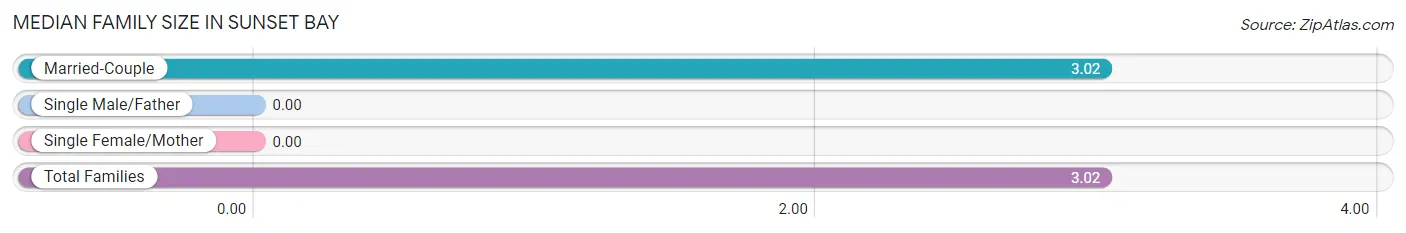
| Family Type | # Families | Family Size |
| Married-Couple | 50 (100.0%) | 3.02 |
| Single Male/Father | 0 (0.0%) | - |
| Single Female/Mother | 0 (0.0%) | - |
| Total Families | 50 (100.0%) | 3.02 |
Median Household Size in Sunset Bay
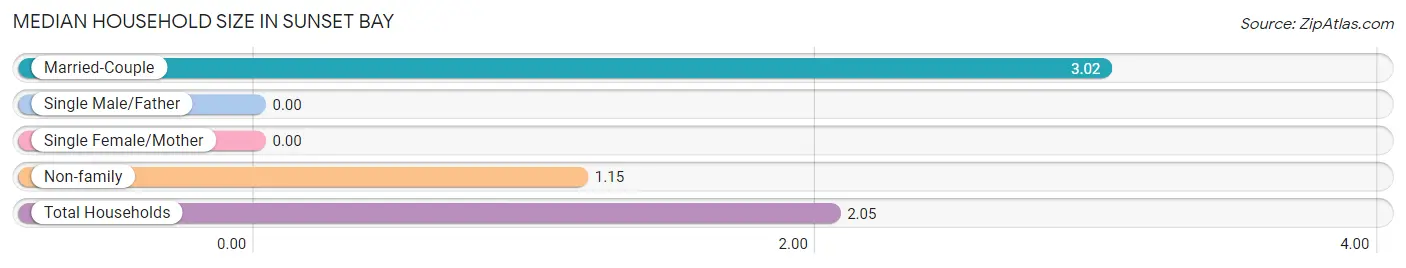
| Household Type | # Households | Household Size |
| Married-Couple | 50 (48.1%) | 3.02 |
| Single Male/Father | 0 (0.0%) | - |
| Single Female/Mother | 0 (0.0%) | - |
| Non-family | 54 (51.9%) | 1.15 |
| Total Households | 104 (100.0%) | 2.05 |
Household Size by Marriage Status in Sunset Bay
Out of a total of 104 households in Sunset Bay, 50 (48.1%) are family households, while 54 (51.9%) are nonfamily households. The most numerous type of family households are 2-person households, comprising 28, and the most common type of nonfamily households are 1-person households, comprising 46.
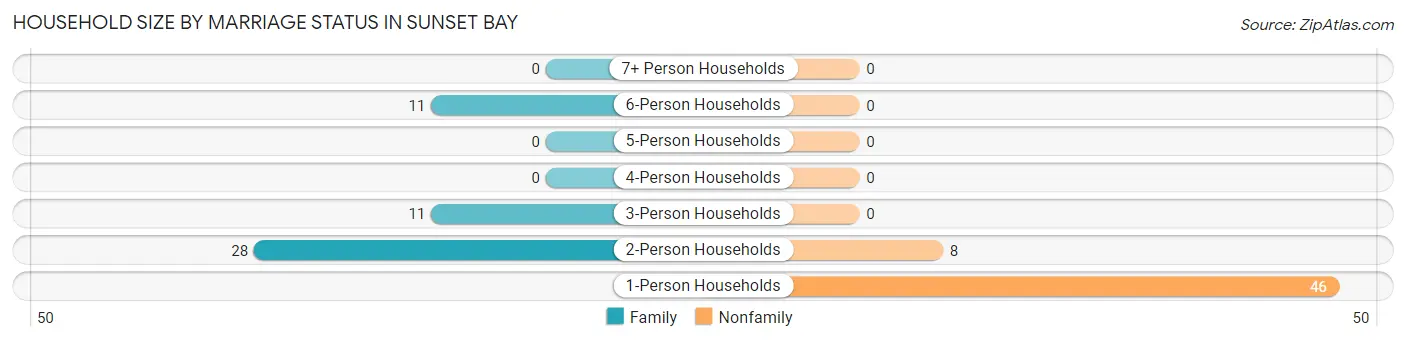
| Household Size | Family Households | Nonfamily Households |
| 1-Person Households | - | 46 (44.2%) |
| 2-Person Households | 28 (26.9%) | 8 (7.7%) |
| 3-Person Households | 11 (10.6%) | 0 (0.0%) |
| 4-Person Households | 0 (0.0%) | 0 (0.0%) |
| 5-Person Households | 0 (0.0%) | 0 (0.0%) |
| 6-Person Households | 11 (10.6%) | 0 (0.0%) |
| 7+ Person Households | 0 (0.0%) | 0 (0.0%) |
| Total | 50 (48.1%) | 54 (51.9%) |
Female Fertility in Sunset Bay
Fertility by Age in Sunset Bay
| Age Bracket | Women with Births | Births / 1,000 Women |
| 15 to 19 years | 0 (0.0%) | 0.0 |
| 20 to 34 years | 0 (0.0%) | 0.0 |
| 35 to 50 years | 0 (0.0%) | 0.0 |
| Total | 0 (0.0%) | 0.0 |
Fertility by Age by Marriage Status in Sunset Bay
| Age Bracket | Married | Unmarried |
| 15 to 19 years | 0 (0.0%) | 0 (0.0%) |
| 20 to 34 years | 0 (0.0%) | 0 (0.0%) |
| 35 to 50 years | 0 (0.0%) | 0 (0.0%) |
| Total | 0 (0.0%) | 0 (0.0%) |
Fertility by Education in Sunset Bay
| Educational Attainment | Women with Births | Births / 1,000 Women |
| Less than High School | 0 (0.0%) | 0.0 |
| High School Diploma | 0 (0.0%) | 0.0 |
| College or Associate's Degree | 0 (0.0%) | 0.0 |
| Bachelor's Degree | 0 (0.0%) | 0.0 |
| Graduate Degree | 0 (0.0%) | 0.0 |
| Total | 0 (0.0%) | 0.0 |
Fertility by Education by Marriage Status in Sunset Bay
| Educational Attainment | Married | Unmarried |
| Less than High School | 0 (0.0%) | 0 (0.0%) |
| High School Diploma | 0 (0.0%) | 0 (0.0%) |
| College or Associate's Degree | 0 (0.0%) | 0 (0.0%) |
| Bachelor's Degree | 0 (0.0%) | 0 (0.0%) |
| Graduate Degree | 0 (0.0%) | 0 (0.0%) |
| Total | 0 (0.0%) | 0 (0.0%) |
Employment Characteristics in Sunset Bay
Employment by Class of Employer in Sunset Bay
Among the 85 employed individuals in Sunset Bay, private company employees (59 | 69.4%), self-employed (incorporated) (18 | 21.2%), and not-for-profit organizations (4 | 4.7%) make up the most common classes of employment.
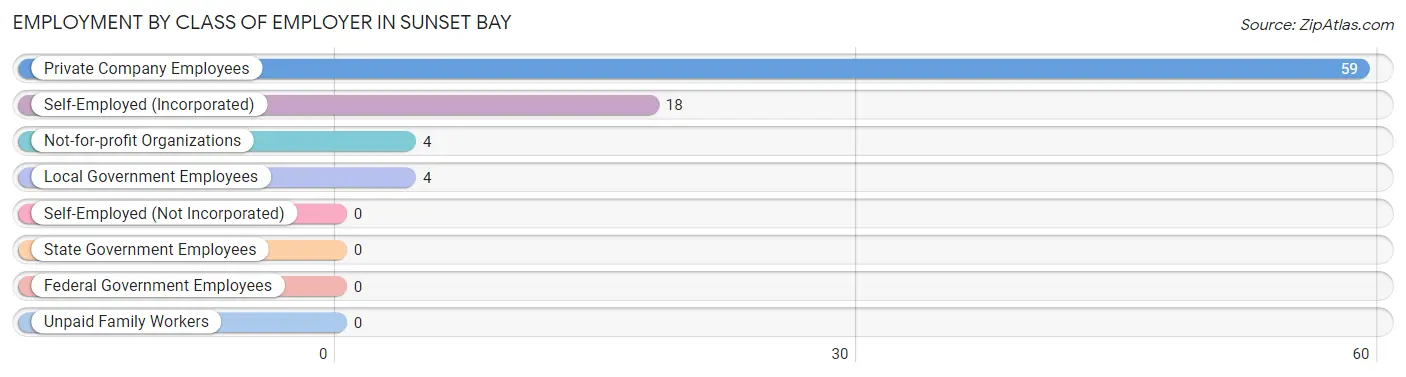
| Employer Class | # Employees | % Employees |
| Private Company Employees | 59 | 69.4% |
| Self-Employed (Incorporated) | 18 | 21.2% |
| Self-Employed (Not Incorporated) | 0 | 0.0% |
| Not-for-profit Organizations | 4 | 4.7% |
| Local Government Employees | 4 | 4.7% |
| State Government Employees | 0 | 0.0% |
| Federal Government Employees | 0 | 0.0% |
| Unpaid Family Workers | 0 | 0.0% |
| Total | 85 | 100.0% |
Employment Status by Age in Sunset Bay
According to the labor force statistics for Sunset Bay, out of the total population over 16 years of age (335), 29.0% or 97 individuals are in the labor force, with 12.4% or 12 of them unemployed. The age group with the highest labor force participation rate is 20 to 24 years, with 100.0% or 8 individuals in the labor force. Within the labor force, the 45 to 54 years age range has the highest percentage of unemployed individuals, with 52.2% or 12 of them being unemployed.
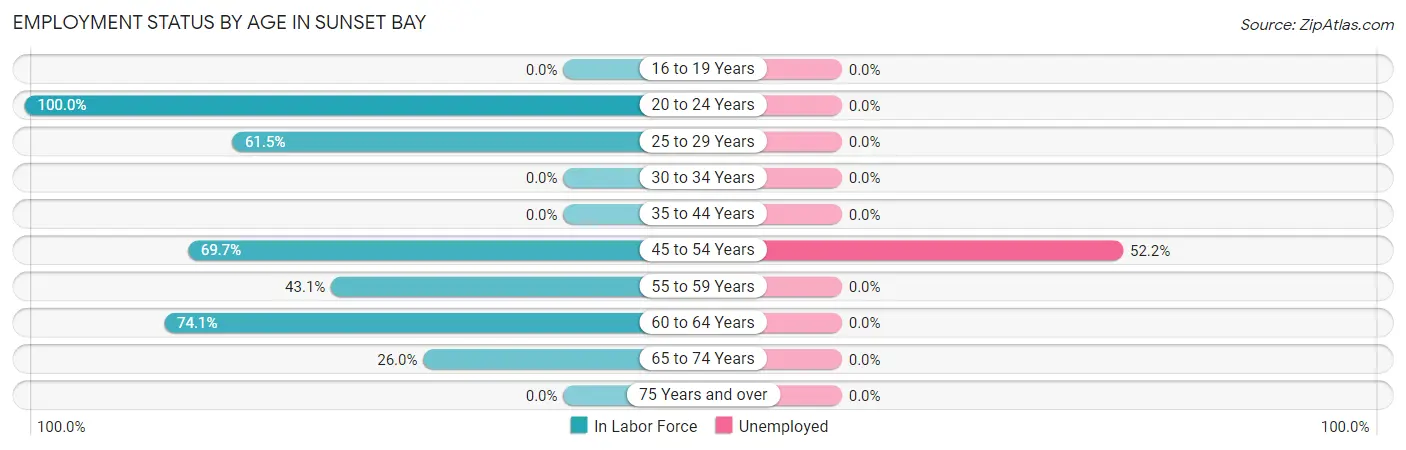
| Age Bracket | In Labor Force | Unemployed |
| 16 to 19 Years | 0 (0.0%) | 0 (0.0%) |
| 20 to 24 Years | 8 (100.0%) | 0 (0.0%) |
| 25 to 29 Years | 8 (61.5%) | 0 (0.0%) |
| 30 to 34 Years | 0 (0.0%) | 0 (0.0%) |
| 35 to 44 Years | 0 (0.0%) | 0 (0.0%) |
| 45 to 54 Years | 23 (69.7%) | 12 (52.2%) |
| 55 to 59 Years | 25 (43.1%) | 0 (0.0%) |
| 60 to 64 Years | 20 (74.1%) | 0 (0.0%) |
| 65 to 74 Years | 13 (26.0%) | 0 (0.0%) |
| 75 Years and over | 0 (0.0%) | 0 (0.0%) |
| Total | 97 (29.0%) | 12 (12.4%) |
Employment Status by Educational Attainment in Sunset Bay
According to labor force statistics for Sunset Bay, 46.3% of individuals (76) out of the total population between 25 and 64 years of age (164) are in the labor force, with 15.8% or 12 of them being unemployed. The group with the highest labor force participation rate are those with the educational attainment of bachelor's degree or higher, with 100.0% or 19 individuals in the labor force. Within the labor force, individuals with less than high school education have the highest percentage of unemployment, with 100.0% or 12 of them being unemployed.
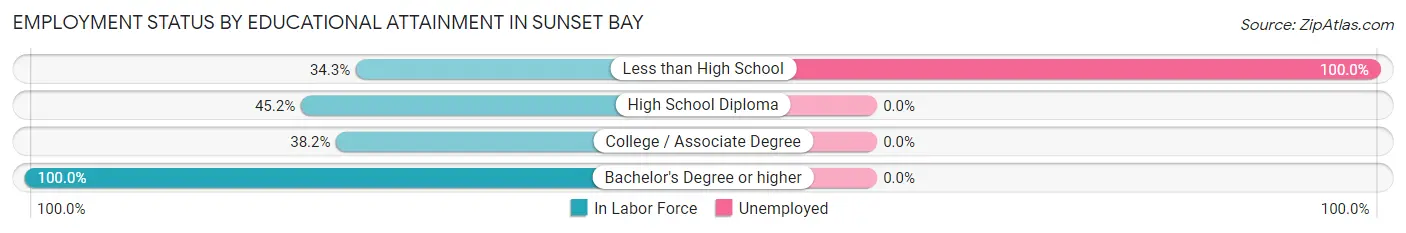
| Educational Attainment | In Labor Force | Unemployed |
| Less than High School | 12 (34.3%) | 35 (100.0%) |
| High School Diploma | 19 (45.2%) | 0 (0.0%) |
| College / Associate Degree | 26 (38.2%) | 0 (0.0%) |
| Bachelor's Degree or higher | 19 (100.0%) | 0 (0.0%) |
| Total | 76 (46.3%) | 26 (15.8%) |
Employment Occupations by Sex in Sunset Bay
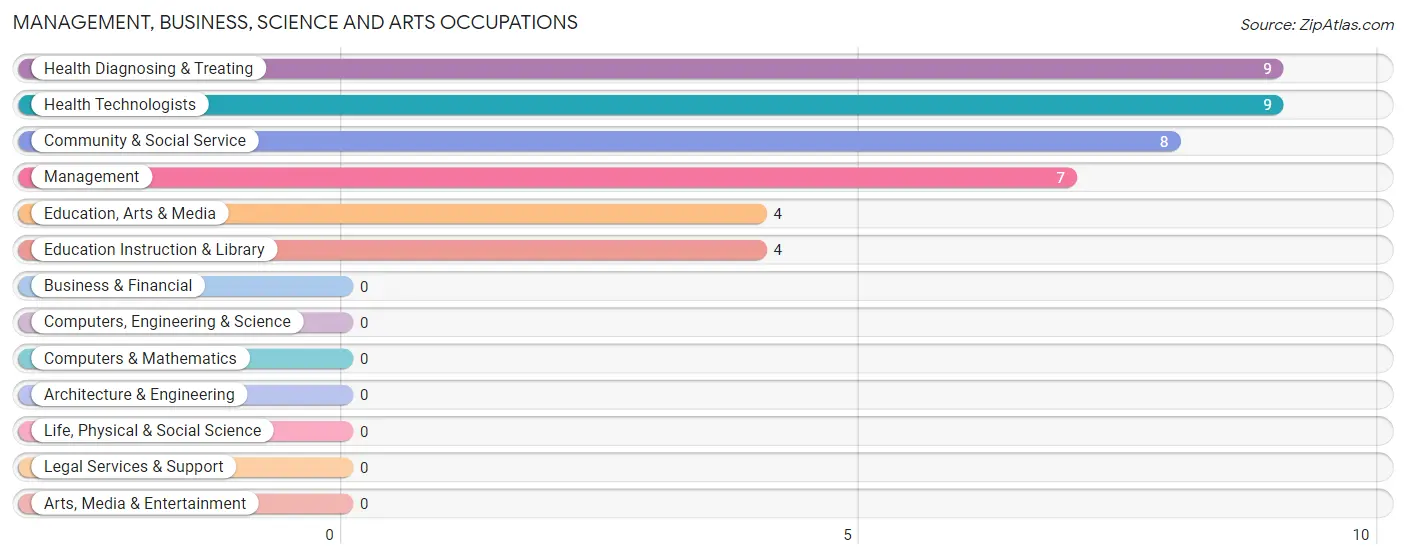
Management, Business, Science and Arts Occupations
The most common Management, Business, Science and Arts occupations in Sunset Bay are Health Diagnosing & Treating (9 | 10.6%), Health Technologists (9 | 10.6%), Community & Social Service (8 | 9.4%), Management (7 | 8.2%), and Education, Arts & Media (4 | 4.7%).
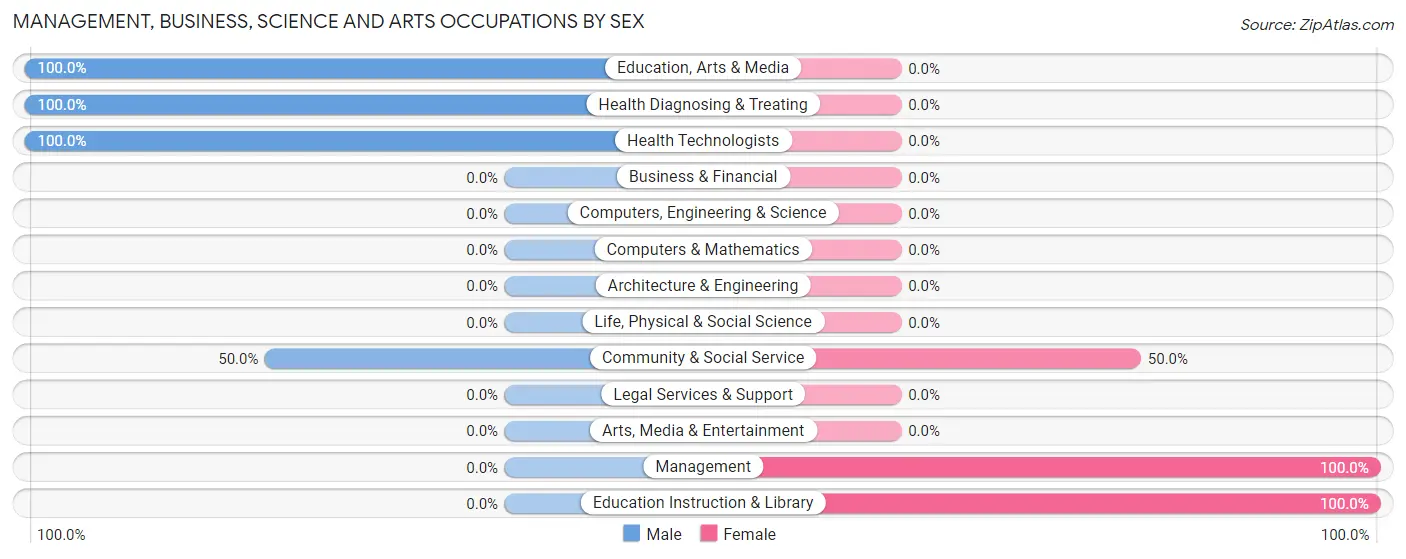
Management, Business, Science and Arts Occupations by Sex
Within the Management, Business, Science and Arts occupations in Sunset Bay, the most male-oriented occupations are Education, Arts & Media (100.0%), Health Diagnosing & Treating (100.0%), and Health Technologists (100.0%), while the most female-oriented occupations are Management (100.0%), Education Instruction & Library (100.0%), and Community & Social Service (50.0%).
| Occupation | Male | Female |
| Management | 0 (0.0%) | 7 (100.0%) |
| Business & Financial | 0 (0.0%) | 0 (0.0%) |
| Computers, Engineering & Science | 0 (0.0%) | 0 (0.0%) |
| Computers & Mathematics | 0 (0.0%) | 0 (0.0%) |
| Architecture & Engineering | 0 (0.0%) | 0 (0.0%) |
| Life, Physical & Social Science | 0 (0.0%) | 0 (0.0%) |
| Community & Social Service | 4 (50.0%) | 4 (50.0%) |
| Education, Arts & Media | 4 (100.0%) | 0 (0.0%) |
| Legal Services & Support | 0 (0.0%) | 0 (0.0%) |
| Education Instruction & Library | 0 (0.0%) | 4 (100.0%) |
| Arts, Media & Entertainment | 0 (0.0%) | 0 (0.0%) |
| Health Diagnosing & Treating | 9 (100.0%) | 0 (0.0%) |
| Health Technologists | 9 (100.0%) | 0 (0.0%) |
| Total (Category) | 13 (54.2%) | 11 (45.8%) |
| Total (Overall) | 51 (60.0%) | 34 (40.0%) |
Services Occupations
Services Occupations by Sex
| Occupation | Male | Female |
| Healthcare Support | 0 (0.0%) | 0 (0.0%) |
| Security & Protection | 0 (0.0%) | 0 (0.0%) |
| Firefighting & Prevention | 0 (0.0%) | 0 (0.0%) |
| Law Enforcement | 0 (0.0%) | 0 (0.0%) |
| Food Preparation & Serving | 0 (0.0%) | 0 (0.0%) |
| Cleaning & Maintenance | 0 (0.0%) | 0 (0.0%) |
| Personal Care & Service | 0 (0.0%) | 0 (0.0%) |
| Total (Category) | 0 (0.0%) | 0 (0.0%) |
| Total (Overall) | 51 (60.0%) | 34 (40.0%) |
Sales and Office Occupations
The most common Sales and Office occupations in Sunset Bay are Sales & Related (26 | 30.6%), and Office & Administration (8 | 9.4%).
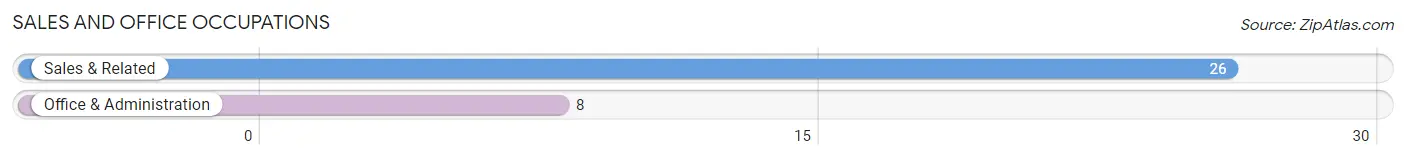
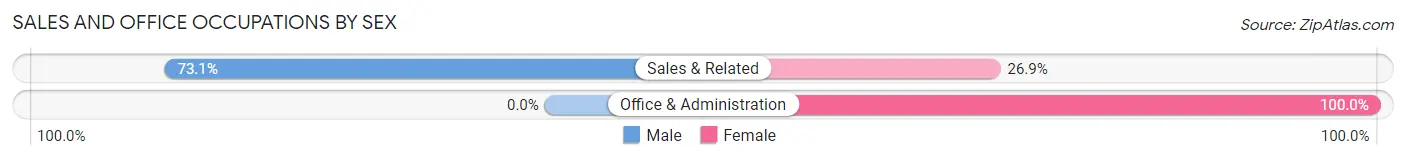
Sales and Office Occupations by Sex
| Occupation | Male | Female |
| Sales & Related | 19 (73.1%) | 7 (26.9%) |
| Office & Administration | 0 (0.0%) | 8 (100.0%) |
| Total (Category) | 19 (55.9%) | 15 (44.1%) |
| Total (Overall) | 51 (60.0%) | 34 (40.0%) |
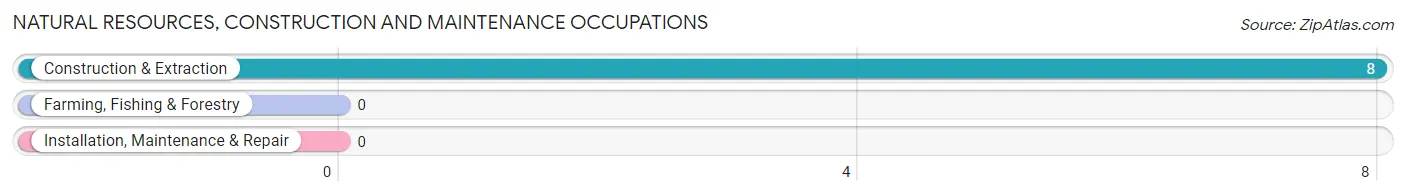
Natural Resources, Construction and Maintenance Occupations
The most common Natural Resources, Construction and Maintenance occupations in Sunset Bay are , and Construction & Extraction (8 | 9.4%).
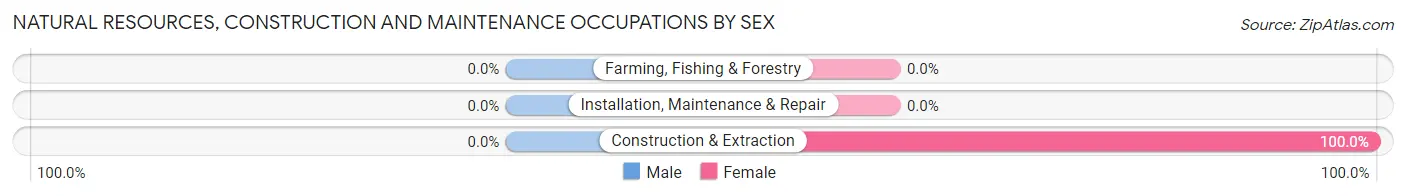
Natural Resources, Construction and Maintenance Occupations by Sex
| Occupation | Male | Female |
| Farming, Fishing & Forestry | 0 (0.0%) | 0 (0.0%) |
| Construction & Extraction | 0 (0.0%) | 8 (100.0%) |
| Installation, Maintenance & Repair | 0 (0.0%) | 0 (0.0%) |
| Total (Category) | 0 (0.0%) | 8 (100.0%) |
| Total (Overall) | 51 (60.0%) | 34 (40.0%) |
Production, Transportation and Moving Occupations
The most common Production, Transportation and Moving occupations in Sunset Bay are , and Transportation (19 | 22.4%).
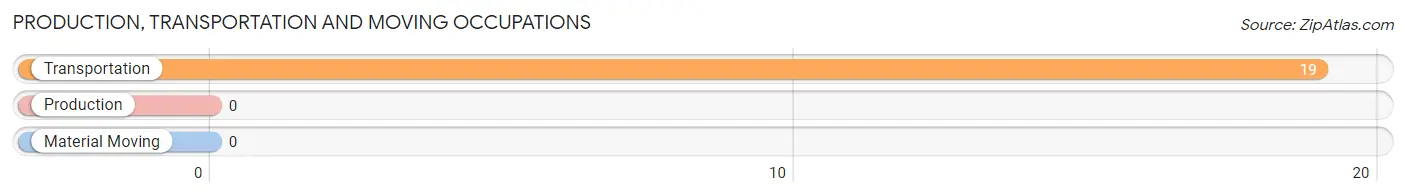
Production, Transportation and Moving Occupations by Sex
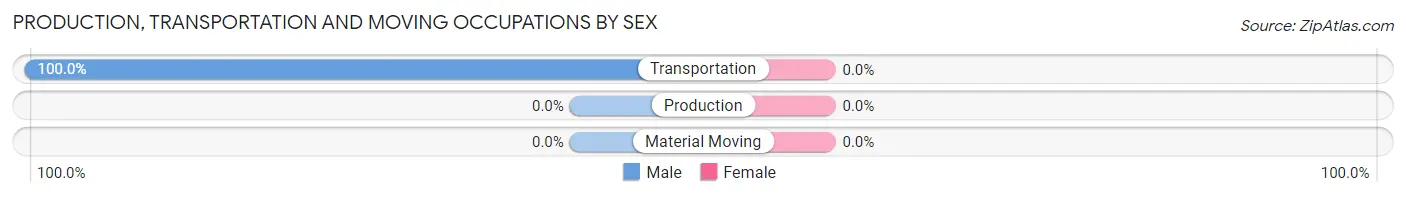
| Occupation | Male | Female |
| Production | 0 (0.0%) | 0 (0.0%) |
| Transportation | 19 (100.0%) | 0 (0.0%) |
| Material Moving | 0 (0.0%) | 0 (0.0%) |
| Total (Category) | 19 (100.0%) | 0 (0.0%) |
| Total (Overall) | 51 (60.0%) | 34 (40.0%) |
Employment Industries by Sex in Sunset Bay
Employment Industries in Sunset Bay
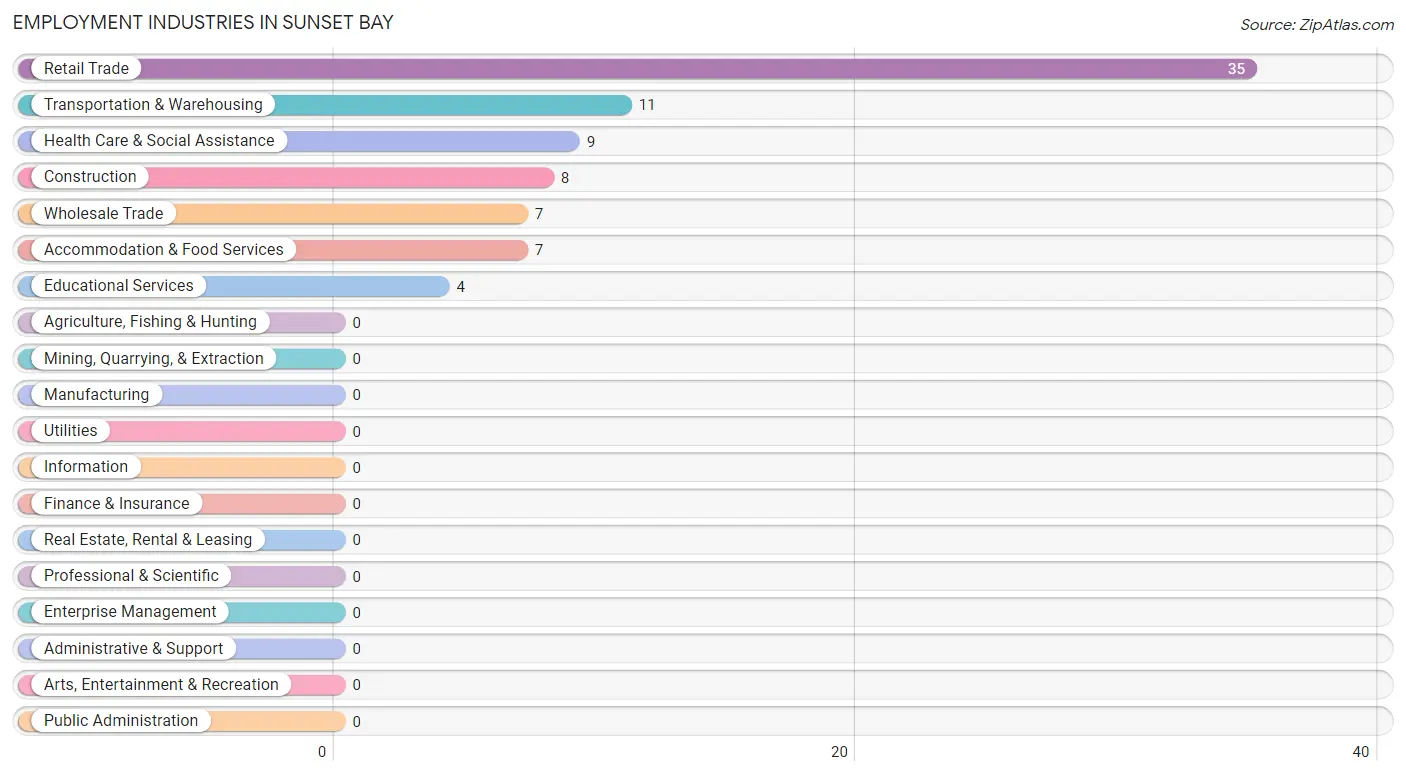
The major employment industries in Sunset Bay include Retail Trade (35 | 41.2%), Transportation & Warehousing (11 | 12.9%), Health Care & Social Assistance (9 | 10.6%), Construction (8 | 9.4%), and Wholesale Trade (7 | 8.2%).
Employment Industries by Sex in Sunset Bay
The Sunset Bay industries that see more men than women are Transportation & Warehousing (100.0%), Health Care & Social Assistance (100.0%), and Retail Trade (77.1%), whereas the industries that tend to have a higher number of women are Construction (100.0%), Wholesale Trade (100.0%), and Educational Services (100.0%).
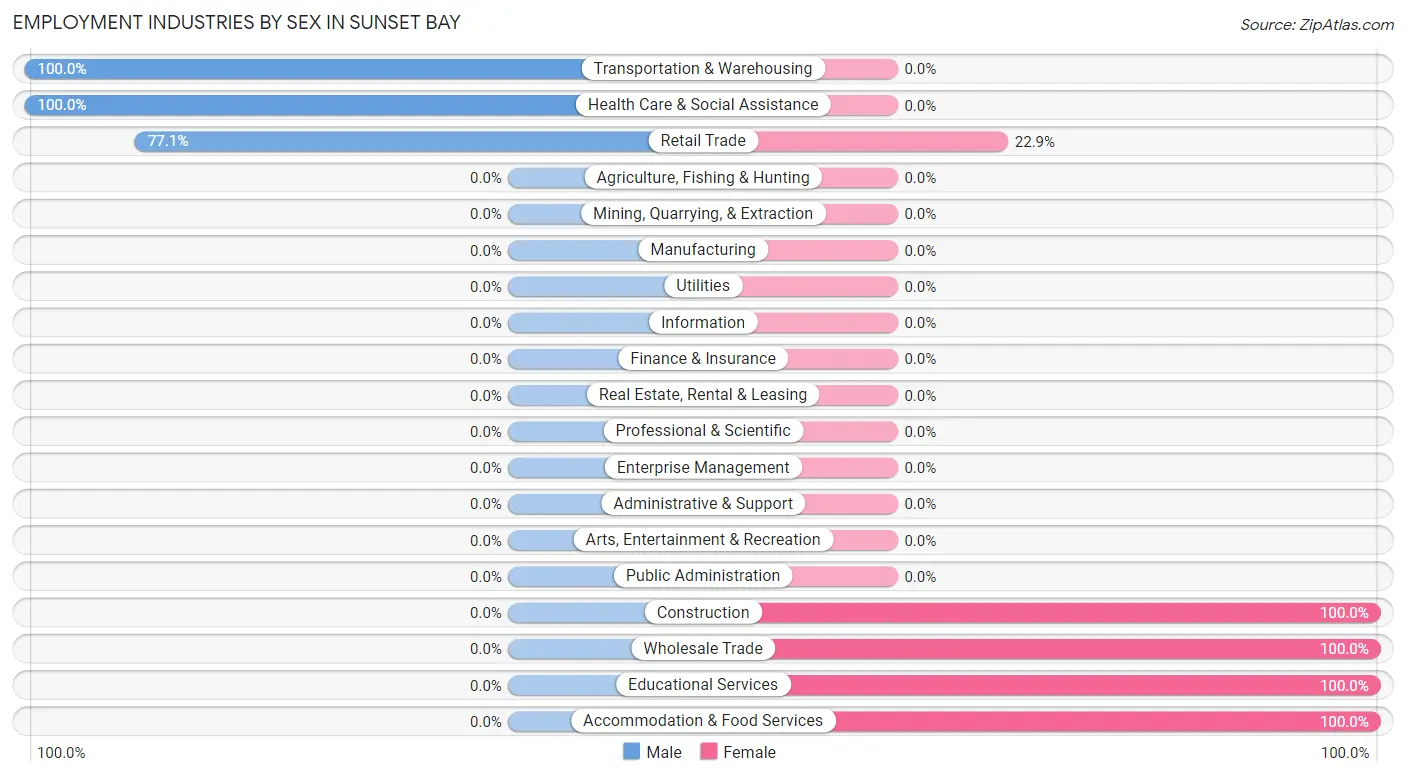
| Industry | Male | Female |
| Agriculture, Fishing & Hunting | 0 (0.0%) | 0 (0.0%) |
| Mining, Quarrying, & Extraction | 0 (0.0%) | 0 (0.0%) |
| Construction | 0 (0.0%) | 8 (100.0%) |
| Manufacturing | 0 (0.0%) | 0 (0.0%) |
| Wholesale Trade | 0 (0.0%) | 7 (100.0%) |
| Retail Trade | 27 (77.1%) | 8 (22.9%) |
| Transportation & Warehousing | 11 (100.0%) | 0 (0.0%) |
| Utilities | 0 (0.0%) | 0 (0.0%) |
| Information | 0 (0.0%) | 0 (0.0%) |
| Finance & Insurance | 0 (0.0%) | 0 (0.0%) |
| Real Estate, Rental & Leasing | 0 (0.0%) | 0 (0.0%) |
| Professional & Scientific | 0 (0.0%) | 0 (0.0%) |
| Enterprise Management | 0 (0.0%) | 0 (0.0%) |
| Administrative & Support | 0 (0.0%) | 0 (0.0%) |
| Educational Services | 0 (0.0%) | 4 (100.0%) |
| Health Care & Social Assistance | 9 (100.0%) | 0 (0.0%) |
| Arts, Entertainment & Recreation | 0 (0.0%) | 0 (0.0%) |
| Accommodation & Food Services | 0 (0.0%) | 7 (100.0%) |
| Public Administration | 0 (0.0%) | 0 (0.0%) |
| Total | 51 (60.0%) | 34 (40.0%) |
Education in Sunset Bay
School Enrollment in Sunset Bay
The most common levels of schooling among the 31 students in Sunset Bay are middle school (11 | 35.5%), elementary school (10 | 32.3%), and high school (10 | 32.3%).
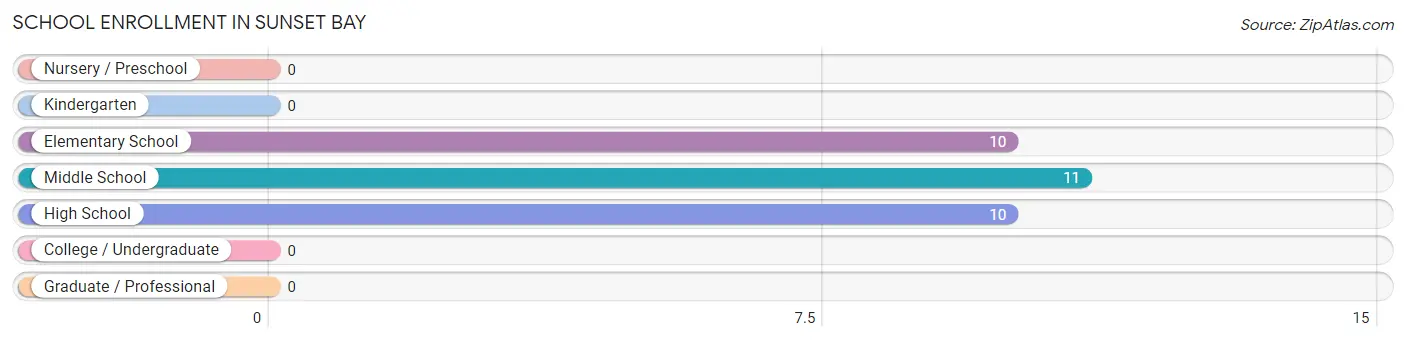
| School Level | # Students | % Students |
| Nursery / Preschool | 0 | 0.0% |
| Kindergarten | 0 | 0.0% |
| Elementary School | 10 | 32.3% |
| Middle School | 11 | 35.5% |
| High School | 10 | 32.3% |
| College / Undergraduate | 0 | 0.0% |
| Graduate / Professional | 0 | 0.0% |
| Total | 31 | 100.0% |
School Enrollment by Age by Funding Source in Sunset Bay
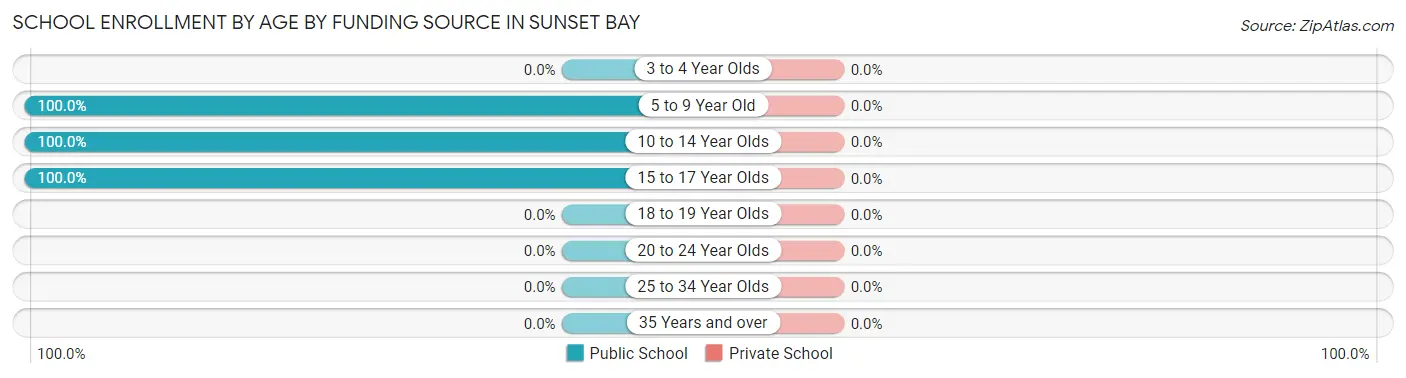
| Age Bracket | Public School | Private School |
| 3 to 4 Year Olds | 0 (0.0%) | 0 (0.0%) |
| 5 to 9 Year Old | 10 (100.0%) | 0 (0.0%) |
| 10 to 14 Year Olds | 11 (100.0%) | 0 (0.0%) |
| 15 to 17 Year Olds | 10 (100.0%) | 0 (0.0%) |
| 18 to 19 Year Olds | 0 (0.0%) | 0 (0.0%) |
| 20 to 24 Year Olds | 0 (0.0%) | 0 (0.0%) |
| 25 to 34 Year Olds | 0 (0.0%) | 0 (0.0%) |
| 35 Years and over | 0 (0.0%) | 0 (0.0%) |
| Total | 31 (100.0%) | 0 (0.0%) |
Educational Attainment by Field of Study in Sunset Bay
Education (18 | 25.0%), science & technology (14 | 19.4%), bio, nature & agricultural (9 | 12.5%), business (8 | 11.1%), and computers & mathematics (7 | 9.7%) are the most common fields of study among 72 individuals in Sunset Bay who have obtained a bachelor's degree or higher.
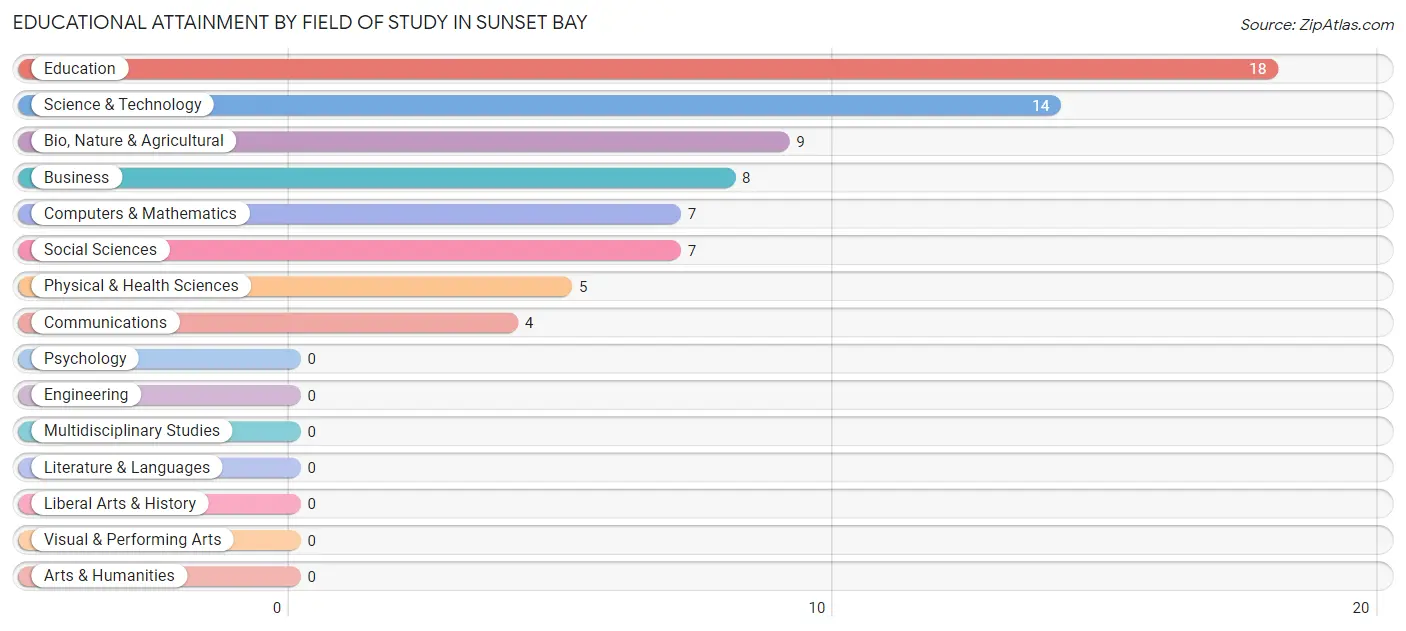
| Field of Study | # Graduates | % Graduates |
| Computers & Mathematics | 7 | 9.7% |
| Bio, Nature & Agricultural | 9 | 12.5% |
| Physical & Health Sciences | 5 | 6.9% |
| Psychology | 0 | 0.0% |
| Social Sciences | 7 | 9.7% |
| Engineering | 0 | 0.0% |
| Multidisciplinary Studies | 0 | 0.0% |
| Science & Technology | 14 | 19.4% |
| Business | 8 | 11.1% |
| Education | 18 | 25.0% |
| Literature & Languages | 0 | 0.0% |
| Liberal Arts & History | 0 | 0.0% |
| Visual & Performing Arts | 0 | 0.0% |
| Communications | 4 | 5.6% |
| Arts & Humanities | 0 | 0.0% |
| Total | 72 | 100.0% |
Transportation & Commute in Sunset Bay
Vehicle Availability by Sex in Sunset Bay
The most prevalent vehicle ownership categories in Sunset Bay are males with 2 vehicles (39, accounting for 76.5%) and females with 2 vehicles (15, making up 114.7%).
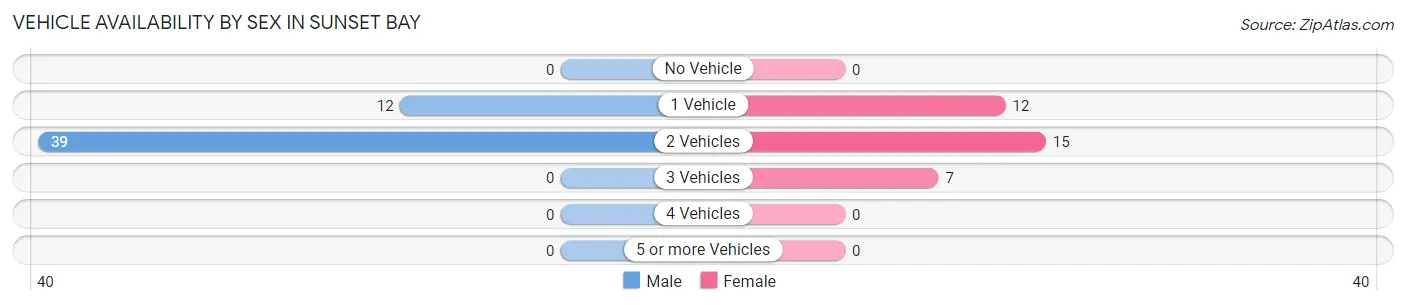
| Vehicles Available | Male | Female |
| No Vehicle | 0 (0.0%) | 0 (0.0%) |
| 1 Vehicle | 12 (23.5%) | 12 (35.3%) |
| 2 Vehicles | 39 (76.5%) | 15 (44.1%) |
| 3 Vehicles | 0 (0.0%) | 7 (20.6%) |
| 4 Vehicles | 0 (0.0%) | 0 (0.0%) |
| 5 or more Vehicles | 0 (0.0%) | 0 (0.0%) |
| Total | 51 (100.0%) | 34 (100.0%) |
Commute Time in Sunset Bay
The most frequently occuring commute durations in Sunset Bay are less than 5 minutes (20 commuters, 28.6%), 35 to 39 minutes (15 commuters, 21.4%), and 15 to 19 minutes (11 commuters, 15.7%).
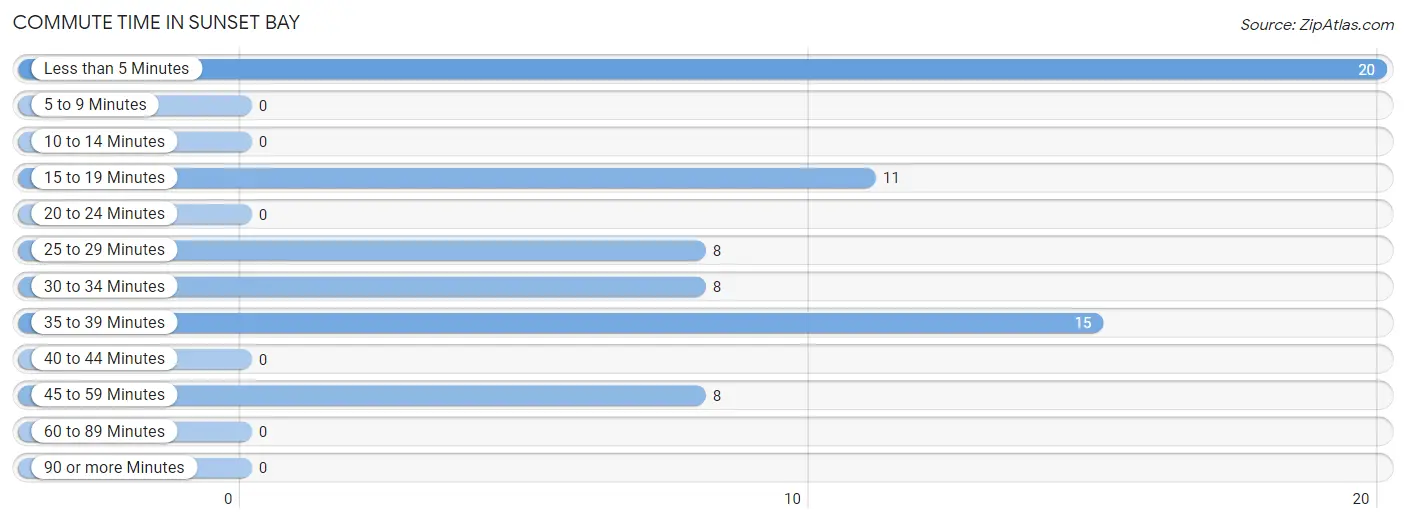
| Commute Time | # Commuters | % Commuters |
| Less than 5 Minutes | 20 | 28.6% |
| 5 to 9 Minutes | 0 | 0.0% |
| 10 to 14 Minutes | 0 | 0.0% |
| 15 to 19 Minutes | 11 | 15.7% |
| 20 to 24 Minutes | 0 | 0.0% |
| 25 to 29 Minutes | 8 | 11.4% |
| 30 to 34 Minutes | 8 | 11.4% |
| 35 to 39 Minutes | 15 | 21.4% |
| 40 to 44 Minutes | 0 | 0.0% |
| 45 to 59 Minutes | 8 | 11.4% |
| 60 to 89 Minutes | 0 | 0.0% |
| 90 or more Minutes | 0 | 0.0% |
Commute Time by Sex in Sunset Bay
The most common commute times in Sunset Bay are 15 to 19 minutes (11 commuters, 30.6%) for males and less than 5 minutes (11 commuters, 32.4%) for females.
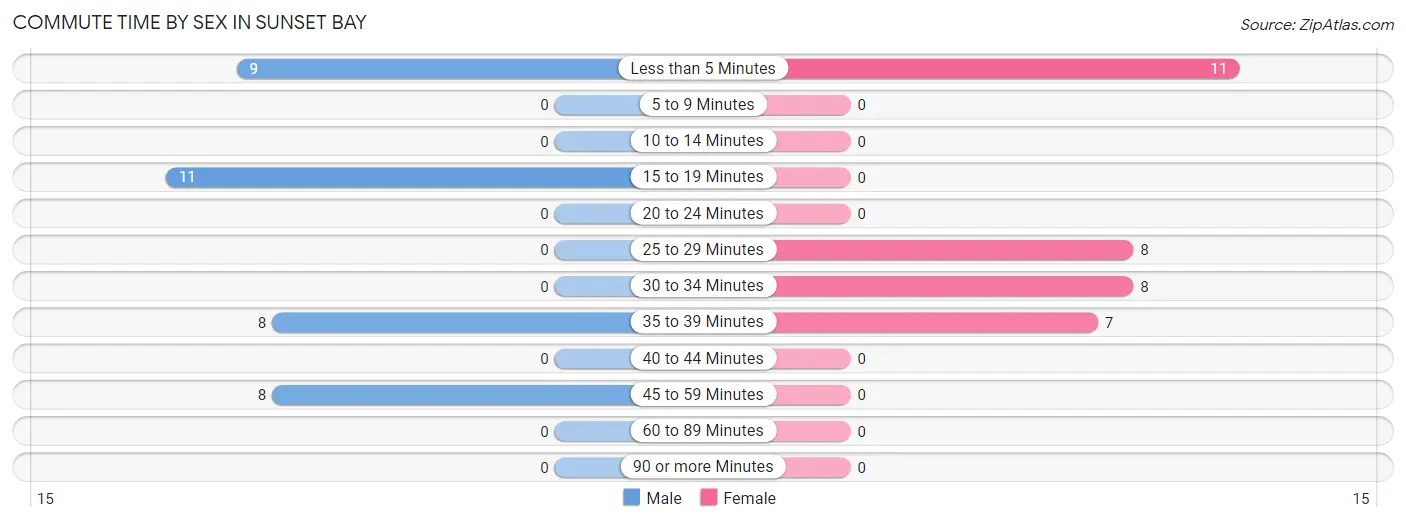
| Commute Time | Male | Female |
| Less than 5 Minutes | 9 (25.0%) | 11 (32.4%) |
| 5 to 9 Minutes | 0 (0.0%) | 0 (0.0%) |
| 10 to 14 Minutes | 0 (0.0%) | 0 (0.0%) |
| 15 to 19 Minutes | 11 (30.6%) | 0 (0.0%) |
| 20 to 24 Minutes | 0 (0.0%) | 0 (0.0%) |
| 25 to 29 Minutes | 0 (0.0%) | 8 (23.5%) |
| 30 to 34 Minutes | 0 (0.0%) | 8 (23.5%) |
| 35 to 39 Minutes | 8 (22.2%) | 7 (20.6%) |
| 40 to 44 Minutes | 0 (0.0%) | 0 (0.0%) |
| 45 to 59 Minutes | 8 (22.2%) | 0 (0.0%) |
| 60 to 89 Minutes | 0 (0.0%) | 0 (0.0%) |
| 90 or more Minutes | 0 (0.0%) | 0 (0.0%) |
Time of Departure to Work by Sex in Sunset Bay
The most frequent times of departure to work in Sunset Bay are 7:30 AM to 7:59 AM (20, 55.6%) for males and 7:00 AM to 7:29 AM (11, 32.4%) for females.
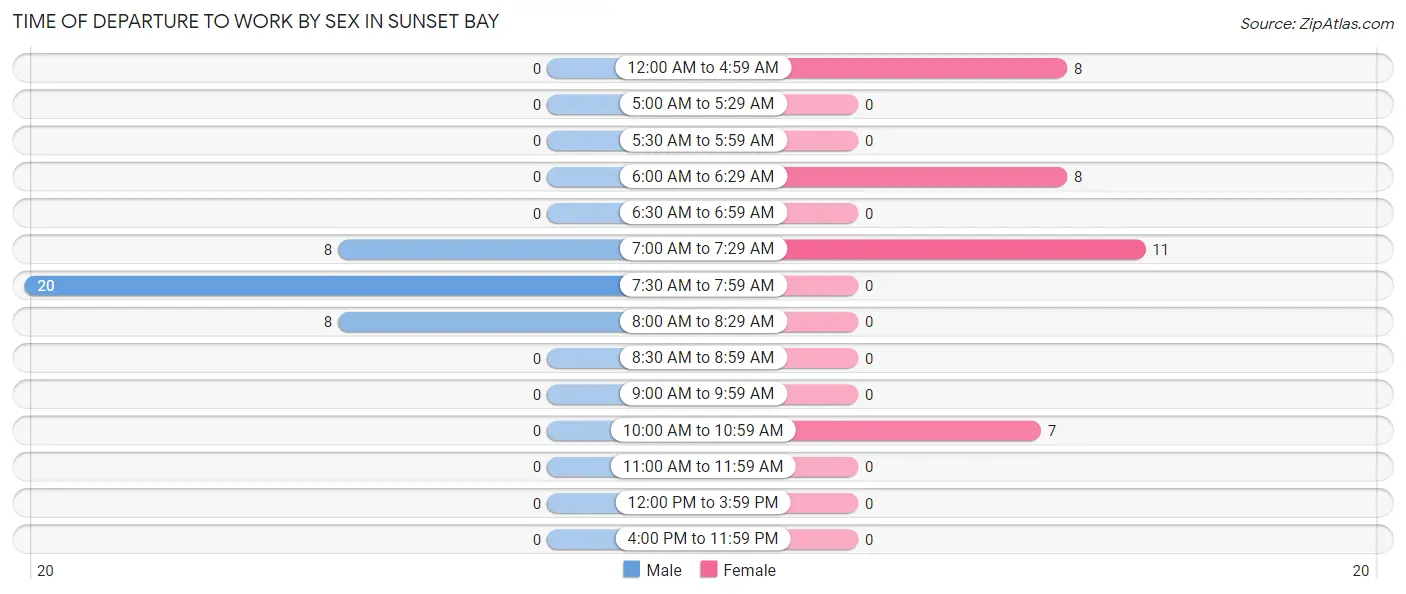
| Time of Departure | Male | Female |
| 12:00 AM to 4:59 AM | 0 (0.0%) | 8 (23.5%) |
| 5:00 AM to 5:29 AM | 0 (0.0%) | 0 (0.0%) |
| 5:30 AM to 5:59 AM | 0 (0.0%) | 0 (0.0%) |
| 6:00 AM to 6:29 AM | 0 (0.0%) | 8 (23.5%) |
| 6:30 AM to 6:59 AM | 0 (0.0%) | 0 (0.0%) |
| 7:00 AM to 7:29 AM | 8 (22.2%) | 11 (32.4%) |
| 7:30 AM to 7:59 AM | 20 (55.6%) | 0 (0.0%) |
| 8:00 AM to 8:29 AM | 8 (22.2%) | 0 (0.0%) |
| 8:30 AM to 8:59 AM | 0 (0.0%) | 0 (0.0%) |
| 9:00 AM to 9:59 AM | 0 (0.0%) | 0 (0.0%) |
| 10:00 AM to 10:59 AM | 0 (0.0%) | 7 (20.6%) |
| 11:00 AM to 11:59 AM | 0 (0.0%) | 0 (0.0%) |
| 12:00 PM to 3:59 PM | 0 (0.0%) | 0 (0.0%) |
| 4:00 PM to 11:59 PM | 0 (0.0%) | 0 (0.0%) |
| Total | 36 (100.0%) | 34 (100.0%) |
Housing Occupancy in Sunset Bay
Occupancy by Ownership in Sunset Bay
Of the total 104 dwellings in Sunset Bay, owner-occupied units account for 70 (67.3%), while renter-occupied units make up 34 (32.7%).
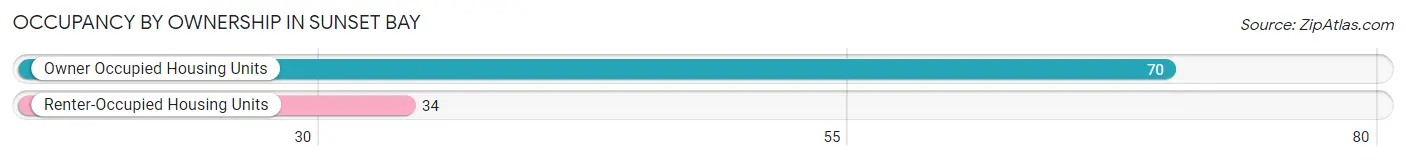
| Occupancy | # Housing Units | % Housing Units |
| Owner Occupied Housing Units | 70 | 67.3% |
| Renter-Occupied Housing Units | 34 | 32.7% |
| Total Occupied Housing Units | 104 | 100.0% |
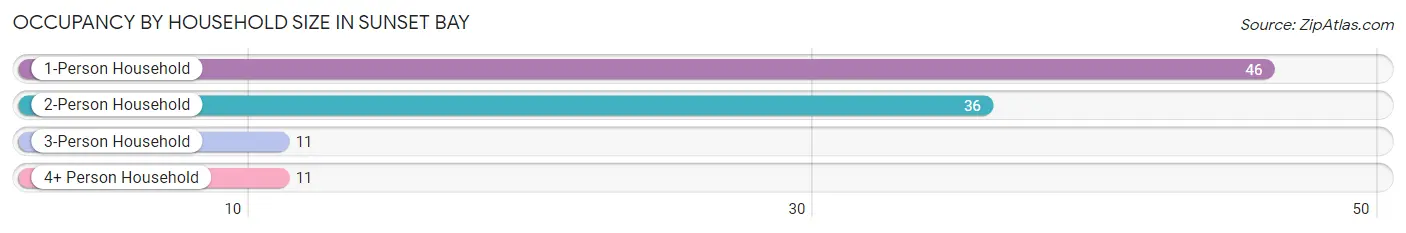
Occupancy by Household Size in Sunset Bay
| Household Size | # Housing Units | % Housing Units |
| 1-Person Household | 46 | 44.2% |
| 2-Person Household | 36 | 34.6% |
| 3-Person Household | 11 | 10.6% |
| 4+ Person Household | 11 | 10.6% |
| Total Housing Units | 104 | 100.0% |
Occupancy by Ownership by Household Size in Sunset Bay
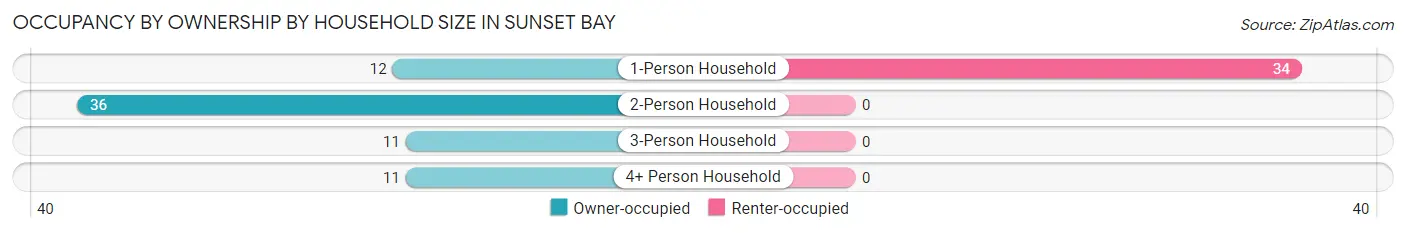
| Household Size | Owner-occupied | Renter-occupied |
| 1-Person Household | 12 (26.1%) | 34 (73.9%) |
| 2-Person Household | 36 (100.0%) | 0 (0.0%) |
| 3-Person Household | 11 (100.0%) | 0 (0.0%) |
| 4+ Person Household | 11 (100.0%) | 0 (0.0%) |
| Total Housing Units | 70 (67.3%) | 34 (32.7%) |
Occupancy by Educational Attainment in Sunset Bay
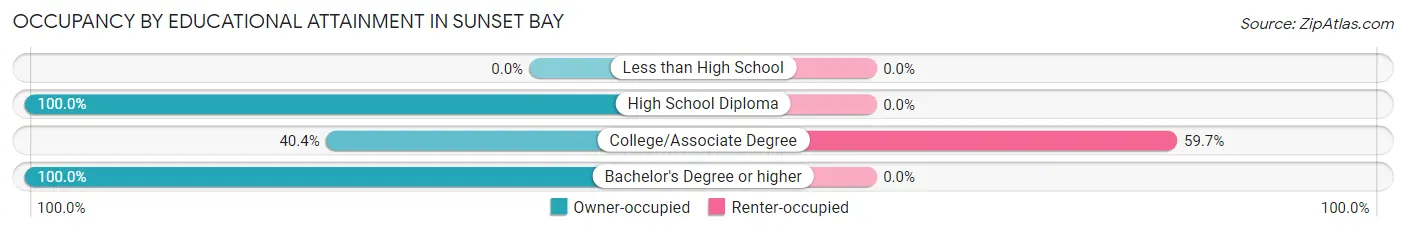
| Household Size | Owner-occupied | Renter-occupied |
| Less than High School | 0 (0.0%) | 0 (0.0%) |
| High School Diploma | 19 (100.0%) | 0 (0.0%) |
| College/Associate Degree | 23 (40.4%) | 34 (59.7%) |
| Bachelor's Degree or higher | 28 (100.0%) | 0 (0.0%) |
Occupancy by Age of Householder in Sunset Bay
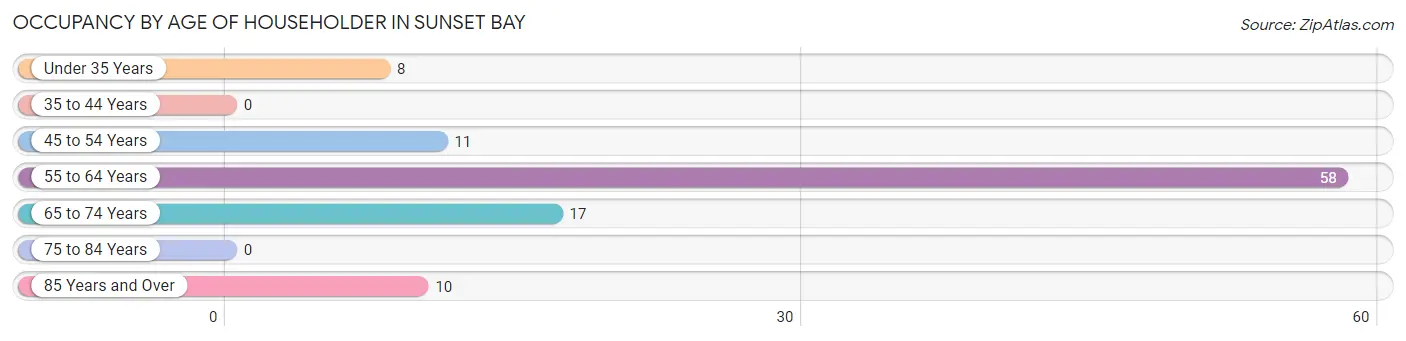
| Age Bracket | # Households | % Households |
| Under 35 Years | 8 | 7.7% |
| 35 to 44 Years | 0 | 0.0% |
| 45 to 54 Years | 11 | 10.6% |
| 55 to 64 Years | 58 | 55.8% |
| 65 to 74 Years | 17 | 16.4% |
| 75 to 84 Years | 0 | 0.0% |
| 85 Years and Over | 10 | 9.6% |
| Total | 104 | 100.0% |
Housing Finances in Sunset Bay
Median Income by Occupancy in Sunset Bay
| Occupancy Type | # Households | Median Income |
| Owner-Occupied | 70 (67.3%) | $0 |
| Renter-Occupied | 34 (32.7%) | $0 |
| Average | 104 (100.0%) | $0 |
Occupancy by Householder Income Bracket in Sunset Bay
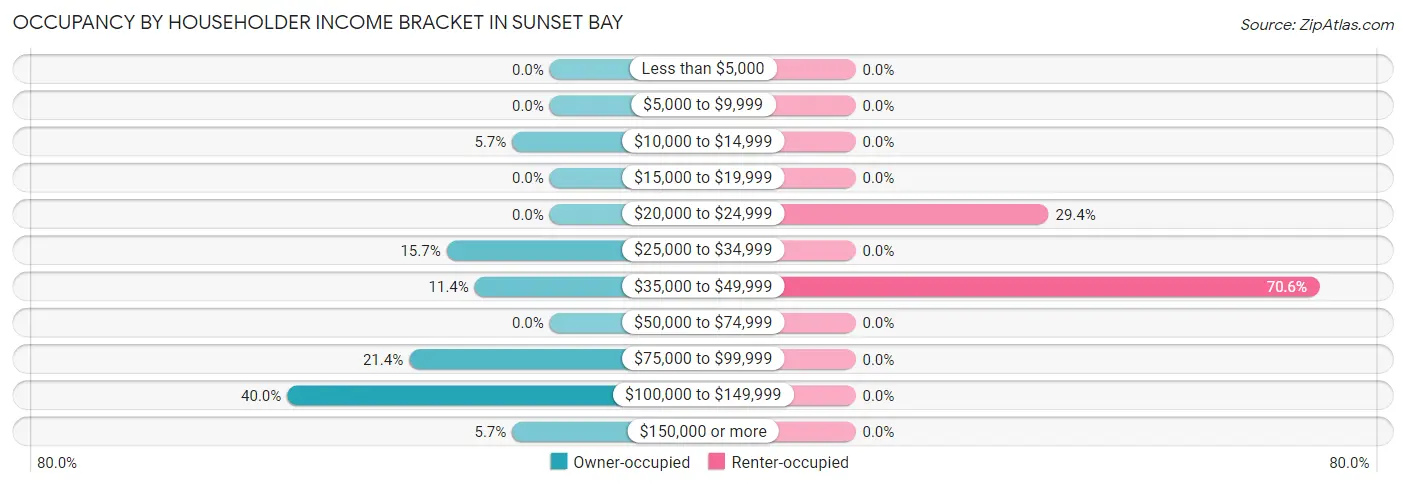
| Income Bracket | Owner-occupied | Renter-occupied |
| Less than $5,000 | 0 (0.0%) | 0 (0.0%) |
| $5,000 to $9,999 | 0 (0.0%) | 0 (0.0%) |
| $10,000 to $14,999 | 4 (5.7%) | 0 (0.0%) |
| $15,000 to $19,999 | 0 (0.0%) | 0 (0.0%) |
| $20,000 to $24,999 | 0 (0.0%) | 10 (29.4%) |
| $25,000 to $34,999 | 11 (15.7%) | 0 (0.0%) |
| $35,000 to $49,999 | 8 (11.4%) | 24 (70.6%) |
| $50,000 to $74,999 | 0 (0.0%) | 0 (0.0%) |
| $75,000 to $99,999 | 15 (21.4%) | 0 (0.0%) |
| $100,000 to $149,999 | 28 (40.0%) | 0 (0.0%) |
| $150,000 or more | 4 (5.7%) | 0 (0.0%) |
| Total | 70 (100.0%) | 34 (100.0%) |
Monthly Housing Cost Tiers in Sunset Bay
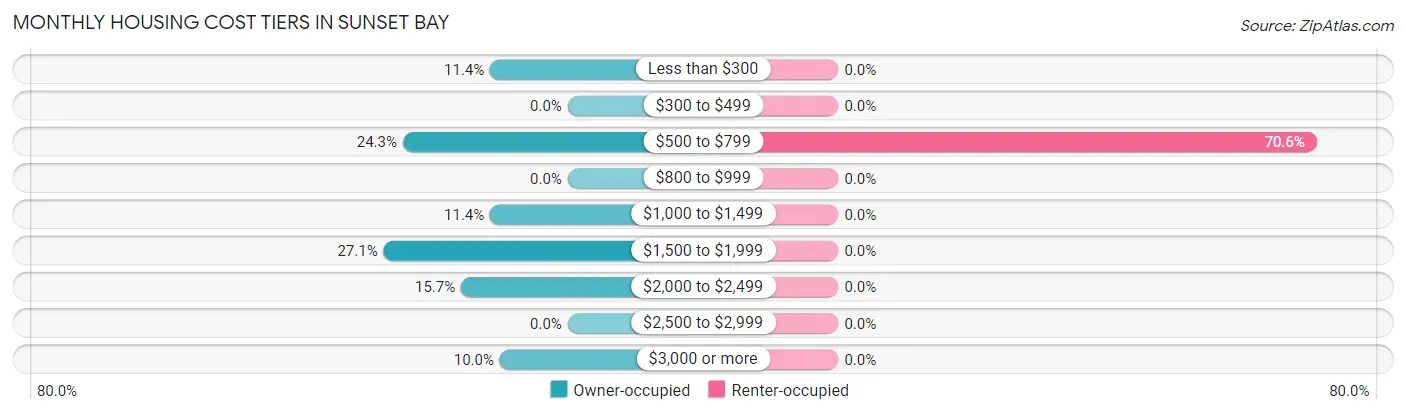
| Monthly Cost | Owner-occupied | Renter-occupied |
| Less than $300 | 8 (11.4%) | 0 (0.0%) |
| $300 to $499 | 0 (0.0%) | 0 (0.0%) |
| $500 to $799 | 17 (24.3%) | 24 (70.6%) |
| $800 to $999 | 0 (0.0%) | 0 (0.0%) |
| $1,000 to $1,499 | 8 (11.4%) | 0 (0.0%) |
| $1,500 to $1,999 | 19 (27.1%) | 0 (0.0%) |
| $2,000 to $2,499 | 11 (15.7%) | 0 (0.0%) |
| $2,500 to $2,999 | 0 (0.0%) | 0 (0.0%) |
| $3,000 or more | 7 (10.0%) | 0 (0.0%) |
| Total | 70 (100.0%) | 34 (100.0%) |
Physical Housing Characteristics in Sunset Bay
Housing Structures in Sunset Bay
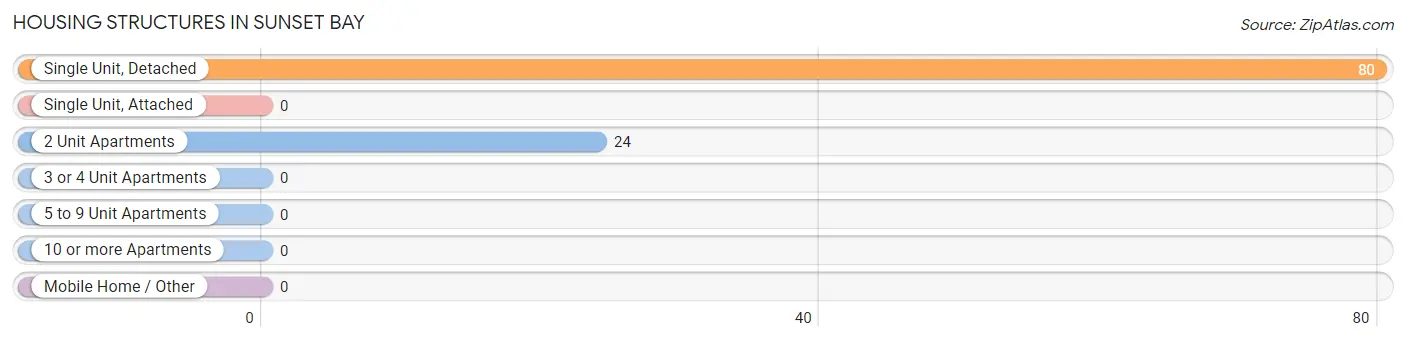
| Structure Type | # Housing Units | % Housing Units |
| Single Unit, Detached | 80 | 76.9% |
| Single Unit, Attached | 0 | 0.0% |
| 2 Unit Apartments | 24 | 23.1% |
| 3 or 4 Unit Apartments | 0 | 0.0% |
| 5 to 9 Unit Apartments | 0 | 0.0% |
| 10 or more Apartments | 0 | 0.0% |
| Mobile Home / Other | 0 | 0.0% |
| Total | 104 | 100.0% |
Housing Structures by Occupancy in Sunset Bay
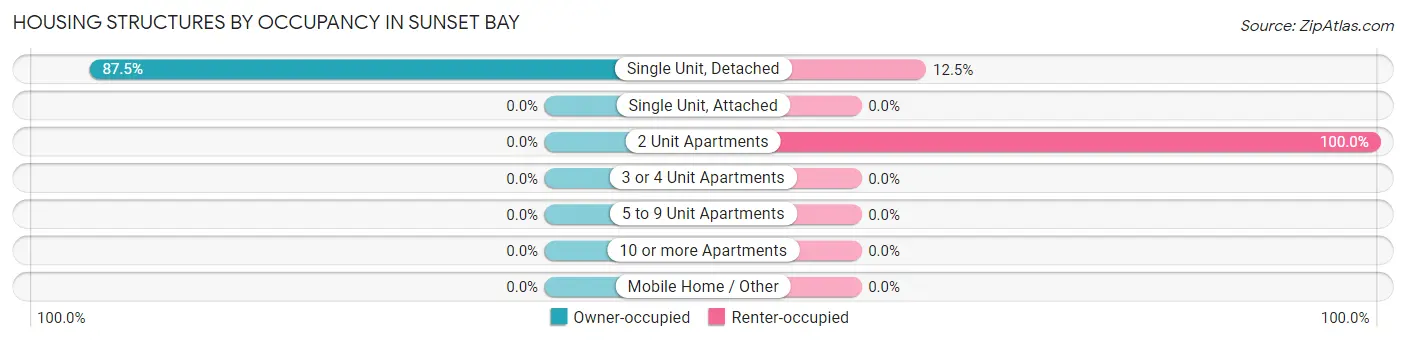
| Structure Type | Owner-occupied | Renter-occupied |
| Single Unit, Detached | 70 (87.5%) | 10 (12.5%) |
| Single Unit, Attached | 0 (0.0%) | 0 (0.0%) |
| 2 Unit Apartments | 0 (0.0%) | 24 (100.0%) |
| 3 or 4 Unit Apartments | 0 (0.0%) | 0 (0.0%) |
| 5 to 9 Unit Apartments | 0 (0.0%) | 0 (0.0%) |
| 10 or more Apartments | 0 (0.0%) | 0 (0.0%) |
| Mobile Home / Other | 0 (0.0%) | 0 (0.0%) |
| Total | 70 (67.3%) | 34 (32.7%) |
Housing Structures by Number of Rooms in Sunset Bay
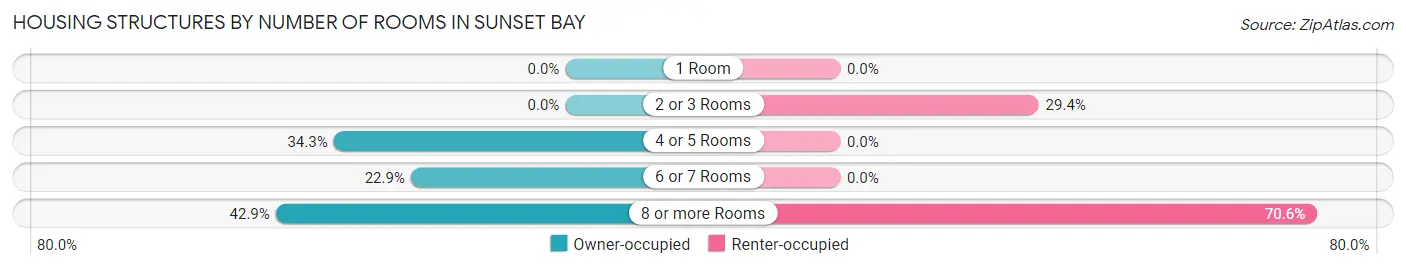
| Number of Rooms | Owner-occupied | Renter-occupied |
| 1 Room | 0 (0.0%) | 0 (0.0%) |
| 2 or 3 Rooms | 0 (0.0%) | 10 (29.4%) |
| 4 or 5 Rooms | 24 (34.3%) | 0 (0.0%) |
| 6 or 7 Rooms | 16 (22.9%) | 0 (0.0%) |
| 8 or more Rooms | 30 (42.9%) | 24 (70.6%) |
| Total | 70 (100.0%) | 34 (100.0%) |
Housing Structure by Heating Type in Sunset Bay
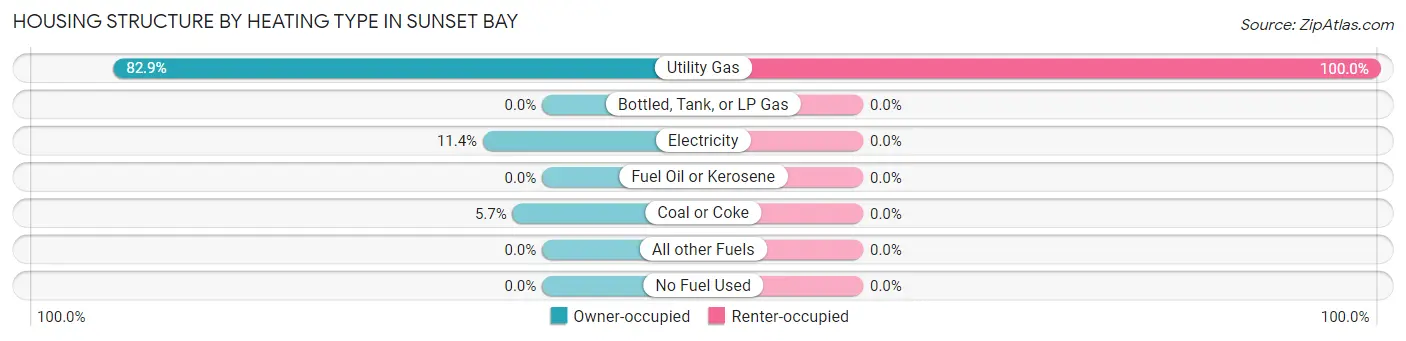
| Heating Type | Owner-occupied | Renter-occupied |
| Utility Gas | 58 (82.9%) | 34 (100.0%) |
| Bottled, Tank, or LP Gas | 0 (0.0%) | 0 (0.0%) |
| Electricity | 8 (11.4%) | 0 (0.0%) |
| Fuel Oil or Kerosene | 0 (0.0%) | 0 (0.0%) |
| Coal or Coke | 4 (5.7%) | 0 (0.0%) |
| All other Fuels | 0 (0.0%) | 0 (0.0%) |
| No Fuel Used | 0 (0.0%) | 0 (0.0%) |
| Total | 70 (100.0%) | 34 (100.0%) |
Household Vehicle Usage in Sunset Bay
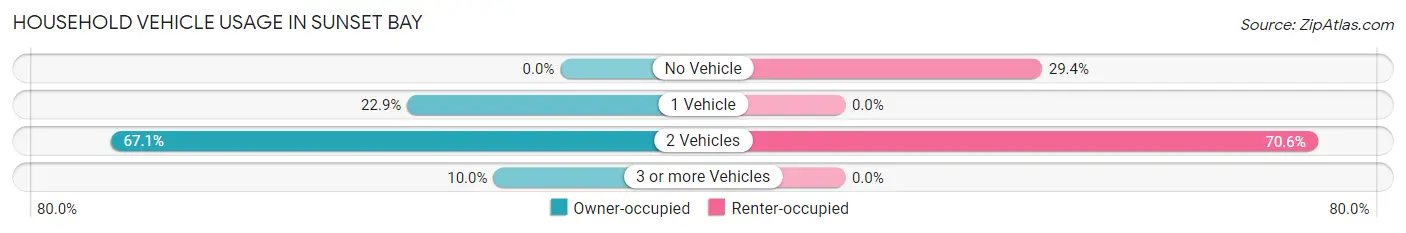
| Vehicles per Household | Owner-occupied | Renter-occupied |
| No Vehicle | 0 (0.0%) | 10 (29.4%) |
| 1 Vehicle | 16 (22.9%) | 0 (0.0%) |
| 2 Vehicles | 47 (67.1%) | 24 (70.6%) |
| 3 or more Vehicles | 7 (10.0%) | 0 (0.0%) |
| Total | 70 (100.0%) | 34 (100.0%) |
Real Estate & Mortgages in Sunset Bay
Real Estate and Mortgage Overview in Sunset Bay
| Characteristic | Without Mortgage | With Mortgage |
| Housing Units | 33 | 37 |
| Median Property Value | - | - |
| Median Household Income | $131,406 | $0 |
| Monthly Housing Costs | $565 | $7 |
| Real Estate Taxes | $5,139 | $0 |
Property Value by Mortgage Status in Sunset Bay
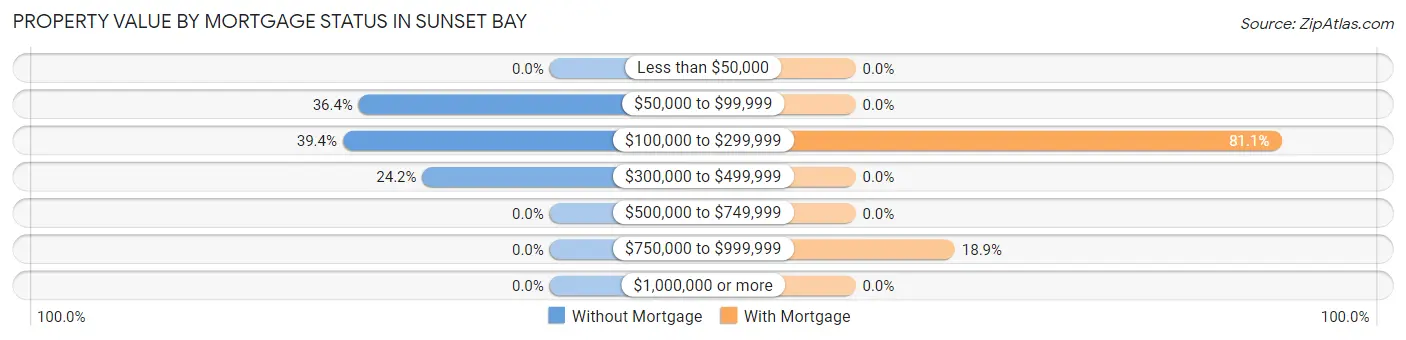
| Property Value | Without Mortgage | With Mortgage |
| Less than $50,000 | 0 (0.0%) | 0 (0.0%) |
| $50,000 to $99,999 | 12 (36.4%) | 0 (0.0%) |
| $100,000 to $299,999 | 13 (39.4%) | 30 (81.1%) |
| $300,000 to $499,999 | 8 (24.2%) | 0 (0.0%) |
| $500,000 to $749,999 | 0 (0.0%) | 0 (0.0%) |
| $750,000 to $999,999 | 0 (0.0%) | 7 (18.9%) |
| $1,000,000 or more | 0 (0.0%) | 0 (0.0%) |
| Total | 33 (100.0%) | 37 (100.0%) |
Household Income by Mortgage Status in Sunset Bay
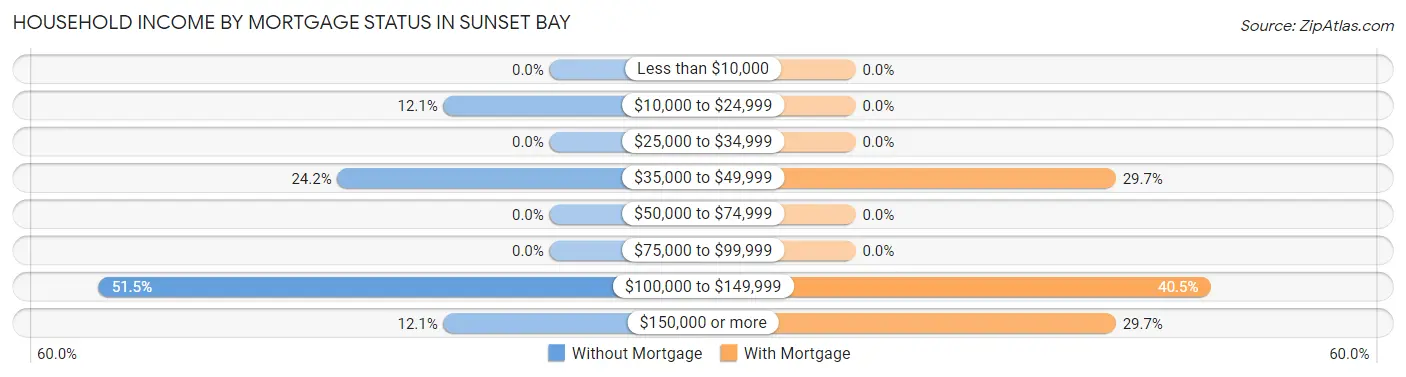
| Household Income | Without Mortgage | With Mortgage |
| Less than $10,000 | 0 (0.0%) | 0 (0.0%) |
| $10,000 to $24,999 | 4 (12.1%) | 0 (0.0%) |
| $25,000 to $34,999 | 0 (0.0%) | 0 (0.0%) |
| $35,000 to $49,999 | 8 (24.2%) | 11 (29.7%) |
| $50,000 to $74,999 | 0 (0.0%) | 0 (0.0%) |
| $75,000 to $99,999 | 0 (0.0%) | 0 (0.0%) |
| $100,000 to $149,999 | 17 (51.5%) | 15 (40.5%) |
| $150,000 or more | 4 (12.1%) | 11 (29.7%) |
| Total | 33 (100.0%) | 37 (100.0%) |
Property Value to Household Income Ratio in Sunset Bay
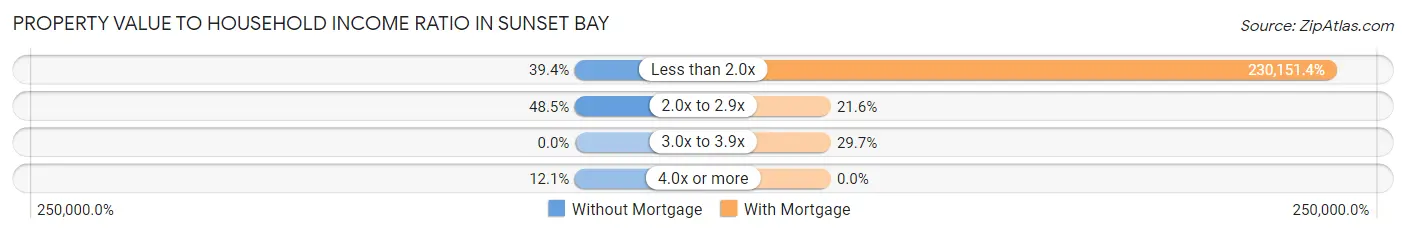
| Value-to-Income Ratio | Without Mortgage | With Mortgage |
| Less than 2.0x | 13 (39.4%) | 85,156 (230,151.4%) |
| 2.0x to 2.9x | 16 (48.5%) | 8 (21.6%) |
| 3.0x to 3.9x | 0 (0.0%) | 11 (29.7%) |
| 4.0x or more | 4 (12.1%) | 0 (0.0%) |
| Total | 33 (100.0%) | 37 (100.0%) |
Real Estate Taxes by Mortgage Status in Sunset Bay
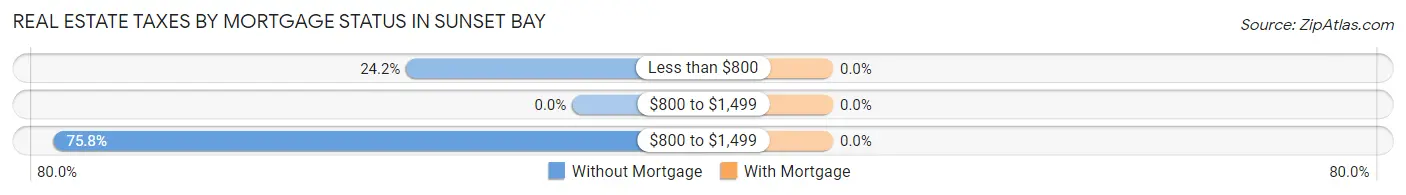
| Property Taxes | Without Mortgage | With Mortgage |
| Less than $800 | 8 (24.2%) | 0 (0.0%) |
| $800 to $1,499 | 0 (0.0%) | 0 (0.0%) |
| $800 to $1,499 | 25 (75.8%) | 0 (0.0%) |
| Total | 33 (100.0%) | 37 (100.0%) |
Health & Disability in Sunset Bay
Health Insurance Coverage by Age in Sunset Bay
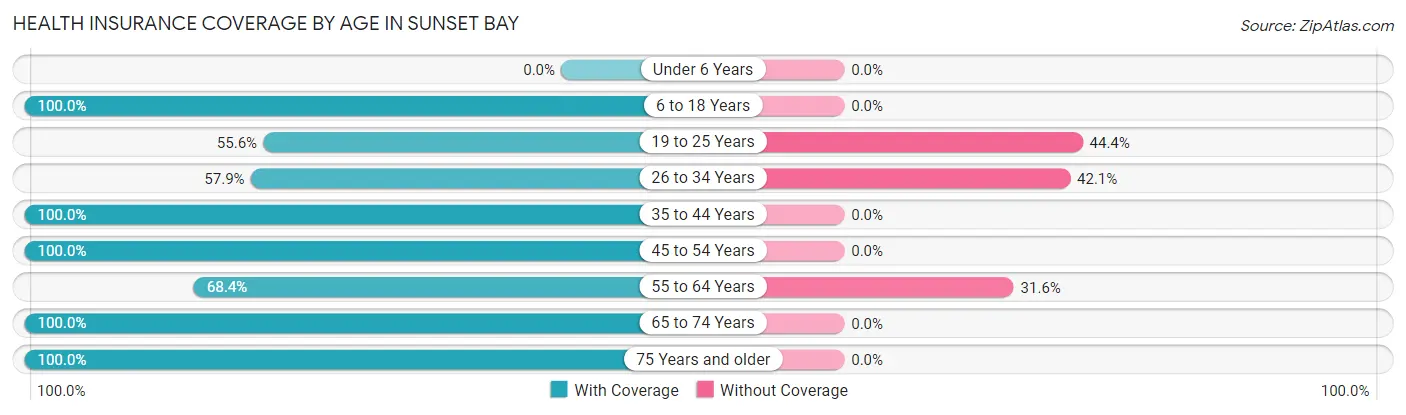
| Age Bracket | With Coverage | Without Coverage |
| Under 6 Years | 0 (0.0%) | 0 (0.0%) |
| 6 to 18 Years | 31 (100.0%) | 0 (0.0%) |
| 19 to 25 Years | 10 (55.6%) | 8 (44.4%) |
| 26 to 34 Years | 11 (57.9%) | 8 (42.1%) |
| 35 to 44 Years | 18 (100.0%) | 0 (0.0%) |
| 45 to 54 Years | 33 (100.0%) | 0 (0.0%) |
| 55 to 64 Years | 52 (68.4%) | 24 (31.6%) |
| 65 to 74 Years | 33 (100.0%) | 0 (0.0%) |
| 75 Years and older | 10 (100.0%) | 0 (0.0%) |
| Total | 198 (83.2%) | 40 (16.8%) |
Health Insurance Coverage by Citizenship Status in Sunset Bay
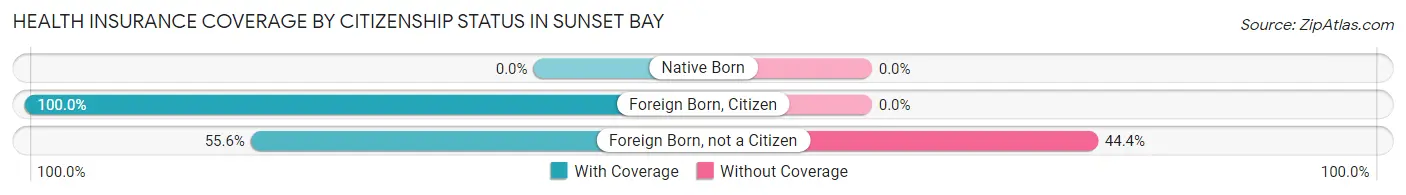
| Citizenship Status | With Coverage | Without Coverage |
| Native Born | 0 (0.0%) | 0 (0.0%) |
| Foreign Born, Citizen | 31 (100.0%) | 0 (0.0%) |
| Foreign Born, not a Citizen | 10 (55.6%) | 8 (44.4%) |
Health Insurance Coverage by Household Income in Sunset Bay
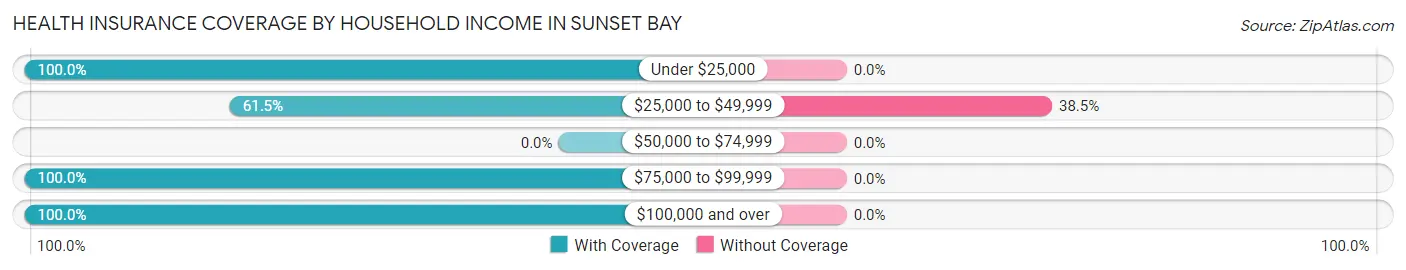
| Household Income | With Coverage | Without Coverage |
| Under $25,000 | 14 (100.0%) | 0 (0.0%) |
| $25,000 to $49,999 | 64 (61.5%) | 40 (38.5%) |
| $50,000 to $74,999 | 0 (0.0%) | 0 (0.0%) |
| $75,000 to $99,999 | 22 (100.0%) | 0 (0.0%) |
| $100,000 and over | 73 (100.0%) | 0 (0.0%) |
Public vs Private Health Insurance Coverage by Age in Sunset Bay
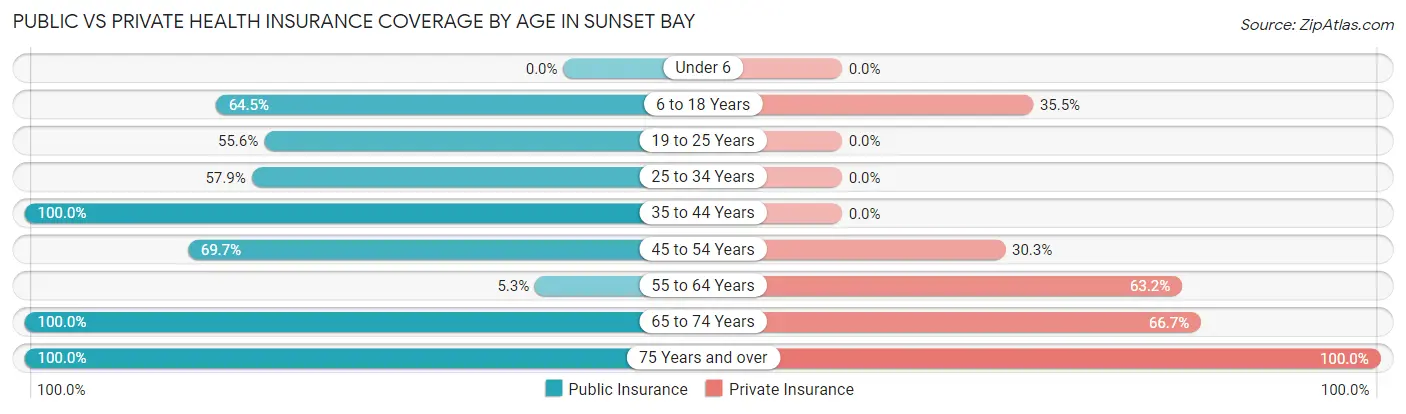
| Age Bracket | Public Insurance | Private Insurance |
| Under 6 | 0 (0.0%) | 0 (0.0%) |
| 6 to 18 Years | 20 (64.5%) | 11 (35.5%) |
| 19 to 25 Years | 10 (55.6%) | 0 (0.0%) |
| 25 to 34 Years | 11 (57.9%) | 0 (0.0%) |
| 35 to 44 Years | 18 (100.0%) | 0 (0.0%) |
| 45 to 54 Years | 23 (69.7%) | 10 (30.3%) |
| 55 to 64 Years | 4 (5.3%) | 48 (63.2%) |
| 65 to 74 Years | 33 (100.0%) | 22 (66.7%) |
| 75 Years and over | 10 (100.0%) | 10 (100.0%) |
| Total | 129 (54.2%) | 101 (42.4%) |
Disability Status by Sex by Age in Sunset Bay
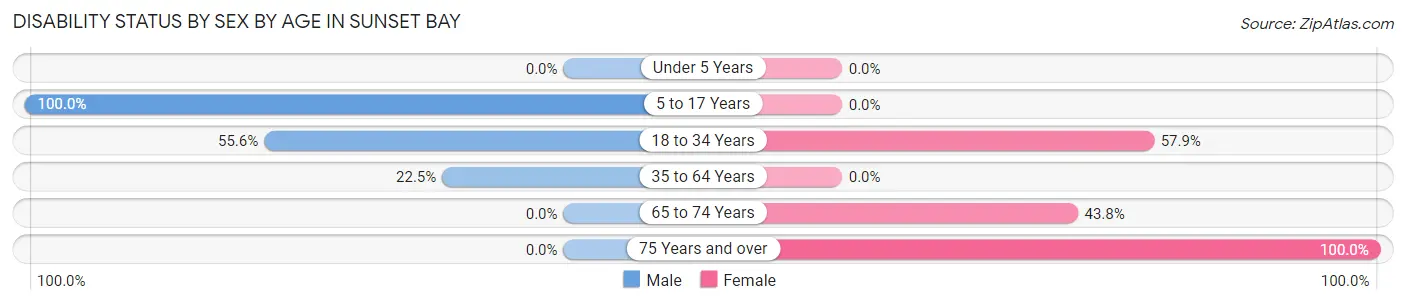
| Age Bracket | Male | Female |
| Under 5 Years | 0 (0.0%) | 0 (0.0%) |
| 5 to 17 Years | 20 (100.0%) | 0 (0.0%) |
| 18 to 34 Years | 10 (55.6%) | 11 (57.9%) |
| 35 to 64 Years | 18 (22.5%) | 0 (0.0%) |
| 65 to 74 Years | 0 (0.0%) | 7 (43.8%) |
| 75 Years and over | 0 (0.0%) | 10 (100.0%) |
Disability Class by Sex by Age in Sunset Bay
Disability Class: Hearing Difficulty
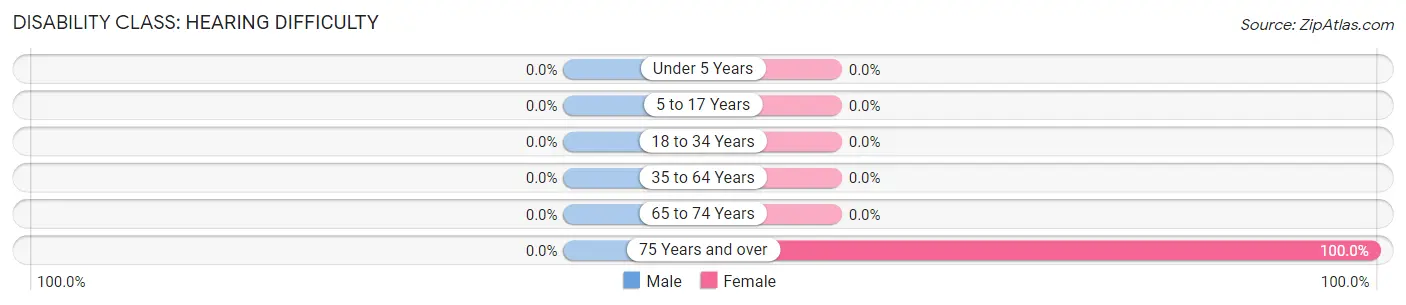
| Age Bracket | Male | Female |
| Under 5 Years | 0 (0.0%) | 0 (0.0%) |
| 5 to 17 Years | 0 (0.0%) | 0 (0.0%) |
| 18 to 34 Years | 0 (0.0%) | 0 (0.0%) |
| 35 to 64 Years | 0 (0.0%) | 0 (0.0%) |
| 65 to 74 Years | 0 (0.0%) | 0 (0.0%) |
| 75 Years and over | 0 (0.0%) | 10 (100.0%) |
Disability Class: Vision Difficulty
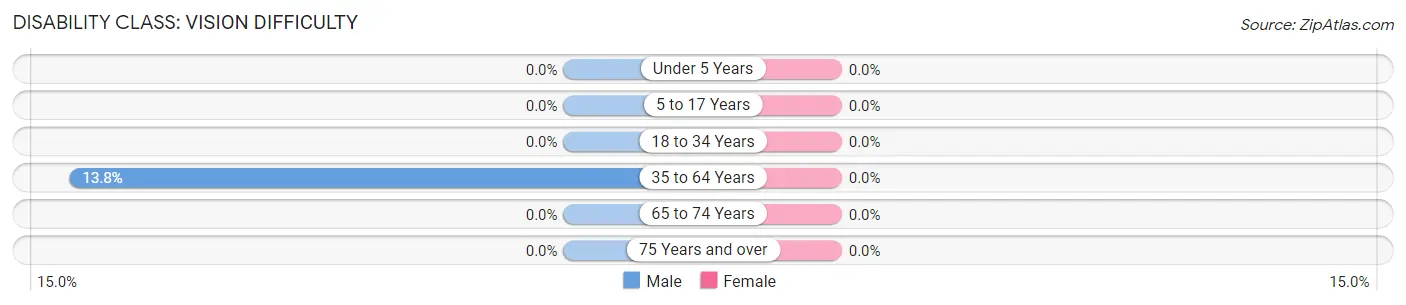
| Age Bracket | Male | Female |
| Under 5 Years | 0 (0.0%) | 0 (0.0%) |
| 5 to 17 Years | 0 (0.0%) | 0 (0.0%) |
| 18 to 34 Years | 0 (0.0%) | 0 (0.0%) |
| 35 to 64 Years | 11 (13.8%) | 0 (0.0%) |
| 65 to 74 Years | 0 (0.0%) | 0 (0.0%) |
| 75 Years and over | 0 (0.0%) | 0 (0.0%) |
Disability Class: Cognitive Difficulty
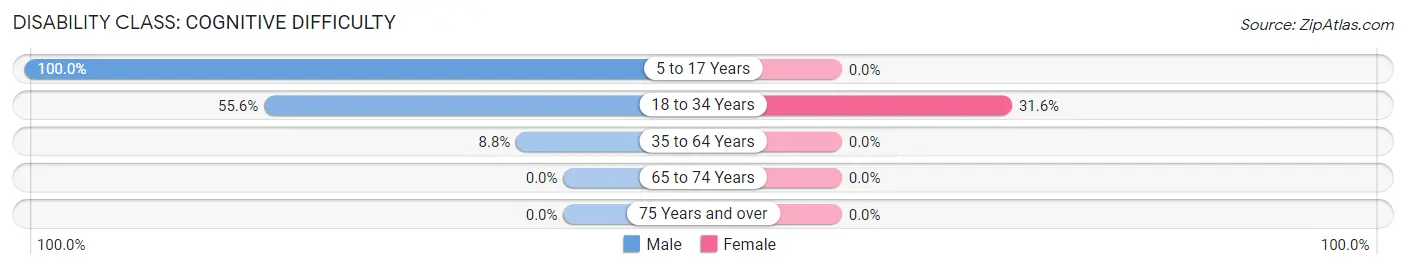
| Age Bracket | Male | Female |
| 5 to 17 Years | 20 (100.0%) | 0 (0.0%) |
| 18 to 34 Years | 10 (55.6%) | 6 (31.6%) |
| 35 to 64 Years | 7 (8.7%) | 0 (0.0%) |
| 65 to 74 Years | 0 (0.0%) | 0 (0.0%) |
| 75 Years and over | 0 (0.0%) | 0 (0.0%) |
Disability Class: Ambulatory Difficulty
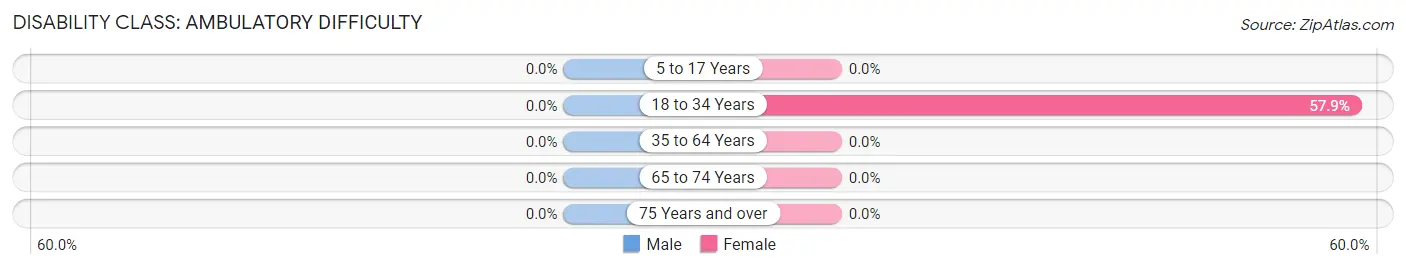
| Age Bracket | Male | Female |
| 5 to 17 Years | 0 (0.0%) | 0 (0.0%) |
| 18 to 34 Years | 0 (0.0%) | 11 (57.9%) |
| 35 to 64 Years | 0 (0.0%) | 0 (0.0%) |
| 65 to 74 Years | 0 (0.0%) | 0 (0.0%) |
| 75 Years and over | 0 (0.0%) | 0 (0.0%) |
Disability Class: Self-Care Difficulty
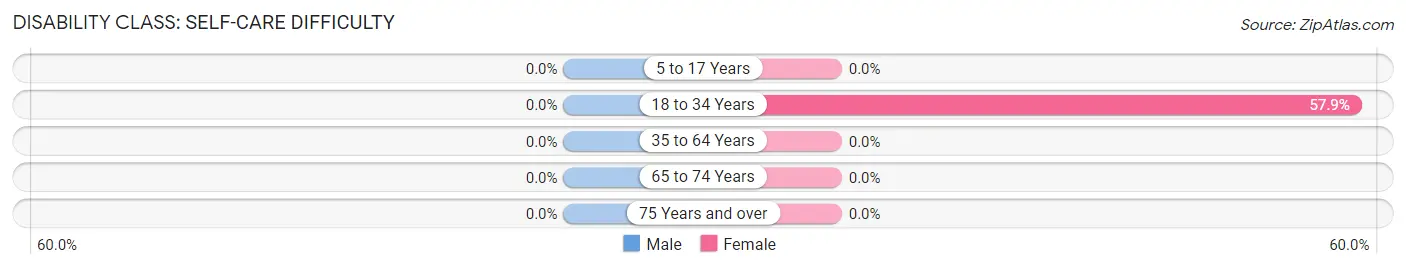
| Age Bracket | Male | Female |
| 5 to 17 Years | 0 (0.0%) | 0 (0.0%) |
| 18 to 34 Years | 0 (0.0%) | 11 (57.9%) |
| 35 to 64 Years | 0 (0.0%) | 0 (0.0%) |
| 65 to 74 Years | 0 (0.0%) | 0 (0.0%) |
| 75 Years and over | 0 (0.0%) | 0 (0.0%) |
Technology Access in Sunset Bay
Computing Device Access in Sunset Bay
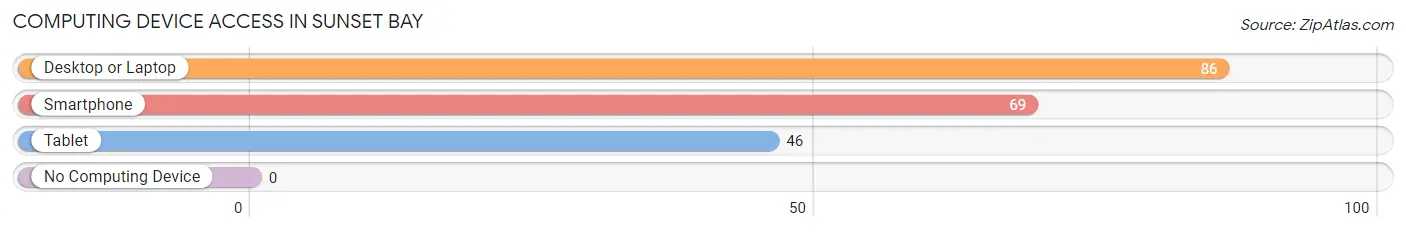
| Device Type | # Households | % Households |
| Desktop or Laptop | 86 | 82.7% |
| Smartphone | 69 | 66.3% |
| Tablet | 46 | 44.2% |
| No Computing Device | 0 | 0.0% |
| Total | 104 | 100.0% |
Internet Access in Sunset Bay
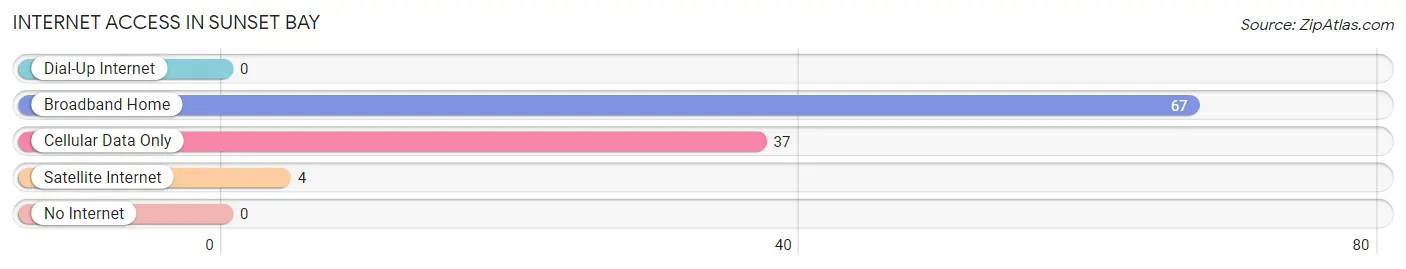
| Internet Type | # Households | % Households |
| Dial-Up Internet | 0 | 0.0% |
| Broadband Home | 67 | 64.4% |
| Cellular Data Only | 37 | 35.6% |
| Satellite Internet | 4 | 3.8% |
| No Internet | 0 | 0.0% |
| Total | 104 | 100.0% |
Sunset Bay Summary
Sunset Bay, NY is a small town located in the western part of New York State, on the shores of Lake Ontario. It is part of the Niagara County region and is situated between the cities of Buffalo and Rochester. The town has a population of approximately 2,500 people and is known for its picturesque views of the lake and its quaint, small-town atmosphere.
History
Sunset Bay was first settled in the early 1800s by a group of settlers from the nearby town of Lockport. The settlers were attracted to the area due to its proximity to Lake Ontario and the abundance of natural resources. The town was originally known as “Sunset Bay” due to its location on the western shore of the lake. The town was officially incorporated in 1845 and has remained a small, rural community ever since.
Geography
Sunset Bay is located in the western part of New York State, on the shores of Lake Ontario. The town is situated between the cities of Buffalo and Rochester and is part of the Niagara County region. The town is bordered by the towns of Lockport to the north, Newfane to the east, and Wilson to the south. The town is situated on a flat plain, with the lake to the west and the Niagara River to the east.
Economy
Sunset Bay’s economy is largely based on tourism and agriculture. The town is home to several small businesses, including restaurants, shops, and a marina. The town also has a small fishing industry, with several local fishermen selling their catches to local restaurants and markets. The town is also home to several wineries, which produce a variety of wines from local grapes.
Demographics
As of the 2010 census, the population of Sunset Bay was 2,500 people. The town is predominantly white, with a small minority population of African Americans, Hispanics, and Asians. The median household income in the town is $45,000, and the median home value is $150,000. The town has a high rate of homeownership, with nearly 80% of residents owning their own homes.
Sunset Bay is a small, rural town with a rich history and a unique atmosphere. The town is known for its picturesque views of the lake and its quaint, small-town atmosphere. The town’s economy is largely based on tourism and agriculture, and the town is home to several small businesses, wineries, and fishermen. The town has a population of approximately 2,500 people, with a predominantly white population and a small minority population.
Common Questions
What is Per Capita Income in Sunset Bay?
Per Capita income in Sunset Bay is $26,115.
What is the Median Family Income in Sunset Bay?
Median Family Income in Sunset Bay is $132,188.
What is Inequality or Gini Index in Sunset Bay?
Inequality or Gini Index in Sunset Bay is 0.36.
What is the Total Population of Sunset Bay?
Total Population of Sunset Bay is 366.
What is the Total Male Population of Sunset Bay?
Total Male Population of Sunset Bay is 196.
What is the Total Female Population of Sunset Bay?
Total Female Population of Sunset Bay is 170.
What is the Ratio of Males per 100 Females in Sunset Bay?
There are 115.29 Males per 100 Females in Sunset Bay.
What is the Ratio of Females per 100 Males in Sunset Bay?
There are 86.73 Females per 100 Males in Sunset Bay.
What is the Median Population Age in Sunset Bay?
Median Population Age in Sunset Bay is 59.8 Years.
What is the Average Family Size in Sunset Bay
Average Family Size in Sunset Bay is 3.0 People.
What is the Average Household Size in Sunset Bay
Average Household Size in Sunset Bay is 2.0 People.
How Large is the Labor Force in Sunset Bay?
There are 97 People in the Labor Forcein in Sunset Bay.
What is the Percentage of People in the Labor Force in Sunset Bay?
29.0% of People are in the Labor Force in Sunset Bay.
What is the Unemployment Rate in Sunset Bay?
Unemployment Rate in Sunset Bay is 12.4%.