Zip Codes with the Highest Percentage of Population Employed in Health Diagnosing & Treating in Haverhill, MA
RELATED REPORTS & OPTIONS
Health Diagnosing & Treating
Haverhill
Compare Zip Codes
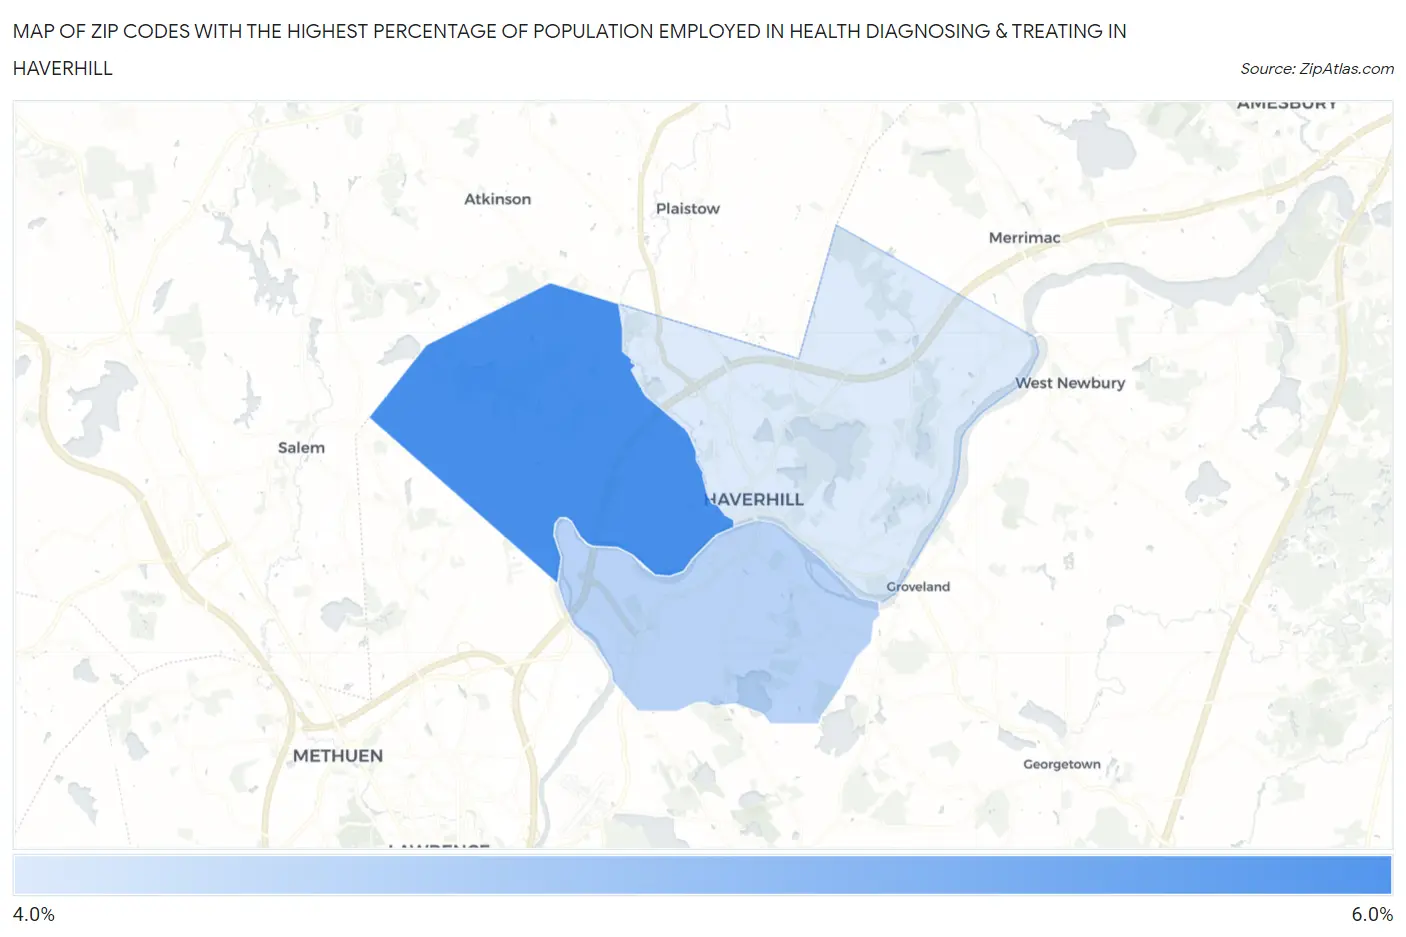
Map of Zip Codes with the Highest Percentage of Population Employed in Health Diagnosing & Treating in Haverhill
4.8%
5.9%
Zip Codes with the Highest Percentage of Population Employed in Health Diagnosing & Treating in Haverhill, MA
| Zip Code | % Employed | vs State | vs National | |
| 1. | 01832 | 5.9% | 6.9%(-1.01)#339 | 6.2%(-0.350)#14,242 |
| 2. | 01835 | 5.0% | 6.9%(-1.87)#399 | 6.2%(-1.21)#17,556 |
| 3. | 01830 | 4.8% | 6.9%(-2.14)#418 | 6.2%(-1.48)#18,608 |
1
Common Questions
What are the Top Zip Codes with the Highest Percentage of Population Employed in Health Diagnosing & Treating in Haverhill, MA?
Top Zip Codes with the Highest Percentage of Population Employed in Health Diagnosing & Treating in Haverhill, MA are:
What zip code has the Highest Percentage of Population Employed in Health Diagnosing & Treating in Haverhill, MA?
01832 has the Highest Percentage of Population Employed in Health Diagnosing & Treating in Haverhill, MA with 5.9%.
What is the Percentage of Population Employed in Health Diagnosing & Treating in Haverhill, MA?
Percentage of Population Employed in Health Diagnosing & Treating in Haverhill is 5.3%.
What is the Percentage of Population Employed in Health Diagnosing & Treating in Massachusetts?
Percentage of Population Employed in Health Diagnosing & Treating in Massachusetts is 6.9%.
What is the Percentage of Population Employed in Health Diagnosing & Treating in the United States?
Percentage of Population Employed in Health Diagnosing & Treating in the United States is 6.2%.