Weweantic, MA Map & Demographics
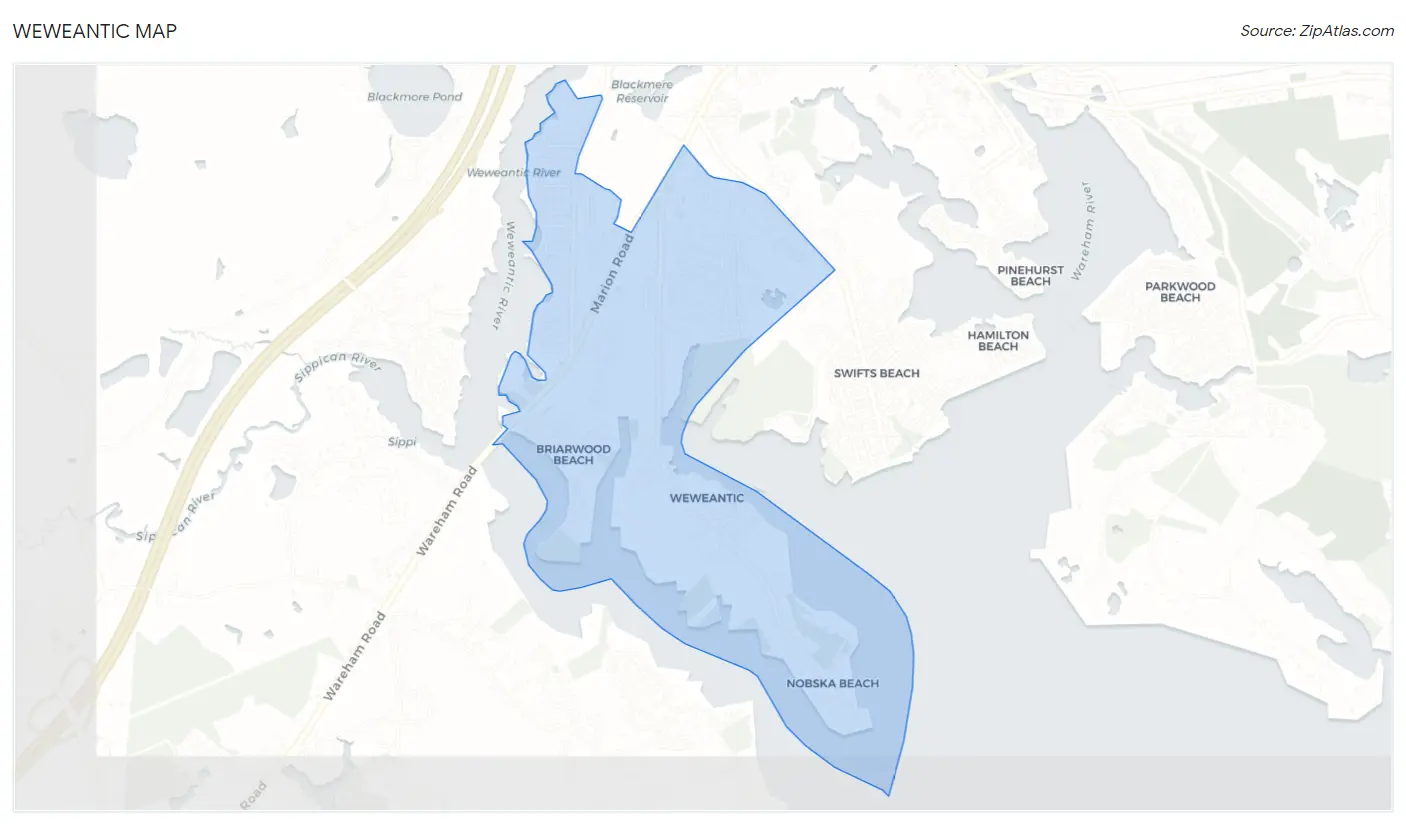
Weweantic Map
Weweantic Overview
$37,286
PER CAPITA INCOME
$66,375
AVG FAMILY INCOME
28.8%
WAGE / INCOME GAP [ % ]
71.2¢/ $1
WAGE / INCOME GAP [ $ ]
0.42
INEQUALITY / GINI INDEX
1,593
TOTAL POPULATION
852
MALE POPULATION
741
FEMALE POPULATION
114.98
MALES / 100 FEMALES
86.97
FEMALES / 100 MALES
42.7
MEDIAN AGE
2.8
AVG FAMILY SIZE
2.3
AVG HOUSEHOLD SIZE
880
LABOR FORCE [ PEOPLE ]
65.1%
PERCENT IN LABOR FORCE
12.5%
UNEMPLOYMENT RATE
Income in Weweantic
Income Overview in Weweantic
| Characteristic | Number | Measure |
| Per Capita Income | 1,593 | $37,286 |
| Median Family Income | 501 | $66,375 |
| Mean Family Income | 501 | $92,808 |
| Median Household Income | 692 | $0 |
| Mean Household Income | 692 | $82,521 |
| Income Deficit | 501 | $0 |
| Wage / Income Gap (%) | 1,593 | 28.76% |
| Wage / Income Gap ($) | 1,593 | 71.24¢ per $1 |
| Gini / Inequality Index | 1,593 | 0.42 |
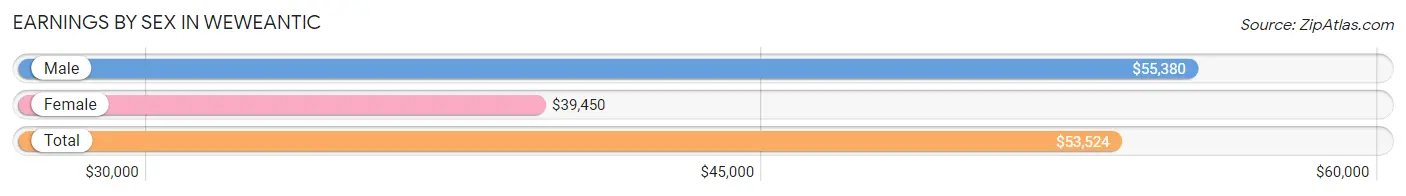
Earnings by Sex in Weweantic
Average Earnings in Weweantic are $53,524, $55,380 for men and $39,450 for women, a difference of 28.8%.
| Sex | Number | Average Earnings |
| Male | 426 (54.4%) | $55,380 |
| Female | 357 (45.6%) | $39,450 |
| Total | 783 (100.0%) | $53,524 |
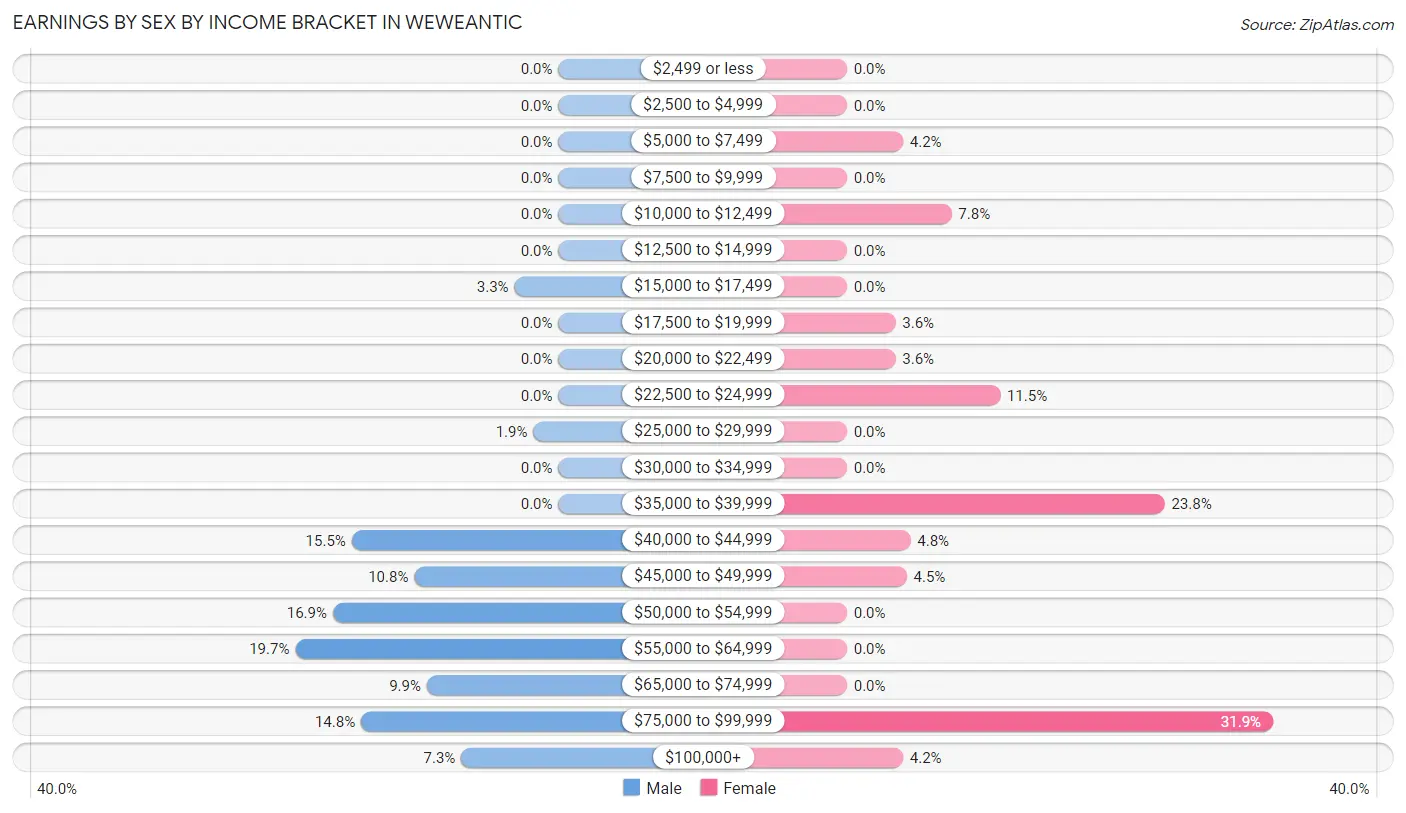
Earnings by Sex by Income Bracket in Weweantic
The most common earnings brackets in Weweantic are $55,000 to $64,999 for men (84 | 19.7%) and $75,000 to $99,999 for women (114 | 31.9%).
| Income | Male | Female |
| $2,499 or less | 0 (0.0%) | 0 (0.0%) |
| $2,500 to $4,999 | 0 (0.0%) | 0 (0.0%) |
| $5,000 to $7,499 | 0 (0.0%) | 15 (4.2%) |
| $7,500 to $9,999 | 0 (0.0%) | 0 (0.0%) |
| $10,000 to $12,499 | 0 (0.0%) | 28 (7.8%) |
| $12,500 to $14,999 | 0 (0.0%) | 0 (0.0%) |
| $15,000 to $17,499 | 14 (3.3%) | 0 (0.0%) |
| $17,500 to $19,999 | 0 (0.0%) | 13 (3.6%) |
| $20,000 to $22,499 | 0 (0.0%) | 13 (3.6%) |
| $22,500 to $24,999 | 0 (0.0%) | 41 (11.5%) |
| $25,000 to $29,999 | 8 (1.9%) | 0 (0.0%) |
| $30,000 to $34,999 | 0 (0.0%) | 0 (0.0%) |
| $35,000 to $39,999 | 0 (0.0%) | 85 (23.8%) |
| $40,000 to $44,999 | 66 (15.5%) | 17 (4.8%) |
| $45,000 to $49,999 | 46 (10.8%) | 16 (4.5%) |
| $50,000 to $54,999 | 72 (16.9%) | 0 (0.0%) |
| $55,000 to $64,999 | 84 (19.7%) | 0 (0.0%) |
| $65,000 to $74,999 | 42 (9.9%) | 0 (0.0%) |
| $75,000 to $99,999 | 63 (14.8%) | 114 (31.9%) |
| $100,000+ | 31 (7.3%) | 15 (4.2%) |
| Total | 426 (100.0%) | 357 (100.0%) |
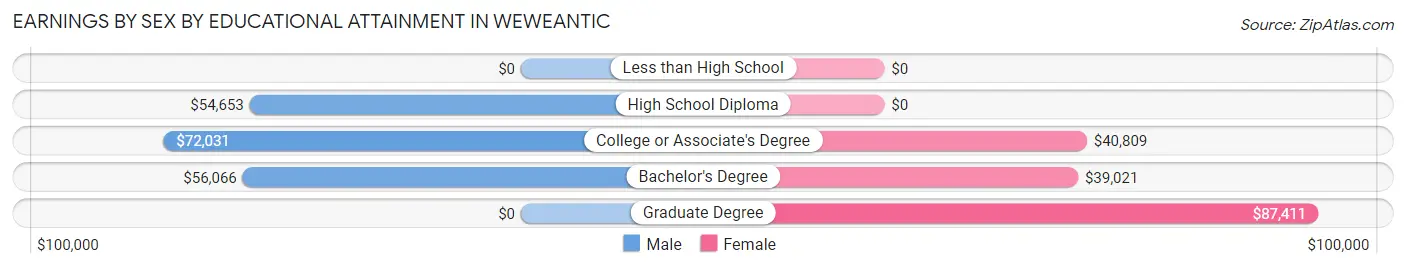
Earnings by Sex by Educational Attainment in Weweantic
Average earnings in Weweantic are $55,380 for men and $39,450 for women, a difference of 28.8%. Men with an educational attainment of college or associate's degree enjoy the highest average annual earnings of $72,031, while those with high school diploma education earn the least with $54,653. Women with an educational attainment of graduate degree earn the most with the average annual earnings of $87,411, while those with bachelor's degree education have the smallest earnings of $39,021.
| Educational Attainment | Male Income | Female Income |
| Less than High School | - | - |
| High School Diploma | $54,653 | $0 |
| College or Associate's Degree | $72,031 | $40,809 |
| Bachelor's Degree | $56,066 | $39,021 |
| Graduate Degree | - | - |
| Total | $55,380 | $39,450 |
Family Income in Weweantic
Family Income Brackets in Weweantic
According to the Weweantic family income data, there are 167 families falling into the $35,000 to $49,999 income range, which is the most common income bracket and makes up 33.3% of all families.
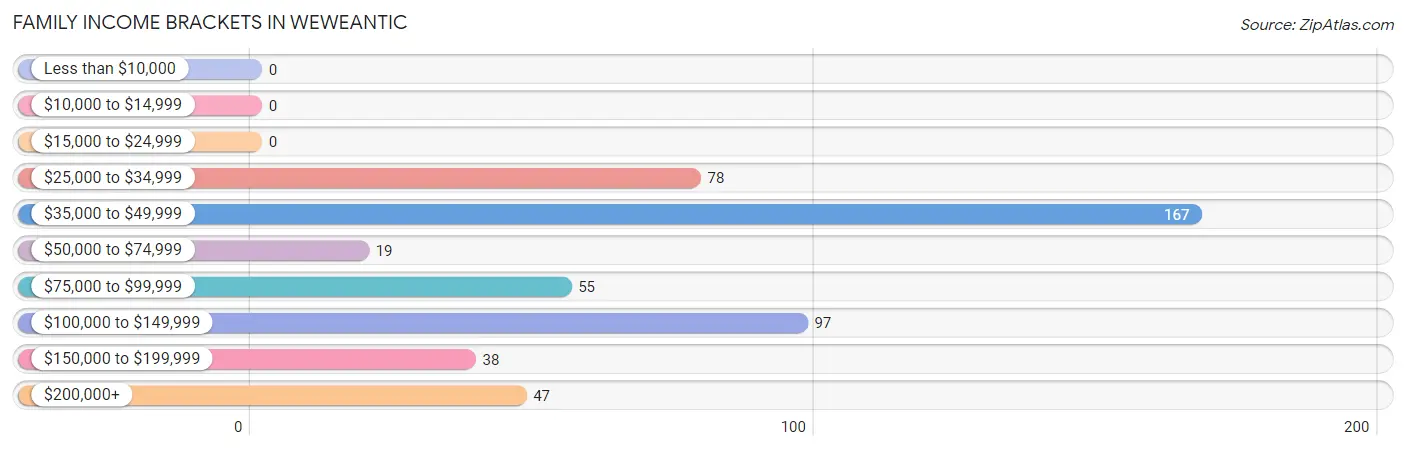
| Income Bracket | # Families | % Families |
| Less than $10,000 | 0 | 0.0% |
| $10,000 to $14,999 | 0 | 0.0% |
| $15,000 to $24,999 | 0 | 0.0% |
| $25,000 to $34,999 | 78 | 15.6% |
| $35,000 to $49,999 | 167 | 33.3% |
| $50,000 to $74,999 | 19 | 3.8% |
| $75,000 to $99,999 | 55 | 11.0% |
| $100,000 to $149,999 | 97 | 19.4% |
| $150,000 to $199,999 | 38 | 7.6% |
| $200,000+ | 47 | 9.4% |
Family Income by Famaliy Size in Weweantic
4-person families (36 | 7.2%) account for the highest median family income in Weweantic with $98,750 per family, while 2-person families (263 | 52.5%) have the highest median income of $41,562 per family member.
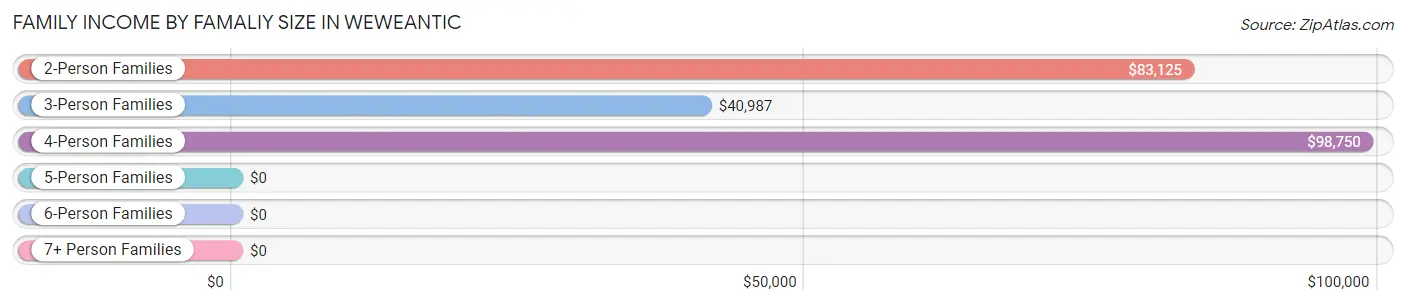
| Income Bracket | # Families | Median Income |
| 2-Person Families | 263 (52.5%) | $83,125 |
| 3-Person Families | 171 (34.1%) | $40,987 |
| 4-Person Families | 36 (7.2%) | $98,750 |
| 5-Person Families | 31 (6.2%) | $0 |
| 6-Person Families | 0 (0.0%) | $0 |
| 7+ Person Families | 0 (0.0%) | $0 |
| Total | 501 (100.0%) | $66,375 |
Family Income by Number of Earners in Weweantic
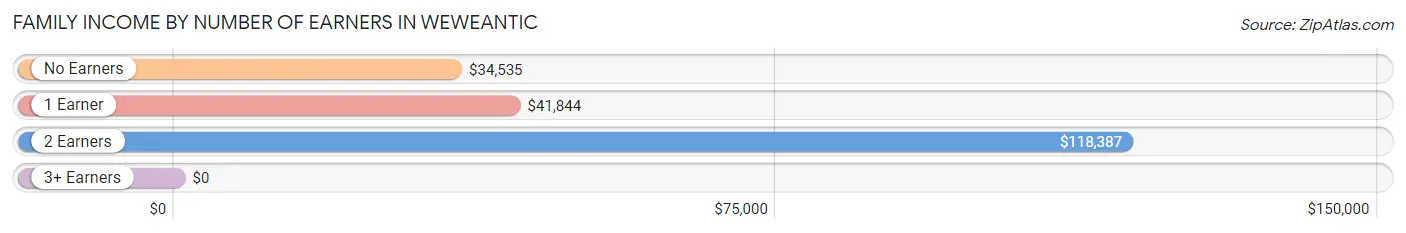
| Number of Earners | # Families | Median Income |
| No Earners | 127 (25.4%) | $34,535 |
| 1 Earner | 179 (35.7%) | $41,844 |
| 2 Earners | 164 (32.7%) | $118,387 |
| 3+ Earners | 31 (6.2%) | $0 |
| Total | 501 (100.0%) | $66,375 |
Household Income in Weweantic
Household Income Brackets in Weweantic
With 167 households falling in the category, the $35,000 to $49,999 income range is the most frequent in Weweantic, accounting for 24.1% of all households.
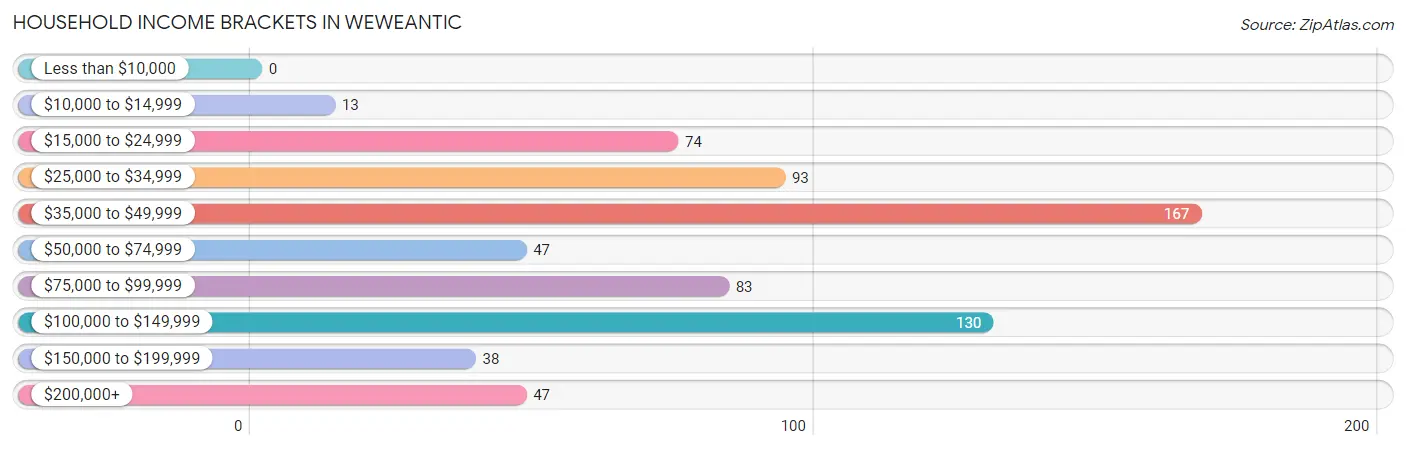
| Income Bracket | # Households | % Households |
| Less than $10,000 | 0 | 0.0% |
| $10,000 to $14,999 | 13 | 1.9% |
| $15,000 to $24,999 | 74 | 10.7% |
| $25,000 to $34,999 | 93 | 13.4% |
| $35,000 to $49,999 | 167 | 24.1% |
| $50,000 to $74,999 | 47 | 6.8% |
| $75,000 to $99,999 | 83 | 12.0% |
| $100,000 to $149,999 | 130 | 18.8% |
| $150,000 to $199,999 | 38 | 5.5% |
| $200,000+ | 47 | 6.8% |
Household Income by Householder Age in Weweantic
The median household income in Weweantic is $0, with the highest median household income of $107,326 found in the 45 to 64 years age bracket for the primary householder. A total of 235 households (34.0%) fall into this category.
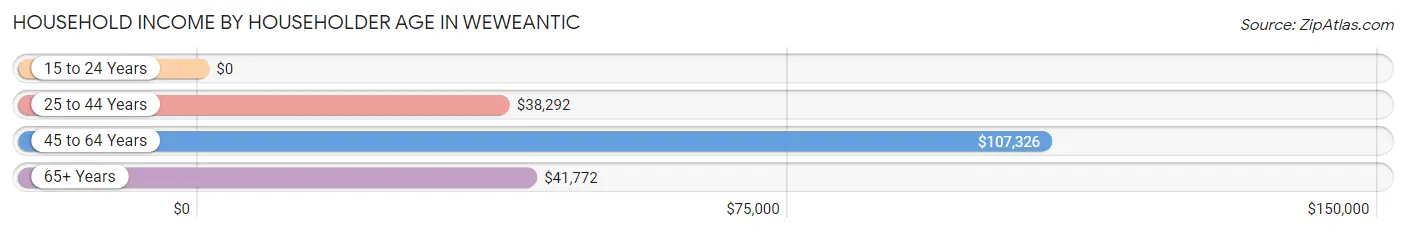
| Income Bracket | # Households | Median Income |
| 15 to 24 Years | 0 (0.0%) | $0 |
| 25 to 44 Years | 220 (31.8%) | $38,292 |
| 45 to 64 Years | 235 (34.0%) | $107,326 |
| 65+ Years | 237 (34.3%) | $41,772 |
| Total | 692 (100.0%) | $0 |
Poverty in Weweantic
Income Below Poverty by Sex and Age in Weweantic
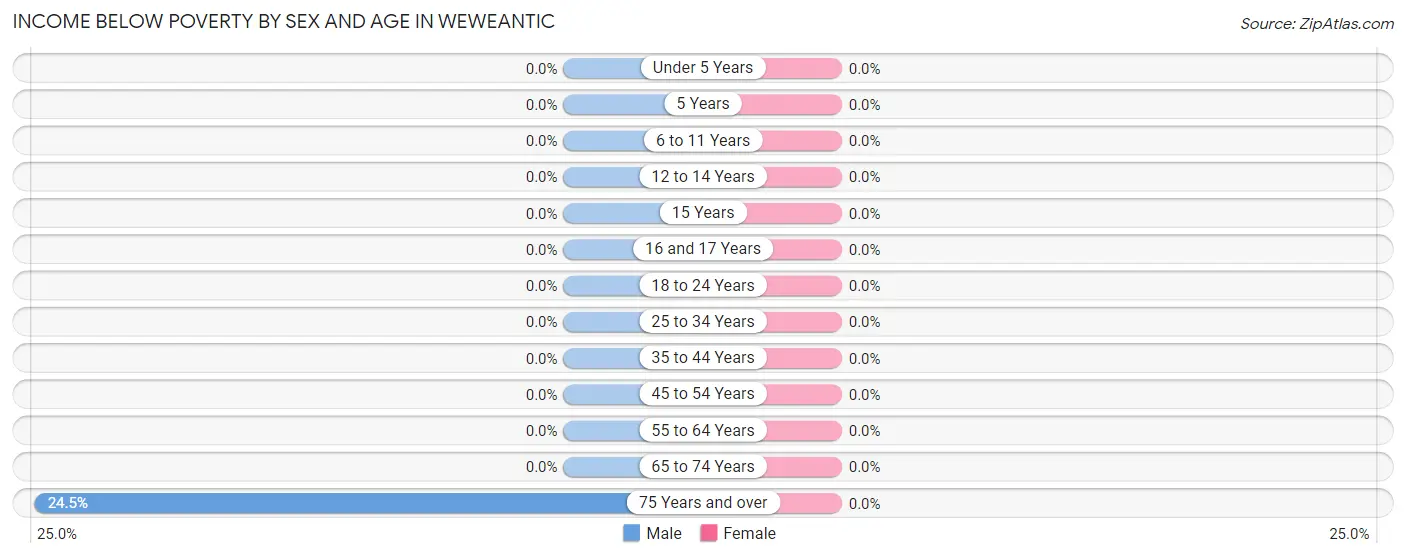
| Age Bracket | Male | Female |
| Under 5 Years | 0 (0.0%) | 0 (0.0%) |
| 5 Years | 0 (0.0%) | 0 (0.0%) |
| 6 to 11 Years | 0 (0.0%) | 0 (0.0%) |
| 12 to 14 Years | 0 (0.0%) | 0 (0.0%) |
| 15 Years | 0 (0.0%) | 0 (0.0%) |
| 16 and 17 Years | 0 (0.0%) | 0 (0.0%) |
| 18 to 24 Years | 0 (0.0%) | 0 (0.0%) |
| 25 to 34 Years | 0 (0.0%) | 0 (0.0%) |
| 35 to 44 Years | 0 (0.0%) | 0 (0.0%) |
| 45 to 54 Years | 0 (0.0%) | 0 (0.0%) |
| 55 to 64 Years | 0 (0.0%) | 0 (0.0%) |
| 65 to 74 Years | 0 (0.0%) | 0 (0.0%) |
| 75 Years and over | 13 (24.5%) | 0 (0.0%) |
| Total | 13 (1.5%) | 0 (0.0%) |
Income Above Poverty by Sex and Age in Weweantic
According to the poverty statistics in Weweantic, males aged under 5 years and females aged 6 to 11 years are the age groups that are most secure financially, with 100.0% of males and 100.0% of females in these age groups living above the poverty line.
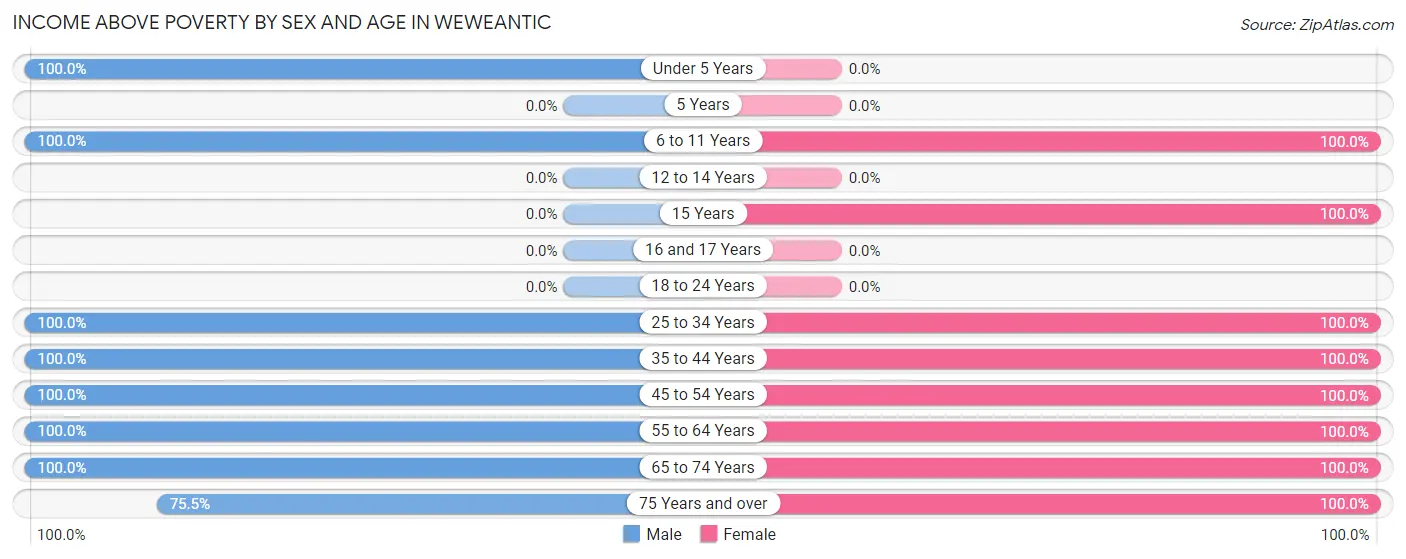
| Age Bracket | Male | Female |
| Under 5 Years | 40 (100.0%) | 0 (0.0%) |
| 5 Years | 0 (0.0%) | 0 (0.0%) |
| 6 to 11 Years | 100 (100.0%) | 86 (100.0%) |
| 12 to 14 Years | 0 (0.0%) | 0 (0.0%) |
| 15 Years | 0 (0.0%) | 16 (100.0%) |
| 16 and 17 Years | 0 (0.0%) | 0 (0.0%) |
| 18 to 24 Years | 0 (0.0%) | 0 (0.0%) |
| 25 to 34 Years | 192 (100.0%) | 65 (100.0%) |
| 35 to 44 Years | 142 (100.0%) | 214 (100.0%) |
| 45 to 54 Years | 74 (100.0%) | 34 (100.0%) |
| 55 to 64 Years | 182 (100.0%) | 123 (100.0%) |
| 65 to 74 Years | 69 (100.0%) | 119 (100.0%) |
| 75 Years and over | 40 (75.5%) | 84 (100.0%) |
| Total | 839 (98.5%) | 741 (100.0%) |
Income Below Poverty Among Married-Couple Families in Weweantic
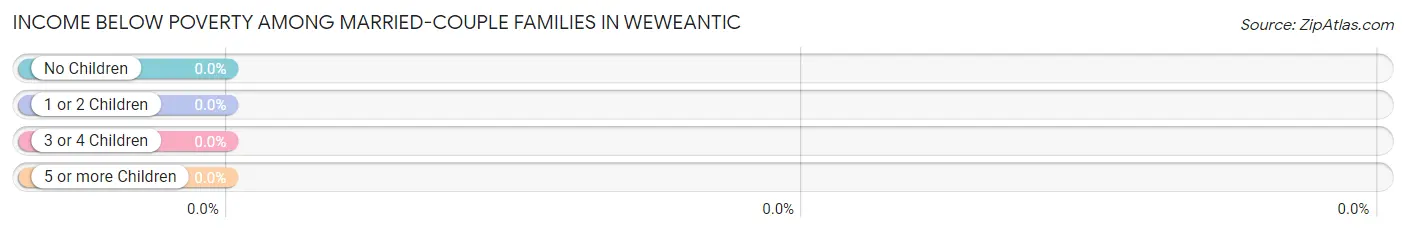
| Children | Above Poverty | Below Poverty |
| No Children | 239 (100.0%) | 0 (0.0%) |
| 1 or 2 Children | 118 (100.0%) | 0 (0.0%) |
| 3 or 4 Children | 0 (0.0%) | 0 (0.0%) |
| 5 or more Children | 0 (0.0%) | 0 (0.0%) |
| Total | 357 (100.0%) | 0 (0.0%) |
Income Below Poverty Among Single-Parent Households in Weweantic
| Children | Single Father | Single Mother |
| No Children | 0 (0.0%) | 0 (0.0%) |
| 1 or 2 Children | 0 (0.0%) | 0 (0.0%) |
| 3 or 4 Children | 0 (0.0%) | 0 (0.0%) |
| 5 or more Children | 0 (0.0%) | 0 (0.0%) |
| Total | 0 (0.0%) | 0 (0.0%) |
Income Below Poverty Among Married-Couple vs Single-Parent Households in Weweantic
| Children | Married-Couple Families | Single-Parent Households |
| No Children | 0 (0.0%) | 0 (0.0%) |
| 1 or 2 Children | 0 (0.0%) | 0 (0.0%) |
| 3 or 4 Children | 0 (0.0%) | 0 (0.0%) |
| 5 or more Children | 0 (0.0%) | 0 (0.0%) |
| Total | 0 (0.0%) | 0 (0.0%) |
Race in Weweantic
The most populous races in Weweantic are White / Caucasian (1,526 | 95.8%), Black / African American (34 | 2.1%), and Two or more Races (20 | 1.3%).
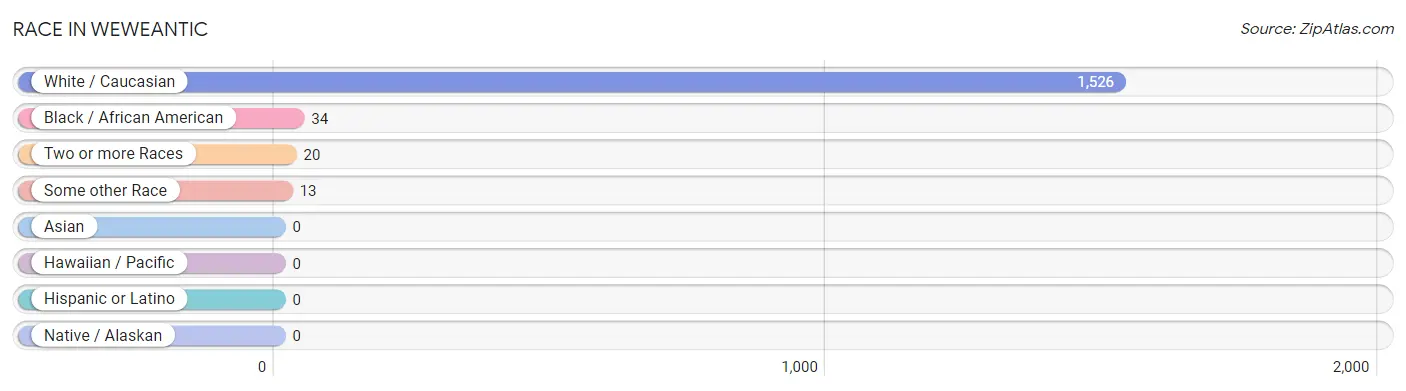
| Race | # Population | % Population |
| Asian | 0 | 0.0% |
| Black / African American | 34 | 2.1% |
| Hawaiian / Pacific | 0 | 0.0% |
| Hispanic or Latino | 0 | 0.0% |
| Native / Alaskan | 0 | 0.0% |
| White / Caucasian | 1,526 | 95.8% |
| Two or more Races | 20 | 1.3% |
| Some other Race | 13 | 0.8% |
| Total | 1,593 | 100.0% |
Ancestry in Weweantic
The most populous ancestries reported in Weweantic are Irish (470 | 29.5%), English (376 | 23.6%), Swedish (193 | 12.1%), American (187 | 11.7%), and French (166 | 10.4%), together accounting for 87.4% of all Weweantic residents.
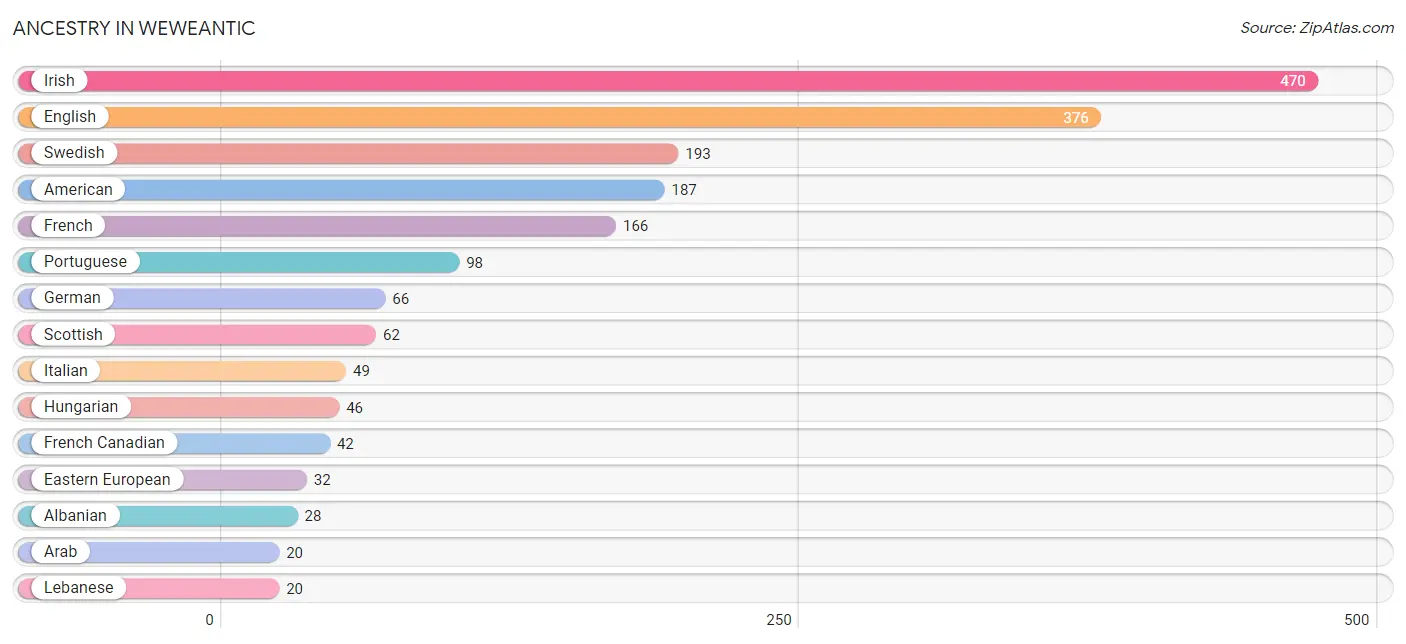
| Ancestry | # Population | % Population |
| Albanian | 28 | 1.8% |
| American | 187 | 11.7% |
| Arab | 20 | 1.3% |
| Canadian | 12 | 0.7% |
| Eastern European | 32 | 2.0% |
| English | 376 | 23.6% |
| French | 166 | 10.4% |
| French Canadian | 42 | 2.6% |
| German | 66 | 4.1% |
| Hungarian | 46 | 2.9% |
| Irish | 470 | 29.5% |
| Italian | 49 | 3.1% |
| Lebanese | 20 | 1.3% |
| Northern European | 14 | 0.9% |
| Polish | 10 | 0.6% |
| Portuguese | 98 | 6.1% |
| Scottish | 62 | 3.9% |
| Swedish | 193 | 12.1% |
| Ukrainian | 15 | 0.9% | View All 19 Rows |
Immigrants in Weweantic
The most numerous immigrant groups reported in Weweantic came from Europe (28 | 1.8%), Germany (28 | 1.8%), Western Europe (28 | 1.8%), Africa (20 | 1.3%), and Middle Africa (20 | 1.3%), together accounting for 7.8% of all Weweantic residents.
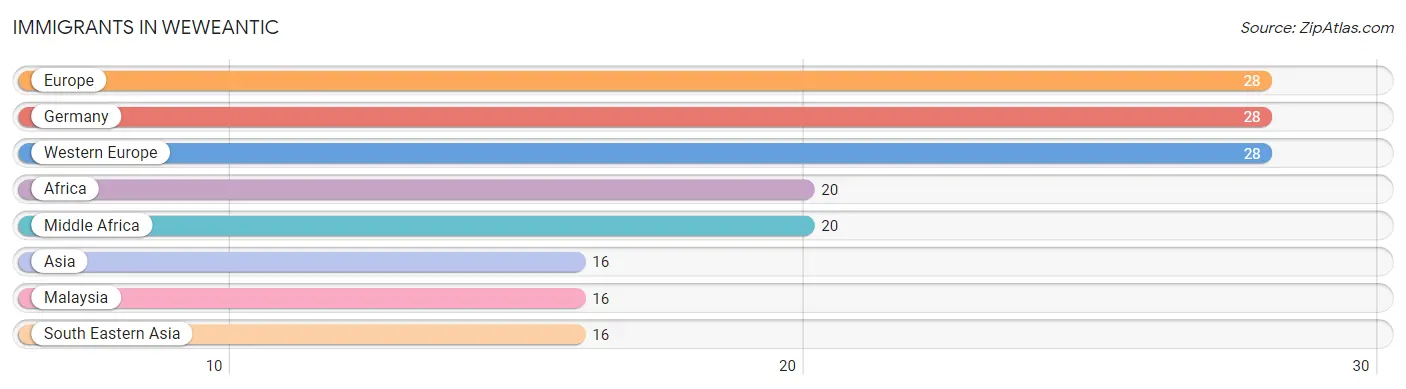
| Immigration Origin | # Population | % Population |
| Africa | 20 | 1.3% |
| Asia | 16 | 1.0% |
| Europe | 28 | 1.8% |
| Germany | 28 | 1.8% |
| Malaysia | 16 | 1.0% |
| Middle Africa | 20 | 1.3% |
| South Eastern Asia | 16 | 1.0% |
| Western Europe | 28 | 1.8% | View All 8 Rows |
Sex and Age in Weweantic
Sex and Age in Weweantic
The most populous age groups in Weweantic are 25 to 29 Years (130 | 15.3%) for men and 35 to 39 Years (164 | 22.1%) for women.
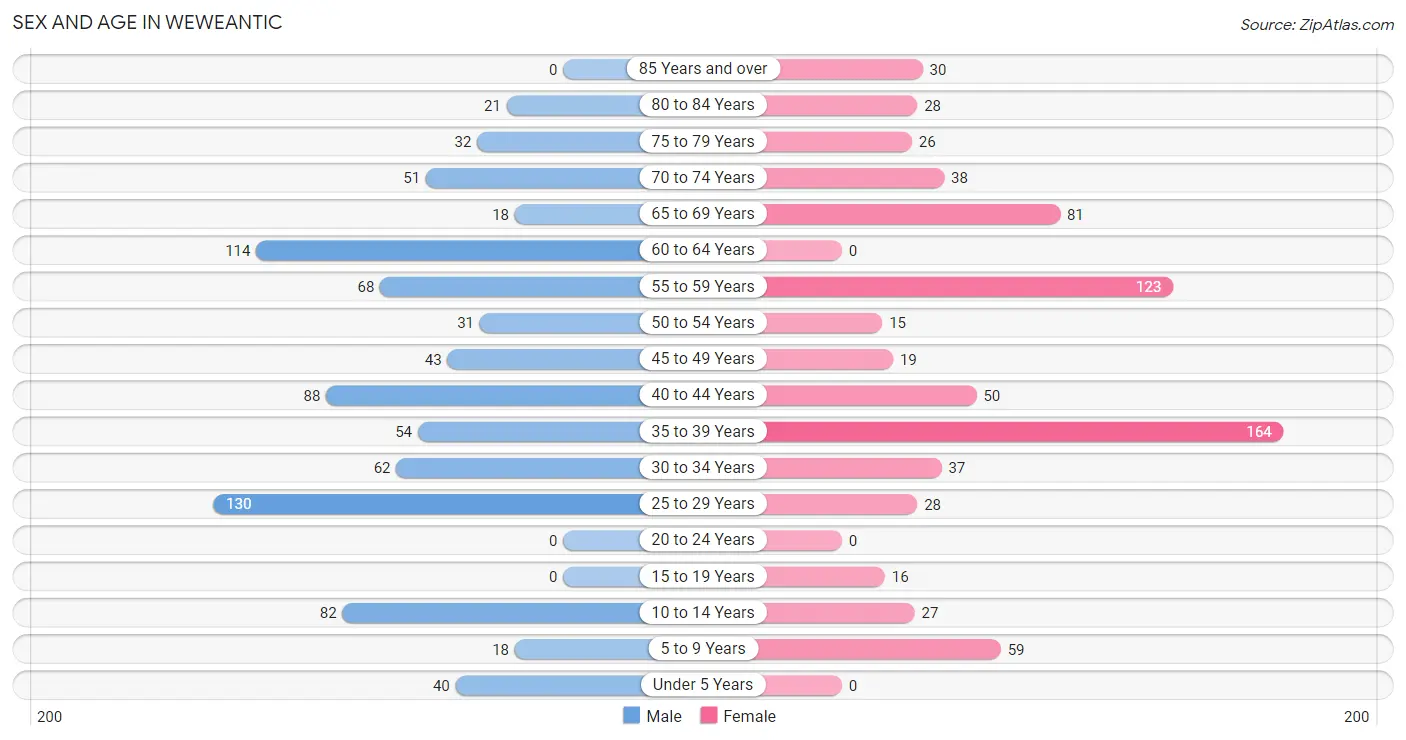
| Age Bracket | Male | Female |
| Under 5 Years | 40 (4.7%) | 0 (0.0%) |
| 5 to 9 Years | 18 (2.1%) | 59 (8.0%) |
| 10 to 14 Years | 82 (9.6%) | 27 (3.6%) |
| 15 to 19 Years | 0 (0.0%) | 16 (2.2%) |
| 20 to 24 Years | 0 (0.0%) | 0 (0.0%) |
| 25 to 29 Years | 130 (15.3%) | 28 (3.8%) |
| 30 to 34 Years | 62 (7.3%) | 37 (5.0%) |
| 35 to 39 Years | 54 (6.3%) | 164 (22.1%) |
| 40 to 44 Years | 88 (10.3%) | 50 (6.8%) |
| 45 to 49 Years | 43 (5.1%) | 19 (2.6%) |
| 50 to 54 Years | 31 (3.6%) | 15 (2.0%) |
| 55 to 59 Years | 68 (8.0%) | 123 (16.6%) |
| 60 to 64 Years | 114 (13.4%) | 0 (0.0%) |
| 65 to 69 Years | 18 (2.1%) | 81 (10.9%) |
| 70 to 74 Years | 51 (6.0%) | 38 (5.1%) |
| 75 to 79 Years | 32 (3.8%) | 26 (3.5%) |
| 80 to 84 Years | 21 (2.5%) | 28 (3.8%) |
| 85 Years and over | 0 (0.0%) | 30 (4.1%) |
| Total | 852 (100.0%) | 741 (100.0%) |
Families and Households in Weweantic
Median Family Size in Weweantic
The median family size in Weweantic is 2.75 persons per family, with married-couple families (357 | 71.3%) accounting for the largest median family size of 2.96 persons per family. On the other hand, single female/mother families (60 | 12.0%) represent the smallest median family size with 1.98 persons per family.
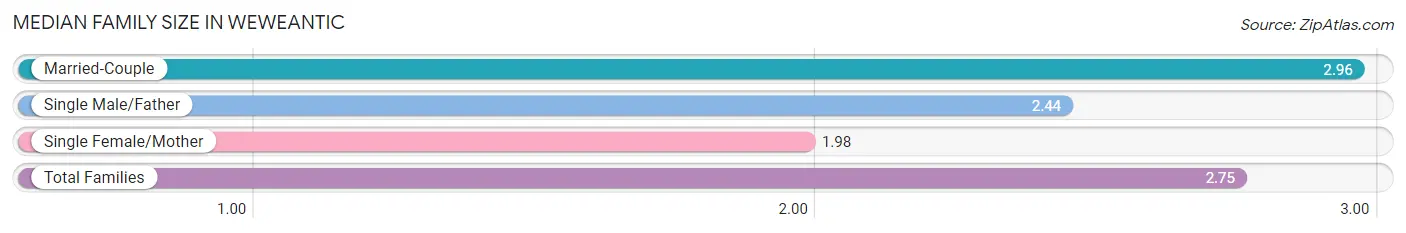
| Family Type | # Families | Family Size |
| Married-Couple | 357 (71.3%) | 2.96 |
| Single Male/Father | 84 (16.8%) | 2.44 |
| Single Female/Mother | 60 (12.0%) | 1.98 |
| Total Families | 501 (100.0%) | 2.75 |
Median Household Size in Weweantic
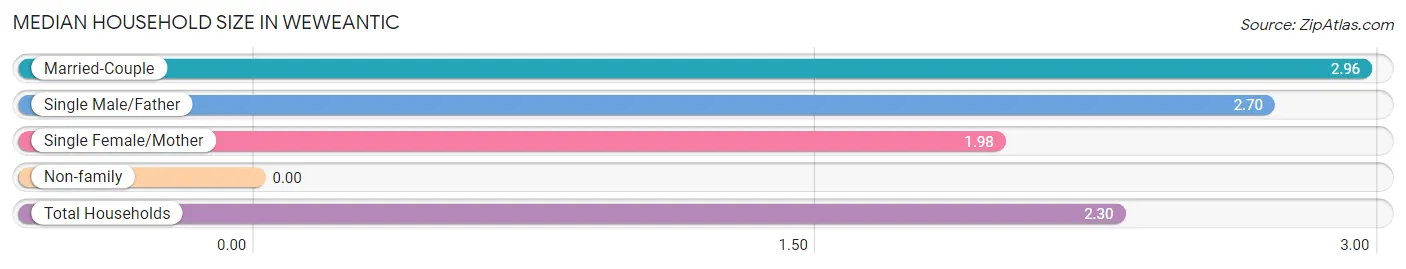
| Household Type | # Households | Household Size |
| Married-Couple | 357 (51.6%) | 2.96 |
| Single Male/Father | 84 (12.1%) | 2.70 |
| Single Female/Mother | 60 (8.7%) | 1.98 |
| Non-family | 191 (27.6%) | - |
| Total Households | 692 (100.0%) | 2.30 |
Household Size by Marriage Status in Weweantic
Out of a total of 692 households in Weweantic, 501 (72.4%) are family households, while 191 (27.6%) are nonfamily households. The most numerous type of family households are 2-person households, comprising 263, and the most common type of nonfamily households are 1-person households, comprising 191.
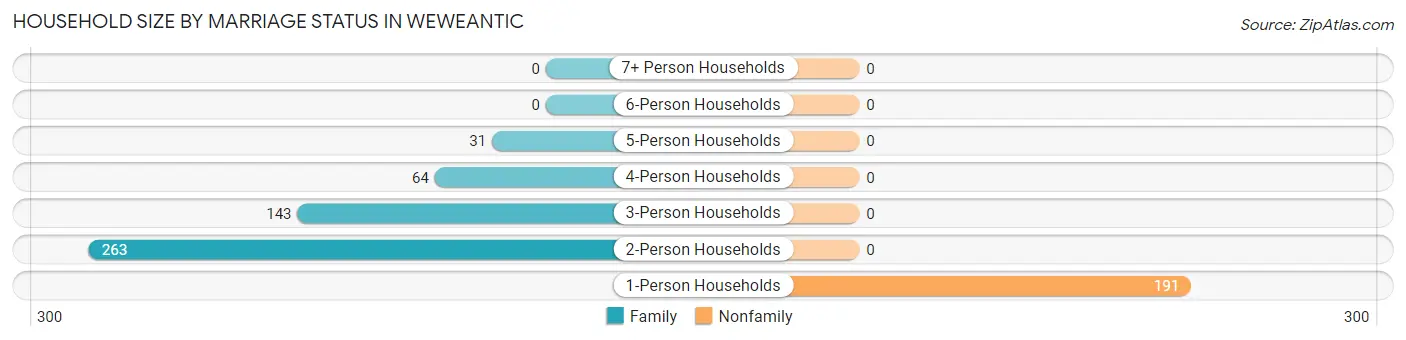
| Household Size | Family Households | Nonfamily Households |
| 1-Person Households | - | 191 (27.6%) |
| 2-Person Households | 263 (38.0%) | 0 (0.0%) |
| 3-Person Households | 143 (20.7%) | 0 (0.0%) |
| 4-Person Households | 64 (9.2%) | 0 (0.0%) |
| 5-Person Households | 31 (4.5%) | 0 (0.0%) |
| 6-Person Households | 0 (0.0%) | 0 (0.0%) |
| 7+ Person Households | 0 (0.0%) | 0 (0.0%) |
| Total | 501 (72.4%) | 191 (27.6%) |
Female Fertility in Weweantic
Fertility by Age in Weweantic
| Age Bracket | Women with Births | Births / 1,000 Women |
| 15 to 19 years | 0 (0.0%) | 0.0 |
| 20 to 34 years | 0 (0.0%) | 0.0 |
| 35 to 50 years | 0 (0.0%) | 0.0 |
| Total | 0 (0.0%) | 0.0 |
Fertility by Age by Marriage Status in Weweantic
| Age Bracket | Married | Unmarried |
| 15 to 19 years | 0 (0.0%) | 0 (0.0%) |
| 20 to 34 years | 0 (0.0%) | 0 (0.0%) |
| 35 to 50 years | 0 (0.0%) | 0 (0.0%) |
| Total | 0 (0.0%) | 0 (0.0%) |
Fertility by Education in Weweantic
| Educational Attainment | Women with Births | Births / 1,000 Women |
| Less than High School | 0 (0.0%) | 0.0 |
| High School Diploma | 0 (0.0%) | 0.0 |
| College or Associate's Degree | 0 (0.0%) | 0.0 |
| Bachelor's Degree | 0 (0.0%) | 0.0 |
| Graduate Degree | 0 (0.0%) | 0.0 |
| Total | 0 (0.0%) | 0.0 |
Fertility by Education by Marriage Status in Weweantic
| Educational Attainment | Married | Unmarried |
| Less than High School | 0 (0.0%) | 0 (0.0%) |
| High School Diploma | 0 (0.0%) | 0 (0.0%) |
| College or Associate's Degree | 0 (0.0%) | 0 (0.0%) |
| Bachelor's Degree | 0 (0.0%) | 0 (0.0%) |
| Graduate Degree | 0 (0.0%) | 0 (0.0%) |
| Total | 0 (0.0%) | 0 (0.0%) |
Employment Characteristics in Weweantic
Employment by Class of Employer in Weweantic
Among the 750 employed individuals in Weweantic, private company employees (495 | 66.0%), local government employees (123 | 16.4%), and self-employed (not incorporated) (77 | 10.3%) make up the most common classes of employment.
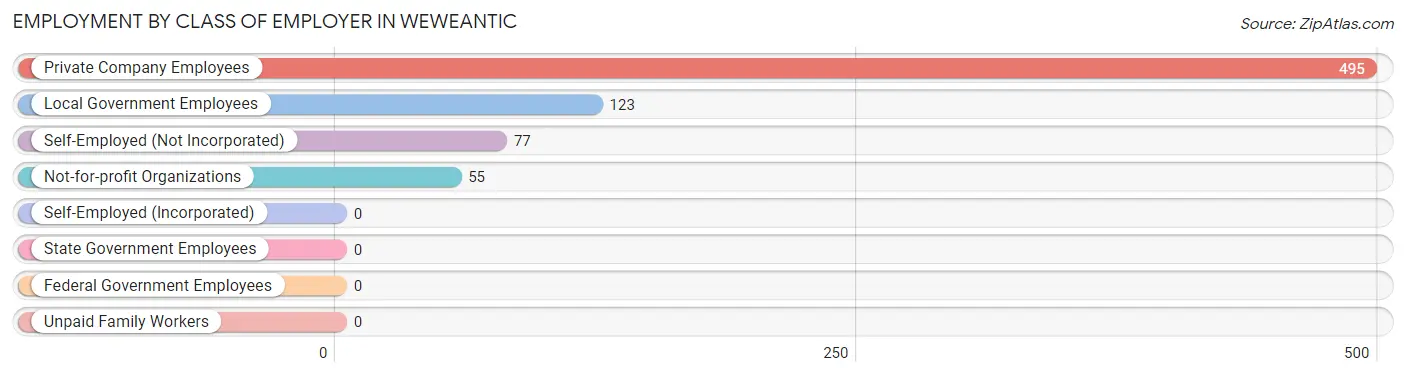
| Employer Class | # Employees | % Employees |
| Private Company Employees | 495 | 66.0% |
| Self-Employed (Incorporated) | 0 | 0.0% |
| Self-Employed (Not Incorporated) | 77 | 10.3% |
| Not-for-profit Organizations | 55 | 7.3% |
| Local Government Employees | 123 | 16.4% |
| State Government Employees | 0 | 0.0% |
| Federal Government Employees | 0 | 0.0% |
| Unpaid Family Workers | 0 | 0.0% |
| Total | 750 | 100.0% |
Employment Status by Age in Weweantic
According to the labor force statistics for Weweantic, out of the total population over 16 years of age (1,351), 65.1% or 880 individuals are in the labor force, with 12.5% or 110 of them unemployed. The age group with the highest labor force participation rate is 30 to 34 years, with 100.0% or 99 individuals in the labor force. Within the labor force, the 35 to 44 years age range has the highest percentage of unemployed individuals, with 30.0% or 78 of them being unemployed.
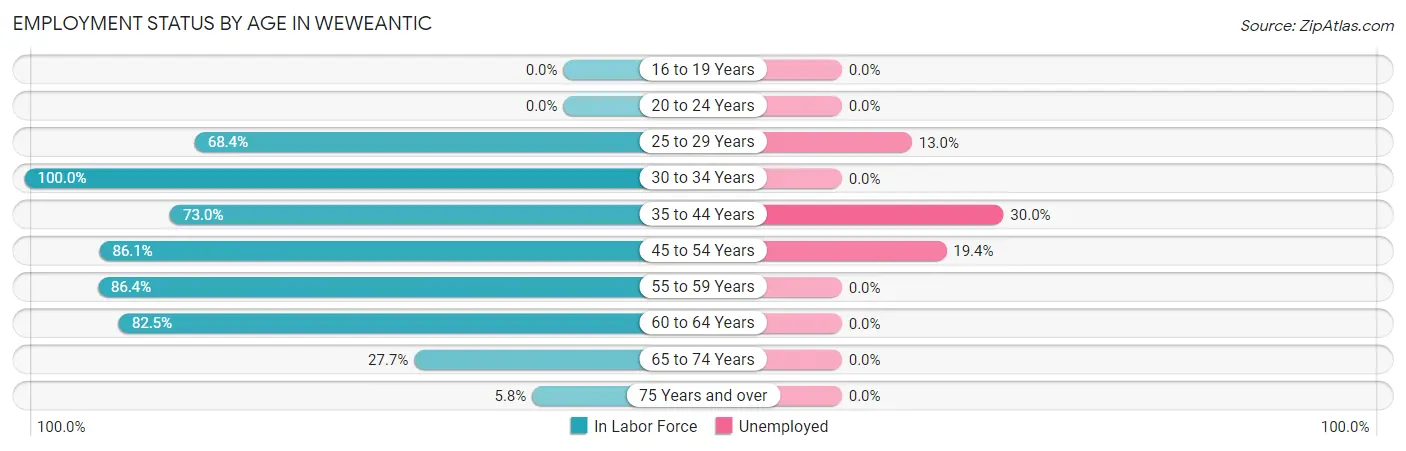
| Age Bracket | In Labor Force | Unemployed |
| 16 to 19 Years | 0 (0.0%) | 0 (0.0%) |
| 20 to 24 Years | 0 (0.0%) | 0 (0.0%) |
| 25 to 29 Years | 108 (68.4%) | 14 (13.0%) |
| 30 to 34 Years | 99 (100.0%) | 0 (0.0%) |
| 35 to 44 Years | 260 (73.0%) | 78 (30.0%) |
| 45 to 54 Years | 93 (86.1%) | 18 (19.4%) |
| 55 to 59 Years | 165 (86.4%) | 0 (0.0%) |
| 60 to 64 Years | 94 (82.5%) | 0 (0.0%) |
| 65 to 74 Years | 52 (27.7%) | 0 (0.0%) |
| 75 Years and over | 8 (5.8%) | 0 (0.0%) |
| Total | 880 (65.1%) | 110 (12.5%) |
Employment Status by Educational Attainment in Weweantic
According to labor force statistics for Weweantic, 79.8% of individuals (819) out of the total population between 25 and 64 years of age (1,026) are in the labor force, with 13.4% or 110 of them being unemployed. The group with the highest labor force participation rate are those with the educational attainment of college / associate degree, with 95.5% or 211 individuals in the labor force. Within the labor force, individuals with high school diploma education have the highest percentage of unemployment, with 32.3% or 96 of them being unemployed.
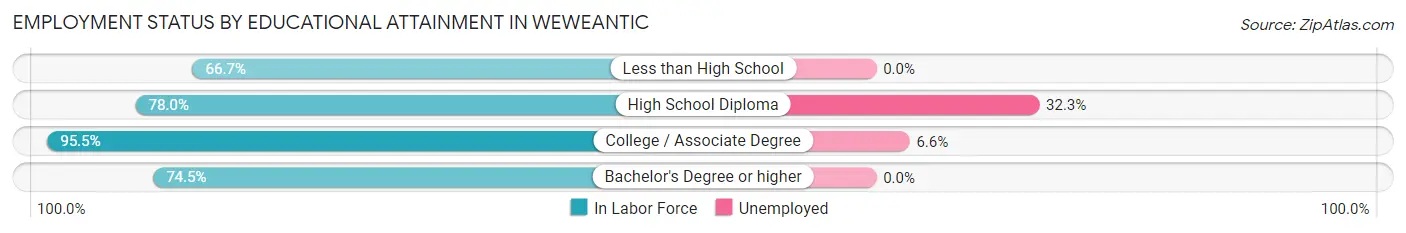
| Educational Attainment | In Labor Force | Unemployed |
| Less than High School | 40 (66.7%) | 0 (0.0%) |
| High School Diploma | 297 (78.0%) | 123 (32.3%) |
| College / Associate Degree | 211 (95.5%) | 15 (6.6%) |
| Bachelor's Degree or higher | 271 (74.5%) | 0 (0.0%) |
| Total | 819 (79.8%) | 137 (13.4%) |
Employment Occupations by Sex in Weweantic
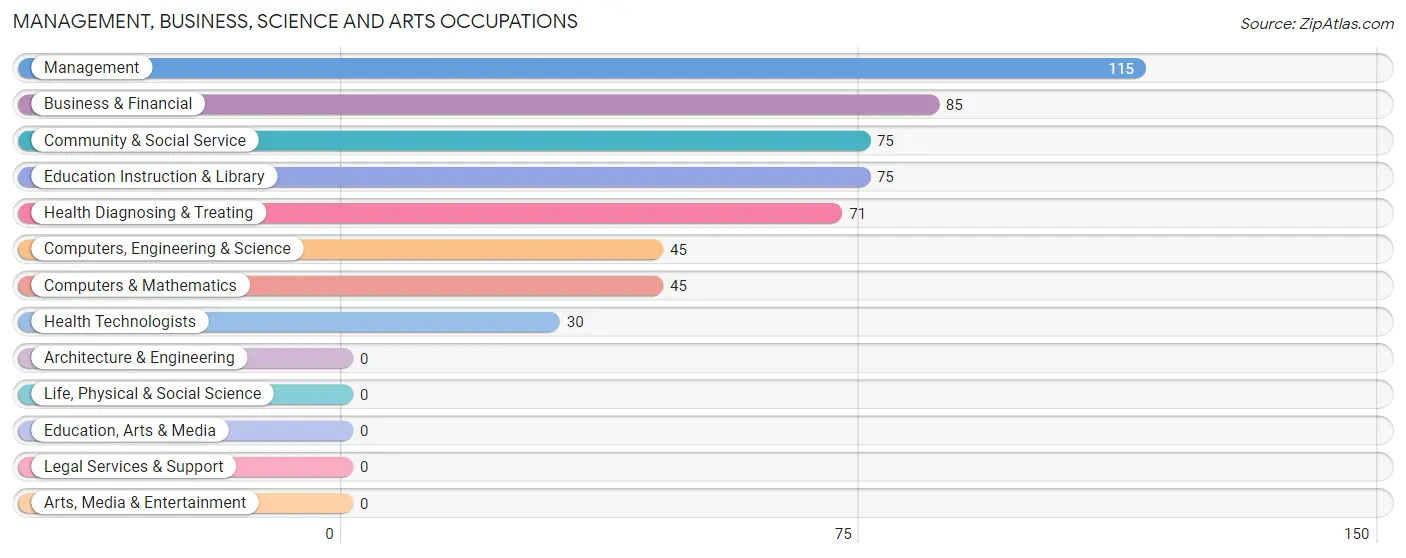
Management, Business, Science and Arts Occupations
The most common Management, Business, Science and Arts occupations in Weweantic are Management (115 | 14.9%), Business & Financial (85 | 11.1%), Community & Social Service (75 | 9.8%), Education Instruction & Library (75 | 9.8%), and Health Diagnosing & Treating (71 | 9.2%).
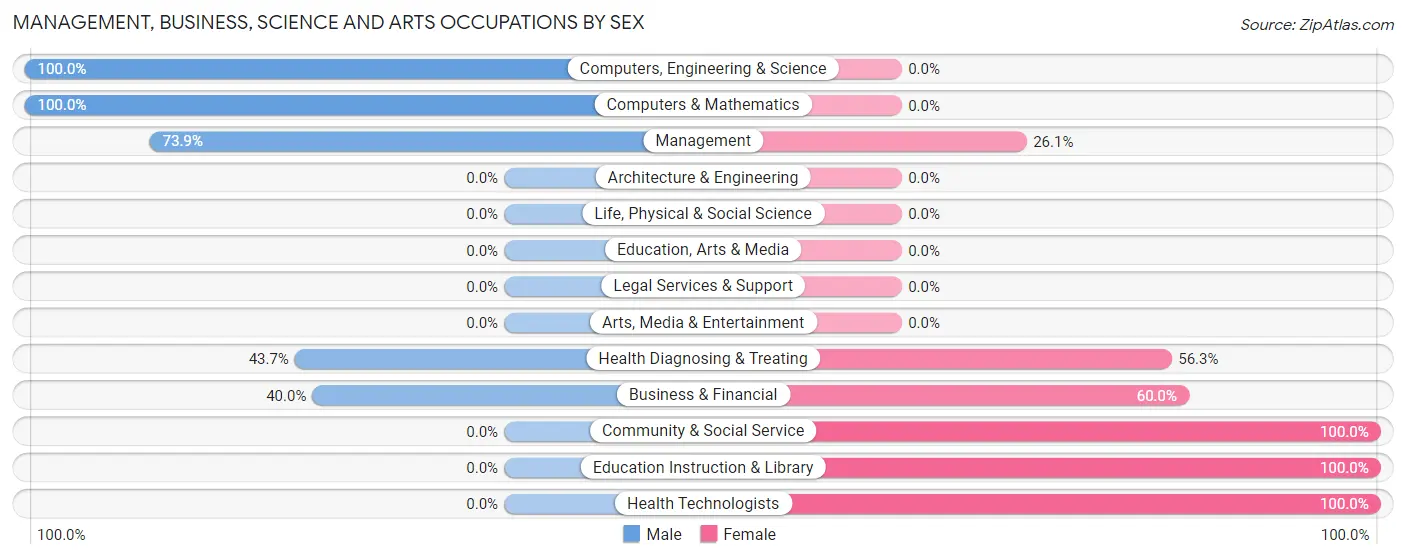
Management, Business, Science and Arts Occupations by Sex
Within the Management, Business, Science and Arts occupations in Weweantic, the most male-oriented occupations are Computers, Engineering & Science (100.0%), Computers & Mathematics (100.0%), and Management (73.9%), while the most female-oriented occupations are Community & Social Service (100.0%), Education Instruction & Library (100.0%), and Health Technologists (100.0%).
| Occupation | Male | Female |
| Management | 85 (73.9%) | 30 (26.1%) |
| Business & Financial | 34 (40.0%) | 51 (60.0%) |
| Computers, Engineering & Science | 45 (100.0%) | 0 (0.0%) |
| Computers & Mathematics | 45 (100.0%) | 0 (0.0%) |
| Architecture & Engineering | 0 (0.0%) | 0 (0.0%) |
| Life, Physical & Social Science | 0 (0.0%) | 0 (0.0%) |
| Community & Social Service | 0 (0.0%) | 75 (100.0%) |
| Education, Arts & Media | 0 (0.0%) | 0 (0.0%) |
| Legal Services & Support | 0 (0.0%) | 0 (0.0%) |
| Education Instruction & Library | 0 (0.0%) | 75 (100.0%) |
| Arts, Media & Entertainment | 0 (0.0%) | 0 (0.0%) |
| Health Diagnosing & Treating | 31 (43.7%) | 40 (56.3%) |
| Health Technologists | 0 (0.0%) | 30 (100.0%) |
| Total (Category) | 195 (49.9%) | 196 (50.1%) |
| Total (Overall) | 412 (53.6%) | 357 (46.4%) |
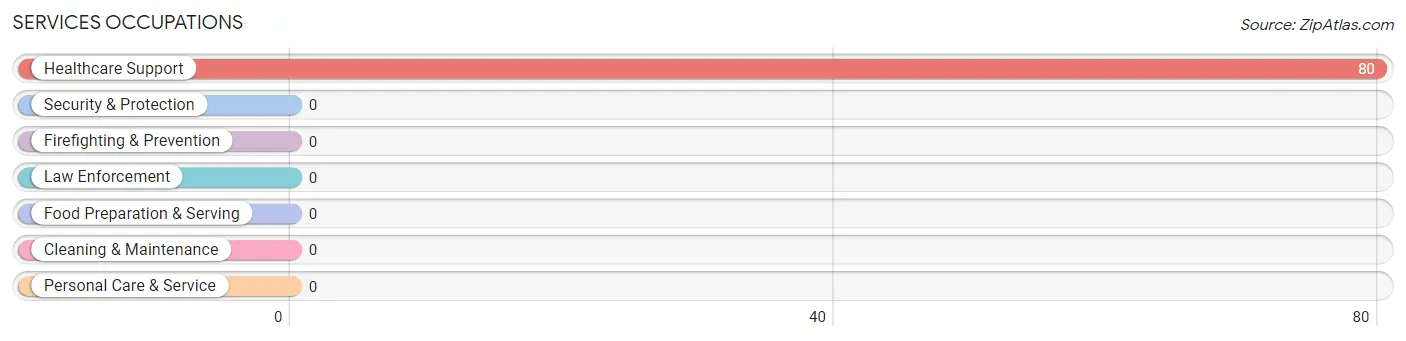
Services Occupations
The most common Services occupations in Weweantic are , and Healthcare Support (80 | 10.4%).
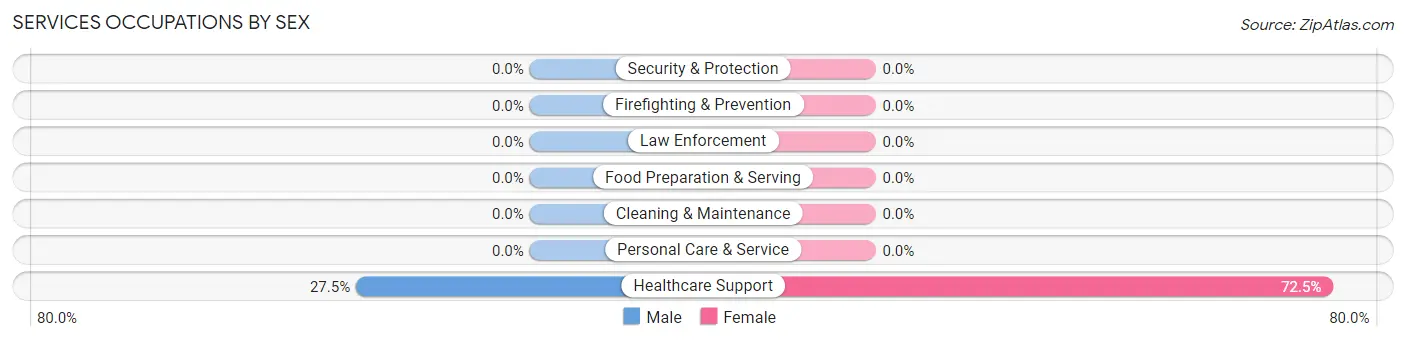
Services Occupations by Sex
| Occupation | Male | Female |
| Healthcare Support | 22 (27.5%) | 58 (72.5%) |
| Security & Protection | 0 (0.0%) | 0 (0.0%) |
| Firefighting & Prevention | 0 (0.0%) | 0 (0.0%) |
| Law Enforcement | 0 (0.0%) | 0 (0.0%) |
| Food Preparation & Serving | 0 (0.0%) | 0 (0.0%) |
| Cleaning & Maintenance | 0 (0.0%) | 0 (0.0%) |
| Personal Care & Service | 0 (0.0%) | 0 (0.0%) |
| Total (Category) | 22 (27.5%) | 58 (72.5%) |
| Total (Overall) | 412 (53.6%) | 357 (46.4%) |
Sales and Office Occupations
The most common Sales and Office occupations in Weweantic are Sales & Related (57 | 7.4%), and Office & Administration (51 | 6.6%).
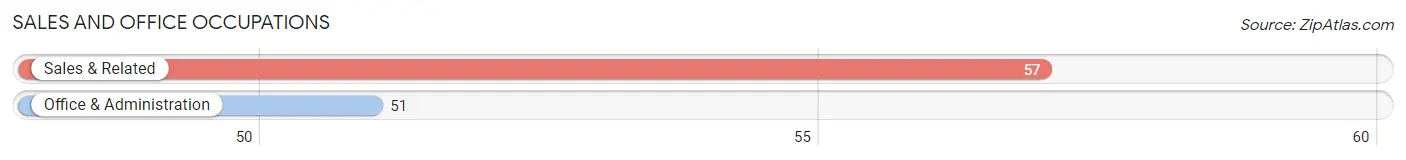
Sales and Office Occupations by Sex
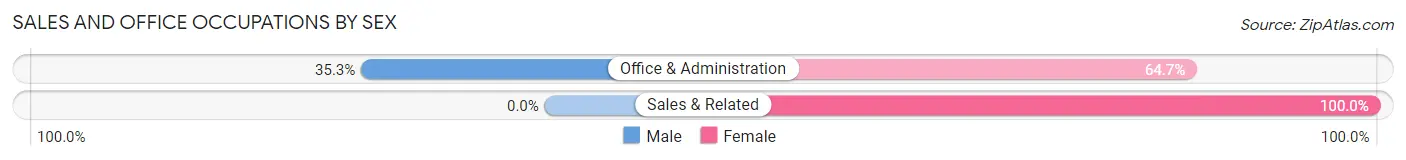
| Occupation | Male | Female |
| Sales & Related | 0 (0.0%) | 57 (100.0%) |
| Office & Administration | 18 (35.3%) | 33 (64.7%) |
| Total (Category) | 18 (16.7%) | 90 (83.3%) |
| Total (Overall) | 412 (53.6%) | 357 (46.4%) |
Natural Resources, Construction and Maintenance Occupations
The most common Natural Resources, Construction and Maintenance occupations in Weweantic are Construction & Extraction (112 | 14.6%), and Installation, Maintenance & Repair (45 | 5.9%).
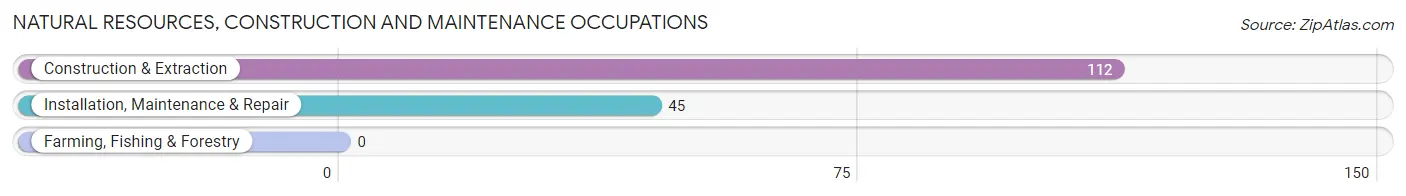
Natural Resources, Construction and Maintenance Occupations by Sex
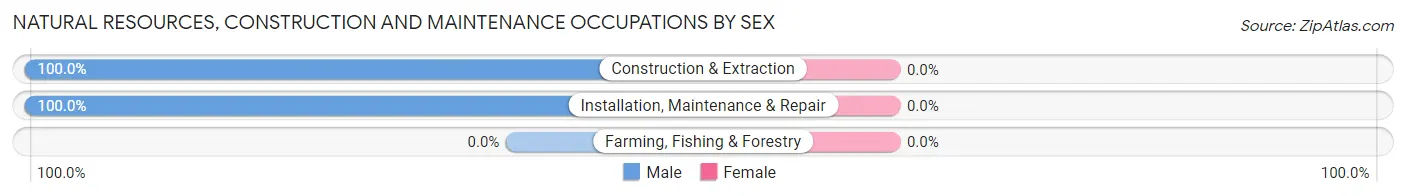
| Occupation | Male | Female |
| Farming, Fishing & Forestry | 0 (0.0%) | 0 (0.0%) |
| Construction & Extraction | 112 (100.0%) | 0 (0.0%) |
| Installation, Maintenance & Repair | 45 (100.0%) | 0 (0.0%) |
| Total (Category) | 157 (100.0%) | 0 (0.0%) |
| Total (Overall) | 412 (53.6%) | 357 (46.4%) |
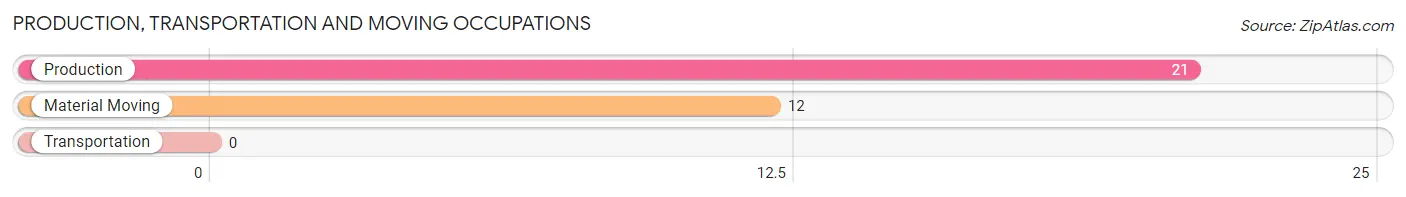
Production, Transportation and Moving Occupations
The most common Production, Transportation and Moving occupations in Weweantic are Production (21 | 2.7%), and Material Moving (12 | 1.6%).
Production, Transportation and Moving Occupations by Sex
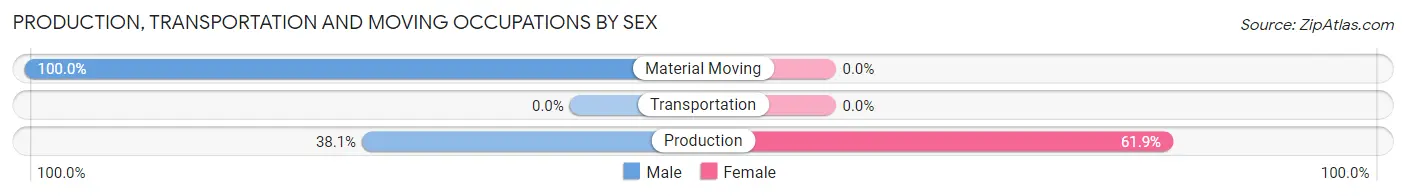
| Occupation | Male | Female |
| Production | 8 (38.1%) | 13 (61.9%) |
| Transportation | 0 (0.0%) | 0 (0.0%) |
| Material Moving | 12 (100.0%) | 0 (0.0%) |
| Total (Category) | 20 (60.6%) | 13 (39.4%) |
| Total (Overall) | 412 (53.6%) | 357 (46.4%) |
Employment Industries by Sex in Weweantic
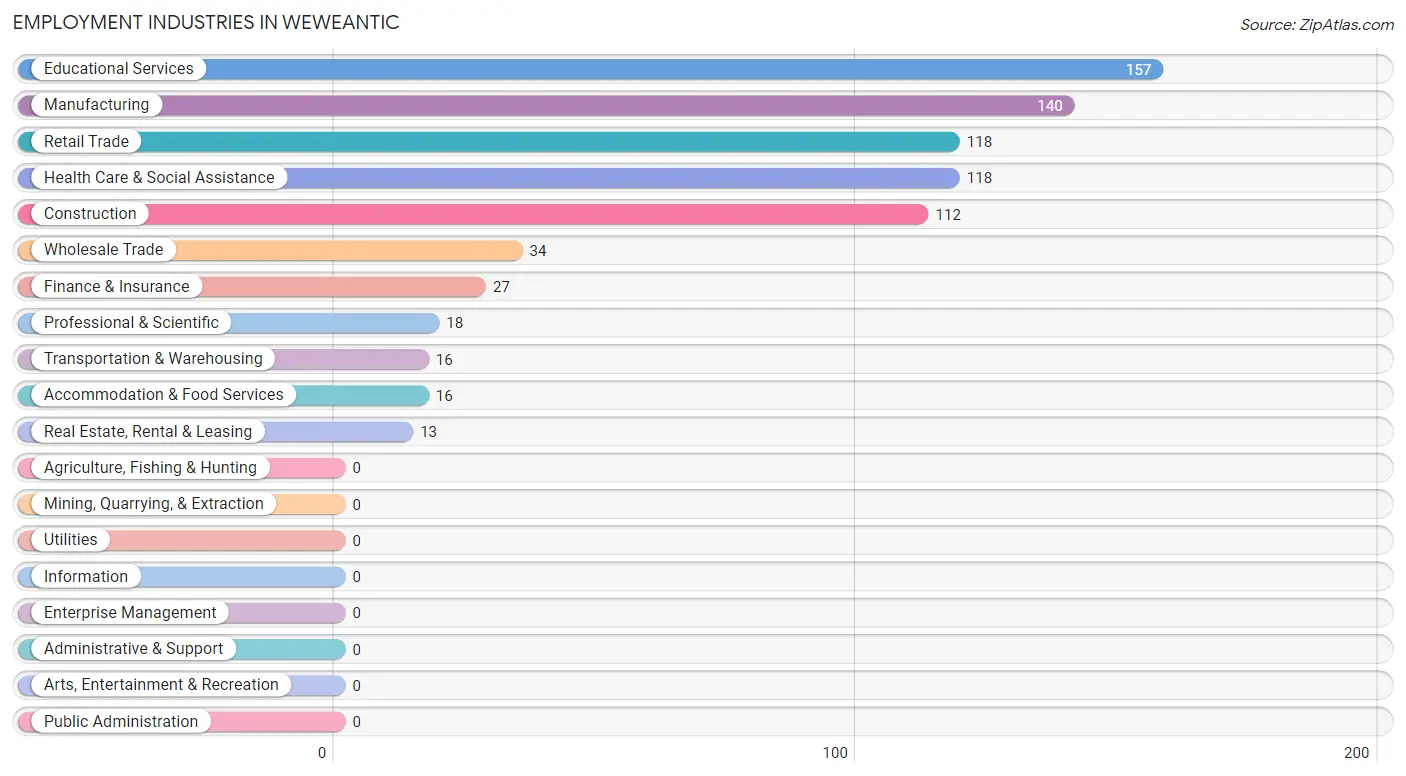
Employment Industries in Weweantic
The major employment industries in Weweantic include Educational Services (157 | 20.4%), Manufacturing (140 | 18.2%), Retail Trade (118 | 15.3%), Health Care & Social Assistance (118 | 15.3%), and Construction (112 | 14.6%).
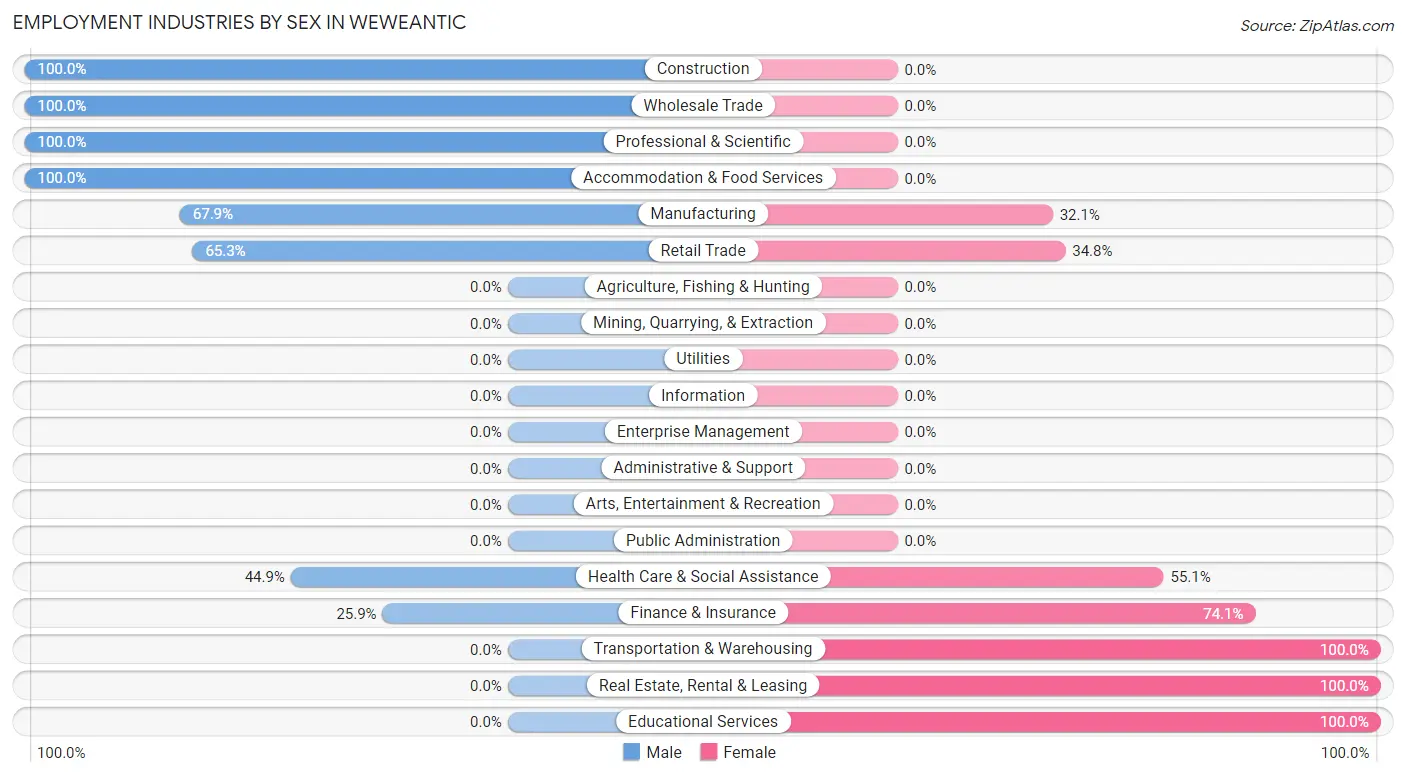
Employment Industries by Sex in Weweantic
The Weweantic industries that see more men than women are Construction (100.0%), Wholesale Trade (100.0%), and Professional & Scientific (100.0%), whereas the industries that tend to have a higher number of women are Transportation & Warehousing (100.0%), Real Estate, Rental & Leasing (100.0%), and Educational Services (100.0%).
| Industry | Male | Female |
| Agriculture, Fishing & Hunting | 0 (0.0%) | 0 (0.0%) |
| Mining, Quarrying, & Extraction | 0 (0.0%) | 0 (0.0%) |
| Construction | 112 (100.0%) | 0 (0.0%) |
| Manufacturing | 95 (67.9%) | 45 (32.1%) |
| Wholesale Trade | 34 (100.0%) | 0 (0.0%) |
| Retail Trade | 77 (65.2%) | 41 (34.7%) |
| Transportation & Warehousing | 0 (0.0%) | 16 (100.0%) |
| Utilities | 0 (0.0%) | 0 (0.0%) |
| Information | 0 (0.0%) | 0 (0.0%) |
| Finance & Insurance | 7 (25.9%) | 20 (74.1%) |
| Real Estate, Rental & Leasing | 0 (0.0%) | 13 (100.0%) |
| Professional & Scientific | 18 (100.0%) | 0 (0.0%) |
| Enterprise Management | 0 (0.0%) | 0 (0.0%) |
| Administrative & Support | 0 (0.0%) | 0 (0.0%) |
| Educational Services | 0 (0.0%) | 157 (100.0%) |
| Health Care & Social Assistance | 53 (44.9%) | 65 (55.1%) |
| Arts, Entertainment & Recreation | 0 (0.0%) | 0 (0.0%) |
| Accommodation & Food Services | 16 (100.0%) | 0 (0.0%) |
| Public Administration | 0 (0.0%) | 0 (0.0%) |
| Total | 412 (53.6%) | 357 (46.4%) |
Education in Weweantic
School Enrollment in Weweantic
The most common levels of schooling among the 246 students in Weweantic are elementary school (159 | 64.6%), graduate / professional (60 | 24.4%), and middle school (27 | 11.0%).
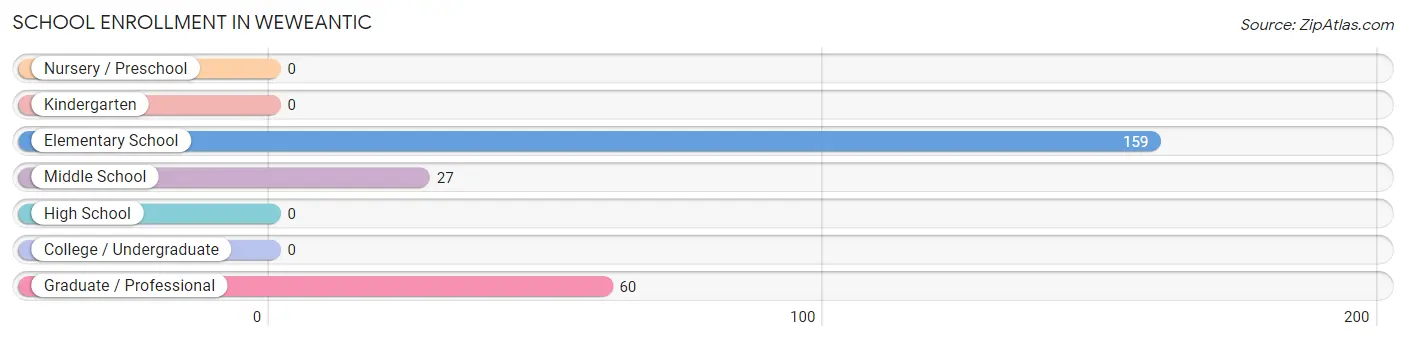
| School Level | # Students | % Students |
| Nursery / Preschool | 0 | 0.0% |
| Kindergarten | 0 | 0.0% |
| Elementary School | 159 | 64.6% |
| Middle School | 27 | 11.0% |
| High School | 0 | 0.0% |
| College / Undergraduate | 0 | 0.0% |
| Graduate / Professional | 60 | 24.4% |
| Total | 246 | 100.0% |
School Enrollment by Age by Funding Source in Weweantic
Out of a total of 246 students who are enrolled in schools in Weweantic, 60 (24.4%) attend a private institution, while the remaining 186 (75.6%) are enrolled in public schools. The age group of 35 years and over has the highest likelihood of being enrolled in private schools, with 60 (100.0% in the age bracket) enrolled. Conversely, the age group of 5 to 9 year old has the lowest likelihood of being enrolled in a private school, with 77 (100.0% in the age bracket) attending a public institution.
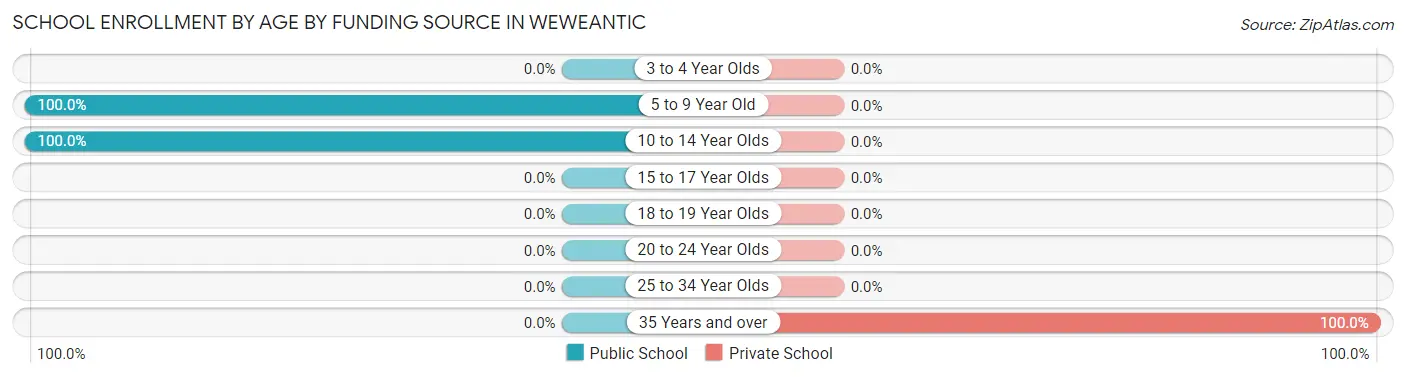
| Age Bracket | Public School | Private School |
| 3 to 4 Year Olds | 0 (0.0%) | 0 (0.0%) |
| 5 to 9 Year Old | 77 (100.0%) | 0 (0.0%) |
| 10 to 14 Year Olds | 109 (100.0%) | 0 (0.0%) |
| 15 to 17 Year Olds | 0 (0.0%) | 0 (0.0%) |
| 18 to 19 Year Olds | 0 (0.0%) | 0 (0.0%) |
| 20 to 24 Year Olds | 0 (0.0%) | 0 (0.0%) |
| 25 to 34 Year Olds | 0 (0.0%) | 0 (0.0%) |
| 35 Years and over | 0 (0.0%) | 60 (100.0%) |
| Total | 186 (75.6%) | 60 (24.4%) |
Educational Attainment by Field of Study in Weweantic
Education (103 | 22.4%), liberal arts & history (70 | 15.2%), science & technology (65 | 14.1%), business (60 | 13.0%), and computers & mathematics (56 | 12.2%) are the most common fields of study among 460 individuals in Weweantic who have obtained a bachelor's degree or higher.
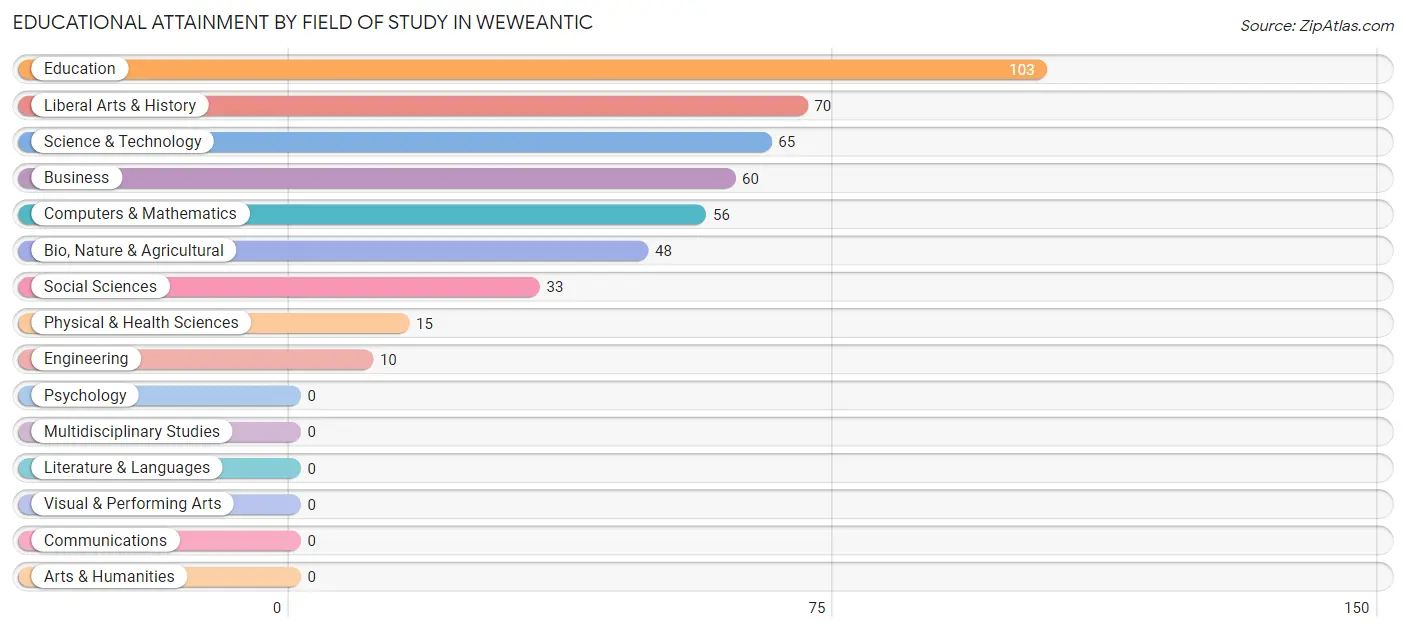
| Field of Study | # Graduates | % Graduates |
| Computers & Mathematics | 56 | 12.2% |
| Bio, Nature & Agricultural | 48 | 10.4% |
| Physical & Health Sciences | 15 | 3.3% |
| Psychology | 0 | 0.0% |
| Social Sciences | 33 | 7.2% |
| Engineering | 10 | 2.2% |
| Multidisciplinary Studies | 0 | 0.0% |
| Science & Technology | 65 | 14.1% |
| Business | 60 | 13.0% |
| Education | 103 | 22.4% |
| Literature & Languages | 0 | 0.0% |
| Liberal Arts & History | 70 | 15.2% |
| Visual & Performing Arts | 0 | 0.0% |
| Communications | 0 | 0.0% |
| Arts & Humanities | 0 | 0.0% |
| Total | 460 | 100.0% |
Transportation & Commute in Weweantic
Vehicle Availability by Sex in Weweantic
The most prevalent vehicle ownership categories in Weweantic are males with 5 or more vehicles (143, accounting for 34.7%) and females with 5 or more vehicles (31, making up 42.3%).
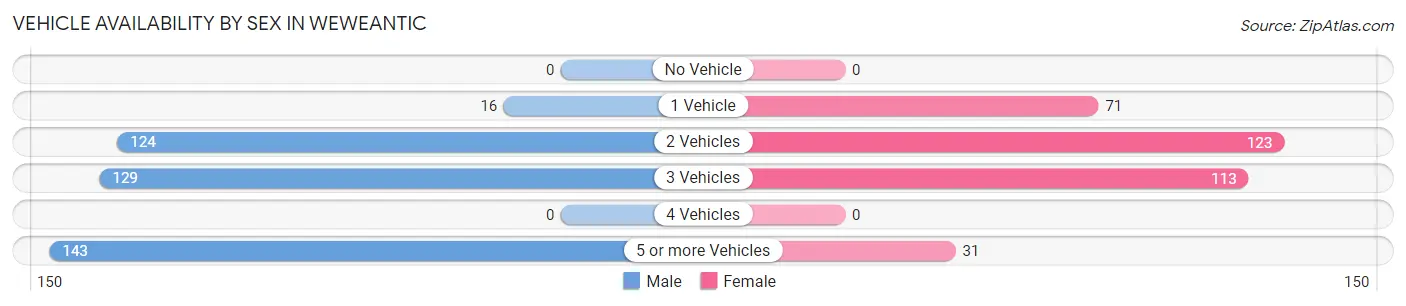
| Vehicles Available | Male | Female |
| No Vehicle | 0 (0.0%) | 0 (0.0%) |
| 1 Vehicle | 16 (3.9%) | 71 (21.0%) |
| 2 Vehicles | 124 (30.1%) | 123 (36.4%) |
| 3 Vehicles | 129 (31.3%) | 113 (33.4%) |
| 4 Vehicles | 0 (0.0%) | 0 (0.0%) |
| 5 or more Vehicles | 143 (34.7%) | 31 (9.2%) |
| Total | 412 (100.0%) | 338 (100.0%) |
Commute Time in Weweantic
The most frequently occuring commute durations in Weweantic are 10 to 14 minutes (176 commuters, 24.4%), 25 to 29 minutes (176 commuters, 24.4%), and 5 to 9 minutes (104 commuters, 14.4%).
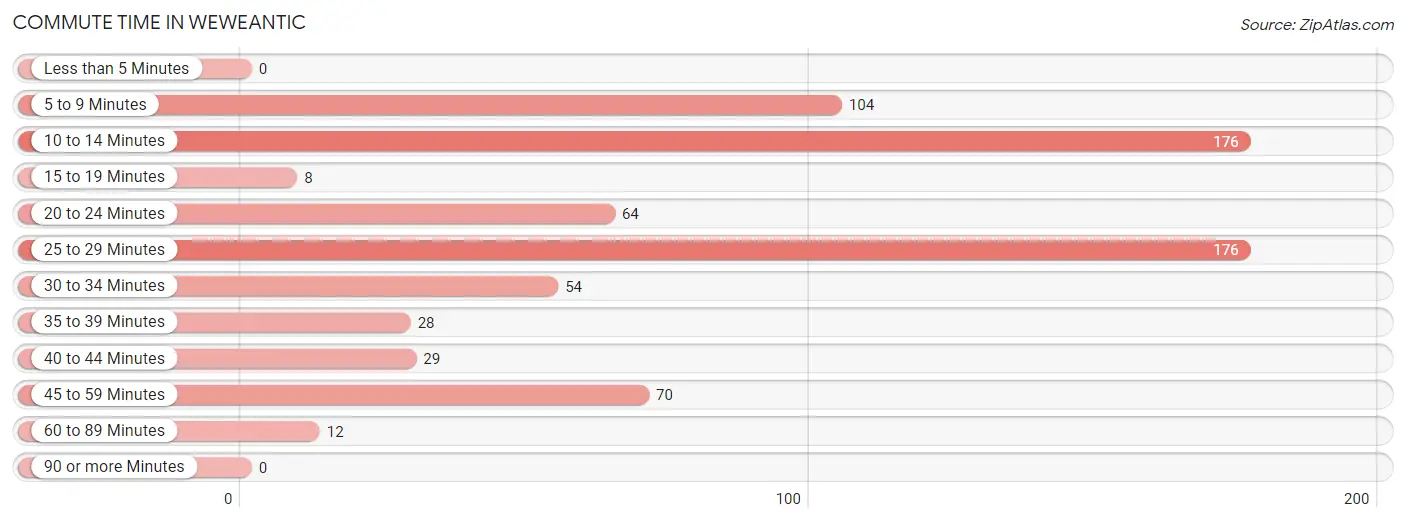
| Commute Time | # Commuters | % Commuters |
| Less than 5 Minutes | 0 | 0.0% |
| 5 to 9 Minutes | 104 | 14.4% |
| 10 to 14 Minutes | 176 | 24.4% |
| 15 to 19 Minutes | 8 | 1.1% |
| 20 to 24 Minutes | 64 | 8.9% |
| 25 to 29 Minutes | 176 | 24.4% |
| 30 to 34 Minutes | 54 | 7.5% |
| 35 to 39 Minutes | 28 | 3.9% |
| 40 to 44 Minutes | 29 | 4.0% |
| 45 to 59 Minutes | 70 | 9.7% |
| 60 to 89 Minutes | 12 | 1.7% |
| 90 or more Minutes | 0 | 0.0% |
Commute Time by Sex in Weweantic
The most common commute times in Weweantic are 25 to 29 minutes (145 commuters, 35.2%) for males and 10 to 14 minutes (130 commuters, 42.1%) for females.
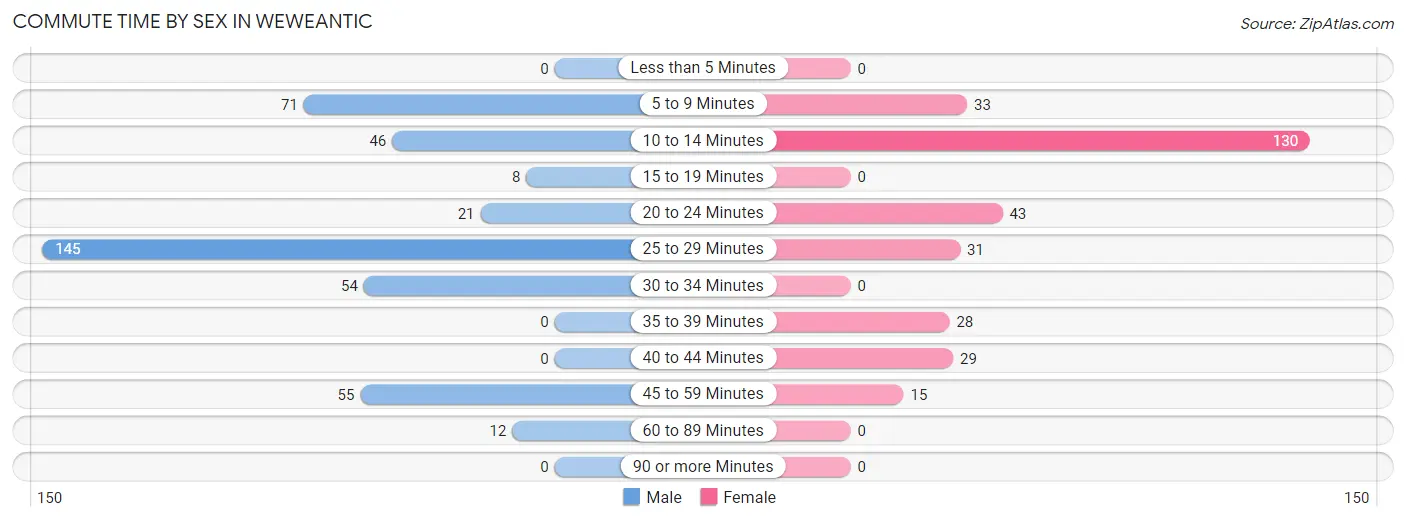
| Commute Time | Male | Female |
| Less than 5 Minutes | 0 (0.0%) | 0 (0.0%) |
| 5 to 9 Minutes | 71 (17.2%) | 33 (10.7%) |
| 10 to 14 Minutes | 46 (11.2%) | 130 (42.1%) |
| 15 to 19 Minutes | 8 (1.9%) | 0 (0.0%) |
| 20 to 24 Minutes | 21 (5.1%) | 43 (13.9%) |
| 25 to 29 Minutes | 145 (35.2%) | 31 (10.0%) |
| 30 to 34 Minutes | 54 (13.1%) | 0 (0.0%) |
| 35 to 39 Minutes | 0 (0.0%) | 28 (9.1%) |
| 40 to 44 Minutes | 0 (0.0%) | 29 (9.4%) |
| 45 to 59 Minutes | 55 (13.4%) | 15 (4.9%) |
| 60 to 89 Minutes | 12 (2.9%) | 0 (0.0%) |
| 90 or more Minutes | 0 (0.0%) | 0 (0.0%) |
Time of Departure to Work by Sex in Weweantic
The most frequent times of departure to work in Weweantic are 7:30 AM to 7:59 AM (82, 19.9%) for males and 6:30 AM to 6:59 AM (123, 39.8%) for females.
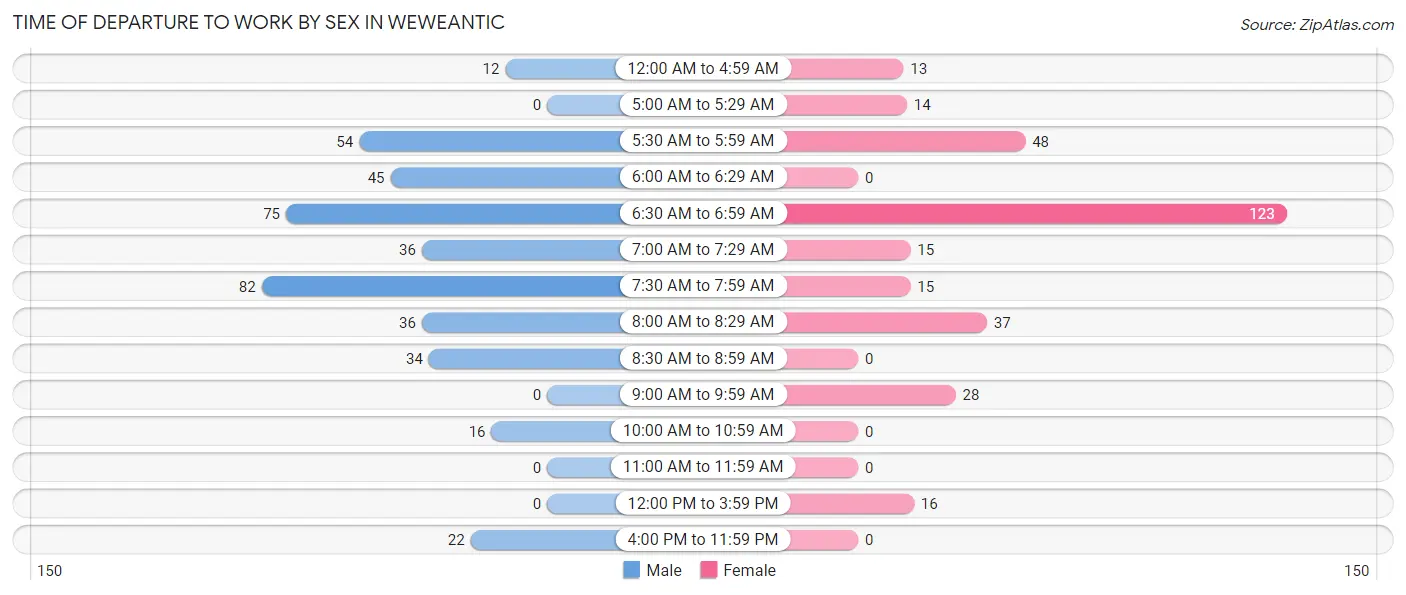
| Time of Departure | Male | Female |
| 12:00 AM to 4:59 AM | 12 (2.9%) | 13 (4.2%) |
| 5:00 AM to 5:29 AM | 0 (0.0%) | 14 (4.5%) |
| 5:30 AM to 5:59 AM | 54 (13.1%) | 48 (15.5%) |
| 6:00 AM to 6:29 AM | 45 (10.9%) | 0 (0.0%) |
| 6:30 AM to 6:59 AM | 75 (18.2%) | 123 (39.8%) |
| 7:00 AM to 7:29 AM | 36 (8.7%) | 15 (4.9%) |
| 7:30 AM to 7:59 AM | 82 (19.9%) | 15 (4.9%) |
| 8:00 AM to 8:29 AM | 36 (8.7%) | 37 (12.0%) |
| 8:30 AM to 8:59 AM | 34 (8.3%) | 0 (0.0%) |
| 9:00 AM to 9:59 AM | 0 (0.0%) | 28 (9.1%) |
| 10:00 AM to 10:59 AM | 16 (3.9%) | 0 (0.0%) |
| 11:00 AM to 11:59 AM | 0 (0.0%) | 0 (0.0%) |
| 12:00 PM to 3:59 PM | 0 (0.0%) | 16 (5.2%) |
| 4:00 PM to 11:59 PM | 22 (5.3%) | 0 (0.0%) |
| Total | 412 (100.0%) | 309 (100.0%) |
Housing Occupancy in Weweantic
Occupancy by Ownership in Weweantic
Of the total 692 dwellings in Weweantic, owner-occupied units account for 615 (88.9%), while renter-occupied units make up 77 (11.1%).
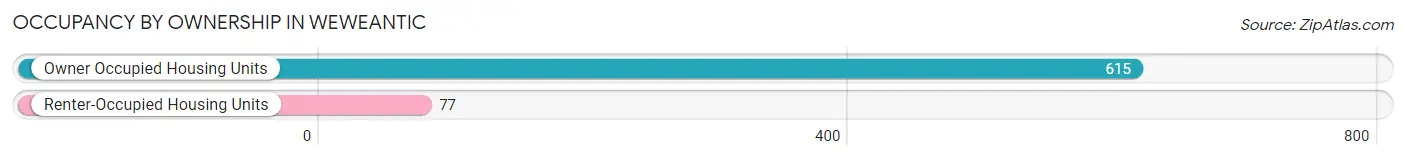
| Occupancy | # Housing Units | % Housing Units |
| Owner Occupied Housing Units | 615 | 88.9% |
| Renter-Occupied Housing Units | 77 | 11.1% |
| Total Occupied Housing Units | 692 | 100.0% |
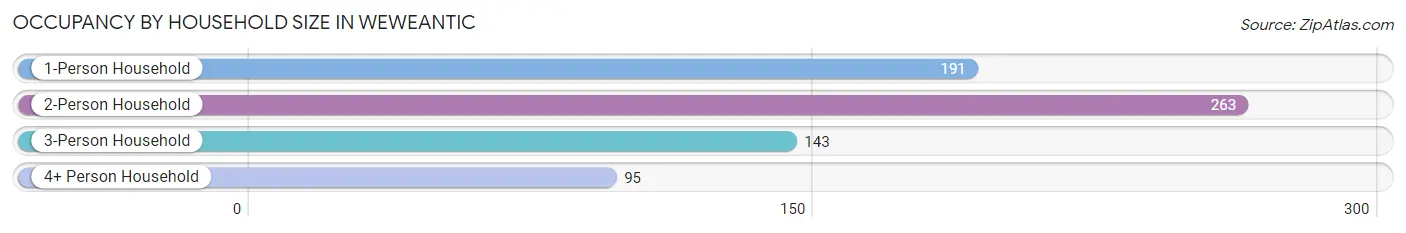
Occupancy by Household Size in Weweantic
| Household Size | # Housing Units | % Housing Units |
| 1-Person Household | 191 | 27.6% |
| 2-Person Household | 263 | 38.0% |
| 3-Person Household | 143 | 20.7% |
| 4+ Person Household | 95 | 13.7% |
| Total Housing Units | 692 | 100.0% |
Occupancy by Ownership by Household Size in Weweantic
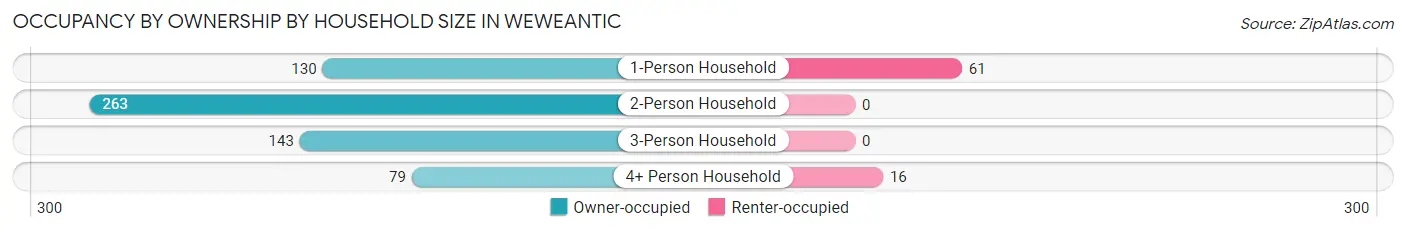
| Household Size | Owner-occupied | Renter-occupied |
| 1-Person Household | 130 (68.1%) | 61 (31.9%) |
| 2-Person Household | 263 (100.0%) | 0 (0.0%) |
| 3-Person Household | 143 (100.0%) | 0 (0.0%) |
| 4+ Person Household | 79 (83.2%) | 16 (16.8%) |
| Total Housing Units | 615 (88.9%) | 77 (11.1%) |
Occupancy by Educational Attainment in Weweantic
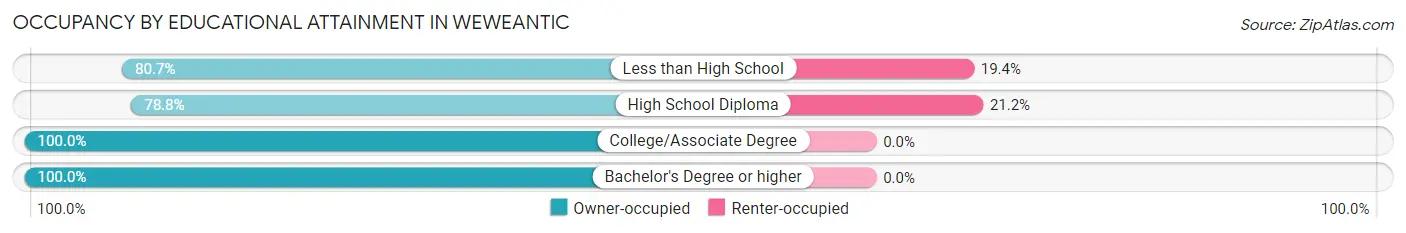
| Household Size | Owner-occupied | Renter-occupied |
| Less than High School | 50 (80.6%) | 12 (19.4%) |
| High School Diploma | 242 (78.8%) | 65 (21.2%) |
| College/Associate Degree | 156 (100.0%) | 0 (0.0%) |
| Bachelor's Degree or higher | 167 (100.0%) | 0 (0.0%) |
Occupancy by Age of Householder in Weweantic
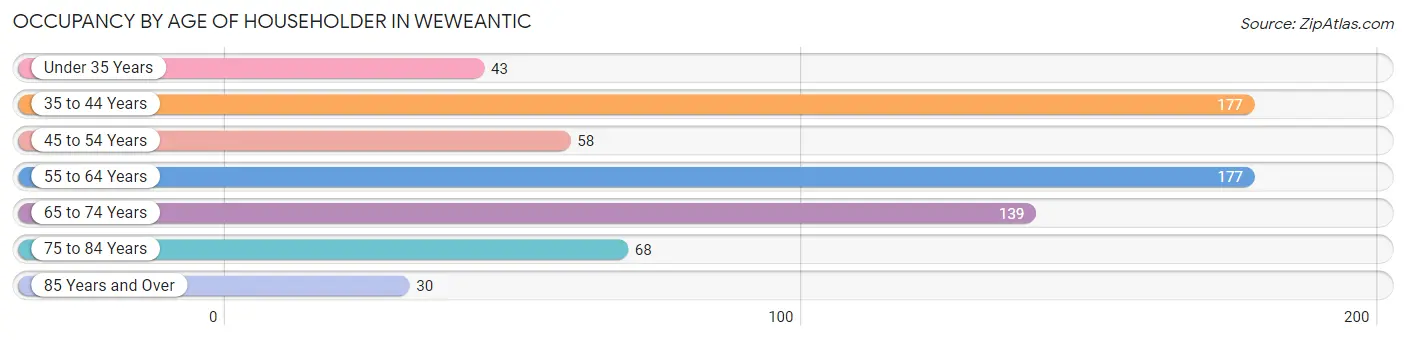
| Age Bracket | # Households | % Households |
| Under 35 Years | 43 | 6.2% |
| 35 to 44 Years | 177 | 25.6% |
| 45 to 54 Years | 58 | 8.4% |
| 55 to 64 Years | 177 | 25.6% |
| 65 to 74 Years | 139 | 20.1% |
| 75 to 84 Years | 68 | 9.8% |
| 85 Years and Over | 30 | 4.3% |
| Total | 692 | 100.0% |
Housing Finances in Weweantic
Median Income by Occupancy in Weweantic
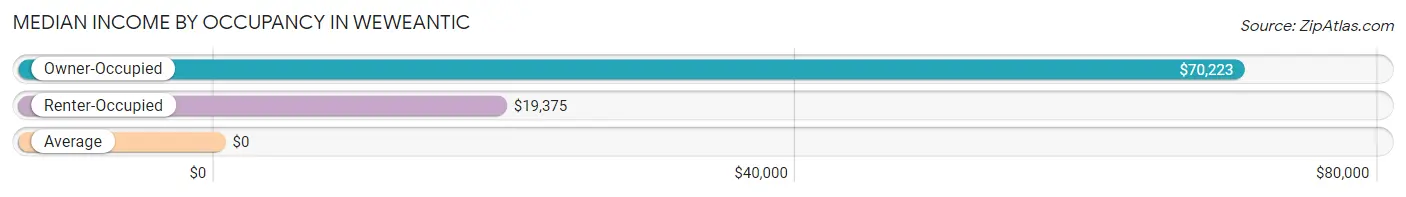
| Occupancy Type | # Households | Median Income |
| Owner-Occupied | 615 (88.9%) | $70,223 |
| Renter-Occupied | 77 (11.1%) | $19,375 |
| Average | 692 (100.0%) | $0 |
Occupancy by Householder Income Bracket in Weweantic
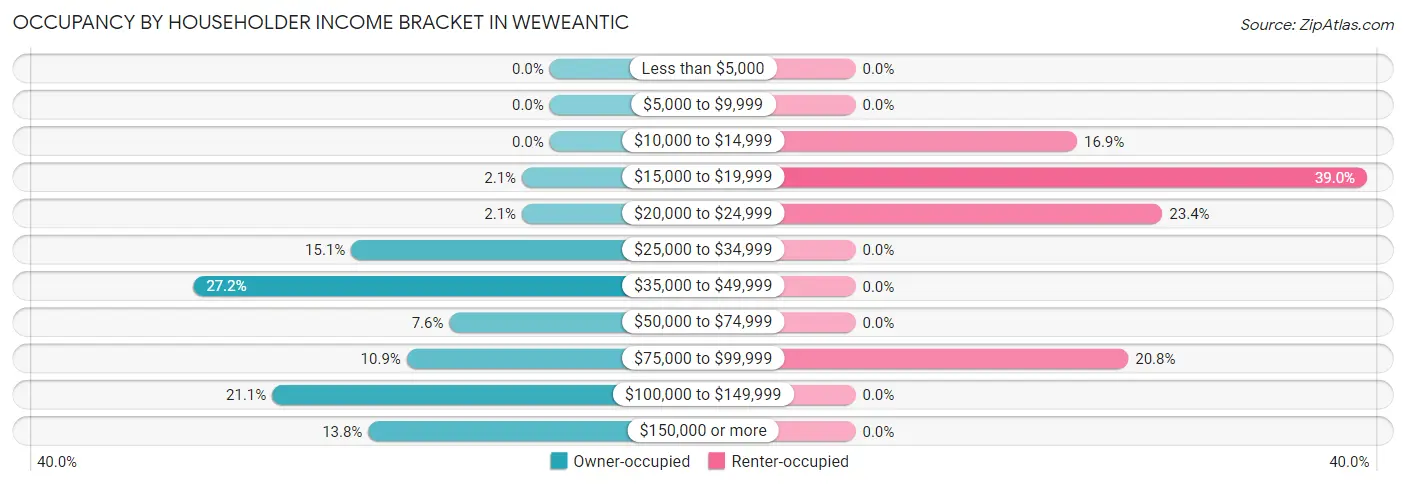
| Income Bracket | Owner-occupied | Renter-occupied |
| Less than $5,000 | 0 (0.0%) | 0 (0.0%) |
| $5,000 to $9,999 | 0 (0.0%) | 0 (0.0%) |
| $10,000 to $14,999 | 0 (0.0%) | 13 (16.9%) |
| $15,000 to $19,999 | 13 (2.1%) | 30 (39.0%) |
| $20,000 to $24,999 | 13 (2.1%) | 18 (23.4%) |
| $25,000 to $34,999 | 93 (15.1%) | 0 (0.0%) |
| $35,000 to $49,999 | 167 (27.2%) | 0 (0.0%) |
| $50,000 to $74,999 | 47 (7.6%) | 0 (0.0%) |
| $75,000 to $99,999 | 67 (10.9%) | 16 (20.8%) |
| $100,000 to $149,999 | 130 (21.1%) | 0 (0.0%) |
| $150,000 or more | 85 (13.8%) | 0 (0.0%) |
| Total | 615 (100.0%) | 77 (100.0%) |
Monthly Housing Cost Tiers in Weweantic
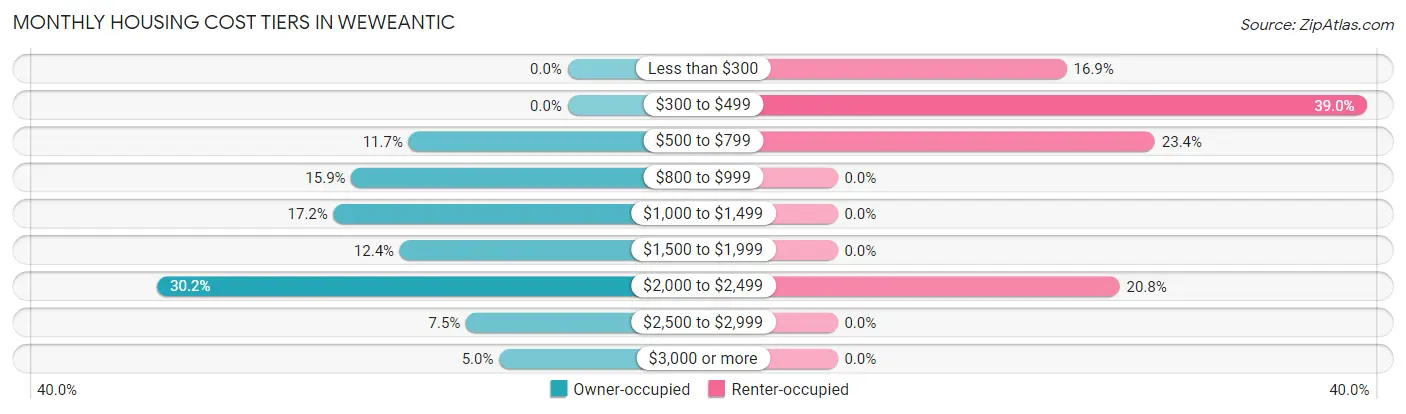
| Monthly Cost | Owner-occupied | Renter-occupied |
| Less than $300 | 0 (0.0%) | 13 (16.9%) |
| $300 to $499 | 0 (0.0%) | 30 (39.0%) |
| $500 to $799 | 72 (11.7%) | 18 (23.4%) |
| $800 to $999 | 98 (15.9%) | 0 (0.0%) |
| $1,000 to $1,499 | 106 (17.2%) | 0 (0.0%) |
| $1,500 to $1,999 | 76 (12.4%) | 0 (0.0%) |
| $2,000 to $2,499 | 186 (30.2%) | 16 (20.8%) |
| $2,500 to $2,999 | 46 (7.5%) | 0 (0.0%) |
| $3,000 or more | 31 (5.0%) | 0 (0.0%) |
| Total | 615 (100.0%) | 77 (100.0%) |
Physical Housing Characteristics in Weweantic
Housing Structures in Weweantic
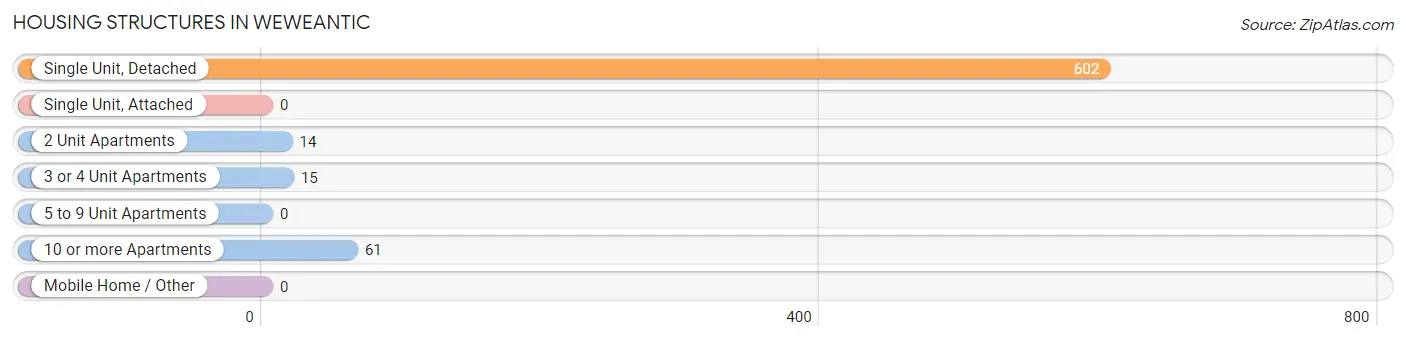
| Structure Type | # Housing Units | % Housing Units |
| Single Unit, Detached | 602 | 87.0% |
| Single Unit, Attached | 0 | 0.0% |
| 2 Unit Apartments | 14 | 2.0% |
| 3 or 4 Unit Apartments | 15 | 2.2% |
| 5 to 9 Unit Apartments | 0 | 0.0% |
| 10 or more Apartments | 61 | 8.8% |
| Mobile Home / Other | 0 | 0.0% |
| Total | 692 | 100.0% |
Housing Structures by Occupancy in Weweantic
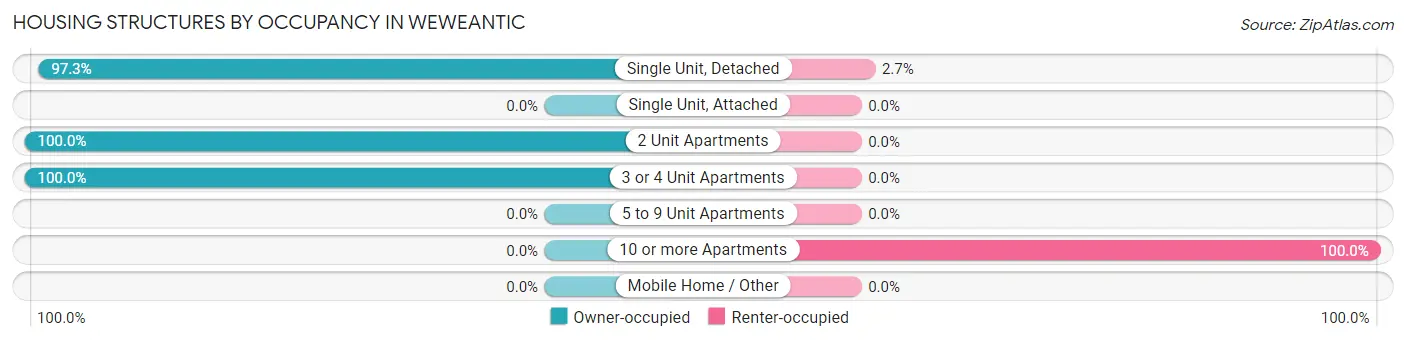
| Structure Type | Owner-occupied | Renter-occupied |
| Single Unit, Detached | 586 (97.3%) | 16 (2.7%) |
| Single Unit, Attached | 0 (0.0%) | 0 (0.0%) |
| 2 Unit Apartments | 14 (100.0%) | 0 (0.0%) |
| 3 or 4 Unit Apartments | 15 (100.0%) | 0 (0.0%) |
| 5 to 9 Unit Apartments | 0 (0.0%) | 0 (0.0%) |
| 10 or more Apartments | 0 (0.0%) | 61 (100.0%) |
| Mobile Home / Other | 0 (0.0%) | 0 (0.0%) |
| Total | 615 (88.9%) | 77 (11.1%) |
Housing Structures by Number of Rooms in Weweantic
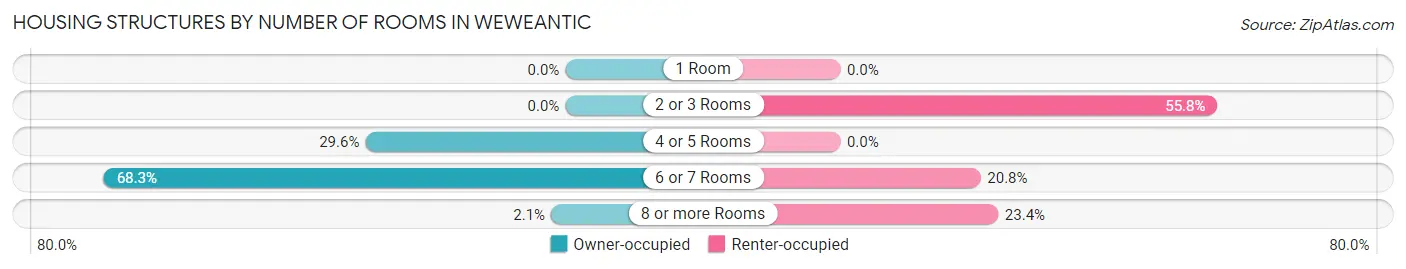
| Number of Rooms | Owner-occupied | Renter-occupied |
| 1 Room | 0 (0.0%) | 0 (0.0%) |
| 2 or 3 Rooms | 0 (0.0%) | 43 (55.8%) |
| 4 or 5 Rooms | 182 (29.6%) | 0 (0.0%) |
| 6 or 7 Rooms | 420 (68.3%) | 16 (20.8%) |
| 8 or more Rooms | 13 (2.1%) | 18 (23.4%) |
| Total | 615 (100.0%) | 77 (100.0%) |
Housing Structure by Heating Type in Weweantic
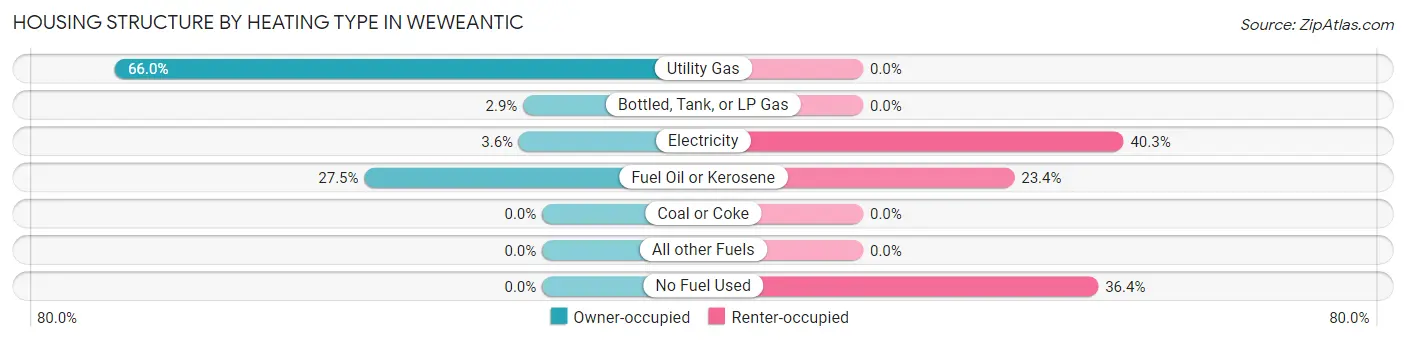
| Heating Type | Owner-occupied | Renter-occupied |
| Utility Gas | 406 (66.0%) | 0 (0.0%) |
| Bottled, Tank, or LP Gas | 18 (2.9%) | 0 (0.0%) |
| Electricity | 22 (3.6%) | 31 (40.3%) |
| Fuel Oil or Kerosene | 169 (27.5%) | 18 (23.4%) |
| Coal or Coke | 0 (0.0%) | 0 (0.0%) |
| All other Fuels | 0 (0.0%) | 0 (0.0%) |
| No Fuel Used | 0 (0.0%) | 28 (36.4%) |
| Total | 615 (100.0%) | 77 (100.0%) |
Household Vehicle Usage in Weweantic
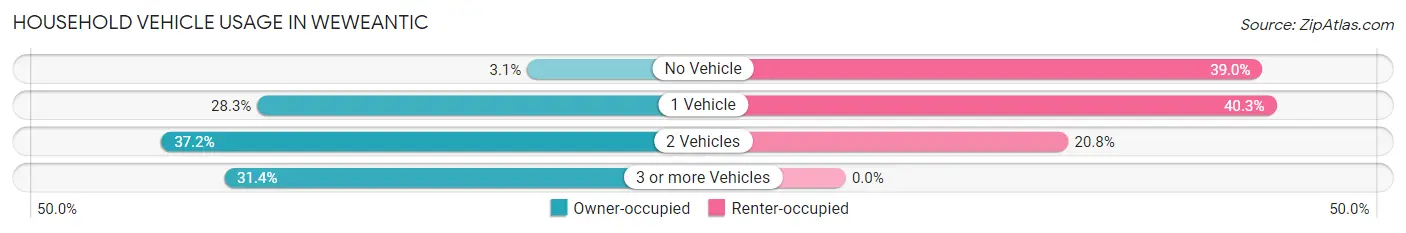
| Vehicles per Household | Owner-occupied | Renter-occupied |
| No Vehicle | 19 (3.1%) | 30 (39.0%) |
| 1 Vehicle | 174 (28.3%) | 31 (40.3%) |
| 2 Vehicles | 229 (37.2%) | 16 (20.8%) |
| 3 or more Vehicles | 193 (31.4%) | 0 (0.0%) |
| Total | 615 (100.0%) | 77 (100.0%) |
Real Estate & Mortgages in Weweantic
Real Estate and Mortgage Overview in Weweantic
| Characteristic | Without Mortgage | With Mortgage |
| Housing Units | 176 | 439 |
| Median Property Value | $378,600 | $361,700 |
| Median Household Income | - | - |
| Monthly Housing Costs | $864 | $31 |
| Real Estate Taxes | $3,691 | $0 |
Property Value by Mortgage Status in Weweantic
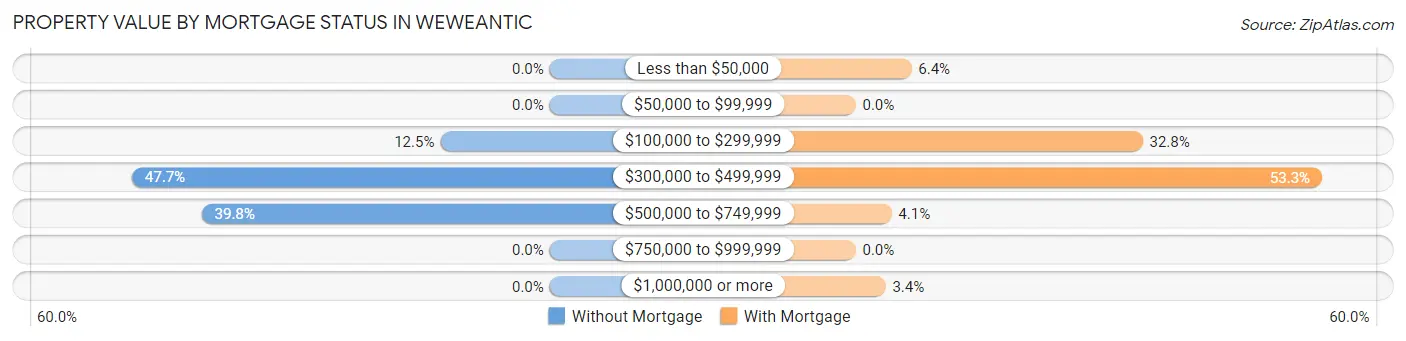
| Property Value | Without Mortgage | With Mortgage |
| Less than $50,000 | 0 (0.0%) | 28 (6.4%) |
| $50,000 to $99,999 | 0 (0.0%) | 0 (0.0%) |
| $100,000 to $299,999 | 22 (12.5%) | 144 (32.8%) |
| $300,000 to $499,999 | 84 (47.7%) | 234 (53.3%) |
| $500,000 to $749,999 | 70 (39.8%) | 18 (4.1%) |
| $750,000 to $999,999 | 0 (0.0%) | 0 (0.0%) |
| $1,000,000 or more | 0 (0.0%) | 15 (3.4%) |
| Total | 176 (100.0%) | 439 (100.0%) |
Household Income by Mortgage Status in Weweantic
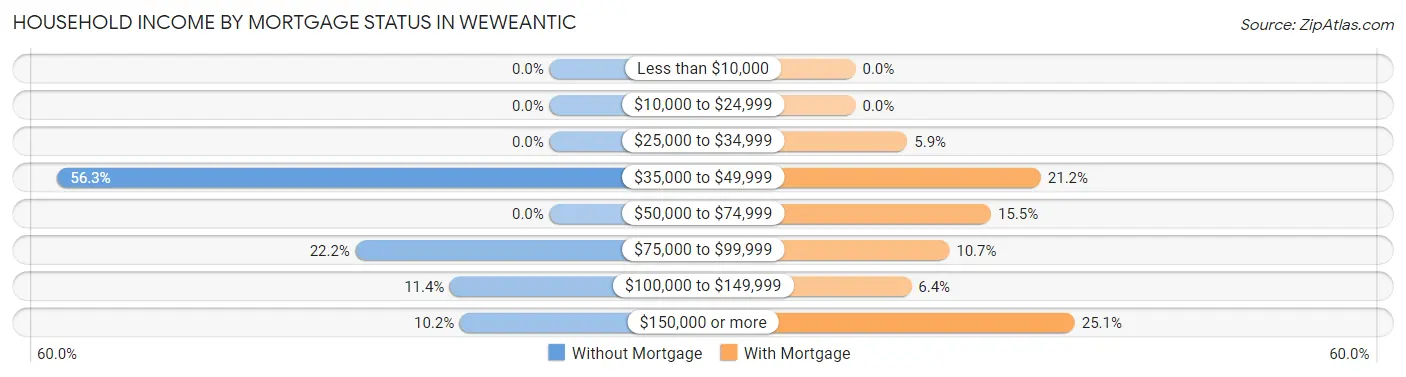
| Household Income | Without Mortgage | With Mortgage |
| Less than $10,000 | 0 (0.0%) | 0 (0.0%) |
| $10,000 to $24,999 | 0 (0.0%) | 0 (0.0%) |
| $25,000 to $34,999 | 0 (0.0%) | 26 (5.9%) |
| $35,000 to $49,999 | 99 (56.2%) | 93 (21.2%) |
| $50,000 to $74,999 | 0 (0.0%) | 68 (15.5%) |
| $75,000 to $99,999 | 39 (22.2%) | 47 (10.7%) |
| $100,000 to $149,999 | 20 (11.4%) | 28 (6.4%) |
| $150,000 or more | 18 (10.2%) | 110 (25.1%) |
| Total | 176 (100.0%) | 439 (100.0%) |
Property Value to Household Income Ratio in Weweantic
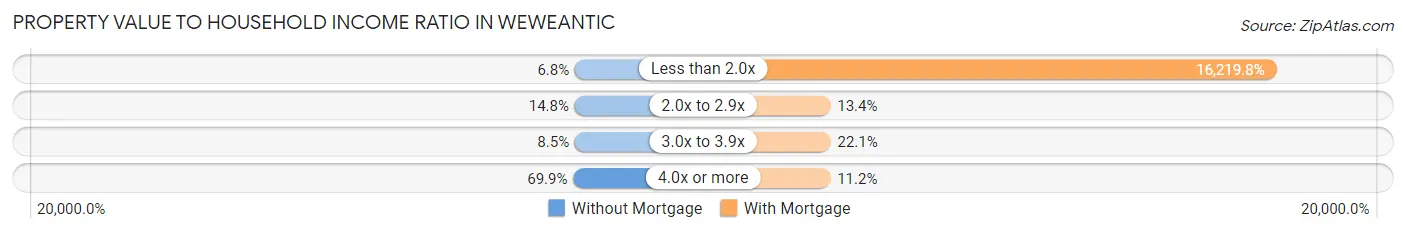
| Value-to-Income Ratio | Without Mortgage | With Mortgage |
| Less than 2.0x | 12 (6.8%) | 71,205 (16,219.8%) |
| 2.0x to 2.9x | 26 (14.8%) | 59 (13.4%) |
| 3.0x to 3.9x | 15 (8.5%) | 97 (22.1%) |
| 4.0x or more | 123 (69.9%) | 49 (11.2%) |
| Total | 176 (100.0%) | 439 (100.0%) |
Real Estate Taxes by Mortgage Status in Weweantic
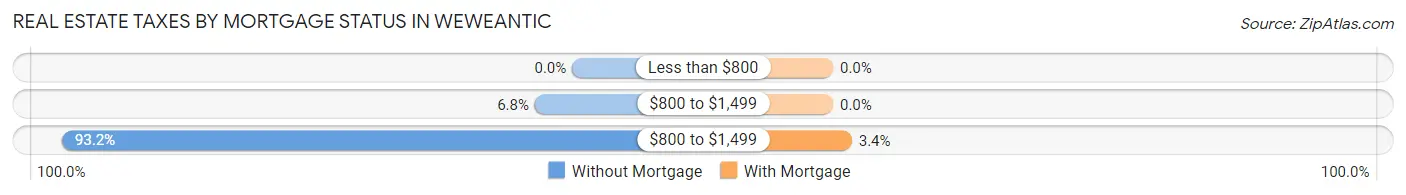
| Property Taxes | Without Mortgage | With Mortgage |
| Less than $800 | 0 (0.0%) | 0 (0.0%) |
| $800 to $1,499 | 12 (6.8%) | 0 (0.0%) |
| $800 to $1,499 | 164 (93.2%) | 15 (3.4%) |
| Total | 176 (100.0%) | 439 (100.0%) |
Health & Disability in Weweantic
Health Insurance Coverage by Age in Weweantic
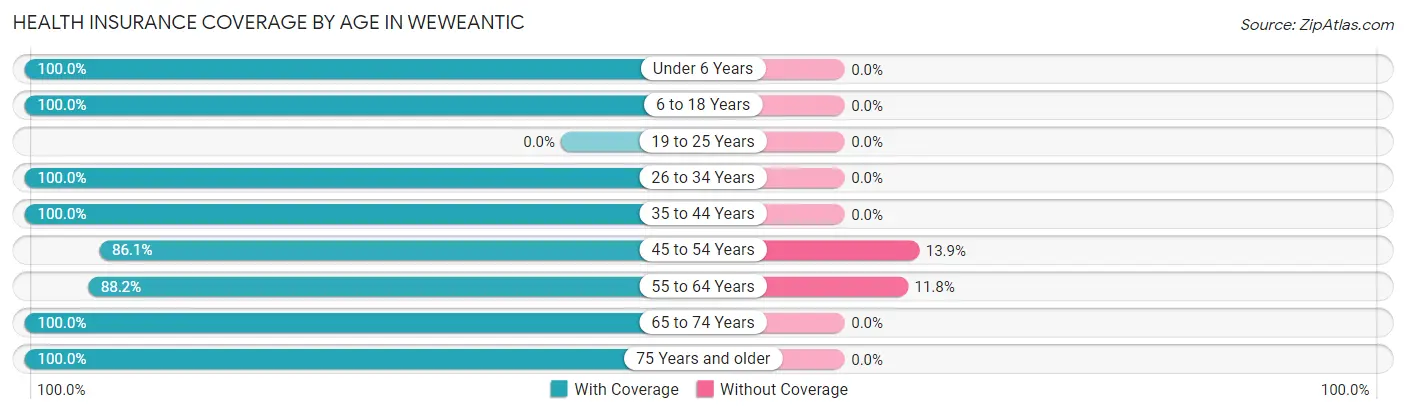
| Age Bracket | With Coverage | Without Coverage |
| Under 6 Years | 40 (100.0%) | 0 (0.0%) |
| 6 to 18 Years | 202 (100.0%) | 0 (0.0%) |
| 19 to 25 Years | 0 (0.0%) | 0 (0.0%) |
| 26 to 34 Years | 257 (100.0%) | 0 (0.0%) |
| 35 to 44 Years | 356 (100.0%) | 0 (0.0%) |
| 45 to 54 Years | 93 (86.1%) | 15 (13.9%) |
| 55 to 64 Years | 269 (88.2%) | 36 (11.8%) |
| 65 to 74 Years | 188 (100.0%) | 0 (0.0%) |
| 75 Years and older | 137 (100.0%) | 0 (0.0%) |
| Total | 1,542 (96.8%) | 51 (3.2%) |
Health Insurance Coverage by Citizenship Status in Weweantic
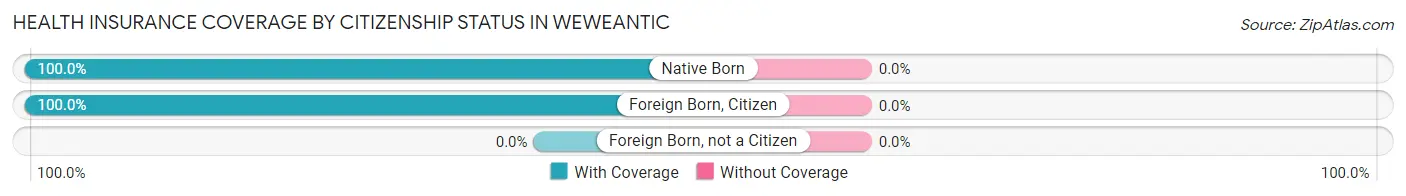
| Citizenship Status | With Coverage | Without Coverage |
| Native Born | 40 (100.0%) | 0 (0.0%) |
| Foreign Born, Citizen | 202 (100.0%) | 0 (0.0%) |
| Foreign Born, not a Citizen | 0 (0.0%) | 0 (0.0%) |
Health Insurance Coverage by Household Income in Weweantic
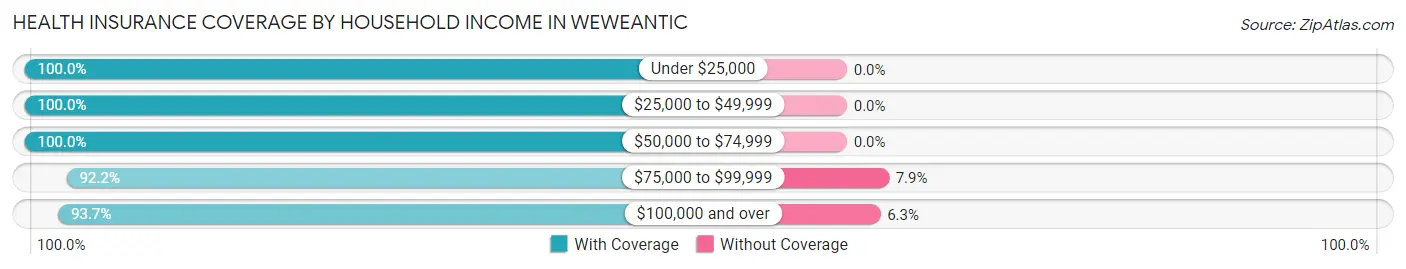
| Household Income | With Coverage | Without Coverage |
| Under $25,000 | 87 (100.0%) | 0 (0.0%) |
| $25,000 to $49,999 | 579 (100.0%) | 0 (0.0%) |
| $50,000 to $74,999 | 161 (100.0%) | 0 (0.0%) |
| $75,000 to $99,999 | 176 (92.1%) | 15 (7.9%) |
| $100,000 and over | 539 (93.7%) | 36 (6.3%) |
Public vs Private Health Insurance Coverage by Age in Weweantic
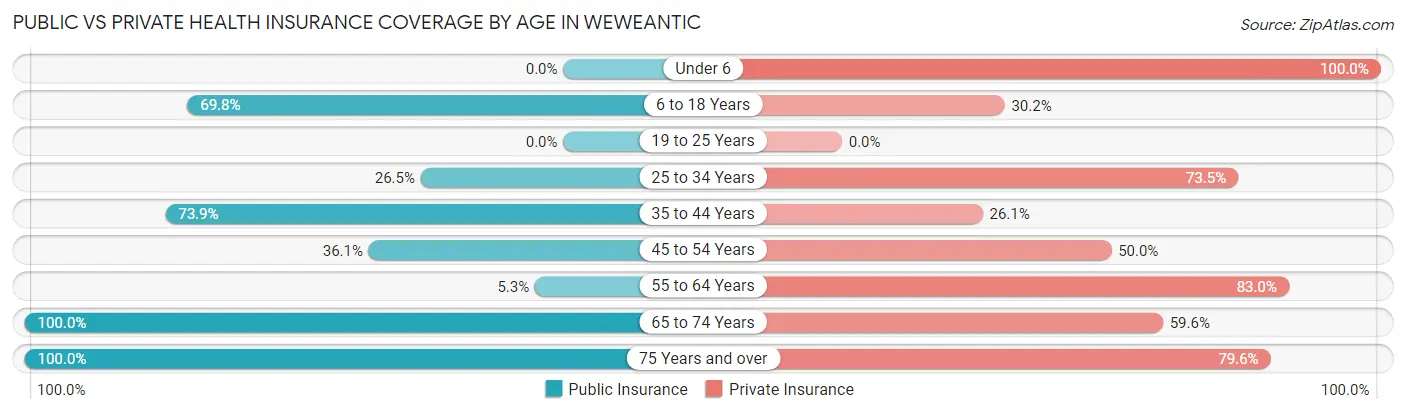
| Age Bracket | Public Insurance | Private Insurance |
| Under 6 | 0 (0.0%) | 40 (100.0%) |
| 6 to 18 Years | 141 (69.8%) | 61 (30.2%) |
| 19 to 25 Years | 0 (0.0%) | 0 (0.0%) |
| 25 to 34 Years | 68 (26.5%) | 189 (73.5%) |
| 35 to 44 Years | 263 (73.9%) | 93 (26.1%) |
| 45 to 54 Years | 39 (36.1%) | 54 (50.0%) |
| 55 to 64 Years | 16 (5.2%) | 253 (83.0%) |
| 65 to 74 Years | 188 (100.0%) | 112 (59.6%) |
| 75 Years and over | 137 (100.0%) | 109 (79.6%) |
| Total | 852 (53.5%) | 911 (57.2%) |
Disability Status by Sex by Age in Weweantic
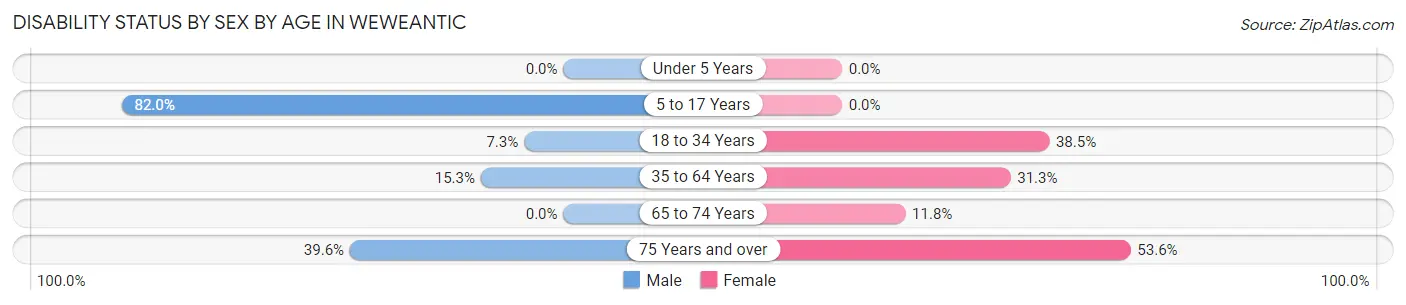
| Age Bracket | Male | Female |
| Under 5 Years | 0 (0.0%) | 0 (0.0%) |
| 5 to 17 Years | 82 (82.0%) | 0 (0.0%) |
| 18 to 34 Years | 14 (7.3%) | 25 (38.5%) |
| 35 to 64 Years | 61 (15.3%) | 116 (31.3%) |
| 65 to 74 Years | 0 (0.0%) | 14 (11.8%) |
| 75 Years and over | 21 (39.6%) | 45 (53.6%) |
Disability Class by Sex by Age in Weweantic
Disability Class: Hearing Difficulty
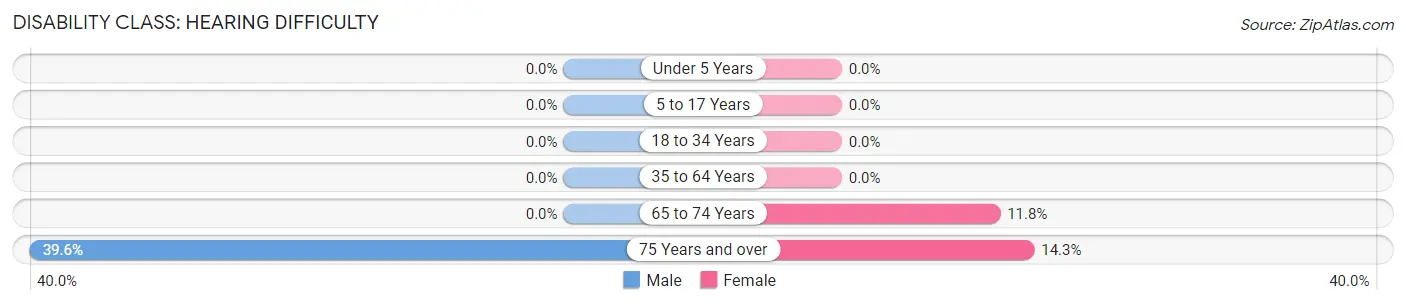
| Age Bracket | Male | Female |
| Under 5 Years | 0 (0.0%) | 0 (0.0%) |
| 5 to 17 Years | 0 (0.0%) | 0 (0.0%) |
| 18 to 34 Years | 0 (0.0%) | 0 (0.0%) |
| 35 to 64 Years | 0 (0.0%) | 0 (0.0%) |
| 65 to 74 Years | 0 (0.0%) | 14 (11.8%) |
| 75 Years and over | 21 (39.6%) | 12 (14.3%) |
Disability Class: Vision Difficulty
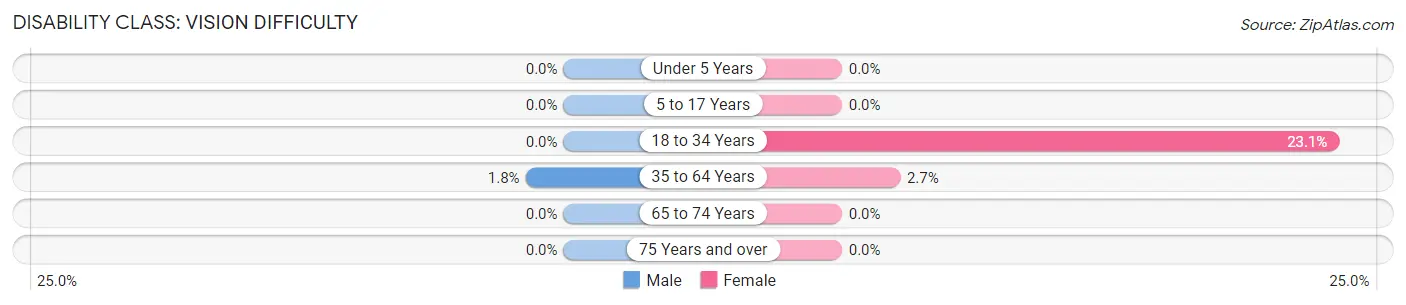
| Age Bracket | Male | Female |
| Under 5 Years | 0 (0.0%) | 0 (0.0%) |
| 5 to 17 Years | 0 (0.0%) | 0 (0.0%) |
| 18 to 34 Years | 0 (0.0%) | 15 (23.1%) |
| 35 to 64 Years | 7 (1.8%) | 10 (2.7%) |
| 65 to 74 Years | 0 (0.0%) | 0 (0.0%) |
| 75 Years and over | 0 (0.0%) | 0 (0.0%) |
Disability Class: Cognitive Difficulty
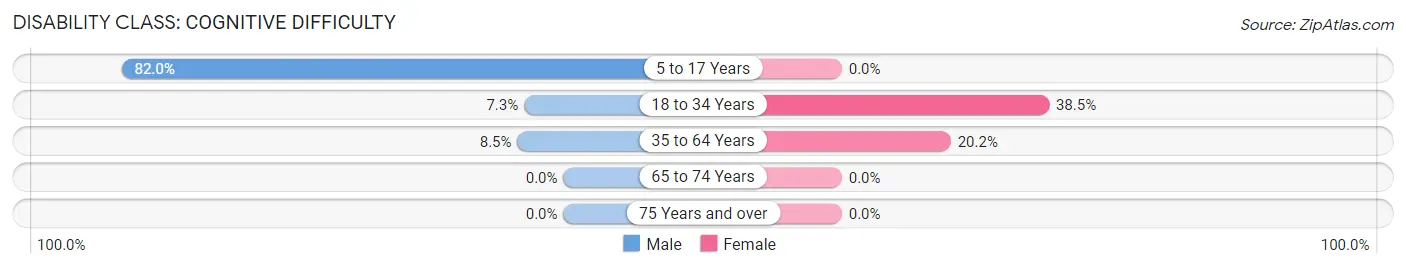
| Age Bracket | Male | Female |
| 5 to 17 Years | 82 (82.0%) | 0 (0.0%) |
| 18 to 34 Years | 14 (7.3%) | 25 (38.5%) |
| 35 to 64 Years | 34 (8.5%) | 75 (20.2%) |
| 65 to 74 Years | 0 (0.0%) | 0 (0.0%) |
| 75 Years and over | 0 (0.0%) | 0 (0.0%) |
Disability Class: Ambulatory Difficulty
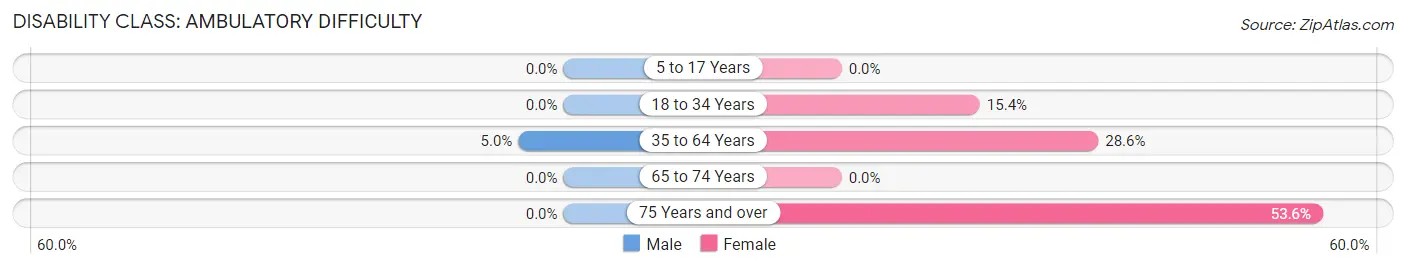
| Age Bracket | Male | Female |
| 5 to 17 Years | 0 (0.0%) | 0 (0.0%) |
| 18 to 34 Years | 0 (0.0%) | 10 (15.4%) |
| 35 to 64 Years | 20 (5.0%) | 106 (28.6%) |
| 65 to 74 Years | 0 (0.0%) | 0 (0.0%) |
| 75 Years and over | 0 (0.0%) | 45 (53.6%) |
Disability Class: Self-Care Difficulty
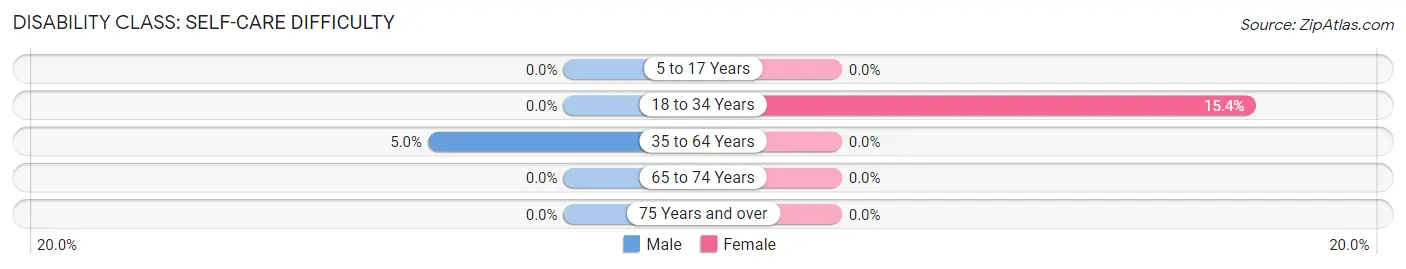
| Age Bracket | Male | Female |
| 5 to 17 Years | 0 (0.0%) | 0 (0.0%) |
| 18 to 34 Years | 0 (0.0%) | 10 (15.4%) |
| 35 to 64 Years | 20 (5.0%) | 0 (0.0%) |
| 65 to 74 Years | 0 (0.0%) | 0 (0.0%) |
| 75 Years and over | 0 (0.0%) | 0 (0.0%) |
Technology Access in Weweantic
Computing Device Access in Weweantic
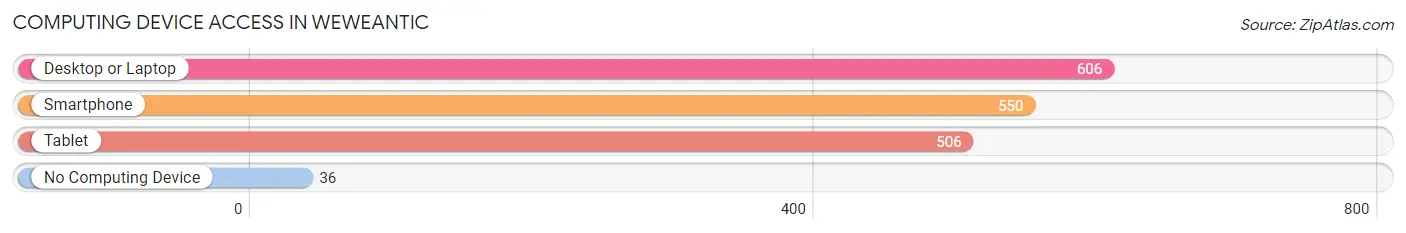
| Device Type | # Households | % Households |
| Desktop or Laptop | 606 | 87.6% |
| Smartphone | 550 | 79.5% |
| Tablet | 506 | 73.1% |
| No Computing Device | 36 | 5.2% |
| Total | 692 | 100.0% |
Internet Access in Weweantic
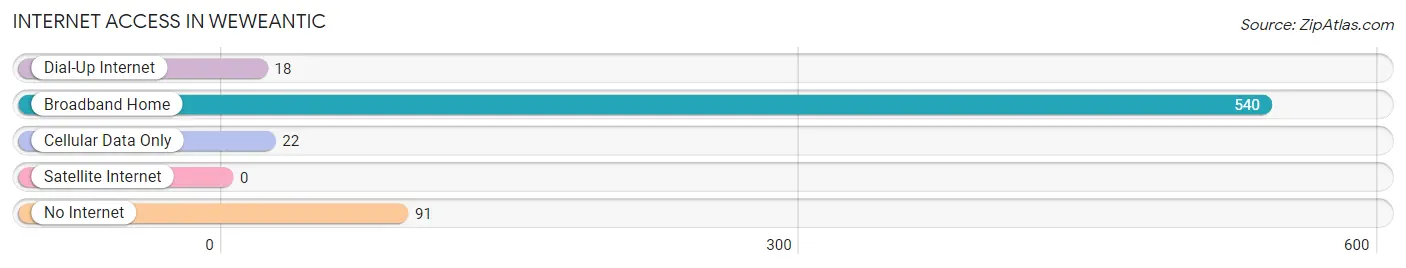
| Internet Type | # Households | % Households |
| Dial-Up Internet | 18 | 2.6% |
| Broadband Home | 540 | 78.0% |
| Cellular Data Only | 22 | 3.2% |
| Satellite Internet | 0 | 0.0% |
| No Internet | 91 | 13.2% |
| Total | 692 | 100.0% |
Weweantic Summary
Weweantic is a small town located in southeastern Massachusetts, in the county of Plymouth. It is situated on the Weweantic River, which is a tributary of the Taunton River. The town is bordered by the towns of Wareham, Carver, and Rochester. The population of Weweantic was 2,845 as of the 2010 census.
History
The area that is now Weweantic was originally inhabited by the Wampanoag people. The town was first settled in 1652 by English colonists, who named it after the Weweantic River. The town was officially incorporated in 1717.
In the late 18th century, Weweantic was a major center of the whaling industry. The town was home to several whaling ships, and the whaling industry provided much of the town's income.
In the 19th century, Weweantic was a major center of the cranberry industry. The town was home to several cranberry bogs, and the cranberry industry provided much of the town's income.
Geography
Weweantic is located in southeastern Massachusetts, in the county of Plymouth. It is situated on the Weweantic River, which is a tributary of the Taunton River. The town is bordered by the towns of Wareham, Carver, and Rochester.
The town has a total area of 10.3 square miles, of which 10.2 square miles is land and 0.1 square miles is water. The town is mostly flat, with some hills in the northern part of town.
Economy
The economy of Weweantic is largely based on agriculture and tourism. The town is home to several cranberry bogs, and the cranberry industry provides much of the town's income. The town is also home to several tourist attractions, including the Weweantic River Wildlife Sanctuary and the Weweantic Historical Society Museum.
Demographics
As of the 2010 census, the population of Weweantic was 2,845. The racial makeup of the town was 97.2% White, 0.7% African American, 0.3% Native American, 0.3% Asian, 0.2% from other races, and 1.5% from two or more races. Hispanic or Latino of any race were 1.2% of the population.
The median household income in Weweantic was $60,938, and the median family income was $68,750. The per capita income for the town was $27,945. About 5.2% of families and 6.7% of the population were below the poverty line, including 8.2% of those under age 18 and 4.2% of those age 65 or over.
Common Questions
What is Per Capita Income in Weweantic?
Per Capita income in Weweantic is $37,286.
What is the Median Family Income in Weweantic?
Median Family Income in Weweantic is $66,375.
What is Income or Wage Gap in Weweantic?
Income or Wage Gap in Weweantic is 28.8%.
Women in Weweantic earn 71.2 cents for every dollar earned by a man.
What is Inequality or Gini Index in Weweantic?
Inequality or Gini Index in Weweantic is 0.42.
What is the Total Population of Weweantic?
Total Population of Weweantic is 1,593.
What is the Total Male Population of Weweantic?
Total Male Population of Weweantic is 852.
What is the Total Female Population of Weweantic?
Total Female Population of Weweantic is 741.
What is the Ratio of Males per 100 Females in Weweantic?
There are 114.98 Males per 100 Females in Weweantic.
What is the Ratio of Females per 100 Males in Weweantic?
There are 86.97 Females per 100 Males in Weweantic.
What is the Median Population Age in Weweantic?
Median Population Age in Weweantic is 42.7 Years.
What is the Average Family Size in Weweantic
Average Family Size in Weweantic is 2.8 People.
What is the Average Household Size in Weweantic
Average Household Size in Weweantic is 2.3 People.
How Large is the Labor Force in Weweantic?
There are 880 People in the Labor Forcein in Weweantic.
What is the Percentage of People in the Labor Force in Weweantic?
65.1% of People are in the Labor Force in Weweantic.
What is the Unemployment Rate in Weweantic?
Unemployment Rate in Weweantic is 12.5%.