Zip Codes with the Highest Percentage of Population Employed in Health Diagnosing & Treating in Lynn, MA
RELATED REPORTS & OPTIONS
Health Diagnosing & Treating
Lynn
Compare Zip Codes
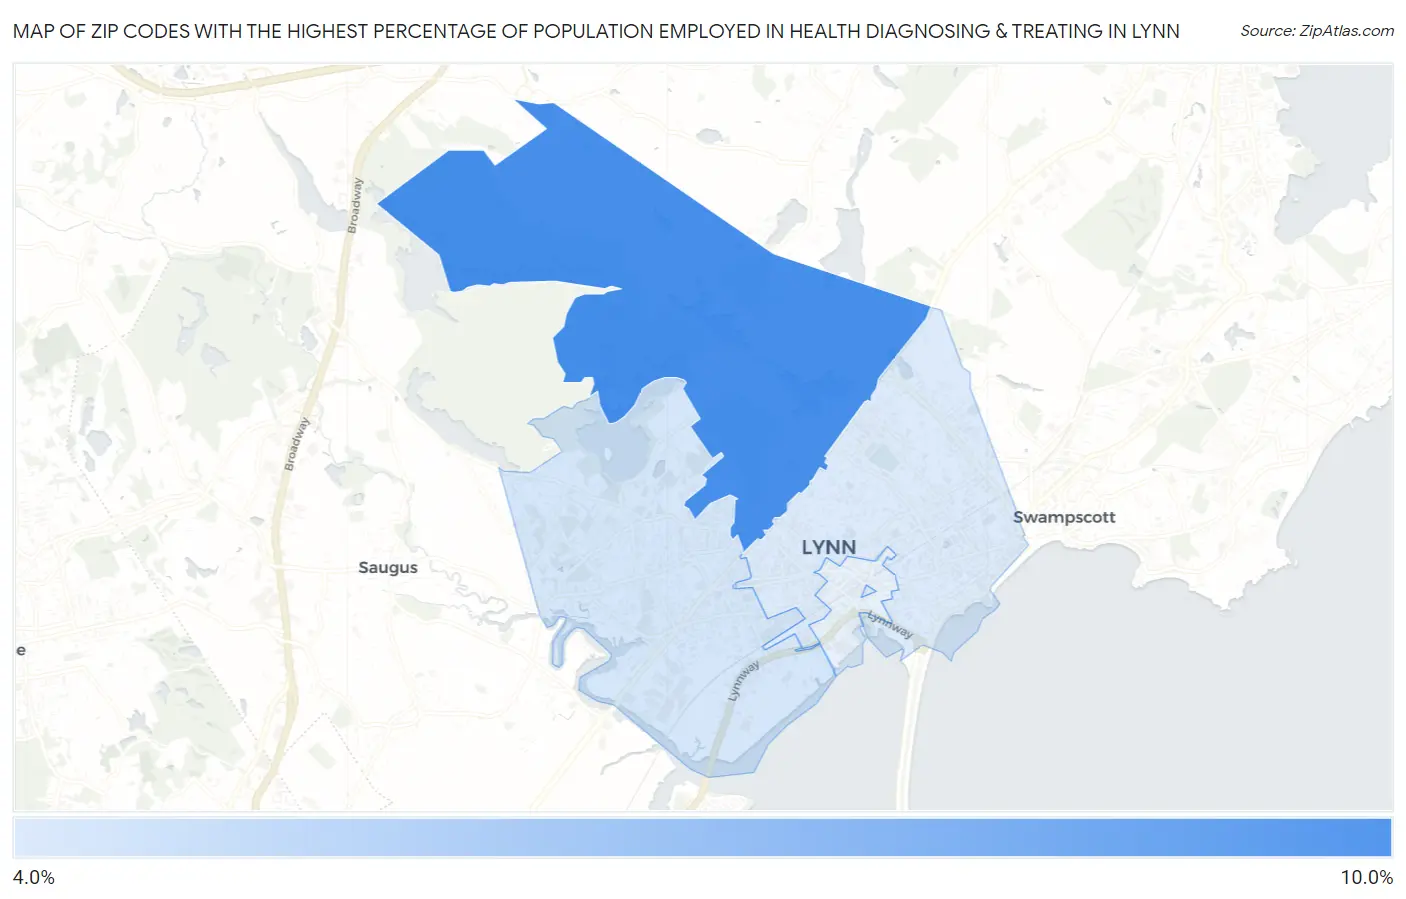
Map of Zip Codes with the Highest Percentage of Population Employed in Health Diagnosing & Treating in Lynn
4.5%
8.6%
Zip Codes with the Highest Percentage of Population Employed in Health Diagnosing & Treating in Lynn, MA
| Zip Code | % Employed | vs State | vs National | |
| 1. | 01904 | 8.6% | 6.9%(+1.68)#141 | 6.2%(+2.34)#6,160 |
| 2. | 01905 | 4.7% | 6.9%(-2.20)#422 | 6.2%(-1.54)#18,831 |
| 3. | 01902 | 4.5% | 6.9%(-2.38)#431 | 6.2%(-1.72)#19,559 |
1
Common Questions
What are the Top 3 Zip Codes with the Highest Percentage of Population Employed in Health Diagnosing & Treating in Lynn, MA?
Top 3 Zip Codes with the Highest Percentage of Population Employed in Health Diagnosing & Treating in Lynn, MA are:
What zip code has the Highest Percentage of Population Employed in Health Diagnosing & Treating in Lynn, MA?
01904 has the Highest Percentage of Population Employed in Health Diagnosing & Treating in Lynn, MA with 8.6%.
What is the Percentage of Population Employed in Health Diagnosing & Treating in Lynn, MA?
Percentage of Population Employed in Health Diagnosing & Treating in Lynn is 5.4%.
What is the Percentage of Population Employed in Health Diagnosing & Treating in Massachusetts?
Percentage of Population Employed in Health Diagnosing & Treating in Massachusetts is 6.9%.
What is the Percentage of Population Employed in Health Diagnosing & Treating in the United States?
Percentage of Population Employed in Health Diagnosing & Treating in the United States is 6.2%.