Zip Codes with the Highest Percentage of Population Employed in Health Diagnosing & Treating in Acton, MA
RELATED REPORTS & OPTIONS
Health Diagnosing & Treating
Acton
Compare Zip Codes
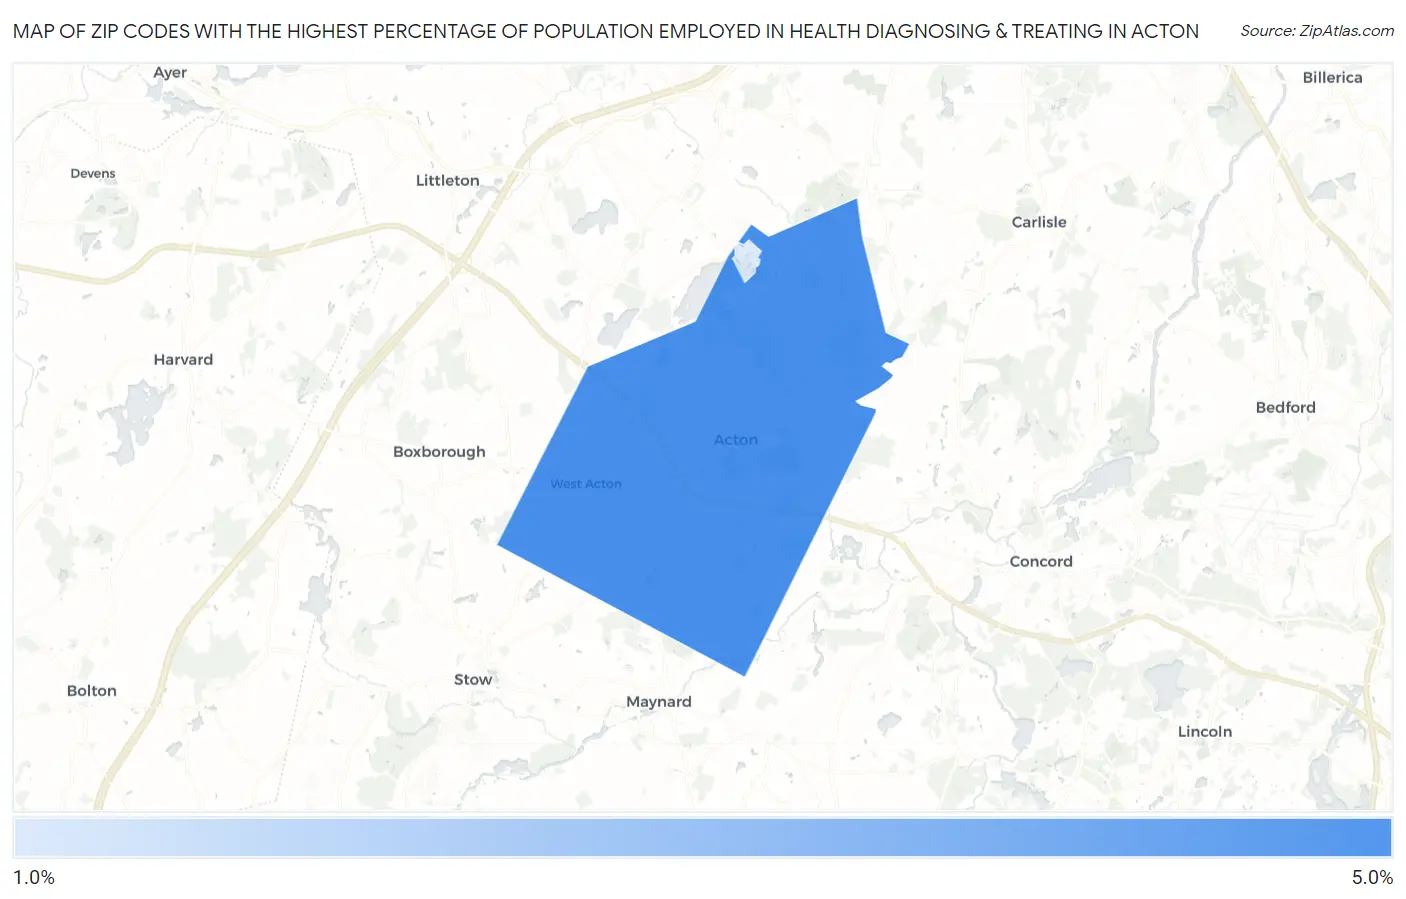
Map of Zip Codes with the Highest Percentage of Population Employed in Health Diagnosing & Treating in Acton
1.8%
4.7%
Zip Codes with the Highest Percentage of Population Employed in Health Diagnosing & Treating in Acton, MA
| Zip Code | % Employed | vs State | vs National | |
| 1. | 01720 | 4.7% | 6.9%(-2.21)#423 | 6.2%(-1.55)#18,858 |
| 2. | 01718 | 1.8% | 6.9%(-5.09)#496 | 6.2%(-4.44)#26,785 |
1
Common Questions
What are the Top Zip Codes with the Highest Percentage of Population Employed in Health Diagnosing & Treating in Acton, MA?
Top Zip Codes with the Highest Percentage of Population Employed in Health Diagnosing & Treating in Acton, MA are:
What zip code has the Highest Percentage of Population Employed in Health Diagnosing & Treating in Acton, MA?
01720 has the Highest Percentage of Population Employed in Health Diagnosing & Treating in Acton, MA with 4.7%.
What is the Percentage of Population Employed in Health Diagnosing & Treating in Massachusetts?
Percentage of Population Employed in Health Diagnosing & Treating in Massachusetts is 6.9%.
What is the Percentage of Population Employed in Health Diagnosing & Treating in the United States?
Percentage of Population Employed in Health Diagnosing & Treating in the United States is 6.2%.