Harwich Center, MA Map & Demographics
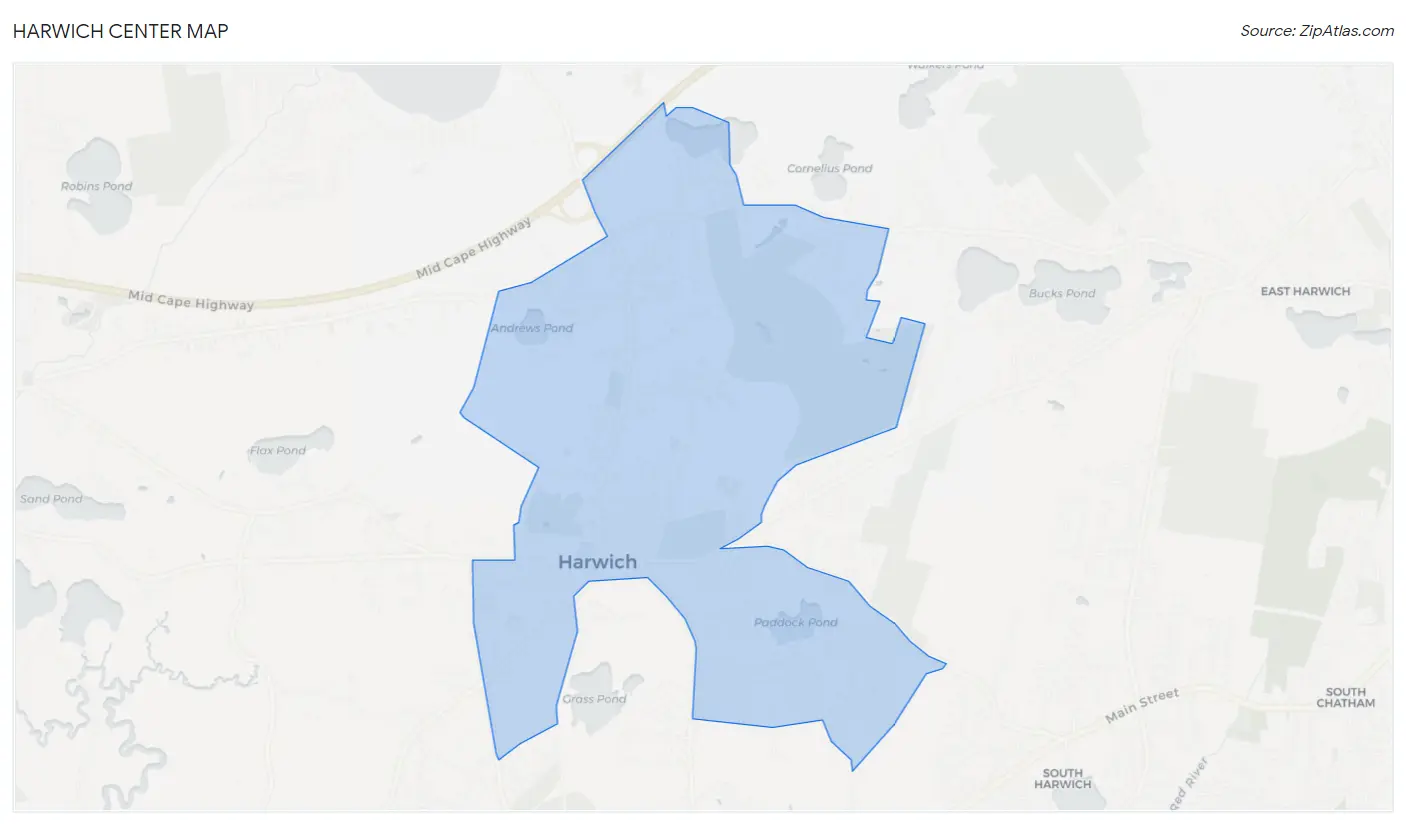
Harwich Center Map
Harwich Center Overview
$53,574
PER CAPITA INCOME
$83,393
AVG FAMILY INCOME
$71,806
AVG HOUSEHOLD INCOME
28.7%
WAGE / INCOME GAP [ % ]
71.3¢/ $1
WAGE / INCOME GAP [ $ ]
0.48
INEQUALITY / GINI INDEX
1,419
TOTAL POPULATION
579
MALE POPULATION
840
FEMALE POPULATION
68.93
MALES / 100 FEMALES
145.08
FEMALES / 100 MALES
60.3
MEDIAN AGE
3.1
AVG FAMILY SIZE
2.0
AVG HOUSEHOLD SIZE
633
LABOR FORCE [ PEOPLE ]
51.3%
PERCENT IN LABOR FORCE
7.1%
UNEMPLOYMENT RATE
Income in Harwich Center
Income Overview in Harwich Center
Per Capita Income in Harwich Center is $53,574, while median incomes of families and households are $83,393 and $71,806 respectively.
| Characteristic | Number | Measure |
| Per Capita Income | 1,419 | $53,574 |
| Median Family Income | 303 | $83,393 |
| Mean Family Income | 303 | $151,687 |
| Median Household Income | 694 | $71,806 |
| Mean Household Income | 694 | $107,360 |
| Income Deficit | 303 | $0 |
| Wage / Income Gap (%) | 1,419 | 28.74% |
| Wage / Income Gap ($) | 1,419 | 71.26¢ per $1 |
| Gini / Inequality Index | 1,419 | 0.48 |
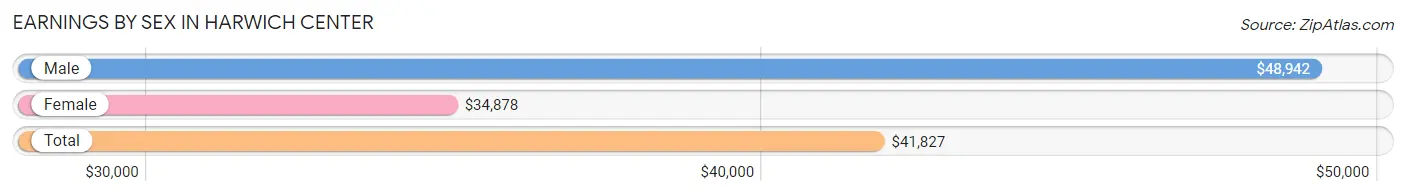
Earnings by Sex in Harwich Center
Average Earnings in Harwich Center are $41,827, $48,942 for men and $34,878 for women, a difference of 28.7%.
| Sex | Number | Average Earnings |
| Male | 297 (44.0%) | $48,942 |
| Female | 378 (56.0%) | $34,878 |
| Total | 675 (100.0%) | $41,827 |
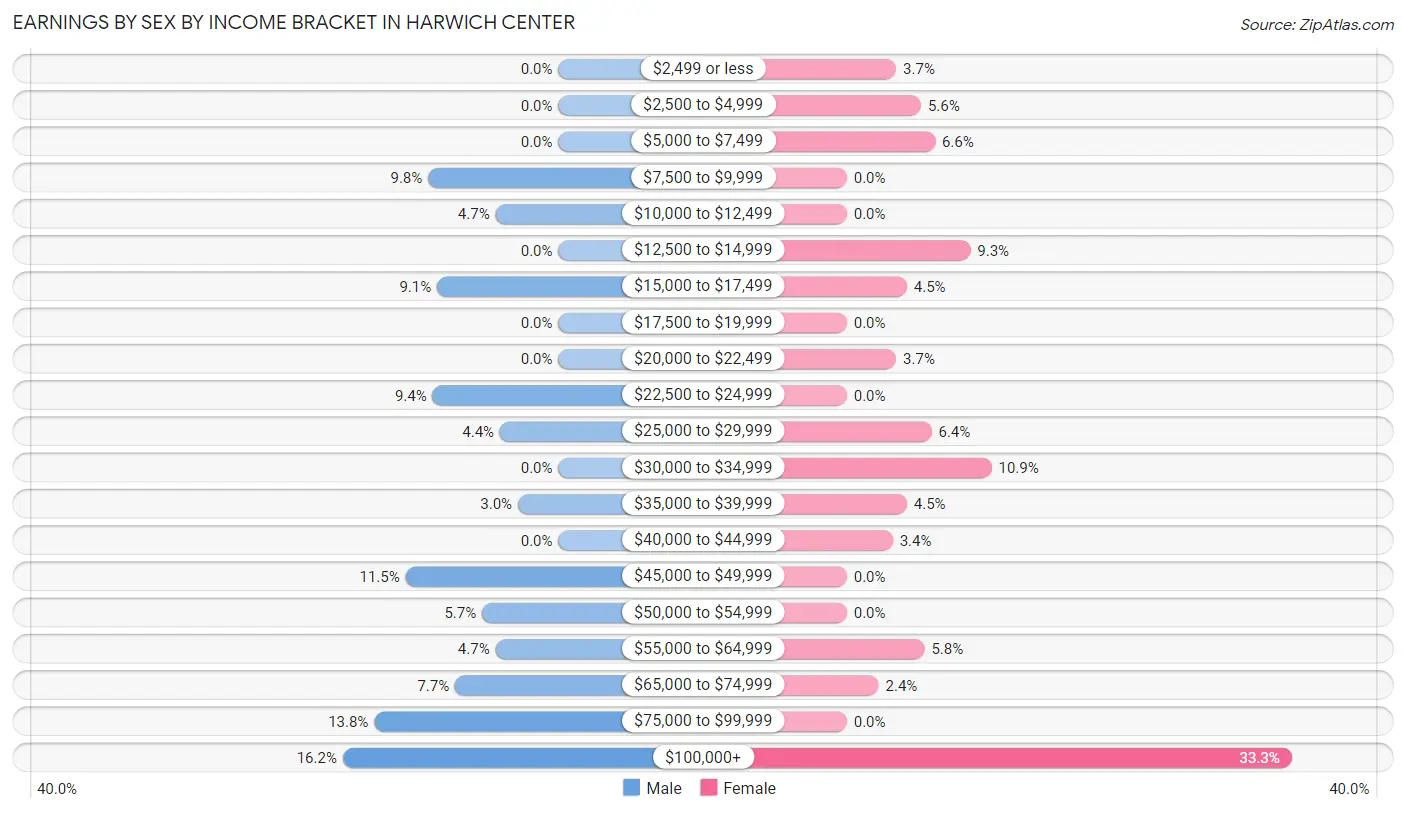
Earnings by Sex by Income Bracket in Harwich Center
The most common earnings brackets in Harwich Center are $100,000+ for men (48 | 16.2%) and $100,000+ for women (126 | 33.3%).
| Income | Male | Female |
| $2,499 or less | 0 (0.0%) | 14 (3.7%) |
| $2,500 to $4,999 | 0 (0.0%) | 21 (5.6%) |
| $5,000 to $7,499 | 0 (0.0%) | 25 (6.6%) |
| $7,500 to $9,999 | 29 (9.8%) | 0 (0.0%) |
| $10,000 to $12,499 | 14 (4.7%) | 0 (0.0%) |
| $12,500 to $14,999 | 0 (0.0%) | 35 (9.3%) |
| $15,000 to $17,499 | 27 (9.1%) | 17 (4.5%) |
| $17,500 to $19,999 | 0 (0.0%) | 0 (0.0%) |
| $20,000 to $22,499 | 0 (0.0%) | 14 (3.7%) |
| $22,500 to $24,999 | 28 (9.4%) | 0 (0.0%) |
| $25,000 to $29,999 | 13 (4.4%) | 24 (6.4%) |
| $30,000 to $34,999 | 0 (0.0%) | 41 (10.8%) |
| $35,000 to $39,999 | 9 (3.0%) | 17 (4.5%) |
| $40,000 to $44,999 | 0 (0.0%) | 13 (3.4%) |
| $45,000 to $49,999 | 34 (11.5%) | 0 (0.0%) |
| $50,000 to $54,999 | 17 (5.7%) | 0 (0.0%) |
| $55,000 to $64,999 | 14 (4.7%) | 22 (5.8%) |
| $65,000 to $74,999 | 23 (7.7%) | 9 (2.4%) |
| $75,000 to $99,999 | 41 (13.8%) | 0 (0.0%) |
| $100,000+ | 48 (16.2%) | 126 (33.3%) |
| Total | 297 (100.0%) | 378 (100.0%) |
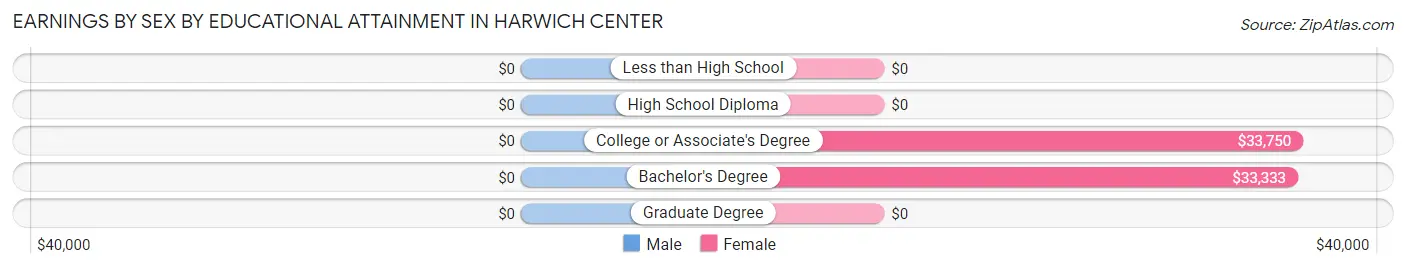
Earnings by Sex by Educational Attainment in Harwich Center
| Educational Attainment | Male Income | Female Income |
| Less than High School | - | - |
| High School Diploma | - | - |
| College or Associate's Degree | - | - |
| Bachelor's Degree | - | - |
| Graduate Degree | - | - |
| Total | $48,942 | $34,878 |
Family Income in Harwich Center
Family Income Brackets in Harwich Center
According to the Harwich Center family income data, there are 96 families falling into the $75,000 to $99,999 income range, which is the most common income bracket and makes up 31.7% of all families.
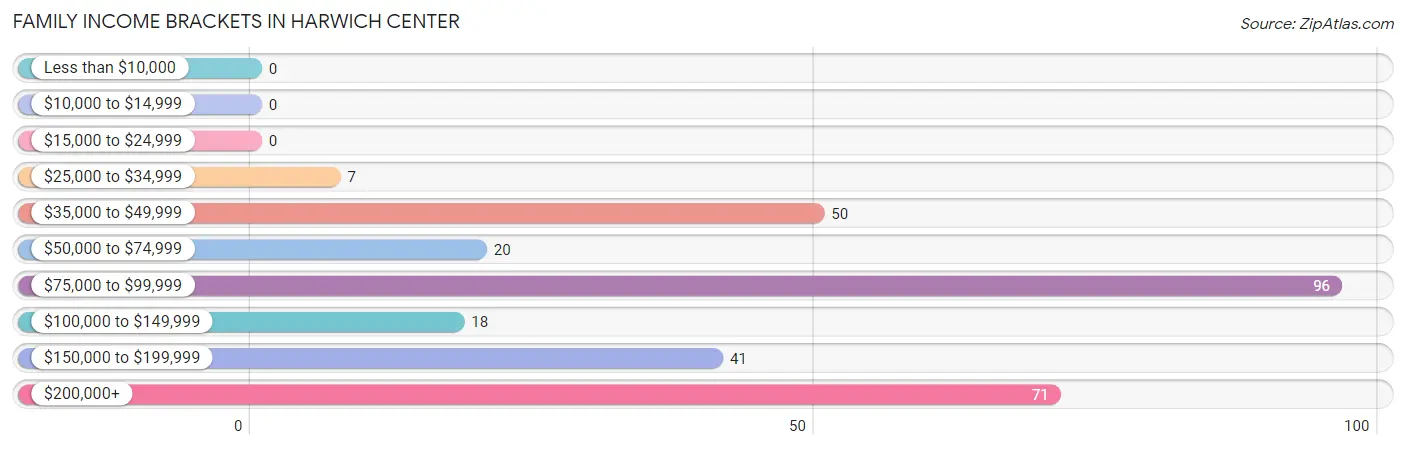
| Income Bracket | # Families | % Families |
| Less than $10,000 | 0 | 0.0% |
| $10,000 to $14,999 | 0 | 0.0% |
| $15,000 to $24,999 | 0 | 0.0% |
| $25,000 to $34,999 | 7 | 2.3% |
| $35,000 to $49,999 | 50 | 16.5% |
| $50,000 to $74,999 | 20 | 6.6% |
| $75,000 to $99,999 | 96 | 31.7% |
| $100,000 to $149,999 | 18 | 5.9% |
| $150,000 to $199,999 | 41 | 13.5% |
| $200,000+ | 71 | 23.4% |
Family Income by Famaliy Size in Harwich Center
2-person families (144 | 47.5%) account for the highest median family income in Harwich Center with $90,735 per family, while 2-person families (144 | 47.5%) have the highest median income of $45,368 per family member.
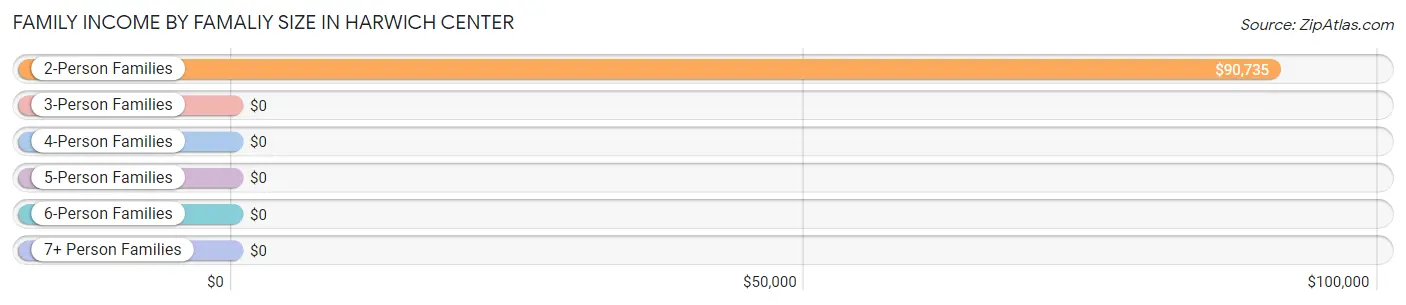
| Income Bracket | # Families | Median Income |
| 2-Person Families | 144 (47.5%) | $90,735 |
| 3-Person Families | 25 (8.3%) | $0 |
| 4-Person Families | 127 (41.9%) | $0 |
| 5-Person Families | 0 (0.0%) | $0 |
| 6-Person Families | 0 (0.0%) | $0 |
| 7+ Person Families | 7 (2.3%) | $0 |
| Total | 303 (100.0%) | $83,393 |
Family Income by Number of Earners in Harwich Center
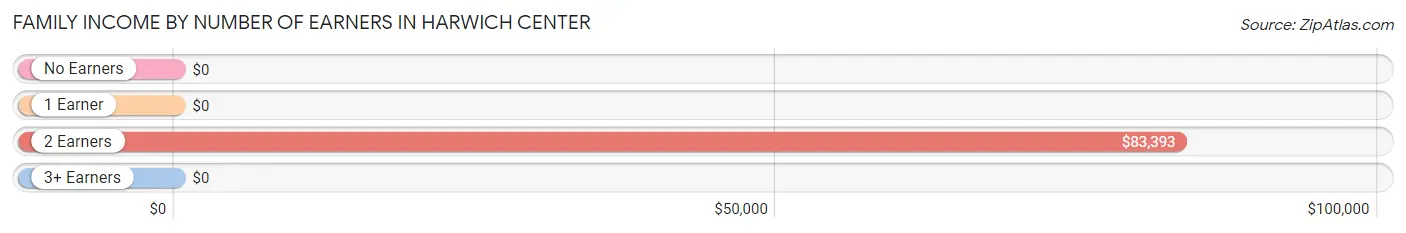
| Number of Earners | # Families | Median Income |
| No Earners | 73 (24.1%) | $0 |
| 1 Earner | 101 (33.3%) | $0 |
| 2 Earners | 105 (34.6%) | $83,393 |
| 3+ Earners | 24 (7.9%) | $0 |
| Total | 303 (100.0%) | $83,393 |
Household Income in Harwich Center
Household Income Brackets in Harwich Center
With 111 households falling in the category, the $200,000+ income range is the most frequent in Harwich Center, accounting for 16.0% of all households.

| Income Bracket | # Households | % Households |
| Less than $10,000 | 0 | 0.0% |
| $10,000 to $14,999 | 12 | 1.7% |
| $15,000 to $24,999 | 87 | 12.5% |
| $25,000 to $34,999 | 78 | 11.2% |
| $35,000 to $49,999 | 97 | 14.0% |
| $50,000 to $74,999 | 78 | 11.2% |
| $75,000 to $99,999 | 107 | 15.4% |
| $100,000 to $149,999 | 44 | 6.3% |
| $150,000 to $199,999 | 80 | 11.5% |
| $200,000+ | 111 | 16.0% |
Household Income by Householder Age in Harwich Center
The median household income in Harwich Center is $71,806, with the highest median household income of $96,250 found in the 45 to 64 years age bracket for the primary householder. A total of 166 households (23.9%) fall into this category.
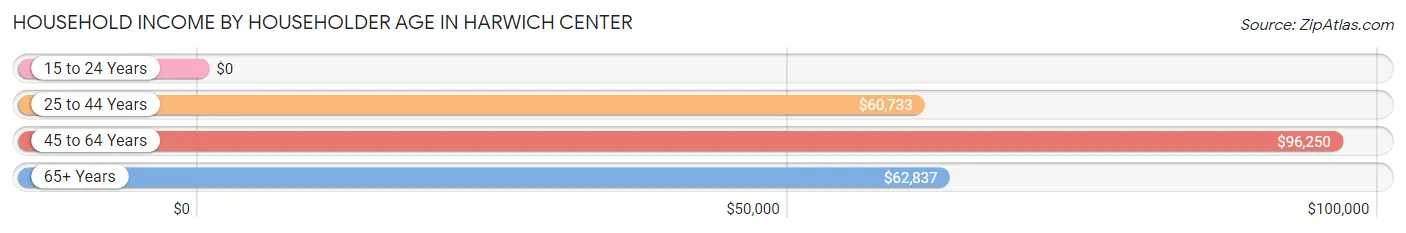
| Income Bracket | # Households | Median Income |
| 15 to 24 Years | 0 (0.0%) | $0 |
| 25 to 44 Years | 105 (15.1%) | $60,733 |
| 45 to 64 Years | 166 (23.9%) | $96,250 |
| 65+ Years | 423 (61.0%) | $62,837 |
| Total | 694 (100.0%) | $71,806 |
Poverty in Harwich Center
Income Below Poverty by Sex and Age in Harwich Center
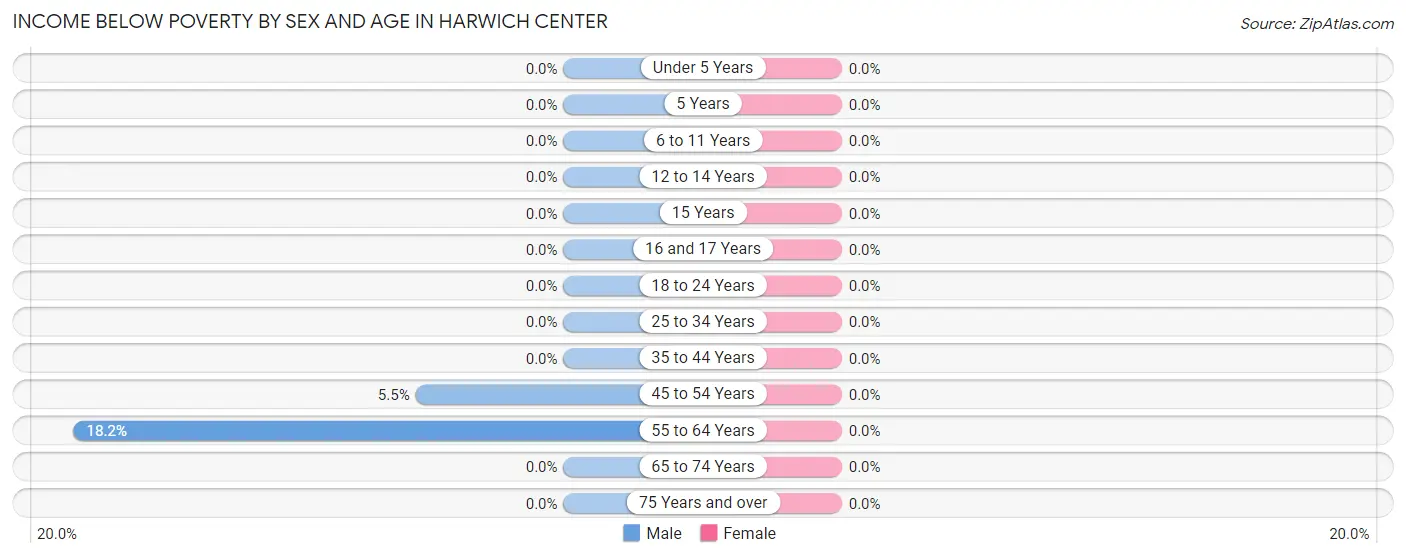
| Age Bracket | Male | Female |
| Under 5 Years | 0 (0.0%) | 0 (0.0%) |
| 5 Years | 0 (0.0%) | 0 (0.0%) |
| 6 to 11 Years | 0 (0.0%) | 0 (0.0%) |
| 12 to 14 Years | 0 (0.0%) | 0 (0.0%) |
| 15 Years | 0 (0.0%) | 0 (0.0%) |
| 16 and 17 Years | 0 (0.0%) | 0 (0.0%) |
| 18 to 24 Years | 0 (0.0%) | 0 (0.0%) |
| 25 to 34 Years | 0 (0.0%) | 0 (0.0%) |
| 35 to 44 Years | 0 (0.0%) | 0 (0.0%) |
| 45 to 54 Years | 5 (5.5%) | 0 (0.0%) |
| 55 to 64 Years | 14 (18.2%) | 0 (0.0%) |
| 65 to 74 Years | 0 (0.0%) | 0 (0.0%) |
| 75 Years and over | 0 (0.0%) | 0 (0.0%) |
| Total | 19 (3.4%) | 0 (0.0%) |
Income Above Poverty by Sex and Age in Harwich Center
According to the poverty statistics in Harwich Center, males aged under 5 years and females aged under 5 years are the age groups that are most secure financially, with 100.0% of males and 100.0% of females in these age groups living above the poverty line.
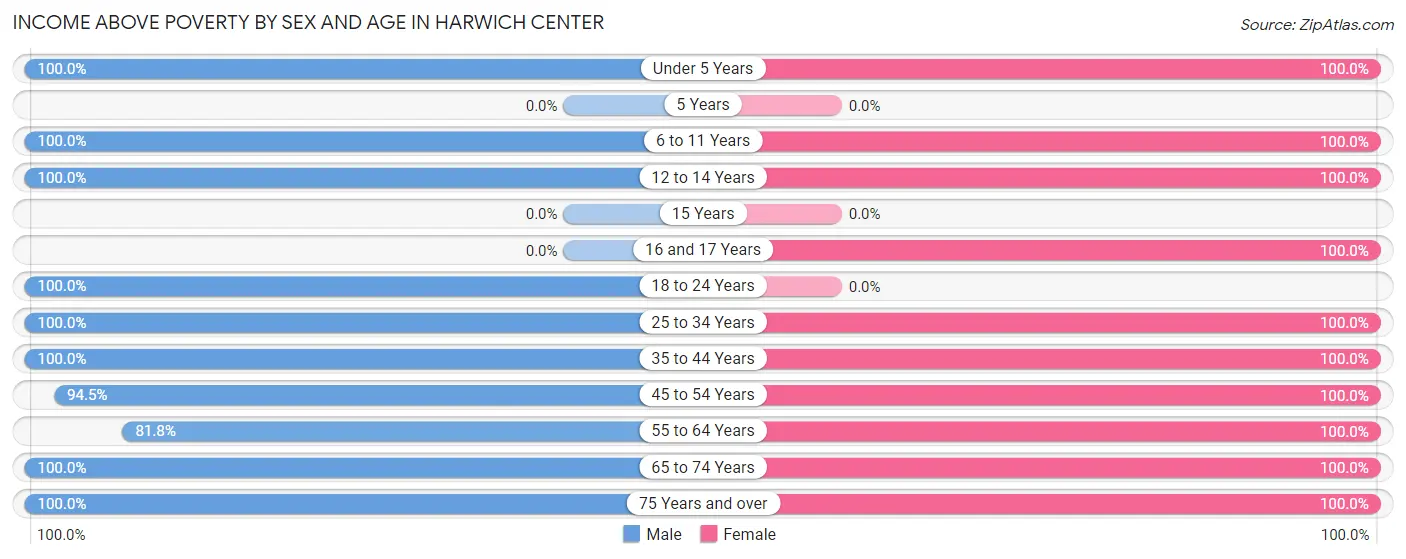
| Age Bracket | Male | Female |
| Under 5 Years | 11 (100.0%) | 18 (100.0%) |
| 5 Years | 0 (0.0%) | 0 (0.0%) |
| 6 to 11 Years | 26 (100.0%) | 54 (100.0%) |
| 12 to 14 Years | 46 (100.0%) | 30 (100.0%) |
| 15 Years | 0 (0.0%) | 0 (0.0%) |
| 16 and 17 Years | 0 (0.0%) | 34 (100.0%) |
| 18 to 24 Years | 47 (100.0%) | 0 (0.0%) |
| 25 to 34 Years | 41 (100.0%) | 36 (100.0%) |
| 35 to 44 Years | 45 (100.0%) | 94 (100.0%) |
| 45 to 54 Years | 86 (94.5%) | 73 (100.0%) |
| 55 to 64 Years | 63 (81.8%) | 135 (100.0%) |
| 65 to 74 Years | 144 (100.0%) | 213 (100.0%) |
| 75 Years and over | 38 (100.0%) | 143 (100.0%) |
| Total | 547 (96.6%) | 830 (100.0%) |
Income Below Poverty Among Married-Couple Families in Harwich Center
| Children | Above Poverty | Below Poverty |
| No Children | 143 (100.0%) | 0 (0.0%) |
| 1 or 2 Children | 128 (100.0%) | 0 (0.0%) |
| 3 or 4 Children | 0 (0.0%) | 0 (0.0%) |
| 5 or more Children | 0 (0.0%) | 0 (0.0%) |
| Total | 271 (100.0%) | 0 (0.0%) |
Income Below Poverty Among Single-Parent Households in Harwich Center
| Children | Single Father | Single Mother |
| No Children | 0 (0.0%) | 0 (0.0%) |
| 1 or 2 Children | 0 (0.0%) | 0 (0.0%) |
| 3 or 4 Children | 0 (0.0%) | 0 (0.0%) |
| 5 or more Children | 0 (0.0%) | 0 (0.0%) |
| Total | 0 (0.0%) | 0 (0.0%) |
Income Below Poverty Among Married-Couple vs Single-Parent Households in Harwich Center
| Children | Married-Couple Families | Single-Parent Households |
| No Children | 0 (0.0%) | 0 (0.0%) |
| 1 or 2 Children | 0 (0.0%) | 0 (0.0%) |
| 3 or 4 Children | 0 (0.0%) | 0 (0.0%) |
| 5 or more Children | 0 (0.0%) | 0 (0.0%) |
| Total | 0 (0.0%) | 0 (0.0%) |
Race in Harwich Center
The most populous races in Harwich Center are White / Caucasian (1,362 | 96.0%), Black / African American (52 | 3.7%), and Hispanic or Latino (5 | 0.4%).
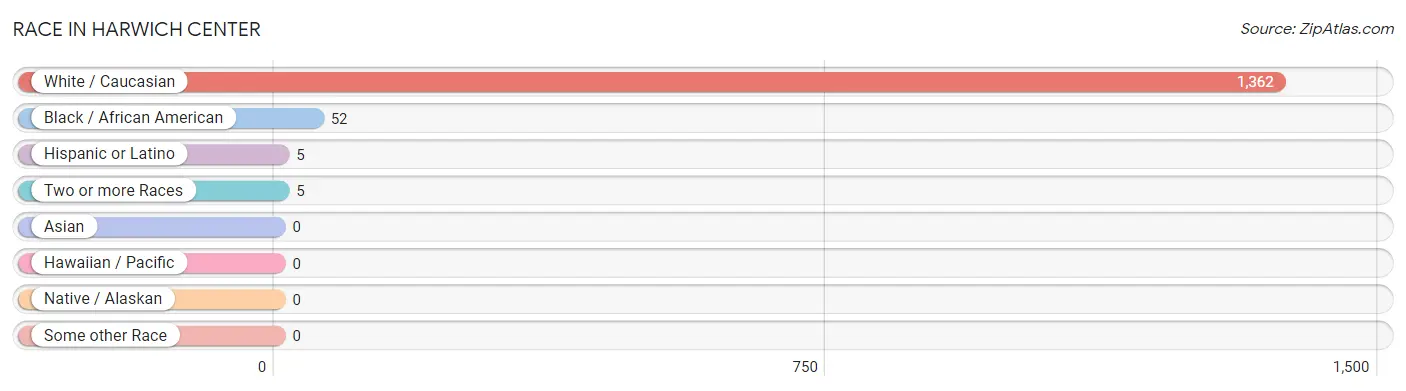
| Race | # Population | % Population |
| Asian | 0 | 0.0% |
| Black / African American | 52 | 3.7% |
| Hawaiian / Pacific | 0 | 0.0% |
| Hispanic or Latino | 5 | 0.4% |
| Native / Alaskan | 0 | 0.0% |
| White / Caucasian | 1,362 | 96.0% |
| Two or more Races | 5 | 0.4% |
| Some other Race | 0 | 0.0% |
| Total | 1,419 | 100.0% |
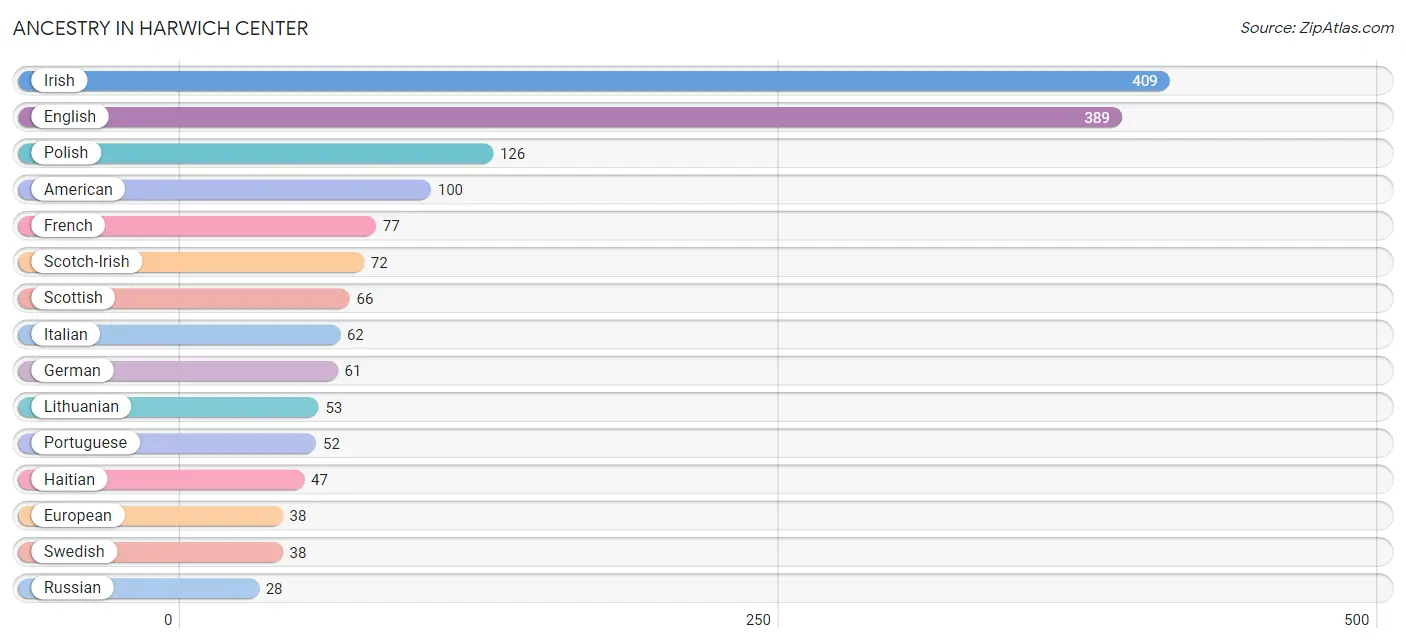
Ancestry in Harwich Center
The most populous ancestries reported in Harwich Center are Irish (409 | 28.8%), English (389 | 27.4%), Polish (126 | 8.9%), American (100 | 7.0%), and French (77 | 5.4%), together accounting for 77.6% of all Harwich Center residents.
| Ancestry | # Population | % Population |
| American | 100 | 7.0% |
| Austrian | 13 | 0.9% |
| Canadian | 10 | 0.7% |
| Danish | 13 | 0.9% |
| Eastern European | 17 | 1.2% |
| English | 389 | 27.4% |
| European | 38 | 2.7% |
| French | 77 | 5.4% |
| French Canadian | 26 | 1.8% |
| German | 61 | 4.3% |
| Greek | 11 | 0.8% |
| Haitian | 47 | 3.3% |
| Irish | 409 | 28.8% |
| Italian | 62 | 4.4% |
| Lithuanian | 53 | 3.7% |
| Polish | 126 | 8.9% |
| Portuguese | 52 | 3.7% |
| Puerto Rican | 5 | 0.4% |
| Russian | 28 | 2.0% |
| Scotch-Irish | 72 | 5.1% |
| Scottish | 66 | 4.6% |
| Swedish | 38 | 2.7% |
| Ukrainian | 11 | 0.8% | View All 23 Rows |
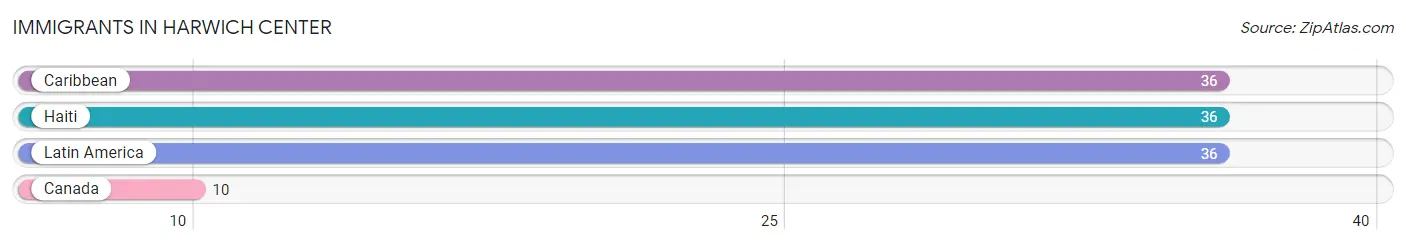
Immigrants in Harwich Center
The most numerous immigrant groups reported in Harwich Center came from Caribbean (36 | 2.5%), Haiti (36 | 2.5%), Latin America (36 | 2.5%), and Canada (10 | 0.7%), together accounting for 8.3% of all Harwich Center residents.
| Immigration Origin | # Population | % Population |
| Canada | 10 | 0.7% |
| Caribbean | 36 | 2.5% |
| Haiti | 36 | 2.5% |
| Latin America | 36 | 2.5% | View All 4 Rows |
Sex and Age in Harwich Center
Sex and Age in Harwich Center
The most populous age groups in Harwich Center are 65 to 69 Years (85 | 14.7%) for men and 65 to 69 Years (144 | 17.1%) for women.
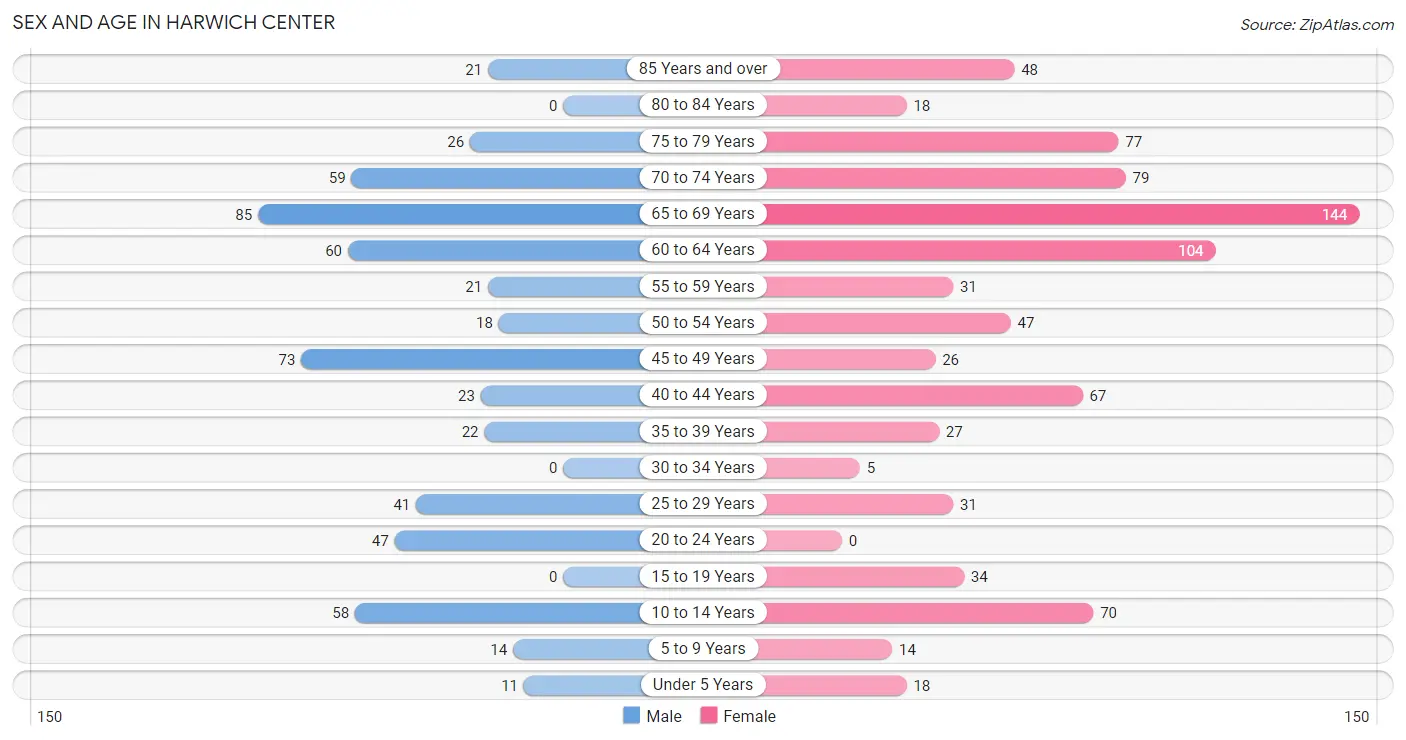
| Age Bracket | Male | Female |
| Under 5 Years | 11 (1.9%) | 18 (2.1%) |
| 5 to 9 Years | 14 (2.4%) | 14 (1.7%) |
| 10 to 14 Years | 58 (10.0%) | 70 (8.3%) |
| 15 to 19 Years | 0 (0.0%) | 34 (4.1%) |
| 20 to 24 Years | 47 (8.1%) | 0 (0.0%) |
| 25 to 29 Years | 41 (7.1%) | 31 (3.7%) |
| 30 to 34 Years | 0 (0.0%) | 5 (0.6%) |
| 35 to 39 Years | 22 (3.8%) | 27 (3.2%) |
| 40 to 44 Years | 23 (4.0%) | 67 (8.0%) |
| 45 to 49 Years | 73 (12.6%) | 26 (3.1%) |
| 50 to 54 Years | 18 (3.1%) | 47 (5.6%) |
| 55 to 59 Years | 21 (3.6%) | 31 (3.7%) |
| 60 to 64 Years | 60 (10.4%) | 104 (12.4%) |
| 65 to 69 Years | 85 (14.7%) | 144 (17.1%) |
| 70 to 74 Years | 59 (10.2%) | 79 (9.4%) |
| 75 to 79 Years | 26 (4.5%) | 77 (9.2%) |
| 80 to 84 Years | 0 (0.0%) | 18 (2.1%) |
| 85 Years and over | 21 (3.6%) | 48 (5.7%) |
| Total | 579 (100.0%) | 840 (100.0%) |
Families and Households in Harwich Center
Median Family Size in Harwich Center
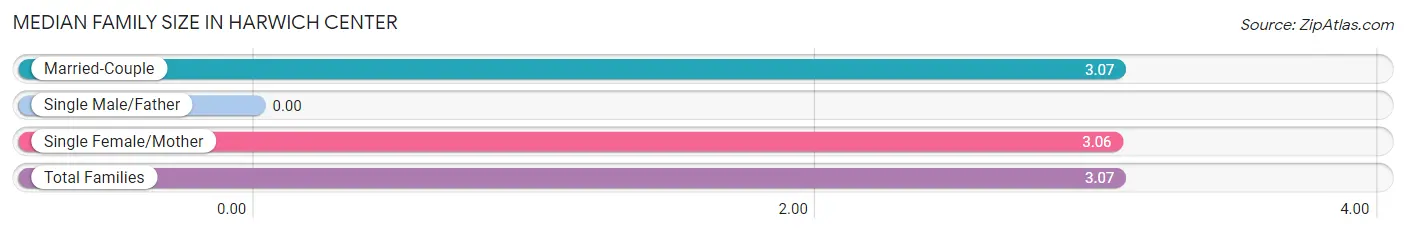
| Family Type | # Families | Family Size |
| Married-Couple | 271 (89.4%) | 3.07 |
| Single Male/Father | 0 (0.0%) | - |
| Single Female/Mother | 32 (10.6%) | 3.06 |
| Total Families | 303 (100.0%) | 3.07 |
Median Household Size in Harwich Center
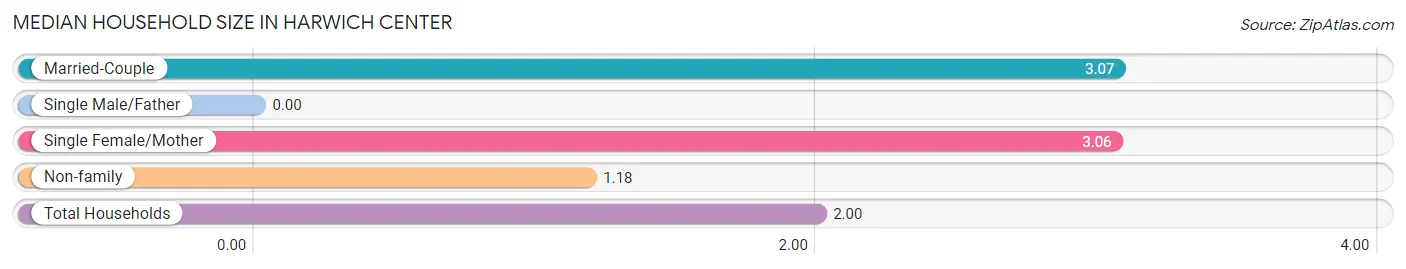
| Household Type | # Households | Household Size |
| Married-Couple | 271 (39.1%) | 3.07 |
| Single Male/Father | 0 (0.0%) | - |
| Single Female/Mother | 32 (4.6%) | 3.06 |
| Non-family | 391 (56.3%) | 1.18 |
| Total Households | 694 (100.0%) | 2.00 |
Household Size by Marriage Status in Harwich Center
Out of a total of 694 households in Harwich Center, 303 (43.7%) are family households, while 391 (56.3%) are nonfamily households. The most numerous type of family households are 2-person households, comprising 144, and the most common type of nonfamily households are 1-person households, comprising 326.
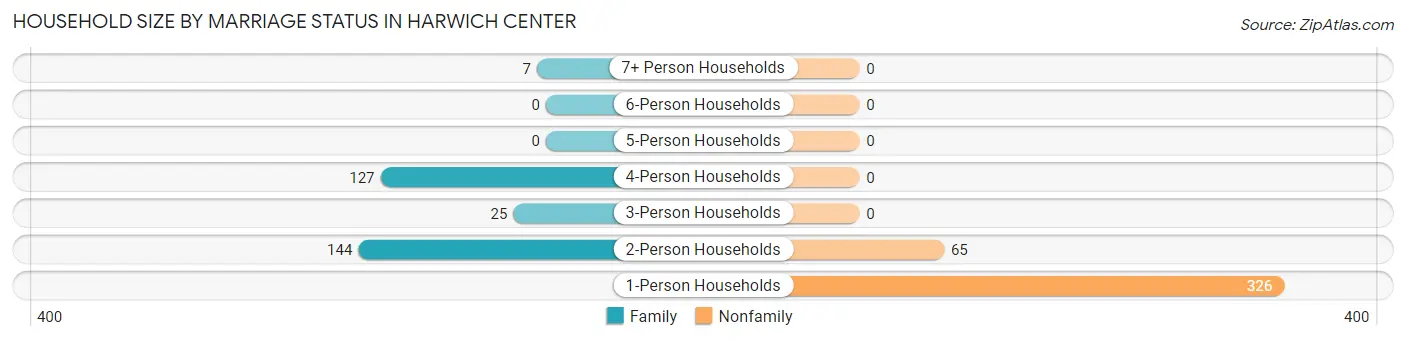
| Household Size | Family Households | Nonfamily Households |
| 1-Person Households | - | 326 (47.0%) |
| 2-Person Households | 144 (20.7%) | 65 (9.4%) |
| 3-Person Households | 25 (3.6%) | 0 (0.0%) |
| 4-Person Households | 127 (18.3%) | 0 (0.0%) |
| 5-Person Households | 0 (0.0%) | 0 (0.0%) |
| 6-Person Households | 0 (0.0%) | 0 (0.0%) |
| 7+ Person Households | 7 (1.0%) | 0 (0.0%) |
| Total | 303 (43.7%) | 391 (56.3%) |
Female Fertility in Harwich Center
Fertility by Age in Harwich Center
| Age Bracket | Women with Births | Births / 1,000 Women |
| 15 to 19 years | 0 (0.0%) | 0.0 |
| 20 to 34 years | 0 (0.0%) | 0.0 |
| 35 to 50 years | 0 (0.0%) | 0.0 |
| Total | 0 (0.0%) | 0.0 |
Fertility by Age by Marriage Status in Harwich Center
| Age Bracket | Married | Unmarried |
| 15 to 19 years | 0 (0.0%) | 0 (0.0%) |
| 20 to 34 years | 0 (0.0%) | 0 (0.0%) |
| 35 to 50 years | 0 (0.0%) | 0 (0.0%) |
| Total | 0 (0.0%) | 0 (0.0%) |
Fertility by Education in Harwich Center
| Educational Attainment | Women with Births | Births / 1,000 Women |
| Less than High School | 0 (0.0%) | 0.0 |
| High School Diploma | 0 (0.0%) | 0.0 |
| College or Associate's Degree | 0 (0.0%) | 0.0 |
| Bachelor's Degree | 0 (0.0%) | 0.0 |
| Graduate Degree | 0 (0.0%) | 0.0 |
| Total | 0 (0.0%) | 0.0 |
Fertility by Education by Marriage Status in Harwich Center
| Educational Attainment | Married | Unmarried |
| Less than High School | 0 (0.0%) | 0 (0.0%) |
| High School Diploma | 0 (0.0%) | 0 (0.0%) |
| College or Associate's Degree | 0 (0.0%) | 0 (0.0%) |
| Bachelor's Degree | 0 (0.0%) | 0 (0.0%) |
| Graduate Degree | 0 (0.0%) | 0 (0.0%) |
| Total | 0 (0.0%) | 0 (0.0%) |
Employment Characteristics in Harwich Center
Employment by Class of Employer in Harwich Center
Among the 588 employed individuals in Harwich Center, private company employees (231 | 39.3%), self-employed (not incorporated) (131 | 22.3%), and not-for-profit organizations (125 | 21.3%) make up the most common classes of employment.
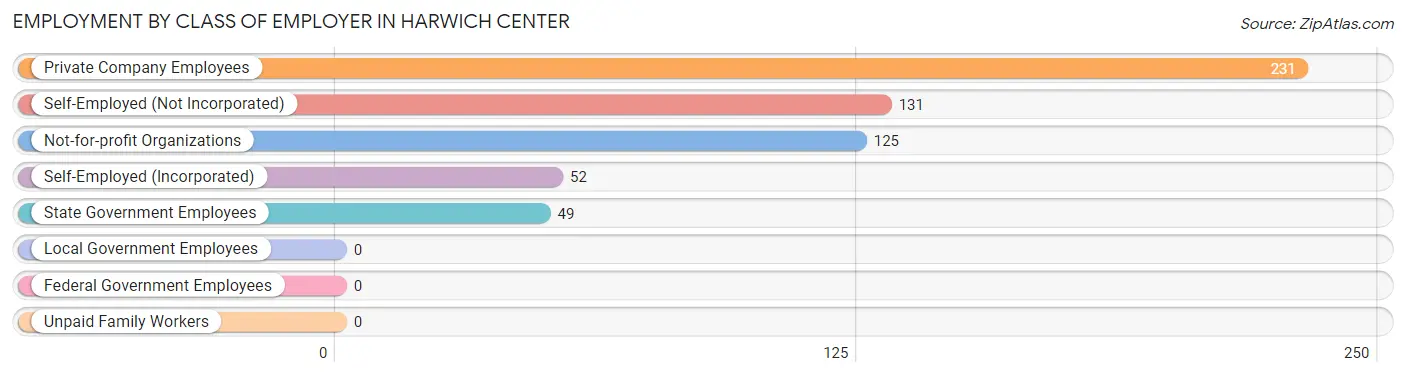
| Employer Class | # Employees | % Employees |
| Private Company Employees | 231 | 39.3% |
| Self-Employed (Incorporated) | 52 | 8.8% |
| Self-Employed (Not Incorporated) | 131 | 22.3% |
| Not-for-profit Organizations | 125 | 21.3% |
| Local Government Employees | 0 | 0.0% |
| State Government Employees | 49 | 8.3% |
| Federal Government Employees | 0 | 0.0% |
| Unpaid Family Workers | 0 | 0.0% |
| Total | 588 | 100.0% |
Employment Status by Age in Harwich Center
According to the labor force statistics for Harwich Center, out of the total population over 16 years of age (1,234), 51.3% or 633 individuals are in the labor force, with 7.1% or 45 of them unemployed. The age group with the highest labor force participation rate is 25 to 29 years, with 100.0% or 72 individuals in the labor force. Within the labor force, the 30 to 34 years age range has the highest percentage of unemployed individuals, with 100.0% or 5 of them being unemployed.
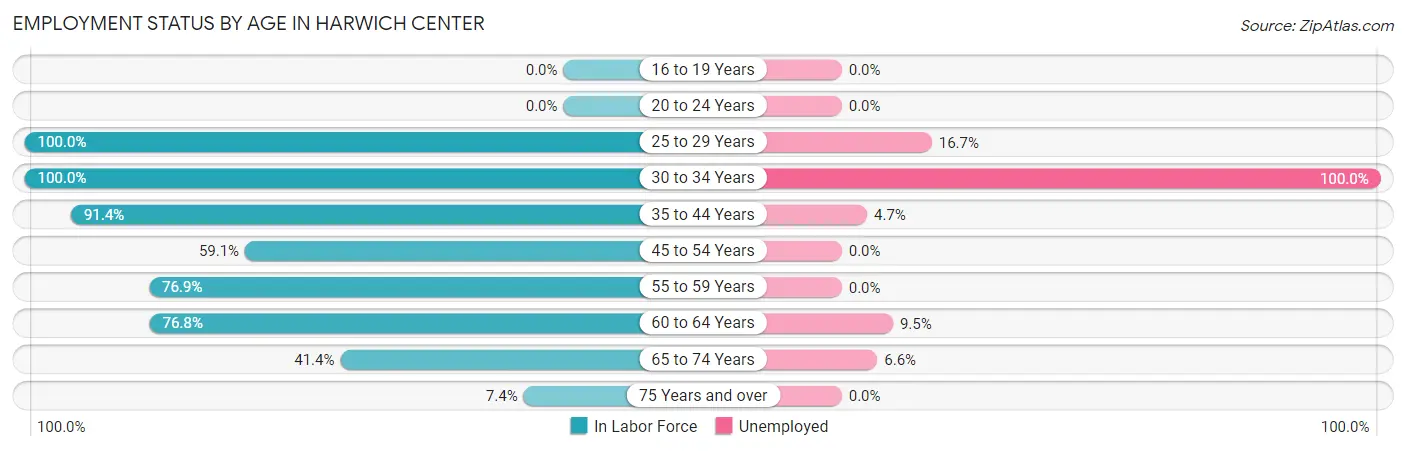
| Age Bracket | In Labor Force | Unemployed |
| 16 to 19 Years | 0 (0.0%) | 0 (0.0%) |
| 20 to 24 Years | 0 (0.0%) | 0 (0.0%) |
| 25 to 29 Years | 72 (100.0%) | 12 (16.7%) |
| 30 to 34 Years | 5 (100.0%) | 5 (100.0%) |
| 35 to 44 Years | 127 (91.4%) | 6 (4.7%) |
| 45 to 54 Years | 97 (59.1%) | 0 (0.0%) |
| 55 to 59 Years | 40 (76.9%) | 0 (0.0%) |
| 60 to 64 Years | 126 (76.8%) | 12 (9.5%) |
| 65 to 74 Years | 152 (41.4%) | 10 (6.6%) |
| 75 Years and over | 14 (7.4%) | 0 (0.0%) |
| Total | 633 (51.3%) | 45 (7.1%) |
Employment Status by Educational Attainment in Harwich Center
According to labor force statistics for Harwich Center, 78.4% of individuals (467) out of the total population between 25 and 64 years of age (596) are in the labor force, with 7.5% or 35 of them being unemployed. The group with the highest labor force participation rate are those with the educational attainment of college / associate degree, with 100.0% or 80 individuals in the labor force. Within the labor force, individuals with college / associate degree education have the highest percentage of unemployment, with 15.0% or 12 of them being unemployed.
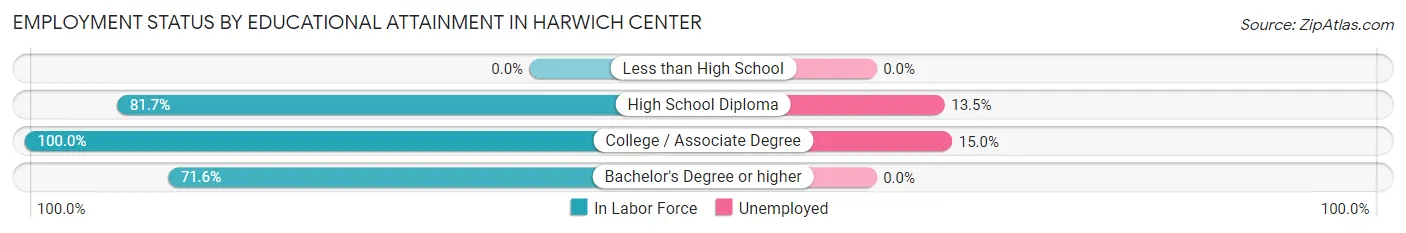
| Educational Attainment | In Labor Force | Unemployed |
| Less than High School | 0 (0.0%) | 0 (0.0%) |
| High School Diploma | 170 (81.7%) | 28 (13.5%) |
| College / Associate Degree | 80 (100.0%) | 12 (15.0%) |
| Bachelor's Degree or higher | 217 (71.6%) | 0 (0.0%) |
| Total | 467 (78.4%) | 45 (7.5%) |
Employment Occupations by Sex in Harwich Center
Management, Business, Science and Arts Occupations
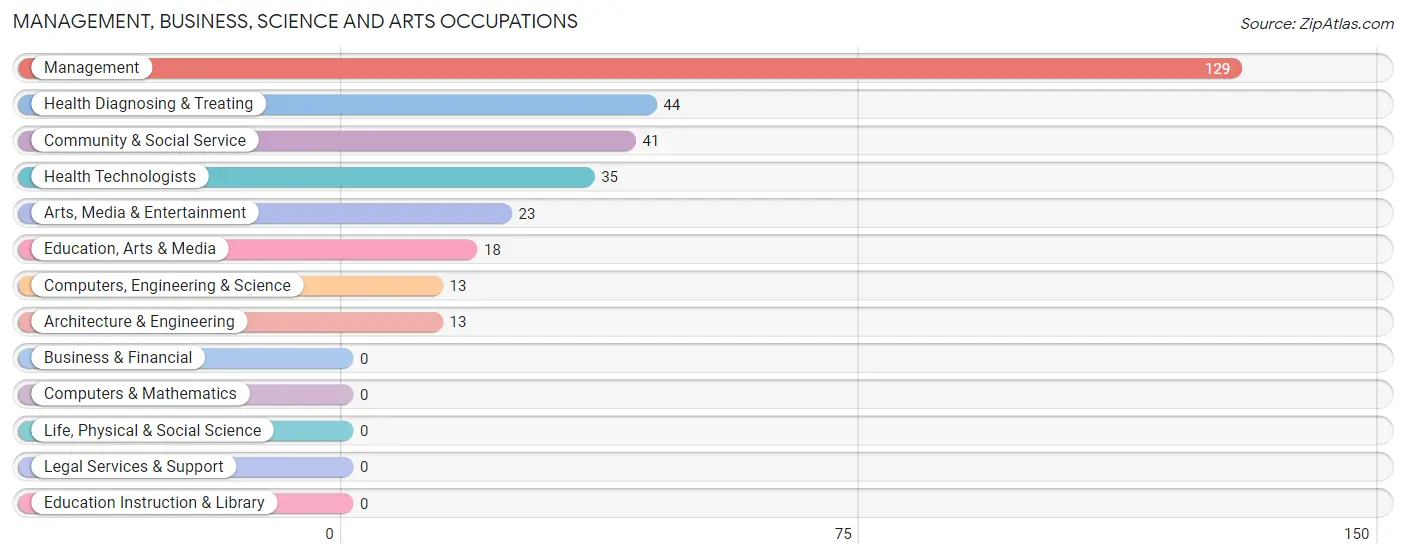
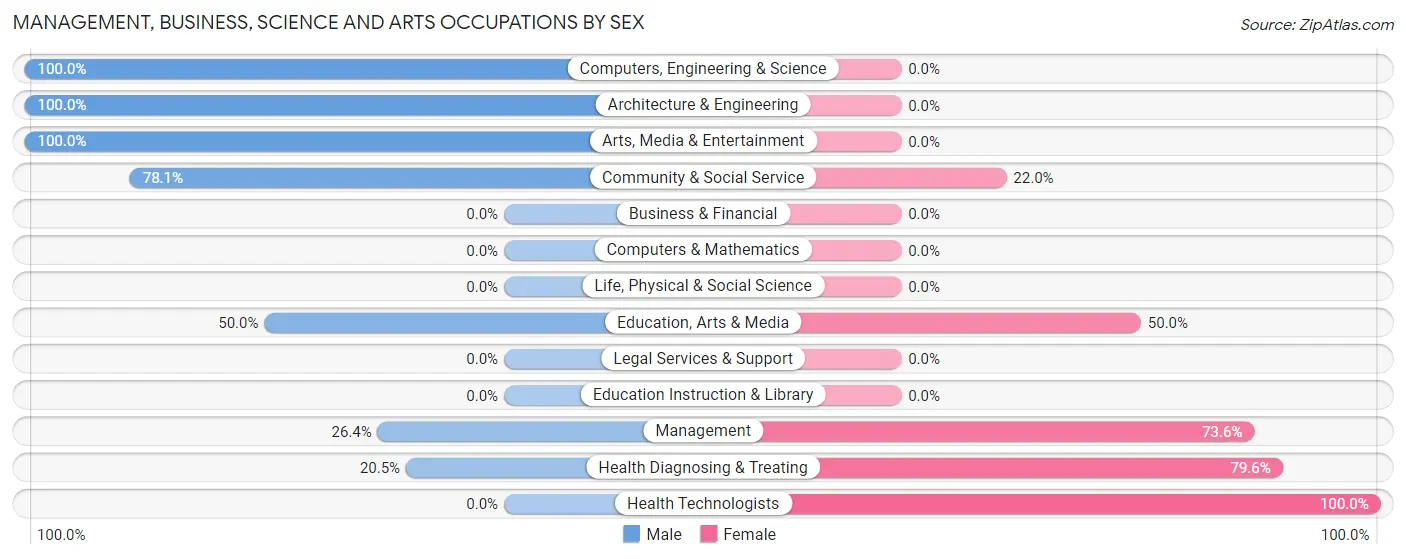
The most common Management, Business, Science and Arts occupations in Harwich Center are Management (129 | 21.9%), Health Diagnosing & Treating (44 | 7.5%), Community & Social Service (41 | 7.0%), Health Technologists (35 | 5.9%), and Arts, Media & Entertainment (23 | 3.9%).
Management, Business, Science and Arts Occupations by Sex
Within the Management, Business, Science and Arts occupations in Harwich Center, the most male-oriented occupations are Computers, Engineering & Science (100.0%), Architecture & Engineering (100.0%), and Arts, Media & Entertainment (100.0%), while the most female-oriented occupations are Health Technologists (100.0%), Health Diagnosing & Treating (79.5%), and Management (73.6%).
| Occupation | Male | Female |
| Management | 34 (26.4%) | 95 (73.6%) |
| Business & Financial | 0 (0.0%) | 0 (0.0%) |
| Computers, Engineering & Science | 13 (100.0%) | 0 (0.0%) |
| Computers & Mathematics | 0 (0.0%) | 0 (0.0%) |
| Architecture & Engineering | 13 (100.0%) | 0 (0.0%) |
| Life, Physical & Social Science | 0 (0.0%) | 0 (0.0%) |
| Community & Social Service | 32 (78.0%) | 9 (22.0%) |
| Education, Arts & Media | 9 (50.0%) | 9 (50.0%) |
| Legal Services & Support | 0 (0.0%) | 0 (0.0%) |
| Education Instruction & Library | 0 (0.0%) | 0 (0.0%) |
| Arts, Media & Entertainment | 23 (100.0%) | 0 (0.0%) |
| Health Diagnosing & Treating | 9 (20.4%) | 35 (79.5%) |
| Health Technologists | 0 (0.0%) | 35 (100.0%) |
| Total (Category) | 88 (38.8%) | 139 (61.2%) |
| Total (Overall) | 269 (45.8%) | 319 (54.2%) |
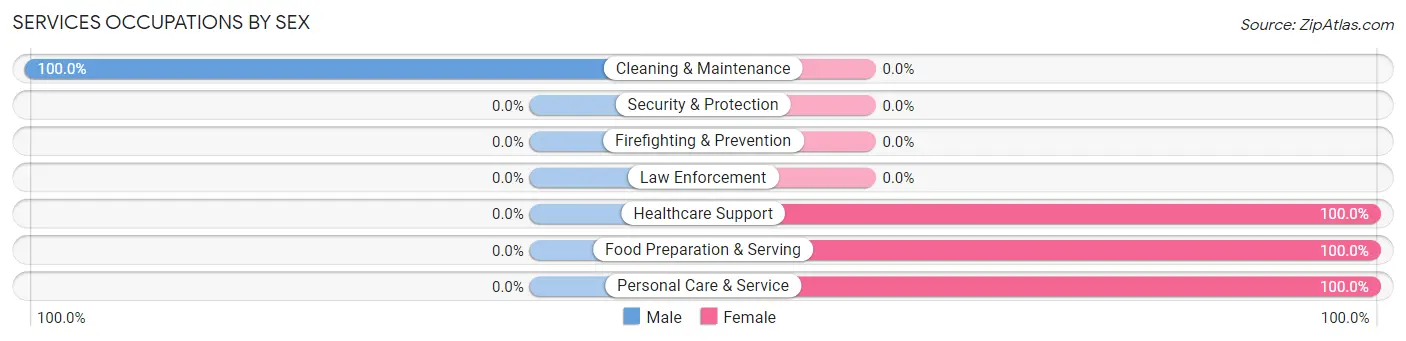
Services Occupations
The most common Services occupations in Harwich Center are Healthcare Support (30 | 5.1%), Personal Care & Service (29 | 4.9%), Cleaning & Maintenance (14 | 2.4%), and Food Preparation & Serving (11 | 1.9%).

Services Occupations by Sex
| Occupation | Male | Female |
| Healthcare Support | 0 (0.0%) | 30 (100.0%) |
| Security & Protection | 0 (0.0%) | 0 (0.0%) |
| Firefighting & Prevention | 0 (0.0%) | 0 (0.0%) |
| Law Enforcement | 0 (0.0%) | 0 (0.0%) |
| Food Preparation & Serving | 0 (0.0%) | 11 (100.0%) |
| Cleaning & Maintenance | 14 (100.0%) | 0 (0.0%) |
| Personal Care & Service | 0 (0.0%) | 29 (100.0%) |
| Total (Category) | 14 (16.7%) | 70 (83.3%) |
| Total (Overall) | 269 (45.8%) | 319 (54.2%) |
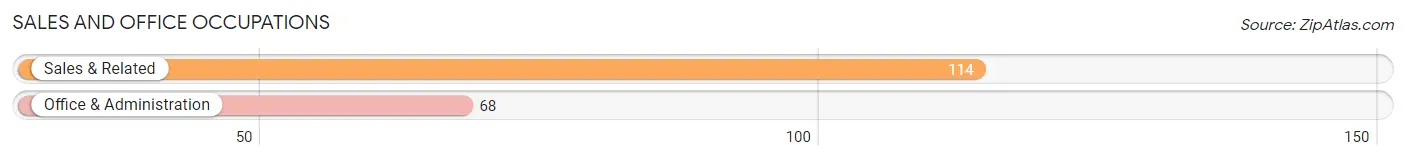
Sales and Office Occupations
The most common Sales and Office occupations in Harwich Center are Sales & Related (114 | 19.4%), and Office & Administration (68 | 11.6%).
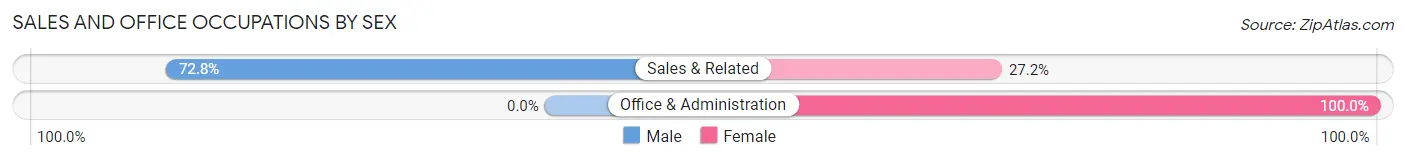
Sales and Office Occupations by Sex
| Occupation | Male | Female |
| Sales & Related | 83 (72.8%) | 31 (27.2%) |
| Office & Administration | 0 (0.0%) | 68 (100.0%) |
| Total (Category) | 83 (45.6%) | 99 (54.4%) |
| Total (Overall) | 269 (45.8%) | 319 (54.2%) |
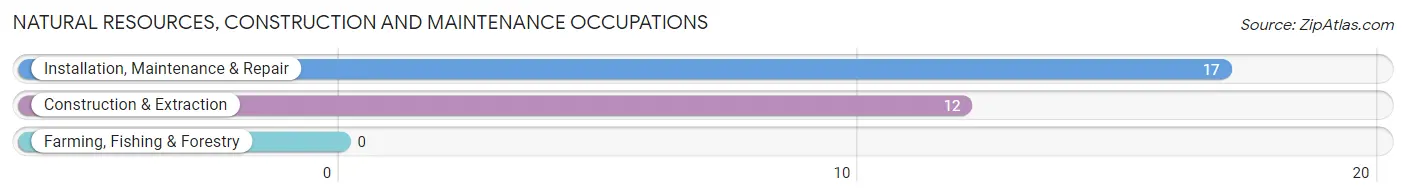
Natural Resources, Construction and Maintenance Occupations
The most common Natural Resources, Construction and Maintenance occupations in Harwich Center are Installation, Maintenance & Repair (17 | 2.9%), and Construction & Extraction (12 | 2.0%).
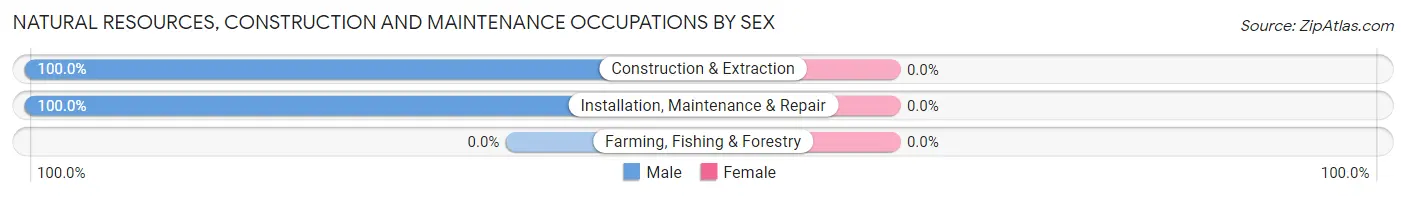
Natural Resources, Construction and Maintenance Occupations by Sex
| Occupation | Male | Female |
| Farming, Fishing & Forestry | 0 (0.0%) | 0 (0.0%) |
| Construction & Extraction | 12 (100.0%) | 0 (0.0%) |
| Installation, Maintenance & Repair | 17 (100.0%) | 0 (0.0%) |
| Total (Category) | 29 (100.0%) | 0 (0.0%) |
| Total (Overall) | 269 (45.8%) | 319 (54.2%) |
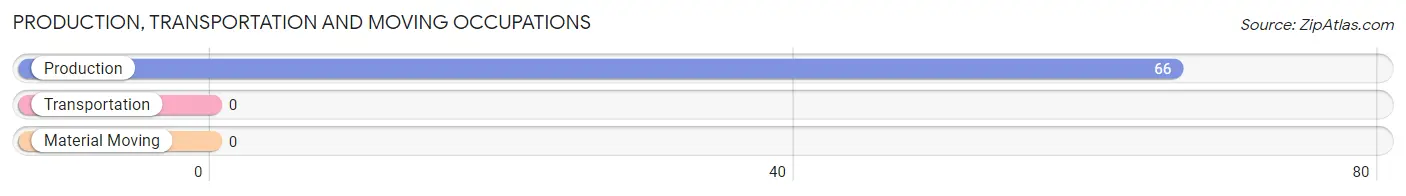
Production, Transportation and Moving Occupations
The most common Production, Transportation and Moving occupations in Harwich Center are , and Production (66 | 11.2%).
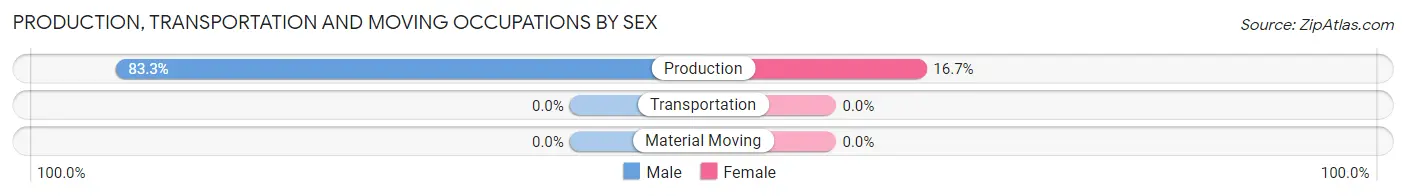
Production, Transportation and Moving Occupations by Sex
| Occupation | Male | Female |
| Production | 55 (83.3%) | 11 (16.7%) |
| Transportation | 0 (0.0%) | 0 (0.0%) |
| Material Moving | 0 (0.0%) | 0 (0.0%) |
| Total (Category) | 55 (83.3%) | 11 (16.7%) |
| Total (Overall) | 269 (45.8%) | 319 (54.2%) |
Employment Industries by Sex in Harwich Center
Employment Industries in Harwich Center
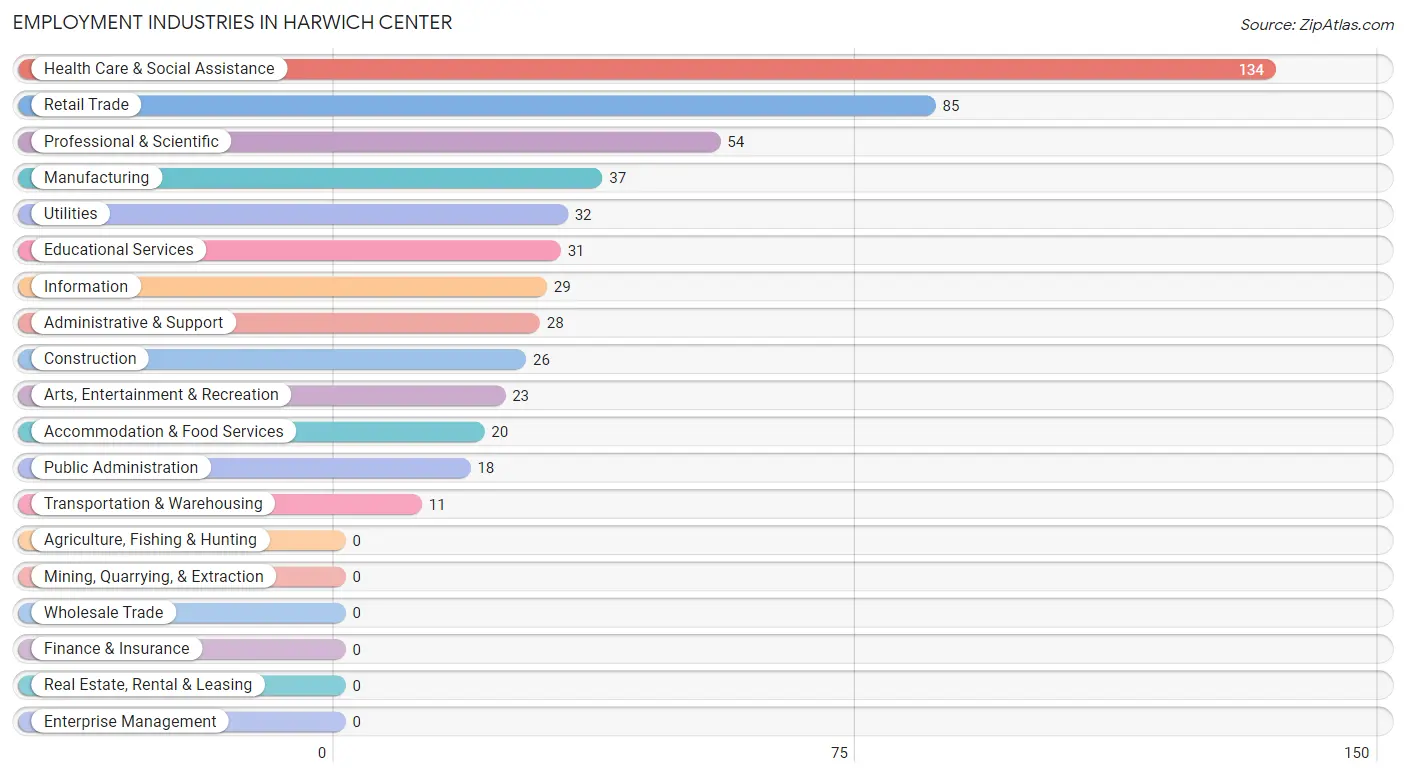
The major employment industries in Harwich Center include Health Care & Social Assistance (134 | 22.8%), Retail Trade (85 | 14.5%), Professional & Scientific (54 | 9.2%), Manufacturing (37 | 6.3%), and Utilities (32 | 5.4%).
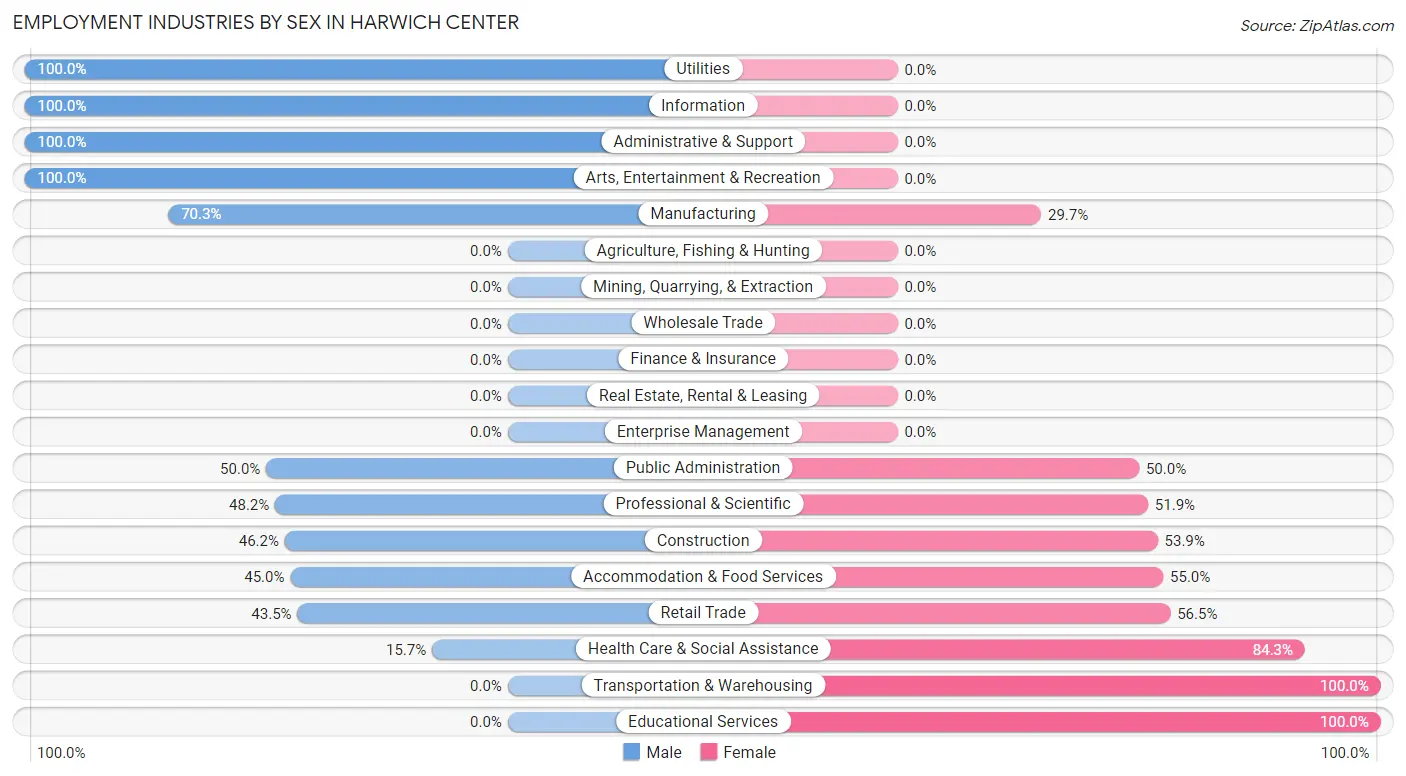
Employment Industries by Sex in Harwich Center
The Harwich Center industries that see more men than women are Utilities (100.0%), Information (100.0%), and Administrative & Support (100.0%), whereas the industries that tend to have a higher number of women are Transportation & Warehousing (100.0%), Educational Services (100.0%), and Health Care & Social Assistance (84.3%).
| Industry | Male | Female |
| Agriculture, Fishing & Hunting | 0 (0.0%) | 0 (0.0%) |
| Mining, Quarrying, & Extraction | 0 (0.0%) | 0 (0.0%) |
| Construction | 12 (46.2%) | 14 (53.8%) |
| Manufacturing | 26 (70.3%) | 11 (29.7%) |
| Wholesale Trade | 0 (0.0%) | 0 (0.0%) |
| Retail Trade | 37 (43.5%) | 48 (56.5%) |
| Transportation & Warehousing | 0 (0.0%) | 11 (100.0%) |
| Utilities | 32 (100.0%) | 0 (0.0%) |
| Information | 29 (100.0%) | 0 (0.0%) |
| Finance & Insurance | 0 (0.0%) | 0 (0.0%) |
| Real Estate, Rental & Leasing | 0 (0.0%) | 0 (0.0%) |
| Professional & Scientific | 26 (48.1%) | 28 (51.8%) |
| Enterprise Management | 0 (0.0%) | 0 (0.0%) |
| Administrative & Support | 28 (100.0%) | 0 (0.0%) |
| Educational Services | 0 (0.0%) | 31 (100.0%) |
| Health Care & Social Assistance | 21 (15.7%) | 113 (84.3%) |
| Arts, Entertainment & Recreation | 23 (100.0%) | 0 (0.0%) |
| Accommodation & Food Services | 9 (45.0%) | 11 (55.0%) |
| Public Administration | 9 (50.0%) | 9 (50.0%) |
| Total | 269 (45.8%) | 319 (54.2%) |
Education in Harwich Center
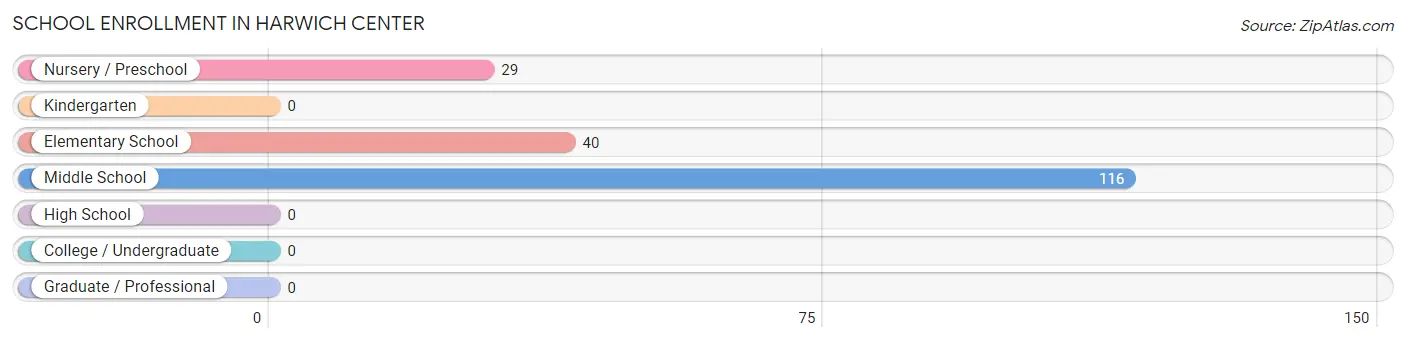
School Enrollment in Harwich Center
The most common levels of schooling among the 185 students in Harwich Center are middle school (116 | 62.7%), elementary school (40 | 21.6%), and nursery / preschool (29 | 15.7%).
| School Level | # Students | % Students |
| Nursery / Preschool | 29 | 15.7% |
| Kindergarten | 0 | 0.0% |
| Elementary School | 40 | 21.6% |
| Middle School | 116 | 62.7% |
| High School | 0 | 0.0% |
| College / Undergraduate | 0 | 0.0% |
| Graduate / Professional | 0 | 0.0% |
| Total | 185 | 100.0% |
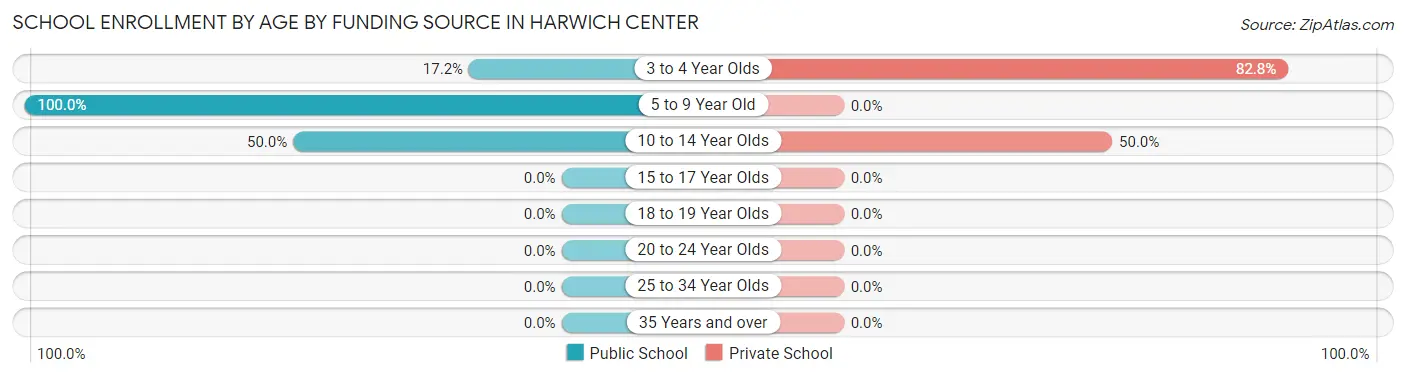
School Enrollment by Age by Funding Source in Harwich Center
Out of a total of 185 students who are enrolled in schools in Harwich Center, 88 (47.6%) attend a private institution, while the remaining 97 (52.4%) are enrolled in public schools. The age group of 3 to 4 year olds has the highest likelihood of being enrolled in private schools, with 24 (82.8% in the age bracket) enrolled. Conversely, the age group of 5 to 9 year old has the lowest likelihood of being enrolled in a private school, with 28 (100.0% in the age bracket) attending a public institution.
| Age Bracket | Public School | Private School |
| 3 to 4 Year Olds | 5 (17.2%) | 24 (82.8%) |
| 5 to 9 Year Old | 28 (100.0%) | 0 (0.0%) |
| 10 to 14 Year Olds | 64 (50.0%) | 64 (50.0%) |
| 15 to 17 Year Olds | 0 (0.0%) | 0 (0.0%) |
| 18 to 19 Year Olds | 0 (0.0%) | 0 (0.0%) |
| 20 to 24 Year Olds | 0 (0.0%) | 0 (0.0%) |
| 25 to 34 Year Olds | 0 (0.0%) | 0 (0.0%) |
| 35 Years and over | 0 (0.0%) | 0 (0.0%) |
| Total | 97 (52.4%) | 88 (47.6%) |
Educational Attainment by Field of Study in Harwich Center
Business (111 | 16.8%), social sciences (104 | 15.8%), literature & languages (102 | 15.5%), science & technology (69 | 10.5%), and education (61 | 9.3%) are the most common fields of study among 659 individuals in Harwich Center who have obtained a bachelor's degree or higher.
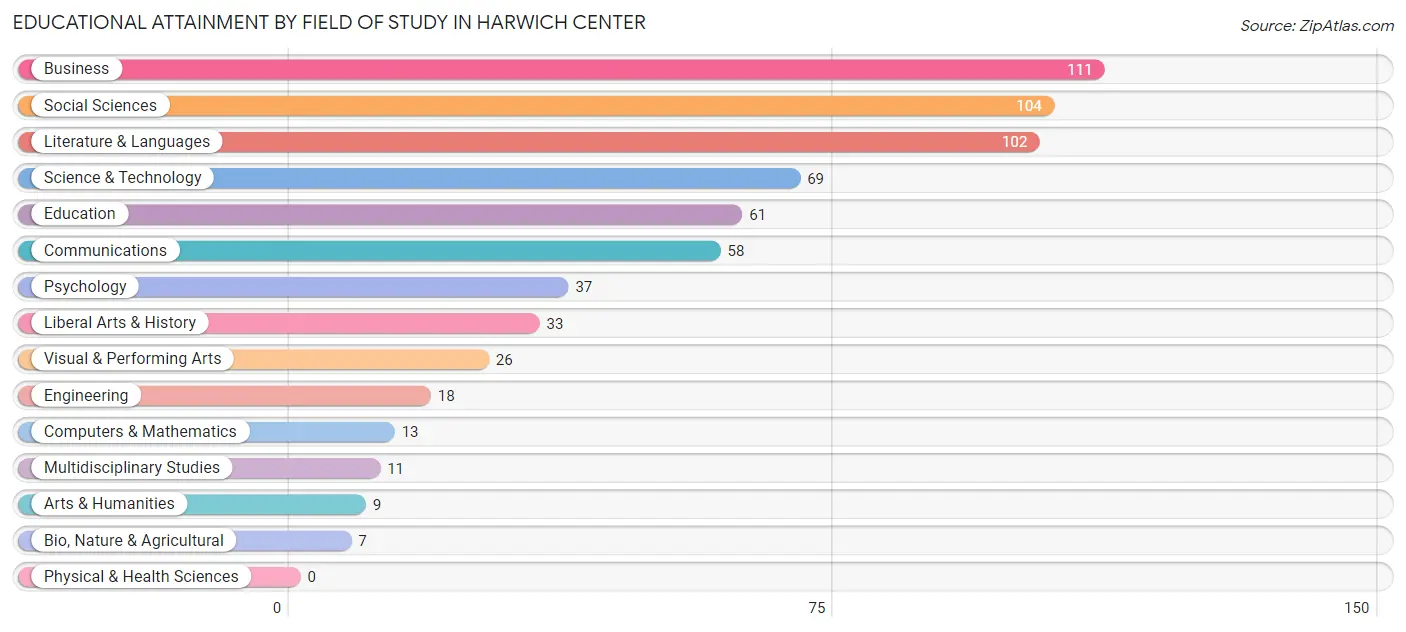
| Field of Study | # Graduates | % Graduates |
| Computers & Mathematics | 13 | 2.0% |
| Bio, Nature & Agricultural | 7 | 1.1% |
| Physical & Health Sciences | 0 | 0.0% |
| Psychology | 37 | 5.6% |
| Social Sciences | 104 | 15.8% |
| Engineering | 18 | 2.7% |
| Multidisciplinary Studies | 11 | 1.7% |
| Science & Technology | 69 | 10.5% |
| Business | 111 | 16.8% |
| Education | 61 | 9.3% |
| Literature & Languages | 102 | 15.5% |
| Liberal Arts & History | 33 | 5.0% |
| Visual & Performing Arts | 26 | 4.0% |
| Communications | 58 | 8.8% |
| Arts & Humanities | 9 | 1.4% |
| Total | 659 | 100.0% |
Transportation & Commute in Harwich Center
Vehicle Availability by Sex in Harwich Center
The most prevalent vehicle ownership categories in Harwich Center are males with 2 vehicles (172, accounting for 63.9%) and females with 2 vehicles (147, making up 53.9%).
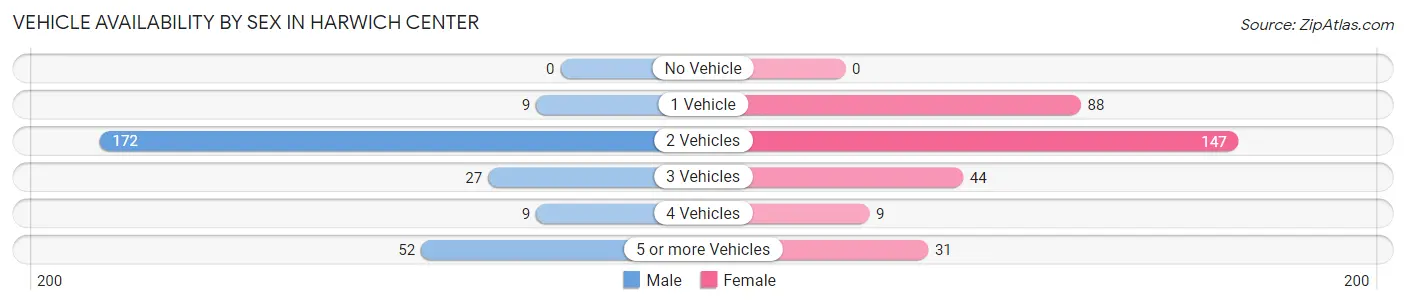
| Vehicles Available | Male | Female |
| No Vehicle | 0 (0.0%) | 0 (0.0%) |
| 1 Vehicle | 9 (3.4%) | 88 (27.6%) |
| 2 Vehicles | 172 (63.9%) | 147 (46.1%) |
| 3 Vehicles | 27 (10.0%) | 44 (13.8%) |
| 4 Vehicles | 9 (3.4%) | 9 (2.8%) |
| 5 or more Vehicles | 52 (19.3%) | 31 (9.7%) |
| Total | 269 (100.0%) | 319 (100.0%) |
Commute Time in Harwich Center
The most frequently occuring commute durations in Harwich Center are 10 to 14 minutes (111 commuters, 22.0%), 20 to 24 minutes (96 commuters, 19.0%), and 5 to 9 minutes (83 commuters, 16.4%).
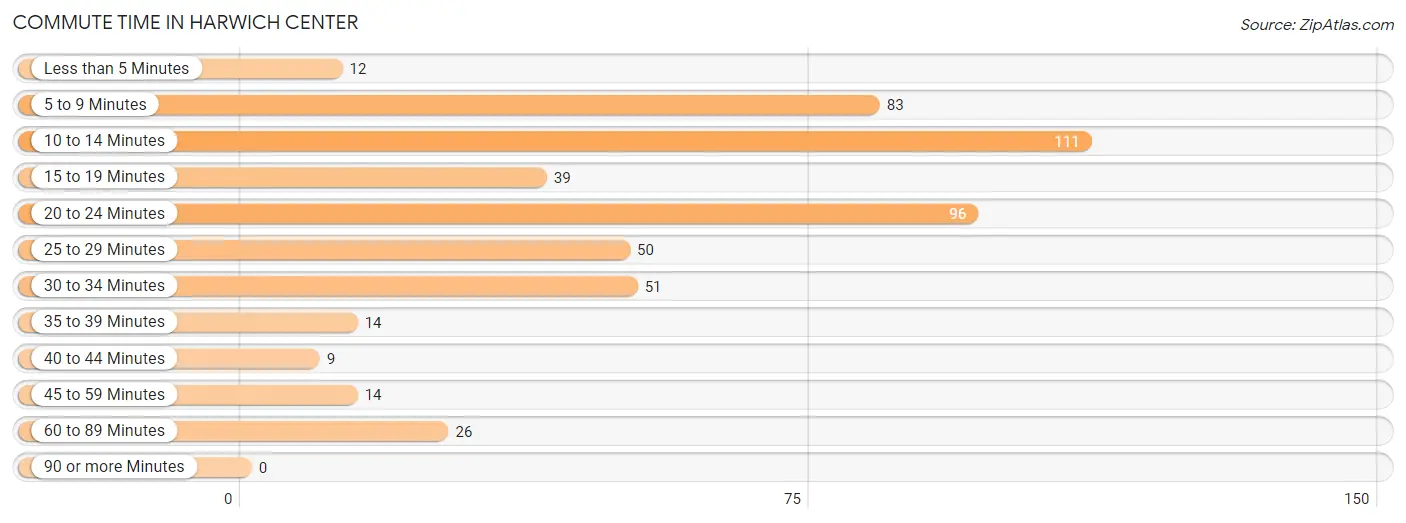
| Commute Time | # Commuters | % Commuters |
| Less than 5 Minutes | 12 | 2.4% |
| 5 to 9 Minutes | 83 | 16.4% |
| 10 to 14 Minutes | 111 | 22.0% |
| 15 to 19 Minutes | 39 | 7.7% |
| 20 to 24 Minutes | 96 | 19.0% |
| 25 to 29 Minutes | 50 | 9.9% |
| 30 to 34 Minutes | 51 | 10.1% |
| 35 to 39 Minutes | 14 | 2.8% |
| 40 to 44 Minutes | 9 | 1.8% |
| 45 to 59 Minutes | 14 | 2.8% |
| 60 to 89 Minutes | 26 | 5.1% |
| 90 or more Minutes | 0 | 0.0% |
Commute Time by Sex in Harwich Center
The most common commute times in Harwich Center are 10 to 14 minutes (52 commuters, 24.0%) for males and 20 to 24 minutes (96 commuters, 33.3%) for females.
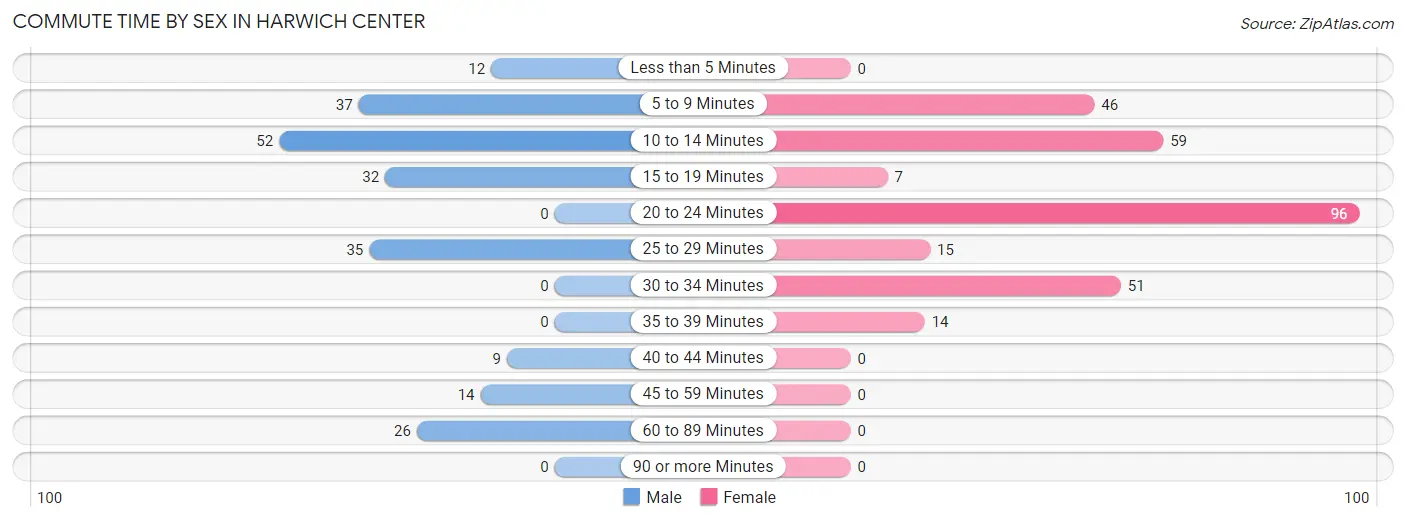
| Commute Time | Male | Female |
| Less than 5 Minutes | 12 (5.5%) | 0 (0.0%) |
| 5 to 9 Minutes | 37 (17.1%) | 46 (16.0%) |
| 10 to 14 Minutes | 52 (24.0%) | 59 (20.5%) |
| 15 to 19 Minutes | 32 (14.7%) | 7 (2.4%) |
| 20 to 24 Minutes | 0 (0.0%) | 96 (33.3%) |
| 25 to 29 Minutes | 35 (16.1%) | 15 (5.2%) |
| 30 to 34 Minutes | 0 (0.0%) | 51 (17.7%) |
| 35 to 39 Minutes | 0 (0.0%) | 14 (4.9%) |
| 40 to 44 Minutes | 9 (4.2%) | 0 (0.0%) |
| 45 to 59 Minutes | 14 (6.5%) | 0 (0.0%) |
| 60 to 89 Minutes | 26 (12.0%) | 0 (0.0%) |
| 90 or more Minutes | 0 (0.0%) | 0 (0.0%) |
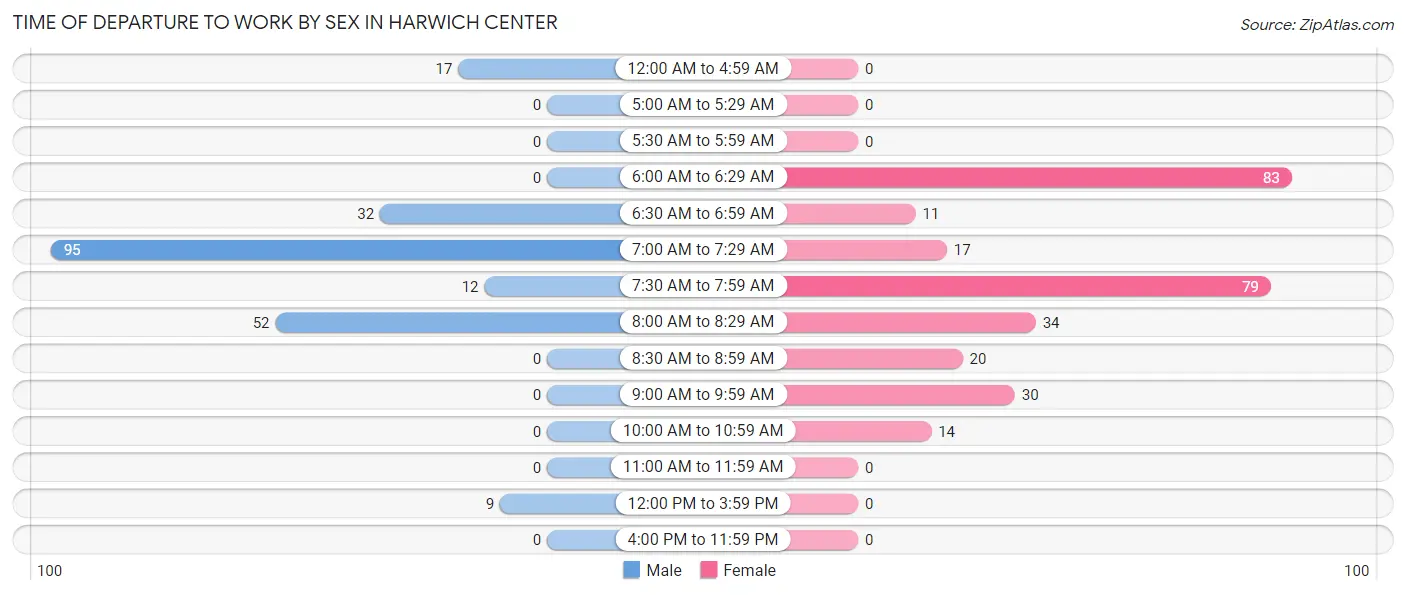
Time of Departure to Work by Sex in Harwich Center
The most frequent times of departure to work in Harwich Center are 7:00 AM to 7:29 AM (95, 43.8%) for males and 6:00 AM to 6:29 AM (83, 28.8%) for females.
| Time of Departure | Male | Female |
| 12:00 AM to 4:59 AM | 17 (7.8%) | 0 (0.0%) |
| 5:00 AM to 5:29 AM | 0 (0.0%) | 0 (0.0%) |
| 5:30 AM to 5:59 AM | 0 (0.0%) | 0 (0.0%) |
| 6:00 AM to 6:29 AM | 0 (0.0%) | 83 (28.8%) |
| 6:30 AM to 6:59 AM | 32 (14.7%) | 11 (3.8%) |
| 7:00 AM to 7:29 AM | 95 (43.8%) | 17 (5.9%) |
| 7:30 AM to 7:59 AM | 12 (5.5%) | 79 (27.4%) |
| 8:00 AM to 8:29 AM | 52 (24.0%) | 34 (11.8%) |
| 8:30 AM to 8:59 AM | 0 (0.0%) | 20 (6.9%) |
| 9:00 AM to 9:59 AM | 0 (0.0%) | 30 (10.4%) |
| 10:00 AM to 10:59 AM | 0 (0.0%) | 14 (4.9%) |
| 11:00 AM to 11:59 AM | 0 (0.0%) | 0 (0.0%) |
| 12:00 PM to 3:59 PM | 9 (4.2%) | 0 (0.0%) |
| 4:00 PM to 11:59 PM | 0 (0.0%) | 0 (0.0%) |
| Total | 217 (100.0%) | 288 (100.0%) |
Housing Occupancy in Harwich Center
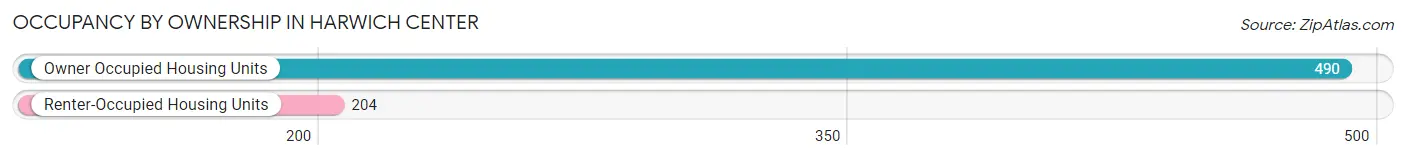
Occupancy by Ownership in Harwich Center
Of the total 694 dwellings in Harwich Center, owner-occupied units account for 490 (70.6%), while renter-occupied units make up 204 (29.4%).
| Occupancy | # Housing Units | % Housing Units |
| Owner Occupied Housing Units | 490 | 70.6% |
| Renter-Occupied Housing Units | 204 | 29.4% |
| Total Occupied Housing Units | 694 | 100.0% |
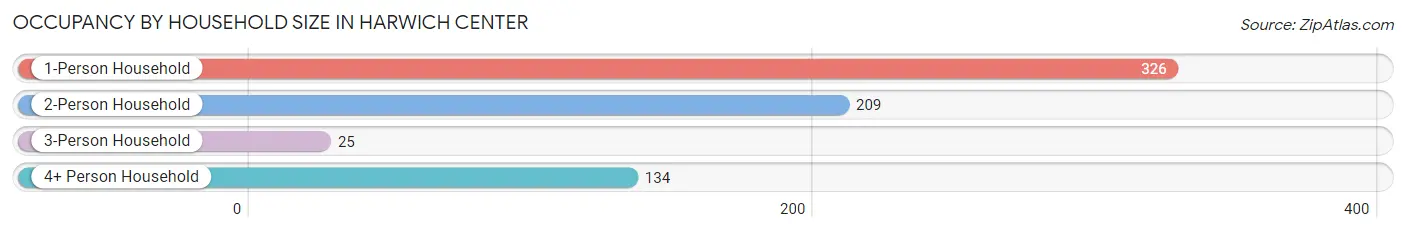
Occupancy by Household Size in Harwich Center
| Household Size | # Housing Units | % Housing Units |
| 1-Person Household | 326 | 47.0% |
| 2-Person Household | 209 | 30.1% |
| 3-Person Household | 25 | 3.6% |
| 4+ Person Household | 134 | 19.3% |
| Total Housing Units | 694 | 100.0% |
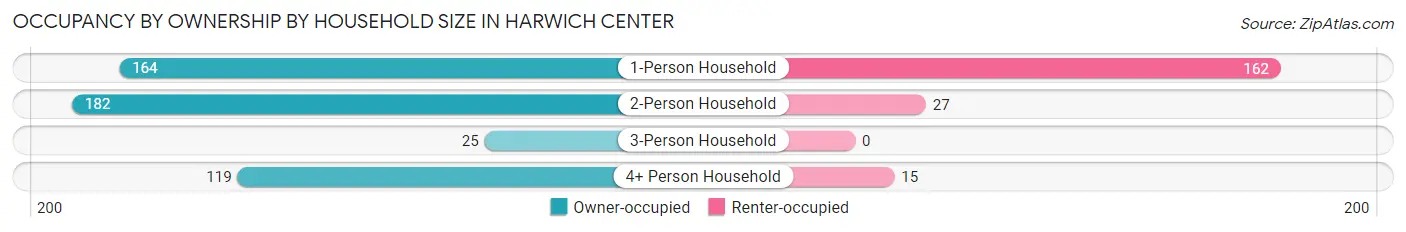
Occupancy by Ownership by Household Size in Harwich Center
| Household Size | Owner-occupied | Renter-occupied |
| 1-Person Household | 164 (50.3%) | 162 (49.7%) |
| 2-Person Household | 182 (87.1%) | 27 (12.9%) |
| 3-Person Household | 25 (100.0%) | 0 (0.0%) |
| 4+ Person Household | 119 (88.8%) | 15 (11.2%) |
| Total Housing Units | 490 (70.6%) | 204 (29.4%) |
Occupancy by Educational Attainment in Harwich Center
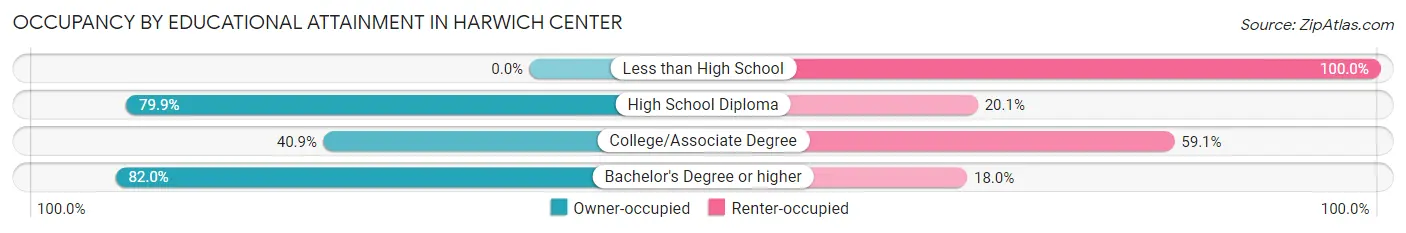
| Household Size | Owner-occupied | Renter-occupied |
| Less than High School | 0 (0.0%) | 13 (100.0%) |
| High School Diploma | 111 (79.9%) | 28 (20.1%) |
| College/Associate Degree | 65 (40.9%) | 94 (59.1%) |
| Bachelor's Degree or higher | 314 (82.0%) | 69 (18.0%) |
Occupancy by Age of Householder in Harwich Center
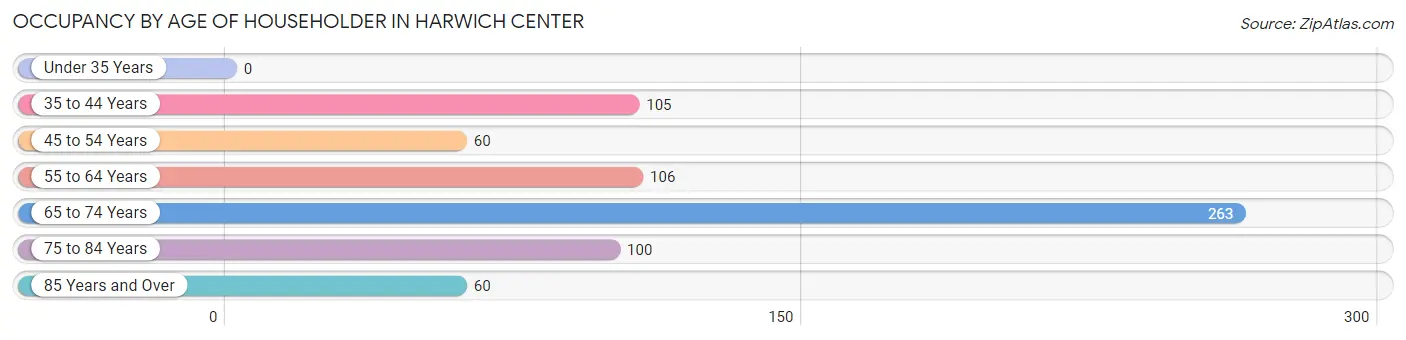
| Age Bracket | # Households | % Households |
| Under 35 Years | 0 | 0.0% |
| 35 to 44 Years | 105 | 15.1% |
| 45 to 54 Years | 60 | 8.6% |
| 55 to 64 Years | 106 | 15.3% |
| 65 to 74 Years | 263 | 37.9% |
| 75 to 84 Years | 100 | 14.4% |
| 85 Years and Over | 60 | 8.6% |
| Total | 694 | 100.0% |
Housing Finances in Harwich Center
Median Income by Occupancy in Harwich Center
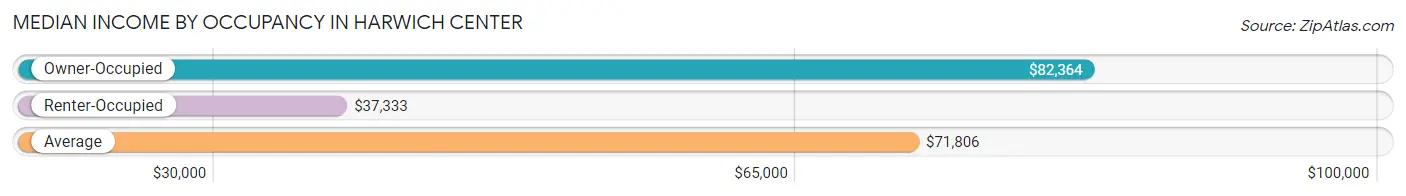
| Occupancy Type | # Households | Median Income |
| Owner-Occupied | 490 (70.6%) | $82,364 |
| Renter-Occupied | 204 (29.4%) | $37,333 |
| Average | 694 (100.0%) | $71,806 |
Occupancy by Householder Income Bracket in Harwich Center
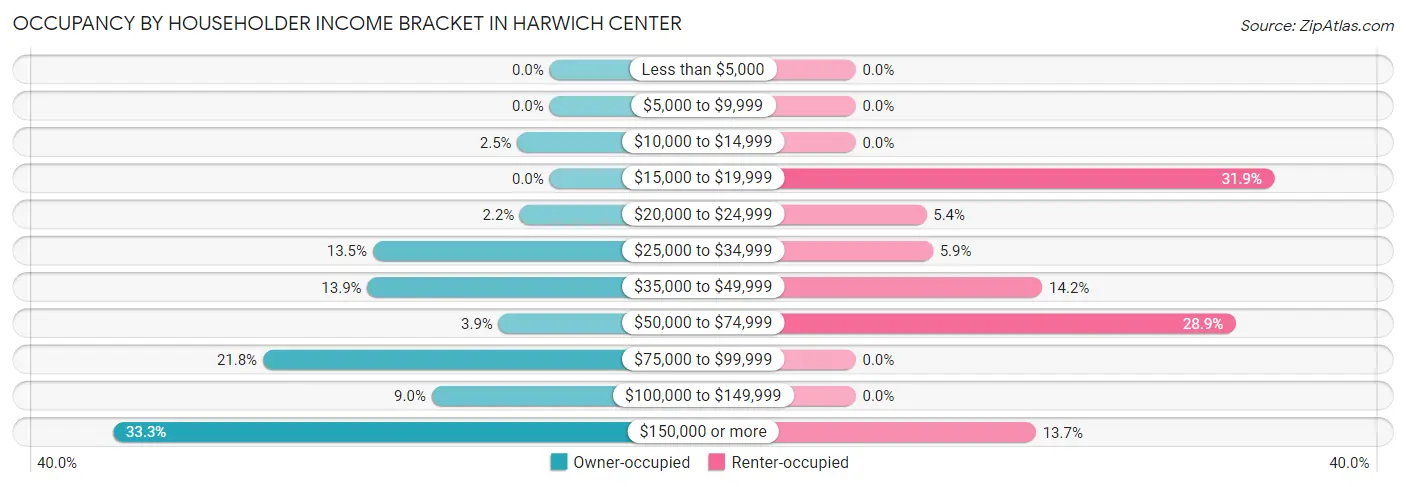
| Income Bracket | Owner-occupied | Renter-occupied |
| Less than $5,000 | 0 (0.0%) | 0 (0.0%) |
| $5,000 to $9,999 | 0 (0.0%) | 0 (0.0%) |
| $10,000 to $14,999 | 12 (2.5%) | 0 (0.0%) |
| $15,000 to $19,999 | 0 (0.0%) | 65 (31.9%) |
| $20,000 to $24,999 | 11 (2.2%) | 11 (5.4%) |
| $25,000 to $34,999 | 66 (13.5%) | 12 (5.9%) |
| $35,000 to $49,999 | 68 (13.9%) | 29 (14.2%) |
| $50,000 to $74,999 | 19 (3.9%) | 59 (28.9%) |
| $75,000 to $99,999 | 107 (21.8%) | 0 (0.0%) |
| $100,000 to $149,999 | 44 (9.0%) | 0 (0.0%) |
| $150,000 or more | 163 (33.3%) | 28 (13.7%) |
| Total | 490 (100.0%) | 204 (100.0%) |
Monthly Housing Cost Tiers in Harwich Center
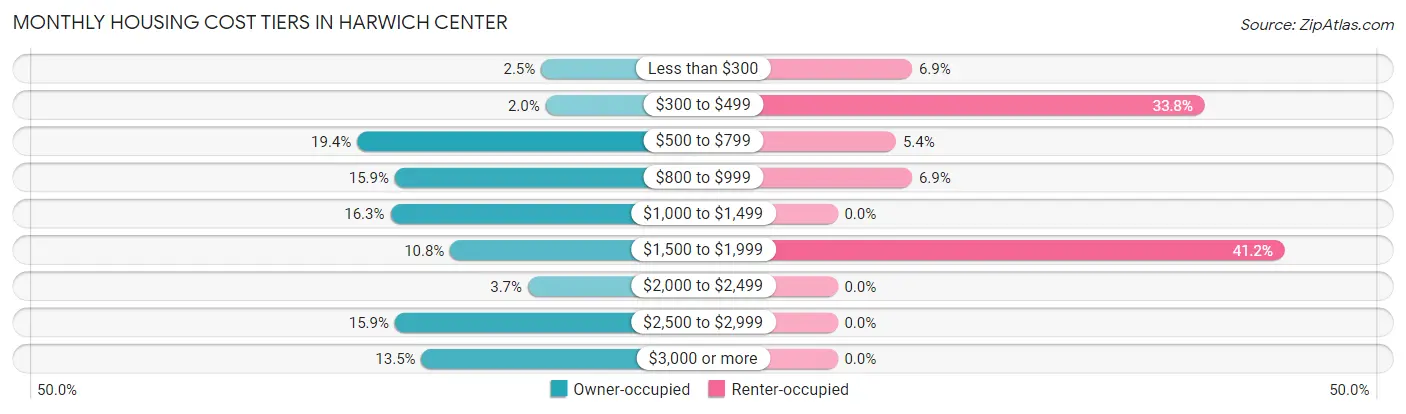
| Monthly Cost | Owner-occupied | Renter-occupied |
| Less than $300 | 12 (2.5%) | 14 (6.9%) |
| $300 to $499 | 10 (2.0%) | 69 (33.8%) |
| $500 to $799 | 95 (19.4%) | 11 (5.4%) |
| $800 to $999 | 78 (15.9%) | 14 (6.9%) |
| $1,000 to $1,499 | 80 (16.3%) | 0 (0.0%) |
| $1,500 to $1,999 | 53 (10.8%) | 84 (41.2%) |
| $2,000 to $2,499 | 18 (3.7%) | 0 (0.0%) |
| $2,500 to $2,999 | 78 (15.9%) | 0 (0.0%) |
| $3,000 or more | 66 (13.5%) | 0 (0.0%) |
| Total | 490 (100.0%) | 204 (100.0%) |
Physical Housing Characteristics in Harwich Center
Housing Structures in Harwich Center
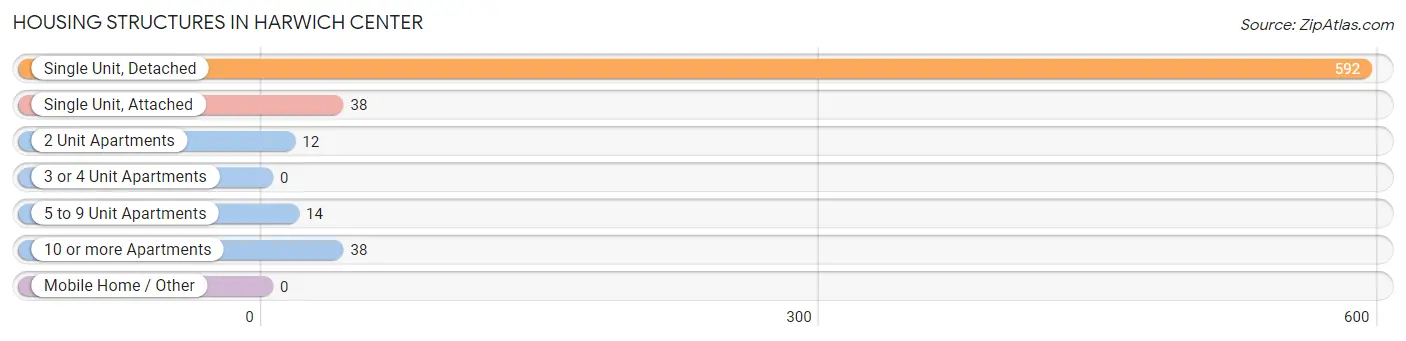
| Structure Type | # Housing Units | % Housing Units |
| Single Unit, Detached | 592 | 85.3% |
| Single Unit, Attached | 38 | 5.5% |
| 2 Unit Apartments | 12 | 1.7% |
| 3 or 4 Unit Apartments | 0 | 0.0% |
| 5 to 9 Unit Apartments | 14 | 2.0% |
| 10 or more Apartments | 38 | 5.5% |
| Mobile Home / Other | 0 | 0.0% |
| Total | 694 | 100.0% |
Housing Structures by Occupancy in Harwich Center
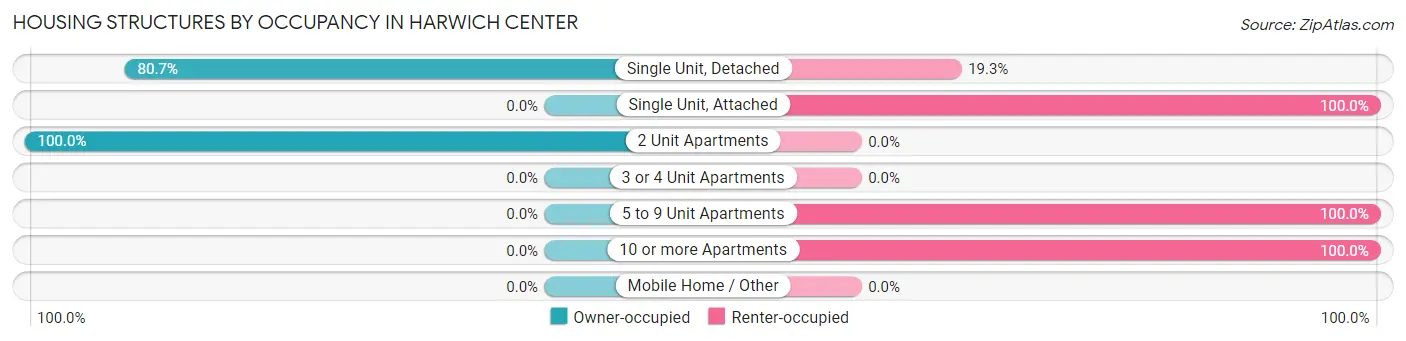
| Structure Type | Owner-occupied | Renter-occupied |
| Single Unit, Detached | 478 (80.7%) | 114 (19.3%) |
| Single Unit, Attached | 0 (0.0%) | 38 (100.0%) |
| 2 Unit Apartments | 12 (100.0%) | 0 (0.0%) |
| 3 or 4 Unit Apartments | 0 (0.0%) | 0 (0.0%) |
| 5 to 9 Unit Apartments | 0 (0.0%) | 14 (100.0%) |
| 10 or more Apartments | 0 (0.0%) | 38 (100.0%) |
| Mobile Home / Other | 0 (0.0%) | 0 (0.0%) |
| Total | 490 (70.6%) | 204 (29.4%) |
Housing Structures by Number of Rooms in Harwich Center
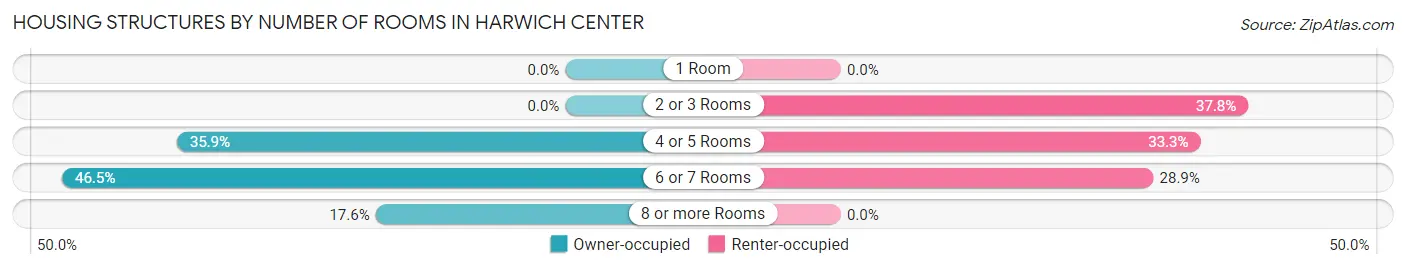
| Number of Rooms | Owner-occupied | Renter-occupied |
| 1 Room | 0 (0.0%) | 0 (0.0%) |
| 2 or 3 Rooms | 0 (0.0%) | 77 (37.8%) |
| 4 or 5 Rooms | 176 (35.9%) | 68 (33.3%) |
| 6 or 7 Rooms | 228 (46.5%) | 59 (28.9%) |
| 8 or more Rooms | 86 (17.5%) | 0 (0.0%) |
| Total | 490 (100.0%) | 204 (100.0%) |
Housing Structure by Heating Type in Harwich Center
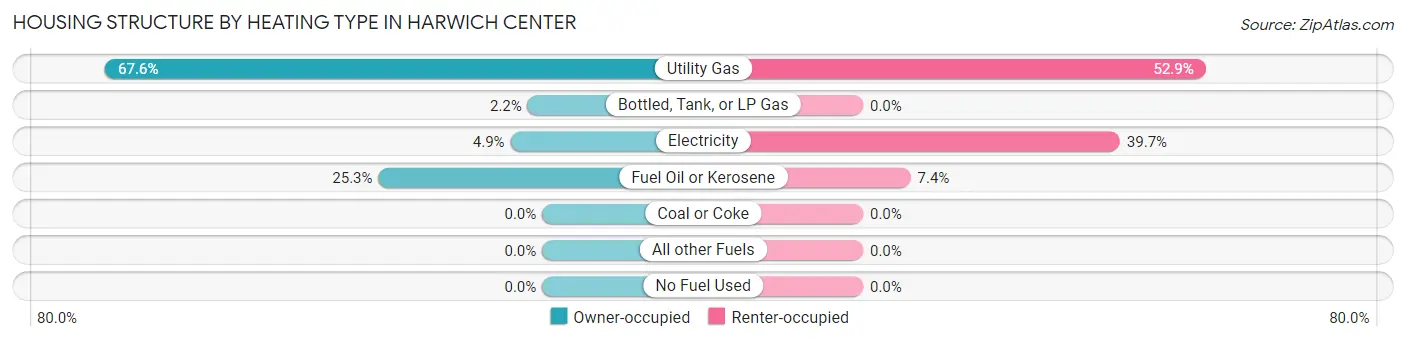
| Heating Type | Owner-occupied | Renter-occupied |
| Utility Gas | 331 (67.5%) | 108 (52.9%) |
| Bottled, Tank, or LP Gas | 11 (2.2%) | 0 (0.0%) |
| Electricity | 24 (4.9%) | 81 (39.7%) |
| Fuel Oil or Kerosene | 124 (25.3%) | 15 (7.3%) |
| Coal or Coke | 0 (0.0%) | 0 (0.0%) |
| All other Fuels | 0 (0.0%) | 0 (0.0%) |
| No Fuel Used | 0 (0.0%) | 0 (0.0%) |
| Total | 490 (100.0%) | 204 (100.0%) |
Household Vehicle Usage in Harwich Center
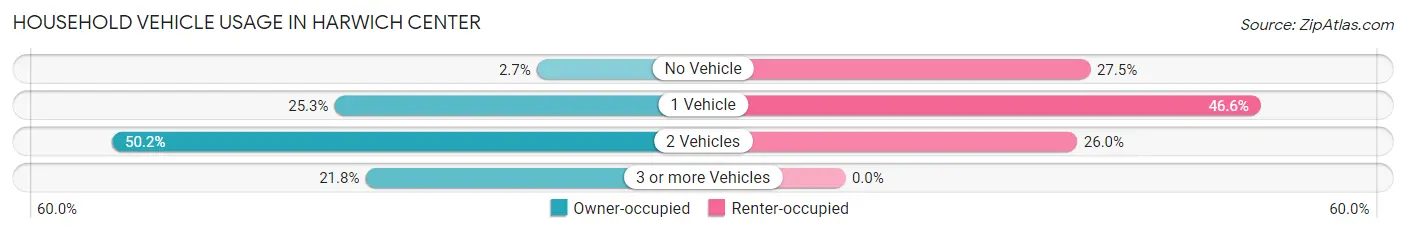
| Vehicles per Household | Owner-occupied | Renter-occupied |
| No Vehicle | 13 (2.6%) | 56 (27.5%) |
| 1 Vehicle | 124 (25.3%) | 95 (46.6%) |
| 2 Vehicles | 246 (50.2%) | 53 (26.0%) |
| 3 or more Vehicles | 107 (21.8%) | 0 (0.0%) |
| Total | 490 (100.0%) | 204 (100.0%) |
Real Estate & Mortgages in Harwich Center
Real Estate and Mortgage Overview in Harwich Center
| Characteristic | Without Mortgage | With Mortgage |
| Housing Units | 204 | 286 |
| Median Property Value | $500,000 | $547,800 |
| Median Household Income | - | - |
| Monthly Housing Costs | $698 | $66 |
| Real Estate Taxes | $3,744 | $0 |
Property Value by Mortgage Status in Harwich Center
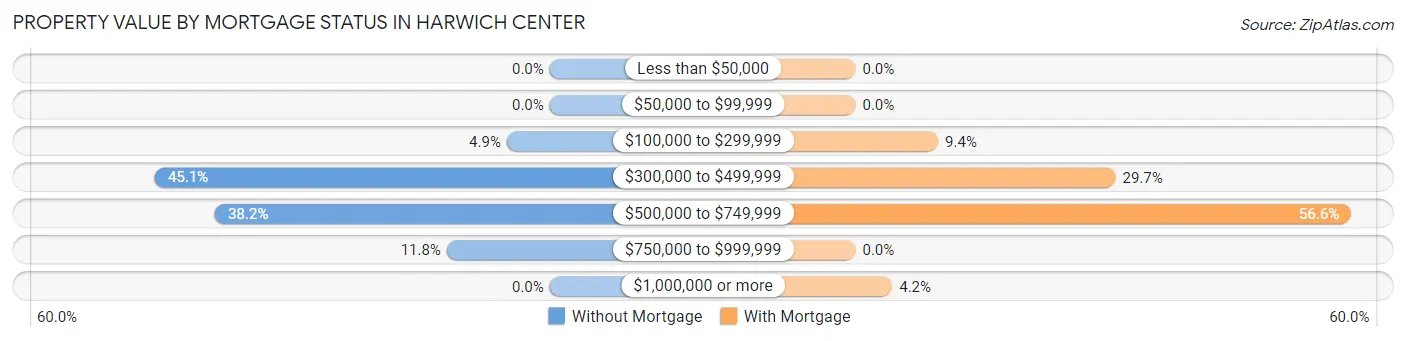
| Property Value | Without Mortgage | With Mortgage |
| Less than $50,000 | 0 (0.0%) | 0 (0.0%) |
| $50,000 to $99,999 | 0 (0.0%) | 0 (0.0%) |
| $100,000 to $299,999 | 10 (4.9%) | 27 (9.4%) |
| $300,000 to $499,999 | 92 (45.1%) | 85 (29.7%) |
| $500,000 to $749,999 | 78 (38.2%) | 162 (56.6%) |
| $750,000 to $999,999 | 24 (11.8%) | 0 (0.0%) |
| $1,000,000 or more | 0 (0.0%) | 12 (4.2%) |
| Total | 204 (100.0%) | 286 (100.0%) |
Household Income by Mortgage Status in Harwich Center
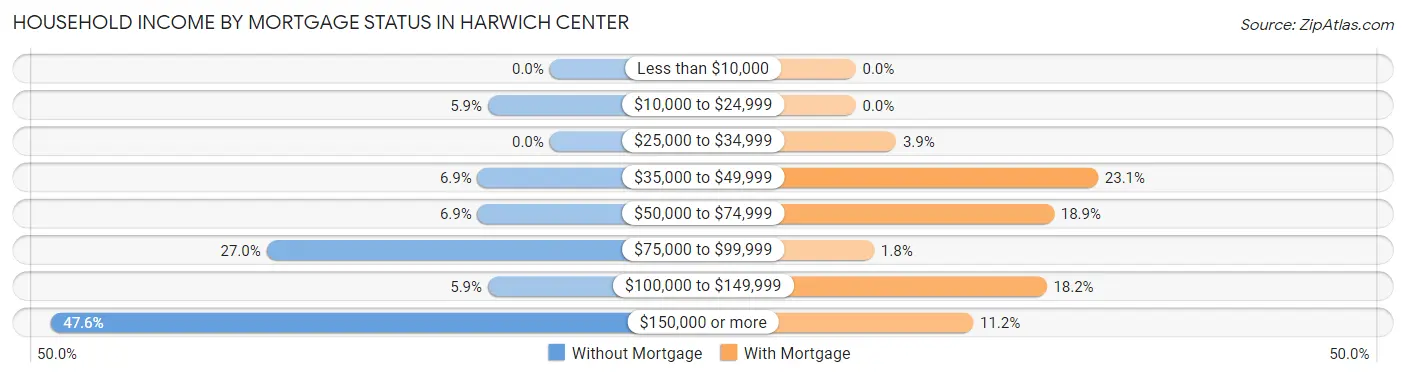
| Household Income | Without Mortgage | With Mortgage |
| Less than $10,000 | 0 (0.0%) | 0 (0.0%) |
| $10,000 to $24,999 | 12 (5.9%) | 0 (0.0%) |
| $25,000 to $34,999 | 0 (0.0%) | 11 (3.8%) |
| $35,000 to $49,999 | 14 (6.9%) | 66 (23.1%) |
| $50,000 to $74,999 | 14 (6.9%) | 54 (18.9%) |
| $75,000 to $99,999 | 55 (27.0%) | 5 (1.8%) |
| $100,000 to $149,999 | 12 (5.9%) | 52 (18.2%) |
| $150,000 or more | 97 (47.5%) | 32 (11.2%) |
| Total | 204 (100.0%) | 286 (100.0%) |
Property Value to Household Income Ratio in Harwich Center
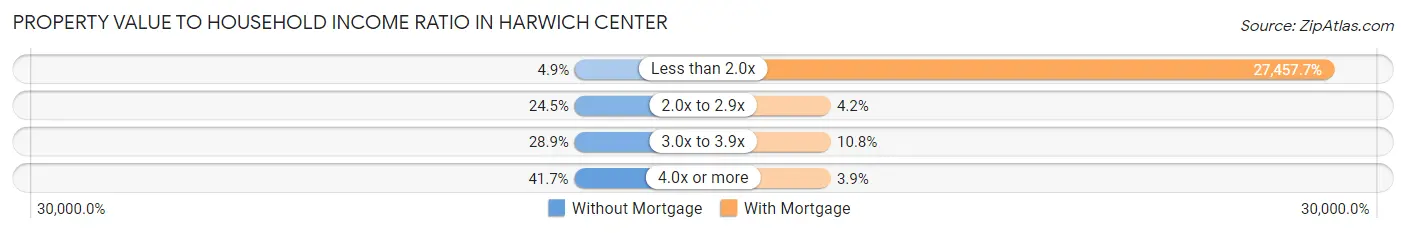
| Value-to-Income Ratio | Without Mortgage | With Mortgage |
| Less than 2.0x | 10 (4.9%) | 78,529 (27,457.7%) |
| 2.0x to 2.9x | 50 (24.5%) | 12 (4.2%) |
| 3.0x to 3.9x | 59 (28.9%) | 31 (10.8%) |
| 4.0x or more | 85 (41.7%) | 11 (3.8%) |
| Total | 204 (100.0%) | 286 (100.0%) |
Real Estate Taxes by Mortgage Status in Harwich Center
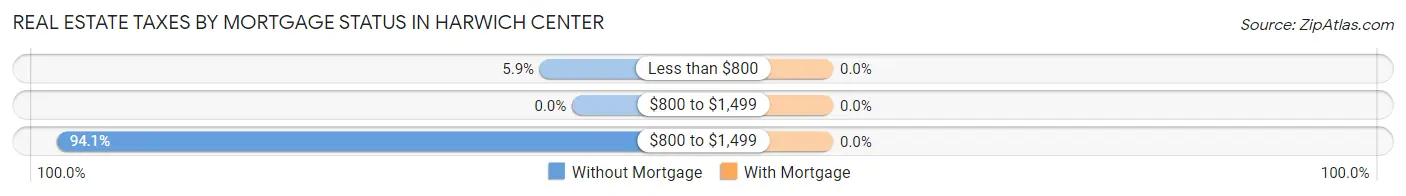
| Property Taxes | Without Mortgage | With Mortgage |
| Less than $800 | 12 (5.9%) | 0 (0.0%) |
| $800 to $1,499 | 0 (0.0%) | 0 (0.0%) |
| $800 to $1,499 | 192 (94.1%) | 0 (0.0%) |
| Total | 204 (100.0%) | 286 (100.0%) |
Health & Disability in Harwich Center
Health Insurance Coverage by Age in Harwich Center
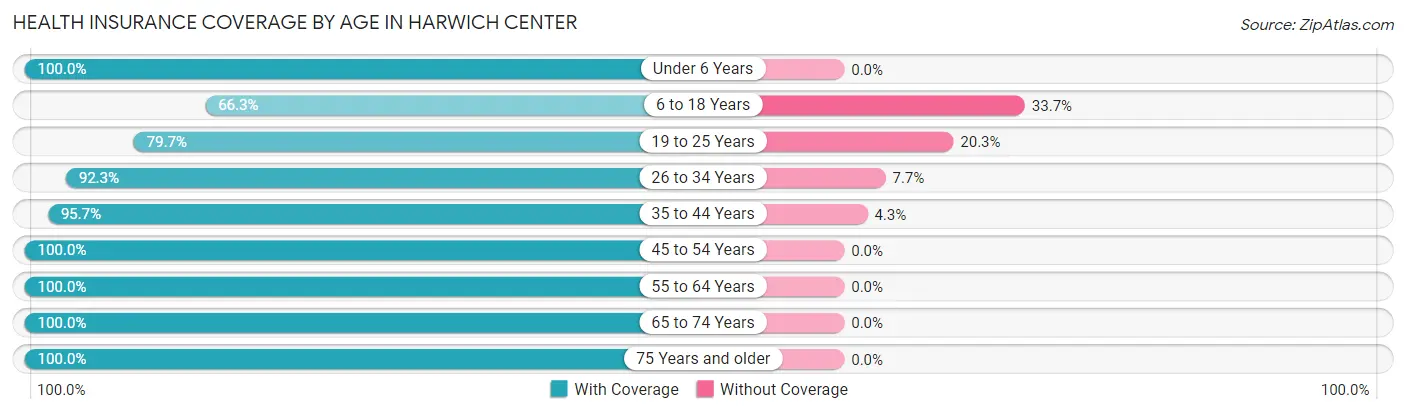
| Age Bracket | With Coverage | Without Coverage |
| Under 6 Years | 29 (100.0%) | 0 (0.0%) |
| 6 to 18 Years | 126 (66.3%) | 64 (33.7%) |
| 19 to 25 Years | 47 (79.7%) | 12 (20.3%) |
| 26 to 34 Years | 60 (92.3%) | 5 (7.7%) |
| 35 to 44 Years | 133 (95.7%) | 6 (4.3%) |
| 45 to 54 Years | 164 (100.0%) | 0 (0.0%) |
| 55 to 64 Years | 212 (100.0%) | 0 (0.0%) |
| 65 to 74 Years | 357 (100.0%) | 0 (0.0%) |
| 75 Years and older | 181 (100.0%) | 0 (0.0%) |
| Total | 1,309 (93.8%) | 87 (6.2%) |
Health Insurance Coverage by Citizenship Status in Harwich Center
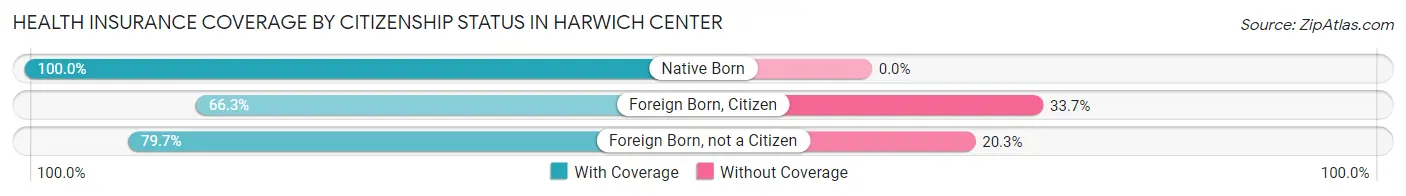
| Citizenship Status | With Coverage | Without Coverage |
| Native Born | 29 (100.0%) | 0 (0.0%) |
| Foreign Born, Citizen | 126 (66.3%) | 64 (33.7%) |
| Foreign Born, not a Citizen | 47 (79.7%) | 12 (20.3%) |
Health Insurance Coverage by Household Income in Harwich Center
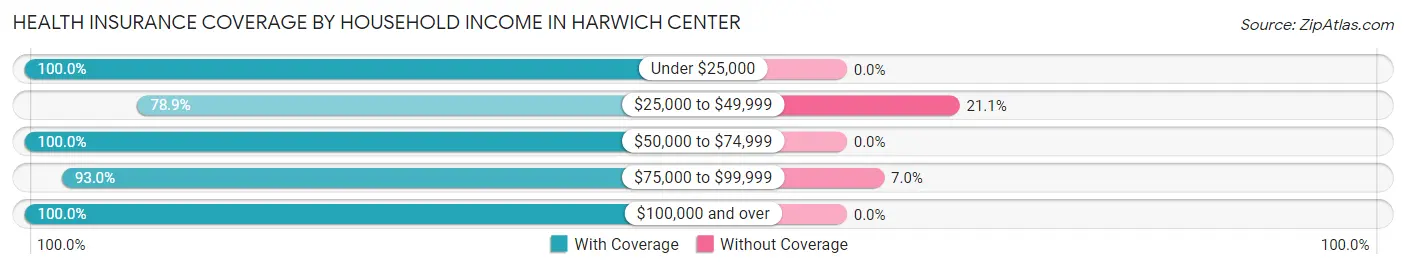
| Household Income | With Coverage | Without Coverage |
| Under $25,000 | 99 (100.0%) | 0 (0.0%) |
| $25,000 to $49,999 | 239 (78.9%) | 64 (21.1%) |
| $50,000 to $74,999 | 124 (100.0%) | 0 (0.0%) |
| $75,000 to $99,999 | 306 (93.0%) | 23 (7.0%) |
| $100,000 and over | 536 (100.0%) | 0 (0.0%) |
Public vs Private Health Insurance Coverage by Age in Harwich Center
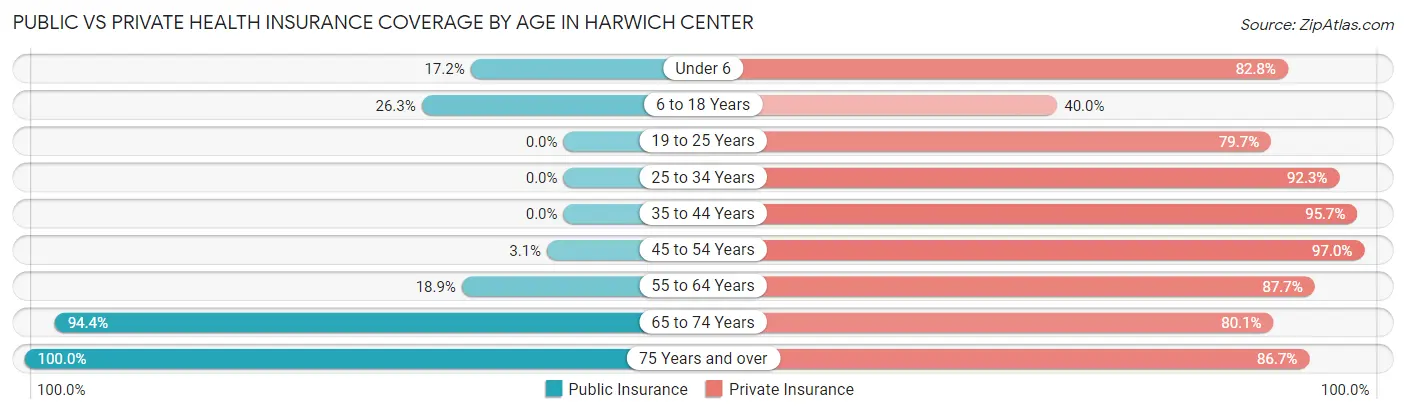
| Age Bracket | Public Insurance | Private Insurance |
| Under 6 | 5 (17.2%) | 24 (82.8%) |
| 6 to 18 Years | 50 (26.3%) | 76 (40.0%) |
| 19 to 25 Years | 0 (0.0%) | 47 (79.7%) |
| 25 to 34 Years | 0 (0.0%) | 60 (92.3%) |
| 35 to 44 Years | 0 (0.0%) | 133 (95.7%) |
| 45 to 54 Years | 5 (3.0%) | 159 (97.0%) |
| 55 to 64 Years | 40 (18.9%) | 186 (87.7%) |
| 65 to 74 Years | 337 (94.4%) | 286 (80.1%) |
| 75 Years and over | 181 (100.0%) | 157 (86.7%) |
| Total | 618 (44.3%) | 1,128 (80.8%) |
Disability Status by Sex by Age in Harwich Center
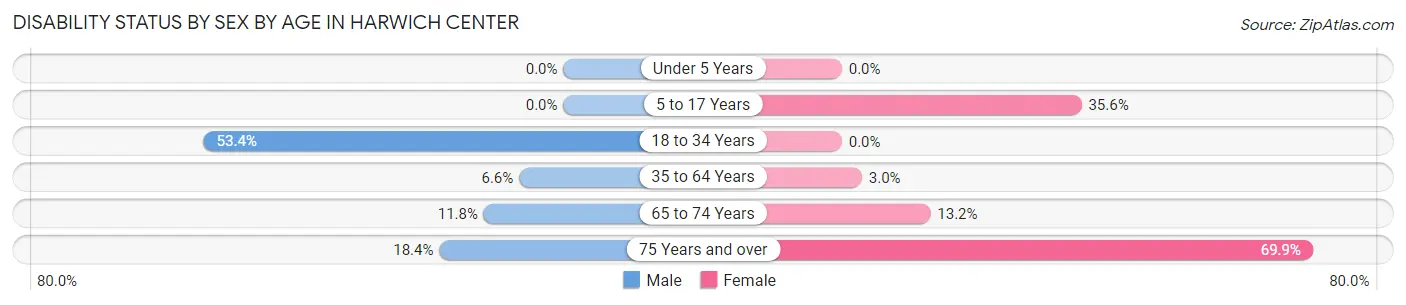
| Age Bracket | Male | Female |
| Under 5 Years | 0 (0.0%) | 0 (0.0%) |
| 5 to 17 Years | 0 (0.0%) | 42 (35.6%) |
| 18 to 34 Years | 47 (53.4%) | 0 (0.0%) |
| 35 to 64 Years | 14 (6.6%) | 9 (3.0%) |
| 65 to 74 Years | 17 (11.8%) | 28 (13.2%) |
| 75 Years and over | 7 (18.4%) | 100 (69.9%) |
Disability Class by Sex by Age in Harwich Center
Disability Class: Hearing Difficulty
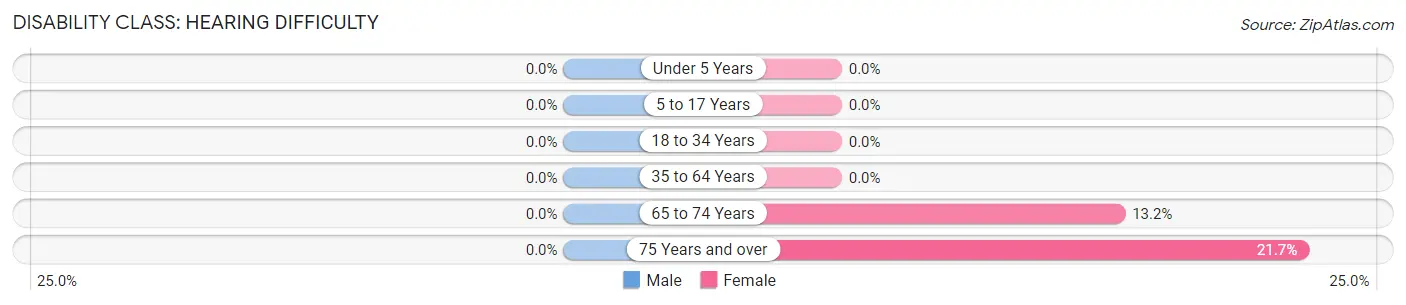
| Age Bracket | Male | Female |
| Under 5 Years | 0 (0.0%) | 0 (0.0%) |
| 5 to 17 Years | 0 (0.0%) | 0 (0.0%) |
| 18 to 34 Years | 0 (0.0%) | 0 (0.0%) |
| 35 to 64 Years | 0 (0.0%) | 0 (0.0%) |
| 65 to 74 Years | 0 (0.0%) | 28 (13.2%) |
| 75 Years and over | 0 (0.0%) | 31 (21.7%) |
Disability Class: Vision Difficulty
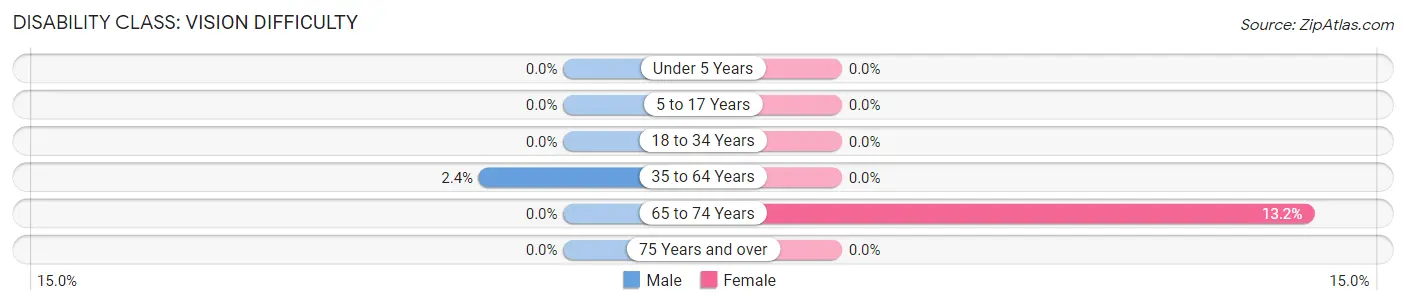
| Age Bracket | Male | Female |
| Under 5 Years | 0 (0.0%) | 0 (0.0%) |
| 5 to 17 Years | 0 (0.0%) | 0 (0.0%) |
| 18 to 34 Years | 0 (0.0%) | 0 (0.0%) |
| 35 to 64 Years | 5 (2.4%) | 0 (0.0%) |
| 65 to 74 Years | 0 (0.0%) | 28 (13.2%) |
| 75 Years and over | 0 (0.0%) | 0 (0.0%) |
Disability Class: Cognitive Difficulty
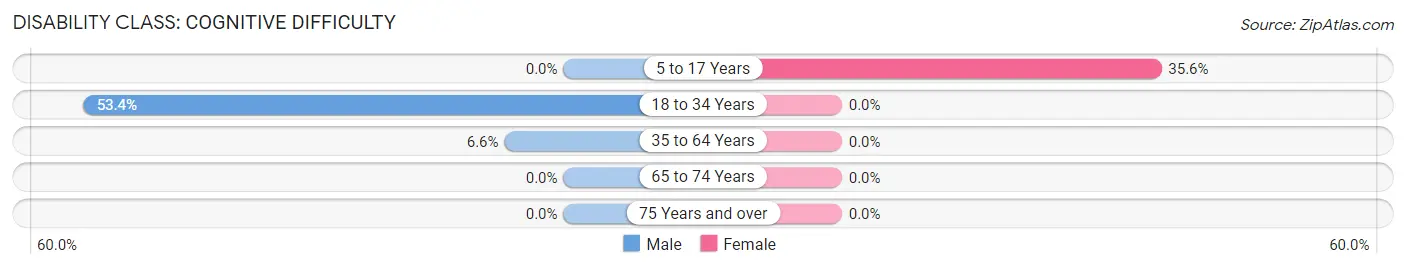
| Age Bracket | Male | Female |
| 5 to 17 Years | 0 (0.0%) | 42 (35.6%) |
| 18 to 34 Years | 47 (53.4%) | 0 (0.0%) |
| 35 to 64 Years | 14 (6.6%) | 0 (0.0%) |
| 65 to 74 Years | 0 (0.0%) | 0 (0.0%) |
| 75 Years and over | 0 (0.0%) | 0 (0.0%) |
Disability Class: Ambulatory Difficulty
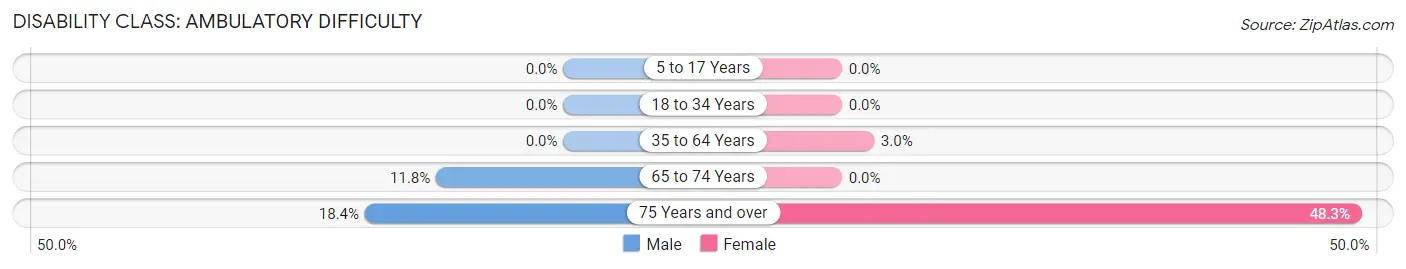
| Age Bracket | Male | Female |
| 5 to 17 Years | 0 (0.0%) | 0 (0.0%) |
| 18 to 34 Years | 0 (0.0%) | 0 (0.0%) |
| 35 to 64 Years | 0 (0.0%) | 9 (3.0%) |
| 65 to 74 Years | 17 (11.8%) | 0 (0.0%) |
| 75 Years and over | 7 (18.4%) | 69 (48.2%) |
Disability Class: Self-Care Difficulty
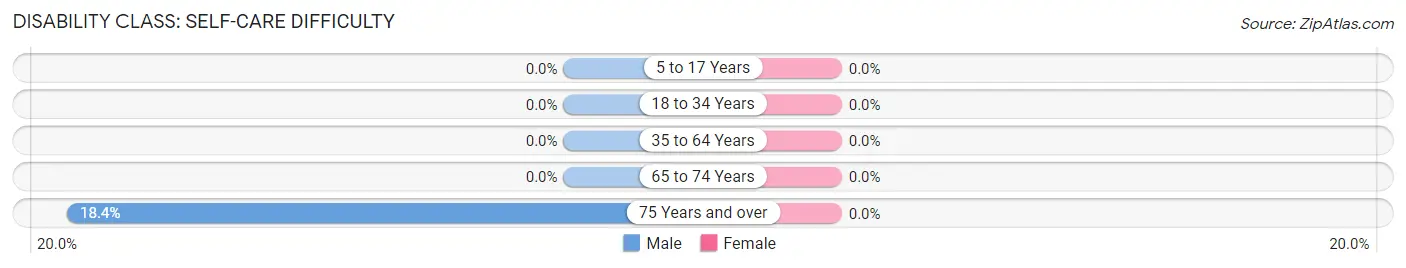
| Age Bracket | Male | Female |
| 5 to 17 Years | 0 (0.0%) | 0 (0.0%) |
| 18 to 34 Years | 0 (0.0%) | 0 (0.0%) |
| 35 to 64 Years | 0 (0.0%) | 0 (0.0%) |
| 65 to 74 Years | 0 (0.0%) | 0 (0.0%) |
| 75 Years and over | 7 (18.4%) | 0 (0.0%) |
Technology Access in Harwich Center
Computing Device Access in Harwich Center
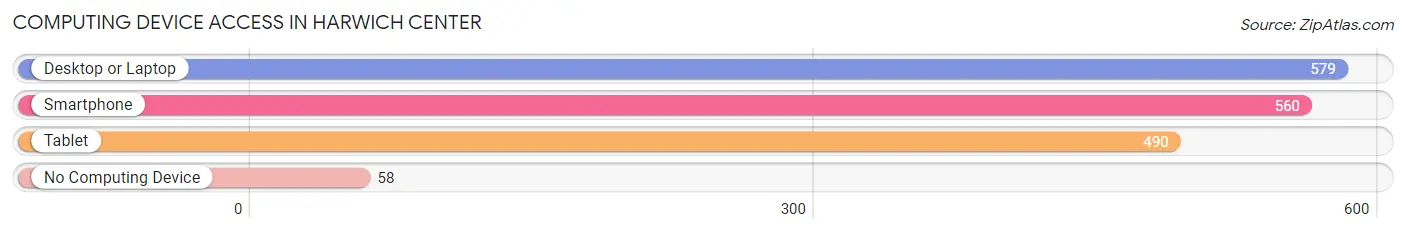
| Device Type | # Households | % Households |
| Desktop or Laptop | 579 | 83.4% |
| Smartphone | 560 | 80.7% |
| Tablet | 490 | 70.6% |
| No Computing Device | 58 | 8.4% |
| Total | 694 | 100.0% |
Internet Access in Harwich Center
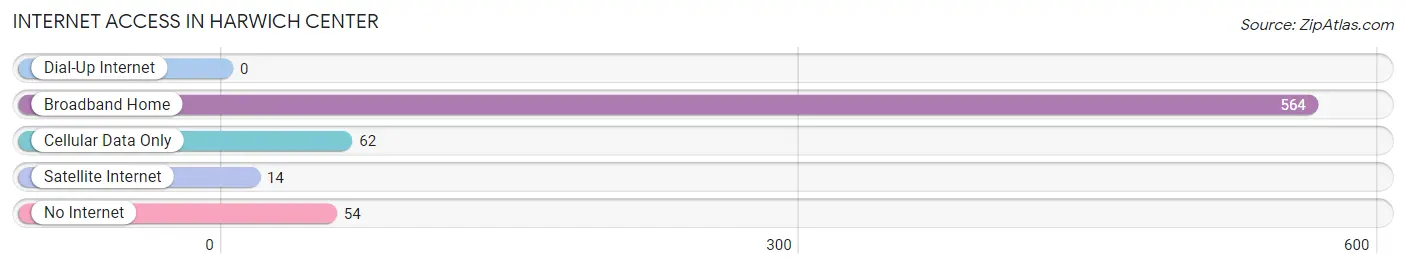
| Internet Type | # Households | % Households |
| Dial-Up Internet | 0 | 0.0% |
| Broadband Home | 564 | 81.3% |
| Cellular Data Only | 62 | 8.9% |
| Satellite Internet | 14 | 2.0% |
| No Internet | 54 | 7.8% |
| Total | 694 | 100.0% |
Harwich Center Summary
Harwich Center is a small village located in the town of Harwich, Massachusetts, on the south side of Cape Cod. It is a popular tourist destination, known for its beautiful beaches, quaint shops, and historic sites. The village is home to a variety of businesses, including restaurants, retail stores, and art galleries.
Geography
Harwich Center is located in the southeastern corner of the town of Harwich, Massachusetts. It is bordered by the towns of Brewster to the north, Chatham to the east, and Dennis to the south. The village is situated on the south side of Cape Cod, and is approximately 25 miles from the city of Boston. The village is located on the banks of the Herring River, which flows into Nantucket Sound. The village is also home to several ponds, including Long Pond, Round Pond, and Mill Pond.
The village is located in a temperate climate, with mild winters and warm summers. The average temperature in the summer is around 70 degrees Fahrenheit, and the average temperature in the winter is around 40 degrees Fahrenheit. The village receives an average of 45 inches of precipitation per year.
Economy
Harwich Center is a popular tourist destination, and the village's economy is largely dependent on tourism. The village is home to a variety of businesses, including restaurants, retail stores, and art galleries. The village is also home to several marinas, which provide boat rentals and fishing charters.
The village is also home to several manufacturing companies, including a boat building company and a furniture manufacturer. The village is also home to several farms, which produce a variety of fruits and vegetables.
Demographics
As of the 2010 census, the population of Harwich Center was 1,845. The population is predominantly white, with a small percentage of African Americans, Hispanics, and Asians. The median household income in the village is $60,000, and the median home value is $400,000.
The village is home to a variety of religious denominations, including Catholic, Protestant, and Jewish. The village is also home to a variety of educational institutions, including a public elementary school, a private middle school, and a private high school.
Conclusion
Harwich Center is a small village located in the town of Harwich, Massachusetts, on the south side of Cape Cod. It is a popular tourist destination, known for its beautiful beaches, quaint shops, and historic sites. The village is home to a variety of businesses, including restaurants, retail stores, and art galleries. The village is also home to several manufacturing companies, farms, and marinas. The population of Harwich Center is predominantly white, with a small percentage of African Americans, Hispanics, and Asians. The village is home to a variety of religious denominations, and a variety of educational institutions.
Common Questions
What is Per Capita Income in Harwich Center?
Per Capita income in Harwich Center is $53,574.
What is the Median Family Income in Harwich Center?
Median Family Income in Harwich Center is $83,393.
What is the Median Household income in Harwich Center?
Median Household Income in Harwich Center is $71,806.
What is Income or Wage Gap in Harwich Center?
Income or Wage Gap in Harwich Center is 28.7%.
Women in Harwich Center earn 71.3 cents for every dollar earned by a man.
What is Inequality or Gini Index in Harwich Center?
Inequality or Gini Index in Harwich Center is 0.48.
What is the Total Population of Harwich Center?
Total Population of Harwich Center is 1,419.
What is the Total Male Population of Harwich Center?
Total Male Population of Harwich Center is 579.
What is the Total Female Population of Harwich Center?
Total Female Population of Harwich Center is 840.
What is the Ratio of Males per 100 Females in Harwich Center?
There are 68.93 Males per 100 Females in Harwich Center.
What is the Ratio of Females per 100 Males in Harwich Center?
There are 145.08 Females per 100 Males in Harwich Center.
What is the Median Population Age in Harwich Center?
Median Population Age in Harwich Center is 60.3 Years.
What is the Average Family Size in Harwich Center
Average Family Size in Harwich Center is 3.1 People.
What is the Average Household Size in Harwich Center
Average Household Size in Harwich Center is 2.0 People.
How Large is the Labor Force in Harwich Center?
There are 633 People in the Labor Forcein in Harwich Center.
What is the Percentage of People in the Labor Force in Harwich Center?
51.3% of People are in the Labor Force in Harwich Center.
What is the Unemployment Rate in Harwich Center?
Unemployment Rate in Harwich Center is 7.1%.