Zip Codes with the Highest Percentage of Population Employed in Health Diagnosing & Treating in Quincy, MA
RELATED REPORTS & OPTIONS
Health Diagnosing & Treating
Quincy
Compare Zip Codes
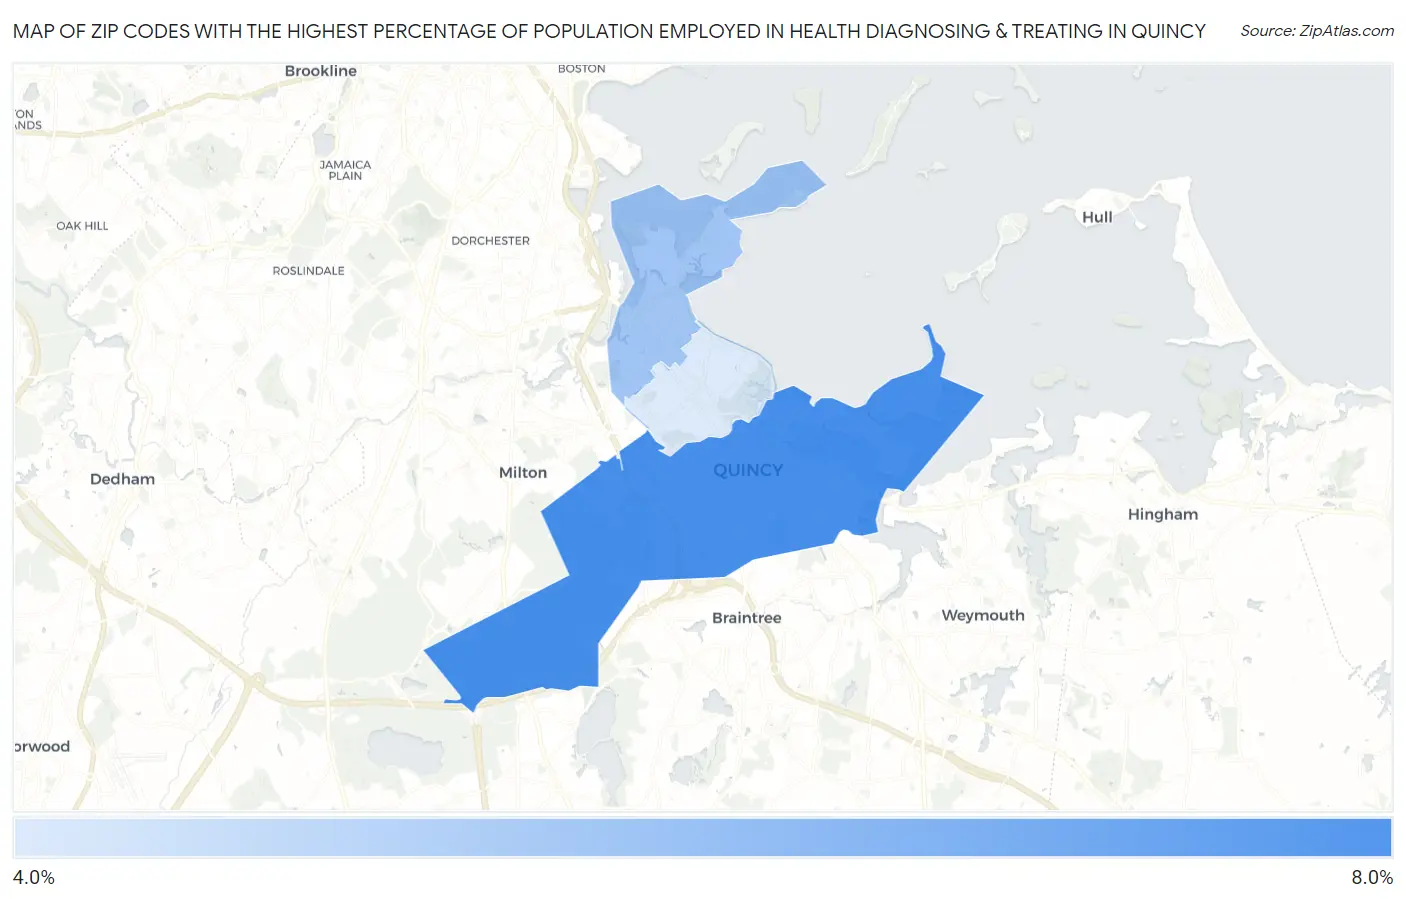
Map of Zip Codes with the Highest Percentage of Population Employed in Health Diagnosing & Treating in Quincy
5.0%
7.1%
Zip Codes with the Highest Percentage of Population Employed in Health Diagnosing & Treating in Quincy, MA
| Zip Code | % Employed | vs State | vs National | |
| 1. | 02169 | 7.1% | 6.9%(+0.198)#232 | 6.2%(+0.857)#10,030 |
| 2. | 02171 | 5.8% | 6.9%(-1.08)#348 | 6.2%(-0.420)#14,504 |
| 3. | 02170 | 5.0% | 6.9%(-1.95)#407 | 6.2%(-1.29)#17,888 |
1
Common Questions
What are the Top Zip Codes with the Highest Percentage of Population Employed in Health Diagnosing & Treating in Quincy, MA?
Top Zip Codes with the Highest Percentage of Population Employed in Health Diagnosing & Treating in Quincy, MA are:
What zip code has the Highest Percentage of Population Employed in Health Diagnosing & Treating in Quincy, MA?
02169 has the Highest Percentage of Population Employed in Health Diagnosing & Treating in Quincy, MA with 7.1%.
What is the Percentage of Population Employed in Health Diagnosing & Treating in Quincy, MA?
Percentage of Population Employed in Health Diagnosing & Treating in Quincy is 6.4%.
What is the Percentage of Population Employed in Health Diagnosing & Treating in Massachusetts?
Percentage of Population Employed in Health Diagnosing & Treating in Massachusetts is 6.9%.
What is the Percentage of Population Employed in Health Diagnosing & Treating in the United States?
Percentage of Population Employed in Health Diagnosing & Treating in the United States is 6.2%.