Zip Codes with the Highest Percentage of Population Employed in Health Diagnosing & Treating in New Bedford, MA
RELATED REPORTS & OPTIONS
Health Diagnosing & Treating
New Bedford
Compare Zip Codes
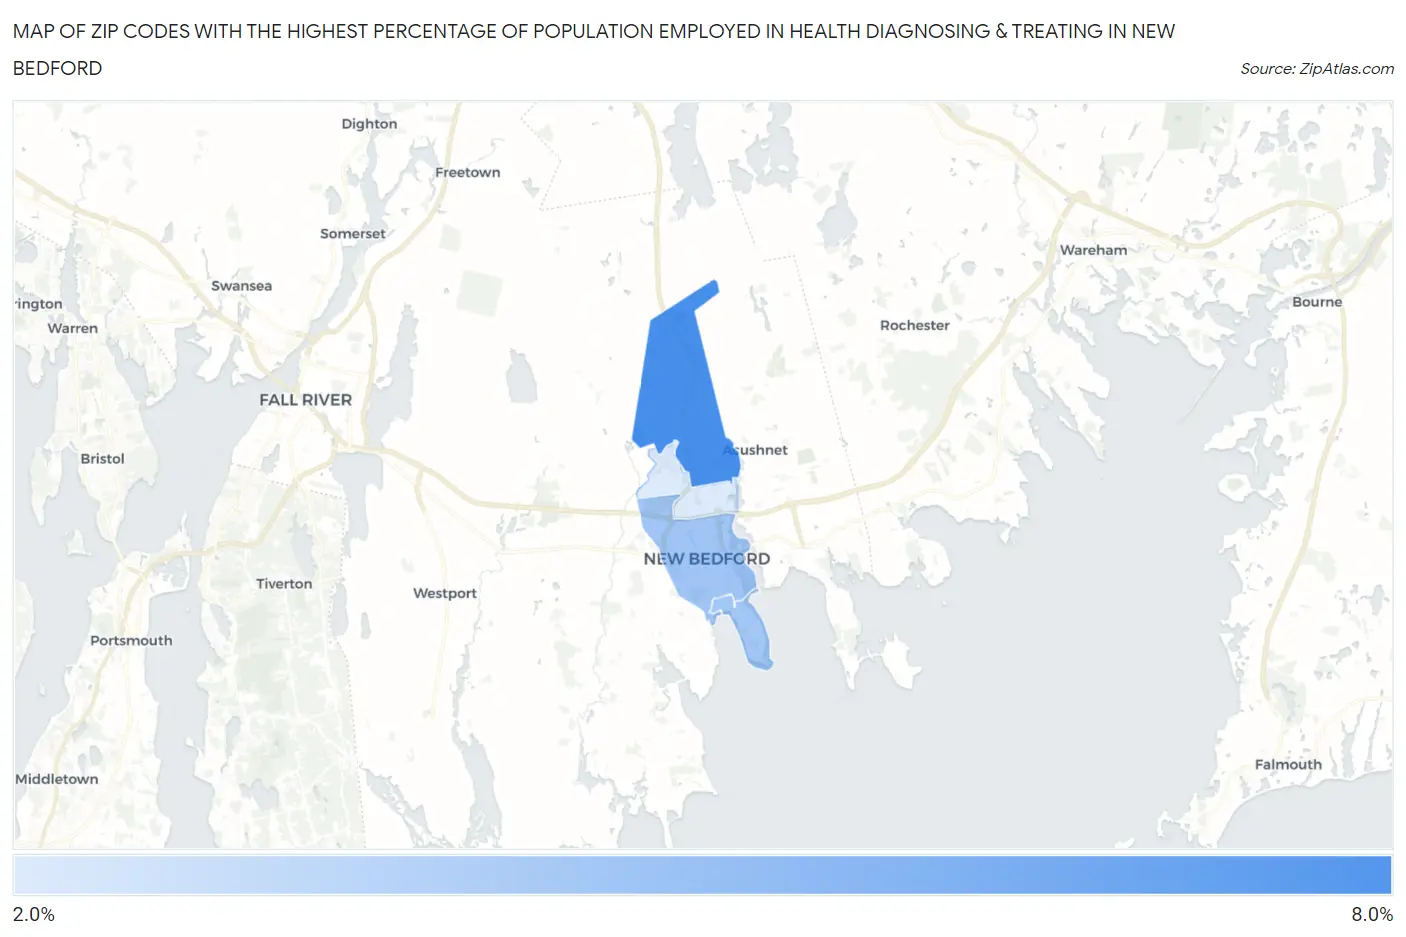
Map of Zip Codes with the Highest Percentage of Population Employed in Health Diagnosing & Treating in New Bedford
2.6%
7.7%
Zip Codes with the Highest Percentage of Population Employed in Health Diagnosing & Treating in New Bedford, MA
| Zip Code | % Employed | vs State | vs National | |
| 1. | 02745 | 7.7% | 6.9%(+0.798)#190 | 6.2%(+1.46)#8,238 |
| 2. | 02740 | 4.6% | 6.9%(-2.29)#426 | 6.2%(-1.63)#19,208 |
| 3. | 02744 | 4.5% | 6.9%(-2.40)#434 | 6.2%(-1.74)#19,634 |
| 4. | 02746 | 2.6% | 6.9%(-4.34)#486 | 6.2%(-3.68)#25,385 |
1
Common Questions
What are the Top 3 Zip Codes with the Highest Percentage of Population Employed in Health Diagnosing & Treating in New Bedford, MA?
Top 3 Zip Codes with the Highest Percentage of Population Employed in Health Diagnosing & Treating in New Bedford, MA are:
What zip code has the Highest Percentage of Population Employed in Health Diagnosing & Treating in New Bedford, MA?
02745 has the Highest Percentage of Population Employed in Health Diagnosing & Treating in New Bedford, MA with 7.7%.
What is the Percentage of Population Employed in Health Diagnosing & Treating in New Bedford, MA?
Percentage of Population Employed in Health Diagnosing & Treating in New Bedford is 5.2%.
What is the Percentage of Population Employed in Health Diagnosing & Treating in Massachusetts?
Percentage of Population Employed in Health Diagnosing & Treating in Massachusetts is 6.9%.
What is the Percentage of Population Employed in Health Diagnosing & Treating in the United States?
Percentage of Population Employed in Health Diagnosing & Treating in the United States is 6.2%.