Zip Codes with the Highest Percentage of Population Employed in Administrative & Support Services in Quincy, MA
RELATED REPORTS & OPTIONS
Administrative & Support Services
Quincy
Compare Zip Codes
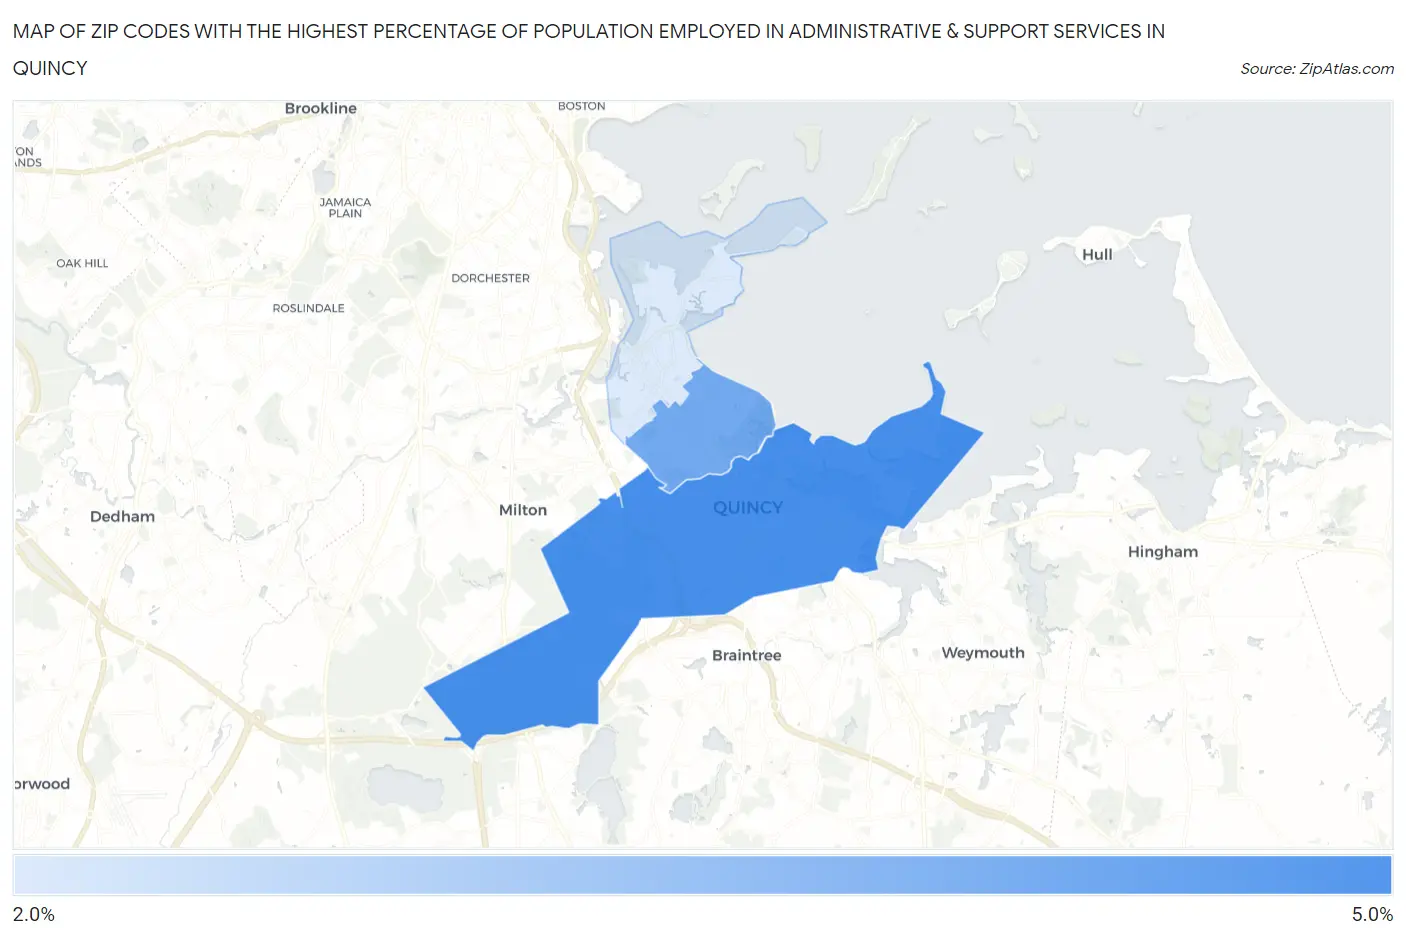
Map of Zip Codes with the Highest Percentage of Population Employed in Administrative & Support Services in Quincy
2.5%
4.1%
Zip Codes with the Highest Percentage of Population Employed in Administrative & Support Services in Quincy, MA
| Zip Code | % Employed | vs State | vs National | |
| 1. | 02169 | 4.1% | 3.6%(+0.459)#152 | 4.1%(-0.046)#10,222 |
| 2. | 02170 | 3.6% | 3.6%(-0.004)#200 | 4.1%(-0.509)#12,280 |
| 3. | 02171 | 2.5% | 3.6%(-1.13)#324 | 4.1%(-1.64)#18,082 |
1
Common Questions
What are the Top Zip Codes with the Highest Percentage of Population Employed in Administrative & Support Services in Quincy, MA?
Top Zip Codes with the Highest Percentage of Population Employed in Administrative & Support Services in Quincy, MA are:
What zip code has the Highest Percentage of Population Employed in Administrative & Support Services in Quincy, MA?
02169 has the Highest Percentage of Population Employed in Administrative & Support Services in Quincy, MA with 4.1%.
What is the Percentage of Population Employed in Administrative & Support Services in Quincy, MA?
Percentage of Population Employed in Administrative & Support Services in Quincy is 3.7%.
What is the Percentage of Population Employed in Administrative & Support Services in Massachusetts?
Percentage of Population Employed in Administrative & Support Services in Massachusetts is 3.6%.
What is the Percentage of Population Employed in Administrative & Support Services in the United States?
Percentage of Population Employed in Administrative & Support Services in the United States is 4.1%.