Zip Codes with the Highest Percentage of Population Employed in Administrative & Support Services in Arlington, MA
RELATED REPORTS & OPTIONS
Administrative & Support Services
Arlington
Compare Zip Codes
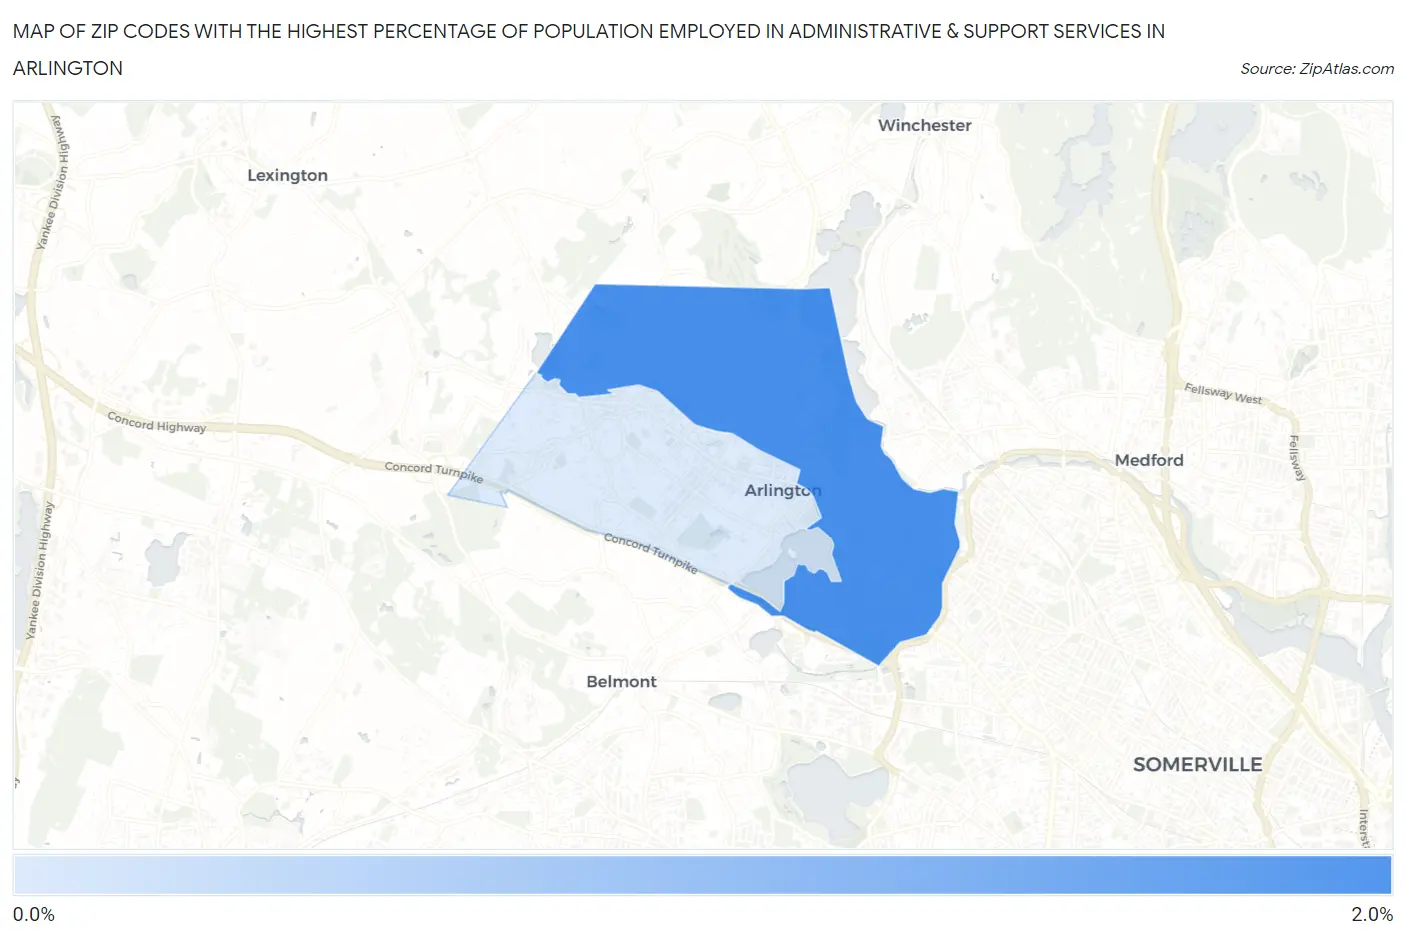
Map of Zip Codes with the Highest Percentage of Population Employed in Administrative & Support Services in Arlington
0.95%
1.6%
Zip Codes with the Highest Percentage of Population Employed in Administrative & Support Services in Arlington, MA
| Zip Code | % Employed | vs State | vs National | |
| 1. | 02474 | 1.6% | 3.6%(-2.04)#415 | 4.1%(-2.55)#22,343 |
| 2. | 02476 | 0.95% | 3.6%(-2.69)#466 | 4.1%(-3.20)#24,659 |
1
Common Questions
What are the Top Zip Codes with the Highest Percentage of Population Employed in Administrative & Support Services in Arlington, MA?
Top Zip Codes with the Highest Percentage of Population Employed in Administrative & Support Services in Arlington, MA are:
What zip code has the Highest Percentage of Population Employed in Administrative & Support Services in Arlington, MA?
02474 has the Highest Percentage of Population Employed in Administrative & Support Services in Arlington, MA with 1.6%.
What is the Percentage of Population Employed in Administrative & Support Services in Arlington, MA?
Percentage of Population Employed in Administrative & Support Services in Arlington is 1.4%.
What is the Percentage of Population Employed in Administrative & Support Services in Massachusetts?
Percentage of Population Employed in Administrative & Support Services in Massachusetts is 3.6%.
What is the Percentage of Population Employed in Administrative & Support Services in the United States?
Percentage of Population Employed in Administrative & Support Services in the United States is 4.1%.