Zip Codes with the Highest Percentage of Population Employed in Administrative & Support Services in Chicopee, MA
RELATED REPORTS & OPTIONS
Administrative & Support Services
Chicopee
Compare Zip Codes
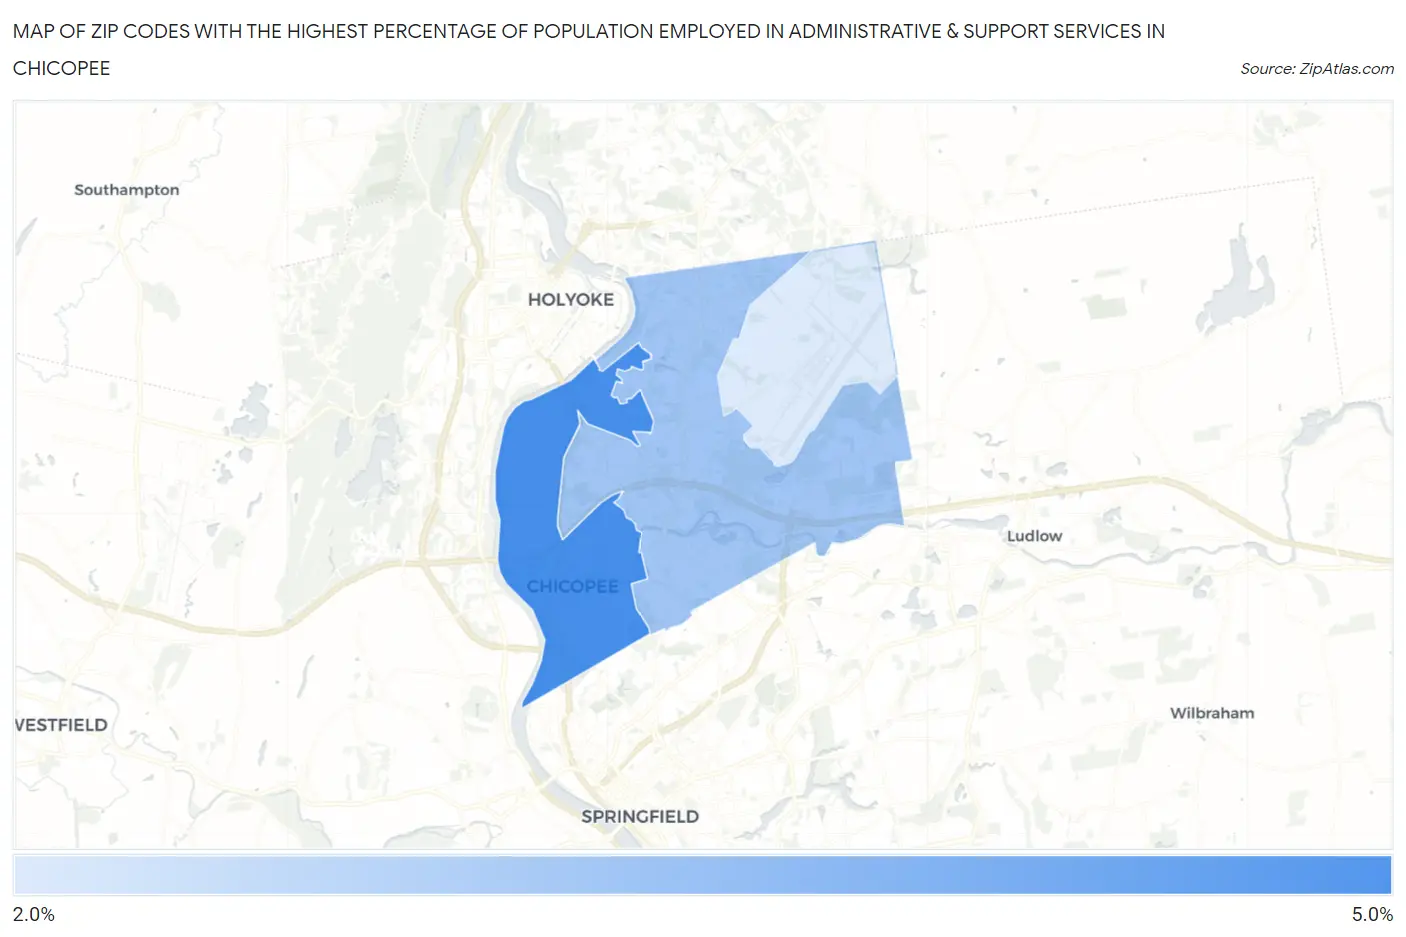
Map of Zip Codes with the Highest Percentage of Population Employed in Administrative & Support Services in Chicopee
2.1%
4.2%
Zip Codes with the Highest Percentage of Population Employed in Administrative & Support Services in Chicopee, MA
| Zip Code | % Employed | vs State | vs National | |
| 1. | 01013 | 4.2% | 3.6%(+0.594)#139 | 4.1%(+0.090)#9,662 |
| 2. | 01020 | 2.9% | 3.6%(-0.699)#268 | 4.1%(-1.20)#15,753 |
| 3. | 01022 | 2.1% | 3.6%(-1.53)#360 | 4.1%(-2.04)#20,088 |
1
Common Questions
What are the Top Zip Codes with the Highest Percentage of Population Employed in Administrative & Support Services in Chicopee, MA?
Top Zip Codes with the Highest Percentage of Population Employed in Administrative & Support Services in Chicopee, MA are:
What zip code has the Highest Percentage of Population Employed in Administrative & Support Services in Chicopee, MA?
01013 has the Highest Percentage of Population Employed in Administrative & Support Services in Chicopee, MA with 4.2%.
What is the Percentage of Population Employed in Administrative & Support Services in Chicopee, MA?
Percentage of Population Employed in Administrative & Support Services in Chicopee is 3.4%.
What is the Percentage of Population Employed in Administrative & Support Services in Massachusetts?
Percentage of Population Employed in Administrative & Support Services in Massachusetts is 3.6%.
What is the Percentage of Population Employed in Administrative & Support Services in the United States?
Percentage of Population Employed in Administrative & Support Services in the United States is 4.1%.