Townsend, MA Map & Demographics
Townsend Map
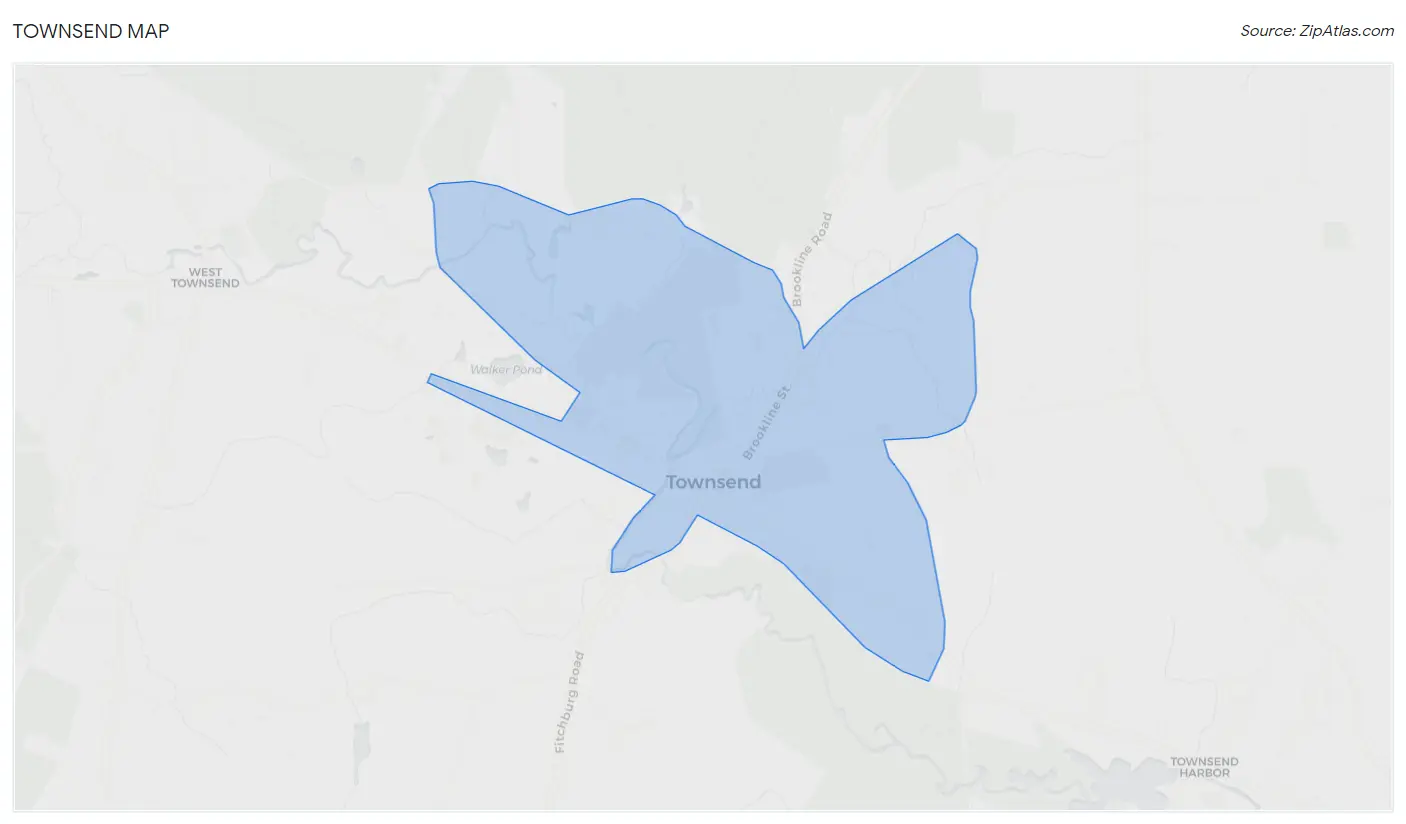
Townsend Overview
$43,406
PER CAPITA INCOME
$137,813
AVG FAMILY INCOME
$61,546
AVG HOUSEHOLD INCOME
47.3%
WAGE / INCOME GAP [ % ]
52.7¢/ $1
WAGE / INCOME GAP [ $ ]
0.55
INEQUALITY / GINI INDEX
1,131
TOTAL POPULATION
550
MALE POPULATION
581
FEMALE POPULATION
94.66
MALES / 100 FEMALES
105.64
FEMALES / 100 MALES
40.8
MEDIAN AGE
3.3
AVG FAMILY SIZE
2.3
AVG HOUSEHOLD SIZE
553
LABOR FORCE [ PEOPLE ]
64.8%
PERCENT IN LABOR FORCE
3.3%
UNEMPLOYMENT RATE
Townsend Zip Codes
Townsend Area Codes
Income in Townsend
Income Overview in Townsend
Per Capita Income in Townsend is $43,406, while median incomes of families and households are $137,813 and $61,546 respectively.
| Characteristic | Number | Measure |
| Per Capita Income | 1,131 | $43,406 |
| Median Family Income | 262 | $137,813 |
| Mean Family Income | 262 | $162,060 |
| Median Household Income | 487 | $61,546 |
| Mean Household Income | 487 | $98,465 |
| Income Deficit | 262 | $0 |
| Wage / Income Gap (%) | 1,131 | 47.27% |
| Wage / Income Gap ($) | 1,131 | 52.73¢ per $1 |
| Gini / Inequality Index | 1,131 | 0.55 |
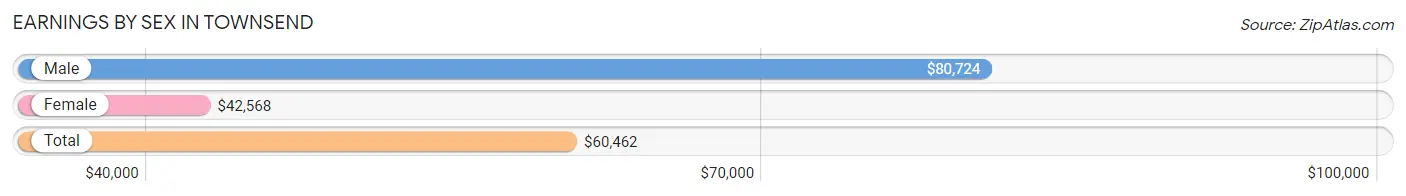
Earnings by Sex in Townsend
Average Earnings in Townsend are $60,462, $80,724 for men and $42,568 for women, a difference of 47.3%.
| Sex | Number | Average Earnings |
| Male | 287 (50.3%) | $80,724 |
| Female | 284 (49.7%) | $42,568 |
| Total | 571 (100.0%) | $60,462 |
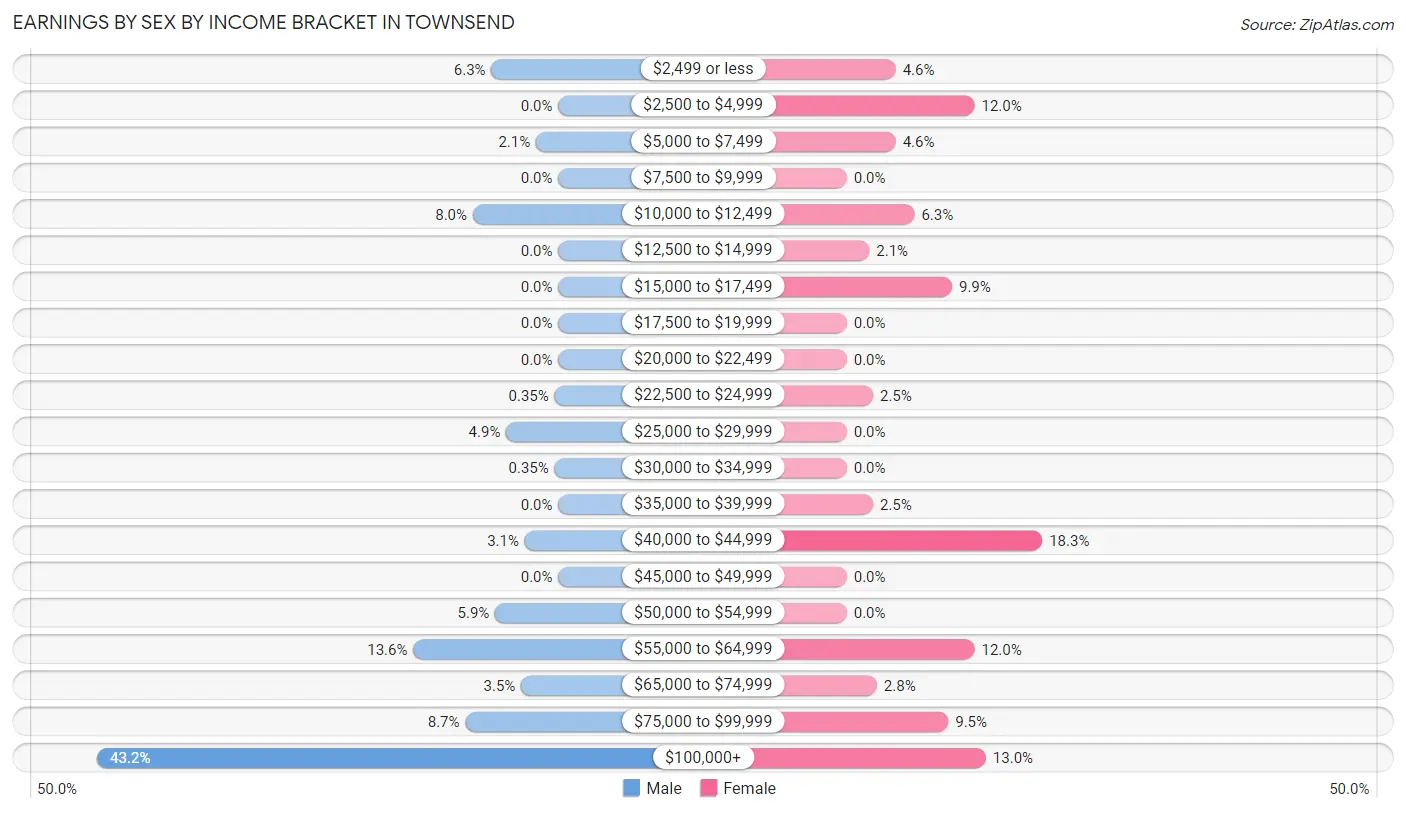
Earnings by Sex by Income Bracket in Townsend
The most common earnings brackets in Townsend are $100,000+ for men (124 | 43.2%) and $40,000 to $44,999 for women (52 | 18.3%).
| Income | Male | Female |
| $2,499 or less | 18 (6.3%) | 13 (4.6%) |
| $2,500 to $4,999 | 0 (0.0%) | 34 (12.0%) |
| $5,000 to $7,499 | 6 (2.1%) | 13 (4.6%) |
| $7,500 to $9,999 | 0 (0.0%) | 0 (0.0%) |
| $10,000 to $12,499 | 23 (8.0%) | 18 (6.3%) |
| $12,500 to $14,999 | 0 (0.0%) | 6 (2.1%) |
| $15,000 to $17,499 | 0 (0.0%) | 28 (9.9%) |
| $17,500 to $19,999 | 0 (0.0%) | 0 (0.0%) |
| $20,000 to $22,499 | 0 (0.0%) | 0 (0.0%) |
| $22,500 to $24,999 | 1 (0.4%) | 7 (2.5%) |
| $25,000 to $29,999 | 14 (4.9%) | 0 (0.0%) |
| $30,000 to $34,999 | 1 (0.4%) | 0 (0.0%) |
| $35,000 to $39,999 | 0 (0.0%) | 7 (2.5%) |
| $40,000 to $44,999 | 9 (3.1%) | 52 (18.3%) |
| $45,000 to $49,999 | 0 (0.0%) | 0 (0.0%) |
| $50,000 to $54,999 | 17 (5.9%) | 0 (0.0%) |
| $55,000 to $64,999 | 39 (13.6%) | 34 (12.0%) |
| $65,000 to $74,999 | 10 (3.5%) | 8 (2.8%) |
| $75,000 to $99,999 | 25 (8.7%) | 27 (9.5%) |
| $100,000+ | 124 (43.2%) | 37 (13.0%) |
| Total | 287 (100.0%) | 284 (100.0%) |
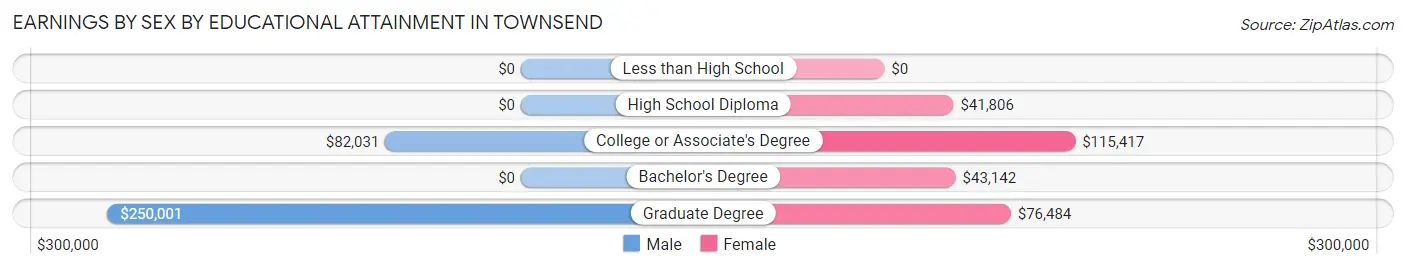
Earnings by Sex by Educational Attainment in Townsend
Average earnings in Townsend are $81,382 for men and $44,155 for women, a difference of 45.7%. Men with an educational attainment of graduate degree enjoy the highest average annual earnings of $250,001, while those with college or associate's degree education earn the least with $82,031. Women with an educational attainment of college or associate's degree earn the most with the average annual earnings of $115,417, while those with high school diploma education have the smallest earnings of $41,806.
| Educational Attainment | Male Income | Female Income |
| Less than High School | - | - |
| High School Diploma | - | - |
| College or Associate's Degree | $82,031 | $115,417 |
| Bachelor's Degree | - | - |
| Graduate Degree | $250,001 | $76,484 |
| Total | $81,382 | $44,155 |
Family Income in Townsend
Family Income Brackets in Townsend
According to the Townsend family income data, there are 106 families falling into the $200,000+ income range, which is the most common income bracket and makes up 40.5% of all families.
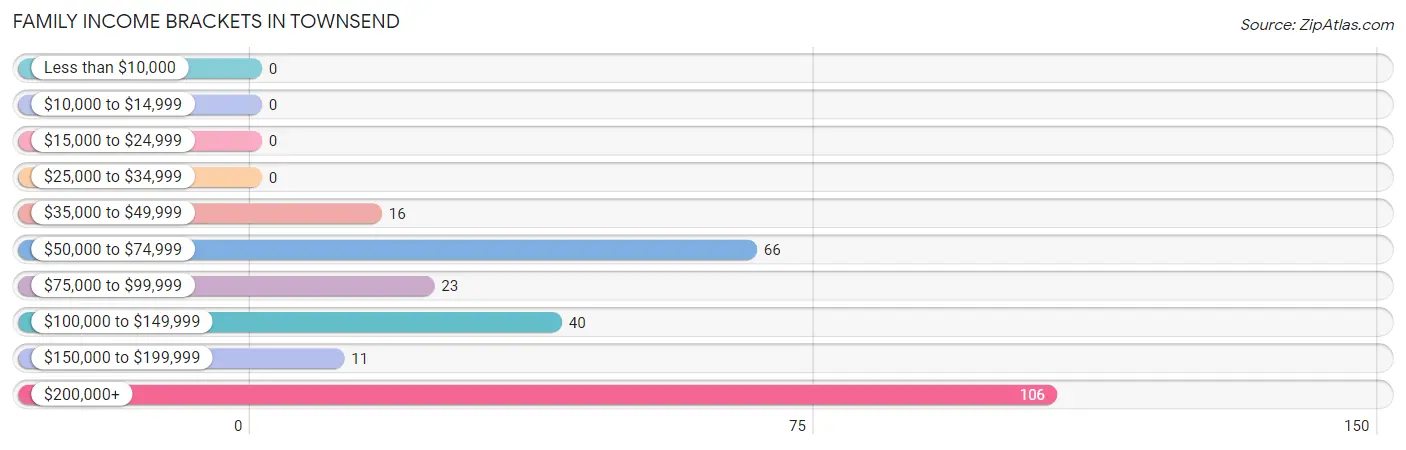
| Income Bracket | # Families | % Families |
| Less than $10,000 | 0 | 0.0% |
| $10,000 to $14,999 | 0 | 0.0% |
| $15,000 to $24,999 | 0 | 0.0% |
| $25,000 to $34,999 | 0 | 0.0% |
| $35,000 to $49,999 | 16 | 6.1% |
| $50,000 to $74,999 | 66 | 25.2% |
| $75,000 to $99,999 | 23 | 8.8% |
| $100,000 to $149,999 | 40 | 15.3% |
| $150,000 to $199,999 | 11 | 4.2% |
| $200,000+ | 106 | 40.5% |
Family Income by Famaliy Size in Townsend
4-person families (49 | 18.7%) account for the highest median family income in Townsend with $203,973 per family, while 4-person families (49 | 18.7%) have the highest median income of $50,993 per family member.
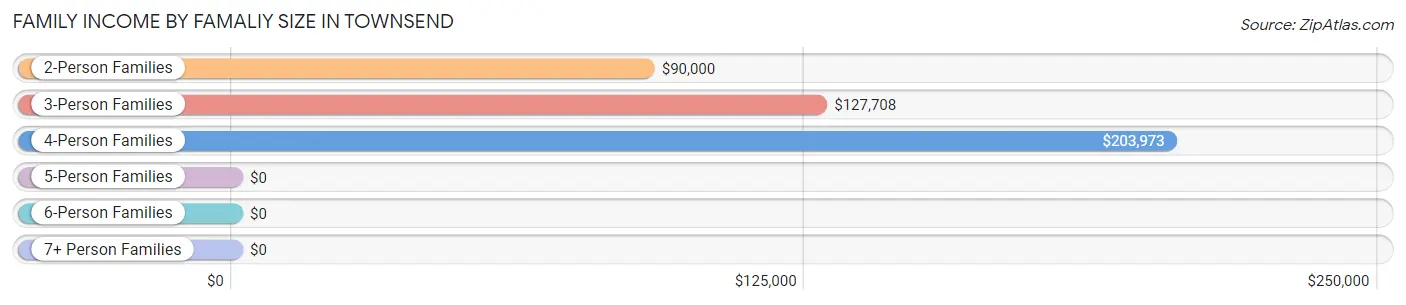
| Income Bracket | # Families | Median Income |
| 2-Person Families | 128 (48.8%) | $90,000 |
| 3-Person Families | 29 (11.1%) | $127,708 |
| 4-Person Families | 49 (18.7%) | $203,973 |
| 5-Person Families | 39 (14.9%) | $0 |
| 6-Person Families | 0 (0.0%) | $0 |
| 7+ Person Families | 17 (6.5%) | $0 |
| Total | 262 (100.0%) | $137,813 |
Family Income by Number of Earners in Townsend
The median family income in Townsend is $137,813, with families comprising 3+ earners (30) having the highest median family income of $234,545, while families with 1 earner (56) have the lowest median family income of $60,833, accounting for 11.5% and 21.4% of families, respectively.
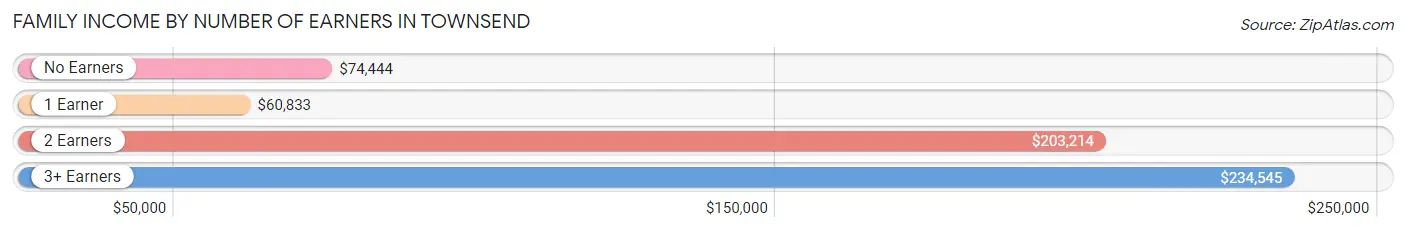
| Number of Earners | # Families | Median Income |
| No Earners | 28 (10.7%) | $74,444 |
| 1 Earner | 56 (21.4%) | $60,833 |
| 2 Earners | 148 (56.5%) | $203,214 |
| 3+ Earners | 30 (11.5%) | $234,545 |
| Total | 262 (100.0%) | $137,813 |
Household Income in Townsend
Household Income Brackets in Townsend
With 106 households falling in the category, the $200,000+ income range is the most frequent in Townsend, accounting for 21.8% of all households. In contrast, only 15 households (3.1%) fall into the $25,000 to $34,999 income bracket, making it the least populous group.
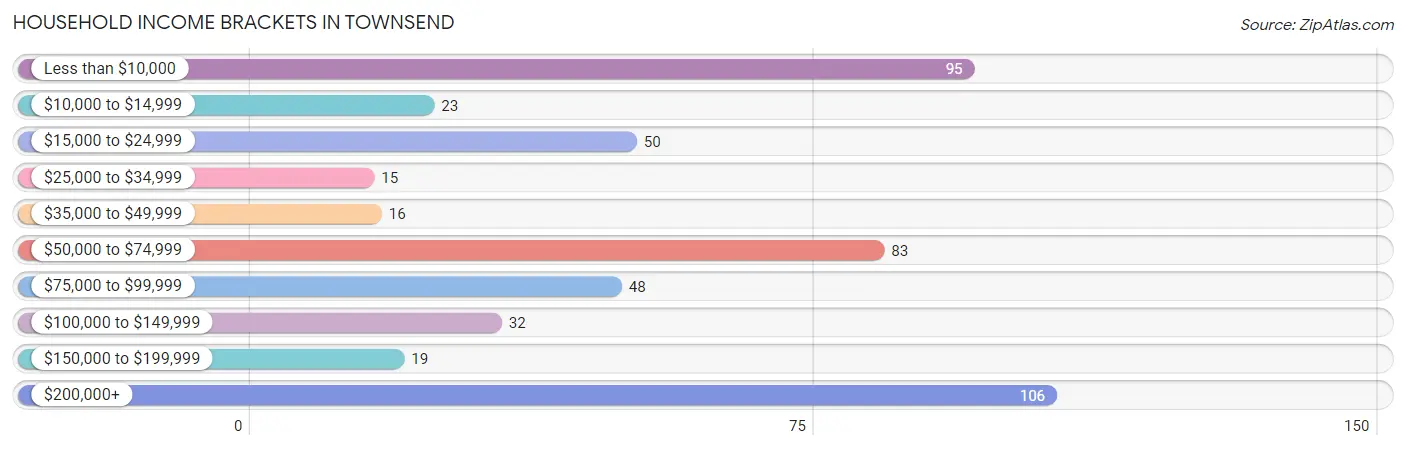
| Income Bracket | # Households | % Households |
| Less than $10,000 | 95 | 19.5% |
| $10,000 to $14,999 | 23 | 4.7% |
| $15,000 to $24,999 | 50 | 10.3% |
| $25,000 to $34,999 | 15 | 3.1% |
| $35,000 to $49,999 | 16 | 3.3% |
| $50,000 to $74,999 | 83 | 17.0% |
| $75,000 to $99,999 | 48 | 9.9% |
| $100,000 to $149,999 | 32 | 6.6% |
| $150,000 to $199,999 | 19 | 3.9% |
| $200,000+ | 106 | 21.8% |
Household Income by Householder Age in Townsend
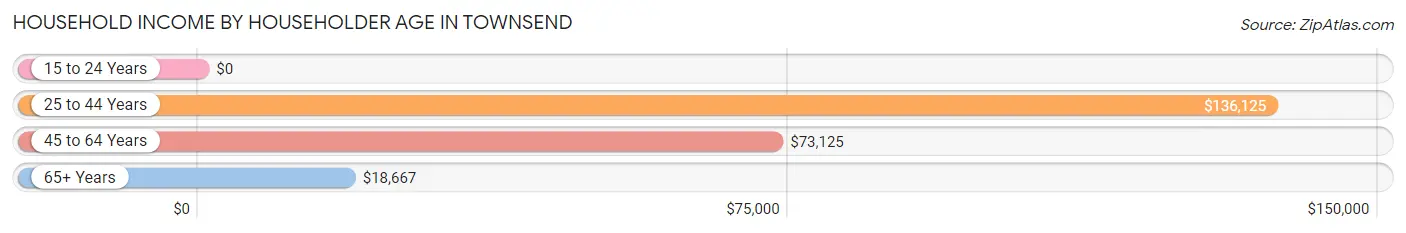
The median household income in Townsend is $61,546, with the highest median household income of $136,125 found in the 25 to 44 years age bracket for the primary householder. A total of 119 households (24.4%) fall into this category.
| Income Bracket | # Households | Median Income |
| 15 to 24 Years | 0 (0.0%) | $0 |
| 25 to 44 Years | 119 (24.4%) | $136,125 |
| 45 to 64 Years | 236 (48.5%) | $73,125 |
| 65+ Years | 132 (27.1%) | $18,667 |
| Total | 487 (100.0%) | $61,546 |
Poverty in Townsend
Income Below Poverty by Sex and Age in Townsend
With 18.4% poverty level for males and 4.6% for females among the residents of Townsend, 75 year old and over males and 65 to 74 year old females are the most vulnerable to poverty, with 14 males (42.4%) and 14 females (24.6%) in their respective age groups living below the poverty level.
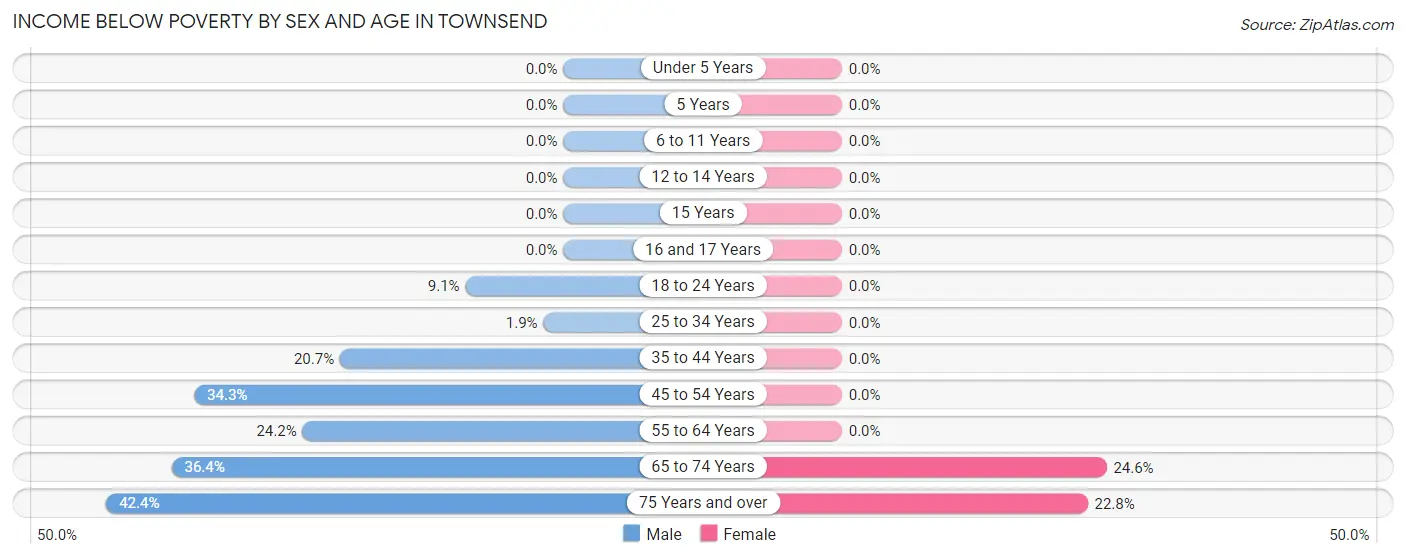
| Age Bracket | Male | Female |
| Under 5 Years | 0 (0.0%) | 0 (0.0%) |
| 5 Years | 0 (0.0%) | 0 (0.0%) |
| 6 to 11 Years | 0 (0.0%) | 0 (0.0%) |
| 12 to 14 Years | 0 (0.0%) | 0 (0.0%) |
| 15 Years | 0 (0.0%) | 0 (0.0%) |
| 16 and 17 Years | 0 (0.0%) | 0 (0.0%) |
| 18 to 24 Years | 1 (9.1%) | 0 (0.0%) |
| 25 to 34 Years | 1 (1.8%) | 0 (0.0%) |
| 35 to 44 Years | 17 (20.7%) | 0 (0.0%) |
| 45 to 54 Years | 37 (34.3%) | 0 (0.0%) |
| 55 to 64 Years | 23 (24.2%) | 0 (0.0%) |
| 65 to 74 Years | 8 (36.4%) | 14 (24.6%) |
| 75 Years and over | 14 (42.4%) | 13 (22.8%) |
| Total | 101 (18.4%) | 27 (4.6%) |
Income Above Poverty by Sex and Age in Townsend
According to the poverty statistics in Townsend, males aged under 5 years and females aged under 5 years are the age groups that are most secure financially, with 100.0% of males and 100.0% of females in these age groups living above the poverty line.
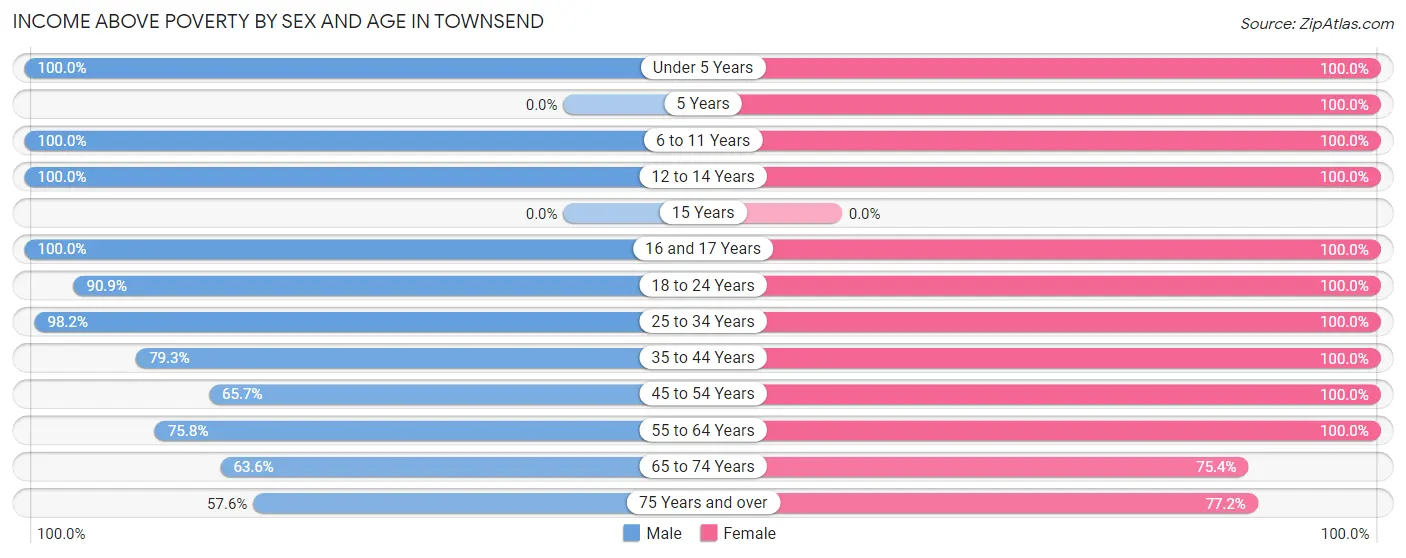
| Age Bracket | Male | Female |
| Under 5 Years | 31 (100.0%) | 24 (100.0%) |
| 5 Years | 0 (0.0%) | 37 (100.0%) |
| 6 to 11 Years | 77 (100.0%) | 58 (100.0%) |
| 12 to 14 Years | 30 (100.0%) | 21 (100.0%) |
| 15 Years | 0 (0.0%) | 0 (0.0%) |
| 16 and 17 Years | 7 (100.0%) | 6 (100.0%) |
| 18 to 24 Years | 10 (90.9%) | 47 (100.0%) |
| 25 to 34 Years | 53 (98.2%) | 70 (100.0%) |
| 35 to 44 Years | 65 (79.3%) | 41 (100.0%) |
| 45 to 54 Years | 71 (65.7%) | 110 (100.0%) |
| 55 to 64 Years | 72 (75.8%) | 53 (100.0%) |
| 65 to 74 Years | 14 (63.6%) | 43 (75.4%) |
| 75 Years and over | 19 (57.6%) | 44 (77.2%) |
| Total | 449 (81.6%) | 554 (95.4%) |
Income Below Poverty Among Married-Couple Families in Townsend
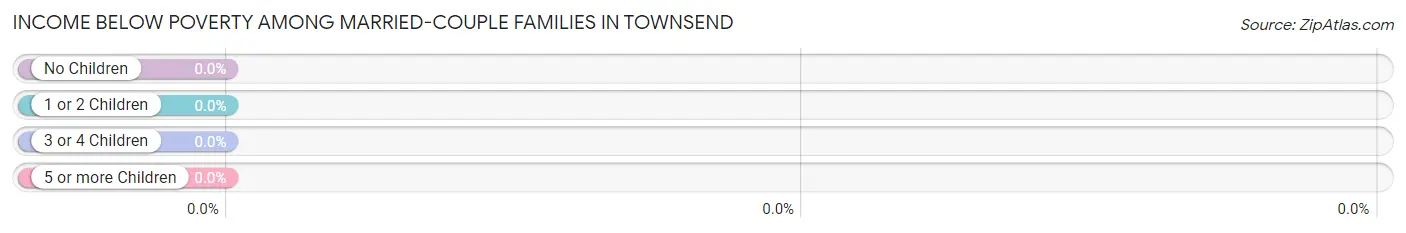
| Children | Above Poverty | Below Poverty |
| No Children | 86 (100.0%) | 0 (0.0%) |
| 1 or 2 Children | 57 (100.0%) | 0 (0.0%) |
| 3 or 4 Children | 43 (100.0%) | 0 (0.0%) |
| 5 or more Children | 0 (0.0%) | 0 (0.0%) |
| Total | 186 (100.0%) | 0 (0.0%) |
Income Below Poverty Among Single-Parent Households in Townsend
| Children | Single Father | Single Mother |
| No Children | 0 (0.0%) | 0 (0.0%) |
| 1 or 2 Children | 0 (0.0%) | 0 (0.0%) |
| 3 or 4 Children | 0 (0.0%) | 0 (0.0%) |
| 5 or more Children | 0 (0.0%) | 0 (0.0%) |
| Total | 0 (0.0%) | 0 (0.0%) |
Income Below Poverty Among Married-Couple vs Single-Parent Households in Townsend
| Children | Married-Couple Families | Single-Parent Households |
| No Children | 0 (0.0%) | 0 (0.0%) |
| 1 or 2 Children | 0 (0.0%) | 0 (0.0%) |
| 3 or 4 Children | 0 (0.0%) | 0 (0.0%) |
| 5 or more Children | 0 (0.0%) | 0 (0.0%) |
| Total | 0 (0.0%) | 0 (0.0%) |
Race in Townsend
The most populous races in Townsend are White / Caucasian (925 | 81.8%), Two or more Races (86 | 7.6%), and Hispanic or Latino (85 | 7.5%).
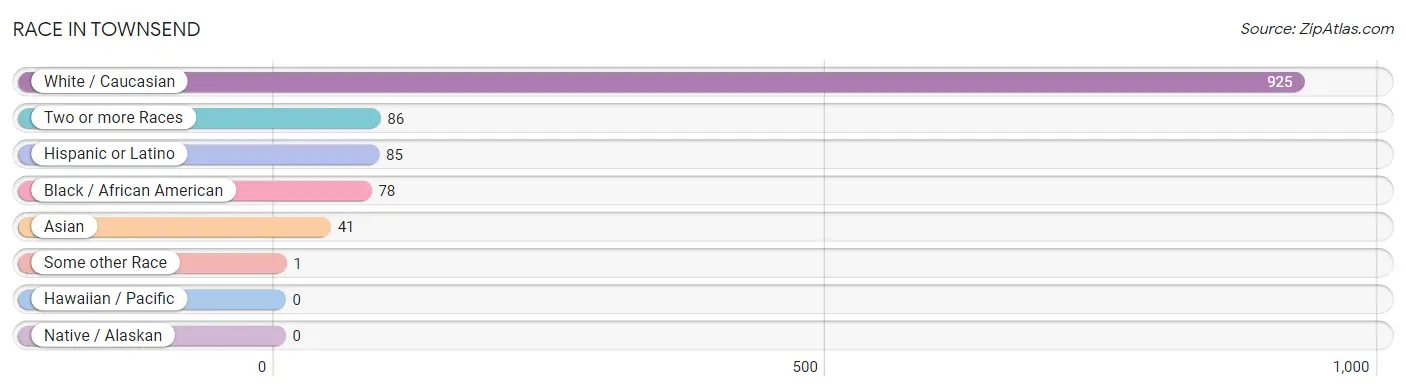
| Race | # Population | % Population |
| Asian | 41 | 3.6% |
| Black / African American | 78 | 6.9% |
| Hawaiian / Pacific | 0 | 0.0% |
| Hispanic or Latino | 85 | 7.5% |
| Native / Alaskan | 0 | 0.0% |
| White / Caucasian | 925 | 81.8% |
| Two or more Races | 86 | 7.6% |
| Some other Race | 1 | 0.1% |
| Total | 1,131 | 100.0% |
Ancestry in Townsend
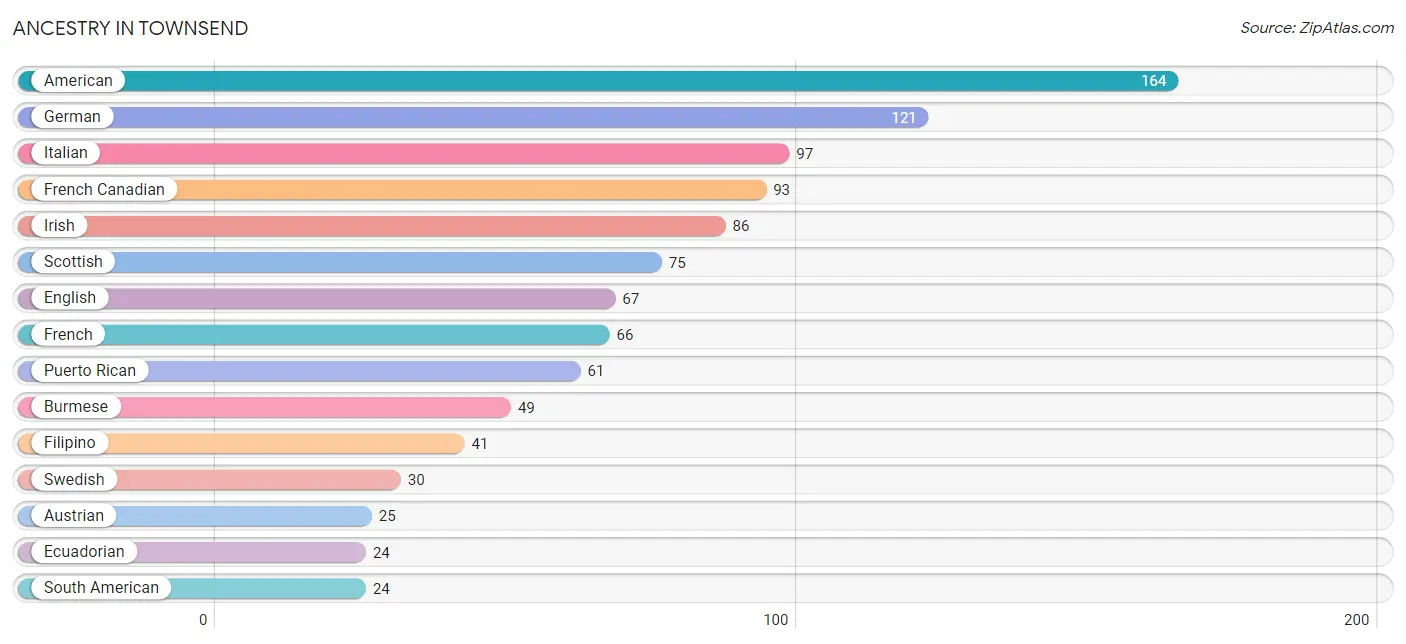
The most populous ancestries reported in Townsend are American (164 | 14.5%), German (121 | 10.7%), Italian (97 | 8.6%), French Canadian (93 | 8.2%), and Irish (86 | 7.6%), together accounting for 49.6% of all Townsend residents.
| Ancestry | # Population | % Population |
| American | 164 | 14.5% |
| Arab | 9 | 0.8% |
| Austrian | 25 | 2.2% |
| Burmese | 49 | 4.3% |
| Eastern European | 19 | 1.7% |
| Ecuadorian | 24 | 2.1% |
| English | 67 | 5.9% |
| European | 8 | 0.7% |
| Filipino | 41 | 3.6% |
| Finnish | 14 | 1.2% |
| French | 66 | 5.8% |
| French Canadian | 93 | 8.2% |
| German | 121 | 10.7% |
| Irish | 86 | 7.6% |
| Italian | 97 | 8.6% |
| Jamaican | 18 | 1.6% |
| Norwegian | 10 | 0.9% |
| Polish | 16 | 1.4% |
| Portuguese | 11 | 1.0% |
| Puerto Rican | 61 | 5.4% |
| Scottish | 75 | 6.6% |
| South American | 24 | 2.1% |
| Swedish | 30 | 2.6% |
| Syrian | 9 | 0.8% |
| Ukrainian | 12 | 1.1% |
| Welsh | 8 | 0.7% | View All 26 Rows |
Immigrants in Townsend
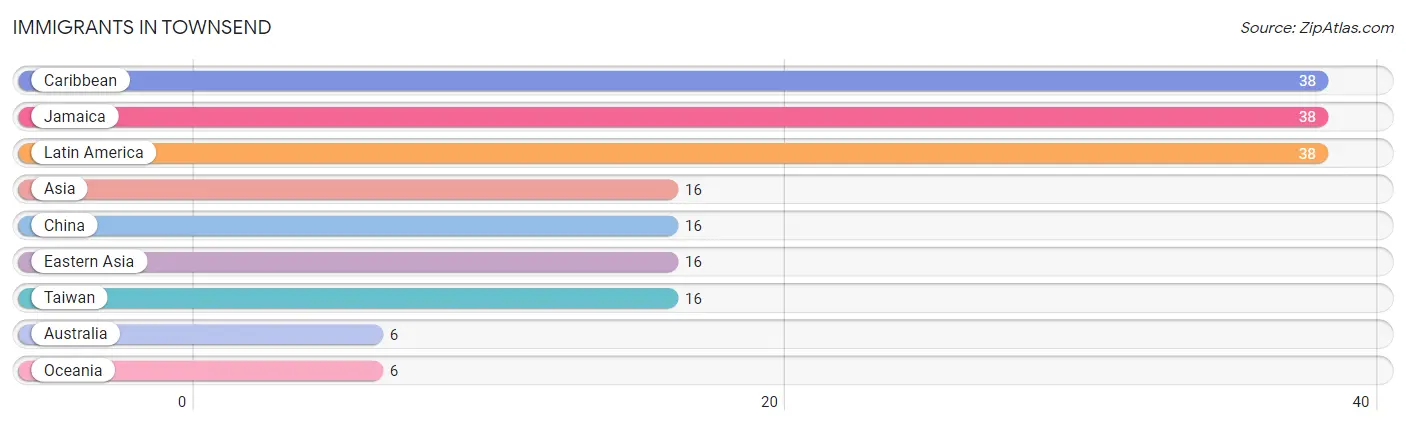
The most numerous immigrant groups reported in Townsend came from Caribbean (38 | 3.4%), Jamaica (38 | 3.4%), Latin America (38 | 3.4%), Asia (16 | 1.4%), and China (16 | 1.4%), together accounting for 12.9% of all Townsend residents.
| Immigration Origin | # Population | % Population |
| Asia | 16 | 1.4% |
| Australia | 6 | 0.5% |
| Caribbean | 38 | 3.4% |
| China | 16 | 1.4% |
| Eastern Asia | 16 | 1.4% |
| Jamaica | 38 | 3.4% |
| Latin America | 38 | 3.4% |
| Oceania | 6 | 0.5% |
| Taiwan | 16 | 1.4% | View All 9 Rows |
Sex and Age in Townsend
Sex and Age in Townsend
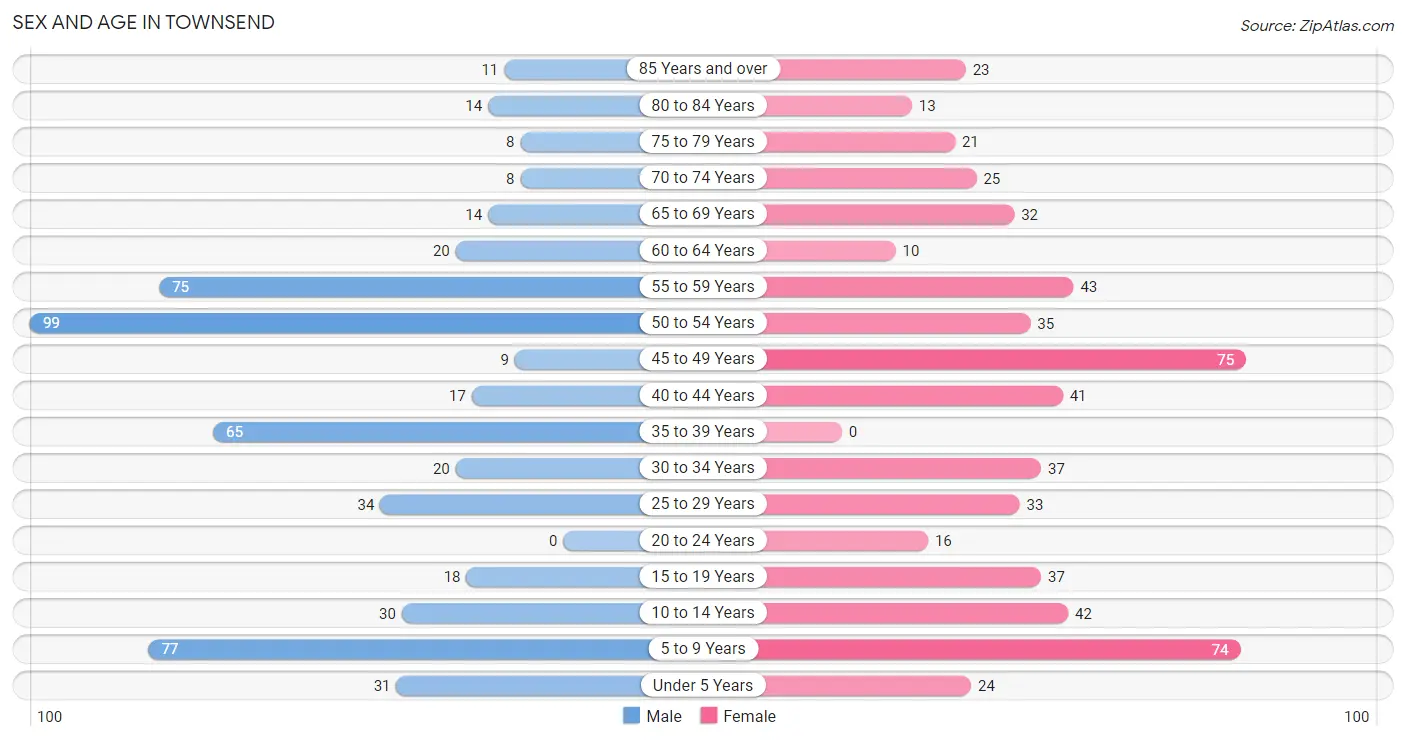
The most populous age groups in Townsend are 50 to 54 Years (99 | 18.0%) for men and 45 to 49 Years (75 | 12.9%) for women.
| Age Bracket | Male | Female |
| Under 5 Years | 31 (5.6%) | 24 (4.1%) |
| 5 to 9 Years | 77 (14.0%) | 74 (12.7%) |
| 10 to 14 Years | 30 (5.4%) | 42 (7.2%) |
| 15 to 19 Years | 18 (3.3%) | 37 (6.4%) |
| 20 to 24 Years | 0 (0.0%) | 16 (2.8%) |
| 25 to 29 Years | 34 (6.2%) | 33 (5.7%) |
| 30 to 34 Years | 20 (3.6%) | 37 (6.4%) |
| 35 to 39 Years | 65 (11.8%) | 0 (0.0%) |
| 40 to 44 Years | 17 (3.1%) | 41 (7.1%) |
| 45 to 49 Years | 9 (1.6%) | 75 (12.9%) |
| 50 to 54 Years | 99 (18.0%) | 35 (6.0%) |
| 55 to 59 Years | 75 (13.6%) | 43 (7.4%) |
| 60 to 64 Years | 20 (3.6%) | 10 (1.7%) |
| 65 to 69 Years | 14 (2.5%) | 32 (5.5%) |
| 70 to 74 Years | 8 (1.5%) | 25 (4.3%) |
| 75 to 79 Years | 8 (1.5%) | 21 (3.6%) |
| 80 to 84 Years | 14 (2.5%) | 13 (2.2%) |
| 85 Years and over | 11 (2.0%) | 23 (4.0%) |
| Total | 550 (100.0%) | 581 (100.0%) |
Families and Households in Townsend
Median Family Size in Townsend
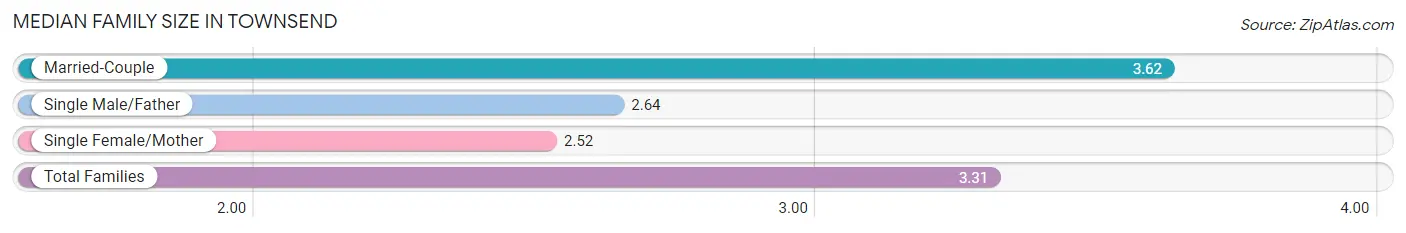
The median family size in Townsend is 3.31 persons per family, with married-couple families (186 | 71.0%) accounting for the largest median family size of 3.62 persons per family. On the other hand, single female/mother families (62 | 23.7%) represent the smallest median family size with 2.52 persons per family.
| Family Type | # Families | Family Size |
| Married-Couple | 186 (71.0%) | 3.62 |
| Single Male/Father | 14 (5.3%) | 2.64 |
| Single Female/Mother | 62 (23.7%) | 2.52 |
| Total Families | 262 (100.0%) | 3.31 |
Median Household Size in Townsend
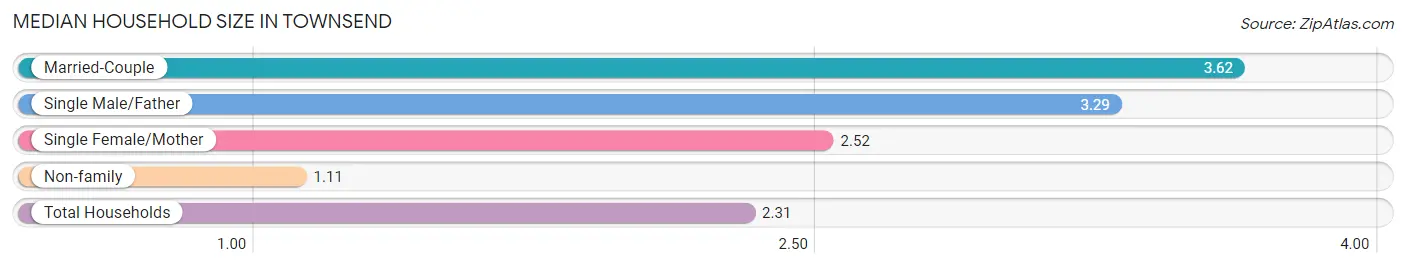
The median household size in Townsend is 2.31 persons per household, with married-couple households (186 | 38.2%) accounting for the largest median household size of 3.62 persons per household. non-family households (225 | 46.2%) represent the smallest median household size with 1.11 persons per household.
| Household Type | # Households | Household Size |
| Married-Couple | 186 (38.2%) | 3.62 |
| Single Male/Father | 14 (2.9%) | 3.29 |
| Single Female/Mother | 62 (12.7%) | 2.52 |
| Non-family | 225 (46.2%) | 1.11 |
| Total Households | 487 (100.0%) | 2.31 |
Household Size by Marriage Status in Townsend
Out of a total of 487 households in Townsend, 262 (53.8%) are family households, while 225 (46.2%) are nonfamily households. The most numerous type of family households are 2-person households, comprising 128, and the most common type of nonfamily households are 1-person households, comprising 200.
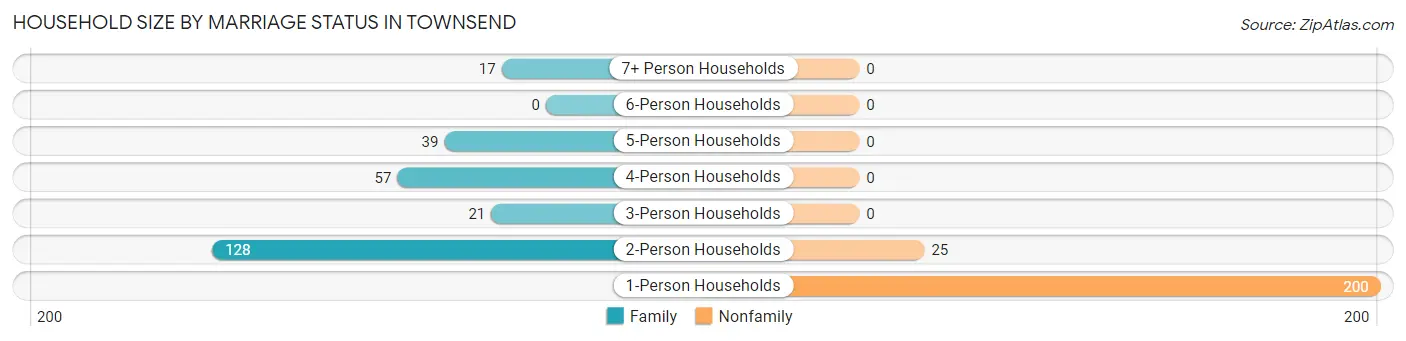
| Household Size | Family Households | Nonfamily Households |
| 1-Person Households | - | 200 (41.1%) |
| 2-Person Households | 128 (26.3%) | 25 (5.1%) |
| 3-Person Households | 21 (4.3%) | 0 (0.0%) |
| 4-Person Households | 57 (11.7%) | 0 (0.0%) |
| 5-Person Households | 39 (8.0%) | 0 (0.0%) |
| 6-Person Households | 0 (0.0%) | 0 (0.0%) |
| 7+ Person Households | 17 (3.5%) | 0 (0.0%) |
| Total | 262 (53.8%) | 225 (46.2%) |
Female Fertility in Townsend
Fertility by Age in Townsend
| Age Bracket | Women with Births | Births / 1,000 Women |
| 15 to 19 years | 0 (0.0%) | 0.0 |
| 20 to 34 years | 0 (0.0%) | 0.0 |
| 35 to 50 years | 0 (0.0%) | 0.0 |
| Total | 0 (0.0%) | 0.0 |
Fertility by Age by Marriage Status in Townsend
| Age Bracket | Married | Unmarried |
| 15 to 19 years | 0 (0.0%) | 0 (0.0%) |
| 20 to 34 years | 0 (0.0%) | 0 (0.0%) |
| 35 to 50 years | 0 (0.0%) | 0 (0.0%) |
| Total | 0 (0.0%) | 0 (0.0%) |
Fertility by Education in Townsend
| Educational Attainment | Women with Births | Births / 1,000 Women |
| Less than High School | 0 (0.0%) | 0.0 |
| High School Diploma | 0 (0.0%) | 0.0 |
| College or Associate's Degree | 0 (0.0%) | 0.0 |
| Bachelor's Degree | 0 (0.0%) | 0.0 |
| Graduate Degree | 0 (0.0%) | 0.0 |
| Total | 0 (0.0%) | 0.0 |
Fertility by Education by Marriage Status in Townsend
| Educational Attainment | Married | Unmarried |
| Less than High School | 0 (0.0%) | 0 (0.0%) |
| High School Diploma | 0 (0.0%) | 0 (0.0%) |
| College or Associate's Degree | 0 (0.0%) | 0 (0.0%) |
| Bachelor's Degree | 0 (0.0%) | 0 (0.0%) |
| Graduate Degree | 0 (0.0%) | 0 (0.0%) |
| Total | 0 (0.0%) | 0 (0.0%) |
Employment Characteristics in Townsend
Employment by Class of Employer in Townsend
Among the 465 employed individuals in Townsend, private company employees (302 | 64.9%), not-for-profit organizations (67 | 14.4%), and local government employees (36 | 7.7%) make up the most common classes of employment.
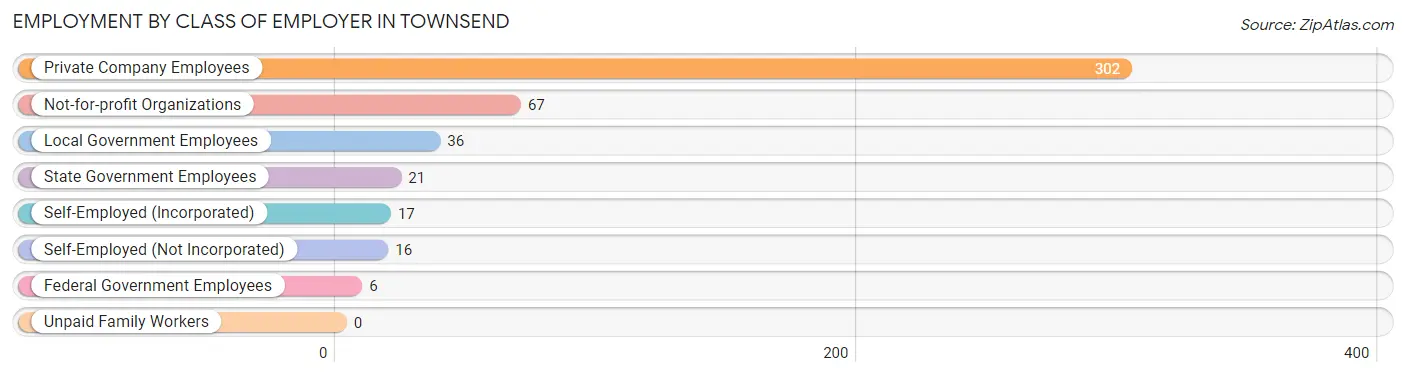
| Employer Class | # Employees | % Employees |
| Private Company Employees | 302 | 64.9% |
| Self-Employed (Incorporated) | 17 | 3.7% |
| Self-Employed (Not Incorporated) | 16 | 3.4% |
| Not-for-profit Organizations | 67 | 14.4% |
| Local Government Employees | 36 | 7.7% |
| State Government Employees | 21 | 4.5% |
| Federal Government Employees | 6 | 1.3% |
| Unpaid Family Workers | 0 | 0.0% |
| Total | 465 | 100.0% |
Employment Status by Age in Townsend
According to the labor force statistics for Townsend, out of the total population over 16 years of age (853), 64.8% or 553 individuals are in the labor force, with 3.3% or 18 of them unemployed. The age group with the highest labor force participation rate is 20 to 24 years, with 100.0% or 16 individuals in the labor force. Within the labor force, the 35 to 44 years age range has the highest percentage of unemployed individuals, with 19.5% or 17 of them being unemployed.
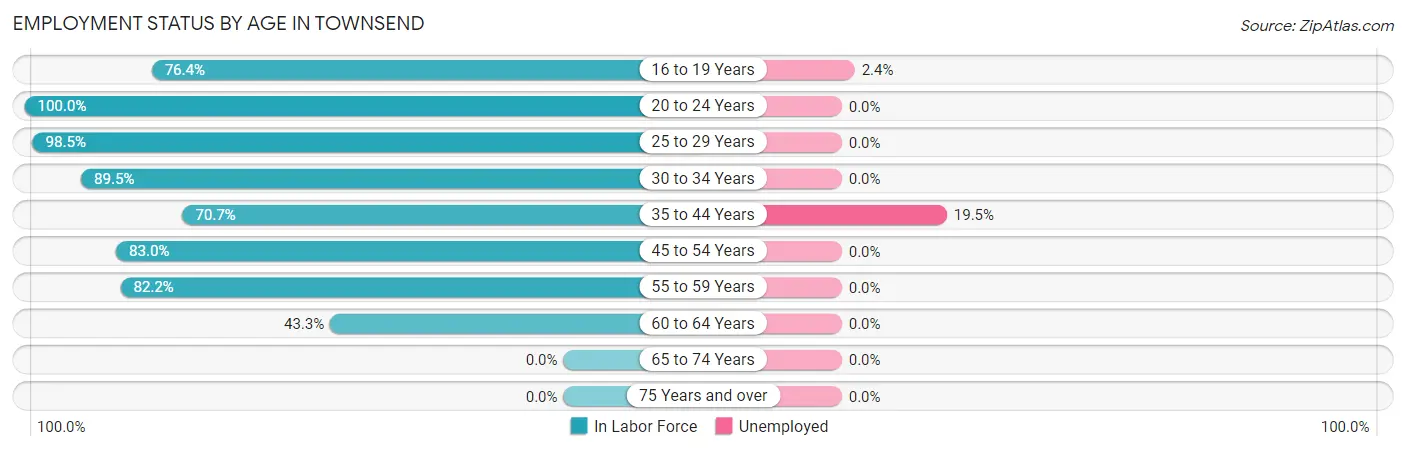
| Age Bracket | In Labor Force | Unemployed |
| 16 to 19 Years | 42 (76.4%) | 1 (2.4%) |
| 20 to 24 Years | 16 (100.0%) | 0 (0.0%) |
| 25 to 29 Years | 66 (98.5%) | 0 (0.0%) |
| 30 to 34 Years | 51 (89.5%) | 0 (0.0%) |
| 35 to 44 Years | 87 (70.7%) | 17 (19.5%) |
| 45 to 54 Years | 181 (83.0%) | 0 (0.0%) |
| 55 to 59 Years | 97 (82.2%) | 0 (0.0%) |
| 60 to 64 Years | 13 (43.3%) | 0 (0.0%) |
| 65 to 74 Years | 0 (0.0%) | 0 (0.0%) |
| 75 Years and over | 0 (0.0%) | 0 (0.0%) |
| Total | 553 (64.8%) | 18 (3.3%) |
Employment Status by Educational Attainment in Townsend
According to labor force statistics for Townsend, 80.8% of individuals (495) out of the total population between 25 and 64 years of age (613) are in the labor force, with 3.4% or 17 of them being unemployed. The group with the highest labor force participation rate are those with the educational attainment of high school diploma, with 89.3% or 142 individuals in the labor force. Within the labor force, individuals with high school diploma education have the highest percentage of unemployment, with 12.0% or 17 of them being unemployed.
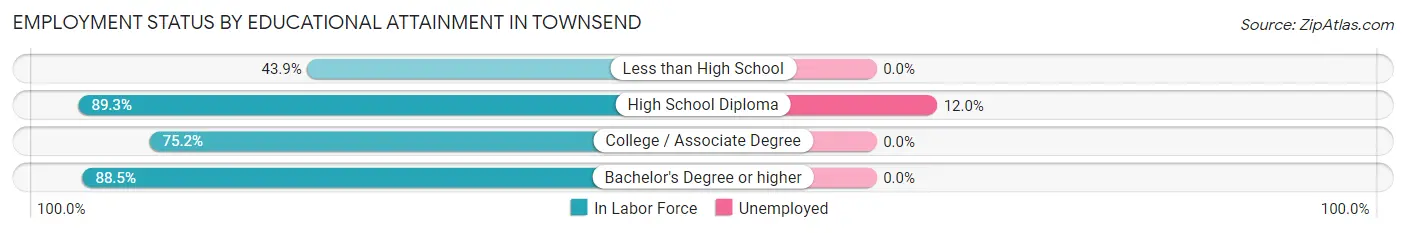
| Educational Attainment | In Labor Force | Unemployed |
| Less than High School | 29 (43.9%) | 0 (0.0%) |
| High School Diploma | 142 (89.3%) | 19 (12.0%) |
| College / Associate Degree | 109 (75.2%) | 0 (0.0%) |
| Bachelor's Degree or higher | 215 (88.5%) | 0 (0.0%) |
| Total | 495 (80.8%) | 21 (3.4%) |
Employment Occupations by Sex in Townsend
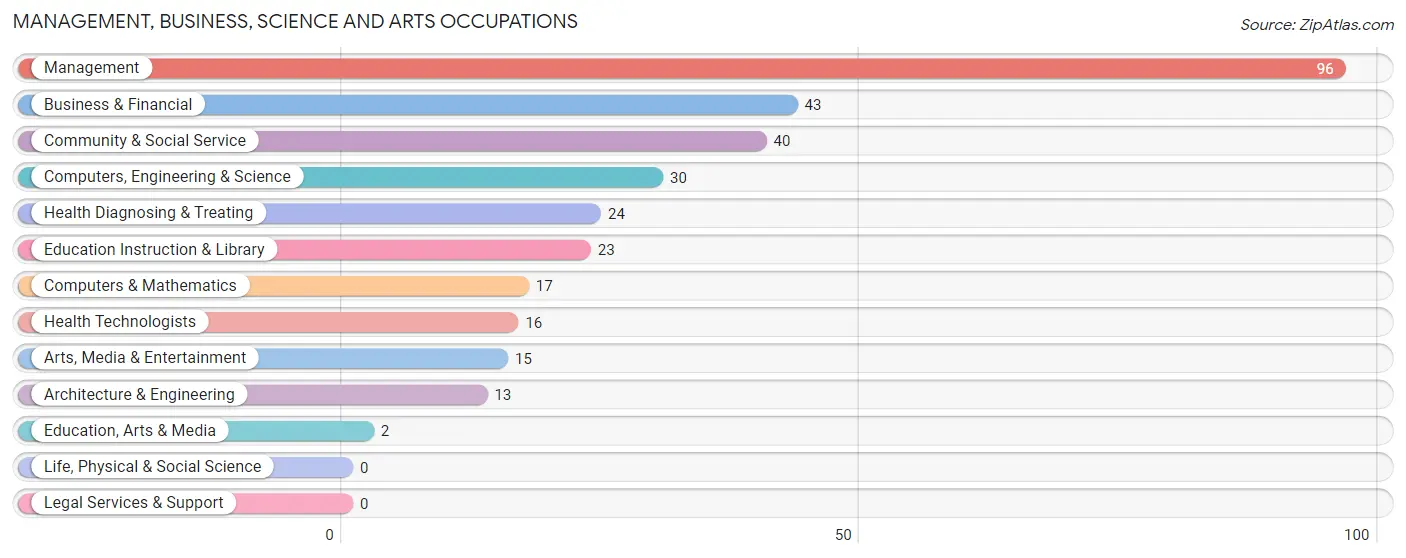
Management, Business, Science and Arts Occupations
The most common Management, Business, Science and Arts occupations in Townsend are Management (96 | 17.9%), Business & Financial (43 | 8.0%), Community & Social Service (40 | 7.5%), Computers, Engineering & Science (30 | 5.6%), and Health Diagnosing & Treating (24 | 4.5%).
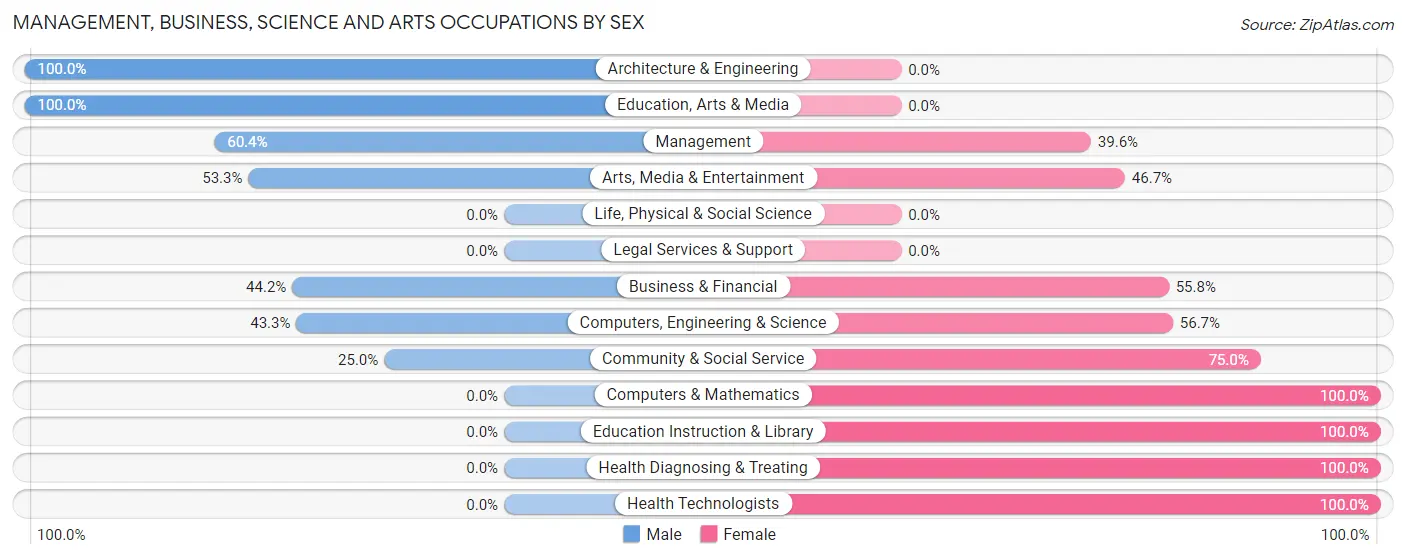
Management, Business, Science and Arts Occupations by Sex
Within the Management, Business, Science and Arts occupations in Townsend, the most male-oriented occupations are Architecture & Engineering (100.0%), Education, Arts & Media (100.0%), and Management (60.4%), while the most female-oriented occupations are Computers & Mathematics (100.0%), Education Instruction & Library (100.0%), and Health Diagnosing & Treating (100.0%).
| Occupation | Male | Female |
| Management | 58 (60.4%) | 38 (39.6%) |
| Business & Financial | 19 (44.2%) | 24 (55.8%) |
| Computers, Engineering & Science | 13 (43.3%) | 17 (56.7%) |
| Computers & Mathematics | 0 (0.0%) | 17 (100.0%) |
| Architecture & Engineering | 13 (100.0%) | 0 (0.0%) |
| Life, Physical & Social Science | 0 (0.0%) | 0 (0.0%) |
| Community & Social Service | 10 (25.0%) | 30 (75.0%) |
| Education, Arts & Media | 2 (100.0%) | 0 (0.0%) |
| Legal Services & Support | 0 (0.0%) | 0 (0.0%) |
| Education Instruction & Library | 0 (0.0%) | 23 (100.0%) |
| Arts, Media & Entertainment | 8 (53.3%) | 7 (46.7%) |
| Health Diagnosing & Treating | 0 (0.0%) | 24 (100.0%) |
| Health Technologists | 0 (0.0%) | 16 (100.0%) |
| Total (Category) | 100 (42.9%) | 133 (57.1%) |
| Total (Overall) | 279 (52.1%) | 256 (47.8%) |
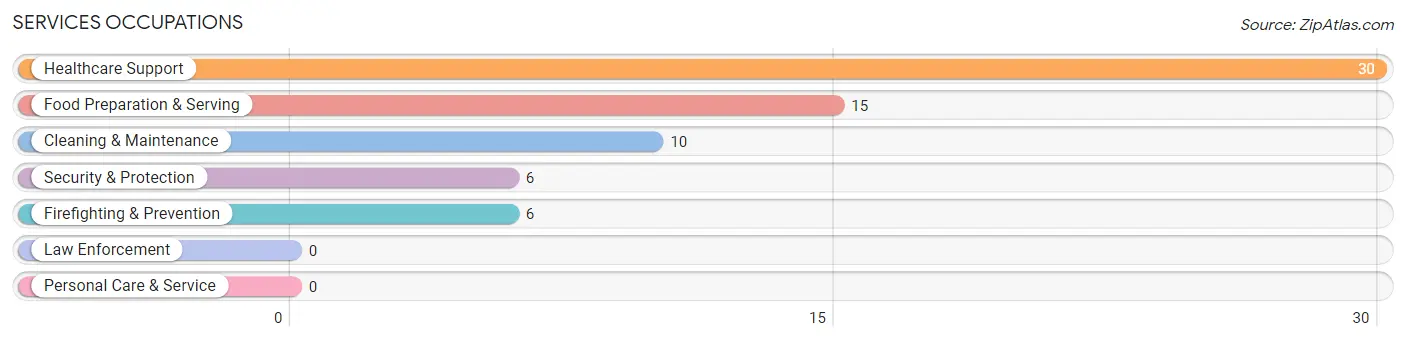
Services Occupations
The most common Services occupations in Townsend are Healthcare Support (30 | 5.6%), Food Preparation & Serving (15 | 2.8%), Cleaning & Maintenance (10 | 1.9%), Security & Protection (6 | 1.1%), and Firefighting & Prevention (6 | 1.1%).
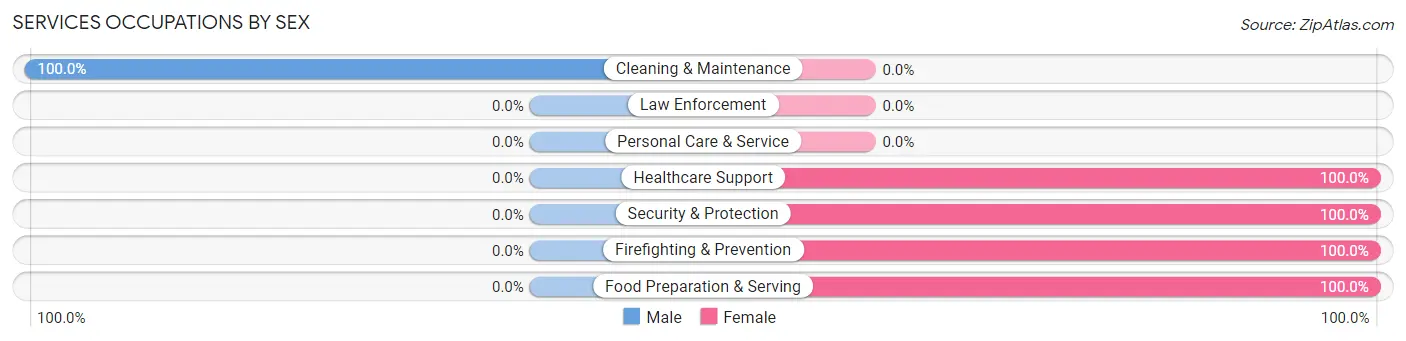
Services Occupations by Sex
| Occupation | Male | Female |
| Healthcare Support | 0 (0.0%) | 30 (100.0%) |
| Security & Protection | 0 (0.0%) | 6 (100.0%) |
| Firefighting & Prevention | 0 (0.0%) | 6 (100.0%) |
| Law Enforcement | 0 (0.0%) | 0 (0.0%) |
| Food Preparation & Serving | 0 (0.0%) | 15 (100.0%) |
| Cleaning & Maintenance | 10 (100.0%) | 0 (0.0%) |
| Personal Care & Service | 0 (0.0%) | 0 (0.0%) |
| Total (Category) | 10 (16.4%) | 51 (83.6%) |
| Total (Overall) | 279 (52.1%) | 256 (47.8%) |
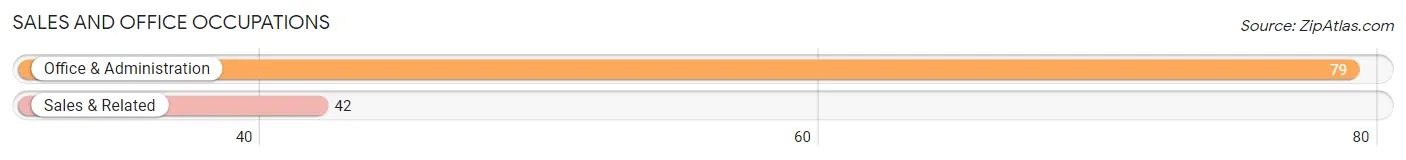
Sales and Office Occupations
The most common Sales and Office occupations in Townsend are Office & Administration (79 | 14.8%), and Sales & Related (42 | 7.9%).
Sales and Office Occupations by Sex
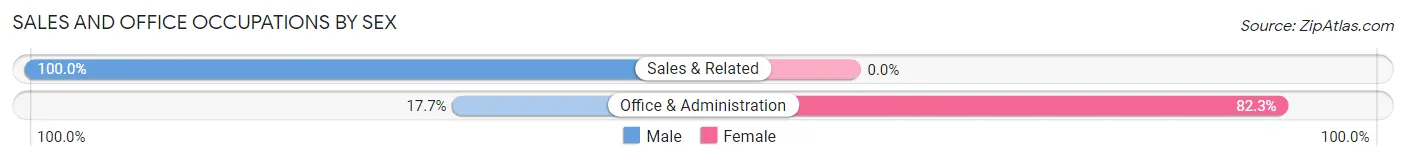
| Occupation | Male | Female |
| Sales & Related | 42 (100.0%) | 0 (0.0%) |
| Office & Administration | 14 (17.7%) | 65 (82.3%) |
| Total (Category) | 56 (46.3%) | 65 (53.7%) |
| Total (Overall) | 279 (52.1%) | 256 (47.8%) |
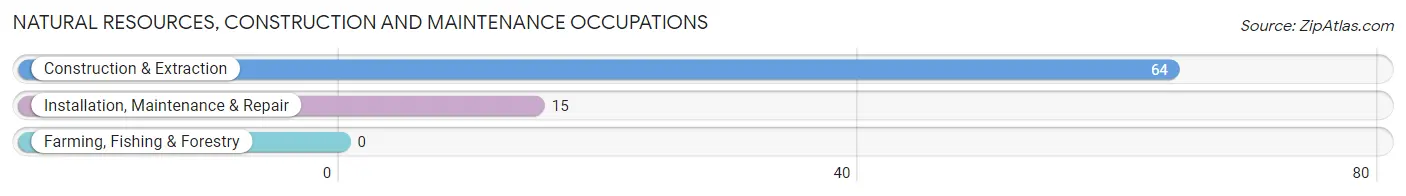
Natural Resources, Construction and Maintenance Occupations
The most common Natural Resources, Construction and Maintenance occupations in Townsend are Construction & Extraction (64 | 12.0%), and Installation, Maintenance & Repair (15 | 2.8%).
Natural Resources, Construction and Maintenance Occupations by Sex
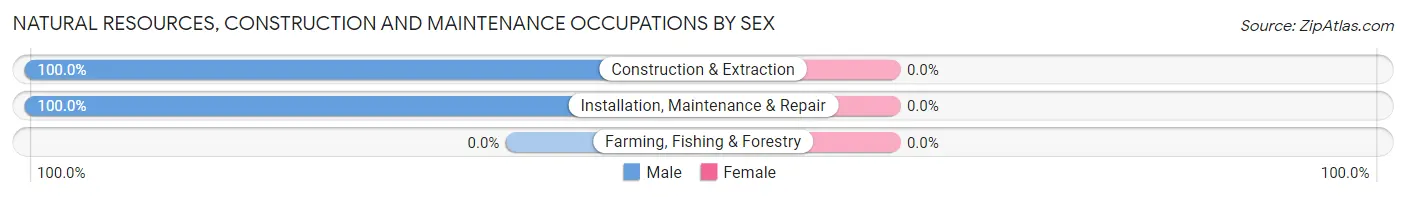
| Occupation | Male | Female |
| Farming, Fishing & Forestry | 0 (0.0%) | 0 (0.0%) |
| Construction & Extraction | 64 (100.0%) | 0 (0.0%) |
| Installation, Maintenance & Repair | 15 (100.0%) | 0 (0.0%) |
| Total (Category) | 79 (100.0%) | 0 (0.0%) |
| Total (Overall) | 279 (52.1%) | 256 (47.8%) |
Production, Transportation and Moving Occupations
The most common Production, Transportation and Moving occupations in Townsend are Production (40 | 7.5%), and Material Moving (1 | 0.2%).
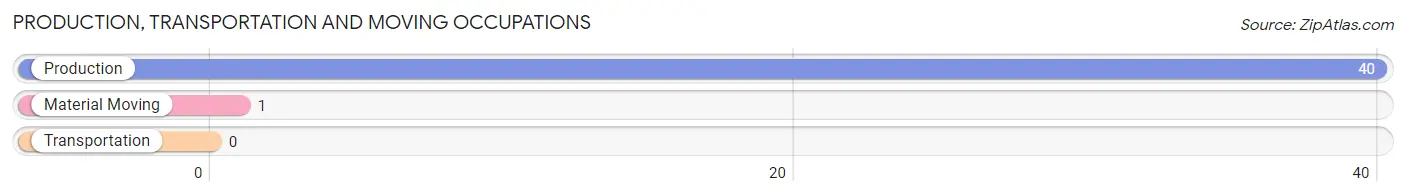
Production, Transportation and Moving Occupations by Sex
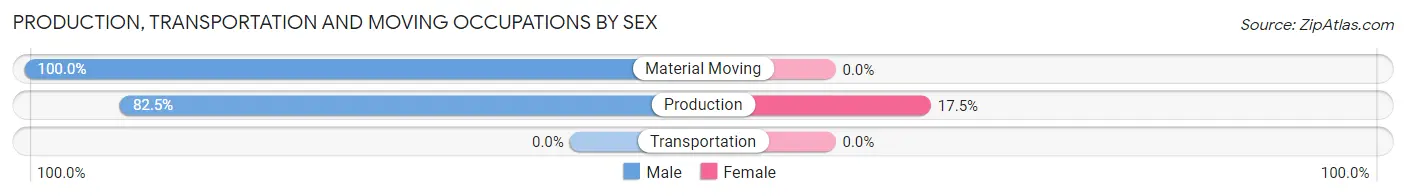
| Occupation | Male | Female |
| Production | 33 (82.5%) | 7 (17.5%) |
| Transportation | 0 (0.0%) | 0 (0.0%) |
| Material Moving | 1 (100.0%) | 0 (0.0%) |
| Total (Category) | 34 (82.9%) | 7 (17.1%) |
| Total (Overall) | 279 (52.1%) | 256 (47.8%) |
Employment Industries by Sex in Townsend
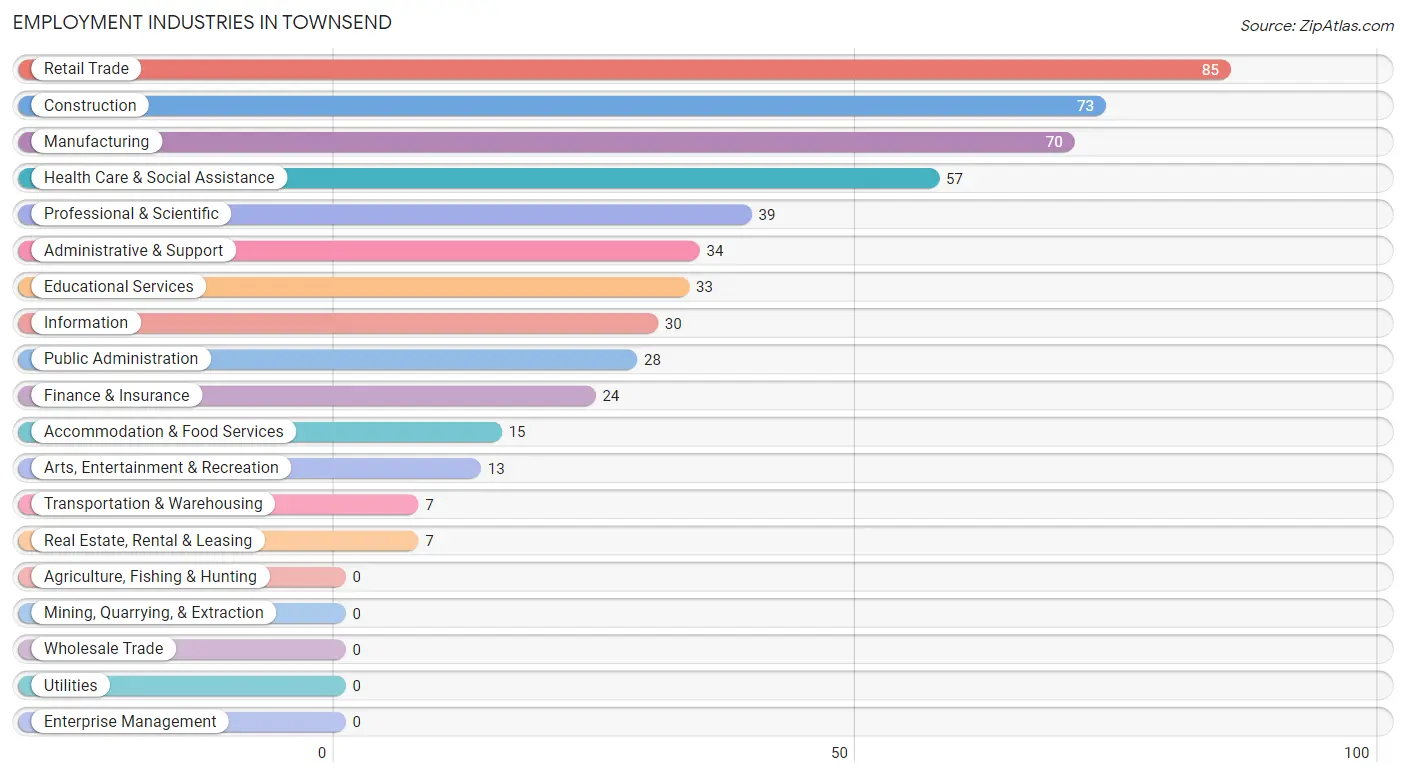
Employment Industries in Townsend
The major employment industries in Townsend include Retail Trade (85 | 15.9%), Construction (73 | 13.6%), Manufacturing (70 | 13.1%), Health Care & Social Assistance (57 | 10.6%), and Professional & Scientific (39 | 7.3%).
Employment Industries by Sex in Townsend
The Townsend industries that see more men than women are Construction (100.0%), Transportation & Warehousing (100.0%), and Real Estate, Rental & Leasing (100.0%), whereas the industries that tend to have a higher number of women are Information (100.0%), Finance & Insurance (100.0%), and Educational Services (100.0%).
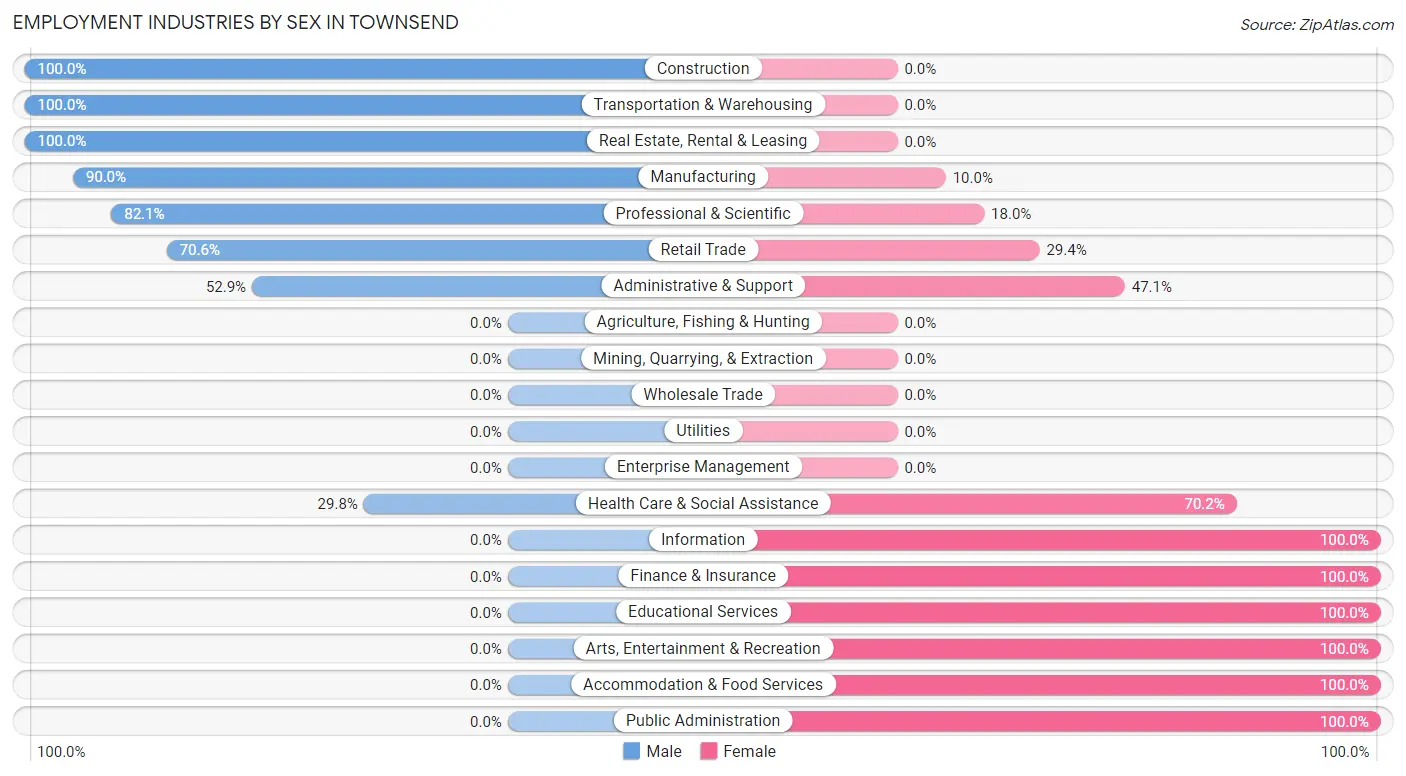
| Industry | Male | Female |
| Agriculture, Fishing & Hunting | 0 (0.0%) | 0 (0.0%) |
| Mining, Quarrying, & Extraction | 0 (0.0%) | 0 (0.0%) |
| Construction | 73 (100.0%) | 0 (0.0%) |
| Manufacturing | 63 (90.0%) | 7 (10.0%) |
| Wholesale Trade | 0 (0.0%) | 0 (0.0%) |
| Retail Trade | 60 (70.6%) | 25 (29.4%) |
| Transportation & Warehousing | 7 (100.0%) | 0 (0.0%) |
| Utilities | 0 (0.0%) | 0 (0.0%) |
| Information | 0 (0.0%) | 30 (100.0%) |
| Finance & Insurance | 0 (0.0%) | 24 (100.0%) |
| Real Estate, Rental & Leasing | 7 (100.0%) | 0 (0.0%) |
| Professional & Scientific | 32 (82.1%) | 7 (17.9%) |
| Enterprise Management | 0 (0.0%) | 0 (0.0%) |
| Administrative & Support | 18 (52.9%) | 16 (47.1%) |
| Educational Services | 0 (0.0%) | 33 (100.0%) |
| Health Care & Social Assistance | 17 (29.8%) | 40 (70.2%) |
| Arts, Entertainment & Recreation | 0 (0.0%) | 13 (100.0%) |
| Accommodation & Food Services | 0 (0.0%) | 15 (100.0%) |
| Public Administration | 0 (0.0%) | 28 (100.0%) |
| Total | 279 (52.1%) | 256 (47.8%) |
Education in Townsend
School Enrollment in Townsend
The most common levels of schooling among the 338 students in Townsend are elementary school (107 | 31.7%), middle school (65 | 19.2%), and high school (62 | 18.3%).
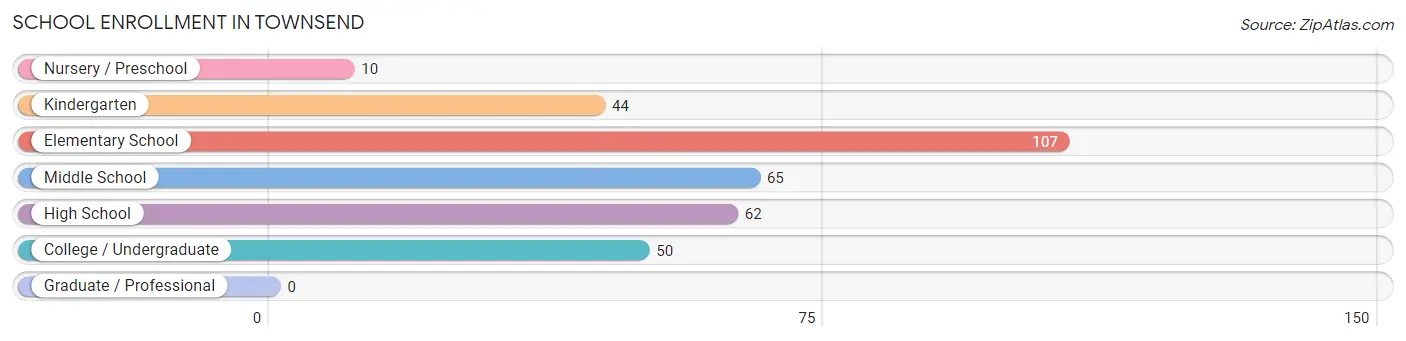
| School Level | # Students | % Students |
| Nursery / Preschool | 10 | 3.0% |
| Kindergarten | 44 | 13.0% |
| Elementary School | 107 | 31.7% |
| Middle School | 65 | 19.2% |
| High School | 62 | 18.3% |
| College / Undergraduate | 50 | 14.8% |
| Graduate / Professional | 0 | 0.0% |
| Total | 338 | 100.0% |
School Enrollment by Age by Funding Source in Townsend
Out of a total of 338 students who are enrolled in schools in Townsend, 122 (36.1%) attend a private institution, while the remaining 216 (63.9%) are enrolled in public schools. The age group of 20 to 24 year olds has the highest likelihood of being enrolled in private schools, with 7 (100.0% in the age bracket) enrolled. Conversely, the age group of 3 to 4 year olds has the lowest likelihood of being enrolled in a private school, with 10 (100.0% in the age bracket) attending a public institution.
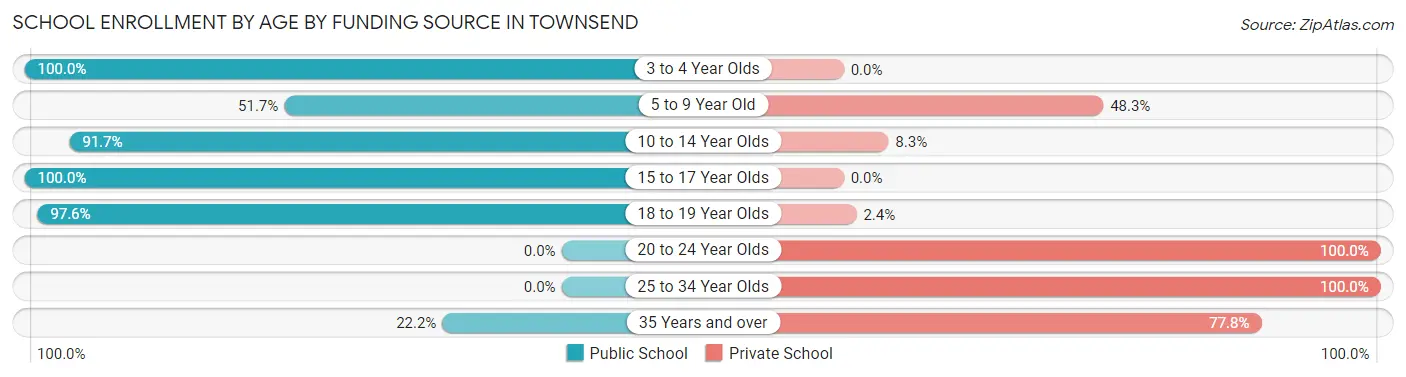
| Age Bracket | Public School | Private School |
| 3 to 4 Year Olds | 10 (100.0%) | 0 (0.0%) |
| 5 to 9 Year Old | 78 (51.7%) | 73 (48.3%) |
| 10 to 14 Year Olds | 66 (91.7%) | 6 (8.3%) |
| 15 to 17 Year Olds | 13 (100.0%) | 0 (0.0%) |
| 18 to 19 Year Olds | 41 (97.6%) | 1 (2.4%) |
| 20 to 24 Year Olds | 0 (0.0%) | 7 (100.0%) |
| 25 to 34 Year Olds | 0 (0.0%) | 7 (100.0%) |
| 35 Years and over | 8 (22.2%) | 28 (77.8%) |
| Total | 216 (63.9%) | 122 (36.1%) |
Educational Attainment by Field of Study in Townsend
Business (48 | 16.8%), arts & humanities (46 | 16.1%), education (45 | 15.7%), literature & languages (31 | 10.8%), and visual & performing arts (30 | 10.5%) are the most common fields of study among 286 individuals in Townsend who have obtained a bachelor's degree or higher.
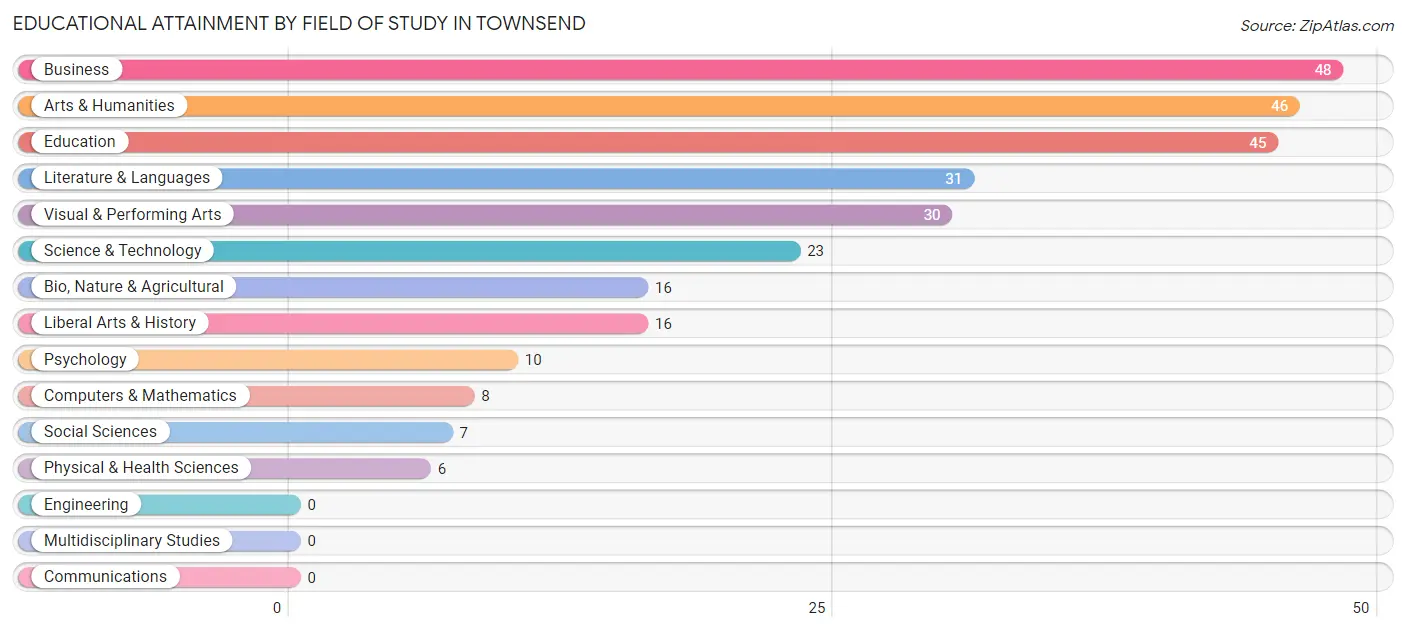
| Field of Study | # Graduates | % Graduates |
| Computers & Mathematics | 8 | 2.8% |
| Bio, Nature & Agricultural | 16 | 5.6% |
| Physical & Health Sciences | 6 | 2.1% |
| Psychology | 10 | 3.5% |
| Social Sciences | 7 | 2.5% |
| Engineering | 0 | 0.0% |
| Multidisciplinary Studies | 0 | 0.0% |
| Science & Technology | 23 | 8.0% |
| Business | 48 | 16.8% |
| Education | 45 | 15.7% |
| Literature & Languages | 31 | 10.8% |
| Liberal Arts & History | 16 | 5.6% |
| Visual & Performing Arts | 30 | 10.5% |
| Communications | 0 | 0.0% |
| Arts & Humanities | 46 | 16.1% |
| Total | 286 | 100.0% |
Transportation & Commute in Townsend
Vehicle Availability by Sex in Townsend
The most prevalent vehicle ownership categories in Townsend are males with 2 vehicles (124, accounting for 53.7%) and females with 2 vehicles (88, making up 53.7%).
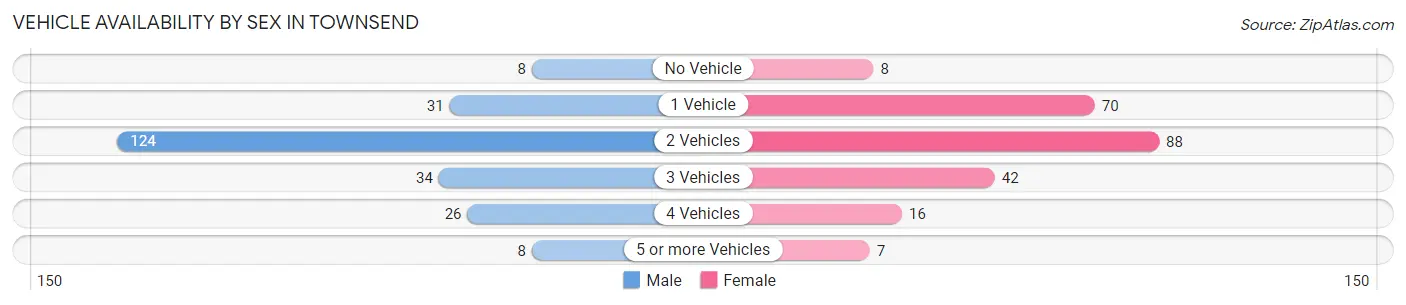
| Vehicles Available | Male | Female |
| No Vehicle | 8 (3.5%) | 8 (3.5%) |
| 1 Vehicle | 31 (13.4%) | 70 (30.3%) |
| 2 Vehicles | 124 (53.7%) | 88 (38.1%) |
| 3 Vehicles | 34 (14.7%) | 42 (18.2%) |
| 4 Vehicles | 26 (11.3%) | 16 (6.9%) |
| 5 or more Vehicles | 8 (3.5%) | 7 (3.0%) |
| Total | 231 (100.0%) | 231 (100.0%) |
Commute Time in Townsend
The most frequently occuring commute durations in Townsend are 20 to 24 minutes (104 commuters, 29.1%), 60 to 89 minutes (52 commuters, 14.6%), and 15 to 19 minutes (39 commuters, 10.9%).
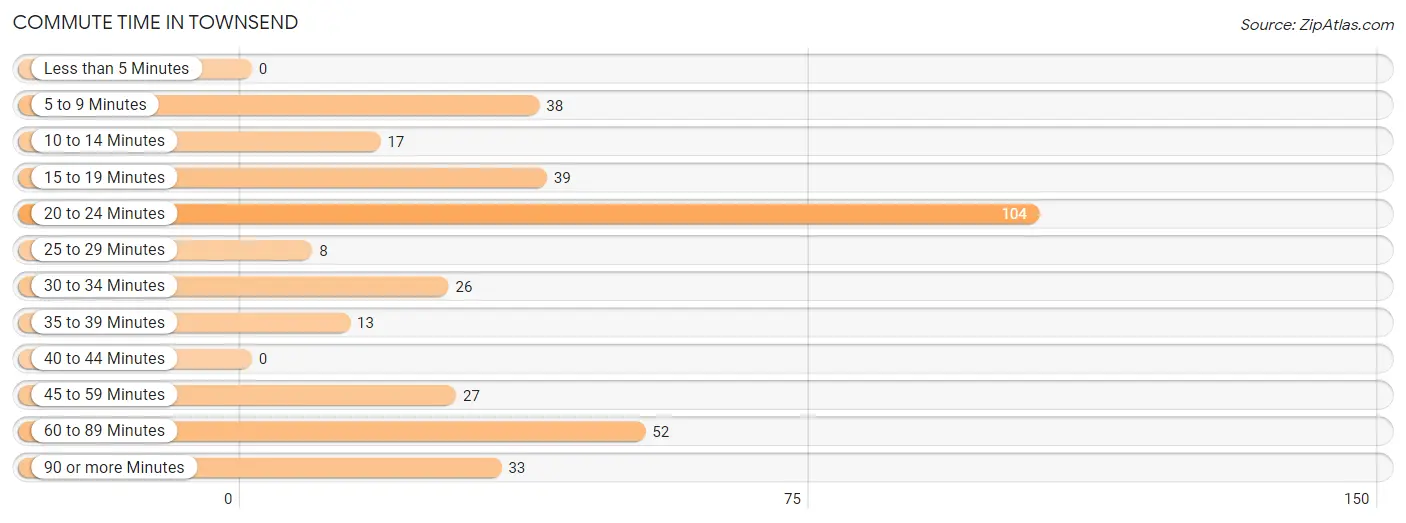
| Commute Time | # Commuters | % Commuters |
| Less than 5 Minutes | 0 | 0.0% |
| 5 to 9 Minutes | 38 | 10.6% |
| 10 to 14 Minutes | 17 | 4.8% |
| 15 to 19 Minutes | 39 | 10.9% |
| 20 to 24 Minutes | 104 | 29.1% |
| 25 to 29 Minutes | 8 | 2.2% |
| 30 to 34 Minutes | 26 | 7.3% |
| 35 to 39 Minutes | 13 | 3.6% |
| 40 to 44 Minutes | 0 | 0.0% |
| 45 to 59 Minutes | 27 | 7.6% |
| 60 to 89 Minutes | 52 | 14.6% |
| 90 or more Minutes | 33 | 9.2% |
Commute Time by Sex in Townsend
The most common commute times in Townsend are 60 to 89 minutes (52 commuters, 28.0%) for males and 20 to 24 minutes (71 commuters, 41.5%) for females.
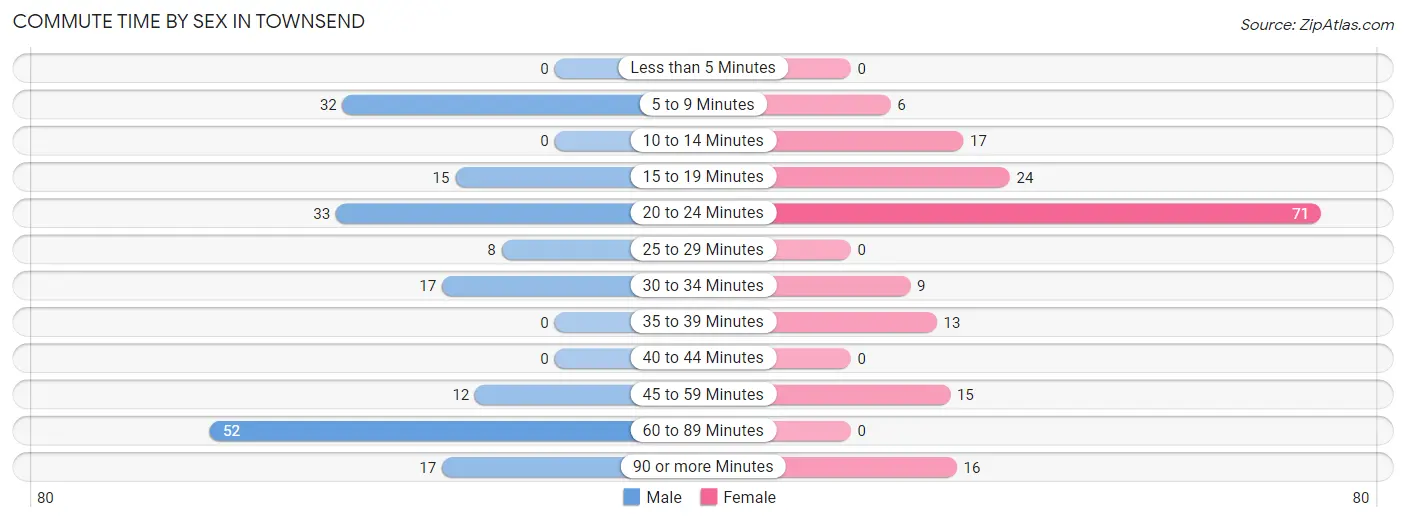
| Commute Time | Male | Female |
| Less than 5 Minutes | 0 (0.0%) | 0 (0.0%) |
| 5 to 9 Minutes | 32 (17.2%) | 6 (3.5%) |
| 10 to 14 Minutes | 0 (0.0%) | 17 (9.9%) |
| 15 to 19 Minutes | 15 (8.1%) | 24 (14.0%) |
| 20 to 24 Minutes | 33 (17.7%) | 71 (41.5%) |
| 25 to 29 Minutes | 8 (4.3%) | 0 (0.0%) |
| 30 to 34 Minutes | 17 (9.1%) | 9 (5.3%) |
| 35 to 39 Minutes | 0 (0.0%) | 13 (7.6%) |
| 40 to 44 Minutes | 0 (0.0%) | 0 (0.0%) |
| 45 to 59 Minutes | 12 (6.5%) | 15 (8.8%) |
| 60 to 89 Minutes | 52 (28.0%) | 0 (0.0%) |
| 90 or more Minutes | 17 (9.1%) | 16 (9.4%) |
Time of Departure to Work by Sex in Townsend
The most frequent times of departure to work in Townsend are 6:30 AM to 6:59 AM (46, 24.7%) for males and 12:00 PM to 3:59 PM (46, 26.9%) for females.
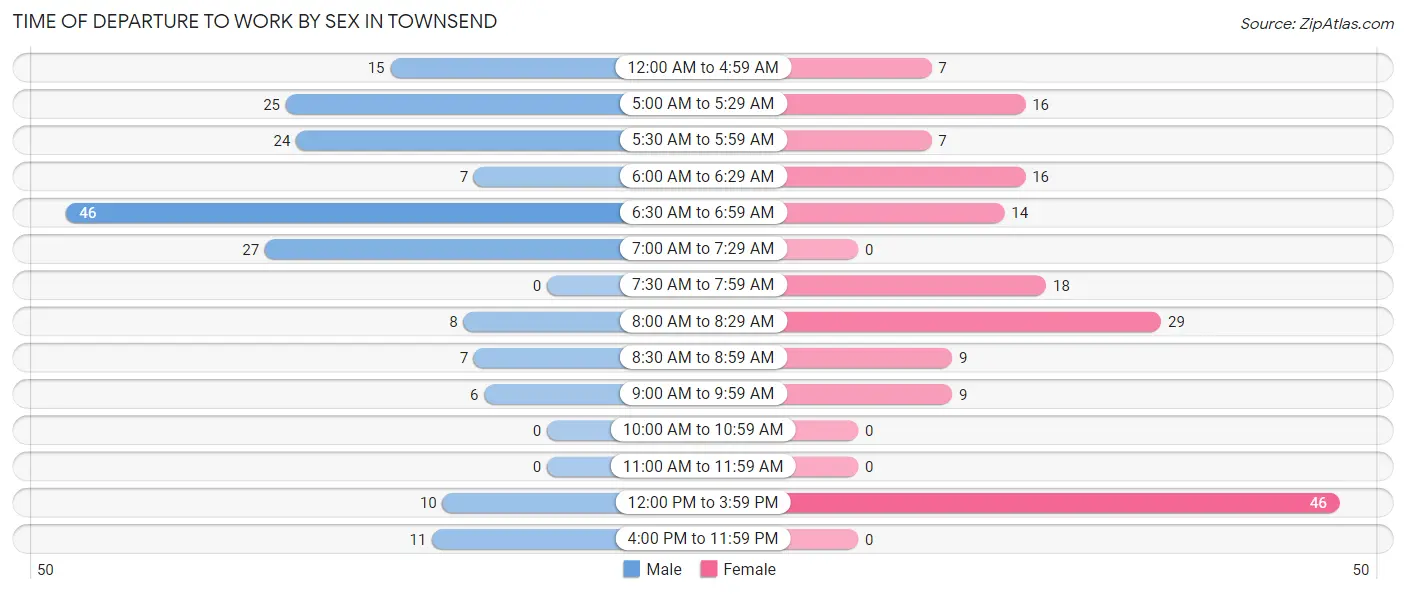
| Time of Departure | Male | Female |
| 12:00 AM to 4:59 AM | 15 (8.1%) | 7 (4.1%) |
| 5:00 AM to 5:29 AM | 25 (13.4%) | 16 (9.4%) |
| 5:30 AM to 5:59 AM | 24 (12.9%) | 7 (4.1%) |
| 6:00 AM to 6:29 AM | 7 (3.8%) | 16 (9.4%) |
| 6:30 AM to 6:59 AM | 46 (24.7%) | 14 (8.2%) |
| 7:00 AM to 7:29 AM | 27 (14.5%) | 0 (0.0%) |
| 7:30 AM to 7:59 AM | 0 (0.0%) | 18 (10.5%) |
| 8:00 AM to 8:29 AM | 8 (4.3%) | 29 (17.0%) |
| 8:30 AM to 8:59 AM | 7 (3.8%) | 9 (5.3%) |
| 9:00 AM to 9:59 AM | 6 (3.2%) | 9 (5.3%) |
| 10:00 AM to 10:59 AM | 0 (0.0%) | 0 (0.0%) |
| 11:00 AM to 11:59 AM | 0 (0.0%) | 0 (0.0%) |
| 12:00 PM to 3:59 PM | 10 (5.4%) | 46 (26.9%) |
| 4:00 PM to 11:59 PM | 11 (5.9%) | 0 (0.0%) |
| Total | 186 (100.0%) | 171 (100.0%) |
Housing Occupancy in Townsend
Occupancy by Ownership in Townsend
Of the total 487 dwellings in Townsend, owner-occupied units account for 254 (52.2%), while renter-occupied units make up 233 (47.8%).
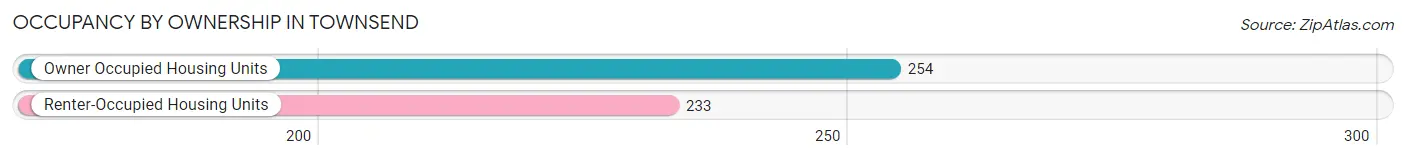
| Occupancy | # Housing Units | % Housing Units |
| Owner Occupied Housing Units | 254 | 52.2% |
| Renter-Occupied Housing Units | 233 | 47.8% |
| Total Occupied Housing Units | 487 | 100.0% |
Occupancy by Household Size in Townsend
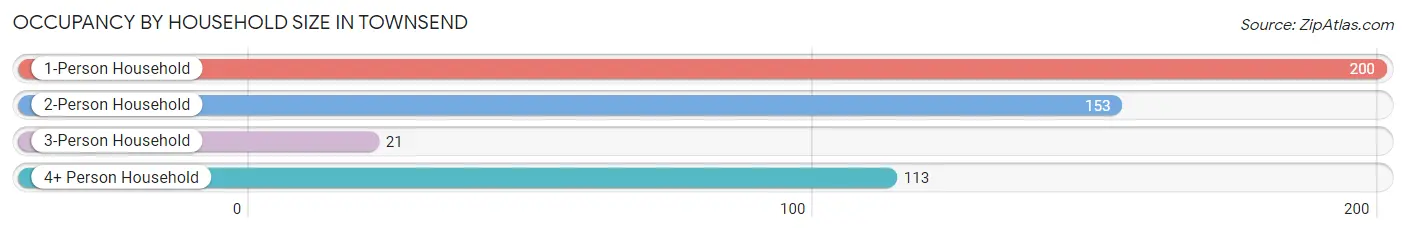
| Household Size | # Housing Units | % Housing Units |
| 1-Person Household | 200 | 41.1% |
| 2-Person Household | 153 | 31.4% |
| 3-Person Household | 21 | 4.3% |
| 4+ Person Household | 113 | 23.2% |
| Total Housing Units | 487 | 100.0% |
Occupancy by Ownership by Household Size in Townsend
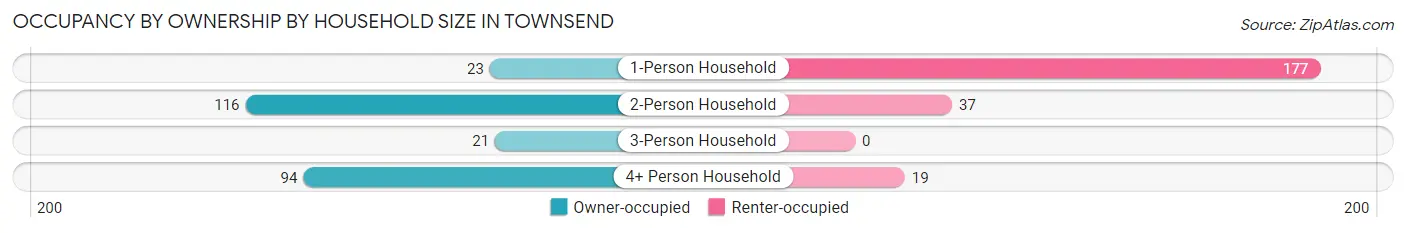
| Household Size | Owner-occupied | Renter-occupied |
| 1-Person Household | 23 (11.5%) | 177 (88.5%) |
| 2-Person Household | 116 (75.8%) | 37 (24.2%) |
| 3-Person Household | 21 (100.0%) | 0 (0.0%) |
| 4+ Person Household | 94 (83.2%) | 19 (16.8%) |
| Total Housing Units | 254 (52.2%) | 233 (47.8%) |
Occupancy by Educational Attainment in Townsend
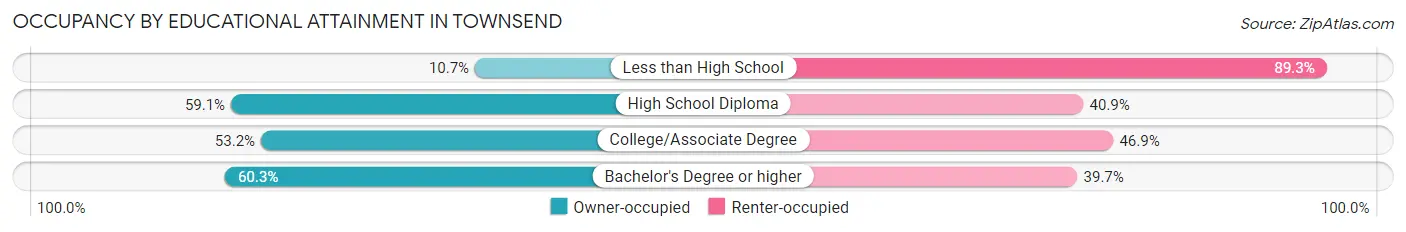
| Household Size | Owner-occupied | Renter-occupied |
| Less than High School | 6 (10.7%) | 50 (89.3%) |
| High School Diploma | 78 (59.1%) | 54 (40.9%) |
| College/Associate Degree | 76 (53.1%) | 67 (46.9%) |
| Bachelor's Degree or higher | 94 (60.3%) | 62 (39.7%) |
Occupancy by Age of Householder in Townsend
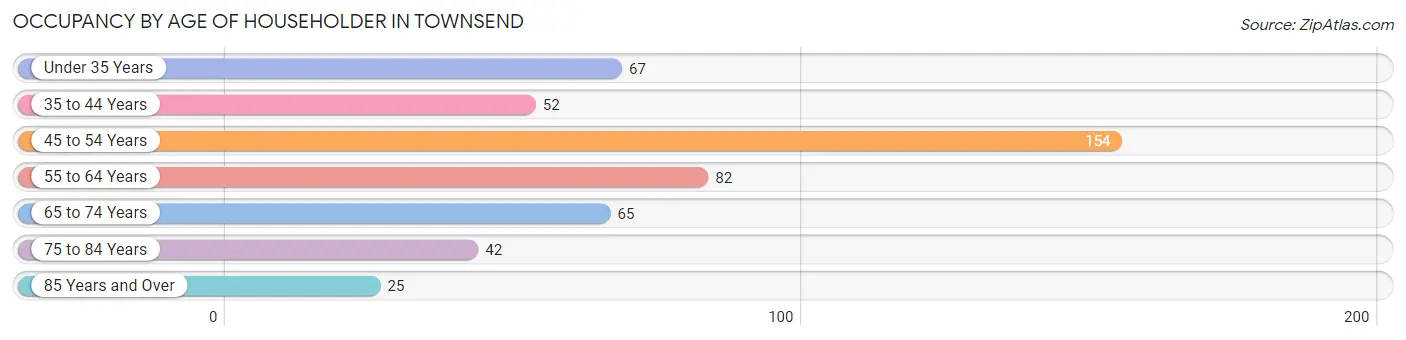
| Age Bracket | # Households | % Households |
| Under 35 Years | 67 | 13.8% |
| 35 to 44 Years | 52 | 10.7% |
| 45 to 54 Years | 154 | 31.6% |
| 55 to 64 Years | 82 | 16.8% |
| 65 to 74 Years | 65 | 13.4% |
| 75 to 84 Years | 42 | 8.6% |
| 85 Years and Over | 25 | 5.1% |
| Total | 487 | 100.0% |
Housing Finances in Townsend
Median Income by Occupancy in Townsend
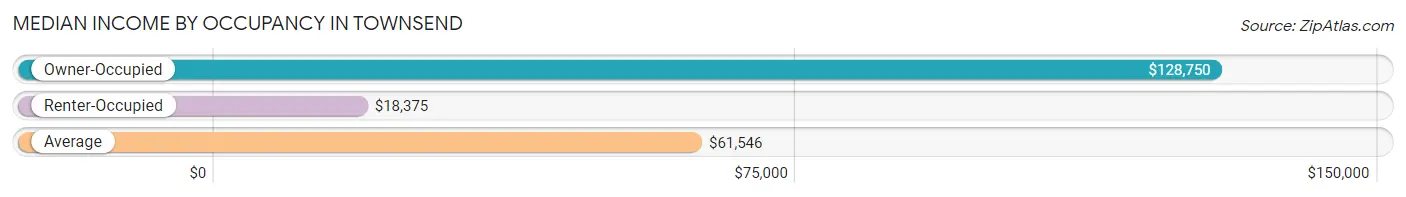
| Occupancy Type | # Households | Median Income |
| Owner-Occupied | 254 (52.2%) | $128,750 |
| Renter-Occupied | 233 (47.8%) | $18,375 |
| Average | 487 (100.0%) | $61,546 |
Occupancy by Householder Income Bracket in Townsend
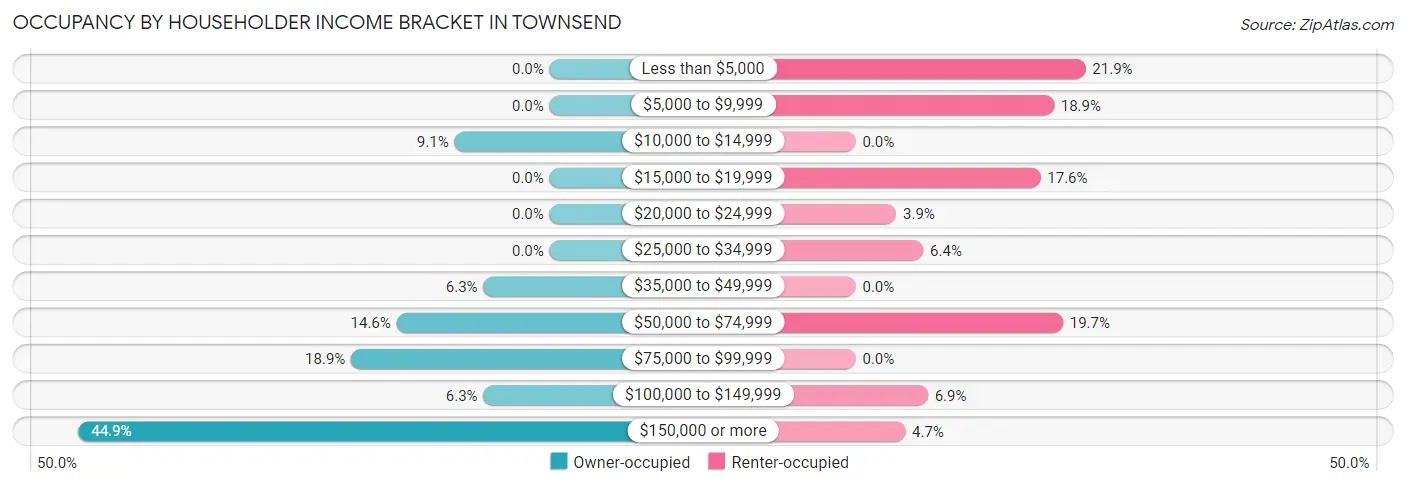
| Income Bracket | Owner-occupied | Renter-occupied |
| Less than $5,000 | 0 (0.0%) | 51 (21.9%) |
| $5,000 to $9,999 | 0 (0.0%) | 44 (18.9%) |
| $10,000 to $14,999 | 23 (9.1%) | 0 (0.0%) |
| $15,000 to $19,999 | 0 (0.0%) | 41 (17.6%) |
| $20,000 to $24,999 | 0 (0.0%) | 9 (3.9%) |
| $25,000 to $34,999 | 0 (0.0%) | 15 (6.4%) |
| $35,000 to $49,999 | 16 (6.3%) | 0 (0.0%) |
| $50,000 to $74,999 | 37 (14.6%) | 46 (19.7%) |
| $75,000 to $99,999 | 48 (18.9%) | 0 (0.0%) |
| $100,000 to $149,999 | 16 (6.3%) | 16 (6.9%) |
| $150,000 or more | 114 (44.9%) | 11 (4.7%) |
| Total | 254 (100.0%) | 233 (100.0%) |
Monthly Housing Cost Tiers in Townsend
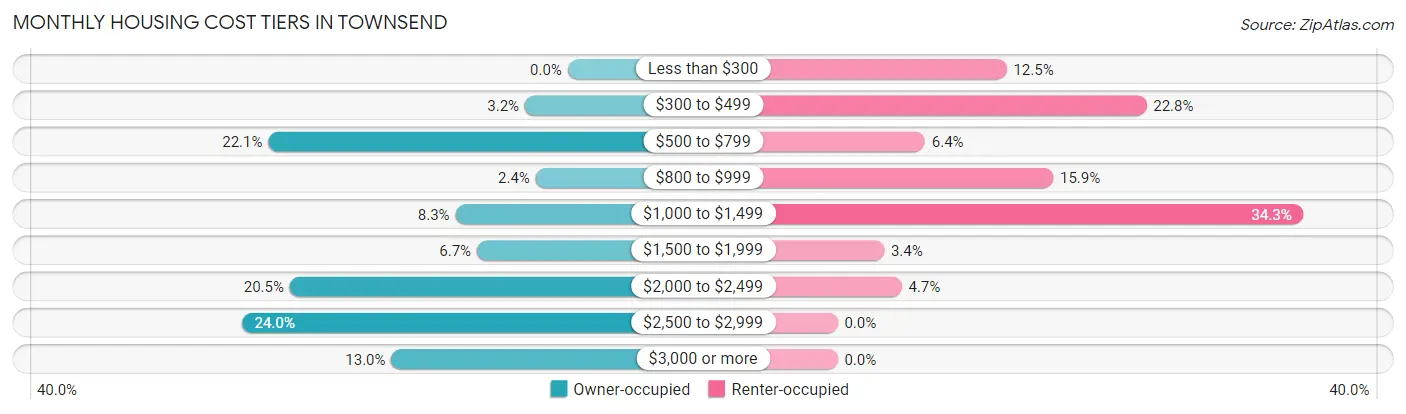
| Monthly Cost | Owner-occupied | Renter-occupied |
| Less than $300 | 0 (0.0%) | 29 (12.4%) |
| $300 to $499 | 8 (3.2%) | 53 (22.8%) |
| $500 to $799 | 56 (22.1%) | 15 (6.4%) |
| $800 to $999 | 6 (2.4%) | 37 (15.9%) |
| $1,000 to $1,499 | 21 (8.3%) | 80 (34.3%) |
| $1,500 to $1,999 | 17 (6.7%) | 8 (3.4%) |
| $2,000 to $2,499 | 52 (20.5%) | 11 (4.7%) |
| $2,500 to $2,999 | 61 (24.0%) | 0 (0.0%) |
| $3,000 or more | 33 (13.0%) | 0 (0.0%) |
| Total | 254 (100.0%) | 233 (100.0%) |
Physical Housing Characteristics in Townsend
Housing Structures in Townsend
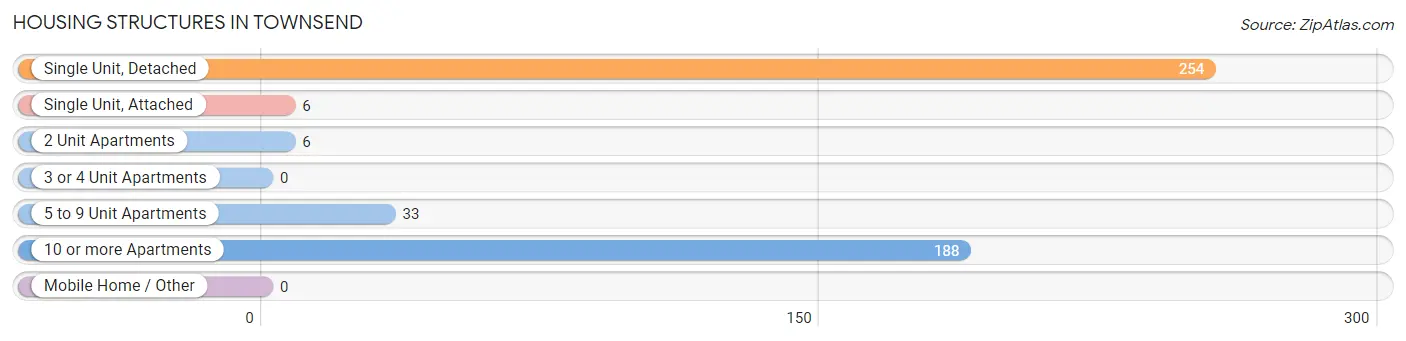
| Structure Type | # Housing Units | % Housing Units |
| Single Unit, Detached | 254 | 52.2% |
| Single Unit, Attached | 6 | 1.2% |
| 2 Unit Apartments | 6 | 1.2% |
| 3 or 4 Unit Apartments | 0 | 0.0% |
| 5 to 9 Unit Apartments | 33 | 6.8% |
| 10 or more Apartments | 188 | 38.6% |
| Mobile Home / Other | 0 | 0.0% |
| Total | 487 | 100.0% |
Housing Structures by Occupancy in Townsend
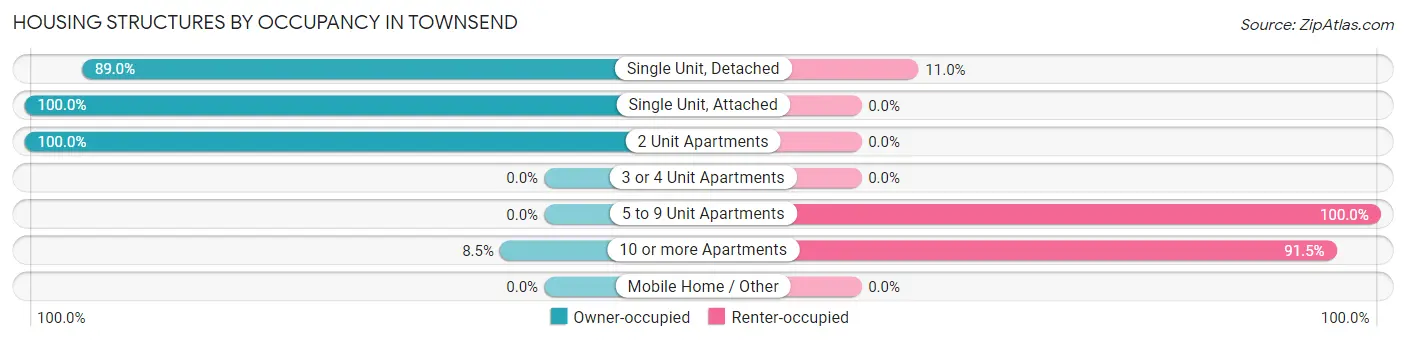
| Structure Type | Owner-occupied | Renter-occupied |
| Single Unit, Detached | 226 (89.0%) | 28 (11.0%) |
| Single Unit, Attached | 6 (100.0%) | 0 (0.0%) |
| 2 Unit Apartments | 6 (100.0%) | 0 (0.0%) |
| 3 or 4 Unit Apartments | 0 (0.0%) | 0 (0.0%) |
| 5 to 9 Unit Apartments | 0 (0.0%) | 33 (100.0%) |
| 10 or more Apartments | 16 (8.5%) | 172 (91.5%) |
| Mobile Home / Other | 0 (0.0%) | 0 (0.0%) |
| Total | 254 (52.2%) | 233 (47.8%) |
Housing Structures by Number of Rooms in Townsend
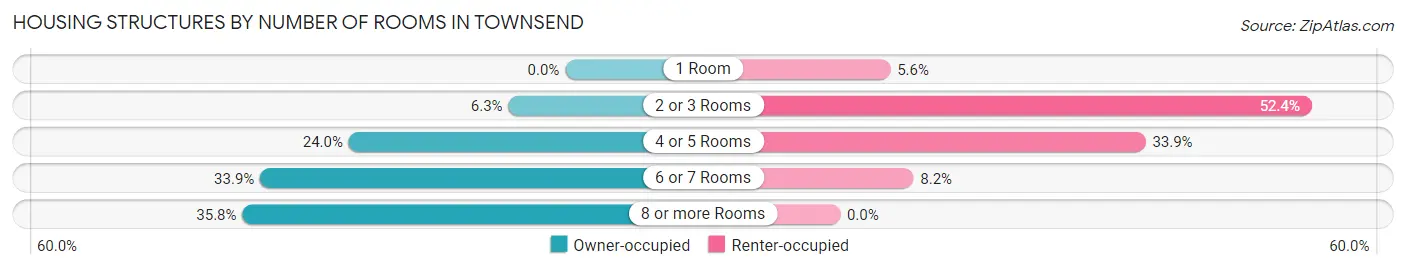
| Number of Rooms | Owner-occupied | Renter-occupied |
| 1 Room | 0 (0.0%) | 13 (5.6%) |
| 2 or 3 Rooms | 16 (6.3%) | 122 (52.4%) |
| 4 or 5 Rooms | 61 (24.0%) | 79 (33.9%) |
| 6 or 7 Rooms | 86 (33.9%) | 19 (8.2%) |
| 8 or more Rooms | 91 (35.8%) | 0 (0.0%) |
| Total | 254 (100.0%) | 233 (100.0%) |
Housing Structure by Heating Type in Townsend
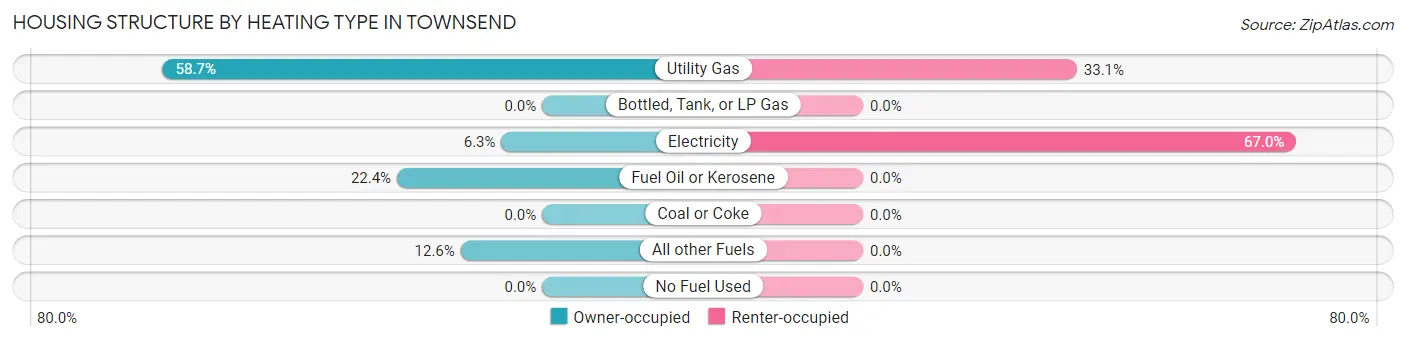
| Heating Type | Owner-occupied | Renter-occupied |
| Utility Gas | 149 (58.7%) | 77 (33.1%) |
| Bottled, Tank, or LP Gas | 0 (0.0%) | 0 (0.0%) |
| Electricity | 16 (6.3%) | 156 (66.9%) |
| Fuel Oil or Kerosene | 57 (22.4%) | 0 (0.0%) |
| Coal or Coke | 0 (0.0%) | 0 (0.0%) |
| All other Fuels | 32 (12.6%) | 0 (0.0%) |
| No Fuel Used | 0 (0.0%) | 0 (0.0%) |
| Total | 254 (100.0%) | 233 (100.0%) |
Household Vehicle Usage in Townsend
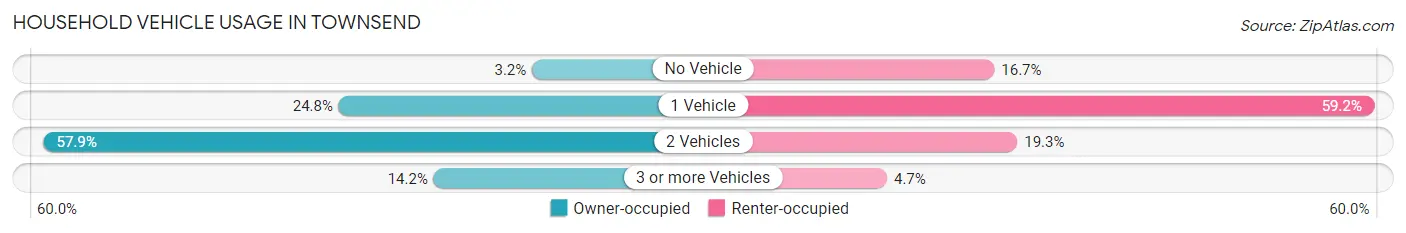
| Vehicles per Household | Owner-occupied | Renter-occupied |
| No Vehicle | 8 (3.2%) | 39 (16.7%) |
| 1 Vehicle | 63 (24.8%) | 138 (59.2%) |
| 2 Vehicles | 147 (57.9%) | 45 (19.3%) |
| 3 or more Vehicles | 36 (14.2%) | 11 (4.7%) |
| Total | 254 (100.0%) | 233 (100.0%) |
Real Estate & Mortgages in Townsend
Real Estate and Mortgage Overview in Townsend
| Characteristic | Without Mortgage | With Mortgage |
| Housing Units | 85 | 169 |
| Median Property Value | $263,100 | $414,400 |
| Median Household Income | $78,375 | $99 |
| Monthly Housing Costs | $650 | $33 |
| Real Estate Taxes | - | - |
Property Value by Mortgage Status in Townsend
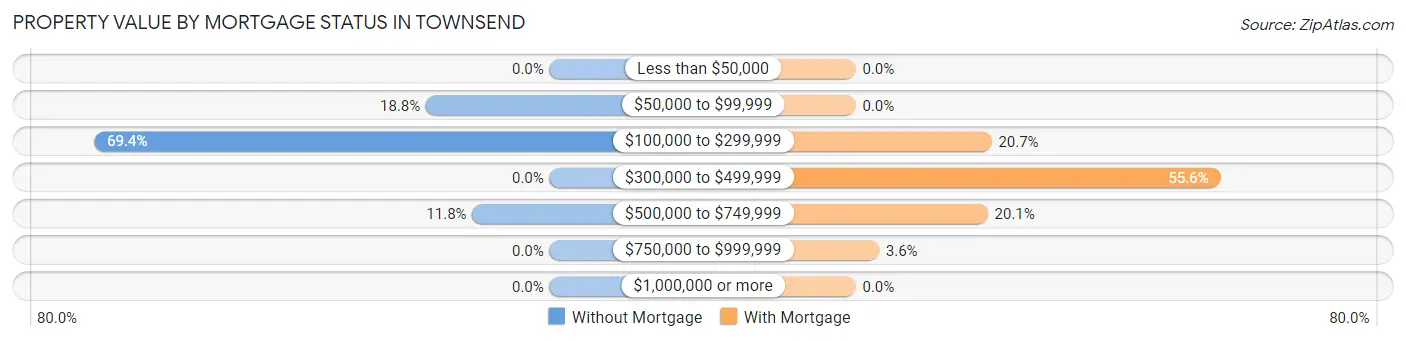
| Property Value | Without Mortgage | With Mortgage |
| Less than $50,000 | 0 (0.0%) | 0 (0.0%) |
| $50,000 to $99,999 | 16 (18.8%) | 0 (0.0%) |
| $100,000 to $299,999 | 59 (69.4%) | 35 (20.7%) |
| $300,000 to $499,999 | 0 (0.0%) | 94 (55.6%) |
| $500,000 to $749,999 | 10 (11.8%) | 34 (20.1%) |
| $750,000 to $999,999 | 0 (0.0%) | 6 (3.5%) |
| $1,000,000 or more | 0 (0.0%) | 0 (0.0%) |
| Total | 85 (100.0%) | 169 (100.0%) |
Household Income by Mortgage Status in Townsend
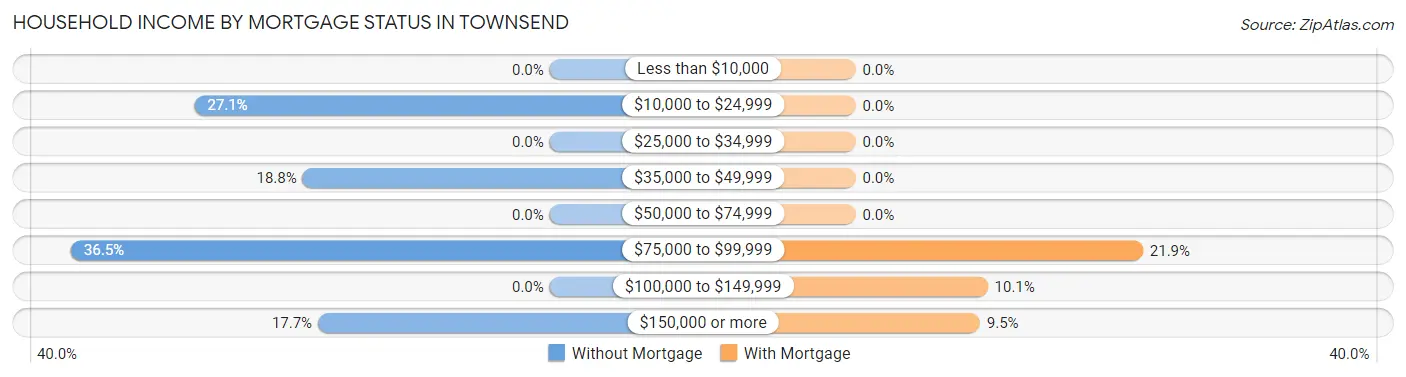
| Household Income | Without Mortgage | With Mortgage |
| Less than $10,000 | 0 (0.0%) | 0 (0.0%) |
| $10,000 to $24,999 | 23 (27.1%) | 0 (0.0%) |
| $25,000 to $34,999 | 0 (0.0%) | 0 (0.0%) |
| $35,000 to $49,999 | 16 (18.8%) | 0 (0.0%) |
| $50,000 to $74,999 | 0 (0.0%) | 0 (0.0%) |
| $75,000 to $99,999 | 31 (36.5%) | 37 (21.9%) |
| $100,000 to $149,999 | 0 (0.0%) | 17 (10.1%) |
| $150,000 or more | 15 (17.6%) | 16 (9.5%) |
| Total | 85 (100.0%) | 169 (100.0%) |
Property Value to Household Income Ratio in Townsend
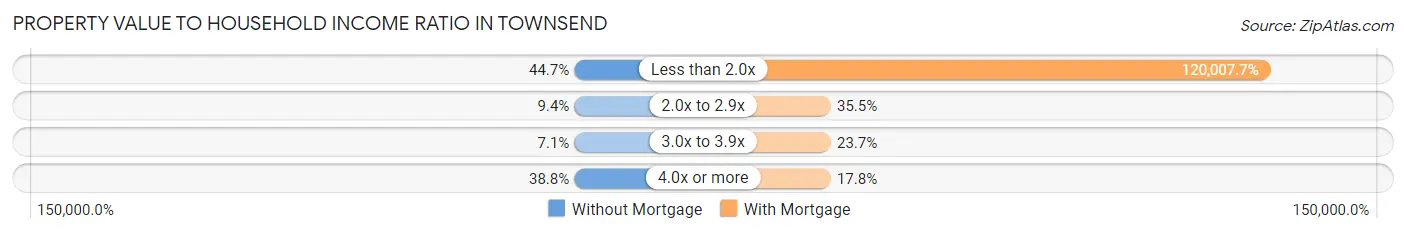
| Value-to-Income Ratio | Without Mortgage | With Mortgage |
| Less than 2.0x | 38 (44.7%) | 202,813 (120,007.7%) |
| 2.0x to 2.9x | 8 (9.4%) | 60 (35.5%) |
| 3.0x to 3.9x | 6 (7.1%) | 40 (23.7%) |
| 4.0x or more | 33 (38.8%) | 30 (17.7%) |
| Total | 85 (100.0%) | 169 (100.0%) |
Real Estate Taxes by Mortgage Status in Townsend
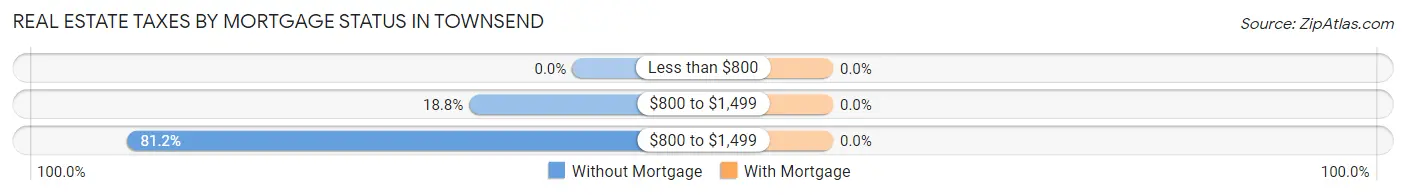
| Property Taxes | Without Mortgage | With Mortgage |
| Less than $800 | 0 (0.0%) | 0 (0.0%) |
| $800 to $1,499 | 16 (18.8%) | 0 (0.0%) |
| $800 to $1,499 | 69 (81.2%) | 0 (0.0%) |
| Total | 85 (100.0%) | 169 (100.0%) |
Health & Disability in Townsend
Health Insurance Coverage by Age in Townsend
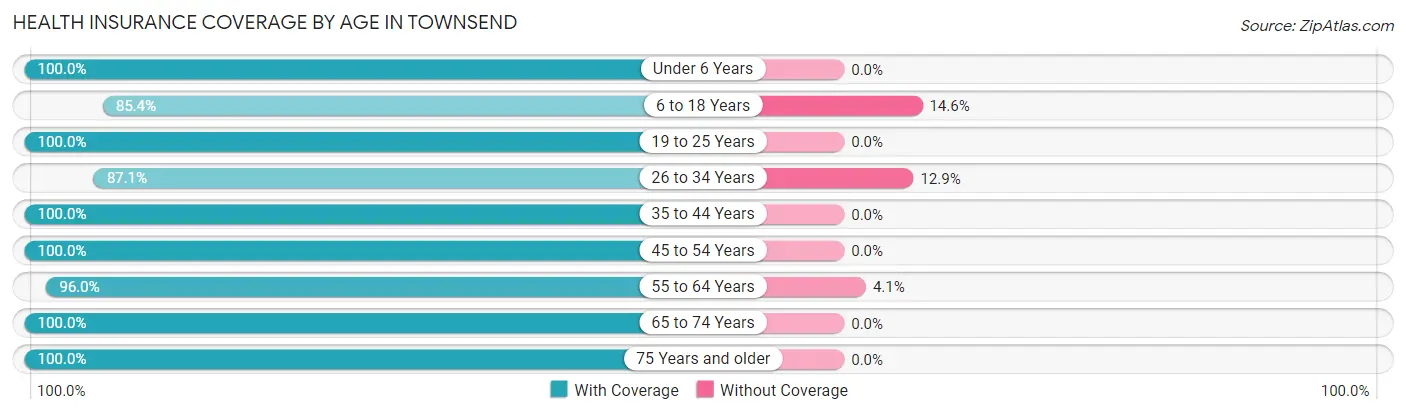
| Age Bracket | With Coverage | Without Coverage |
| Under 6 Years | 92 (100.0%) | 0 (0.0%) |
| 6 to 18 Years | 205 (85.4%) | 35 (14.6%) |
| 19 to 25 Years | 17 (100.0%) | 0 (0.0%) |
| 26 to 34 Years | 108 (87.1%) | 16 (12.9%) |
| 35 to 44 Years | 123 (100.0%) | 0 (0.0%) |
| 45 to 54 Years | 218 (100.0%) | 0 (0.0%) |
| 55 to 64 Years | 142 (96.0%) | 6 (4.1%) |
| 65 to 74 Years | 79 (100.0%) | 0 (0.0%) |
| 75 Years and older | 90 (100.0%) | 0 (0.0%) |
| Total | 1,074 (95.0%) | 57 (5.0%) |
Health Insurance Coverage by Citizenship Status in Townsend
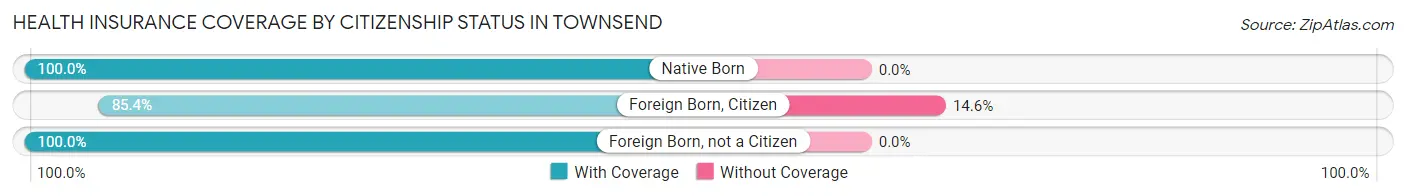
| Citizenship Status | With Coverage | Without Coverage |
| Native Born | 92 (100.0%) | 0 (0.0%) |
| Foreign Born, Citizen | 205 (85.4%) | 35 (14.6%) |
| Foreign Born, not a Citizen | 17 (100.0%) | 0 (0.0%) |
Health Insurance Coverage by Household Income in Townsend
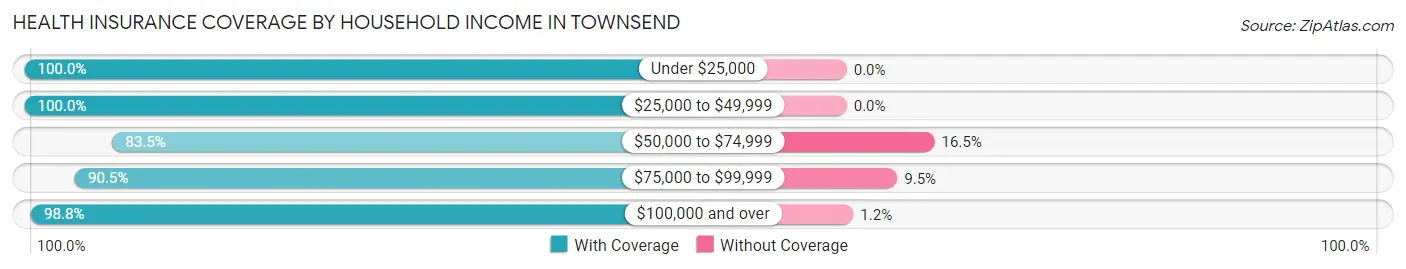
| Household Income | With Coverage | Without Coverage |
| Under $25,000 | 168 (100.0%) | 0 (0.0%) |
| $25,000 to $49,999 | 56 (100.0%) | 0 (0.0%) |
| $50,000 to $74,999 | 203 (83.5%) | 40 (16.5%) |
| $75,000 to $99,999 | 86 (90.5%) | 9 (9.5%) |
| $100,000 and over | 557 (98.8%) | 7 (1.2%) |
Public vs Private Health Insurance Coverage by Age in Townsend
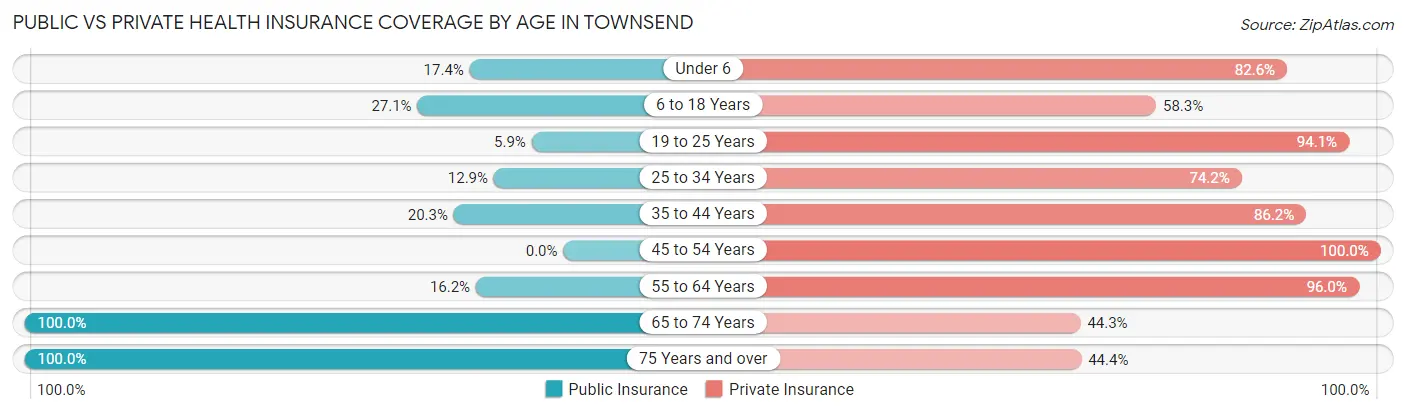
| Age Bracket | Public Insurance | Private Insurance |
| Under 6 | 16 (17.4%) | 76 (82.6%) |
| 6 to 18 Years | 65 (27.1%) | 140 (58.3%) |
| 19 to 25 Years | 1 (5.9%) | 16 (94.1%) |
| 25 to 34 Years | 16 (12.9%) | 92 (74.2%) |
| 35 to 44 Years | 25 (20.3%) | 106 (86.2%) |
| 45 to 54 Years | 0 (0.0%) | 218 (100.0%) |
| 55 to 64 Years | 24 (16.2%) | 142 (96.0%) |
| 65 to 74 Years | 79 (100.0%) | 35 (44.3%) |
| 75 Years and over | 90 (100.0%) | 40 (44.4%) |
| Total | 316 (27.9%) | 865 (76.5%) |
Disability Status by Sex by Age in Townsend
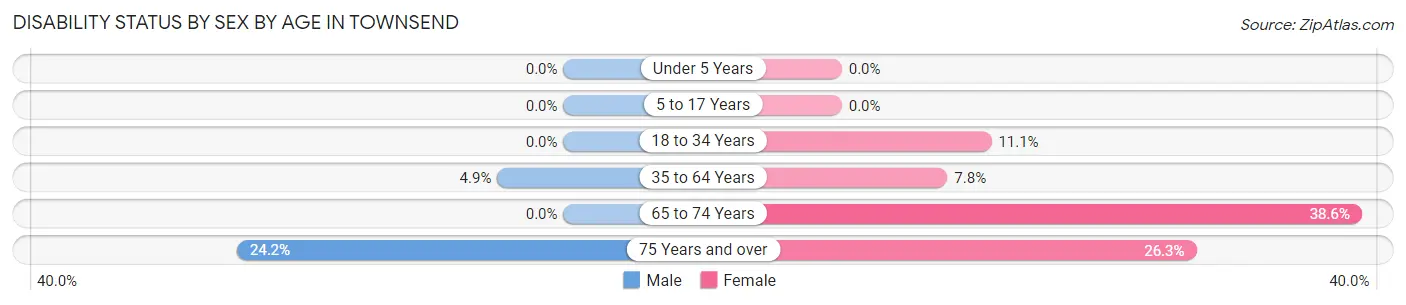
| Age Bracket | Male | Female |
| Under 5 Years | 0 (0.0%) | 0 (0.0%) |
| 5 to 17 Years | 0 (0.0%) | 0 (0.0%) |
| 18 to 34 Years | 0 (0.0%) | 13 (11.1%) |
| 35 to 64 Years | 14 (4.9%) | 16 (7.8%) |
| 65 to 74 Years | 0 (0.0%) | 22 (38.6%) |
| 75 Years and over | 8 (24.2%) | 15 (26.3%) |
Disability Class by Sex by Age in Townsend
Disability Class: Hearing Difficulty
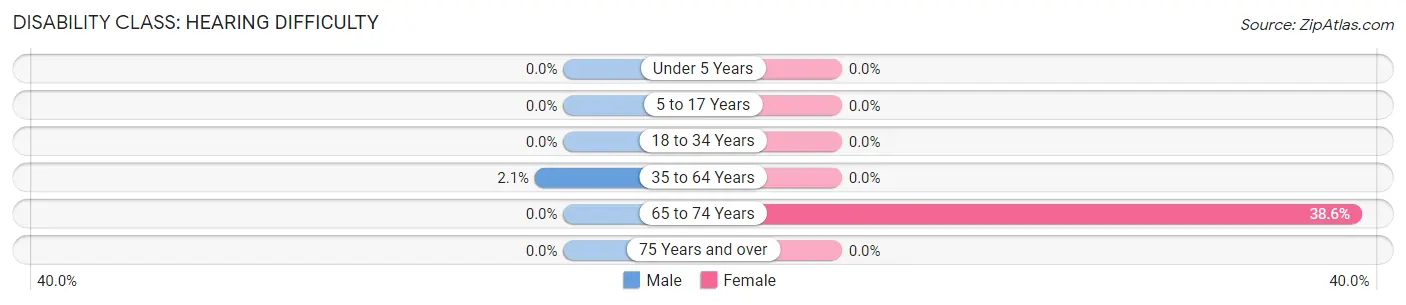
| Age Bracket | Male | Female |
| Under 5 Years | 0 (0.0%) | 0 (0.0%) |
| 5 to 17 Years | 0 (0.0%) | 0 (0.0%) |
| 18 to 34 Years | 0 (0.0%) | 0 (0.0%) |
| 35 to 64 Years | 6 (2.1%) | 0 (0.0%) |
| 65 to 74 Years | 0 (0.0%) | 22 (38.6%) |
| 75 Years and over | 0 (0.0%) | 0 (0.0%) |
Disability Class: Vision Difficulty
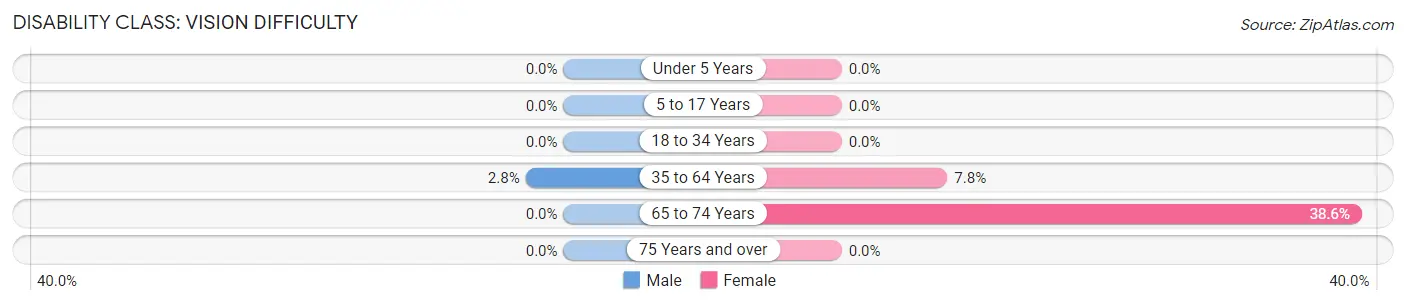
| Age Bracket | Male | Female |
| Under 5 Years | 0 (0.0%) | 0 (0.0%) |
| 5 to 17 Years | 0 (0.0%) | 0 (0.0%) |
| 18 to 34 Years | 0 (0.0%) | 0 (0.0%) |
| 35 to 64 Years | 8 (2.8%) | 16 (7.8%) |
| 65 to 74 Years | 0 (0.0%) | 22 (38.6%) |
| 75 Years and over | 0 (0.0%) | 0 (0.0%) |
Disability Class: Cognitive Difficulty
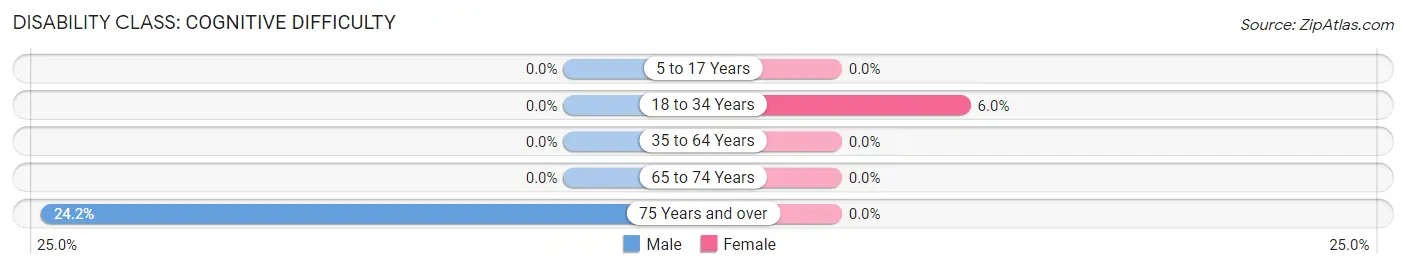
| Age Bracket | Male | Female |
| 5 to 17 Years | 0 (0.0%) | 0 (0.0%) |
| 18 to 34 Years | 0 (0.0%) | 7 (6.0%) |
| 35 to 64 Years | 0 (0.0%) | 0 (0.0%) |
| 65 to 74 Years | 0 (0.0%) | 0 (0.0%) |
| 75 Years and over | 8 (24.2%) | 0 (0.0%) |
Disability Class: Ambulatory Difficulty
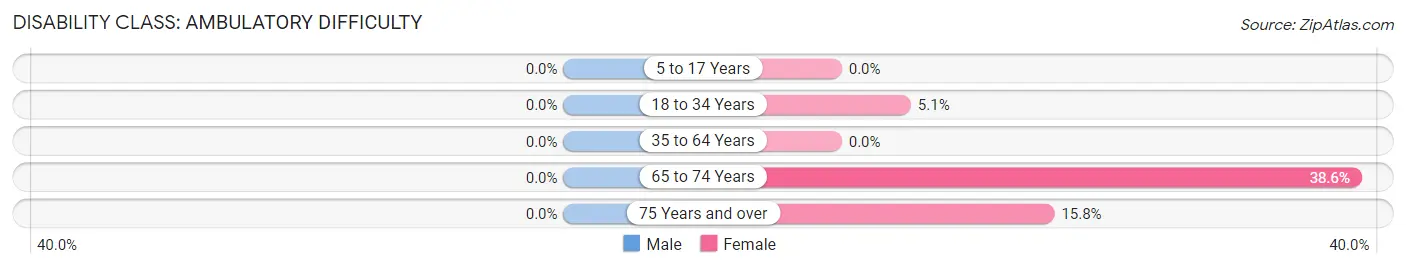
| Age Bracket | Male | Female |
| 5 to 17 Years | 0 (0.0%) | 0 (0.0%) |
| 18 to 34 Years | 0 (0.0%) | 6 (5.1%) |
| 35 to 64 Years | 0 (0.0%) | 0 (0.0%) |
| 65 to 74 Years | 0 (0.0%) | 22 (38.6%) |
| 75 Years and over | 0 (0.0%) | 9 (15.8%) |
Disability Class: Self-Care Difficulty
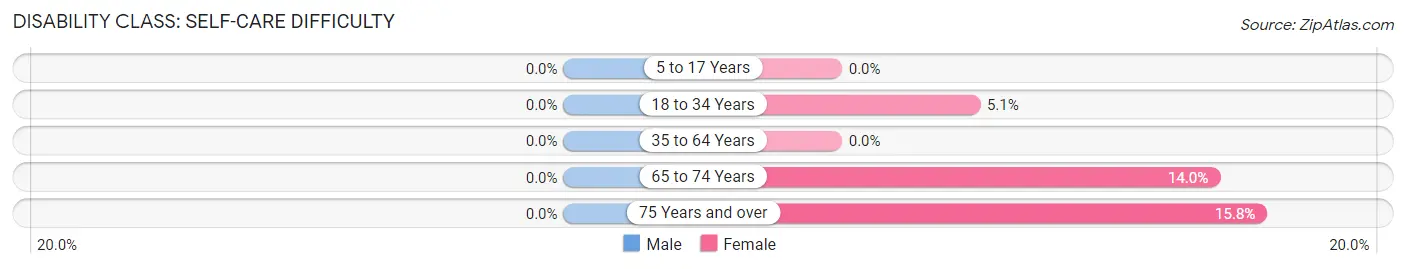
| Age Bracket | Male | Female |
| 5 to 17 Years | 0 (0.0%) | 0 (0.0%) |
| 18 to 34 Years | 0 (0.0%) | 6 (5.1%) |
| 35 to 64 Years | 0 (0.0%) | 0 (0.0%) |
| 65 to 74 Years | 0 (0.0%) | 8 (14.0%) |
| 75 Years and over | 0 (0.0%) | 9 (15.8%) |
Technology Access in Townsend
Computing Device Access in Townsend
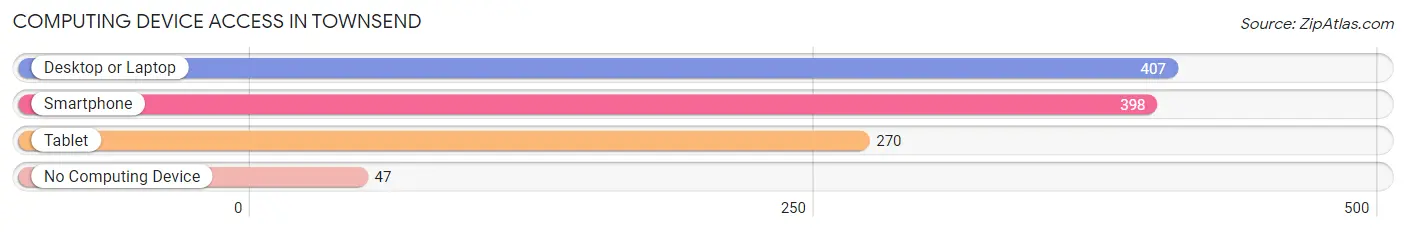
| Device Type | # Households | % Households |
| Desktop or Laptop | 407 | 83.6% |
| Smartphone | 398 | 81.7% |
| Tablet | 270 | 55.4% |
| No Computing Device | 47 | 9.7% |
| Total | 487 | 100.0% |
Internet Access in Townsend
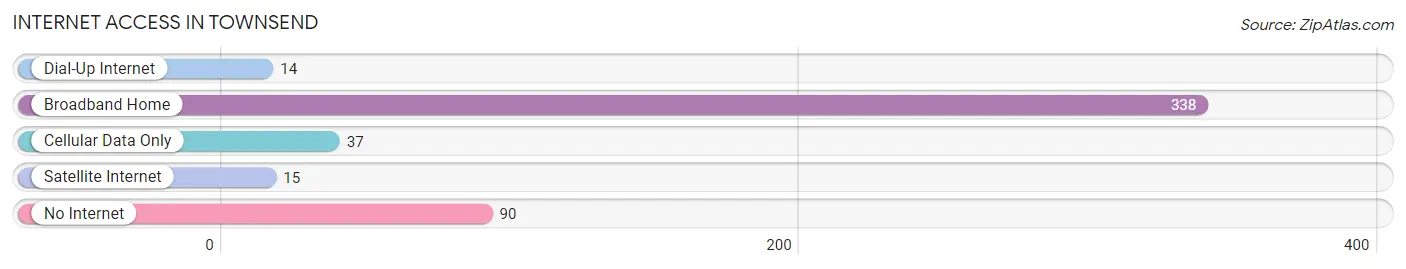
| Internet Type | # Households | % Households |
| Dial-Up Internet | 14 | 2.9% |
| Broadband Home | 338 | 69.4% |
| Cellular Data Only | 37 | 7.6% |
| Satellite Internet | 15 | 3.1% |
| No Internet | 90 | 18.5% |
| Total | 487 | 100.0% |
Townsend Summary
Townsend, Massachusetts is a small town located in Middlesex County, approximately 25 miles northwest of Boston. It is bordered by the towns of Ashby, Groton, Pepperell, and Shirley. The town was first settled in 1676 and was officially incorporated in 1732. As of the 2010 census, the population of Townsend was 6,177.
History
The area that is now Townsend was originally inhabited by the Nashaway tribe of Native Americans. The first European settlers arrived in the area in 1676 and the town was officially incorporated in 1732. The town was named after Charles Townsend, who was the Speaker of the House of Commons in England.
In the late 1700s, Townsend was a thriving agricultural community. The town was known for its production of apples, pears, and other fruits. In the early 1800s, Townsend began to develop a manufacturing industry, with several mills being built along the Squannacook River. The town also had a thriving shoe industry, with several factories producing shoes for the local market.
In the late 1800s, Townsend began to develop a tourism industry, with several hotels and resorts being built in the area. The town also had a thriving dairy industry, with several farms producing milk and other dairy products.
Geography
Townsend is located in Middlesex County, approximately 25 miles northwest of Boston. The town is bordered by the towns of Ashby, Groton, Pepperell, and Shirley. The town has a total area of 24.3 square miles, of which 24.2 square miles is land and 0.1 square miles is water.
The town is located in the Nashua River Valley, with the Squannacook River running through the center of town. The town is mostly rural, with several small villages and hamlets scattered throughout the area. The highest point in town is located at the summit of Bald Hill, which has an elevation of 845 feet.
Economy
The economy of Townsend is largely based on agriculture and tourism. The town is home to several farms, which produce a variety of fruits and vegetables. The town also has several small businesses, including restaurants, retail stores, and service providers.
The town is also home to several resorts and hotels, which attract tourists from all over the region. The town also has several golf courses, which attract golfers from all over the region.
Demographics
As of the 2010 census, the population of Townsend was 6,177. The racial makeup of the town was 94.3% White, 1.2% African American, 0.3% Native American, 1.2% Asian, 0.1% Pacific Islander, 1.2% from other races, and 1.9% from two or more races. Hispanic or Latino of any race were 3.2% of the population.
The median income for a household in the town was $76,944, and the median income for a family was $86,944. The per capita income for the town was $31,944. About 4.2% of families and 5.3% of the population were below the poverty line, including 6.2% of those under age 18 and 4.2% of those age 65 or over.
Common Questions
What is Per Capita Income in Townsend?
Per Capita income in Townsend is $43,406.
What is the Median Family Income in Townsend?
Median Family Income in Townsend is $137,813.
What is the Median Household income in Townsend?
Median Household Income in Townsend is $61,546.
What is Income or Wage Gap in Townsend?
Income or Wage Gap in Townsend is 47.3%.
Women in Townsend earn 52.7 cents for every dollar earned by a man.
What is Inequality or Gini Index in Townsend?
Inequality or Gini Index in Townsend is 0.55.
What is the Total Population of Townsend?
Total Population of Townsend is 1,131.
What is the Total Male Population of Townsend?
Total Male Population of Townsend is 550.
What is the Total Female Population of Townsend?
Total Female Population of Townsend is 581.
What is the Ratio of Males per 100 Females in Townsend?
There are 94.66 Males per 100 Females in Townsend.
What is the Ratio of Females per 100 Males in Townsend?
There are 105.64 Females per 100 Males in Townsend.
What is the Median Population Age in Townsend?
Median Population Age in Townsend is 40.8 Years.
What is the Average Family Size in Townsend
Average Family Size in Townsend is 3.3 People.
What is the Average Household Size in Townsend
Average Household Size in Townsend is 2.3 People.
How Large is the Labor Force in Townsend?
There are 553 People in the Labor Forcein in Townsend.
What is the Percentage of People in the Labor Force in Townsend?
64.8% of People are in the Labor Force in Townsend.
What is the Unemployment Rate in Townsend?
Unemployment Rate in Townsend is 3.3%.