Smith Mills, MA Map & Demographics
Smith Mills Map
Smith Mills Overview
$38,277
PER CAPITA INCOME
$94,713
AVG FAMILY INCOME
$73,393
AVG HOUSEHOLD INCOME
32.9%
WAGE / INCOME GAP [ % ]
67.1¢/ $1
WAGE / INCOME GAP [ $ ]
0.42
INEQUALITY / GINI INDEX
4,556
TOTAL POPULATION
2,113
MALE POPULATION
2,443
FEMALE POPULATION
86.49
MALES / 100 FEMALES
115.62
FEMALES / 100 MALES
42.8
MEDIAN AGE
2.7
AVG FAMILY SIZE
2.3
AVG HOUSEHOLD SIZE
2,626
LABOR FORCE [ PEOPLE ]
69.3%
PERCENT IN LABOR FORCE
2.4%
UNEMPLOYMENT RATE
Income in Smith Mills
Income Overview in Smith Mills
Per Capita Income in Smith Mills is $38,277, while median incomes of families and households are $94,713 and $73,393 respectively.
| Characteristic | Number | Measure |
| Per Capita Income | 4,556 | $38,277 |
| Median Family Income | 1,413 | $94,713 |
| Mean Family Income | 1,413 | $99,203 |
| Median Household Income | 1,984 | $73,393 |
| Mean Household Income | 1,984 | $84,720 |
| Income Deficit | 1,413 | $0 |
| Wage / Income Gap (%) | 4,556 | 32.90% |
| Wage / Income Gap ($) | 4,556 | 67.10¢ per $1 |
| Gini / Inequality Index | 4,556 | 0.42 |
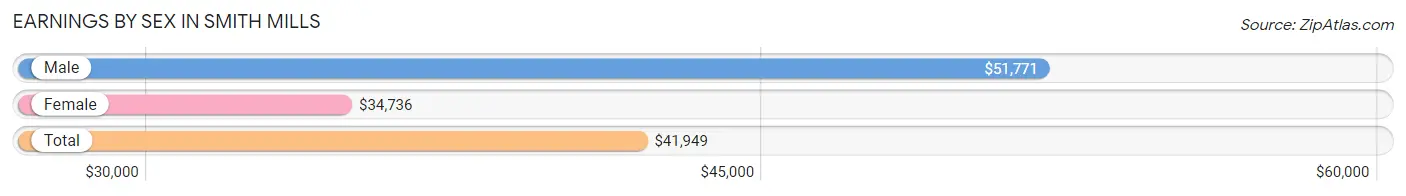
Earnings by Sex in Smith Mills
Average Earnings in Smith Mills are $41,949, $51,771 for men and $34,736 for women, a difference of 32.9%.
| Sex | Number | Average Earnings |
| Male | 1,396 (51.9%) | $51,771 |
| Female | 1,294 (48.1%) | $34,736 |
| Total | 2,690 (100.0%) | $41,949 |
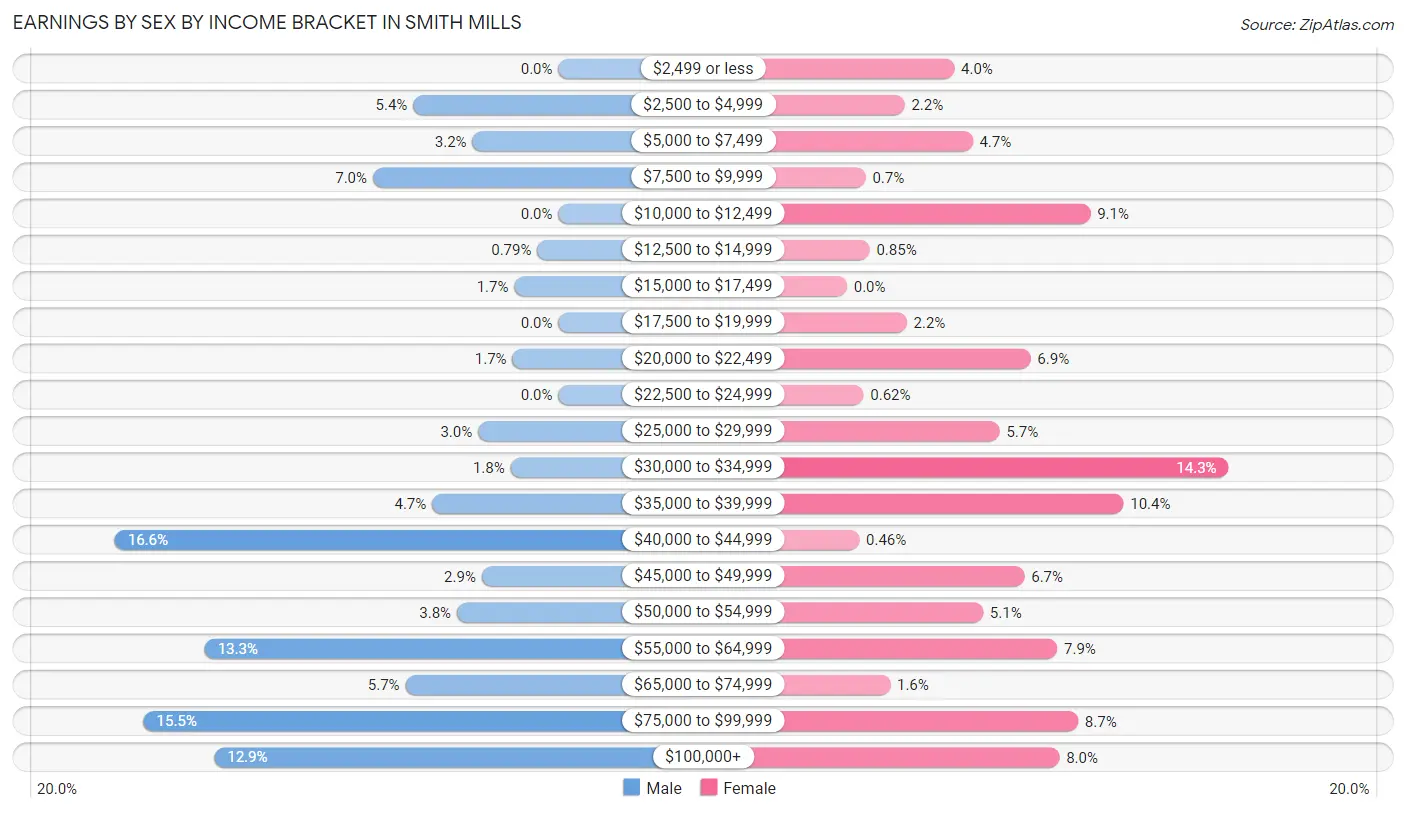
Earnings by Sex by Income Bracket in Smith Mills
The most common earnings brackets in Smith Mills are $40,000 to $44,999 for men (232 | 16.6%) and $30,000 to $34,999 for women (185 | 14.3%).
| Income | Male | Female |
| $2,499 or less | 0 (0.0%) | 52 (4.0%) |
| $2,500 to $4,999 | 76 (5.4%) | 28 (2.2%) |
| $5,000 to $7,499 | 45 (3.2%) | 61 (4.7%) |
| $7,500 to $9,999 | 97 (7.0%) | 9 (0.7%) |
| $10,000 to $12,499 | 0 (0.0%) | 118 (9.1%) |
| $12,500 to $14,999 | 11 (0.8%) | 11 (0.9%) |
| $15,000 to $17,499 | 23 (1.7%) | 0 (0.0%) |
| $17,500 to $19,999 | 0 (0.0%) | 29 (2.2%) |
| $20,000 to $22,499 | 24 (1.7%) | 89 (6.9%) |
| $22,500 to $24,999 | 0 (0.0%) | 8 (0.6%) |
| $25,000 to $29,999 | 42 (3.0%) | 74 (5.7%) |
| $30,000 to $34,999 | 25 (1.8%) | 185 (14.3%) |
| $35,000 to $39,999 | 66 (4.7%) | 134 (10.4%) |
| $40,000 to $44,999 | 232 (16.6%) | 6 (0.5%) |
| $45,000 to $49,999 | 40 (2.9%) | 86 (6.7%) |
| $50,000 to $54,999 | 53 (3.8%) | 66 (5.1%) |
| $55,000 to $64,999 | 185 (13.3%) | 102 (7.9%) |
| $65,000 to $74,999 | 80 (5.7%) | 21 (1.6%) |
| $75,000 to $99,999 | 217 (15.5%) | 112 (8.7%) |
| $100,000+ | 180 (12.9%) | 103 (8.0%) |
| Total | 1,396 (100.0%) | 1,294 (100.0%) |
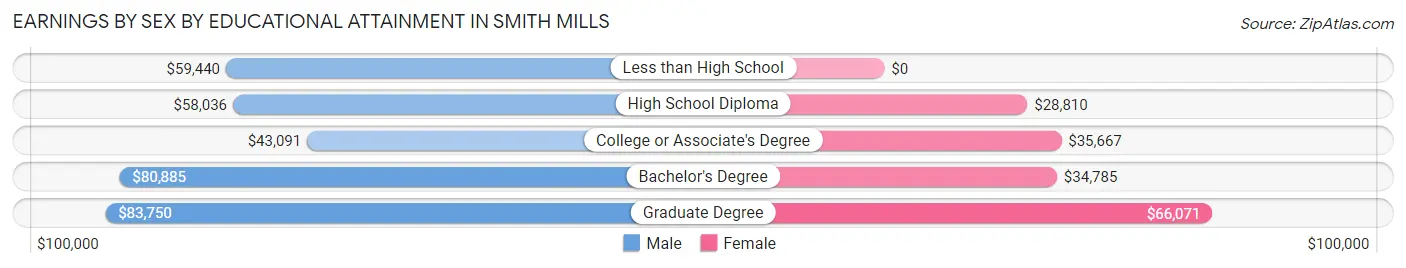
Earnings by Sex by Educational Attainment in Smith Mills
Average earnings in Smith Mills are $59,784 for men and $37,536 for women, a difference of 37.2%. Men with an educational attainment of graduate degree enjoy the highest average annual earnings of $83,750, while those with college or associate's degree education earn the least with $43,091. Women with an educational attainment of graduate degree earn the most with the average annual earnings of $66,071, while those with high school diploma education have the smallest earnings of $28,810.
| Educational Attainment | Male Income | Female Income |
| Less than High School | $59,440 | $0 |
| High School Diploma | $58,036 | $28,810 |
| College or Associate's Degree | $43,091 | $35,667 |
| Bachelor's Degree | $80,885 | $34,785 |
| Graduate Degree | $83,750 | $66,071 |
| Total | $59,784 | $37,536 |
Family Income in Smith Mills
Family Income Brackets in Smith Mills
According to the Smith Mills family income data, there are 319 families falling into the $100,000 to $149,999 income range, which is the most common income bracket and makes up 22.6% of all families. Conversely, the $10,000 to $14,999 income bracket is the least frequent group with only 16 families (1.1%) belonging to this category.
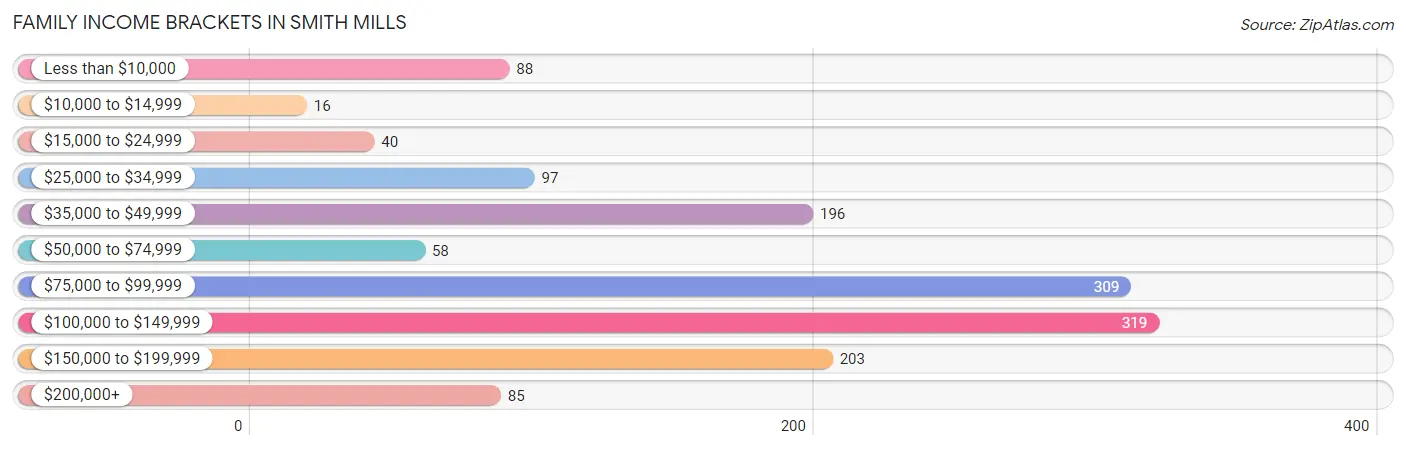
| Income Bracket | # Families | % Families |
| Less than $10,000 | 88 | 6.2% |
| $10,000 to $14,999 | 16 | 1.1% |
| $15,000 to $24,999 | 40 | 2.8% |
| $25,000 to $34,999 | 97 | 6.9% |
| $35,000 to $49,999 | 196 | 13.9% |
| $50,000 to $74,999 | 58 | 4.1% |
| $75,000 to $99,999 | 309 | 21.9% |
| $100,000 to $149,999 | 319 | 22.6% |
| $150,000 to $199,999 | 203 | 14.4% |
| $200,000+ | 85 | 6.0% |
Family Income by Famaliy Size in Smith Mills
5-person families (72 | 5.1%) account for the highest median family income in Smith Mills with $171,200 per family, while 4-person families (143 | 10.1%) have the highest median income of $40,469 per family member.
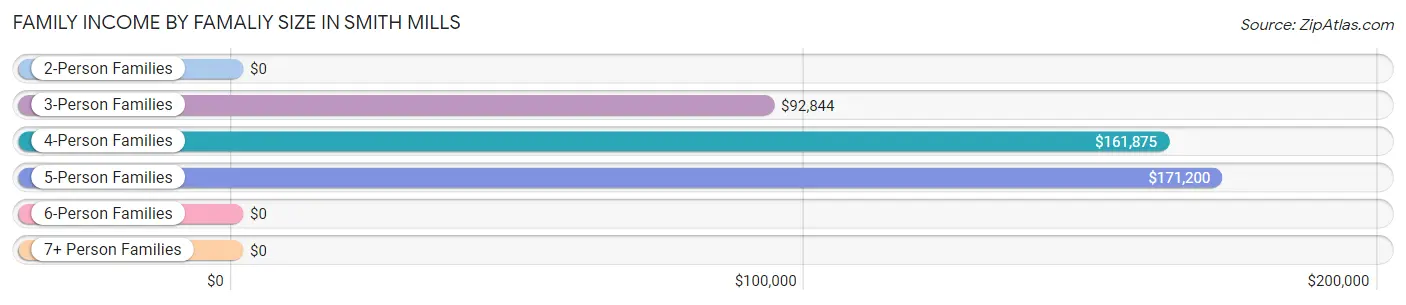
| Income Bracket | # Families | Median Income |
| 2-Person Families | 665 (47.1%) | $0 |
| 3-Person Families | 533 (37.7%) | $92,844 |
| 4-Person Families | 143 (10.1%) | $161,875 |
| 5-Person Families | 72 (5.1%) | $171,200 |
| 6-Person Families | 0 (0.0%) | $0 |
| 7+ Person Families | 0 (0.0%) | $0 |
| Total | 1,413 (100.0%) | $94,713 |
Family Income by Number of Earners in Smith Mills
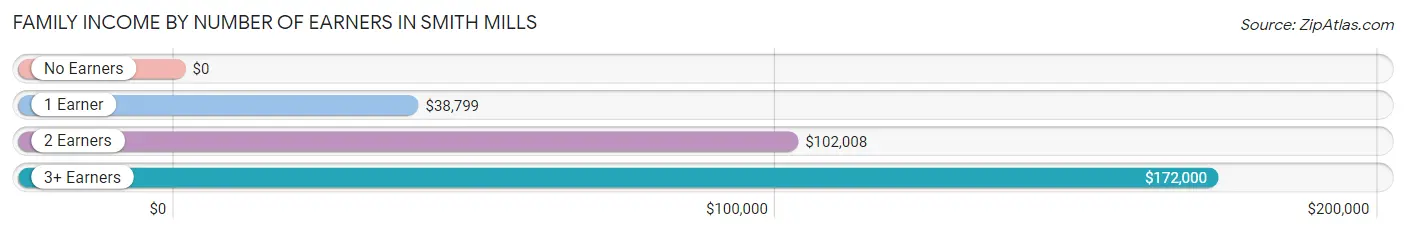
| Number of Earners | # Families | Median Income |
| No Earners | 208 (14.7%) | $0 |
| 1 Earner | 332 (23.5%) | $38,799 |
| 2 Earners | 663 (46.9%) | $102,008 |
| 3+ Earners | 210 (14.9%) | $172,000 |
| Total | 1,413 (100.0%) | $94,713 |
Household Income in Smith Mills
Household Income Brackets in Smith Mills
With 355 households falling in the category, the $100,000 to $149,999 income range is the most frequent in Smith Mills, accounting for 17.9% of all households. In contrast, only 77 households (3.9%) fall into the $10,000 to $14,999 income bracket, making it the least populous group.
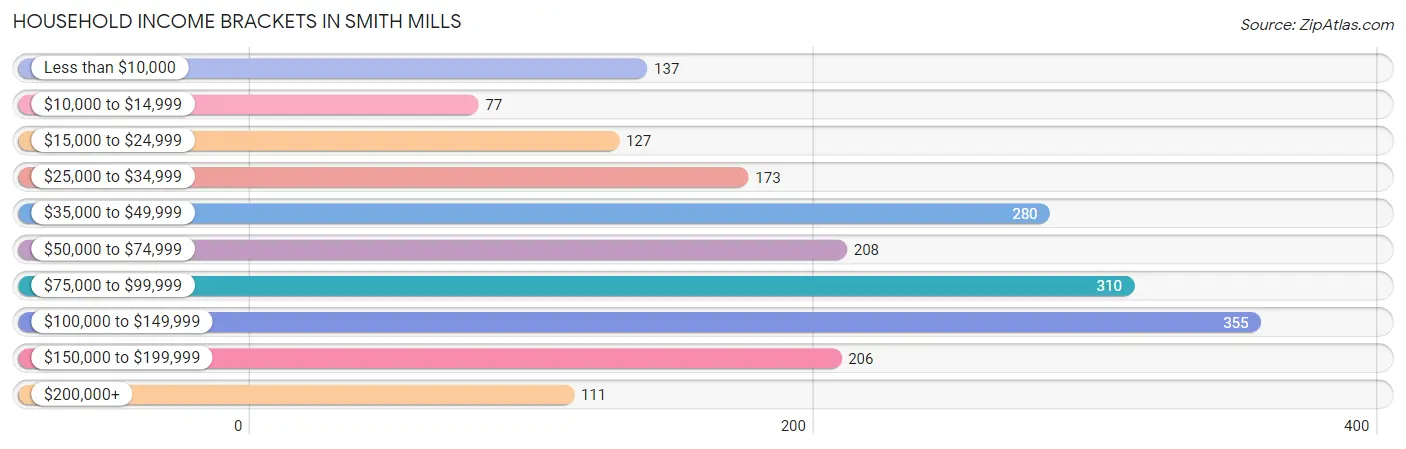
| Income Bracket | # Households | % Households |
| Less than $10,000 | 137 | 6.9% |
| $10,000 to $14,999 | 77 | 3.9% |
| $15,000 to $24,999 | 127 | 6.4% |
| $25,000 to $34,999 | 173 | 8.7% |
| $35,000 to $49,999 | 280 | 14.1% |
| $50,000 to $74,999 | 208 | 10.5% |
| $75,000 to $99,999 | 310 | 15.6% |
| $100,000 to $149,999 | 355 | 17.9% |
| $150,000 to $199,999 | 206 | 10.4% |
| $200,000+ | 111 | 5.6% |
Household Income by Householder Age in Smith Mills
The median household income in Smith Mills is $73,393, with the highest median household income of $105,550 found in the 45 to 64 years age bracket for the primary householder. A total of 666 households (33.6%) fall into this category.
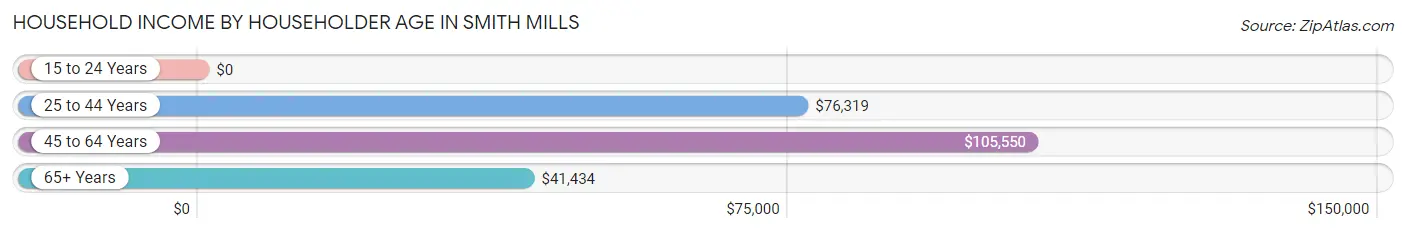
| Income Bracket | # Households | Median Income |
| 15 to 24 Years | 0 (0.0%) | $0 |
| 25 to 44 Years | 722 (36.4%) | $76,319 |
| 45 to 64 Years | 666 (33.6%) | $105,550 |
| 65+ Years | 596 (30.0%) | $41,434 |
| Total | 1,984 (100.0%) | $73,393 |
Poverty in Smith Mills
Income Below Poverty by Sex and Age in Smith Mills
With 7.9% poverty level for males and 9.5% for females among the residents of Smith Mills, under 5 year old males and 65 to 74 year old females are the most vulnerable to poverty, with 24 males (72.7%) and 49 females (25.5%) in their respective age groups living below the poverty level.
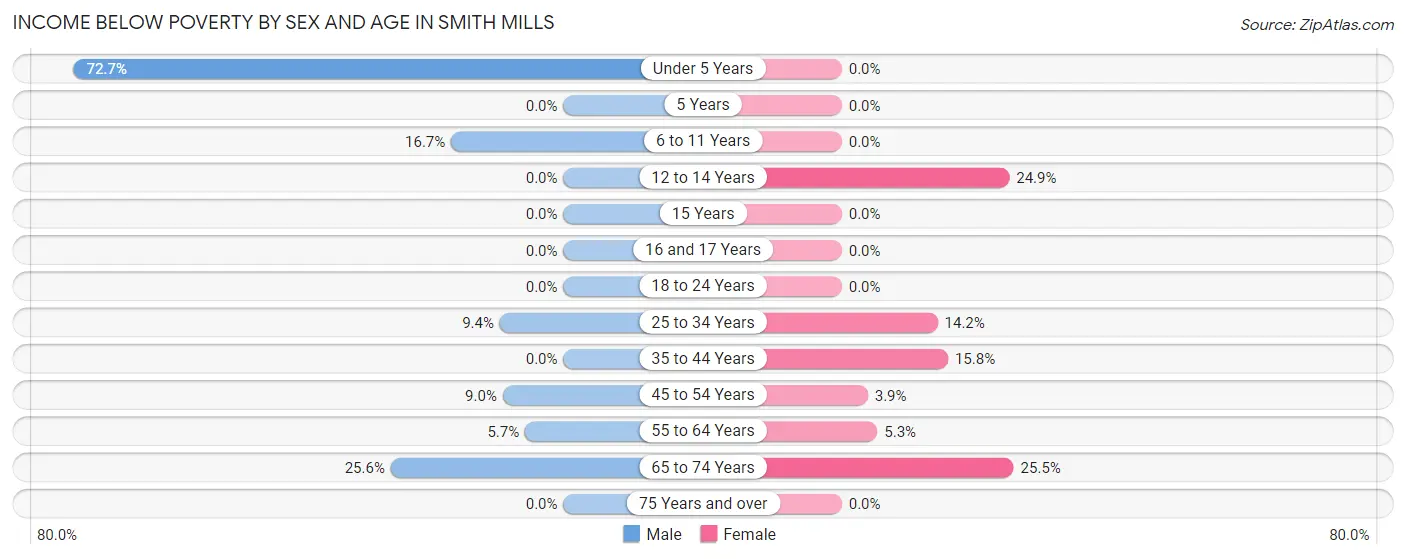
| Age Bracket | Male | Female |
| Under 5 Years | 24 (72.7%) | 0 (0.0%) |
| 5 Years | 0 (0.0%) | 0 (0.0%) |
| 6 to 11 Years | 13 (16.7%) | 0 (0.0%) |
| 12 to 14 Years | 0 (0.0%) | 48 (24.9%) |
| 15 Years | 0 (0.0%) | 0 (0.0%) |
| 16 and 17 Years | 0 (0.0%) | 0 (0.0%) |
| 18 to 24 Years | 0 (0.0%) | 0 (0.0%) |
| 25 to 34 Years | 34 (9.4%) | 37 (14.2%) |
| 35 to 44 Years | 0 (0.0%) | 70 (15.8%) |
| 45 to 54 Years | 28 (9.0%) | 13 (3.9%) |
| 55 to 64 Years | 16 (5.7%) | 16 (5.3%) |
| 65 to 74 Years | 51 (25.6%) | 49 (25.5%) |
| 75 Years and over | 0 (0.0%) | 0 (0.0%) |
| Total | 166 (7.9%) | 233 (9.5%) |
Income Above Poverty by Sex and Age in Smith Mills
According to the poverty statistics in Smith Mills, males aged 5 years and females aged under 5 years are the age groups that are most secure financially, with 100.0% of males and 100.0% of females in these age groups living above the poverty line.
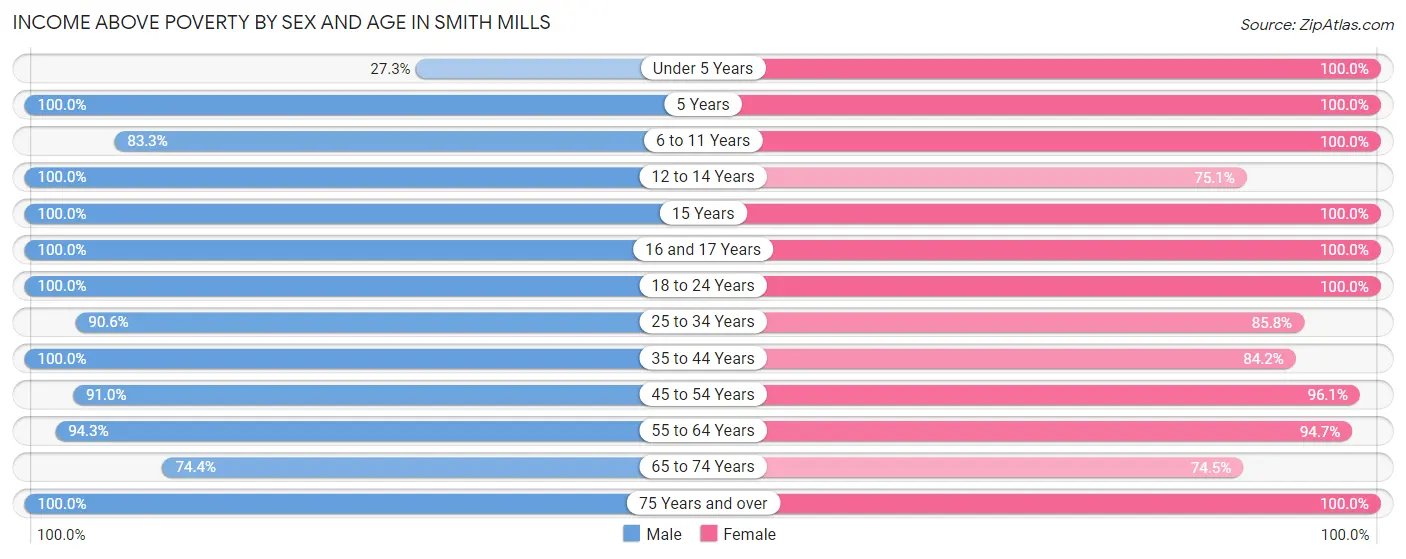
| Age Bracket | Male | Female |
| Under 5 Years | 9 (27.3%) | 99 (100.0%) |
| 5 Years | 15 (100.0%) | 118 (100.0%) |
| 6 to 11 Years | 65 (83.3%) | 79 (100.0%) |
| 12 to 14 Years | 28 (100.0%) | 145 (75.1%) |
| 15 Years | 50 (100.0%) | 73 (100.0%) |
| 16 and 17 Years | 40 (100.0%) | 18 (100.0%) |
| 18 to 24 Years | 193 (100.0%) | 91 (100.0%) |
| 25 to 34 Years | 326 (90.6%) | 223 (85.8%) |
| 35 to 44 Years | 313 (100.0%) | 374 (84.2%) |
| 45 to 54 Years | 283 (91.0%) | 324 (96.1%) |
| 55 to 64 Years | 265 (94.3%) | 287 (94.7%) |
| 65 to 74 Years | 148 (74.4%) | 143 (74.5%) |
| 75 Years and over | 212 (100.0%) | 236 (100.0%) |
| Total | 1,947 (92.1%) | 2,210 (90.5%) |
Income Below Poverty Among Married-Couple Families in Smith Mills
The poverty statistics for married-couple families in Smith Mills show that 3.9% or 39 of the total 1,005 families live below the poverty line. Families with 1 or 2 children have the highest poverty rate of 4.9%, comprising of 23 families. On the other hand, families with no children have the lowest poverty rate of 3.0%, which includes 16 families.
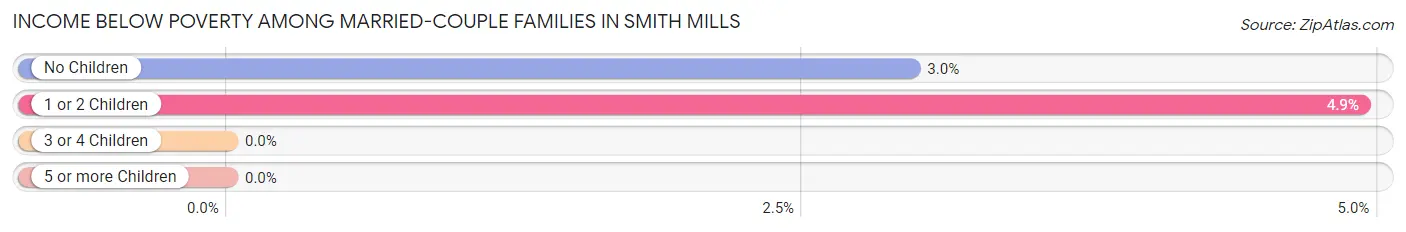
| Children | Above Poverty | Below Poverty |
| No Children | 522 (97.0%) | 16 (3.0%) |
| 1 or 2 Children | 444 (95.1%) | 23 (4.9%) |
| 3 or 4 Children | 0 (0.0%) | 0 (0.0%) |
| 5 or more Children | 0 (0.0%) | 0 (0.0%) |
| Total | 966 (96.1%) | 39 (3.9%) |
Income Below Poverty Among Single-Parent Households in Smith Mills
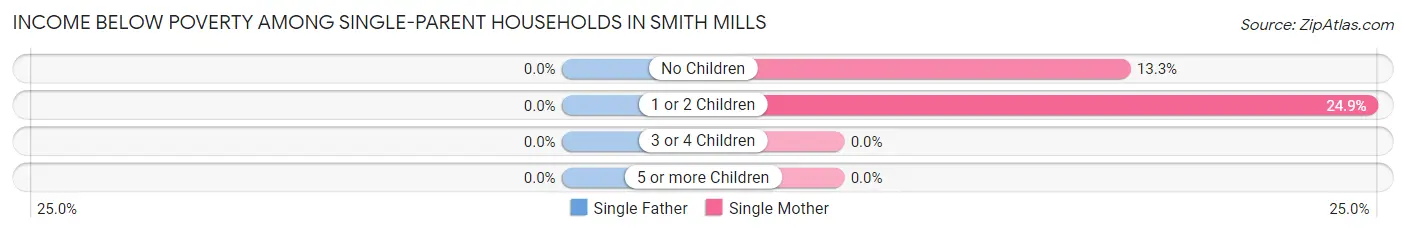
| Children | Single Father | Single Mother |
| No Children | 0 (0.0%) | 16 (13.3%) |
| 1 or 2 Children | 0 (0.0%) | 64 (24.9%) |
| 3 or 4 Children | 0 (0.0%) | 0 (0.0%) |
| 5 or more Children | 0 (0.0%) | 0 (0.0%) |
| Total | 0 (0.0%) | 80 (21.2%) |
Income Below Poverty Among Married-Couple vs Single-Parent Households in Smith Mills
The poverty data for Smith Mills shows that 39 of the married-couple family households (3.9%) and 80 of the single-parent households (19.6%) are living below the poverty level. Within the married-couple family households, those with 1 or 2 children have the highest poverty rate, with 23 households (4.9%) falling below the poverty line. Among the single-parent households, those with 1 or 2 children have the highest poverty rate, with 64 household (24.9%) living below poverty.
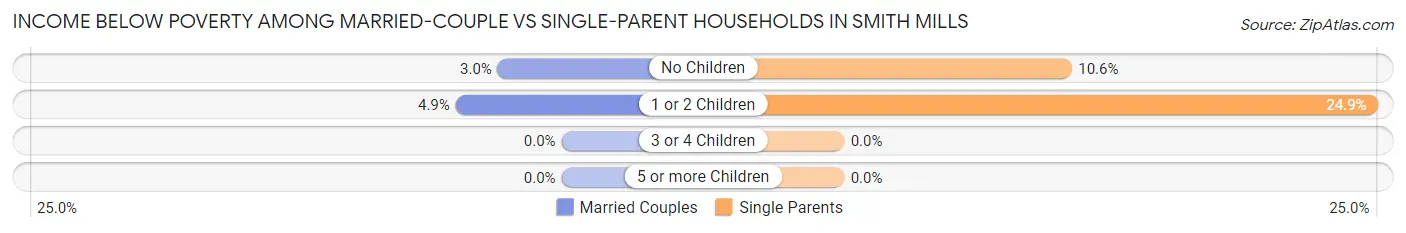
| Children | Married-Couple Families | Single-Parent Households |
| No Children | 16 (3.0%) | 16 (10.6%) |
| 1 or 2 Children | 23 (4.9%) | 64 (24.9%) |
| 3 or 4 Children | 0 (0.0%) | 0 (0.0%) |
| 5 or more Children | 0 (0.0%) | 0 (0.0%) |
| Total | 39 (3.9%) | 80 (19.6%) |
Race in Smith Mills
The most populous races in Smith Mills are White / Caucasian (3,865 | 84.8%), Two or more Races (365 | 8.0%), and Asian (206 | 4.5%).
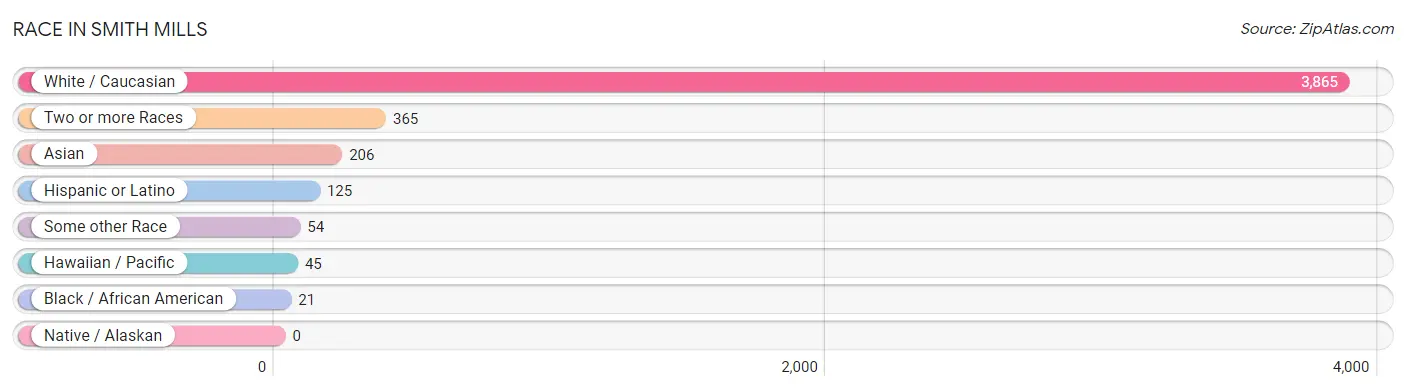
| Race | # Population | % Population |
| Asian | 206 | 4.5% |
| Black / African American | 21 | 0.5% |
| Hawaiian / Pacific | 45 | 1.0% |
| Hispanic or Latino | 125 | 2.7% |
| Native / Alaskan | 0 | 0.0% |
| White / Caucasian | 3,865 | 84.8% |
| Two or more Races | 365 | 8.0% |
| Some other Race | 54 | 1.2% |
| Total | 4,556 | 100.0% |
Ancestry in Smith Mills
The most populous ancestries reported in Smith Mills are Portuguese (1,758 | 38.6%), English (619 | 13.6%), Irish (458 | 10.1%), French Canadian (397 | 8.7%), and French (393 | 8.6%), together accounting for 79.6% of all Smith Mills residents.
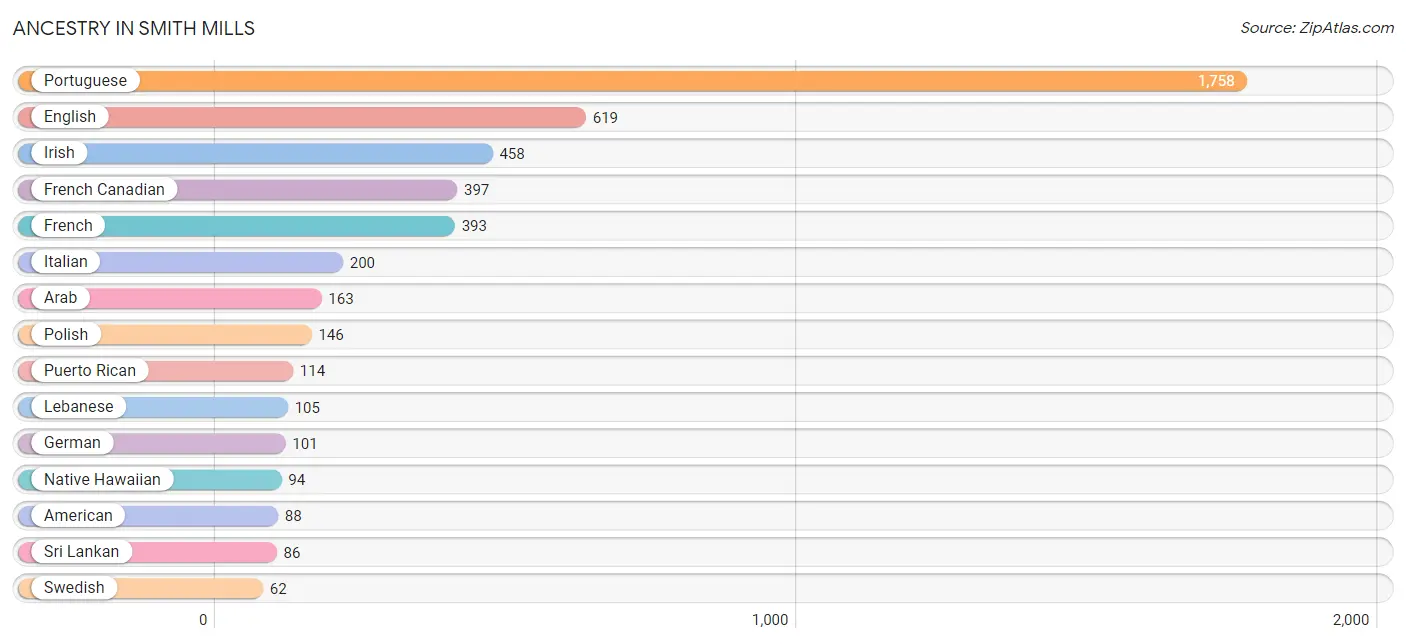
| Ancestry | # Population | % Population |
| American | 88 | 1.9% |
| Arab | 163 | 3.6% |
| Belgian | 16 | 0.4% |
| Brazilian | 15 | 0.3% |
| British | 30 | 0.7% |
| Burmese | 6 | 0.1% |
| Cape Verdean | 53 | 1.2% |
| English | 619 | 13.6% |
| Filipino | 42 | 0.9% |
| French | 393 | 8.6% |
| French Canadian | 397 | 8.7% |
| German | 101 | 2.2% |
| Indian (Asian) | 49 | 1.1% |
| Irish | 458 | 10.1% |
| Italian | 200 | 4.4% |
| Lebanese | 105 | 2.3% |
| Lithuanian | 21 | 0.5% |
| Moroccan | 58 | 1.3% |
| Native Hawaiian | 94 | 2.1% |
| Northern European | 20 | 0.4% |
| Norwegian | 31 | 0.7% |
| Polish | 146 | 3.2% |
| Portuguese | 1,758 | 38.6% |
| Puerto Rican | 114 | 2.5% |
| Russian | 9 | 0.2% |
| Scottish | 23 | 0.5% |
| Sri Lankan | 86 | 1.9% |
| Subsaharan African | 53 | 1.2% |
| Swedish | 62 | 1.4% |
| Thai | 29 | 0.6% |
| Ukrainian | 9 | 0.2% | View All 31 Rows |
Immigrants in Smith Mills
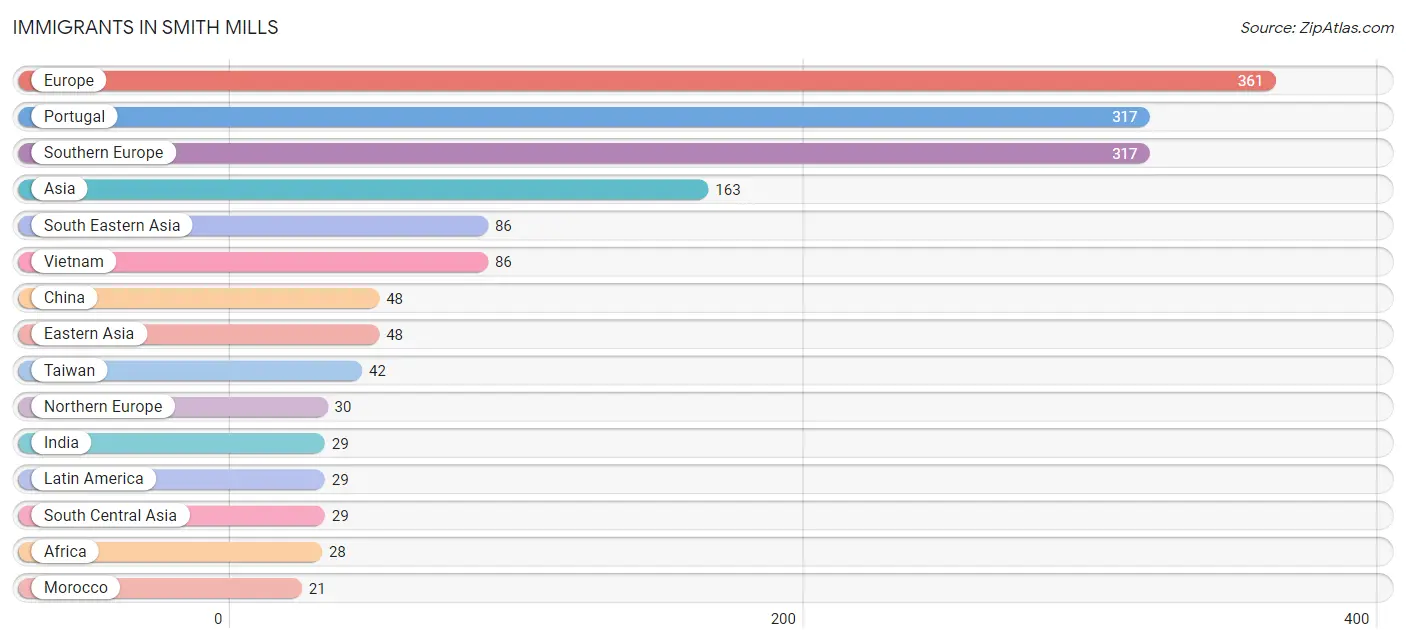
The most numerous immigrant groups reported in Smith Mills came from Europe (361 | 7.9%), Portugal (317 | 7.0%), Southern Europe (317 | 7.0%), Asia (163 | 3.6%), and South Eastern Asia (86 | 1.9%), together accounting for 27.3% of all Smith Mills residents.
| Immigration Origin | # Population | % Population |
| Africa | 28 | 0.6% |
| Asia | 163 | 3.6% |
| Brazil | 15 | 0.3% |
| Cabo Verde | 7 | 0.2% |
| Caribbean | 14 | 0.3% |
| China | 48 | 1.1% |
| Eastern Asia | 48 | 1.1% |
| Eastern Europe | 14 | 0.3% |
| Europe | 361 | 7.9% |
| India | 29 | 0.6% |
| Latin America | 29 | 0.6% |
| Morocco | 21 | 0.5% |
| Northern Africa | 21 | 0.5% |
| Northern Europe | 30 | 0.7% |
| Portugal | 317 | 7.0% |
| South America | 15 | 0.3% |
| South Central Asia | 29 | 0.6% |
| South Eastern Asia | 86 | 1.9% |
| Southern Europe | 317 | 7.0% |
| Taiwan | 42 | 0.9% |
| Trinidad and Tobago | 14 | 0.3% |
| Vietnam | 86 | 1.9% |
| Western Africa | 7 | 0.2% | View All 23 Rows |
Sex and Age in Smith Mills
Sex and Age in Smith Mills
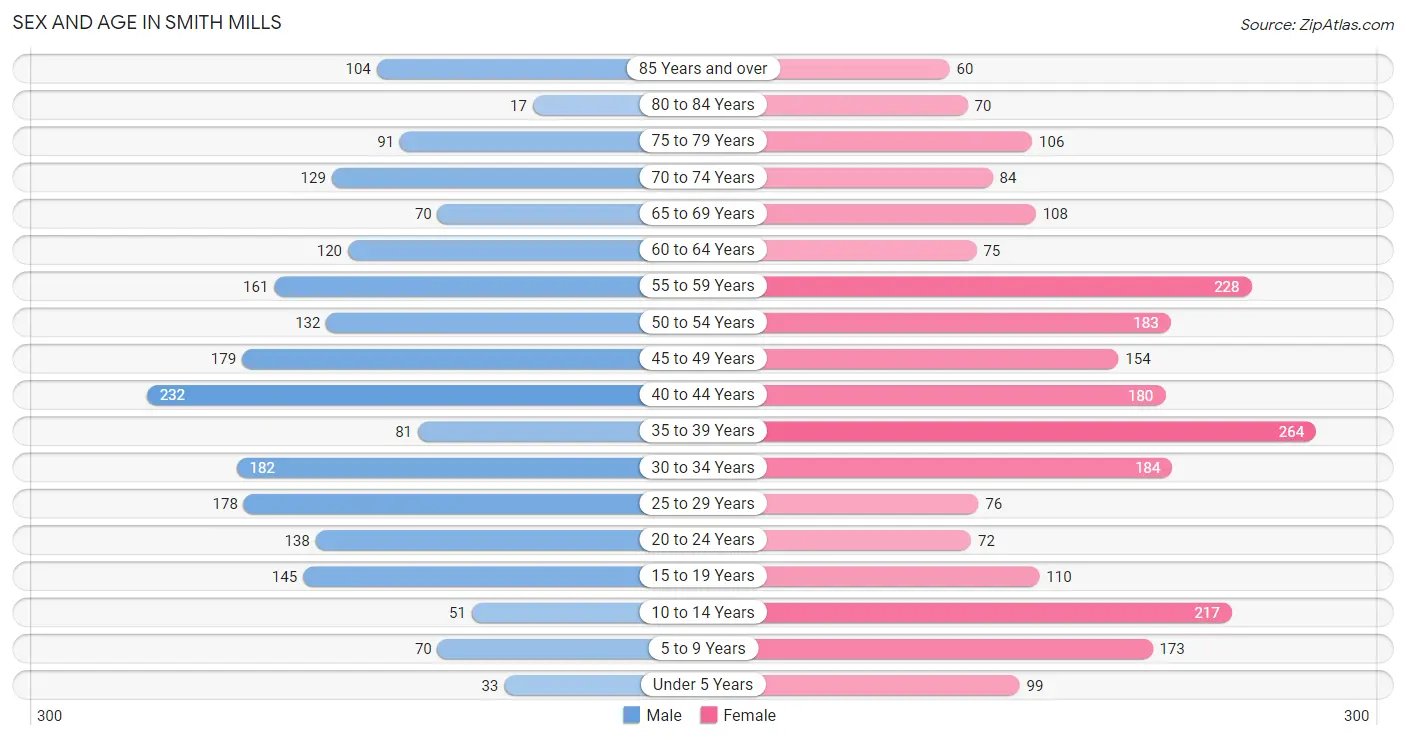
The most populous age groups in Smith Mills are 40 to 44 Years (232 | 11.0%) for men and 35 to 39 Years (264 | 10.8%) for women.
| Age Bracket | Male | Female |
| Under 5 Years | 33 (1.6%) | 99 (4.1%) |
| 5 to 9 Years | 70 (3.3%) | 173 (7.1%) |
| 10 to 14 Years | 51 (2.4%) | 217 (8.9%) |
| 15 to 19 Years | 145 (6.9%) | 110 (4.5%) |
| 20 to 24 Years | 138 (6.5%) | 72 (2.9%) |
| 25 to 29 Years | 178 (8.4%) | 76 (3.1%) |
| 30 to 34 Years | 182 (8.6%) | 184 (7.5%) |
| 35 to 39 Years | 81 (3.8%) | 264 (10.8%) |
| 40 to 44 Years | 232 (11.0%) | 180 (7.4%) |
| 45 to 49 Years | 179 (8.5%) | 154 (6.3%) |
| 50 to 54 Years | 132 (6.2%) | 183 (7.5%) |
| 55 to 59 Years | 161 (7.6%) | 228 (9.3%) |
| 60 to 64 Years | 120 (5.7%) | 75 (3.1%) |
| 65 to 69 Years | 70 (3.3%) | 108 (4.4%) |
| 70 to 74 Years | 129 (6.1%) | 84 (3.4%) |
| 75 to 79 Years | 91 (4.3%) | 106 (4.3%) |
| 80 to 84 Years | 17 (0.8%) | 70 (2.9%) |
| 85 Years and over | 104 (4.9%) | 60 (2.5%) |
| Total | 2,113 (100.0%) | 2,443 (100.0%) |
Families and Households in Smith Mills
Median Family Size in Smith Mills
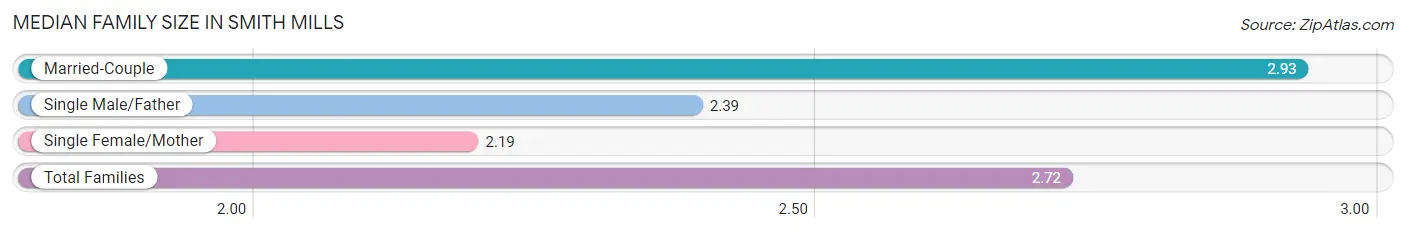
The median family size in Smith Mills is 2.72 persons per family, with married-couple families (1,005 | 71.1%) accounting for the largest median family size of 2.93 persons per family. On the other hand, single female/mother families (377 | 26.7%) represent the smallest median family size with 2.19 persons per family.
| Family Type | # Families | Family Size |
| Married-Couple | 1,005 (71.1%) | 2.93 |
| Single Male/Father | 31 (2.2%) | 2.39 |
| Single Female/Mother | 377 (26.7%) | 2.19 |
| Total Families | 1,413 (100.0%) | 2.72 |
Median Household Size in Smith Mills
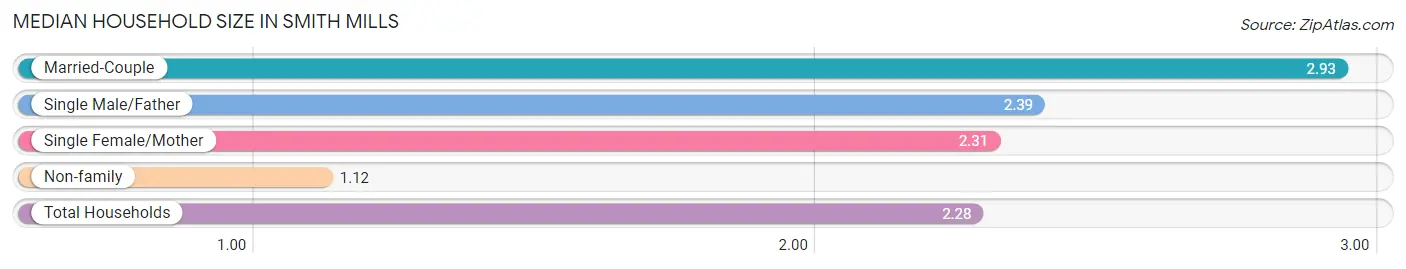
The median household size in Smith Mills is 2.28 persons per household, with married-couple households (1,005 | 50.7%) accounting for the largest median household size of 2.93 persons per household. non-family households (571 | 28.8%) represent the smallest median household size with 1.12 persons per household.
| Household Type | # Households | Household Size |
| Married-Couple | 1,005 (50.7%) | 2.93 |
| Single Male/Father | 31 (1.6%) | 2.39 |
| Single Female/Mother | 377 (19.0%) | 2.31 |
| Non-family | 571 (28.8%) | 1.12 |
| Total Households | 1,984 (100.0%) | 2.28 |
Household Size by Marriage Status in Smith Mills
Out of a total of 1,984 households in Smith Mills, 1,413 (71.2%) are family households, while 571 (28.8%) are nonfamily households. The most numerous type of family households are 2-person households, comprising 665, and the most common type of nonfamily households are 1-person households, comprising 505.
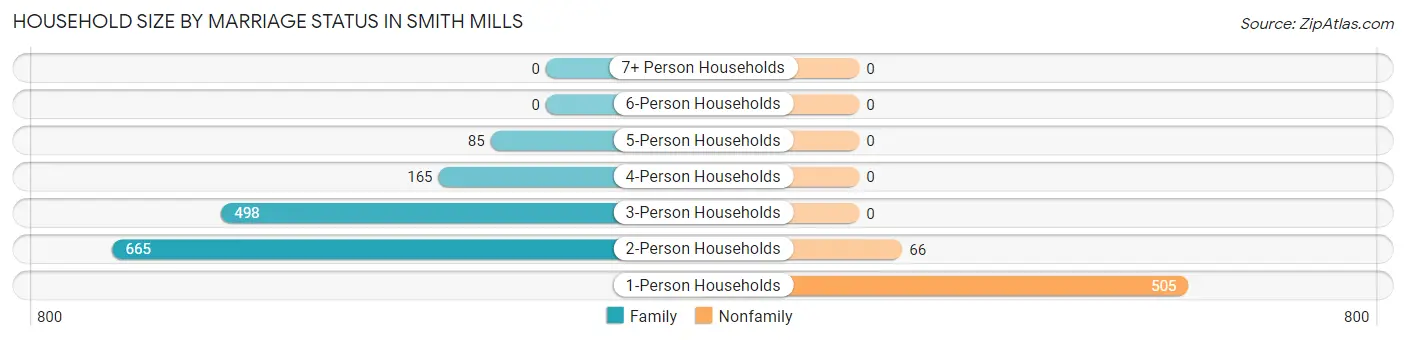
| Household Size | Family Households | Nonfamily Households |
| 1-Person Households | - | 505 (25.5%) |
| 2-Person Households | 665 (33.5%) | 66 (3.3%) |
| 3-Person Households | 498 (25.1%) | 0 (0.0%) |
| 4-Person Households | 165 (8.3%) | 0 (0.0%) |
| 5-Person Households | 85 (4.3%) | 0 (0.0%) |
| 6-Person Households | 0 (0.0%) | 0 (0.0%) |
| 7+ Person Households | 0 (0.0%) | 0 (0.0%) |
| Total | 1,413 (71.2%) | 571 (28.8%) |
Female Fertility in Smith Mills
Fertility by Age in Smith Mills
Average fertility rate in Smith Mills is 11.0 births per 1,000 women. Women in the age bracket of 20 to 34 years have the highest fertility rate with 36.0 births per 1,000 women. Women in the age bracket of 20 to 34 years acount for 100.0% of all women with births.
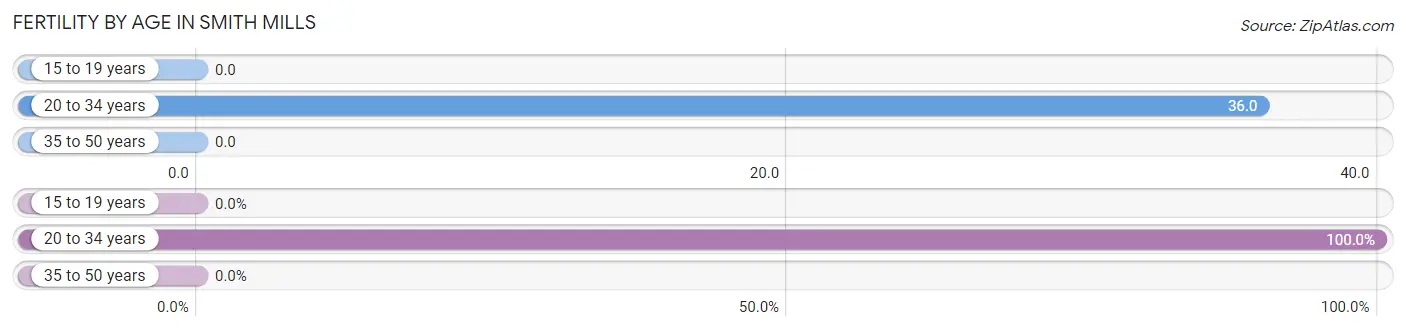
| Age Bracket | Women with Births | Births / 1,000 Women |
| 15 to 19 years | 0 (0.0%) | 0.0 |
| 20 to 34 years | 12 (100.0%) | 36.0 |
| 35 to 50 years | 0 (0.0%) | 0.0 |
| Total | 12 (100.0%) | 11.0 |
Fertility by Age by Marriage Status in Smith Mills
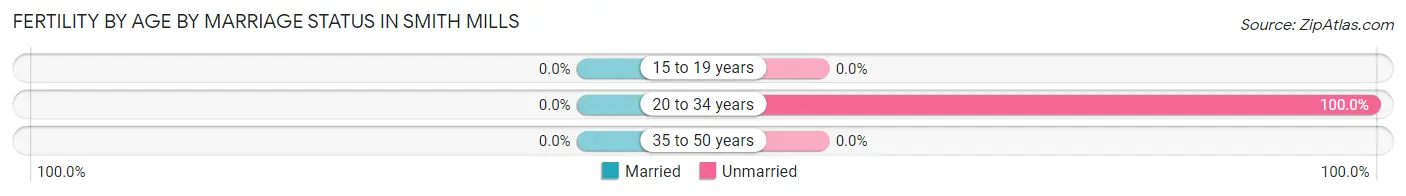
| Age Bracket | Married | Unmarried |
| 15 to 19 years | 0 (0.0%) | 0 (0.0%) |
| 20 to 34 years | 0 (0.0%) | 12 (100.0%) |
| 35 to 50 years | 0 (0.0%) | 0 (0.0%) |
| Total | 0 (0.0%) | 12 (100.0%) |
Fertility by Education in Smith Mills
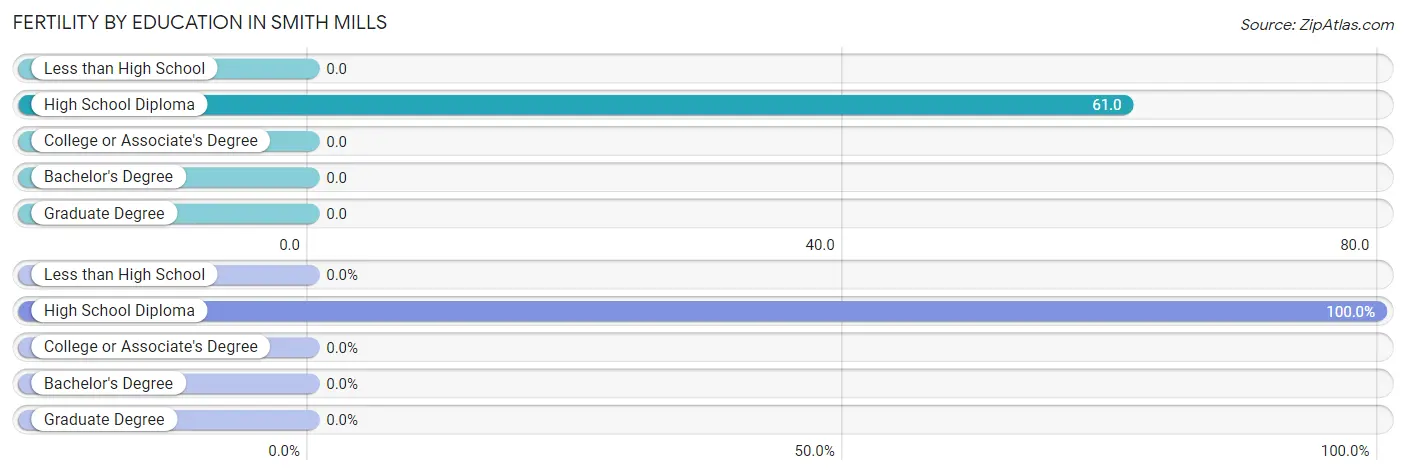
| Educational Attainment | Women with Births | Births / 1,000 Women |
| Less than High School | 0 (0.0%) | 0.0 |
| High School Diploma | 12 (100.0%) | 61.0 |
| College or Associate's Degree | 0 (0.0%) | 0.0 |
| Bachelor's Degree | 0 (0.0%) | 0.0 |
| Graduate Degree | 0 (0.0%) | 0.0 |
| Total | 12 (100.0%) | 11.0 |
Fertility by Education by Marriage Status in Smith Mills
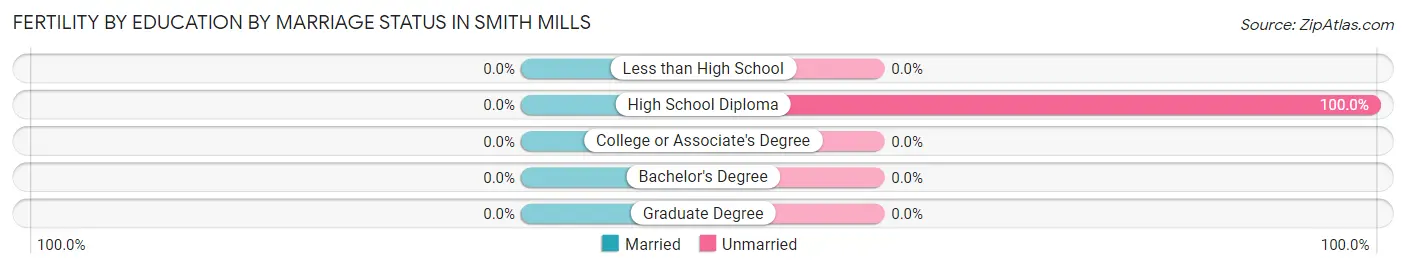
| Educational Attainment | Married | Unmarried |
| Less than High School | 0 (0.0%) | 0 (0.0%) |
| High School Diploma | 0 (0.0%) | 12 (100.0%) |
| College or Associate's Degree | 0 (0.0%) | 0 (0.0%) |
| Bachelor's Degree | 0 (0.0%) | 0 (0.0%) |
| Graduate Degree | 0 (0.0%) | 0 (0.0%) |
| Total | 0 (0.0%) | 12 (100.0%) |
Employment Characteristics in Smith Mills
Employment by Class of Employer in Smith Mills
Among the 2,508 employed individuals in Smith Mills, private company employees (1,573 | 62.7%), self-employed (not incorporated) (350 | 14.0%), and not-for-profit organizations (206 | 8.2%) make up the most common classes of employment.
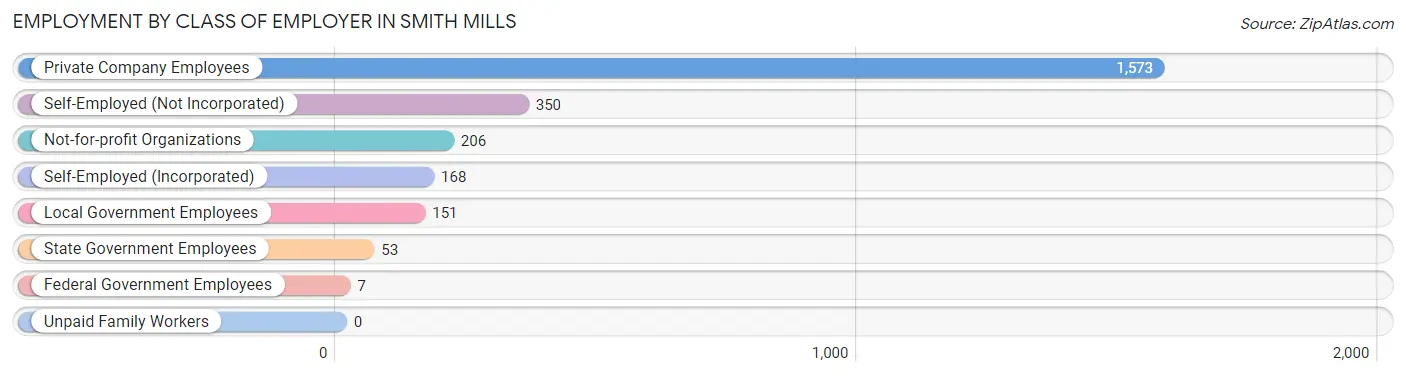
| Employer Class | # Employees | % Employees |
| Private Company Employees | 1,573 | 62.7% |
| Self-Employed (Incorporated) | 168 | 6.7% |
| Self-Employed (Not Incorporated) | 350 | 14.0% |
| Not-for-profit Organizations | 206 | 8.2% |
| Local Government Employees | 151 | 6.0% |
| State Government Employees | 53 | 2.1% |
| Federal Government Employees | 7 | 0.3% |
| Unpaid Family Workers | 0 | 0.0% |
| Total | 2,508 | 100.0% |
Employment Status by Age in Smith Mills
According to the labor force statistics for Smith Mills, out of the total population over 16 years of age (3,790), 69.3% or 2,626 individuals are in the labor force, with 2.4% or 63 of them unemployed. The age group with the highest labor force participation rate is 20 to 24 years, with 100.0% or 210 individuals in the labor force. Within the labor force, the 20 to 24 years age range has the highest percentage of unemployed individuals, with 10.0% or 21 of them being unemployed.
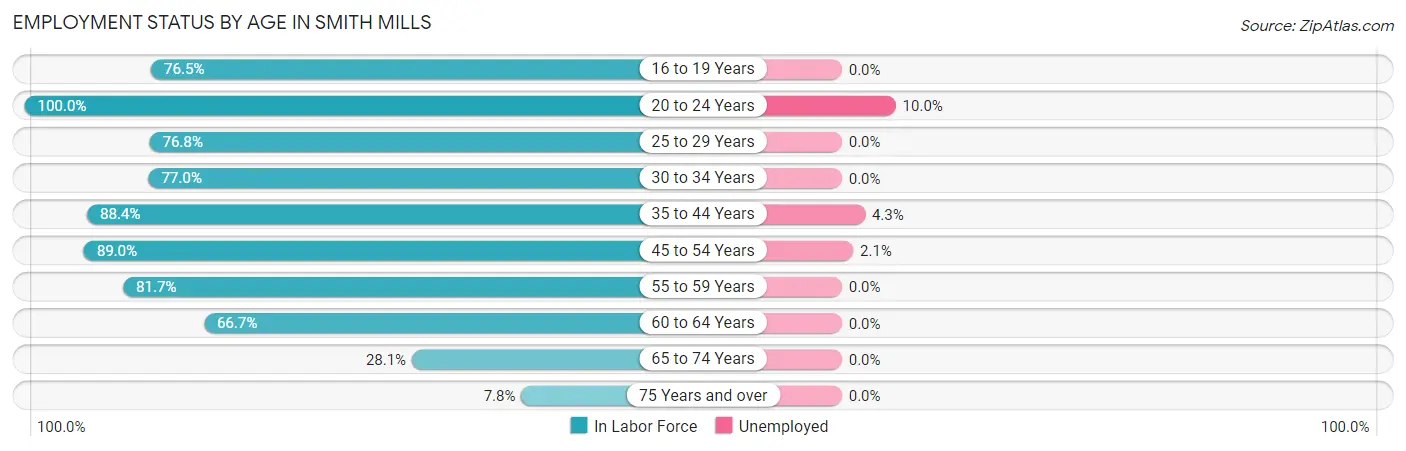
| Age Bracket | In Labor Force | Unemployed |
| 16 to 19 Years | 101 (76.5%) | 0 (0.0%) |
| 20 to 24 Years | 210 (100.0%) | 21 (10.0%) |
| 25 to 29 Years | 195 (76.8%) | 0 (0.0%) |
| 30 to 34 Years | 282 (77.0%) | 0 (0.0%) |
| 35 to 44 Years | 669 (88.4%) | 29 (4.3%) |
| 45 to 54 Years | 577 (89.0%) | 12 (2.1%) |
| 55 to 59 Years | 318 (81.7%) | 0 (0.0%) |
| 60 to 64 Years | 130 (66.7%) | 0 (0.0%) |
| 65 to 74 Years | 110 (28.1%) | 0 (0.0%) |
| 75 Years and over | 35 (7.8%) | 0 (0.0%) |
| Total | 2,626 (69.3%) | 63 (2.4%) |
Employment Status by Educational Attainment in Smith Mills
According to labor force statistics for Smith Mills, 83.2% of individuals (2,171) out of the total population between 25 and 64 years of age (2,609) are in the labor force, with 1.9% or 41 of them being unemployed. The group with the highest labor force participation rate are those with the educational attainment of high school diploma, with 94.6% or 616 individuals in the labor force. Within the labor force, individuals with less than high school education have the highest percentage of unemployment, with 5.0% or 16 of them being unemployed.
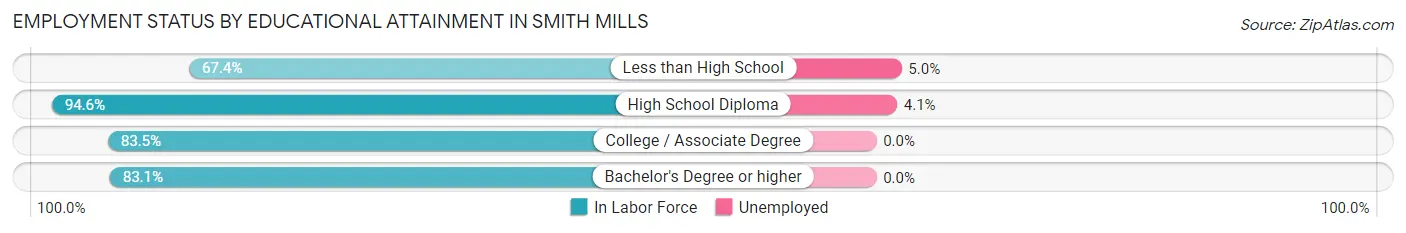
| Educational Attainment | In Labor Force | Unemployed |
| Less than High School | 321 (67.4%) | 24 (5.0%) |
| High School Diploma | 616 (94.6%) | 27 (4.1%) |
| College / Associate Degree | 606 (83.5%) | 0 (0.0%) |
| Bachelor's Degree or higher | 628 (83.1%) | 0 (0.0%) |
| Total | 2,171 (83.2%) | 50 (1.9%) |
Employment Occupations by Sex in Smith Mills
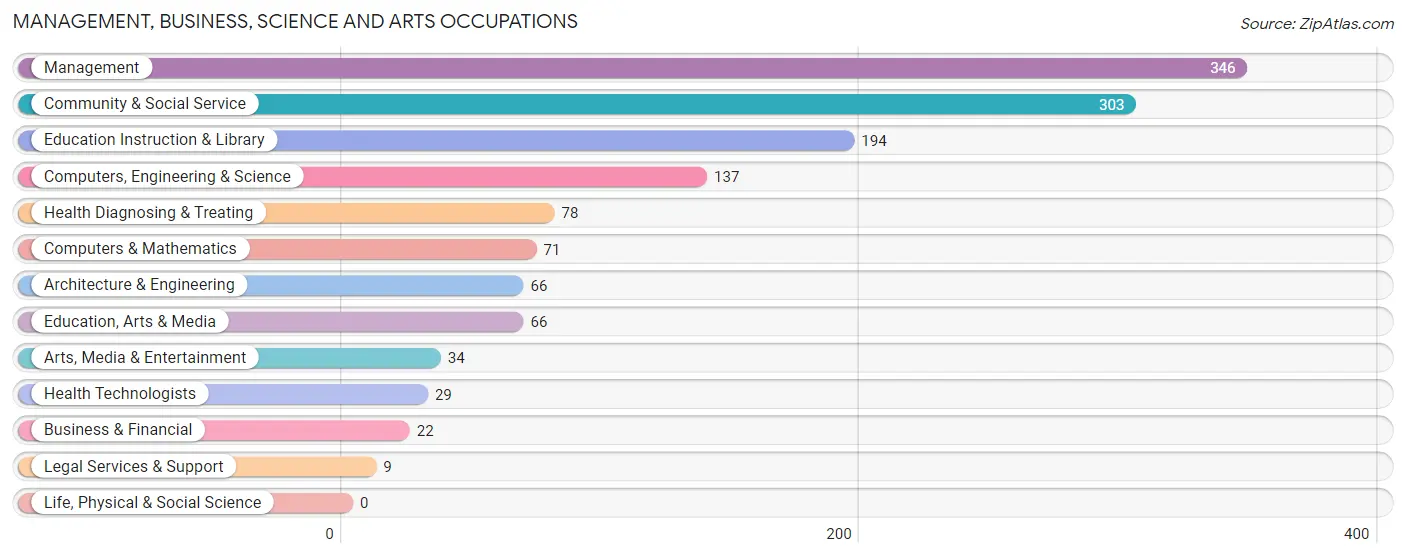
Management, Business, Science and Arts Occupations
The most common Management, Business, Science and Arts occupations in Smith Mills are Management (346 | 13.5%), Community & Social Service (303 | 11.8%), Education Instruction & Library (194 | 7.6%), Computers, Engineering & Science (137 | 5.3%), and Health Diagnosing & Treating (78 | 3.0%).
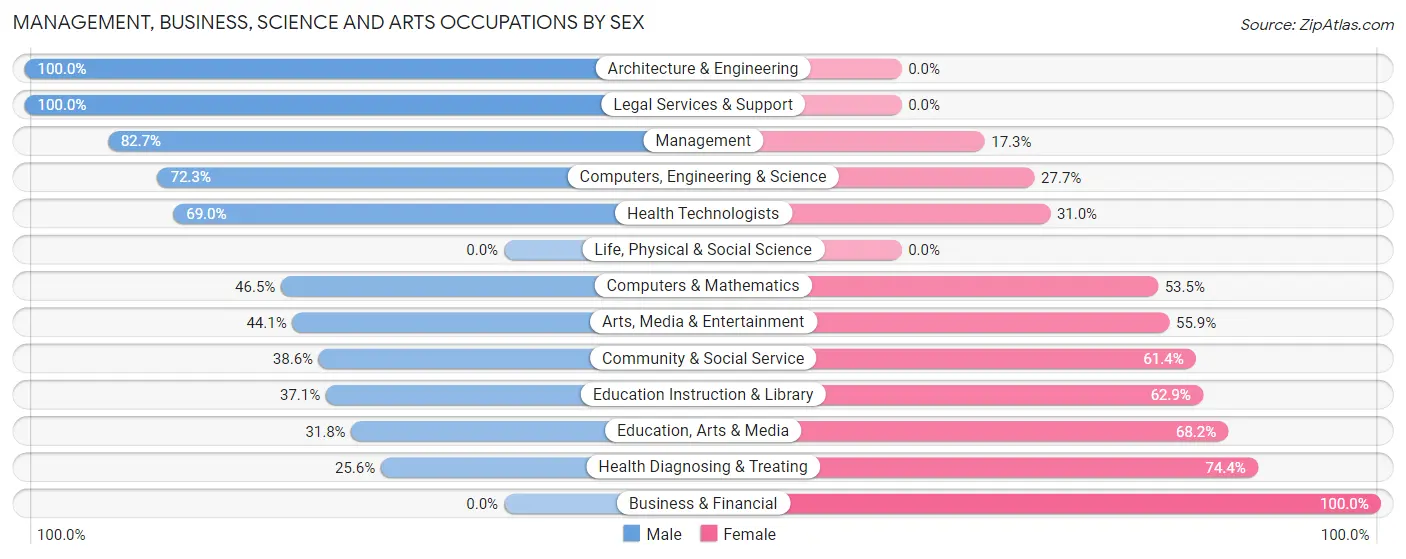
Management, Business, Science and Arts Occupations by Sex
Within the Management, Business, Science and Arts occupations in Smith Mills, the most male-oriented occupations are Architecture & Engineering (100.0%), Legal Services & Support (100.0%), and Management (82.7%), while the most female-oriented occupations are Business & Financial (100.0%), Health Diagnosing & Treating (74.4%), and Education, Arts & Media (68.2%).
| Occupation | Male | Female |
| Management | 286 (82.7%) | 60 (17.3%) |
| Business & Financial | 0 (0.0%) | 22 (100.0%) |
| Computers, Engineering & Science | 99 (72.3%) | 38 (27.7%) |
| Computers & Mathematics | 33 (46.5%) | 38 (53.5%) |
| Architecture & Engineering | 66 (100.0%) | 0 (0.0%) |
| Life, Physical & Social Science | 0 (0.0%) | 0 (0.0%) |
| Community & Social Service | 117 (38.6%) | 186 (61.4%) |
| Education, Arts & Media | 21 (31.8%) | 45 (68.2%) |
| Legal Services & Support | 9 (100.0%) | 0 (0.0%) |
| Education Instruction & Library | 72 (37.1%) | 122 (62.9%) |
| Arts, Media & Entertainment | 15 (44.1%) | 19 (55.9%) |
| Health Diagnosing & Treating | 20 (25.6%) | 58 (74.4%) |
| Health Technologists | 20 (69.0%) | 9 (31.0%) |
| Total (Category) | 522 (58.9%) | 364 (41.1%) |
| Total (Overall) | 1,323 (51.6%) | 1,242 (48.4%) |
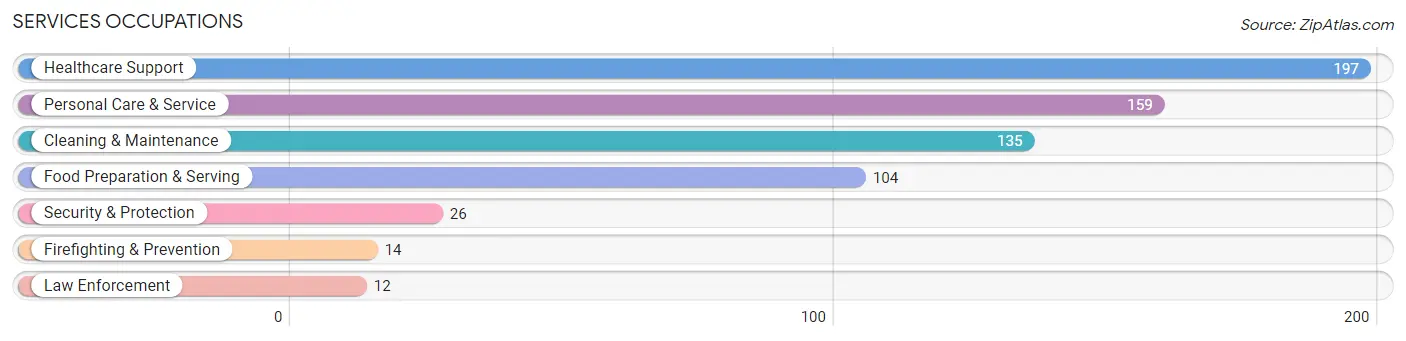
Services Occupations
The most common Services occupations in Smith Mills are Healthcare Support (197 | 7.7%), Personal Care & Service (159 | 6.2%), Cleaning & Maintenance (135 | 5.3%), Food Preparation & Serving (104 | 4.1%), and Security & Protection (26 | 1.0%).
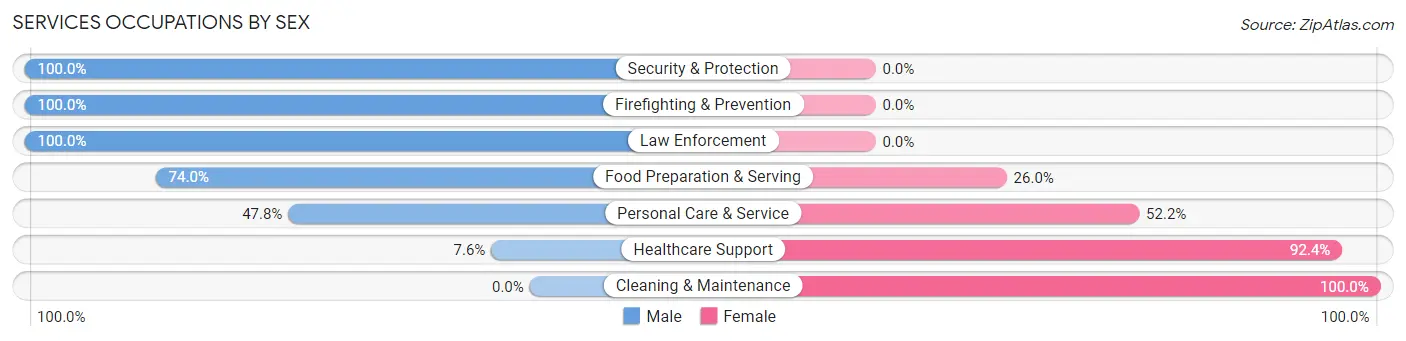
Services Occupations by Sex
Within the Services occupations in Smith Mills, the most male-oriented occupations are Security & Protection (100.0%), Firefighting & Prevention (100.0%), and Law Enforcement (100.0%), while the most female-oriented occupations are Cleaning & Maintenance (100.0%), Healthcare Support (92.4%), and Personal Care & Service (52.2%).
| Occupation | Male | Female |
| Healthcare Support | 15 (7.6%) | 182 (92.4%) |
| Security & Protection | 26 (100.0%) | 0 (0.0%) |
| Firefighting & Prevention | 14 (100.0%) | 0 (0.0%) |
| Law Enforcement | 12 (100.0%) | 0 (0.0%) |
| Food Preparation & Serving | 77 (74.0%) | 27 (26.0%) |
| Cleaning & Maintenance | 0 (0.0%) | 135 (100.0%) |
| Personal Care & Service | 76 (47.8%) | 83 (52.2%) |
| Total (Category) | 194 (31.2%) | 427 (68.8%) |
| Total (Overall) | 1,323 (51.6%) | 1,242 (48.4%) |
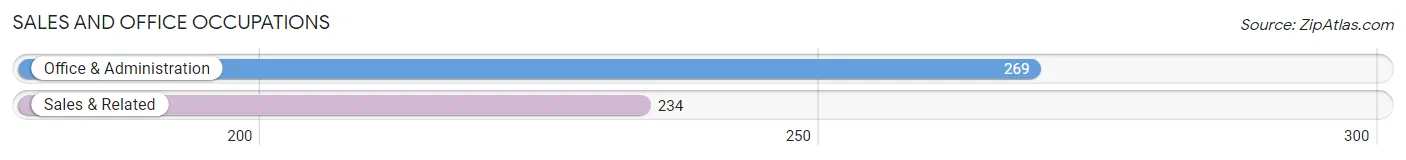
Sales and Office Occupations
The most common Sales and Office occupations in Smith Mills are Office & Administration (269 | 10.5%), and Sales & Related (234 | 9.1%).
Sales and Office Occupations by Sex
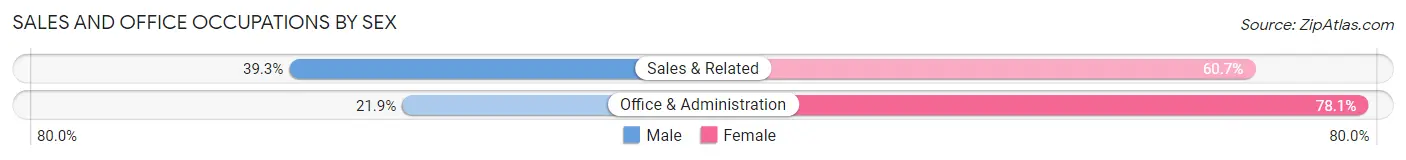
| Occupation | Male | Female |
| Sales & Related | 92 (39.3%) | 142 (60.7%) |
| Office & Administration | 59 (21.9%) | 210 (78.1%) |
| Total (Category) | 151 (30.0%) | 352 (70.0%) |
| Total (Overall) | 1,323 (51.6%) | 1,242 (48.4%) |
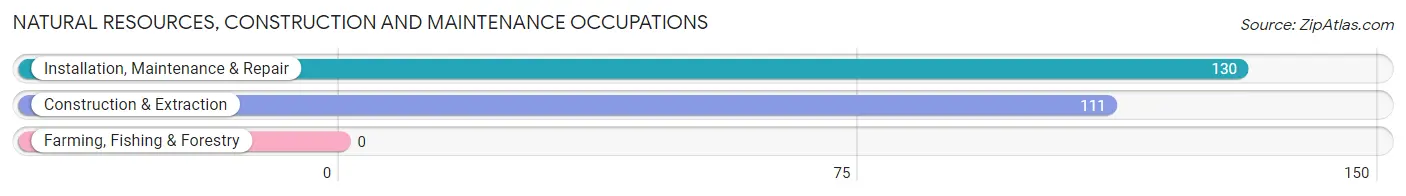
Natural Resources, Construction and Maintenance Occupations
The most common Natural Resources, Construction and Maintenance occupations in Smith Mills are Installation, Maintenance & Repair (130 | 5.1%), and Construction & Extraction (111 | 4.3%).
Natural Resources, Construction and Maintenance Occupations by Sex
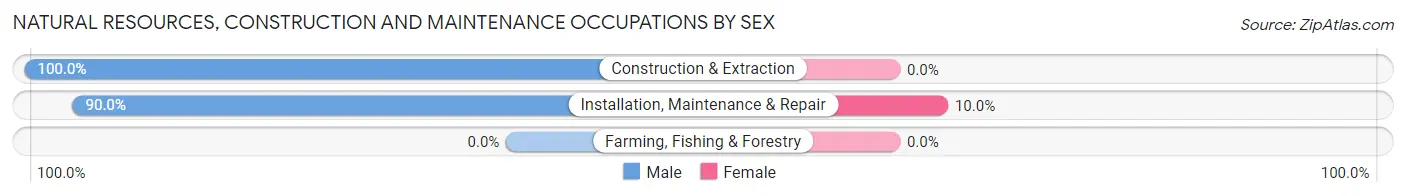
| Occupation | Male | Female |
| Farming, Fishing & Forestry | 0 (0.0%) | 0 (0.0%) |
| Construction & Extraction | 111 (100.0%) | 0 (0.0%) |
| Installation, Maintenance & Repair | 117 (90.0%) | 13 (10.0%) |
| Total (Category) | 228 (94.6%) | 13 (5.4%) |
| Total (Overall) | 1,323 (51.6%) | 1,242 (48.4%) |
Production, Transportation and Moving Occupations
The most common Production, Transportation and Moving occupations in Smith Mills are Transportation (155 | 6.0%), Production (105 | 4.1%), and Material Moving (54 | 2.1%).
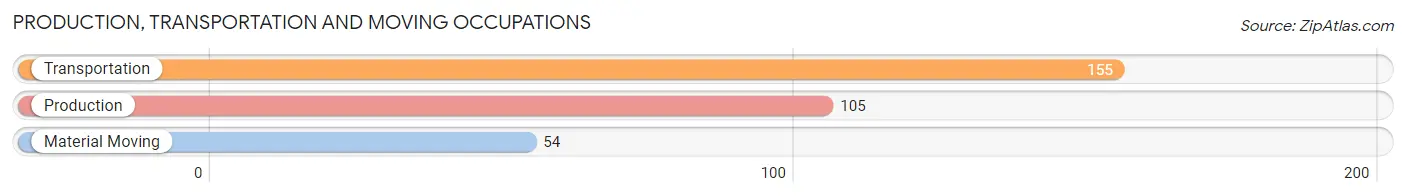
Production, Transportation and Moving Occupations by Sex
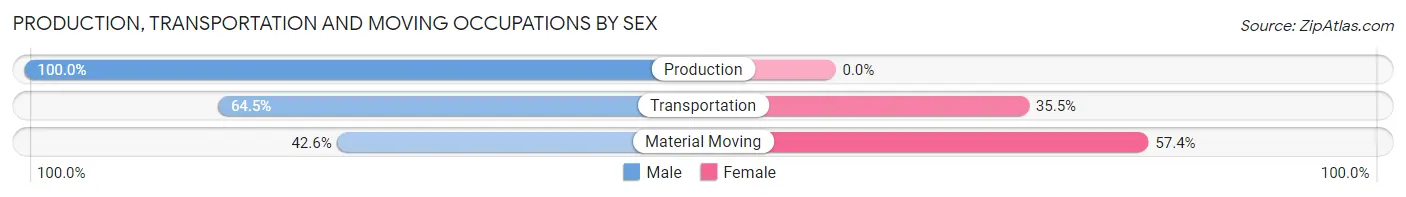
| Occupation | Male | Female |
| Production | 105 (100.0%) | 0 (0.0%) |
| Transportation | 100 (64.5%) | 55 (35.5%) |
| Material Moving | 23 (42.6%) | 31 (57.4%) |
| Total (Category) | 228 (72.6%) | 86 (27.4%) |
| Total (Overall) | 1,323 (51.6%) | 1,242 (48.4%) |
Employment Industries by Sex in Smith Mills
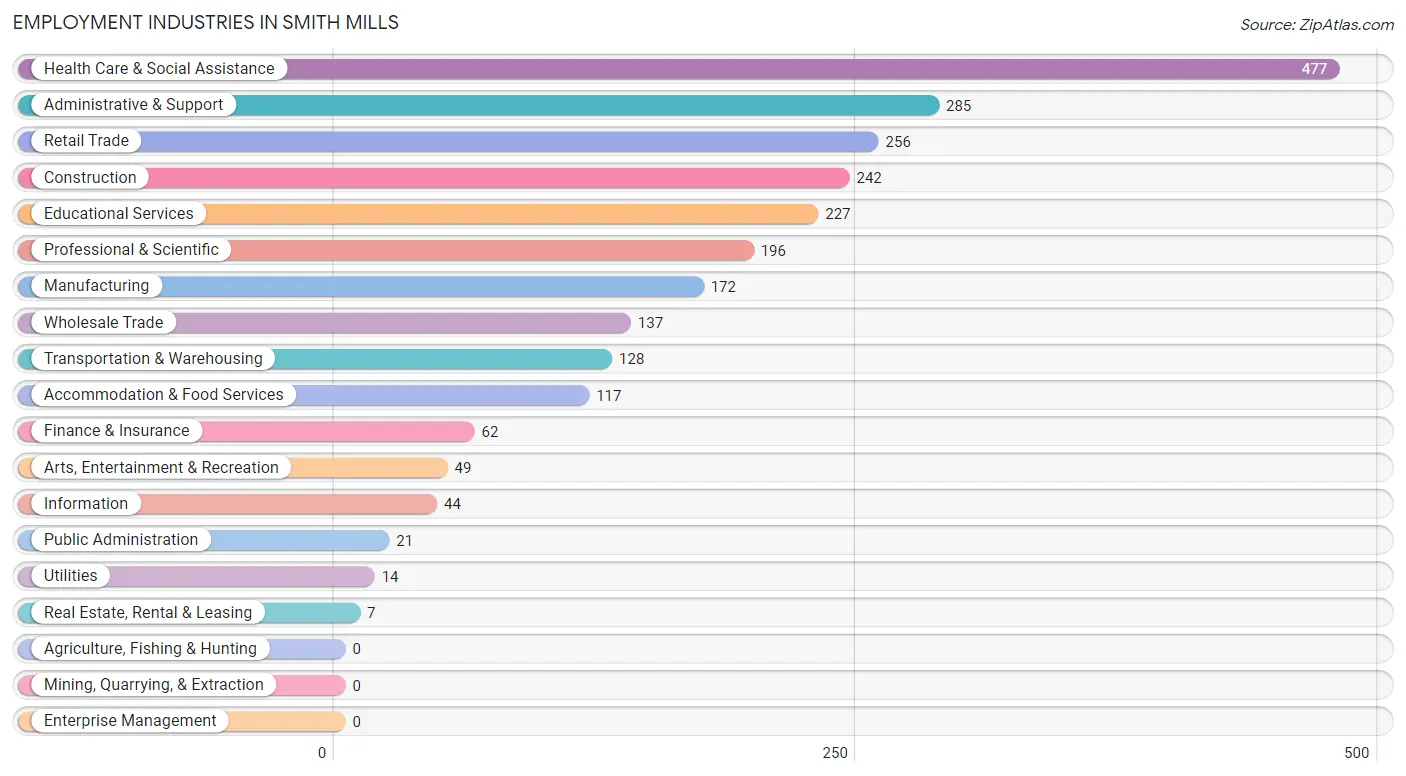
Employment Industries in Smith Mills
The major employment industries in Smith Mills include Health Care & Social Assistance (477 | 18.6%), Administrative & Support (285 | 11.1%), Retail Trade (256 | 10.0%), Construction (242 | 9.4%), and Educational Services (227 | 8.8%).
Employment Industries by Sex in Smith Mills
The Smith Mills industries that see more men than women are Manufacturing (100.0%), Utilities (100.0%), and Arts, Entertainment & Recreation (100.0%), whereas the industries that tend to have a higher number of women are Finance & Insurance (100.0%), Real Estate, Rental & Leasing (100.0%), and Health Care & Social Assistance (87.4%).
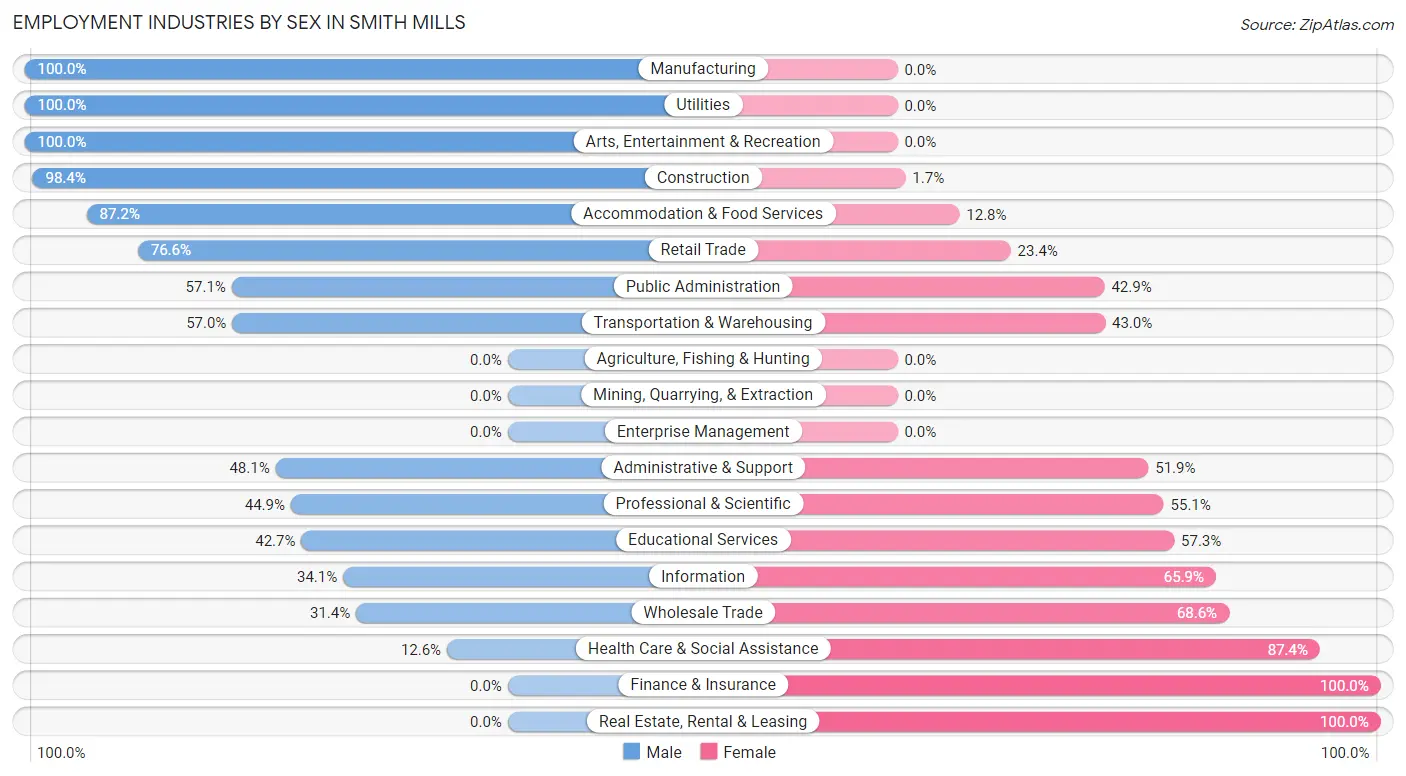
| Industry | Male | Female |
| Agriculture, Fishing & Hunting | 0 (0.0%) | 0 (0.0%) |
| Mining, Quarrying, & Extraction | 0 (0.0%) | 0 (0.0%) |
| Construction | 238 (98.4%) | 4 (1.7%) |
| Manufacturing | 172 (100.0%) | 0 (0.0%) |
| Wholesale Trade | 43 (31.4%) | 94 (68.6%) |
| Retail Trade | 196 (76.6%) | 60 (23.4%) |
| Transportation & Warehousing | 73 (57.0%) | 55 (43.0%) |
| Utilities | 14 (100.0%) | 0 (0.0%) |
| Information | 15 (34.1%) | 29 (65.9%) |
| Finance & Insurance | 0 (0.0%) | 62 (100.0%) |
| Real Estate, Rental & Leasing | 0 (0.0%) | 7 (100.0%) |
| Professional & Scientific | 88 (44.9%) | 108 (55.1%) |
| Enterprise Management | 0 (0.0%) | 0 (0.0%) |
| Administrative & Support | 137 (48.1%) | 148 (51.9%) |
| Educational Services | 97 (42.7%) | 130 (57.3%) |
| Health Care & Social Assistance | 60 (12.6%) | 417 (87.4%) |
| Arts, Entertainment & Recreation | 49 (100.0%) | 0 (0.0%) |
| Accommodation & Food Services | 102 (87.2%) | 15 (12.8%) |
| Public Administration | 12 (57.1%) | 9 (42.9%) |
| Total | 1,323 (51.6%) | 1,242 (48.4%) |
Education in Smith Mills
School Enrollment in Smith Mills
The most common levels of schooling among the 1,031 students in Smith Mills are high school (262 | 25.4%), middle school (235 | 22.8%), and college / undergraduate (195 | 18.9%).
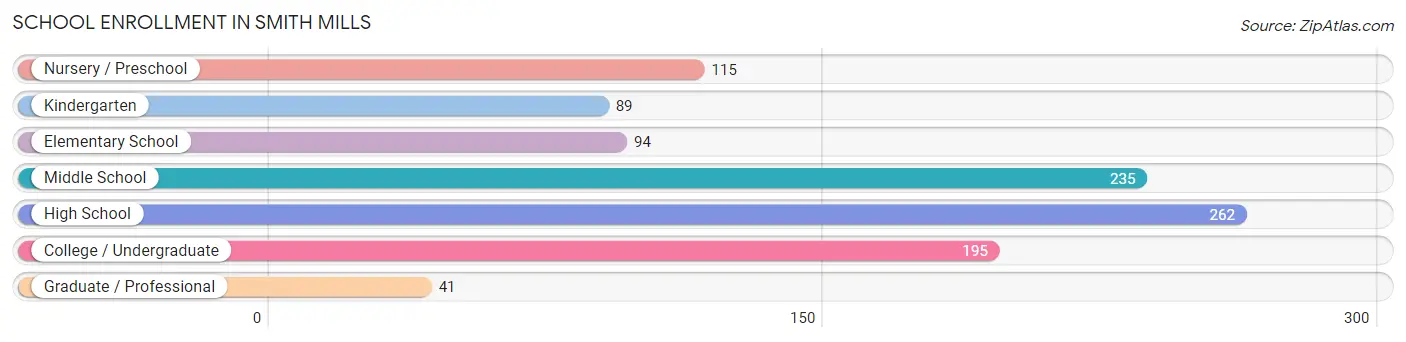
| School Level | # Students | % Students |
| Nursery / Preschool | 115 | 11.2% |
| Kindergarten | 89 | 8.6% |
| Elementary School | 94 | 9.1% |
| Middle School | 235 | 22.8% |
| High School | 262 | 25.4% |
| College / Undergraduate | 195 | 18.9% |
| Graduate / Professional | 41 | 4.0% |
| Total | 1,031 | 100.0% |
School Enrollment by Age by Funding Source in Smith Mills
Out of a total of 1,031 students who are enrolled in schools in Smith Mills, 132 (12.8%) attend a private institution, while the remaining 899 (87.2%) are enrolled in public schools. The age group of 20 to 24 year olds has the highest likelihood of being enrolled in private schools, with 70 (92.1% in the age bracket) enrolled. Conversely, the age group of 5 to 9 year old has the lowest likelihood of being enrolled in a private school, with 207 (100.0% in the age bracket) attending a public institution.
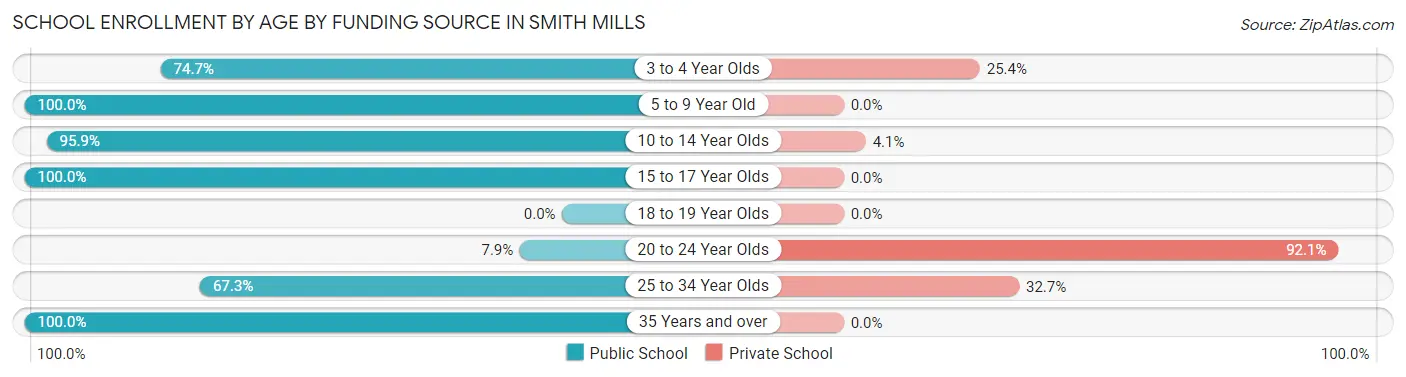
| Age Bracket | Public School | Private School |
| 3 to 4 Year Olds | 53 (74.7%) | 18 (25.4%) |
| 5 to 9 Year Old | 207 (100.0%) | 0 (0.0%) |
| 10 to 14 Year Olds | 257 (95.9%) | 11 (4.1%) |
| 15 to 17 Year Olds | 181 (100.0%) | 0 (0.0%) |
| 18 to 19 Year Olds | 0 (0.0%) | 0 (0.0%) |
| 20 to 24 Year Olds | 6 (7.9%) | 70 (92.1%) |
| 25 to 34 Year Olds | 68 (67.3%) | 33 (32.7%) |
| 35 Years and over | 127 (100.0%) | 0 (0.0%) |
| Total | 899 (87.2%) | 132 (12.8%) |
Educational Attainment by Field of Study in Smith Mills
Science & technology (162 | 14.8%), business (151 | 13.8%), education (148 | 13.5%), bio, nature & agricultural (146 | 13.4%), and social sciences (121 | 11.1%) are the most common fields of study among 1,094 individuals in Smith Mills who have obtained a bachelor's degree or higher.
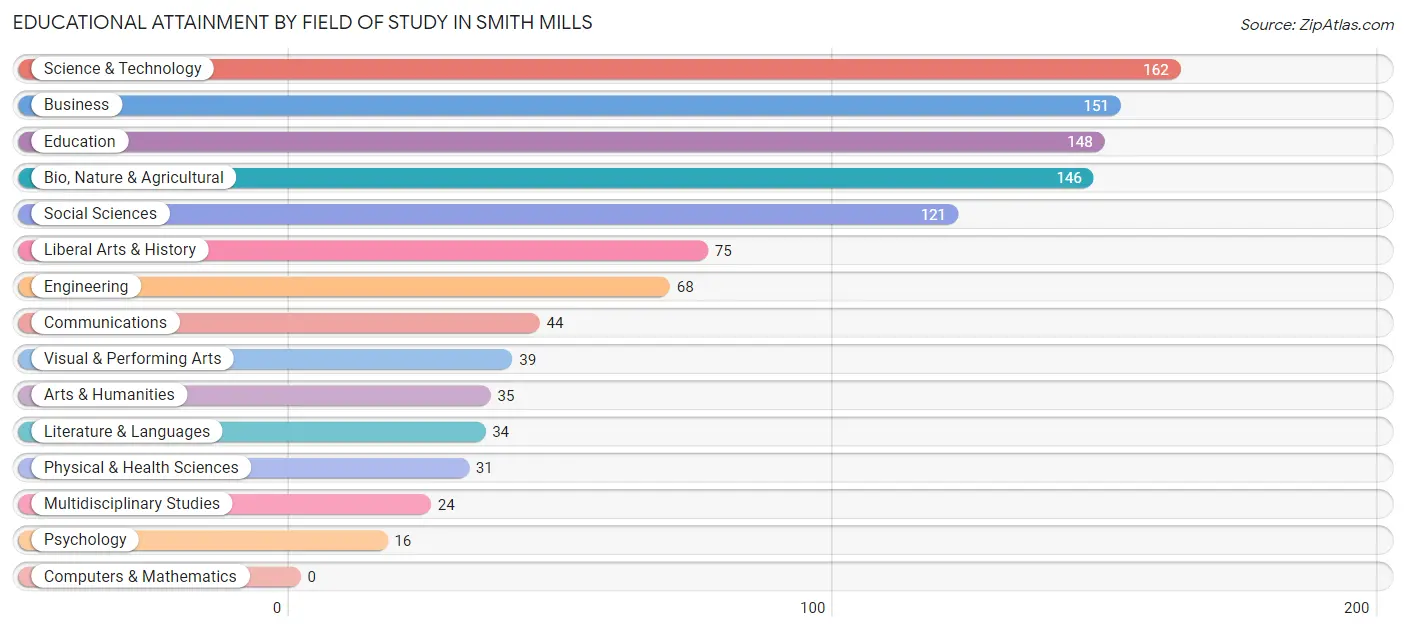
| Field of Study | # Graduates | % Graduates |
| Computers & Mathematics | 0 | 0.0% |
| Bio, Nature & Agricultural | 146 | 13.4% |
| Physical & Health Sciences | 31 | 2.8% |
| Psychology | 16 | 1.5% |
| Social Sciences | 121 | 11.1% |
| Engineering | 68 | 6.2% |
| Multidisciplinary Studies | 24 | 2.2% |
| Science & Technology | 162 | 14.8% |
| Business | 151 | 13.8% |
| Education | 148 | 13.5% |
| Literature & Languages | 34 | 3.1% |
| Liberal Arts & History | 75 | 6.9% |
| Visual & Performing Arts | 39 | 3.6% |
| Communications | 44 | 4.0% |
| Arts & Humanities | 35 | 3.2% |
| Total | 1,094 | 100.0% |
Transportation & Commute in Smith Mills
Vehicle Availability by Sex in Smith Mills
The most prevalent vehicle ownership categories in Smith Mills are males with 2 vehicles (576, accounting for 43.5%) and females with 2 vehicles (400, making up 48.6%).
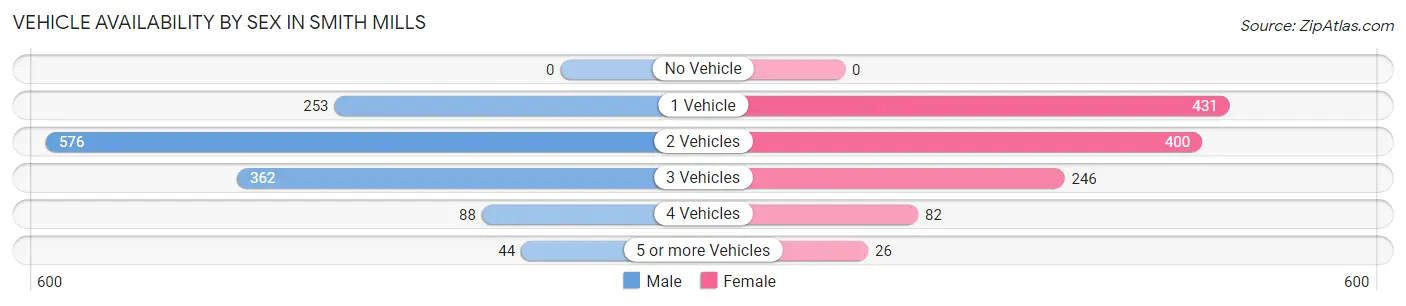
| Vehicles Available | Male | Female |
| No Vehicle | 0 (0.0%) | 0 (0.0%) |
| 1 Vehicle | 253 (19.1%) | 431 (36.4%) |
| 2 Vehicles | 576 (43.5%) | 400 (33.8%) |
| 3 Vehicles | 362 (27.4%) | 246 (20.8%) |
| 4 Vehicles | 88 (6.7%) | 82 (6.9%) |
| 5 or more Vehicles | 44 (3.3%) | 26 (2.2%) |
| Total | 1,323 (100.0%) | 1,185 (100.0%) |
Commute Time in Smith Mills
The most frequently occuring commute durations in Smith Mills are 30 to 34 minutes (380 commuters, 16.2%), 15 to 19 minutes (348 commuters, 14.9%), and 20 to 24 minutes (348 commuters, 14.9%).
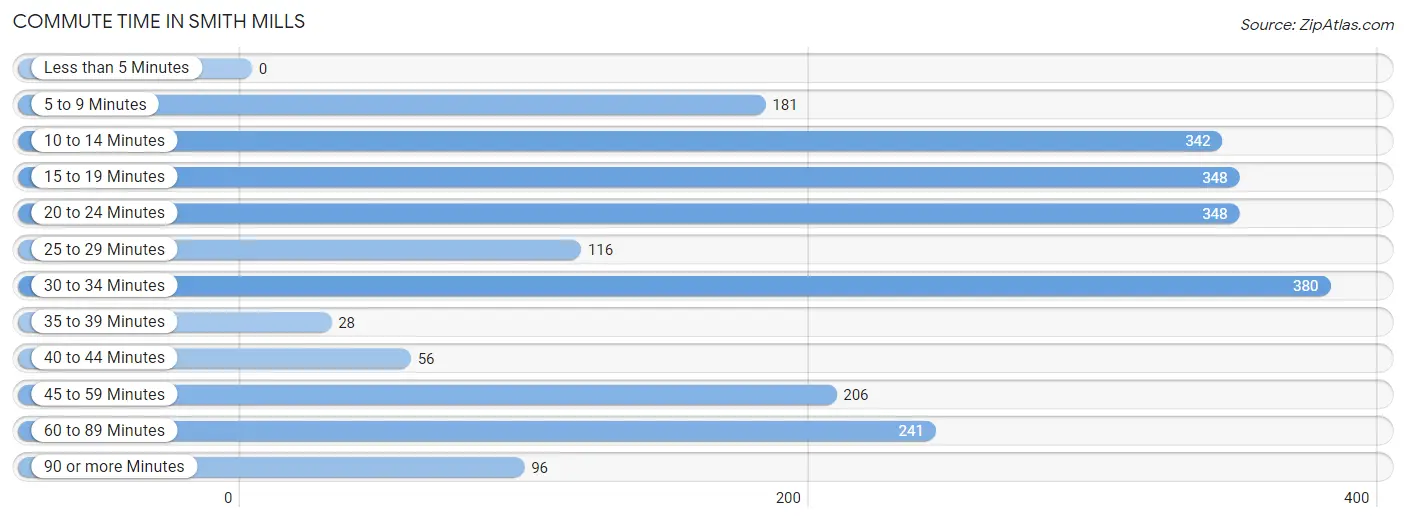
| Commute Time | # Commuters | % Commuters |
| Less than 5 Minutes | 0 | 0.0% |
| 5 to 9 Minutes | 181 | 7.7% |
| 10 to 14 Minutes | 342 | 14.6% |
| 15 to 19 Minutes | 348 | 14.9% |
| 20 to 24 Minutes | 348 | 14.9% |
| 25 to 29 Minutes | 116 | 5.0% |
| 30 to 34 Minutes | 380 | 16.2% |
| 35 to 39 Minutes | 28 | 1.2% |
| 40 to 44 Minutes | 56 | 2.4% |
| 45 to 59 Minutes | 206 | 8.8% |
| 60 to 89 Minutes | 241 | 10.3% |
| 90 or more Minutes | 96 | 4.1% |
Commute Time by Sex in Smith Mills
The most common commute times in Smith Mills are 30 to 34 minutes (246 commuters, 19.2%) for males and 10 to 14 minutes (255 commuters, 24.0%) for females.
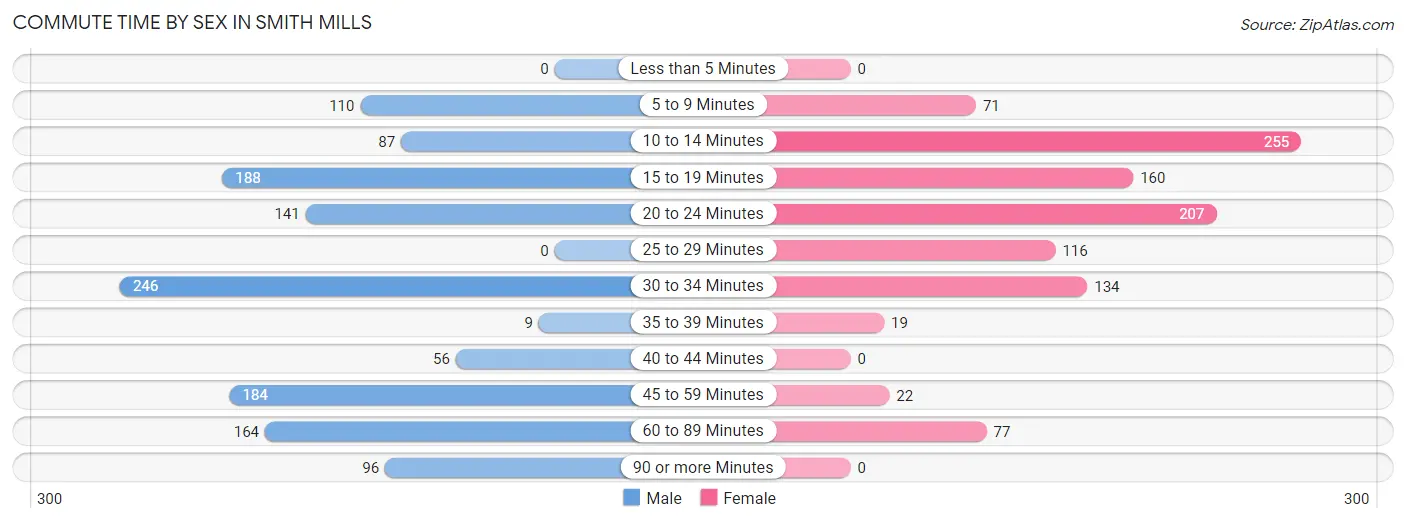
| Commute Time | Male | Female |
| Less than 5 Minutes | 0 (0.0%) | 0 (0.0%) |
| 5 to 9 Minutes | 110 (8.6%) | 71 (6.7%) |
| 10 to 14 Minutes | 87 (6.8%) | 255 (24.0%) |
| 15 to 19 Minutes | 188 (14.7%) | 160 (15.1%) |
| 20 to 24 Minutes | 141 (11.0%) | 207 (19.5%) |
| 25 to 29 Minutes | 0 (0.0%) | 116 (10.9%) |
| 30 to 34 Minutes | 246 (19.2%) | 134 (12.6%) |
| 35 to 39 Minutes | 9 (0.7%) | 19 (1.8%) |
| 40 to 44 Minutes | 56 (4.4%) | 0 (0.0%) |
| 45 to 59 Minutes | 184 (14.4%) | 22 (2.1%) |
| 60 to 89 Minutes | 164 (12.8%) | 77 (7.3%) |
| 90 or more Minutes | 96 (7.5%) | 0 (0.0%) |
Time of Departure to Work by Sex in Smith Mills
The most frequent times of departure to work in Smith Mills are 12:00 AM to 4:59 AM (301, 23.5%) for males and 8:00 AM to 8:29 AM (177, 16.7%) for females.
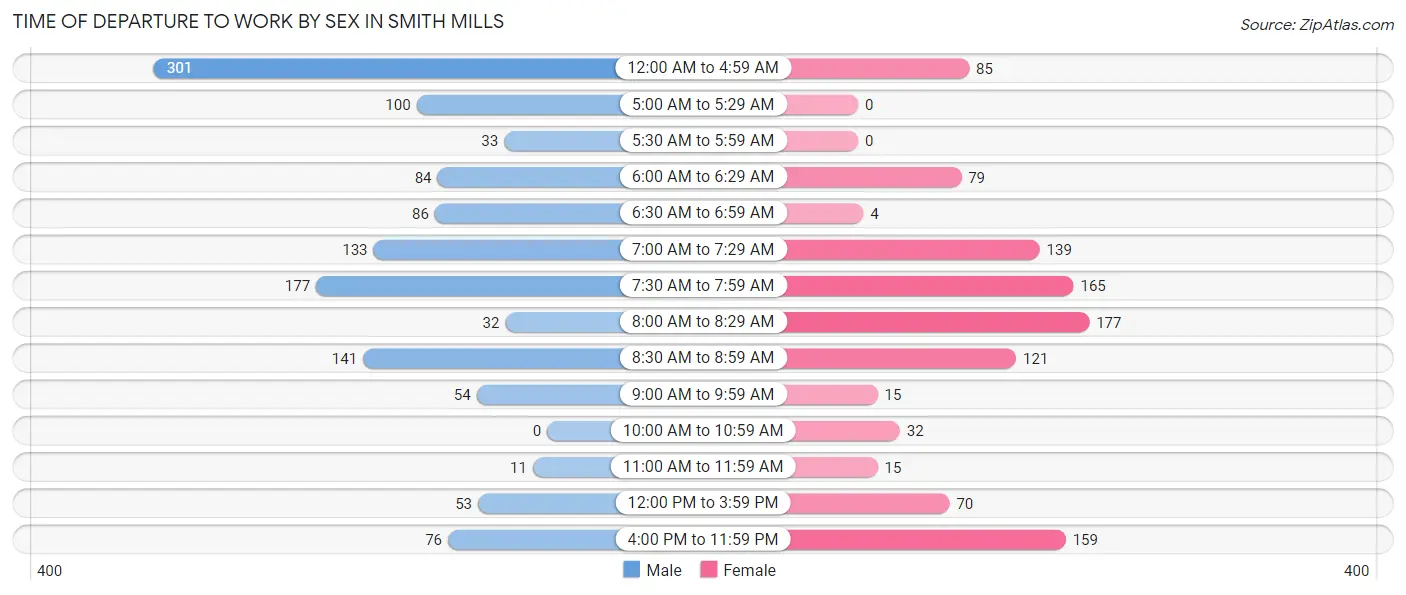
| Time of Departure | Male | Female |
| 12:00 AM to 4:59 AM | 301 (23.5%) | 85 (8.0%) |
| 5:00 AM to 5:29 AM | 100 (7.8%) | 0 (0.0%) |
| 5:30 AM to 5:59 AM | 33 (2.6%) | 0 (0.0%) |
| 6:00 AM to 6:29 AM | 84 (6.6%) | 79 (7.4%) |
| 6:30 AM to 6:59 AM | 86 (6.7%) | 4 (0.4%) |
| 7:00 AM to 7:29 AM | 133 (10.4%) | 139 (13.1%) |
| 7:30 AM to 7:59 AM | 177 (13.8%) | 165 (15.5%) |
| 8:00 AM to 8:29 AM | 32 (2.5%) | 177 (16.7%) |
| 8:30 AM to 8:59 AM | 141 (11.0%) | 121 (11.4%) |
| 9:00 AM to 9:59 AM | 54 (4.2%) | 15 (1.4%) |
| 10:00 AM to 10:59 AM | 0 (0.0%) | 32 (3.0%) |
| 11:00 AM to 11:59 AM | 11 (0.9%) | 15 (1.4%) |
| 12:00 PM to 3:59 PM | 53 (4.1%) | 70 (6.6%) |
| 4:00 PM to 11:59 PM | 76 (5.9%) | 159 (15.0%) |
| Total | 1,281 (100.0%) | 1,061 (100.0%) |
Housing Occupancy in Smith Mills
Occupancy by Ownership in Smith Mills
Of the total 1,984 dwellings in Smith Mills, owner-occupied units account for 1,444 (72.8%), while renter-occupied units make up 540 (27.2%).
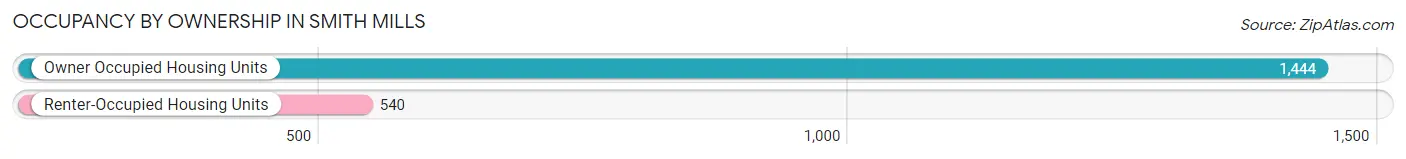
| Occupancy | # Housing Units | % Housing Units |
| Owner Occupied Housing Units | 1,444 | 72.8% |
| Renter-Occupied Housing Units | 540 | 27.2% |
| Total Occupied Housing Units | 1,984 | 100.0% |
Occupancy by Household Size in Smith Mills
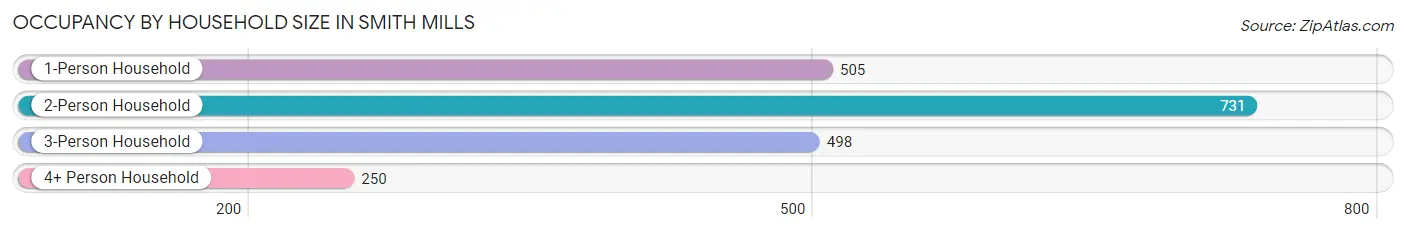
| Household Size | # Housing Units | % Housing Units |
| 1-Person Household | 505 | 25.5% |
| 2-Person Household | 731 | 36.8% |
| 3-Person Household | 498 | 25.1% |
| 4+ Person Household | 250 | 12.6% |
| Total Housing Units | 1,984 | 100.0% |
Occupancy by Ownership by Household Size in Smith Mills
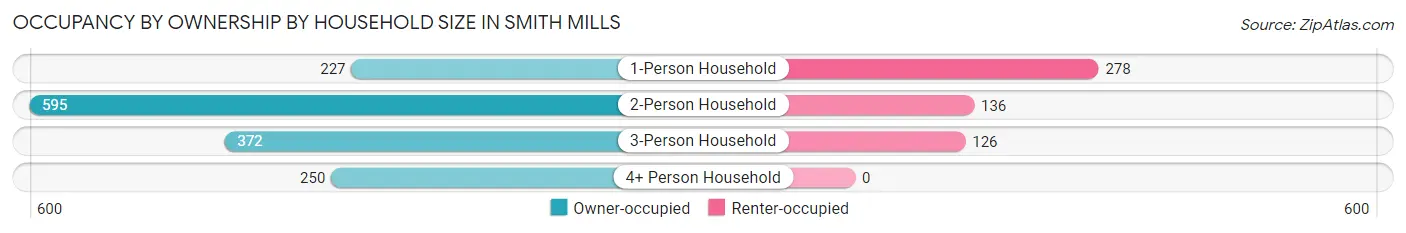
| Household Size | Owner-occupied | Renter-occupied |
| 1-Person Household | 227 (45.0%) | 278 (55.0%) |
| 2-Person Household | 595 (81.4%) | 136 (18.6%) |
| 3-Person Household | 372 (74.7%) | 126 (25.3%) |
| 4+ Person Household | 250 (100.0%) | 0 (0.0%) |
| Total Housing Units | 1,444 (72.8%) | 540 (27.2%) |
Occupancy by Educational Attainment in Smith Mills
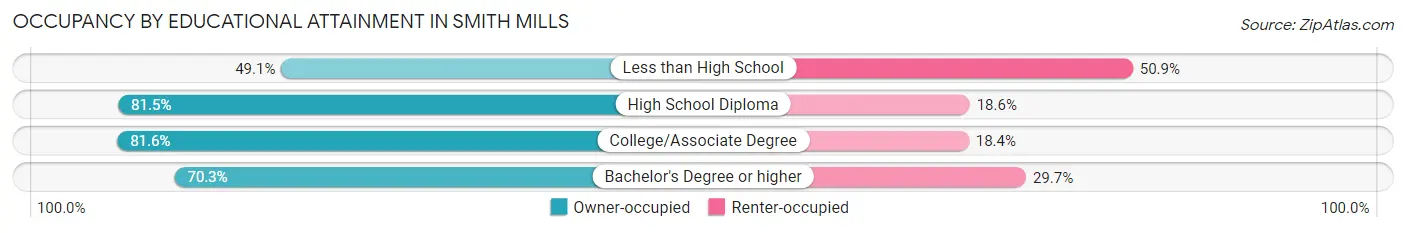
| Household Size | Owner-occupied | Renter-occupied |
| Less than High School | 168 (49.1%) | 174 (50.9%) |
| High School Diploma | 483 (81.5%) | 110 (18.5%) |
| College/Associate Degree | 400 (81.6%) | 90 (18.4%) |
| Bachelor's Degree or higher | 393 (70.3%) | 166 (29.7%) |
Occupancy by Age of Householder in Smith Mills
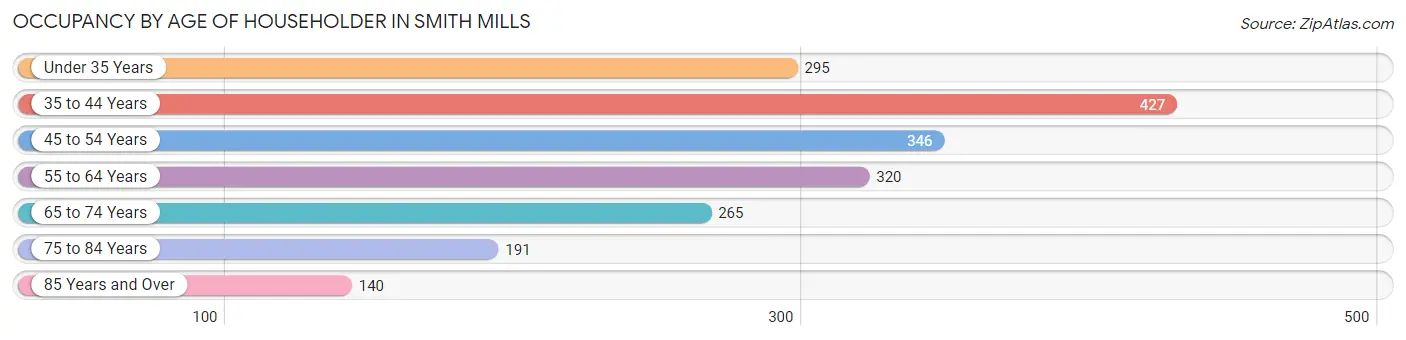
| Age Bracket | # Households | % Households |
| Under 35 Years | 295 | 14.9% |
| 35 to 44 Years | 427 | 21.5% |
| 45 to 54 Years | 346 | 17.4% |
| 55 to 64 Years | 320 | 16.1% |
| 65 to 74 Years | 265 | 13.4% |
| 75 to 84 Years | 191 | 9.6% |
| 85 Years and Over | 140 | 7.1% |
| Total | 1,984 | 100.0% |
Housing Finances in Smith Mills
Median Income by Occupancy in Smith Mills
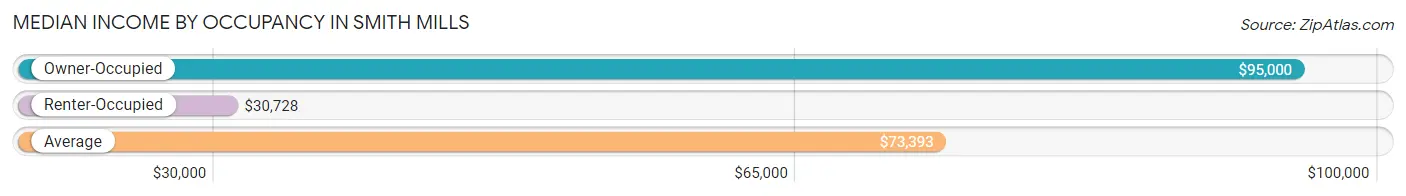
| Occupancy Type | # Households | Median Income |
| Owner-Occupied | 1,444 (72.8%) | $95,000 |
| Renter-Occupied | 540 (27.2%) | $30,728 |
| Average | 1,984 (100.0%) | $73,393 |
Occupancy by Householder Income Bracket in Smith Mills
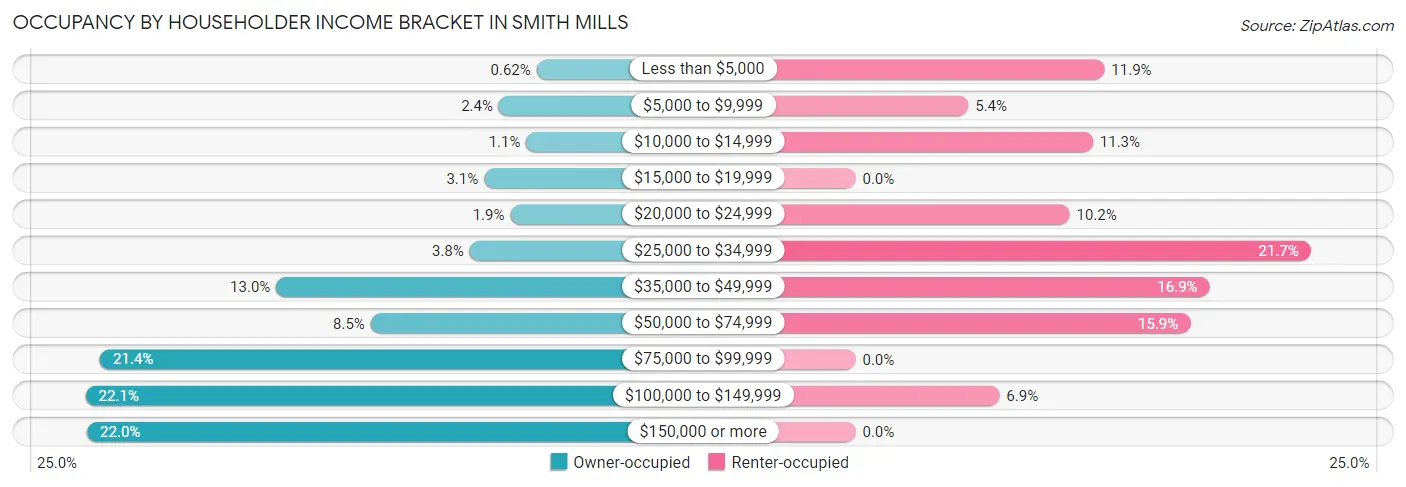
| Income Bracket | Owner-occupied | Renter-occupied |
| Less than $5,000 | 9 (0.6%) | 64 (11.8%) |
| $5,000 to $9,999 | 35 (2.4%) | 29 (5.4%) |
| $10,000 to $14,999 | 16 (1.1%) | 61 (11.3%) |
| $15,000 to $19,999 | 45 (3.1%) | 0 (0.0%) |
| $20,000 to $24,999 | 27 (1.9%) | 55 (10.2%) |
| $25,000 to $34,999 | 55 (3.8%) | 117 (21.7%) |
| $35,000 to $49,999 | 188 (13.0%) | 91 (16.9%) |
| $50,000 to $74,999 | 123 (8.5%) | 86 (15.9%) |
| $75,000 to $99,999 | 309 (21.4%) | 0 (0.0%) |
| $100,000 to $149,999 | 319 (22.1%) | 37 (6.9%) |
| $150,000 or more | 318 (22.0%) | 0 (0.0%) |
| Total | 1,444 (100.0%) | 540 (100.0%) |
Monthly Housing Cost Tiers in Smith Mills
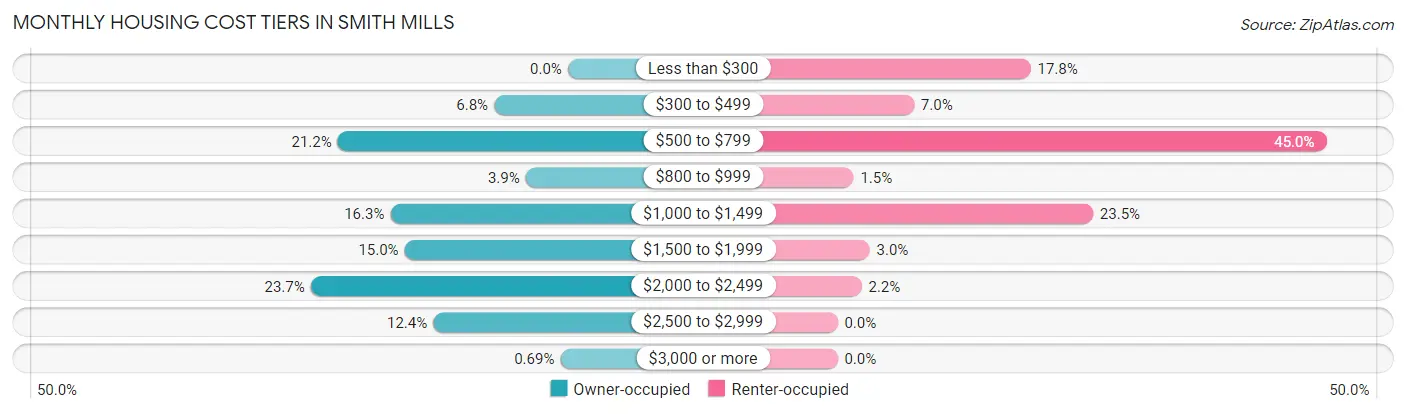
| Monthly Cost | Owner-occupied | Renter-occupied |
| Less than $300 | 0 (0.0%) | 96 (17.8%) |
| $300 to $499 | 98 (6.8%) | 38 (7.0%) |
| $500 to $799 | 306 (21.2%) | 243 (45.0%) |
| $800 to $999 | 56 (3.9%) | 8 (1.5%) |
| $1,000 to $1,499 | 236 (16.3%) | 127 (23.5%) |
| $1,500 to $1,999 | 217 (15.0%) | 16 (3.0%) |
| $2,000 to $2,499 | 342 (23.7%) | 12 (2.2%) |
| $2,500 to $2,999 | 179 (12.4%) | 0 (0.0%) |
| $3,000 or more | 10 (0.7%) | 0 (0.0%) |
| Total | 1,444 (100.0%) | 540 (100.0%) |
Physical Housing Characteristics in Smith Mills
Housing Structures in Smith Mills
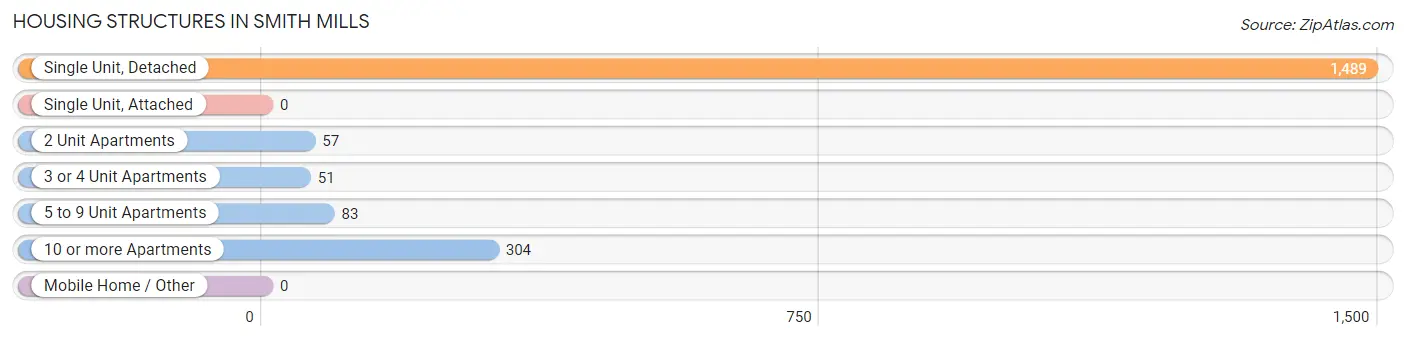
| Structure Type | # Housing Units | % Housing Units |
| Single Unit, Detached | 1,489 | 75.0% |
| Single Unit, Attached | 0 | 0.0% |
| 2 Unit Apartments | 57 | 2.9% |
| 3 or 4 Unit Apartments | 51 | 2.6% |
| 5 to 9 Unit Apartments | 83 | 4.2% |
| 10 or more Apartments | 304 | 15.3% |
| Mobile Home / Other | 0 | 0.0% |
| Total | 1,984 | 100.0% |
Housing Structures by Occupancy in Smith Mills
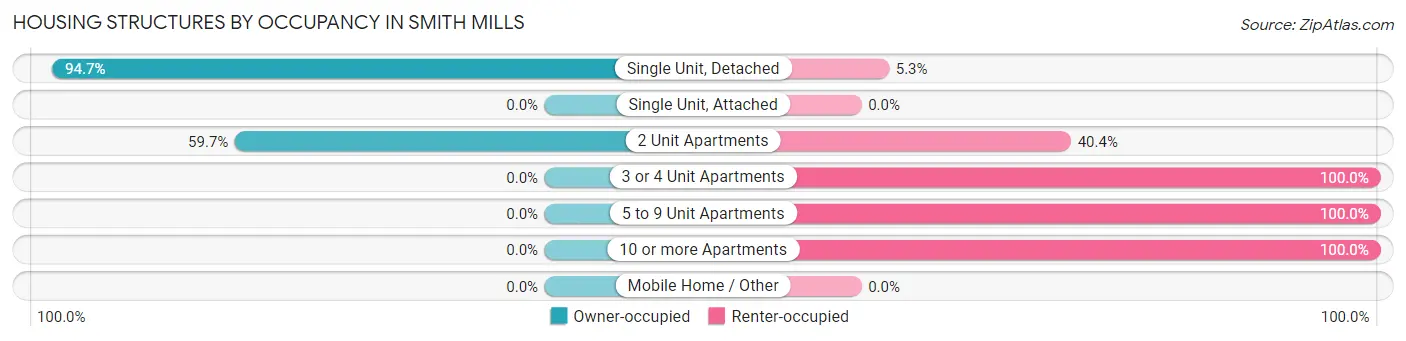
| Structure Type | Owner-occupied | Renter-occupied |
| Single Unit, Detached | 1,410 (94.7%) | 79 (5.3%) |
| Single Unit, Attached | 0 (0.0%) | 0 (0.0%) |
| 2 Unit Apartments | 34 (59.7%) | 23 (40.4%) |
| 3 or 4 Unit Apartments | 0 (0.0%) | 51 (100.0%) |
| 5 to 9 Unit Apartments | 0 (0.0%) | 83 (100.0%) |
| 10 or more Apartments | 0 (0.0%) | 304 (100.0%) |
| Mobile Home / Other | 0 (0.0%) | 0 (0.0%) |
| Total | 1,444 (72.8%) | 540 (27.2%) |
Housing Structures by Number of Rooms in Smith Mills
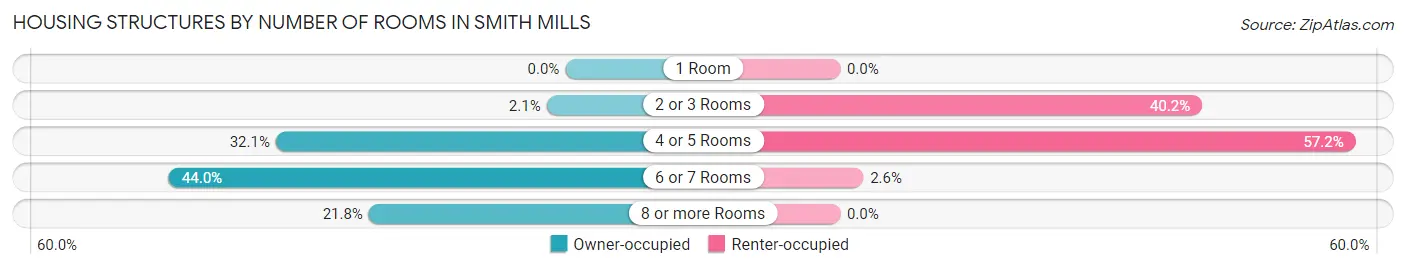
| Number of Rooms | Owner-occupied | Renter-occupied |
| 1 Room | 0 (0.0%) | 0 (0.0%) |
| 2 or 3 Rooms | 30 (2.1%) | 217 (40.2%) |
| 4 or 5 Rooms | 464 (32.1%) | 309 (57.2%) |
| 6 or 7 Rooms | 635 (44.0%) | 14 (2.6%) |
| 8 or more Rooms | 315 (21.8%) | 0 (0.0%) |
| Total | 1,444 (100.0%) | 540 (100.0%) |
Housing Structure by Heating Type in Smith Mills
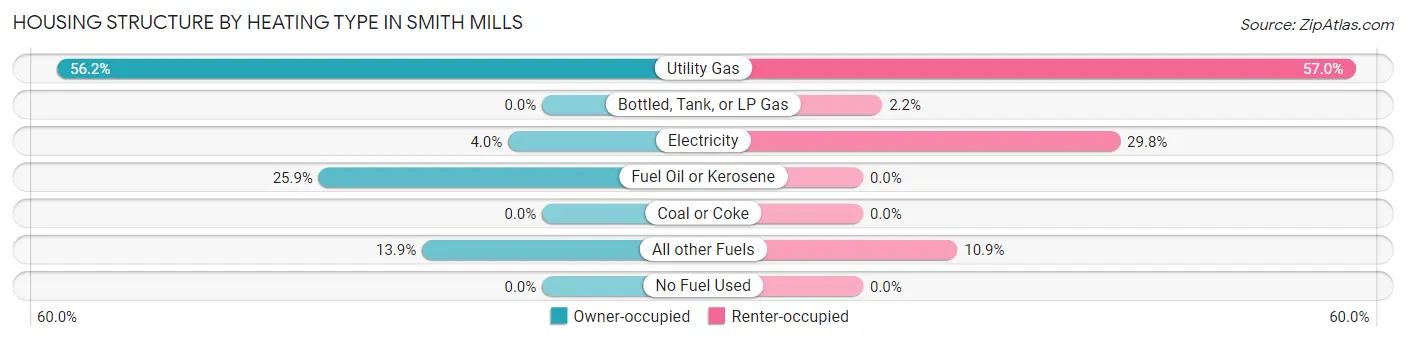
| Heating Type | Owner-occupied | Renter-occupied |
| Utility Gas | 812 (56.2%) | 308 (57.0%) |
| Bottled, Tank, or LP Gas | 0 (0.0%) | 12 (2.2%) |
| Electricity | 57 (4.0%) | 161 (29.8%) |
| Fuel Oil or Kerosene | 374 (25.9%) | 0 (0.0%) |
| Coal or Coke | 0 (0.0%) | 0 (0.0%) |
| All other Fuels | 201 (13.9%) | 59 (10.9%) |
| No Fuel Used | 0 (0.0%) | 0 (0.0%) |
| Total | 1,444 (100.0%) | 540 (100.0%) |
Household Vehicle Usage in Smith Mills
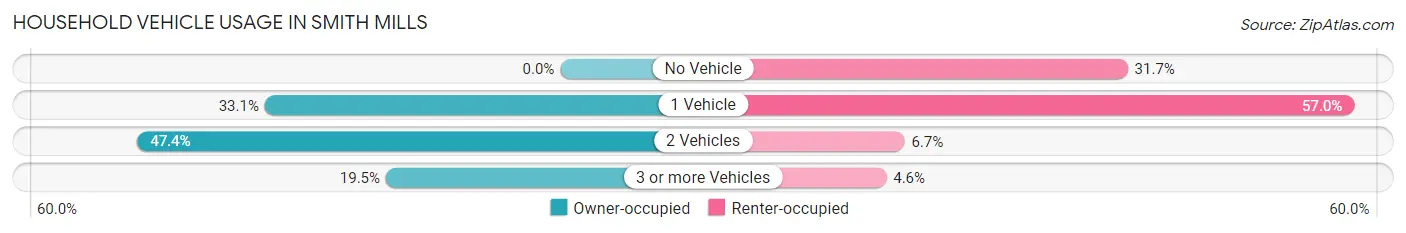
| Vehicles per Household | Owner-occupied | Renter-occupied |
| No Vehicle | 0 (0.0%) | 171 (31.7%) |
| 1 Vehicle | 478 (33.1%) | 308 (57.0%) |
| 2 Vehicles | 684 (47.4%) | 36 (6.7%) |
| 3 or more Vehicles | 282 (19.5%) | 25 (4.6%) |
| Total | 1,444 (100.0%) | 540 (100.0%) |
Real Estate & Mortgages in Smith Mills
Real Estate and Mortgage Overview in Smith Mills
| Characteristic | Without Mortgage | With Mortgage |
| Housing Units | 500 | 944 |
| Median Property Value | $302,800 | $355,600 |
| Median Household Income | $53,362 | $253 |
| Monthly Housing Costs | $659 | $10 |
| Real Estate Taxes | $3,517 | $0 |
Property Value by Mortgage Status in Smith Mills
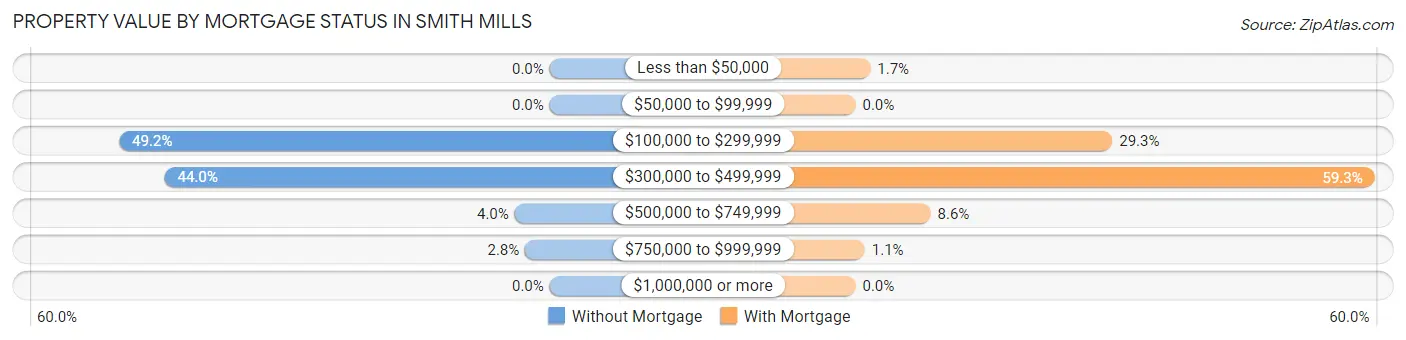
| Property Value | Without Mortgage | With Mortgage |
| Less than $50,000 | 0 (0.0%) | 16 (1.7%) |
| $50,000 to $99,999 | 0 (0.0%) | 0 (0.0%) |
| $100,000 to $299,999 | 246 (49.2%) | 277 (29.3%) |
| $300,000 to $499,999 | 220 (44.0%) | 560 (59.3%) |
| $500,000 to $749,999 | 20 (4.0%) | 81 (8.6%) |
| $750,000 to $999,999 | 14 (2.8%) | 10 (1.1%) |
| $1,000,000 or more | 0 (0.0%) | 0 (0.0%) |
| Total | 500 (100.0%) | 944 (100.0%) |
Household Income by Mortgage Status in Smith Mills
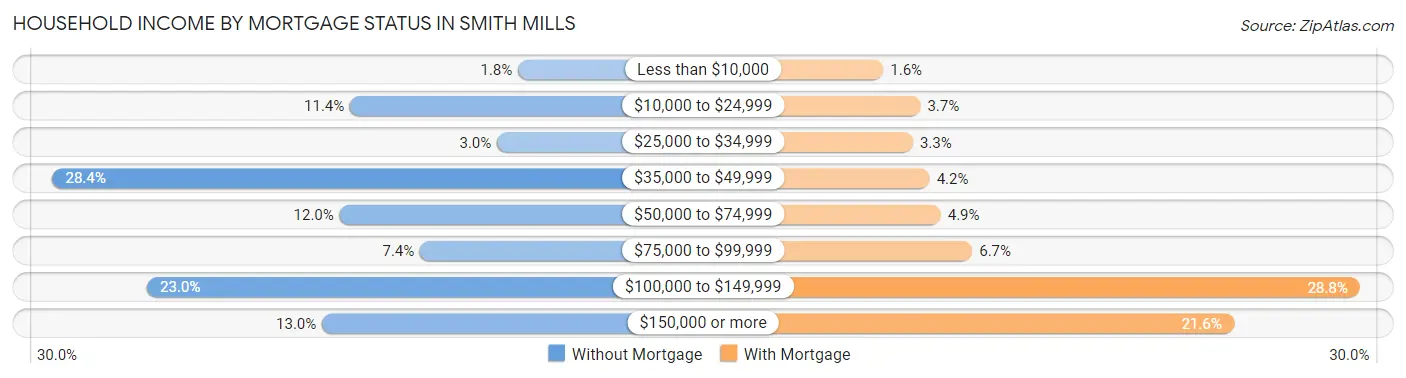
| Household Income | Without Mortgage | With Mortgage |
| Less than $10,000 | 9 (1.8%) | 15 (1.6%) |
| $10,000 to $24,999 | 57 (11.4%) | 35 (3.7%) |
| $25,000 to $34,999 | 15 (3.0%) | 31 (3.3%) |
| $35,000 to $49,999 | 142 (28.4%) | 40 (4.2%) |
| $50,000 to $74,999 | 60 (12.0%) | 46 (4.9%) |
| $75,000 to $99,999 | 37 (7.4%) | 63 (6.7%) |
| $100,000 to $149,999 | 115 (23.0%) | 272 (28.8%) |
| $150,000 or more | 65 (13.0%) | 204 (21.6%) |
| Total | 500 (100.0%) | 944 (100.0%) |
Property Value to Household Income Ratio in Smith Mills
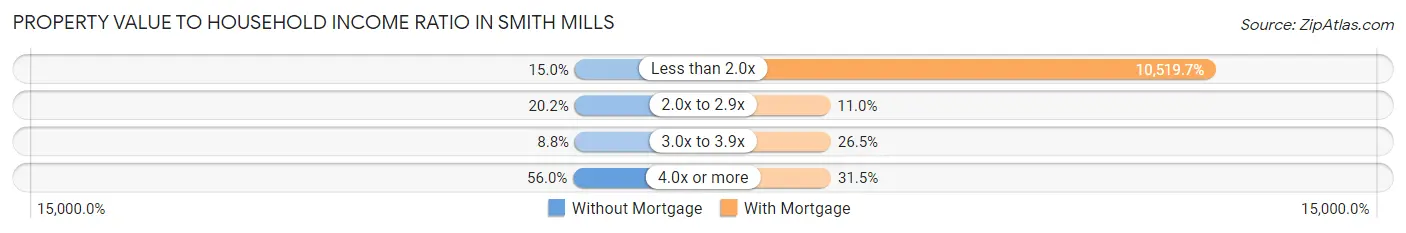
| Value-to-Income Ratio | Without Mortgage | With Mortgage |
| Less than 2.0x | 75 (15.0%) | 99,306 (10,519.7%) |
| 2.0x to 2.9x | 101 (20.2%) | 104 (11.0%) |
| 3.0x to 3.9x | 44 (8.8%) | 250 (26.5%) |
| 4.0x or more | 280 (56.0%) | 297 (31.5%) |
| Total | 500 (100.0%) | 944 (100.0%) |
Real Estate Taxes by Mortgage Status in Smith Mills
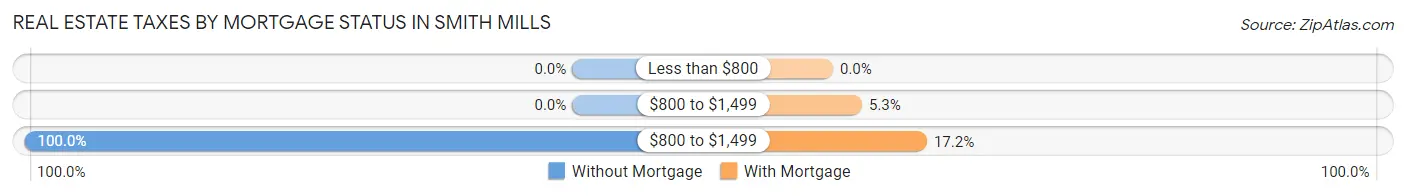
| Property Taxes | Without Mortgage | With Mortgage |
| Less than $800 | 0 (0.0%) | 0 (0.0%) |
| $800 to $1,499 | 0 (0.0%) | 50 (5.3%) |
| $800 to $1,499 | 500 (100.0%) | 162 (17.2%) |
| Total | 500 (100.0%) | 944 (100.0%) |
Health & Disability in Smith Mills
Health Insurance Coverage by Age in Smith Mills
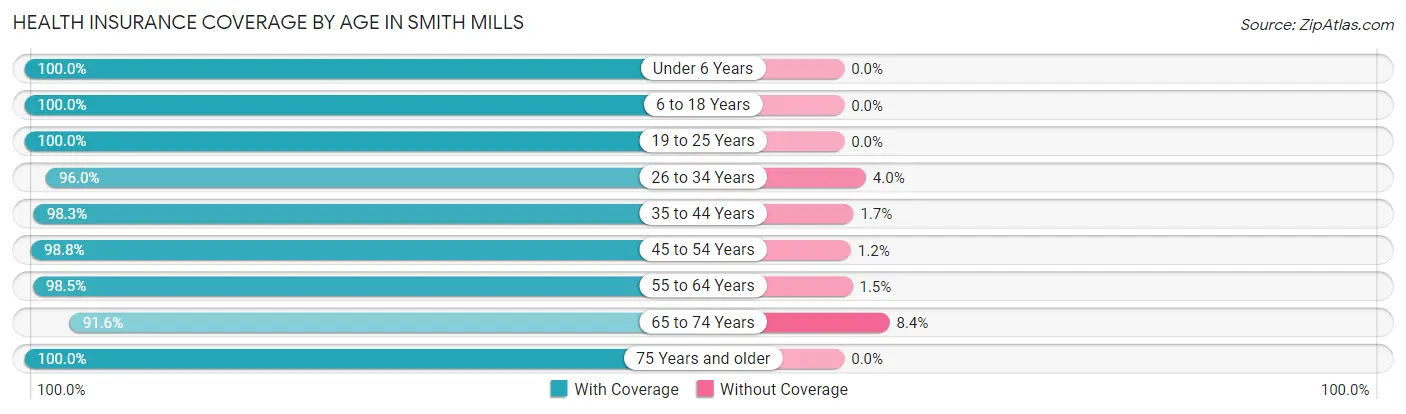
| Age Bracket | With Coverage | Without Coverage |
| Under 6 Years | 265 (100.0%) | 0 (0.0%) |
| 6 to 18 Years | 559 (100.0%) | 0 (0.0%) |
| 19 to 25 Years | 284 (100.0%) | 0 (0.0%) |
| 26 to 34 Years | 595 (96.0%) | 25 (4.0%) |
| 35 to 44 Years | 744 (98.3%) | 13 (1.7%) |
| 45 to 54 Years | 640 (98.8%) | 8 (1.2%) |
| 55 to 64 Years | 575 (98.5%) | 9 (1.5%) |
| 65 to 74 Years | 358 (91.6%) | 33 (8.4%) |
| 75 Years and older | 448 (100.0%) | 0 (0.0%) |
| Total | 4,468 (98.1%) | 88 (1.9%) |
Health Insurance Coverage by Citizenship Status in Smith Mills
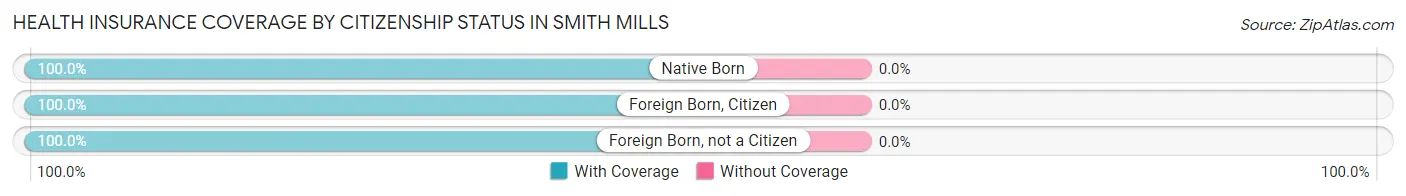
| Citizenship Status | With Coverage | Without Coverage |
| Native Born | 265 (100.0%) | 0 (0.0%) |
| Foreign Born, Citizen | 559 (100.0%) | 0 (0.0%) |
| Foreign Born, not a Citizen | 284 (100.0%) | 0 (0.0%) |
Health Insurance Coverage by Household Income in Smith Mills
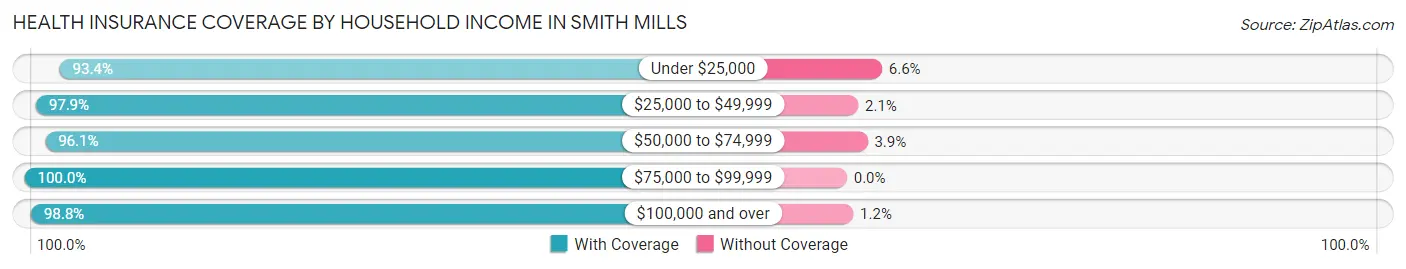
| Household Income | With Coverage | Without Coverage |
| Under $25,000 | 469 (93.4%) | 33 (6.6%) |
| $25,000 to $49,999 | 786 (97.9%) | 17 (2.1%) |
| $50,000 to $74,999 | 323 (96.1%) | 13 (3.9%) |
| $75,000 to $99,999 | 789 (100.0%) | 0 (0.0%) |
| $100,000 and over | 2,071 (98.8%) | 25 (1.2%) |
Public vs Private Health Insurance Coverage by Age in Smith Mills
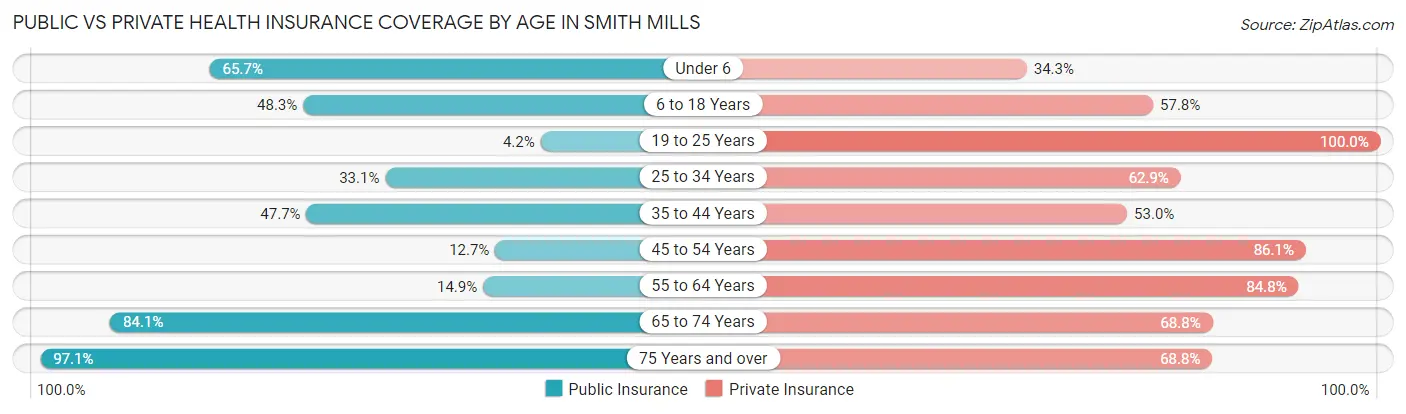
| Age Bracket | Public Insurance | Private Insurance |
| Under 6 | 174 (65.7%) | 91 (34.3%) |
| 6 to 18 Years | 270 (48.3%) | 323 (57.8%) |
| 19 to 25 Years | 12 (4.2%) | 284 (100.0%) |
| 25 to 34 Years | 205 (33.1%) | 390 (62.9%) |
| 35 to 44 Years | 361 (47.7%) | 401 (53.0%) |
| 45 to 54 Years | 82 (12.7%) | 558 (86.1%) |
| 55 to 64 Years | 87 (14.9%) | 495 (84.8%) |
| 65 to 74 Years | 329 (84.1%) | 269 (68.8%) |
| 75 Years and over | 435 (97.1%) | 308 (68.8%) |
| Total | 1,955 (42.9%) | 3,119 (68.5%) |
Disability Status by Sex by Age in Smith Mills
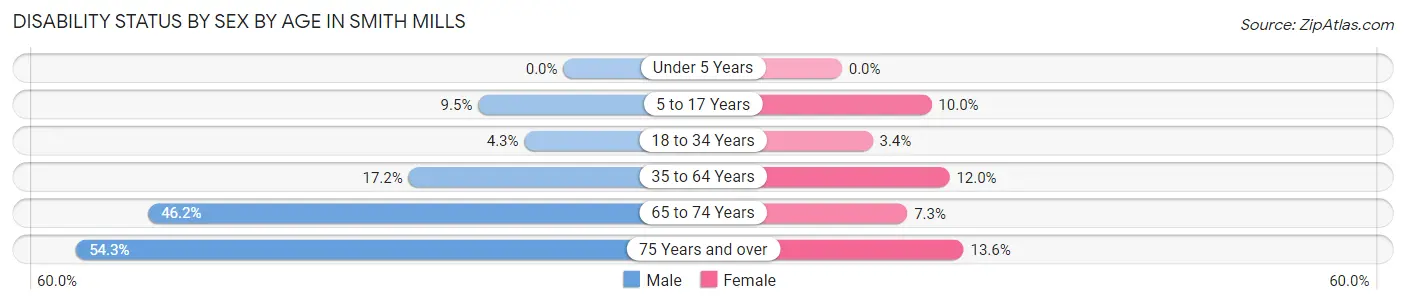
| Age Bracket | Male | Female |
| Under 5 Years | 0 (0.0%) | 0 (0.0%) |
| 5 to 17 Years | 20 (9.5%) | 48 (10.0%) |
| 18 to 34 Years | 24 (4.3%) | 12 (3.4%) |
| 35 to 64 Years | 156 (17.2%) | 130 (12.0%) |
| 65 to 74 Years | 92 (46.2%) | 14 (7.3%) |
| 75 Years and over | 115 (54.2%) | 32 (13.6%) |
Disability Class by Sex by Age in Smith Mills
Disability Class: Hearing Difficulty
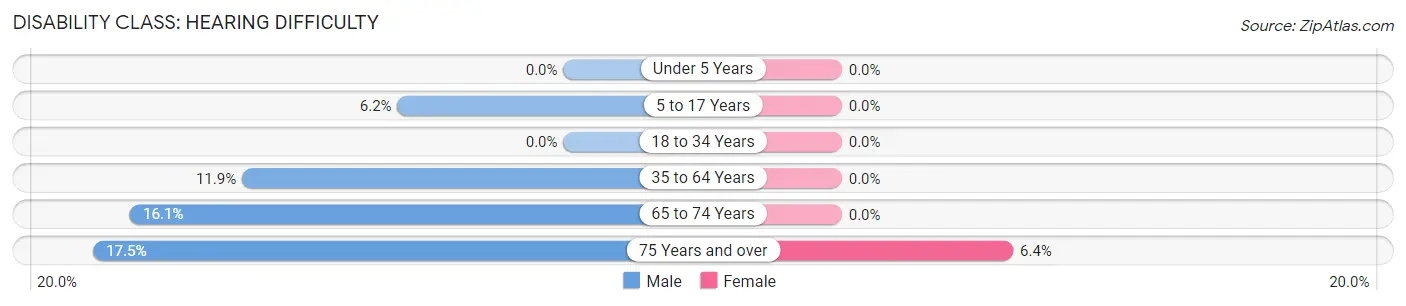
| Age Bracket | Male | Female |
| Under 5 Years | 0 (0.0%) | 0 (0.0%) |
| 5 to 17 Years | 13 (6.2%) | 0 (0.0%) |
| 18 to 34 Years | 0 (0.0%) | 0 (0.0%) |
| 35 to 64 Years | 108 (11.9%) | 0 (0.0%) |
| 65 to 74 Years | 32 (16.1%) | 0 (0.0%) |
| 75 Years and over | 37 (17.4%) | 15 (6.4%) |
Disability Class: Vision Difficulty
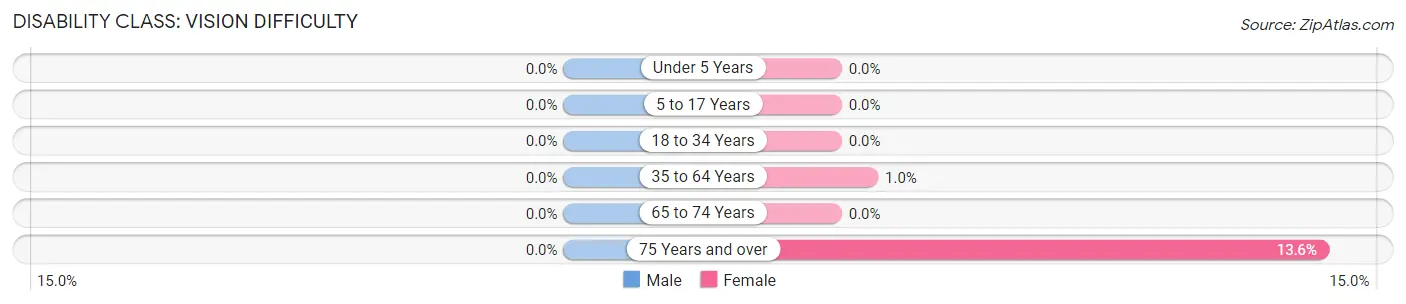
| Age Bracket | Male | Female |
| Under 5 Years | 0 (0.0%) | 0 (0.0%) |
| 5 to 17 Years | 0 (0.0%) | 0 (0.0%) |
| 18 to 34 Years | 0 (0.0%) | 0 (0.0%) |
| 35 to 64 Years | 0 (0.0%) | 11 (1.0%) |
| 65 to 74 Years | 0 (0.0%) | 0 (0.0%) |
| 75 Years and over | 0 (0.0%) | 32 (13.6%) |
Disability Class: Cognitive Difficulty
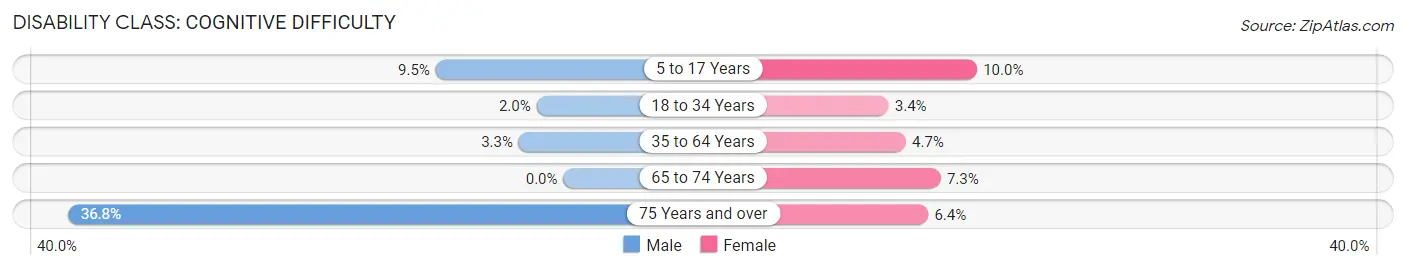
| Age Bracket | Male | Female |
| 5 to 17 Years | 20 (9.5%) | 48 (10.0%) |
| 18 to 34 Years | 11 (2.0%) | 12 (3.4%) |
| 35 to 64 Years | 30 (3.3%) | 51 (4.7%) |
| 65 to 74 Years | 0 (0.0%) | 14 (7.3%) |
| 75 Years and over | 78 (36.8%) | 15 (6.4%) |
Disability Class: Ambulatory Difficulty
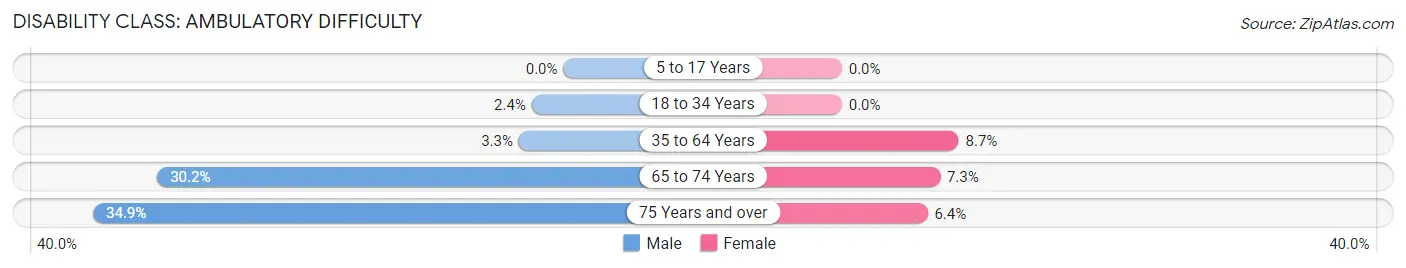
| Age Bracket | Male | Female |
| 5 to 17 Years | 0 (0.0%) | 0 (0.0%) |
| 18 to 34 Years | 13 (2.4%) | 0 (0.0%) |
| 35 to 64 Years | 30 (3.3%) | 94 (8.7%) |
| 65 to 74 Years | 60 (30.1%) | 14 (7.3%) |
| 75 Years and over | 74 (34.9%) | 15 (6.4%) |
Disability Class: Self-Care Difficulty
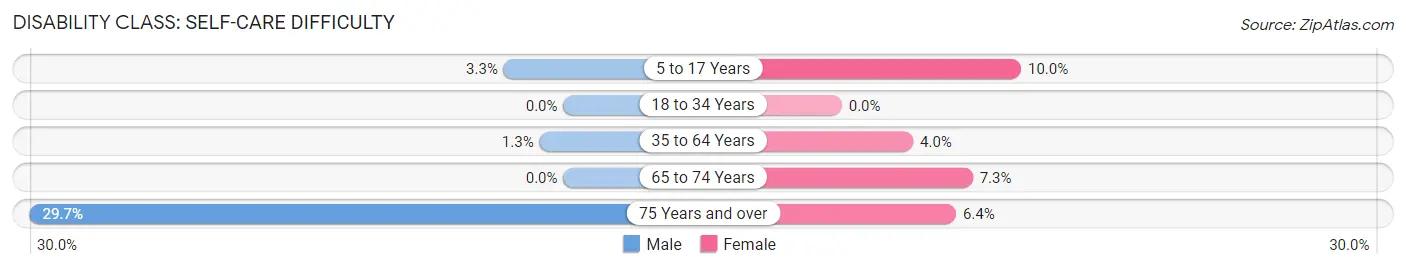
| Age Bracket | Male | Female |
| 5 to 17 Years | 7 (3.3%) | 48 (10.0%) |
| 18 to 34 Years | 0 (0.0%) | 0 (0.0%) |
| 35 to 64 Years | 12 (1.3%) | 43 (4.0%) |
| 65 to 74 Years | 0 (0.0%) | 14 (7.3%) |
| 75 Years and over | 63 (29.7%) | 15 (6.4%) |
Technology Access in Smith Mills
Computing Device Access in Smith Mills
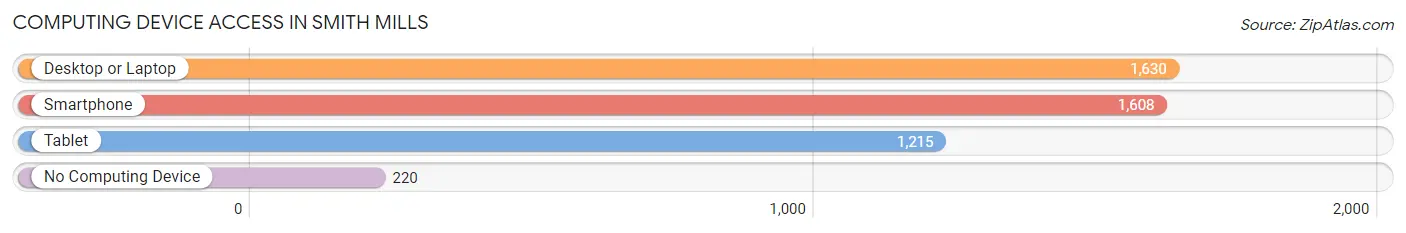
| Device Type | # Households | % Households |
| Desktop or Laptop | 1,630 | 82.2% |
| Smartphone | 1,608 | 81.0% |
| Tablet | 1,215 | 61.2% |
| No Computing Device | 220 | 11.1% |
| Total | 1,984 | 100.0% |
Internet Access in Smith Mills
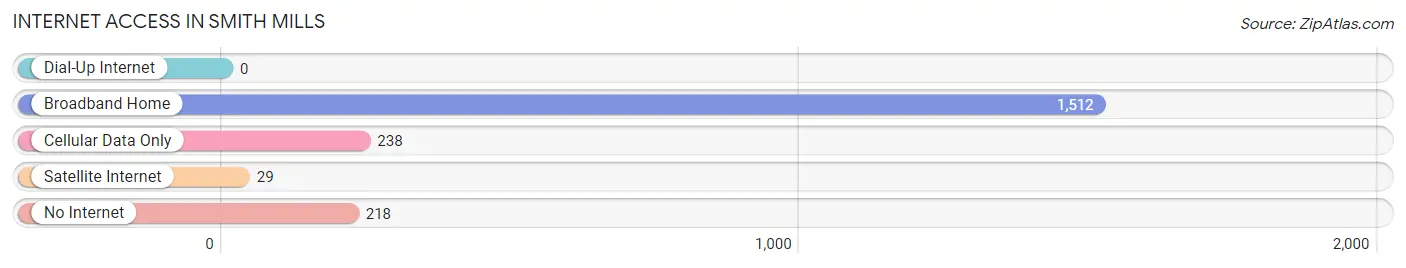
| Internet Type | # Households | % Households |
| Dial-Up Internet | 0 | 0.0% |
| Broadband Home | 1,512 | 76.2% |
| Cellular Data Only | 238 | 12.0% |
| Satellite Internet | 29 | 1.5% |
| No Internet | 218 | 11.0% |
| Total | 1,984 | 100.0% |
Smith Mills Summary
History
Smith Mills is a small town located in the southeastern corner of Massachusetts. It is situated in the town of Dartmouth, which is part of Bristol County. The town was first settled in 1664 and was originally known as Smith’s Mills. The town was named after the Smith family, who were among the first settlers in the area. The town was officially incorporated in 1787.
The town of Smith Mills has a long and rich history. During the Revolutionary War, the town was a major supplier of food and supplies to the Continental Army. The town was also home to a number of prominent figures in the Revolutionary War, including General William Heath and Colonel Joseph Warren.
In the 19th century, Smith Mills was a major center of the whaling industry. The town was home to several whaling ships, which sailed around the world in search of whales. The town was also home to a number of shipbuilding companies, which built ships for the whaling industry.
In the 20th century, Smith Mills became a popular tourist destination. The town was home to a number of popular attractions, including the Smith Mills Lighthouse, which was built in 1872. The town was also home to a number of popular beaches, which attracted visitors from all over the region.
Geography
Smith Mills is located in the southeastern corner of Massachusetts. The town is situated in the town of Dartmouth, which is part of Bristol County. The town is bordered by the towns of Westport, Fairhaven, and Acushnet. The town is located on the eastern shore of Buzzards Bay, which is part of the Atlantic Ocean.
The town of Smith Mills covers an area of approximately 4.2 square miles. The town is mostly flat, with some rolling hills in the northern part of the town. The town is home to a number of small ponds and streams, which are fed by the nearby rivers and streams.
The climate in Smith Mills is generally mild, with temperatures ranging from the low 30s in the winter to the mid-80s in the summer. The town receives an average of 45 inches of precipitation per year.
Economy
The economy of Smith Mills is largely based on tourism and fishing. The town is home to a number of popular tourist attractions, including the Smith Mills Lighthouse and the beaches along Buzzards Bay. The town is also home to a number of fishing boats, which sail out of the harbor in search of fish.
The town is also home to a number of small businesses, including restaurants, shops, and other services. The town is also home to a number of manufacturing companies, which produce a variety of products, including furniture, clothing, and electronics.
Demographics
As of the 2010 census, the town of Smith Mills had a population of 2,845 people. The population is largely white, with a small percentage of African Americans, Hispanics, and Asians. The median household income in the town is $50,000, and the median home value is $250,000.
The town of Smith Mills is served by the Dartmouth Public Schools, which includes four elementary schools, one middle school, and one high school. The town is also home to a number of private schools, including the Smith Mills Academy and the Smith Mills Christian Academy.
Conclusion
Smith Mills is a small town located in the southeastern corner of Massachusetts. The town has a long and rich history, and it was once a major center of the whaling industry. Today, the town is largely based on tourism and fishing, and it is home to a number of popular attractions. The town is also home to a number of small businesses, and the population is largely white. The town is served by the Dartmouth Public Schools, and it is home to a number of private schools.
Common Questions
What is Per Capita Income in Smith Mills?
Per Capita income in Smith Mills is $38,277.
What is the Median Family Income in Smith Mills?
Median Family Income in Smith Mills is $94,713.
What is the Median Household income in Smith Mills?
Median Household Income in Smith Mills is $73,393.
What is Income or Wage Gap in Smith Mills?
Income or Wage Gap in Smith Mills is 32.9%.
Women in Smith Mills earn 67.1 cents for every dollar earned by a man.
What is Inequality or Gini Index in Smith Mills?
Inequality or Gini Index in Smith Mills is 0.42.
What is the Total Population of Smith Mills?
Total Population of Smith Mills is 4,556.
What is the Total Male Population of Smith Mills?
Total Male Population of Smith Mills is 2,113.
What is the Total Female Population of Smith Mills?
Total Female Population of Smith Mills is 2,443.
What is the Ratio of Males per 100 Females in Smith Mills?
There are 86.49 Males per 100 Females in Smith Mills.
What is the Ratio of Females per 100 Males in Smith Mills?
There are 115.62 Females per 100 Males in Smith Mills.
What is the Median Population Age in Smith Mills?
Median Population Age in Smith Mills is 42.8 Years.
What is the Average Family Size in Smith Mills
Average Family Size in Smith Mills is 2.7 People.
What is the Average Household Size in Smith Mills
Average Household Size in Smith Mills is 2.3 People.
How Large is the Labor Force in Smith Mills?
There are 2,626 People in the Labor Forcein in Smith Mills.
What is the Percentage of People in the Labor Force in Smith Mills?
69.3% of People are in the Labor Force in Smith Mills.
What is the Unemployment Rate in Smith Mills?
Unemployment Rate in Smith Mills is 2.4%.