Zip Codes with the Highest Percentage of Population Employed in Administrative & Support Services in Lowell, MA
RELATED REPORTS & OPTIONS
Administrative & Support Services
Lowell
Compare Zip Codes
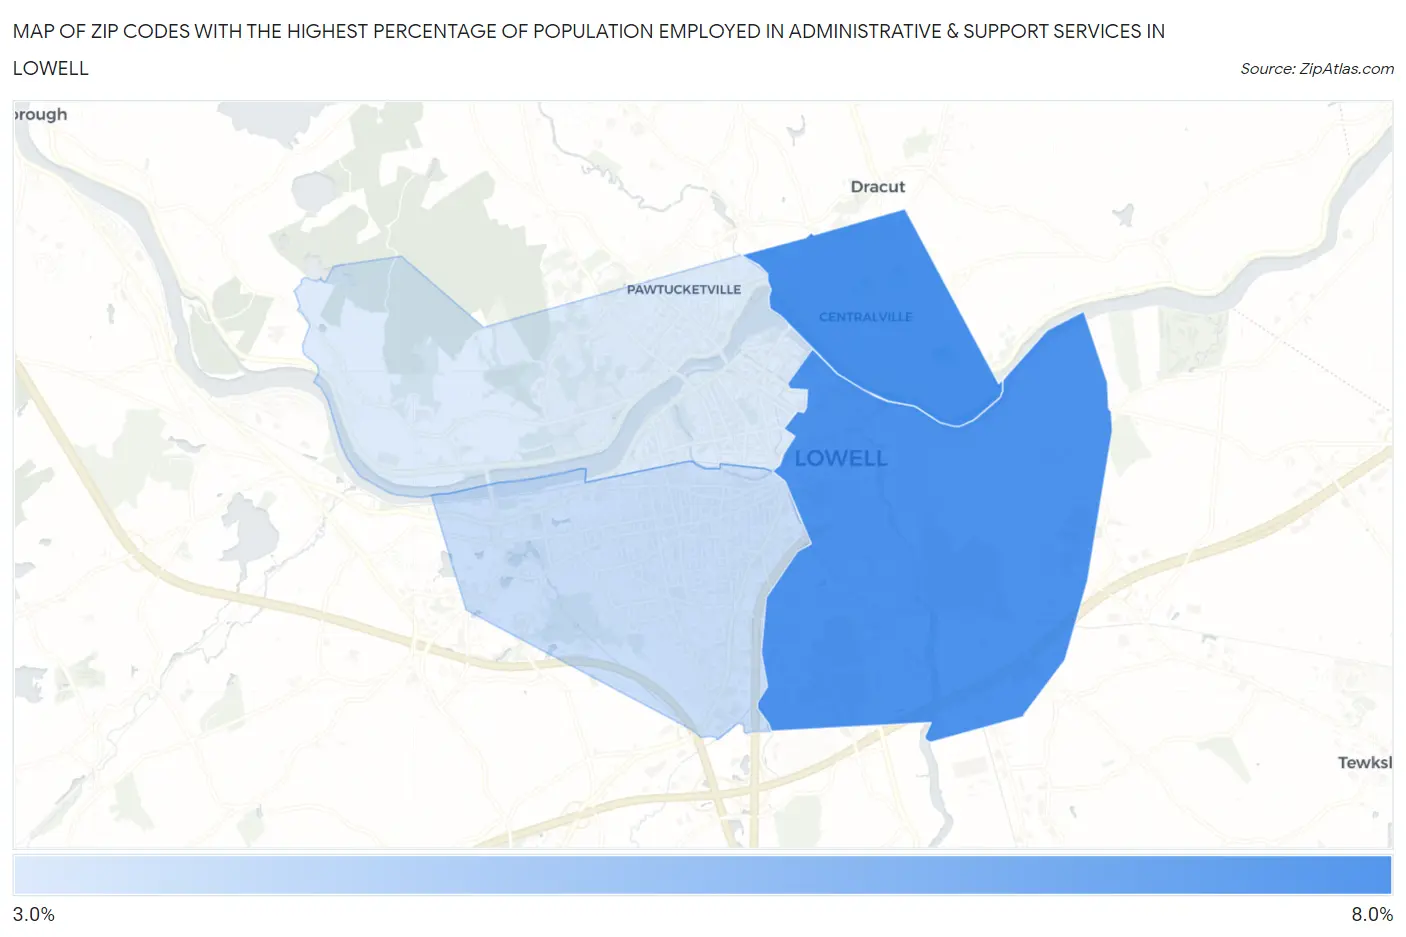
Map of Zip Codes with the Highest Percentage of Population Employed in Administrative & Support Services in Lowell
3.6%
6.5%
Zip Codes with the Highest Percentage of Population Employed in Administrative & Support Services in Lowell, MA
| Zip Code | % Employed | vs State | vs National | |
| 1. | 01850 | 6.5% | 3.6%(+2.81)#43 | 4.1%(+2.31)#3,975 |
| 2. | 01852 | 6.4% | 3.6%(+2.73)#47 | 4.1%(+2.23)#4,115 |
| 3. | 01851 | 4.0% | 3.6%(+0.329)#162 | 4.1%(-0.176)#10,807 |
| 4. | 01854 | 3.6% | 3.6%(-0.089)#209 | 4.1%(-0.594)#12,684 |
1
Common Questions
What are the Top 3 Zip Codes with the Highest Percentage of Population Employed in Administrative & Support Services in Lowell, MA?
Top 3 Zip Codes with the Highest Percentage of Population Employed in Administrative & Support Services in Lowell, MA are:
What zip code has the Highest Percentage of Population Employed in Administrative & Support Services in Lowell, MA?
01850 has the Highest Percentage of Population Employed in Administrative & Support Services in Lowell, MA with 6.5%.
What is the Percentage of Population Employed in Administrative & Support Services in Lowell, MA?
Percentage of Population Employed in Administrative & Support Services in Lowell is 5.0%.
What is the Percentage of Population Employed in Administrative & Support Services in Massachusetts?
Percentage of Population Employed in Administrative & Support Services in Massachusetts is 3.6%.
What is the Percentage of Population Employed in Administrative & Support Services in the United States?
Percentage of Population Employed in Administrative & Support Services in the United States is 4.1%.