Zip Codes with the Highest Percentage of Population Employed in Administrative & Support Services in Des Plaines, IL
RELATED REPORTS & OPTIONS
Administrative & Support Services
Des Plaines
Compare Zip Codes
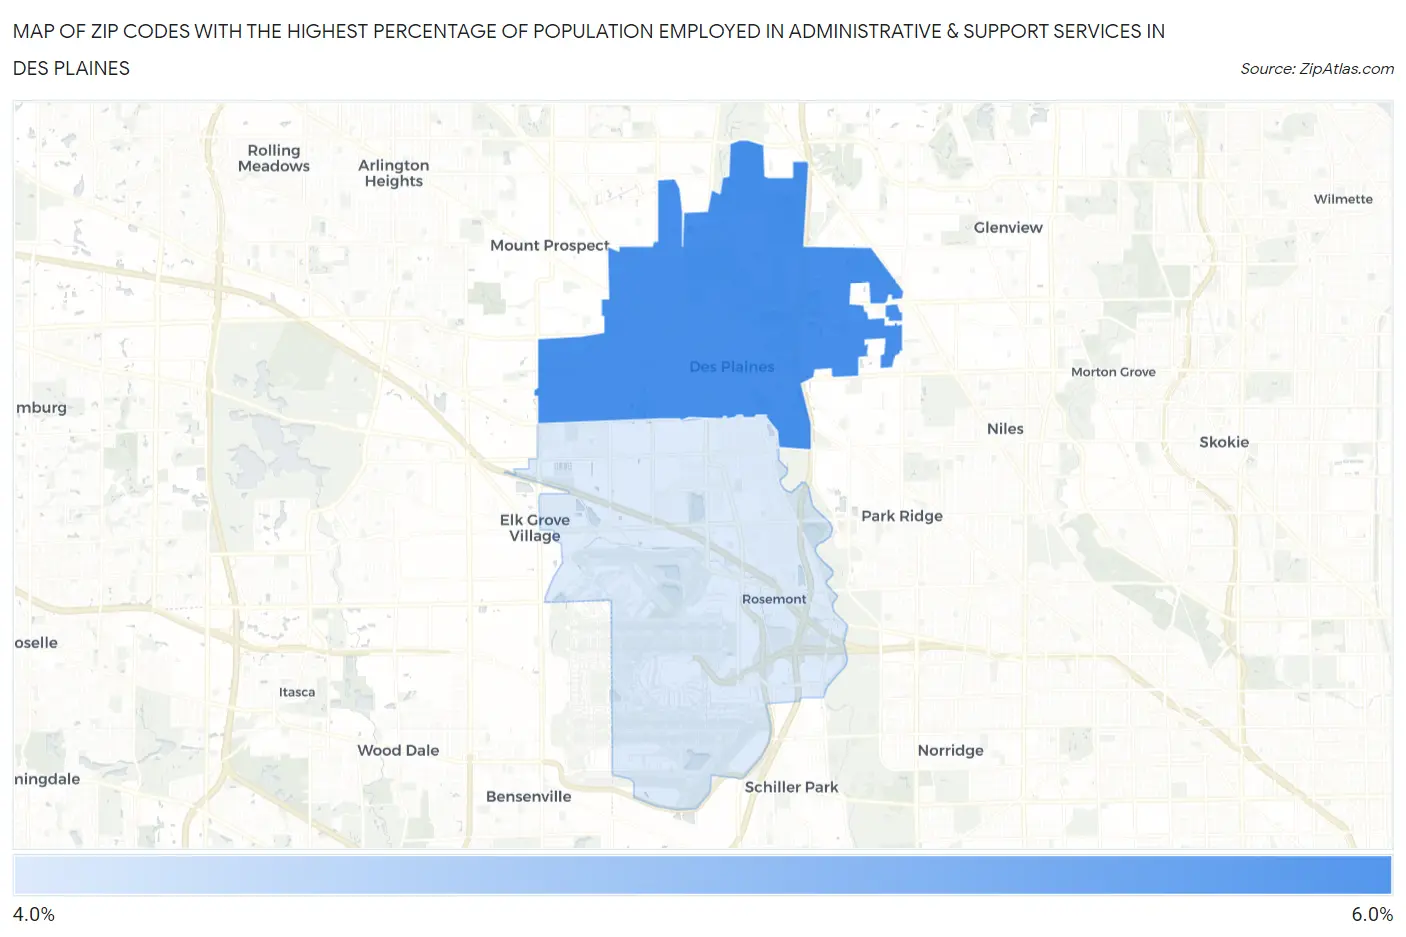
Map of Zip Codes with the Highest Percentage of Population Employed in Administrative & Support Services in Des Plaines
4.9%
5.5%
Zip Codes with the Highest Percentage of Population Employed in Administrative & Support Services in Des Plaines, IL
| Zip Code | % Employed | vs State | vs National | |
| 1. | 60016 | 5.5% | 4.0%(+1.48)#198 | 4.1%(+1.35)#5,849 |
| 2. | 60018 | 4.9% | 4.0%(+0.919)#256 | 4.1%(+0.786)#7,288 |
1
Common Questions
What are the Top Zip Codes with the Highest Percentage of Population Employed in Administrative & Support Services in Des Plaines, IL?
Top Zip Codes with the Highest Percentage of Population Employed in Administrative & Support Services in Des Plaines, IL are:
What zip code has the Highest Percentage of Population Employed in Administrative & Support Services in Des Plaines, IL?
60016 has the Highest Percentage of Population Employed in Administrative & Support Services in Des Plaines, IL with 5.5%.
What is the Percentage of Population Employed in Administrative & Support Services in Des Plaines, IL?
Percentage of Population Employed in Administrative & Support Services in Des Plaines is 4.2%.
What is the Percentage of Population Employed in Administrative & Support Services in Illinois?
Percentage of Population Employed in Administrative & Support Services in Illinois is 4.0%.
What is the Percentage of Population Employed in Administrative & Support Services in the United States?
Percentage of Population Employed in Administrative & Support Services in the United States is 4.1%.