Berlin, IL Map & Demographics
Berlin Map
Berlin Overview
$34,145
PER CAPITA INCOME
$82,625
AVG FAMILY INCOME
$63,750
AVG HOUSEHOLD INCOME
6.7%
WAGE / INCOME GAP [ % ]
93.3¢/ $1
WAGE / INCOME GAP [ $ ]
0.34
INEQUALITY / GINI INDEX
108
TOTAL POPULATION
53
MALE POPULATION
55
FEMALE POPULATION
96.36
MALES / 100 FEMALES
103.77
FEMALES / 100 MALES
53.5
MEDIAN AGE
2.4
AVG FAMILY SIZE
1.8
AVG HOUSEHOLD SIZE
66
LABOR FORCE [ PEOPLE ]
64.7%
PERCENT IN LABOR FORCE
Berlin Area Codes
Income in Berlin
Income Overview in Berlin
Per Capita Income in Berlin is $34,145, while median incomes of families and households are $82,625 and $63,750 respectively.
| Characteristic | Number | Measure |
| Per Capita Income | 108 | $34,145 |
| Median Family Income | 27 | $82,625 |
| Mean Family Income | 27 | $85,470 |
| Median Household Income | 61 | $63,750 |
| Mean Household Income | 61 | $59,598 |
| Income Deficit | 27 | $0 |
| Wage / Income Gap (%) | 108 | 6.67% |
| Wage / Income Gap ($) | 108 | 93.33¢ per $1 |
| Gini / Inequality Index | 108 | 0.34 |
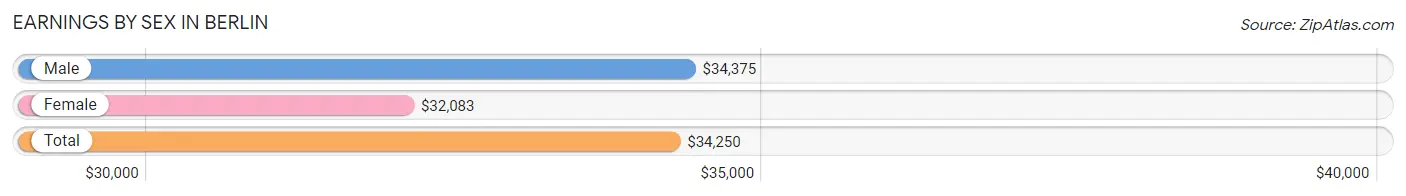
Earnings by Sex in Berlin
Average Earnings in Berlin are $34,250, $34,375 for men and $32,083 for women, a difference of 6.7%.
| Sex | Number | Average Earnings |
| Male | 31 (47.0%) | $34,375 |
| Female | 35 (53.0%) | $32,083 |
| Total | 66 (100.0%) | $34,250 |
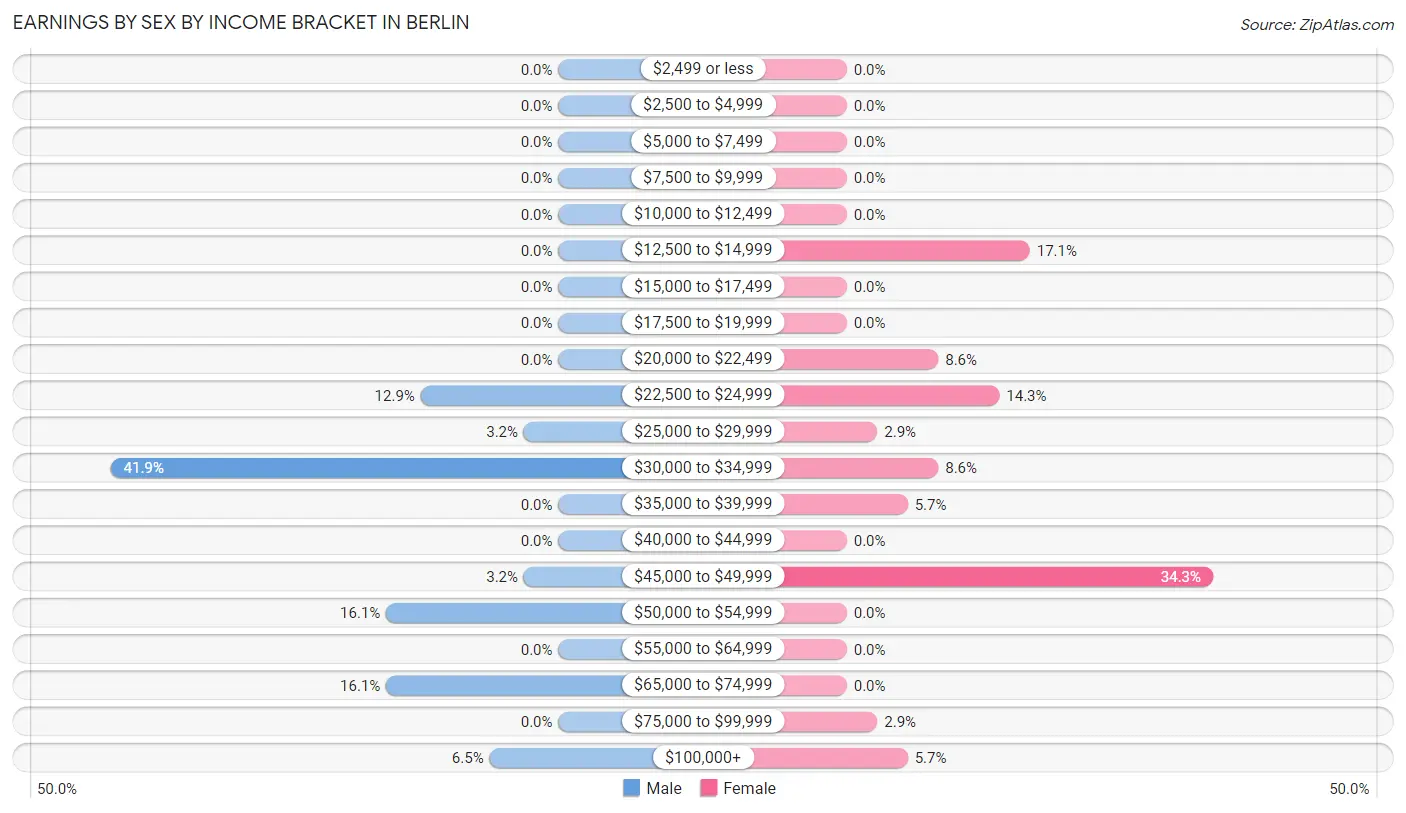
Earnings by Sex by Income Bracket in Berlin
The most common earnings brackets in Berlin are $30,000 to $34,999 for men (13 | 41.9%) and $45,000 to $49,999 for women (12 | 34.3%).
| Income | Male | Female |
| $2,499 or less | 0 (0.0%) | 0 (0.0%) |
| $2,500 to $4,999 | 0 (0.0%) | 0 (0.0%) |
| $5,000 to $7,499 | 0 (0.0%) | 0 (0.0%) |
| $7,500 to $9,999 | 0 (0.0%) | 0 (0.0%) |
| $10,000 to $12,499 | 0 (0.0%) | 0 (0.0%) |
| $12,500 to $14,999 | 0 (0.0%) | 6 (17.1%) |
| $15,000 to $17,499 | 0 (0.0%) | 0 (0.0%) |
| $17,500 to $19,999 | 0 (0.0%) | 0 (0.0%) |
| $20,000 to $22,499 | 0 (0.0%) | 3 (8.6%) |
| $22,500 to $24,999 | 4 (12.9%) | 5 (14.3%) |
| $25,000 to $29,999 | 1 (3.2%) | 1 (2.9%) |
| $30,000 to $34,999 | 13 (41.9%) | 3 (8.6%) |
| $35,000 to $39,999 | 0 (0.0%) | 2 (5.7%) |
| $40,000 to $44,999 | 0 (0.0%) | 0 (0.0%) |
| $45,000 to $49,999 | 1 (3.2%) | 12 (34.3%) |
| $50,000 to $54,999 | 5 (16.1%) | 0 (0.0%) |
| $55,000 to $64,999 | 0 (0.0%) | 0 (0.0%) |
| $65,000 to $74,999 | 5 (16.1%) | 0 (0.0%) |
| $75,000 to $99,999 | 0 (0.0%) | 1 (2.9%) |
| $100,000+ | 2 (6.5%) | 2 (5.7%) |
| Total | 31 (100.0%) | 35 (100.0%) |
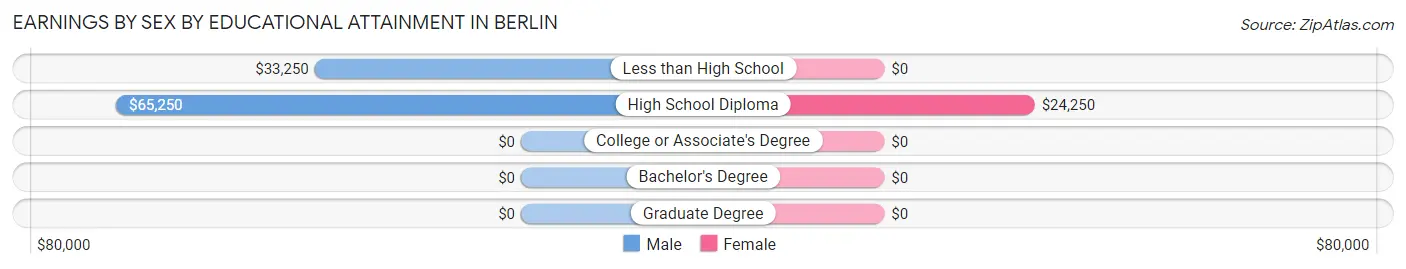
Earnings by Sex by Educational Attainment in Berlin
Average earnings in Berlin are $34,375 for men and $32,083 for women, a difference of 6.7%. Men with an educational attainment of high school diploma enjoy the highest average annual earnings of $65,250, while those with less than high school education earn the least with $33,250. Women with an educational attainment of high school diploma earn the most with the average annual earnings of $24,250, while those with high school diploma education have the smallest earnings of $24,250.
| Educational Attainment | Male Income | Female Income |
| Less than High School | $33,250 | $0 |
| High School Diploma | $65,250 | $24,250 |
| College or Associate's Degree | - | - |
| Bachelor's Degree | - | - |
| Graduate Degree | - | - |
| Total | $34,375 | $32,083 |
Family Income in Berlin
Family Income Brackets in Berlin
According to the Berlin family income data, there are 12 families falling into the $75,000 to $99,999 income range, which is the most common income bracket and makes up 44.4% of all families.
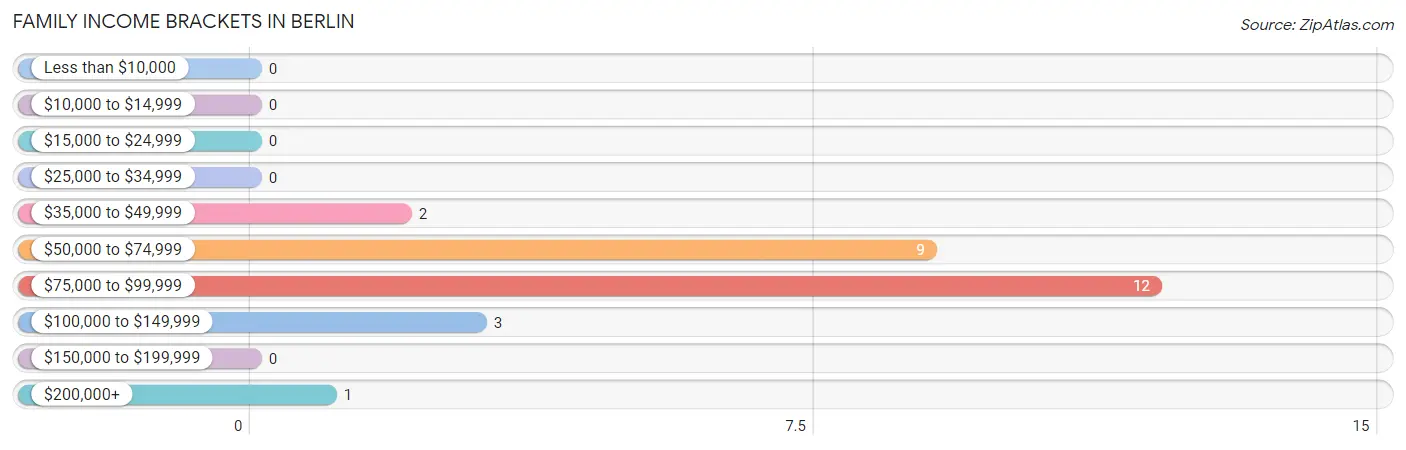
| Income Bracket | # Families | % Families |
| Less than $10,000 | 0 | 0.0% |
| $10,000 to $14,999 | 0 | 0.0% |
| $15,000 to $24,999 | 0 | 0.0% |
| $25,000 to $34,999 | 0 | 0.0% |
| $35,000 to $49,999 | 2 | 7.4% |
| $50,000 to $74,999 | 9 | 33.3% |
| $75,000 to $99,999 | 12 | 44.4% |
| $100,000 to $149,999 | 3 | 11.1% |
| $150,000 to $199,999 | 0 | 0.0% |
| $200,000+ | 1 | 3.7% |
Family Income by Famaliy Size in Berlin
2-person families (23 | 85.2%) account for the highest median family income in Berlin with $82,625 per family, while 2-person families (23 | 85.2%) have the highest median income of $41,312 per family member.
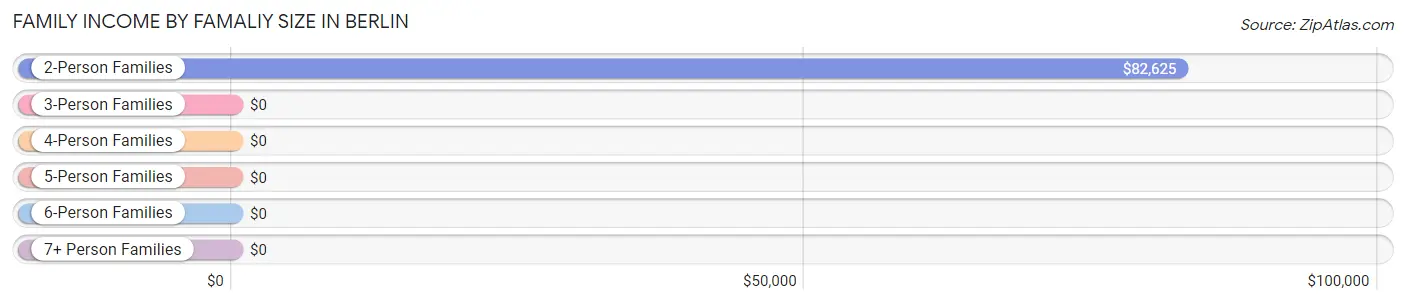
| Income Bracket | # Families | Median Income |
| 2-Person Families | 23 (85.2%) | $82,625 |
| 3-Person Families | 2 (7.4%) | $0 |
| 4-Person Families | 2 (7.4%) | $0 |
| 5-Person Families | 0 (0.0%) | $0 |
| 6-Person Families | 0 (0.0%) | $0 |
| 7+ Person Families | 0 (0.0%) | $0 |
| Total | 27 (100.0%) | $82,625 |
Family Income by Number of Earners in Berlin
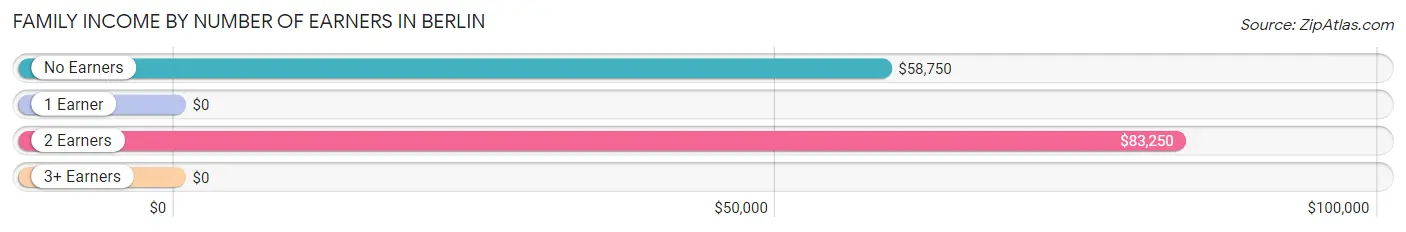
| Number of Earners | # Families | Median Income |
| No Earners | 4 (14.8%) | $58,750 |
| 1 Earner | 3 (11.1%) | $0 |
| 2 Earners | 20 (74.1%) | $83,250 |
| 3+ Earners | 0 (0.0%) | $0 |
| Total | 27 (100.0%) | $82,625 |
Household Income in Berlin
Household Income Brackets in Berlin
With 17 households falling in the category, the $75,000 to $99,999 income range is the most frequent in Berlin, accounting for 27.9% of all households.
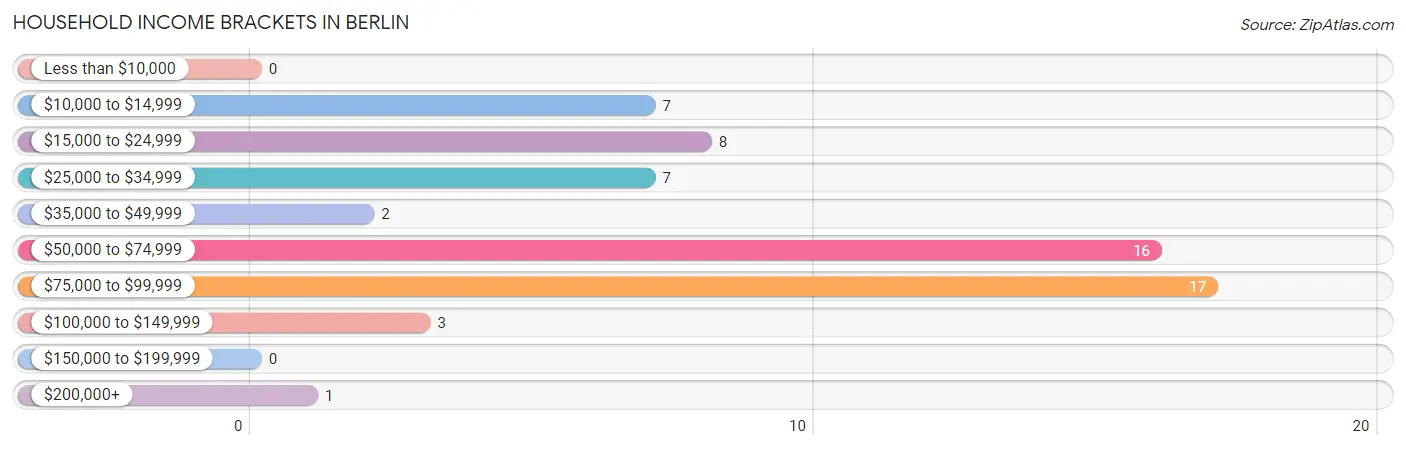
| Income Bracket | # Households | % Households |
| Less than $10,000 | 0 | 0.0% |
| $10,000 to $14,999 | 7 | 11.5% |
| $15,000 to $24,999 | 8 | 13.1% |
| $25,000 to $34,999 | 7 | 11.5% |
| $35,000 to $49,999 | 2 | 3.3% |
| $50,000 to $74,999 | 16 | 26.2% |
| $75,000 to $99,999 | 17 | 27.9% |
| $100,000 to $149,999 | 3 | 4.9% |
| $150,000 to $199,999 | 0 | 0.0% |
| $200,000+ | 1 | 1.6% |
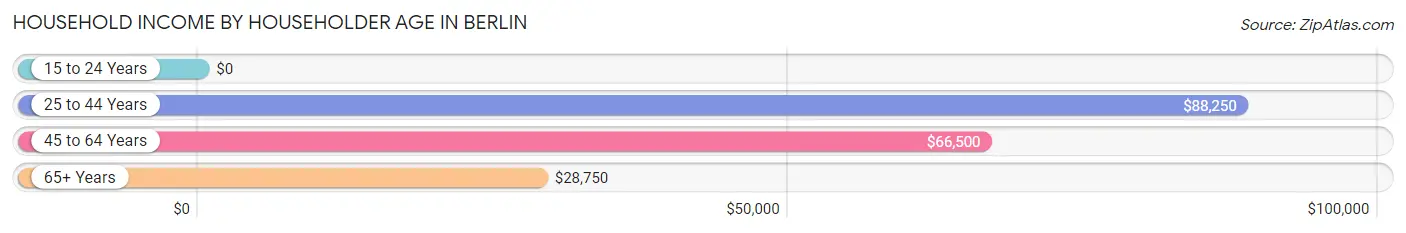
Household Income by Householder Age in Berlin
The median household income in Berlin is $63,750, with the highest median household income of $88,250 found in the 25 to 44 years age bracket for the primary householder. A total of 11 households (18.0%) fall into this category.
| Income Bracket | # Households | Median Income |
| 15 to 24 Years | 0 (0.0%) | $0 |
| 25 to 44 Years | 11 (18.0%) | $88,250 |
| 45 to 64 Years | 32 (52.5%) | $66,500 |
| 65+ Years | 18 (29.5%) | $28,750 |
| Total | 61 (100.0%) | $63,750 |
Poverty in Berlin
Income Below Poverty by Sex and Age in Berlin
With 5.7% poverty level for males and 7.3% for females among the residents of Berlin, 55 to 64 year old males and 75 year old and over females are the most vulnerable to poverty, with 3 males (13.0%) and 4 females (50.0%) in their respective age groups living below the poverty level.

| Age Bracket | Male | Female |
| Under 5 Years | 0 (0.0%) | 0 (0.0%) |
| 5 Years | 0 (0.0%) | 0 (0.0%) |
| 6 to 11 Years | 0 (0.0%) | 0 (0.0%) |
| 12 to 14 Years | 0 (0.0%) | 0 (0.0%) |
| 15 Years | 0 (0.0%) | 0 (0.0%) |
| 16 and 17 Years | 0 (0.0%) | 0 (0.0%) |
| 18 to 24 Years | 0 (0.0%) | 0 (0.0%) |
| 25 to 34 Years | 0 (0.0%) | 0 (0.0%) |
| 35 to 44 Years | 0 (0.0%) | 0 (0.0%) |
| 45 to 54 Years | 0 (0.0%) | 0 (0.0%) |
| 55 to 64 Years | 3 (13.0%) | 0 (0.0%) |
| 65 to 74 Years | 0 (0.0%) | 0 (0.0%) |
| 75 Years and over | 0 (0.0%) | 4 (50.0%) |
| Total | 3 (5.7%) | 4 (7.3%) |
Income Above Poverty by Sex and Age in Berlin
According to the poverty statistics in Berlin, males aged under 5 years and females aged under 5 years are the age groups that are most secure financially, with 100.0% of males and 100.0% of females in these age groups living above the poverty line.
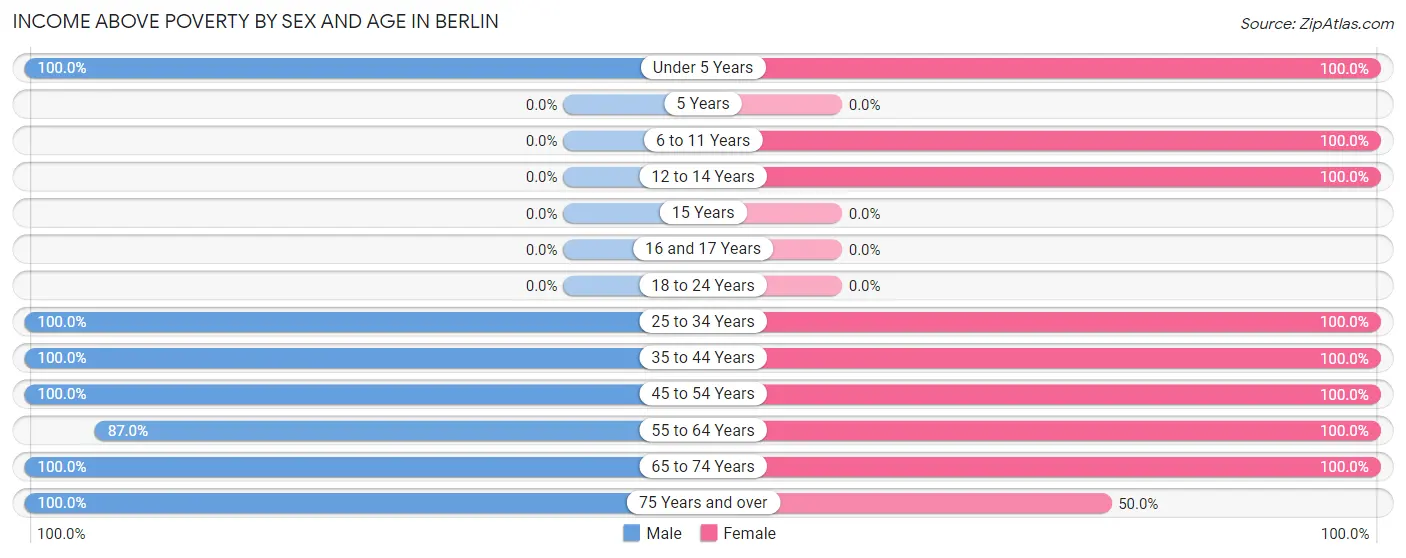
| Age Bracket | Male | Female |
| Under 5 Years | 2 (100.0%) | 1 (100.0%) |
| 5 Years | 0 (0.0%) | 0 (0.0%) |
| 6 to 11 Years | 0 (0.0%) | 2 (100.0%) |
| 12 to 14 Years | 0 (0.0%) | 1 (100.0%) |
| 15 Years | 0 (0.0%) | 0 (0.0%) |
| 16 and 17 Years | 0 (0.0%) | 0 (0.0%) |
| 18 to 24 Years | 0 (0.0%) | 0 (0.0%) |
| 25 to 34 Years | 7 (100.0%) | 7 (100.0%) |
| 35 to 44 Years | 4 (100.0%) | 5 (100.0%) |
| 45 to 54 Years | 9 (100.0%) | 18 (100.0%) |
| 55 to 64 Years | 20 (87.0%) | 7 (100.0%) |
| 65 to 74 Years | 2 (100.0%) | 6 (100.0%) |
| 75 Years and over | 6 (100.0%) | 4 (50.0%) |
| Total | 50 (94.3%) | 51 (92.7%) |
Income Below Poverty Among Married-Couple Families in Berlin
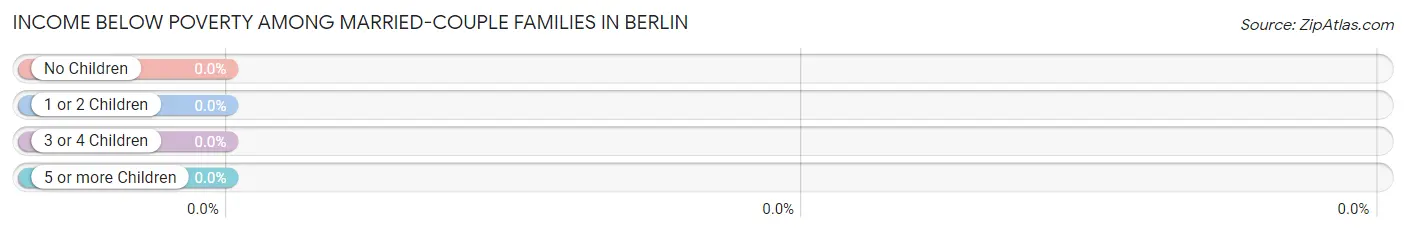
| Children | Above Poverty | Below Poverty |
| No Children | 22 (100.0%) | 0 (0.0%) |
| 1 or 2 Children | 3 (100.0%) | 0 (0.0%) |
| 3 or 4 Children | 0 (0.0%) | 0 (0.0%) |
| 5 or more Children | 0 (0.0%) | 0 (0.0%) |
| Total | 25 (100.0%) | 0 (0.0%) |
Income Below Poverty Among Single-Parent Households in Berlin
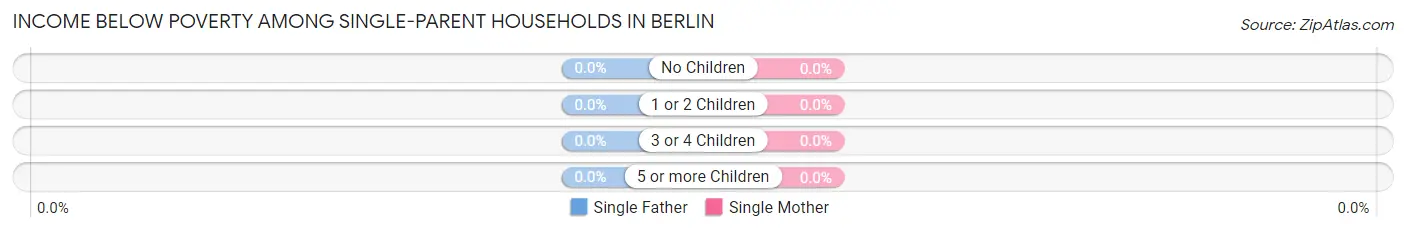
| Children | Single Father | Single Mother |
| No Children | 0 (0.0%) | 0 (0.0%) |
| 1 or 2 Children | 0 (0.0%) | 0 (0.0%) |
| 3 or 4 Children | 0 (0.0%) | 0 (0.0%) |
| 5 or more Children | 0 (0.0%) | 0 (0.0%) |
| Total | 0 (0.0%) | 0 (0.0%) |
Income Below Poverty Among Married-Couple vs Single-Parent Households in Berlin
| Children | Married-Couple Families | Single-Parent Households |
| No Children | 0 (0.0%) | 0 (0.0%) |
| 1 or 2 Children | 0 (0.0%) | 0 (0.0%) |
| 3 or 4 Children | 0 (0.0%) | 0 (0.0%) |
| 5 or more Children | 0 (0.0%) | 0 (0.0%) |
| Total | 0 (0.0%) | 0 (0.0%) |
Race in Berlin
The most populous races in Berlin are , and White / Caucasian (108 | 100.0%).
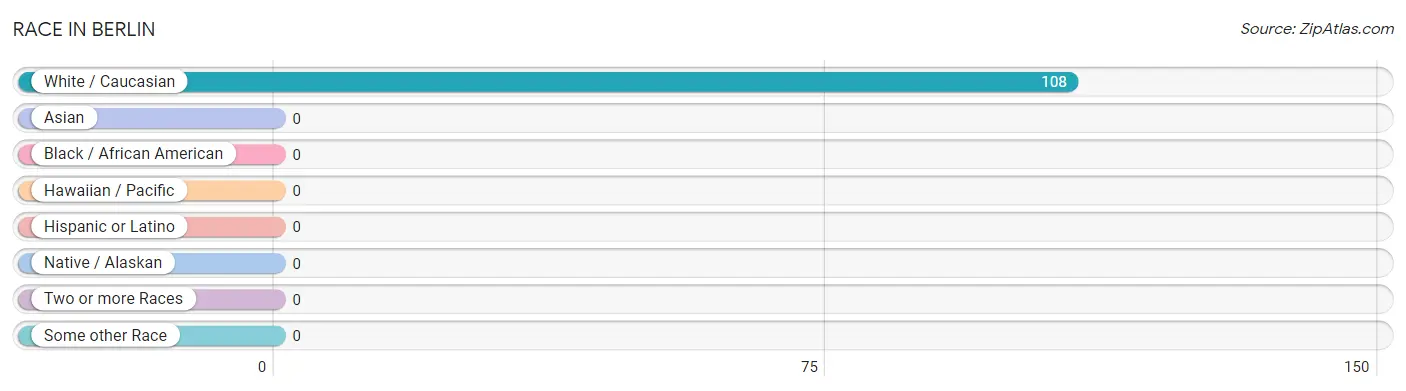
| Race | # Population | % Population |
| Asian | 0 | 0.0% |
| Black / African American | 0 | 0.0% |
| Hawaiian / Pacific | 0 | 0.0% |
| Hispanic or Latino | 0 | 0.0% |
| Native / Alaskan | 0 | 0.0% |
| White / Caucasian | 108 | 100.0% |
| Two or more Races | 0 | 0.0% |
| Some other Race | 0 | 0.0% |
| Total | 108 | 100.0% |
Ancestry in Berlin
The most populous ancestries reported in Berlin are German (17 | 15.7%), French (6 | 5.6%), American (4 | 3.7%), Irish (4 | 3.7%), and Norwegian (2 | 1.8%), together accounting for 30.5% of all Berlin residents.
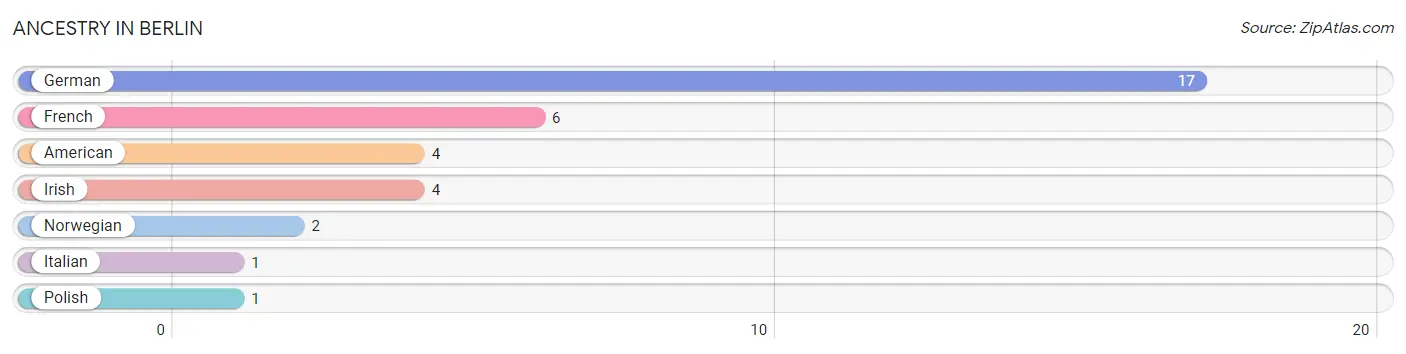
| Ancestry | # Population | % Population |
| American | 4 | 3.7% |
| French | 6 | 5.6% |
| German | 17 | 15.7% |
| Irish | 4 | 3.7% |
| Italian | 1 | 0.9% |
| Norwegian | 2 | 1.8% |
| Polish | 1 | 0.9% | View All 7 Rows |
Immigrants in Berlin

| Immigration Origin | # Population | % Population | View All 0 Rows |
Sex and Age in Berlin
Sex and Age in Berlin
The most populous age groups in Berlin are 60 to 64 Years (20 | 37.7%) for men and 50 to 54 Years (12 | 21.8%) for women.
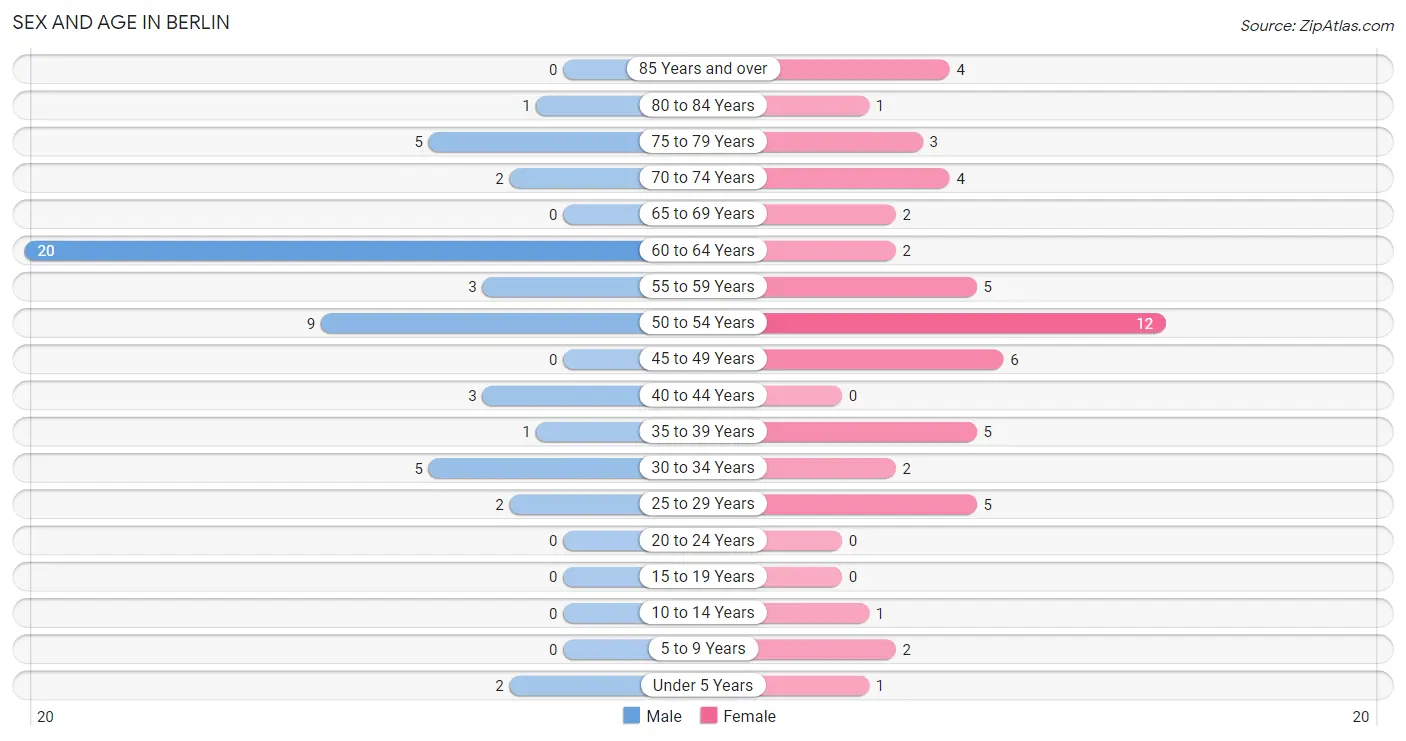
| Age Bracket | Male | Female |
| Under 5 Years | 2 (3.8%) | 1 (1.8%) |
| 5 to 9 Years | 0 (0.0%) | 2 (3.6%) |
| 10 to 14 Years | 0 (0.0%) | 1 (1.8%) |
| 15 to 19 Years | 0 (0.0%) | 0 (0.0%) |
| 20 to 24 Years | 0 (0.0%) | 0 (0.0%) |
| 25 to 29 Years | 2 (3.8%) | 5 (9.1%) |
| 30 to 34 Years | 5 (9.4%) | 2 (3.6%) |
| 35 to 39 Years | 1 (1.9%) | 5 (9.1%) |
| 40 to 44 Years | 3 (5.7%) | 0 (0.0%) |
| 45 to 49 Years | 0 (0.0%) | 6 (10.9%) |
| 50 to 54 Years | 9 (17.0%) | 12 (21.8%) |
| 55 to 59 Years | 3 (5.7%) | 5 (9.1%) |
| 60 to 64 Years | 20 (37.7%) | 2 (3.6%) |
| 65 to 69 Years | 0 (0.0%) | 2 (3.6%) |
| 70 to 74 Years | 2 (3.8%) | 4 (7.3%) |
| 75 to 79 Years | 5 (9.4%) | 3 (5.4%) |
| 80 to 84 Years | 1 (1.9%) | 1 (1.8%) |
| 85 Years and over | 0 (0.0%) | 4 (7.3%) |
| Total | 53 (100.0%) | 55 (100.0%) |
Families and Households in Berlin
Median Family Size in Berlin
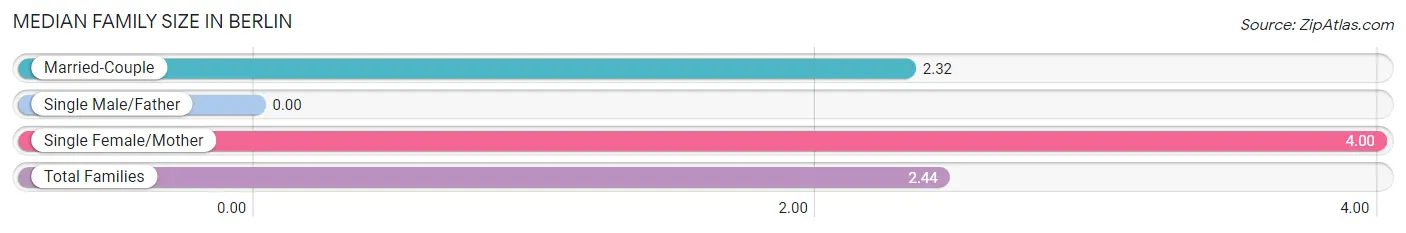
| Family Type | # Families | Family Size |
| Married-Couple | 25 (92.6%) | 2.32 |
| Single Male/Father | 0 (0.0%) | - |
| Single Female/Mother | 2 (7.4%) | 4.00 |
| Total Families | 27 (100.0%) | 2.44 |
Median Household Size in Berlin
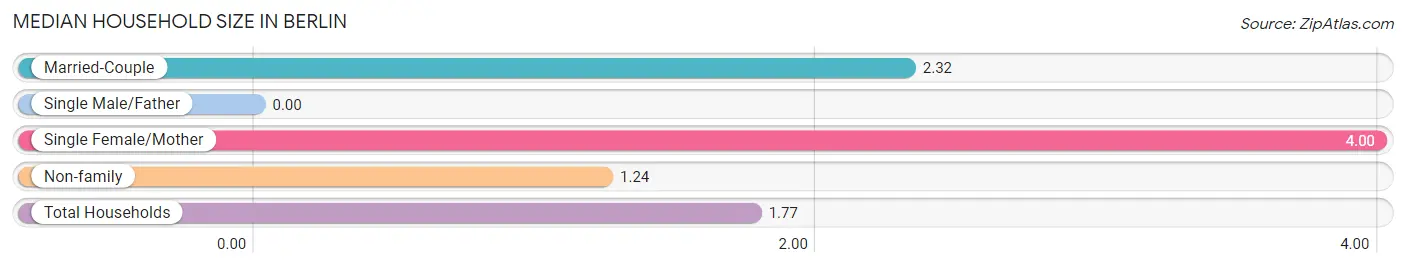
| Household Type | # Households | Household Size |
| Married-Couple | 25 (41.0%) | 2.32 |
| Single Male/Father | 0 (0.0%) | - |
| Single Female/Mother | 2 (3.3%) | 4.00 |
| Non-family | 34 (55.7%) | 1.24 |
| Total Households | 61 (100.0%) | 1.77 |
Household Size by Marriage Status in Berlin
Out of a total of 61 households in Berlin, 27 (44.3%) are family households, while 34 (55.7%) are nonfamily households. The most numerous type of family households are 2-person households, comprising 23, and the most common type of nonfamily households are 1-person households, comprising 26.
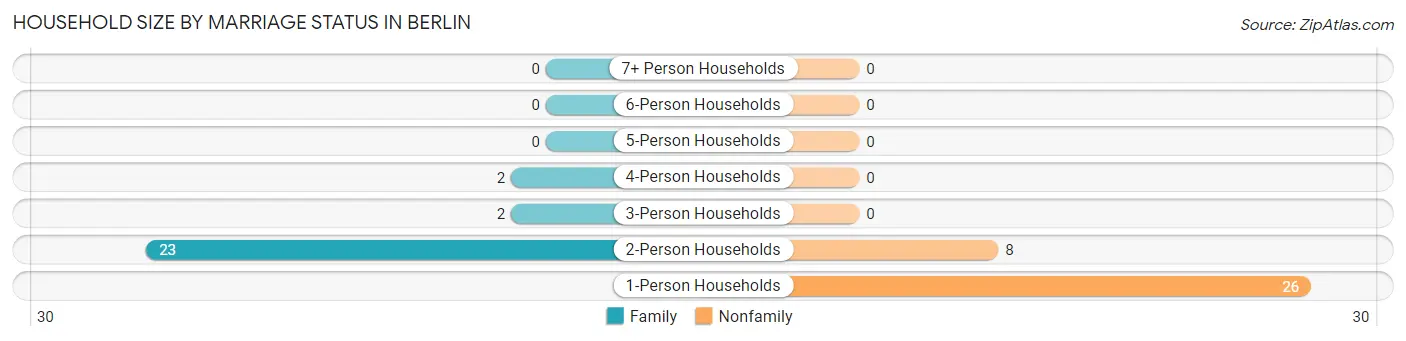
| Household Size | Family Households | Nonfamily Households |
| 1-Person Households | - | 26 (42.6%) |
| 2-Person Households | 23 (37.7%) | 8 (13.1%) |
| 3-Person Households | 2 (3.3%) | 0 (0.0%) |
| 4-Person Households | 2 (3.3%) | 0 (0.0%) |
| 5-Person Households | 0 (0.0%) | 0 (0.0%) |
| 6-Person Households | 0 (0.0%) | 0 (0.0%) |
| 7+ Person Households | 0 (0.0%) | 0 (0.0%) |
| Total | 27 (44.3%) | 34 (55.7%) |
Female Fertility in Berlin
Fertility by Age in Berlin
Average fertility rate in Berlin is 200.0 births per 1,000 women. Women in the age bracket of 20 to 34 years have the highest fertility rate with 857.0 births per 1,000 women. Women in the age bracket of 20 to 34 years acount for 100.0% of all women with births.
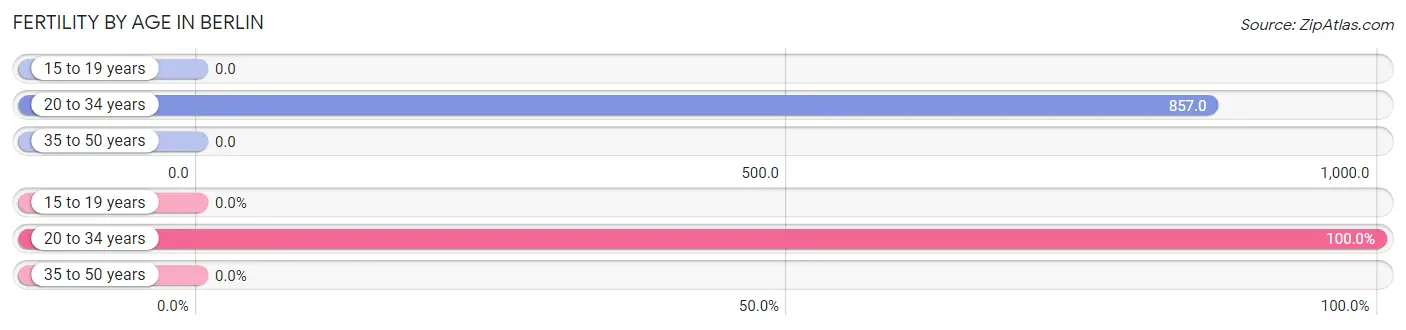
| Age Bracket | Women with Births | Births / 1,000 Women |
| 15 to 19 years | 0 (0.0%) | 0.0 |
| 20 to 34 years | 6 (100.0%) | 857.0 |
| 35 to 50 years | 0 (0.0%) | 0.0 |
| Total | 6 (100.0%) | 200.0 |
Fertility by Age by Marriage Status in Berlin
16.7% of women with births (6) in Berlin are married. The highest percentage of unmarried women with births falls into 20 to 34 years age bracket with 83.3% of them unmarried at the time of birth, while the lowest percentage of unmarried women with births belong to 20 to 34 years age bracket with 83.3% of them unmarried.
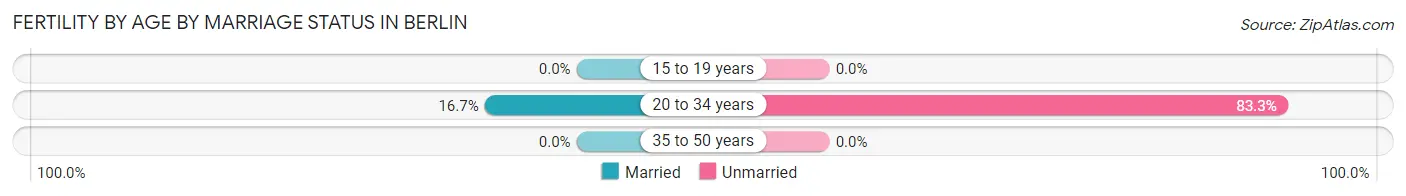
| Age Bracket | Married | Unmarried |
| 15 to 19 years | 0 (0.0%) | 0 (0.0%) |
| 20 to 34 years | 1 (16.7%) | 5 (83.3%) |
| 35 to 50 years | 0 (0.0%) | 0 (0.0%) |
| Total | 1 (16.7%) | 5 (83.3%) |
Fertility by Education in Berlin
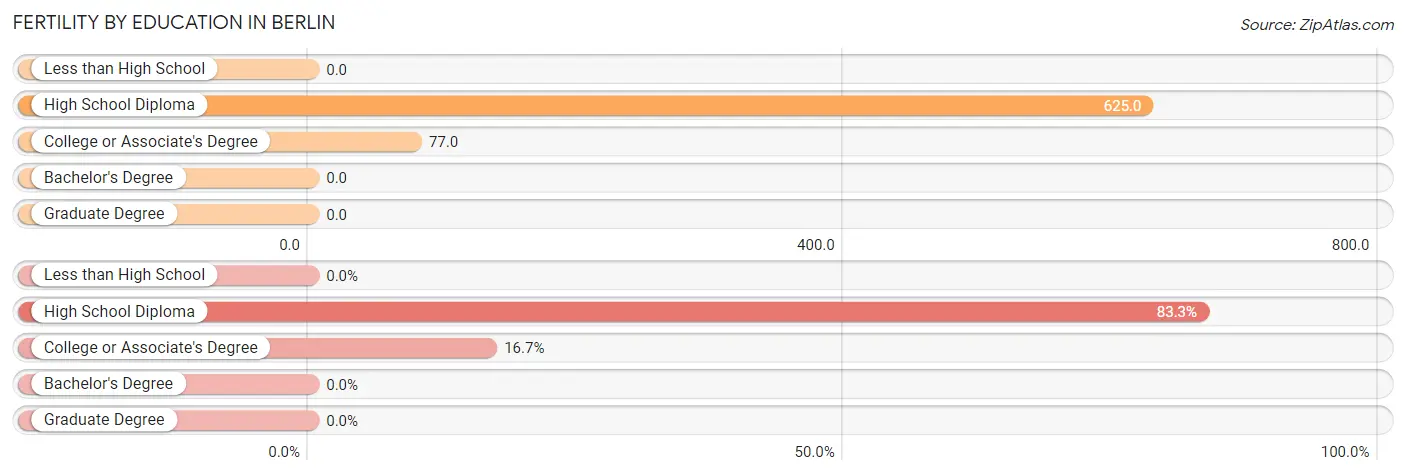
| Educational Attainment | Women with Births | Births / 1,000 Women |
| Less than High School | 0 (0.0%) | 0.0 |
| High School Diploma | 5 (83.3%) | 625.0 |
| College or Associate's Degree | 1 (16.7%) | 77.0 |
| Bachelor's Degree | 0 (0.0%) | 0.0 |
| Graduate Degree | 0 (0.0%) | 0.0 |
| Total | 6 (100.0%) | 200.0 |
Fertility by Education by Marriage Status in Berlin
83.3% of women with births in Berlin are unmarried. Women with the educational attainment of college or associate's degree are most likely to be married with 100.0% of them married at childbirth, while women with the educational attainment of high school diploma are least likely to be married with 100.0% of them unmarried at childbirth.
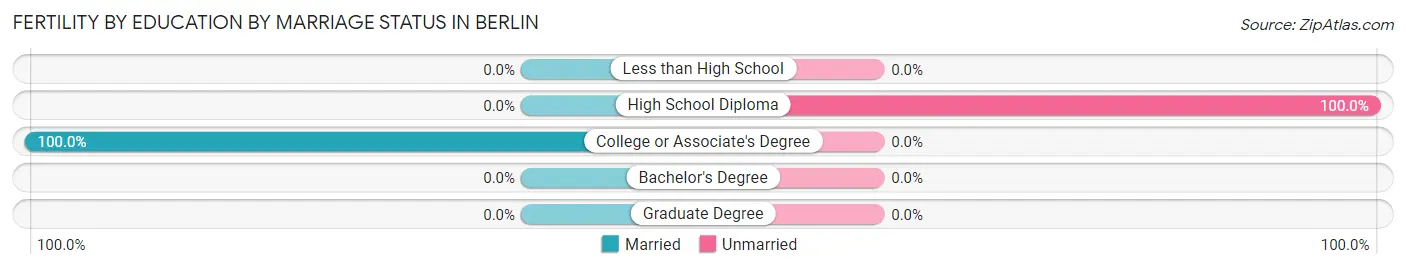
| Educational Attainment | Married | Unmarried |
| Less than High School | 0 (0.0%) | 0 (0.0%) |
| High School Diploma | 0 (0.0%) | 5 (100.0%) |
| College or Associate's Degree | 1 (100.0%) | 0 (0.0%) |
| Bachelor's Degree | 0 (0.0%) | 0 (0.0%) |
| Graduate Degree | 0 (0.0%) | 0 (0.0%) |
| Total | 1 (16.7%) | 5 (83.3%) |
Employment Characteristics in Berlin
Employment by Class of Employer in Berlin
Among the 55 employed individuals in Berlin, private company employees (38 | 69.1%), self-employed (not incorporated) (10 | 18.2%), and self-employed (incorporated) (3 | 5.4%) make up the most common classes of employment.
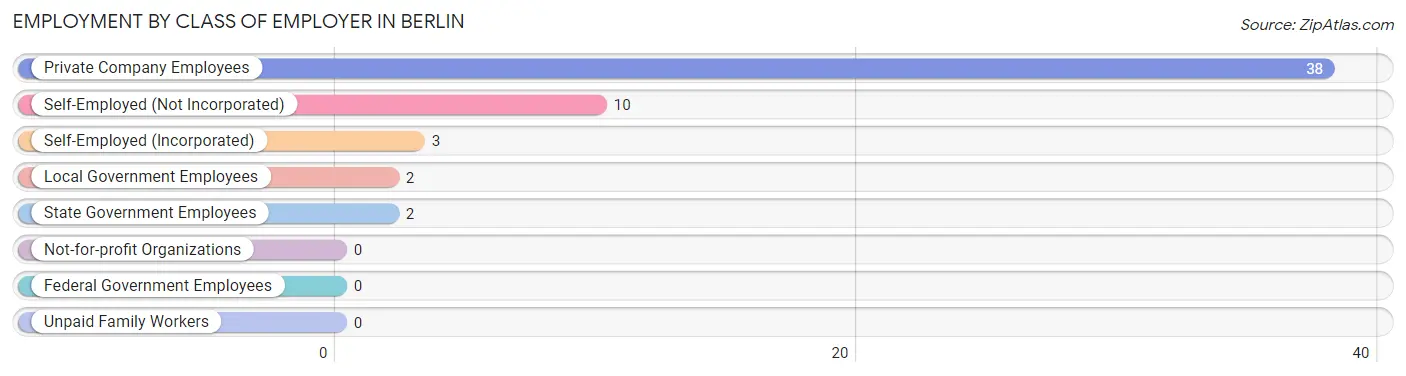
| Employer Class | # Employees | % Employees |
| Private Company Employees | 38 | 69.1% |
| Self-Employed (Incorporated) | 3 | 5.4% |
| Self-Employed (Not Incorporated) | 10 | 18.2% |
| Not-for-profit Organizations | 0 | 0.0% |
| Local Government Employees | 2 | 3.6% |
| State Government Employees | 2 | 3.6% |
| Federal Government Employees | 0 | 0.0% |
| Unpaid Family Workers | 0 | 0.0% |
| Total | 55 | 100.0% |
Employment Status by Age in Berlin
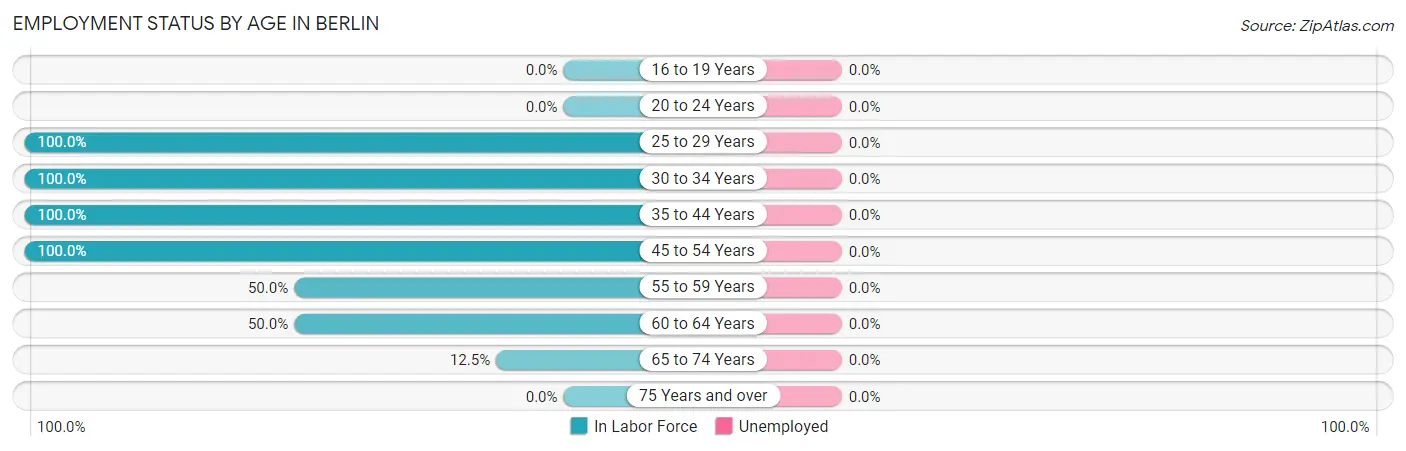
| Age Bracket | In Labor Force | Unemployed |
| 16 to 19 Years | 0 (0.0%) | 0 (0.0%) |
| 20 to 24 Years | 0 (0.0%) | 0 (0.0%) |
| 25 to 29 Years | 7 (100.0%) | 0 (0.0%) |
| 30 to 34 Years | 7 (100.0%) | 0 (0.0%) |
| 35 to 44 Years | 9 (100.0%) | 0 (0.0%) |
| 45 to 54 Years | 27 (100.0%) | 0 (0.0%) |
| 55 to 59 Years | 4 (50.0%) | 0 (0.0%) |
| 60 to 64 Years | 11 (50.0%) | 0 (0.0%) |
| 65 to 74 Years | 1 (12.5%) | 0 (0.0%) |
| 75 Years and over | 0 (0.0%) | 0 (0.0%) |
| Total | 66 (64.7%) | 0 (0.0%) |
Employment Status by Educational Attainment in Berlin
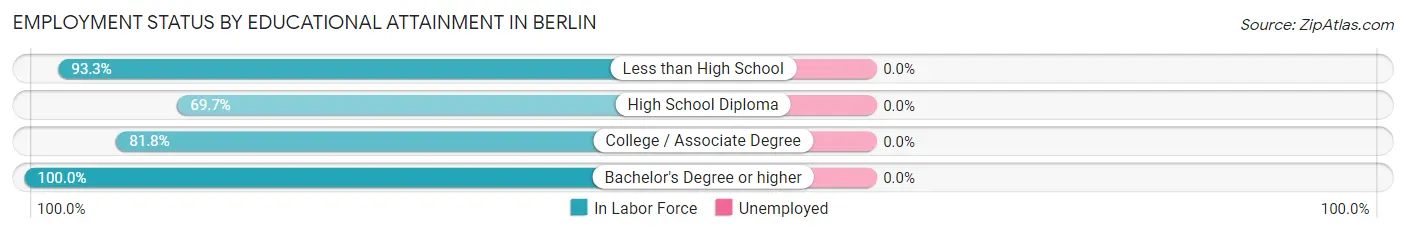
| Educational Attainment | In Labor Force | Unemployed |
| Less than High School | 14 (93.3%) | 0 (0.0%) |
| High School Diploma | 23 (69.7%) | 0 (0.0%) |
| College / Associate Degree | 18 (81.8%) | 0 (0.0%) |
| Bachelor's Degree or higher | 10 (100.0%) | 0 (0.0%) |
| Total | 65 (81.3%) | 0 (0.0%) |
Employment Occupations by Sex in Berlin
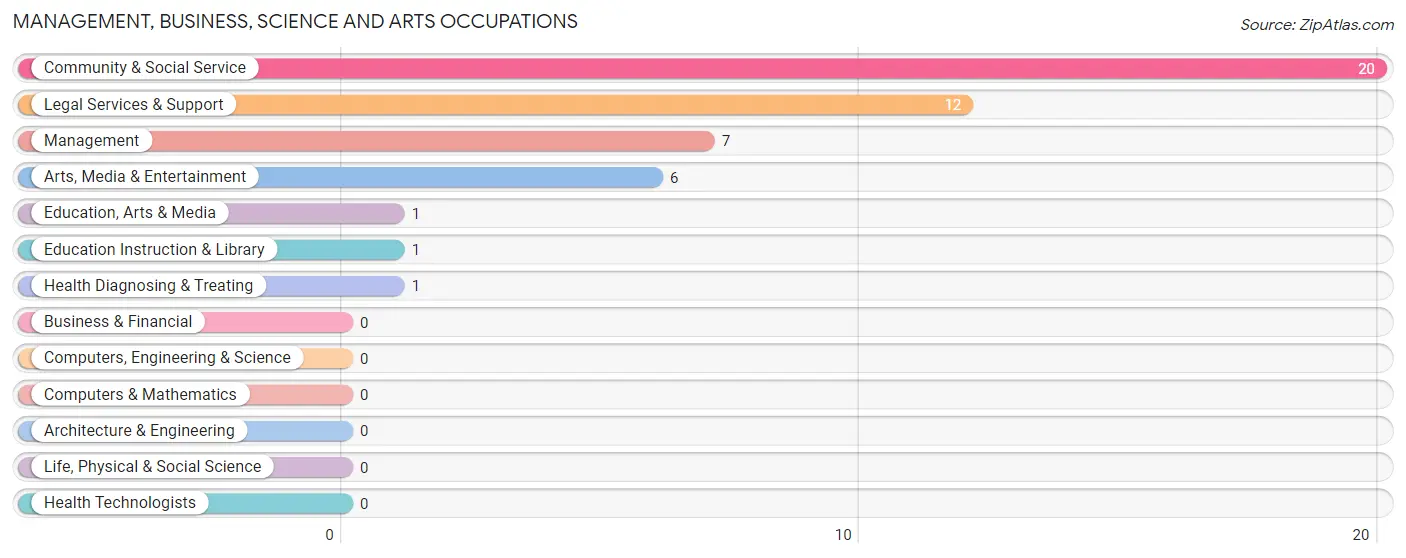
Management, Business, Science and Arts Occupations
The most common Management, Business, Science and Arts occupations in Berlin are Community & Social Service (20 | 30.3%), Legal Services & Support (12 | 18.2%), Management (7 | 10.6%), Arts, Media & Entertainment (6 | 9.1%), and Education, Arts & Media (1 | 1.5%).
Management, Business, Science and Arts Occupations by Sex
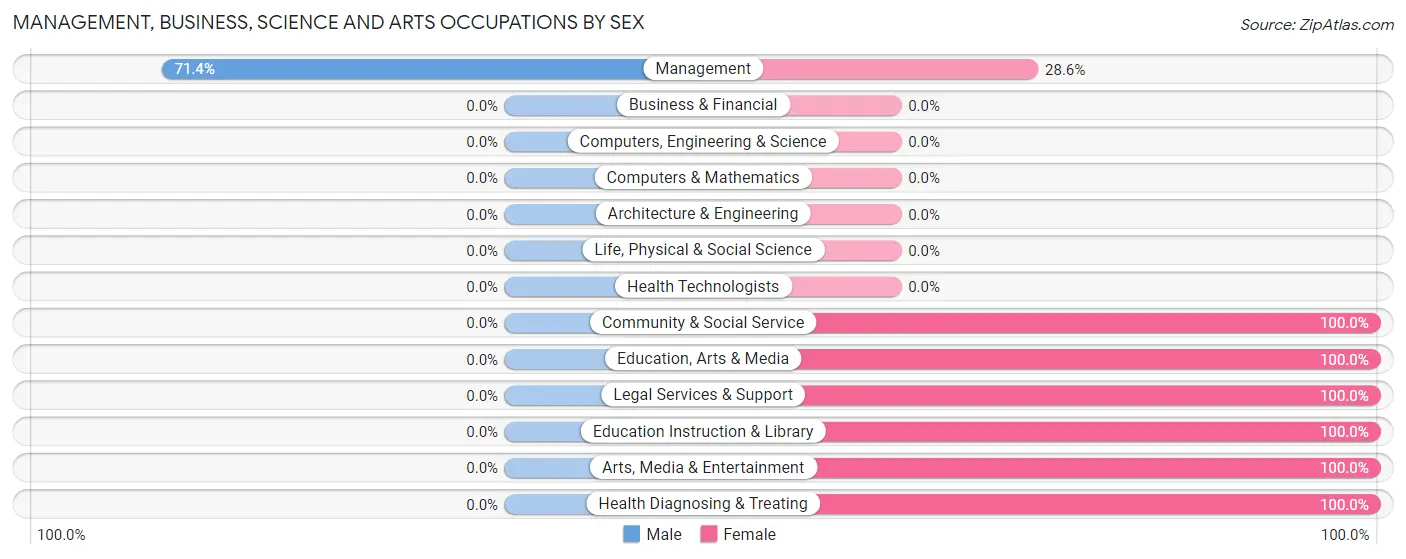
| Occupation | Male | Female |
| Management | 5 (71.4%) | 2 (28.6%) |
| Business & Financial | 0 (0.0%) | 0 (0.0%) |
| Computers, Engineering & Science | 0 (0.0%) | 0 (0.0%) |
| Computers & Mathematics | 0 (0.0%) | 0 (0.0%) |
| Architecture & Engineering | 0 (0.0%) | 0 (0.0%) |
| Life, Physical & Social Science | 0 (0.0%) | 0 (0.0%) |
| Community & Social Service | 0 (0.0%) | 20 (100.0%) |
| Education, Arts & Media | 0 (0.0%) | 1 (100.0%) |
| Legal Services & Support | 0 (0.0%) | 12 (100.0%) |
| Education Instruction & Library | 0 (0.0%) | 1 (100.0%) |
| Arts, Media & Entertainment | 0 (0.0%) | 6 (100.0%) |
| Health Diagnosing & Treating | 0 (0.0%) | 1 (100.0%) |
| Health Technologists | 0 (0.0%) | 0 (0.0%) |
| Total (Category) | 5 (17.9%) | 23 (82.1%) |
| Total (Overall) | 31 (47.0%) | 35 (53.0%) |
Services Occupations
The most common Services occupations in Berlin are Food Preparation & Serving (4 | 6.1%), and Personal Care & Service (1 | 1.5%).
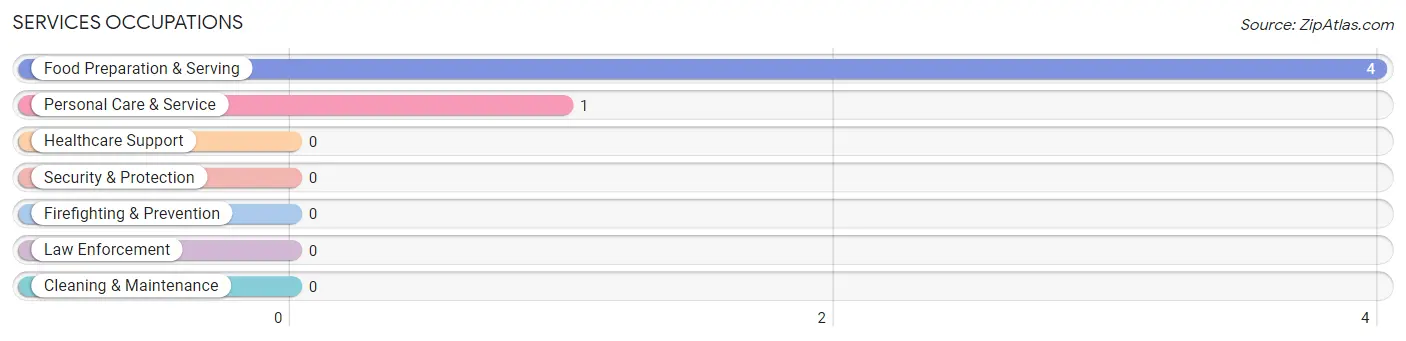
Services Occupations by Sex
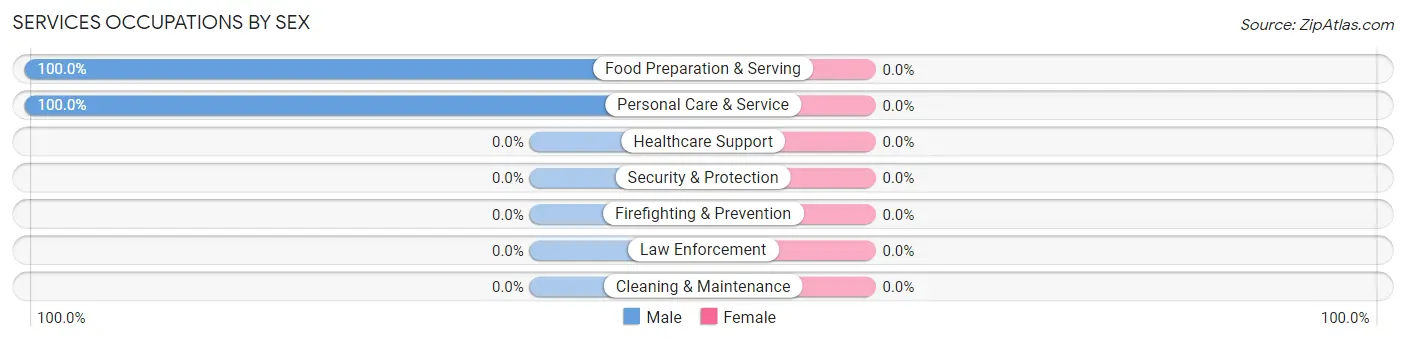
| Occupation | Male | Female |
| Healthcare Support | 0 (0.0%) | 0 (0.0%) |
| Security & Protection | 0 (0.0%) | 0 (0.0%) |
| Firefighting & Prevention | 0 (0.0%) | 0 (0.0%) |
| Law Enforcement | 0 (0.0%) | 0 (0.0%) |
| Food Preparation & Serving | 4 (100.0%) | 0 (0.0%) |
| Cleaning & Maintenance | 0 (0.0%) | 0 (0.0%) |
| Personal Care & Service | 1 (100.0%) | 0 (0.0%) |
| Total (Category) | 5 (100.0%) | 0 (0.0%) |
| Total (Overall) | 31 (47.0%) | 35 (53.0%) |
Sales and Office Occupations
The most common Sales and Office occupations in Berlin are , and Office & Administration (4 | 6.1%).

Sales and Office Occupations by Sex

| Occupation | Male | Female |
| Sales & Related | 0 (0.0%) | 0 (0.0%) |
| Office & Administration | 0 (0.0%) | 4 (100.0%) |
| Total (Category) | 0 (0.0%) | 4 (100.0%) |
| Total (Overall) | 31 (47.0%) | 35 (53.0%) |
Natural Resources, Construction and Maintenance Occupations
The most common Natural Resources, Construction and Maintenance occupations in Berlin are Installation, Maintenance & Repair (6 | 9.1%), and Construction & Extraction (5 | 7.6%).
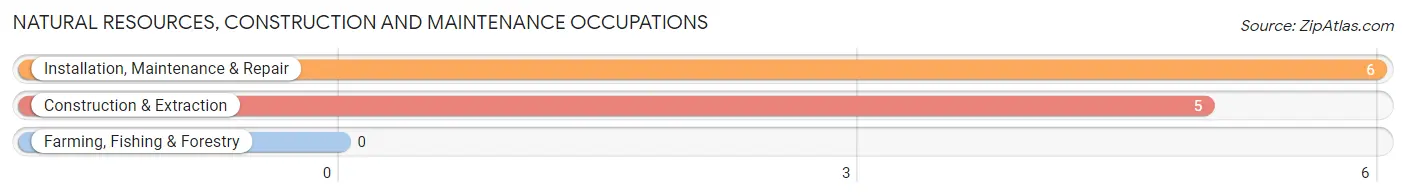
Natural Resources, Construction and Maintenance Occupations by Sex
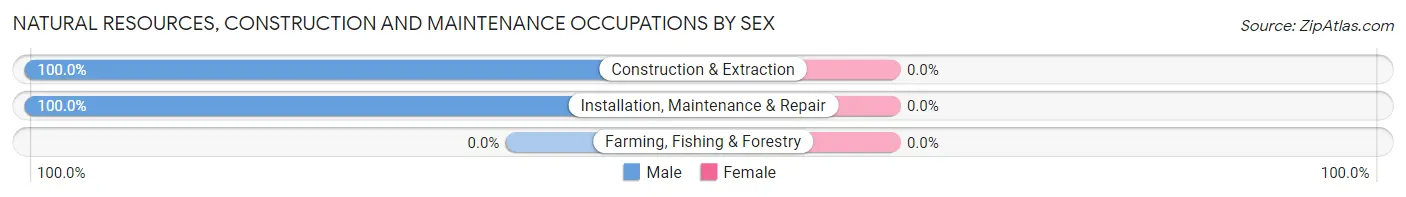
| Occupation | Male | Female |
| Farming, Fishing & Forestry | 0 (0.0%) | 0 (0.0%) |
| Construction & Extraction | 5 (100.0%) | 0 (0.0%) |
| Installation, Maintenance & Repair | 6 (100.0%) | 0 (0.0%) |
| Total (Category) | 11 (100.0%) | 0 (0.0%) |
| Total (Overall) | 31 (47.0%) | 35 (53.0%) |
Production, Transportation and Moving Occupations
The most common Production, Transportation and Moving occupations in Berlin are Production (10 | 15.1%), Material Moving (5 | 7.6%), and Transportation (3 | 4.5%).
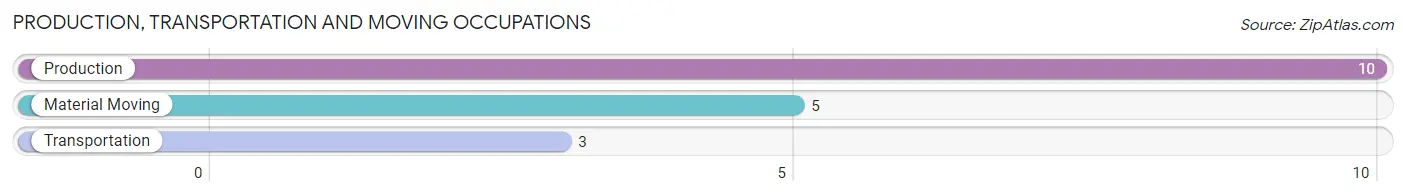
Production, Transportation and Moving Occupations by Sex
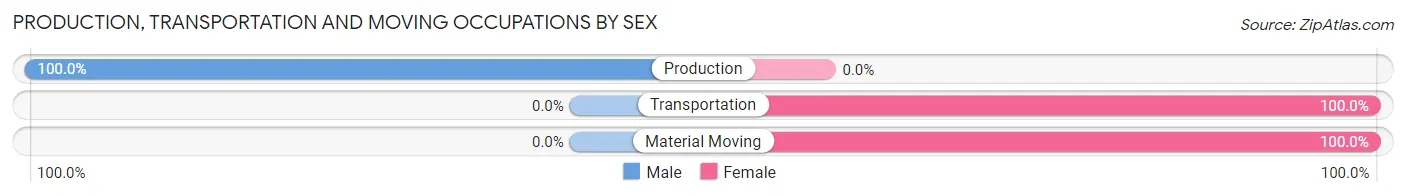
| Occupation | Male | Female |
| Production | 10 (100.0%) | 0 (0.0%) |
| Transportation | 0 (0.0%) | 3 (100.0%) |
| Material Moving | 0 (0.0%) | 5 (100.0%) |
| Total (Category) | 10 (55.6%) | 8 (44.4%) |
| Total (Overall) | 31 (47.0%) | 35 (53.0%) |
Employment Industries by Sex in Berlin
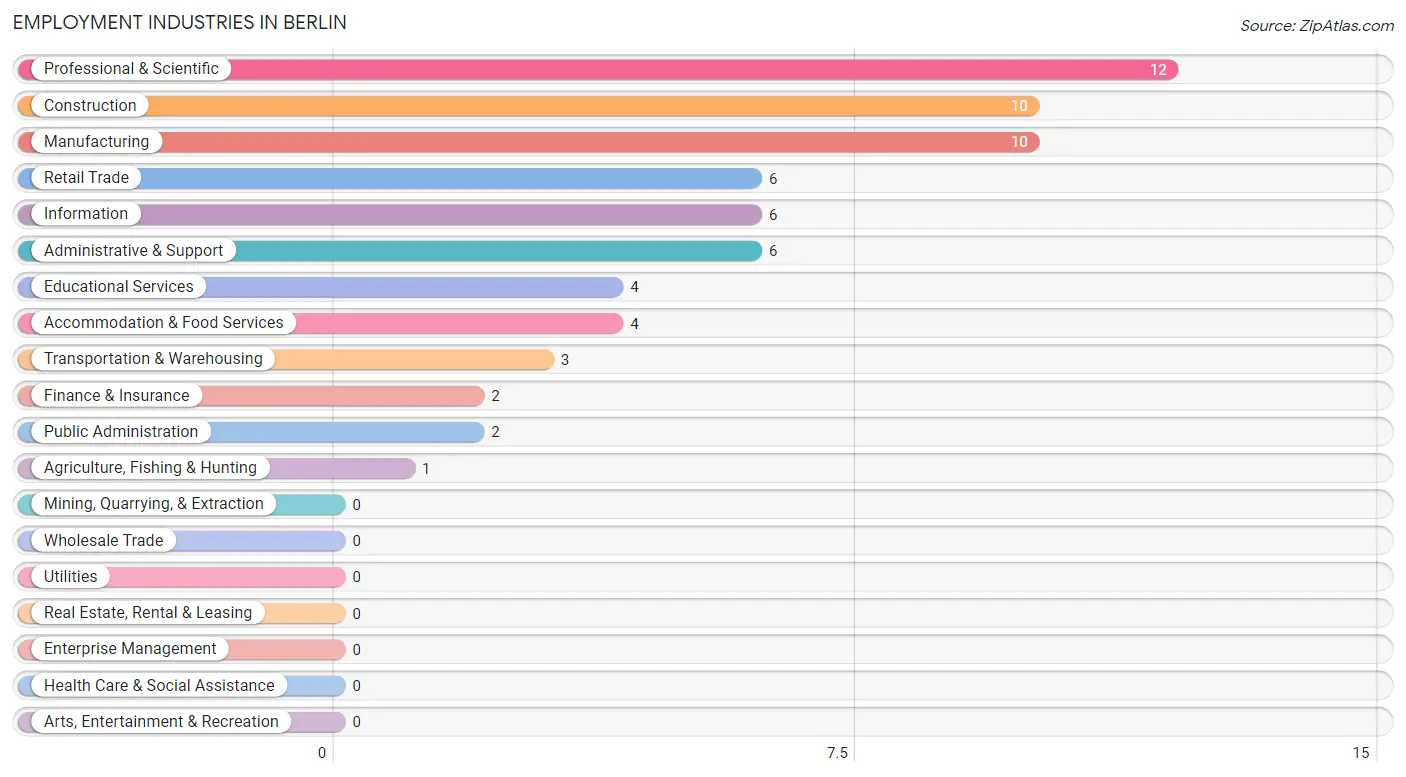
Employment Industries in Berlin
The major employment industries in Berlin include Professional & Scientific (12 | 18.2%), Construction (10 | 15.1%), Manufacturing (10 | 15.1%), Retail Trade (6 | 9.1%), and Information (6 | 9.1%).
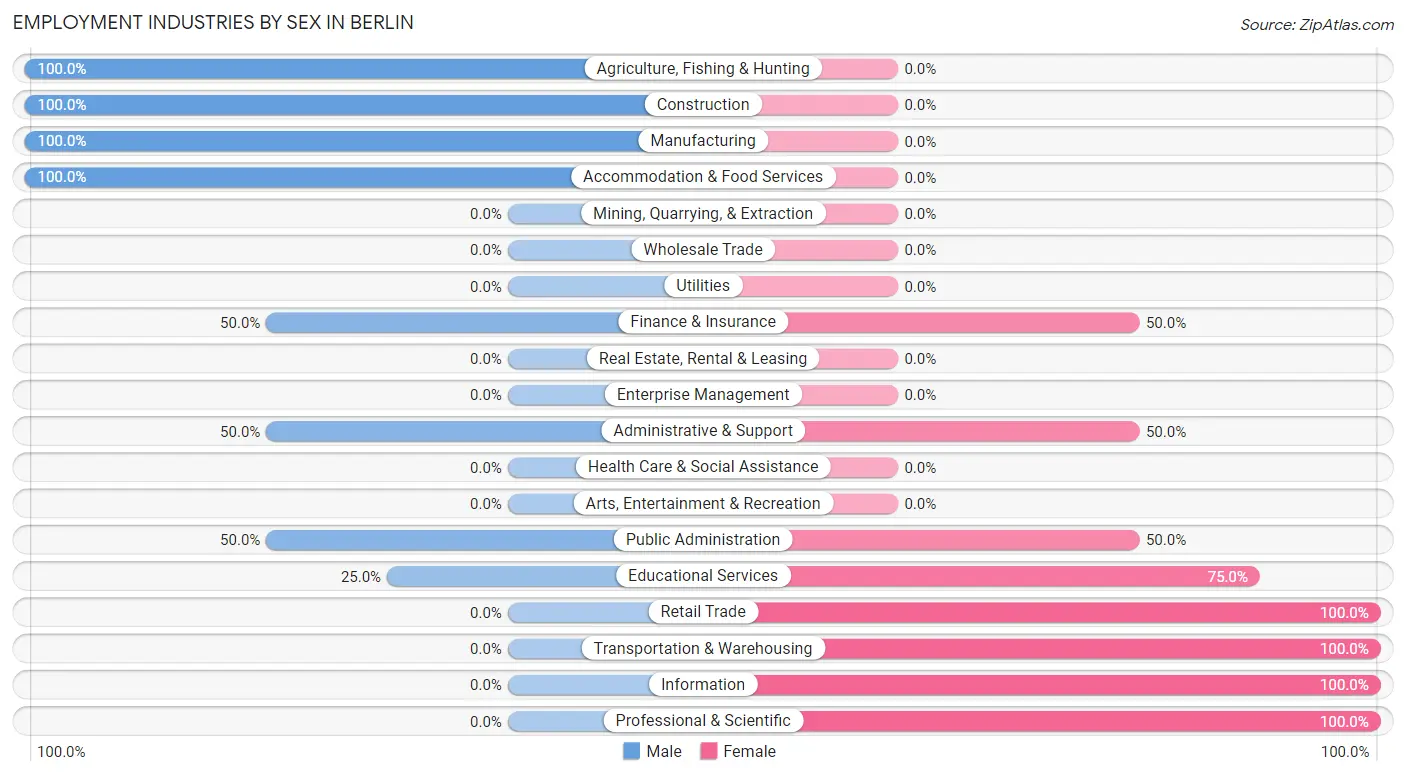
Employment Industries by Sex in Berlin
The Berlin industries that see more men than women are Agriculture, Fishing & Hunting (100.0%), Construction (100.0%), and Manufacturing (100.0%), whereas the industries that tend to have a higher number of women are Retail Trade (100.0%), Transportation & Warehousing (100.0%), and Information (100.0%).
| Industry | Male | Female |
| Agriculture, Fishing & Hunting | 1 (100.0%) | 0 (0.0%) |
| Mining, Quarrying, & Extraction | 0 (0.0%) | 0 (0.0%) |
| Construction | 10 (100.0%) | 0 (0.0%) |
| Manufacturing | 10 (100.0%) | 0 (0.0%) |
| Wholesale Trade | 0 (0.0%) | 0 (0.0%) |
| Retail Trade | 0 (0.0%) | 6 (100.0%) |
| Transportation & Warehousing | 0 (0.0%) | 3 (100.0%) |
| Utilities | 0 (0.0%) | 0 (0.0%) |
| Information | 0 (0.0%) | 6 (100.0%) |
| Finance & Insurance | 1 (50.0%) | 1 (50.0%) |
| Real Estate, Rental & Leasing | 0 (0.0%) | 0 (0.0%) |
| Professional & Scientific | 0 (0.0%) | 12 (100.0%) |
| Enterprise Management | 0 (0.0%) | 0 (0.0%) |
| Administrative & Support | 3 (50.0%) | 3 (50.0%) |
| Educational Services | 1 (25.0%) | 3 (75.0%) |
| Health Care & Social Assistance | 0 (0.0%) | 0 (0.0%) |
| Arts, Entertainment & Recreation | 0 (0.0%) | 0 (0.0%) |
| Accommodation & Food Services | 4 (100.0%) | 0 (0.0%) |
| Public Administration | 1 (50.0%) | 1 (50.0%) |
| Total | 31 (47.0%) | 35 (53.0%) |
Education in Berlin
School Enrollment in Berlin
The most common levels of schooling among the 3 students in Berlin are kindergarten (2 | 66.7%), and middle school (1 | 33.3%).
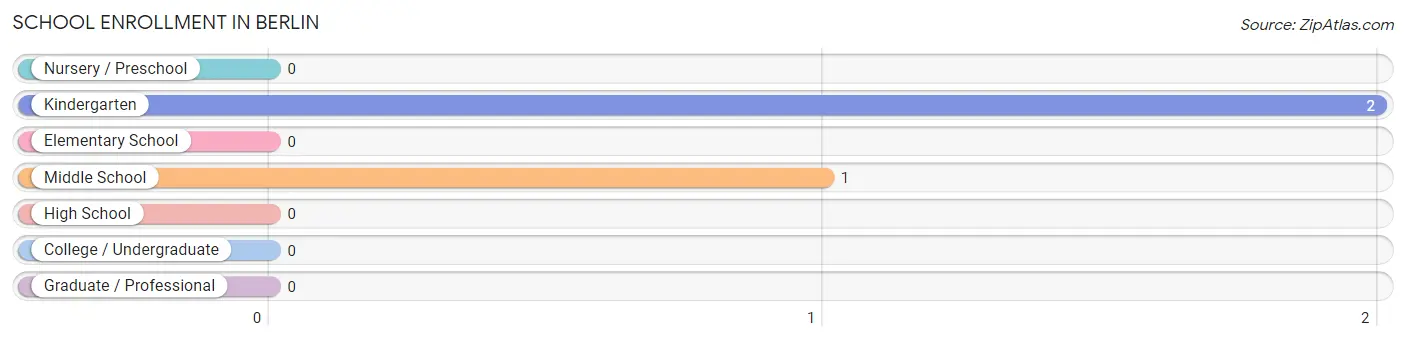
| School Level | # Students | % Students |
| Nursery / Preschool | 0 | 0.0% |
| Kindergarten | 2 | 66.7% |
| Elementary School | 0 | 0.0% |
| Middle School | 1 | 33.3% |
| High School | 0 | 0.0% |
| College / Undergraduate | 0 | 0.0% |
| Graduate / Professional | 0 | 0.0% |
| Total | 3 | 100.0% |
School Enrollment by Age by Funding Source in Berlin
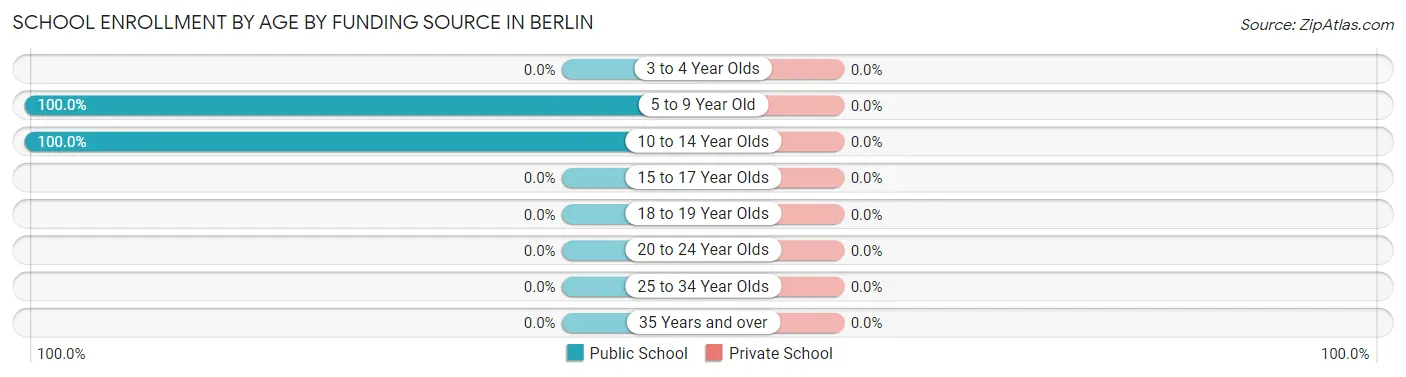
| Age Bracket | Public School | Private School |
| 3 to 4 Year Olds | 0 (0.0%) | 0 (0.0%) |
| 5 to 9 Year Old | 2 (100.0%) | 0 (0.0%) |
| 10 to 14 Year Olds | 1 (100.0%) | 0 (0.0%) |
| 15 to 17 Year Olds | 0 (0.0%) | 0 (0.0%) |
| 18 to 19 Year Olds | 0 (0.0%) | 0 (0.0%) |
| 20 to 24 Year Olds | 0 (0.0%) | 0 (0.0%) |
| 25 to 34 Year Olds | 0 (0.0%) | 0 (0.0%) |
| 35 Years and over | 0 (0.0%) | 0 (0.0%) |
| Total | 3 (100.0%) | 0 (0.0%) |
Educational Attainment by Field of Study in Berlin
Liberal arts & history (6 | 54.5%), education (2 | 18.2%), psychology (1 | 9.1%), social sciences (1 | 9.1%), and business (1 | 9.1%) are the most common fields of study among 11 individuals in Berlin who have obtained a bachelor's degree or higher.
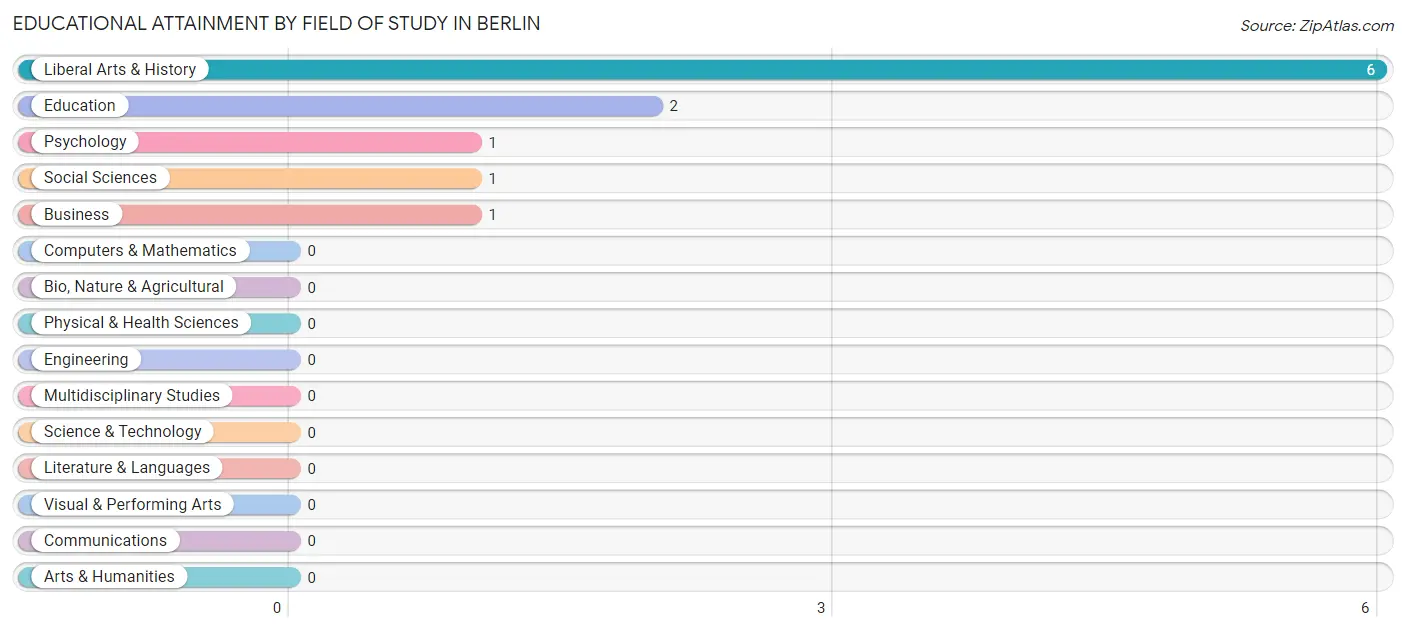
| Field of Study | # Graduates | % Graduates |
| Computers & Mathematics | 0 | 0.0% |
| Bio, Nature & Agricultural | 0 | 0.0% |
| Physical & Health Sciences | 0 | 0.0% |
| Psychology | 1 | 9.1% |
| Social Sciences | 1 | 9.1% |
| Engineering | 0 | 0.0% |
| Multidisciplinary Studies | 0 | 0.0% |
| Science & Technology | 0 | 0.0% |
| Business | 1 | 9.1% |
| Education | 2 | 18.2% |
| Literature & Languages | 0 | 0.0% |
| Liberal Arts & History | 6 | 54.5% |
| Visual & Performing Arts | 0 | 0.0% |
| Communications | 0 | 0.0% |
| Arts & Humanities | 0 | 0.0% |
| Total | 11 | 100.0% |
Transportation & Commute in Berlin
Vehicle Availability by Sex in Berlin
The most prevalent vehicle ownership categories in Berlin are males with 2 vehicles (12, accounting for 57.1%) and females with 2 vehicles (27, making up 35.3%).
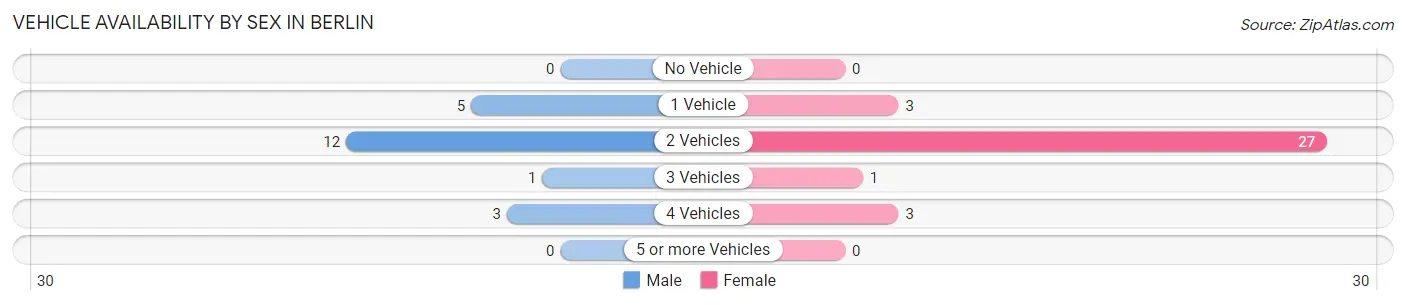
| Vehicles Available | Male | Female |
| No Vehicle | 0 (0.0%) | 0 (0.0%) |
| 1 Vehicle | 5 (23.8%) | 3 (8.8%) |
| 2 Vehicles | 12 (57.1%) | 27 (79.4%) |
| 3 Vehicles | 1 (4.8%) | 1 (2.9%) |
| 4 Vehicles | 3 (14.3%) | 3 (8.8%) |
| 5 or more Vehicles | 0 (0.0%) | 0 (0.0%) |
| Total | 21 (100.0%) | 34 (100.0%) |
Commute Time in Berlin
The most frequently occuring commute durations in Berlin are 30 to 34 minutes (26 commuters, 48.1%), 10 to 14 minutes (11 commuters, 20.4%), and 25 to 29 minutes (9 commuters, 16.7%).
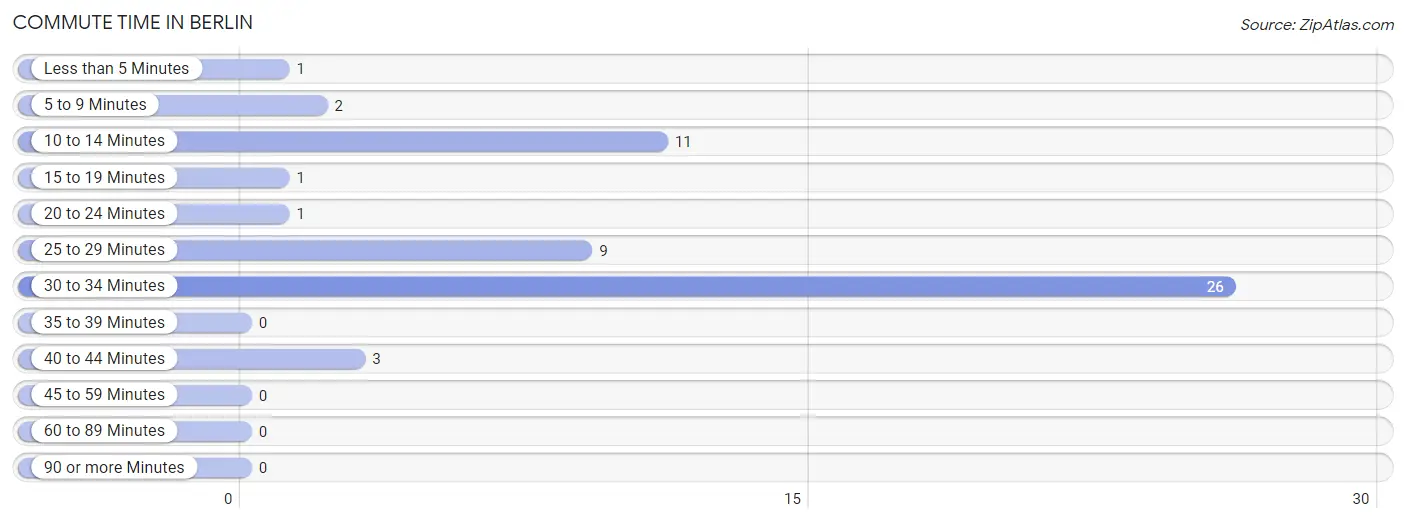
| Commute Time | # Commuters | % Commuters |
| Less than 5 Minutes | 1 | 1.8% |
| 5 to 9 Minutes | 2 | 3.7% |
| 10 to 14 Minutes | 11 | 20.4% |
| 15 to 19 Minutes | 1 | 1.8% |
| 20 to 24 Minutes | 1 | 1.8% |
| 25 to 29 Minutes | 9 | 16.7% |
| 30 to 34 Minutes | 26 | 48.1% |
| 35 to 39 Minutes | 0 | 0.0% |
| 40 to 44 Minutes | 3 | 5.6% |
| 45 to 59 Minutes | 0 | 0.0% |
| 60 to 89 Minutes | 0 | 0.0% |
| 90 or more Minutes | 0 | 0.0% |
Commute Time by Sex in Berlin
The most common commute times in Berlin are 25 to 29 minutes (9 commuters, 42.9%) for males and 30 to 34 minutes (20 commuters, 60.6%) for females.
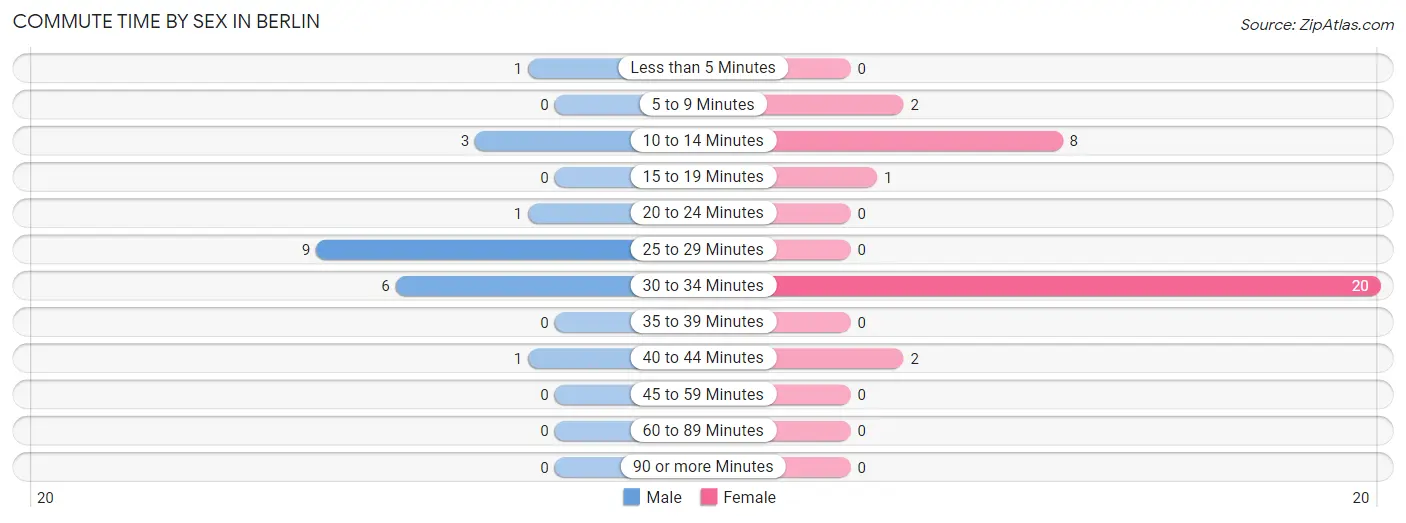
| Commute Time | Male | Female |
| Less than 5 Minutes | 1 (4.8%) | 0 (0.0%) |
| 5 to 9 Minutes | 0 (0.0%) | 2 (6.1%) |
| 10 to 14 Minutes | 3 (14.3%) | 8 (24.2%) |
| 15 to 19 Minutes | 0 (0.0%) | 1 (3.0%) |
| 20 to 24 Minutes | 1 (4.8%) | 0 (0.0%) |
| 25 to 29 Minutes | 9 (42.9%) | 0 (0.0%) |
| 30 to 34 Minutes | 6 (28.6%) | 20 (60.6%) |
| 35 to 39 Minutes | 0 (0.0%) | 0 (0.0%) |
| 40 to 44 Minutes | 1 (4.8%) | 2 (6.1%) |
| 45 to 59 Minutes | 0 (0.0%) | 0 (0.0%) |
| 60 to 89 Minutes | 0 (0.0%) | 0 (0.0%) |
| 90 or more Minutes | 0 (0.0%) | 0 (0.0%) |
Time of Departure to Work by Sex in Berlin
The most frequent times of departure to work in Berlin are 10:00 AM to 10:59 AM (9, 42.9%) for males and 7:30 AM to 7:59 AM (13, 39.4%) for females.

| Time of Departure | Male | Female |
| 12:00 AM to 4:59 AM | 4 (19.1%) | 0 (0.0%) |
| 5:00 AM to 5:29 AM | 0 (0.0%) | 0 (0.0%) |
| 5:30 AM to 5:59 AM | 0 (0.0%) | 0 (0.0%) |
| 6:00 AM to 6:29 AM | 5 (23.8%) | 11 (33.3%) |
| 6:30 AM to 6:59 AM | 1 (4.8%) | 0 (0.0%) |
| 7:00 AM to 7:29 AM | 1 (4.8%) | 4 (12.1%) |
| 7:30 AM to 7:59 AM | 0 (0.0%) | 13 (39.4%) |
| 8:00 AM to 8:29 AM | 1 (4.8%) | 3 (9.1%) |
| 8:30 AM to 8:59 AM | 0 (0.0%) | 0 (0.0%) |
| 9:00 AM to 9:59 AM | 0 (0.0%) | 0 (0.0%) |
| 10:00 AM to 10:59 AM | 9 (42.9%) | 2 (6.1%) |
| 11:00 AM to 11:59 AM | 0 (0.0%) | 0 (0.0%) |
| 12:00 PM to 3:59 PM | 0 (0.0%) | 0 (0.0%) |
| 4:00 PM to 11:59 PM | 0 (0.0%) | 0 (0.0%) |
| Total | 21 (100.0%) | 33 (100.0%) |
Housing Occupancy in Berlin
Occupancy by Ownership in Berlin
Of the total 61 dwellings in Berlin, owner-occupied units account for 48 (78.7%), while renter-occupied units make up 13 (21.3%).
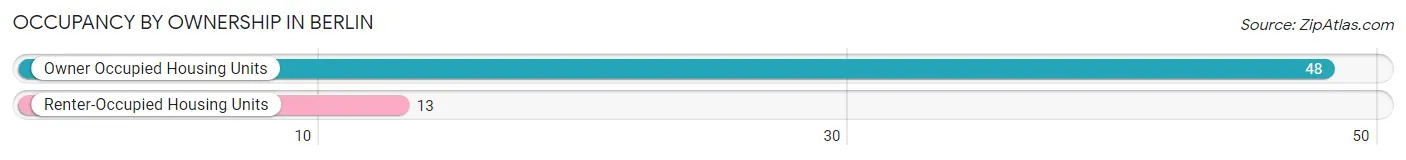
| Occupancy | # Housing Units | % Housing Units |
| Owner Occupied Housing Units | 48 | 78.7% |
| Renter-Occupied Housing Units | 13 | 21.3% |
| Total Occupied Housing Units | 61 | 100.0% |
Occupancy by Household Size in Berlin
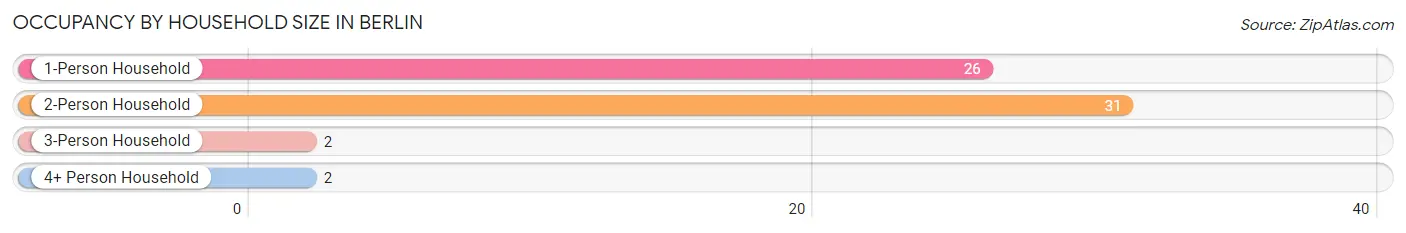
| Household Size | # Housing Units | % Housing Units |
| 1-Person Household | 26 | 42.6% |
| 2-Person Household | 31 | 50.8% |
| 3-Person Household | 2 | 3.3% |
| 4+ Person Household | 2 | 3.3% |
| Total Housing Units | 61 | 100.0% |
Occupancy by Ownership by Household Size in Berlin
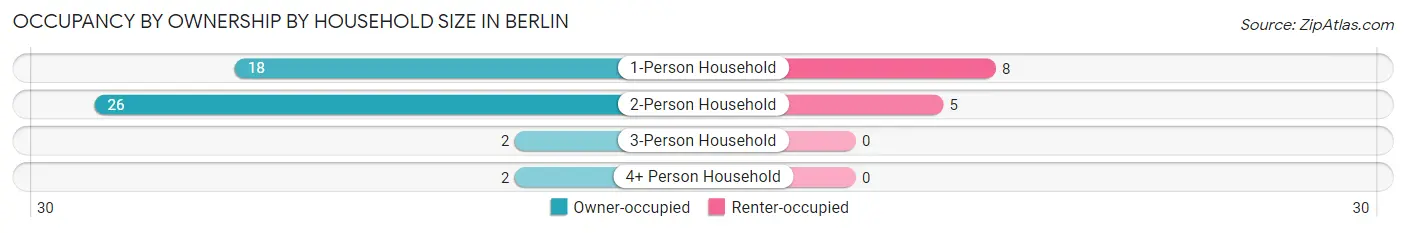
| Household Size | Owner-occupied | Renter-occupied |
| 1-Person Household | 18 (69.2%) | 8 (30.8%) |
| 2-Person Household | 26 (83.9%) | 5 (16.1%) |
| 3-Person Household | 2 (100.0%) | 0 (0.0%) |
| 4+ Person Household | 2 (100.0%) | 0 (0.0%) |
| Total Housing Units | 48 (78.7%) | 13 (21.3%) |
Occupancy by Educational Attainment in Berlin
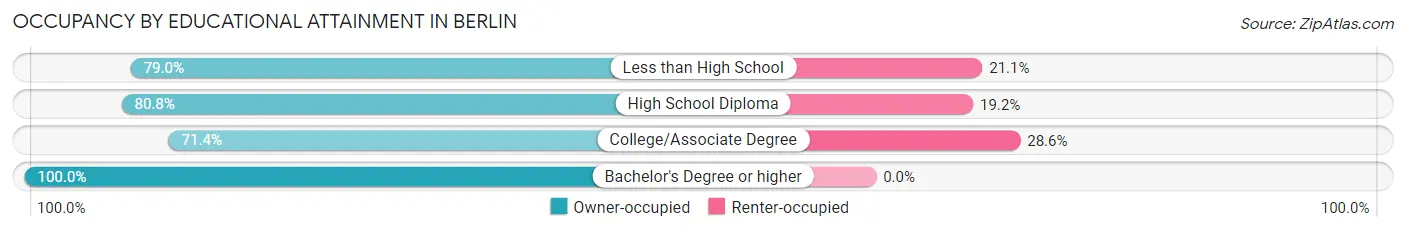
| Household Size | Owner-occupied | Renter-occupied |
| Less than High School | 15 (78.9%) | 4 (21.0%) |
| High School Diploma | 21 (80.8%) | 5 (19.2%) |
| College/Associate Degree | 10 (71.4%) | 4 (28.6%) |
| Bachelor's Degree or higher | 2 (100.0%) | 0 (0.0%) |
Occupancy by Age of Householder in Berlin
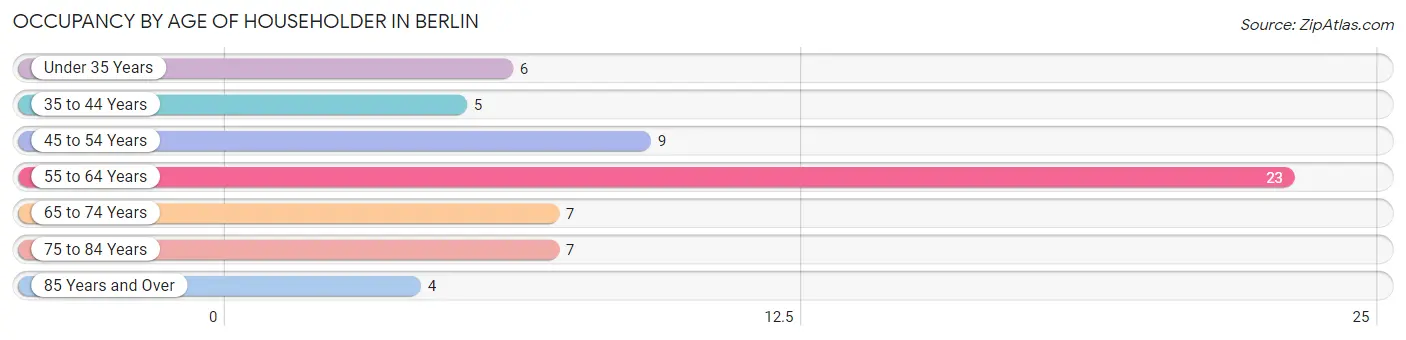
| Age Bracket | # Households | % Households |
| Under 35 Years | 6 | 9.8% |
| 35 to 44 Years | 5 | 8.2% |
| 45 to 54 Years | 9 | 14.7% |
| 55 to 64 Years | 23 | 37.7% |
| 65 to 74 Years | 7 | 11.5% |
| 75 to 84 Years | 7 | 11.5% |
| 85 Years and Over | 4 | 6.6% |
| Total | 61 | 100.0% |
Housing Finances in Berlin
Median Income by Occupancy in Berlin
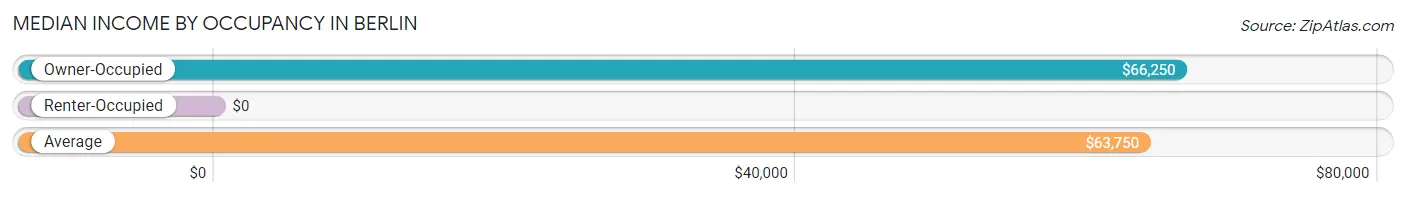
| Occupancy Type | # Households | Median Income |
| Owner-Occupied | 48 (78.7%) | $66,250 |
| Renter-Occupied | 13 (21.3%) | $0 |
| Average | 61 (100.0%) | $63,750 |
Occupancy by Householder Income Bracket in Berlin
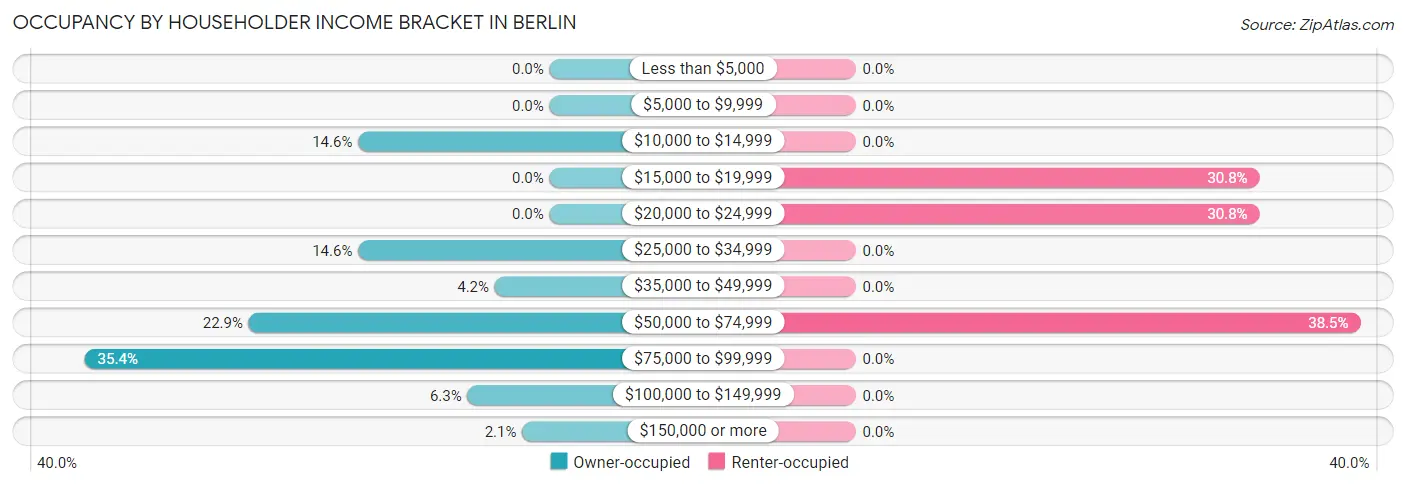
| Income Bracket | Owner-occupied | Renter-occupied |
| Less than $5,000 | 0 (0.0%) | 0 (0.0%) |
| $5,000 to $9,999 | 0 (0.0%) | 0 (0.0%) |
| $10,000 to $14,999 | 7 (14.6%) | 0 (0.0%) |
| $15,000 to $19,999 | 0 (0.0%) | 4 (30.8%) |
| $20,000 to $24,999 | 0 (0.0%) | 4 (30.8%) |
| $25,000 to $34,999 | 7 (14.6%) | 0 (0.0%) |
| $35,000 to $49,999 | 2 (4.2%) | 0 (0.0%) |
| $50,000 to $74,999 | 11 (22.9%) | 5 (38.5%) |
| $75,000 to $99,999 | 17 (35.4%) | 0 (0.0%) |
| $100,000 to $149,999 | 3 (6.2%) | 0 (0.0%) |
| $150,000 or more | 1 (2.1%) | 0 (0.0%) |
| Total | 48 (100.0%) | 13 (100.0%) |
Monthly Housing Cost Tiers in Berlin
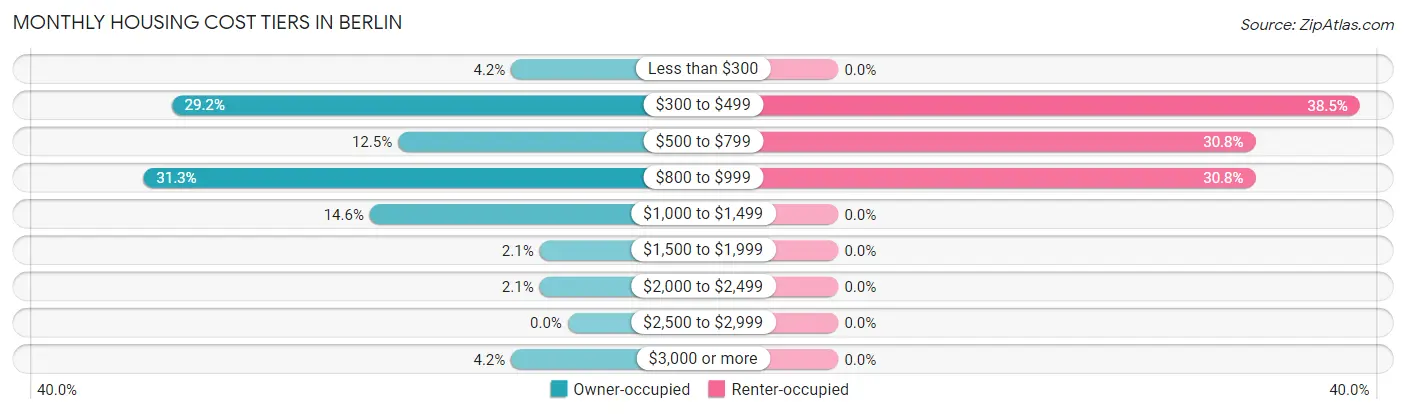
| Monthly Cost | Owner-occupied | Renter-occupied |
| Less than $300 | 2 (4.2%) | 0 (0.0%) |
| $300 to $499 | 14 (29.2%) | 5 (38.5%) |
| $500 to $799 | 6 (12.5%) | 4 (30.8%) |
| $800 to $999 | 15 (31.2%) | 4 (30.8%) |
| $1,000 to $1,499 | 7 (14.6%) | 0 (0.0%) |
| $1,500 to $1,999 | 1 (2.1%) | 0 (0.0%) |
| $2,000 to $2,499 | 1 (2.1%) | 0 (0.0%) |
| $2,500 to $2,999 | 0 (0.0%) | 0 (0.0%) |
| $3,000 or more | 2 (4.2%) | 0 (0.0%) |
| Total | 48 (100.0%) | 13 (100.0%) |
Physical Housing Characteristics in Berlin
Housing Structures in Berlin
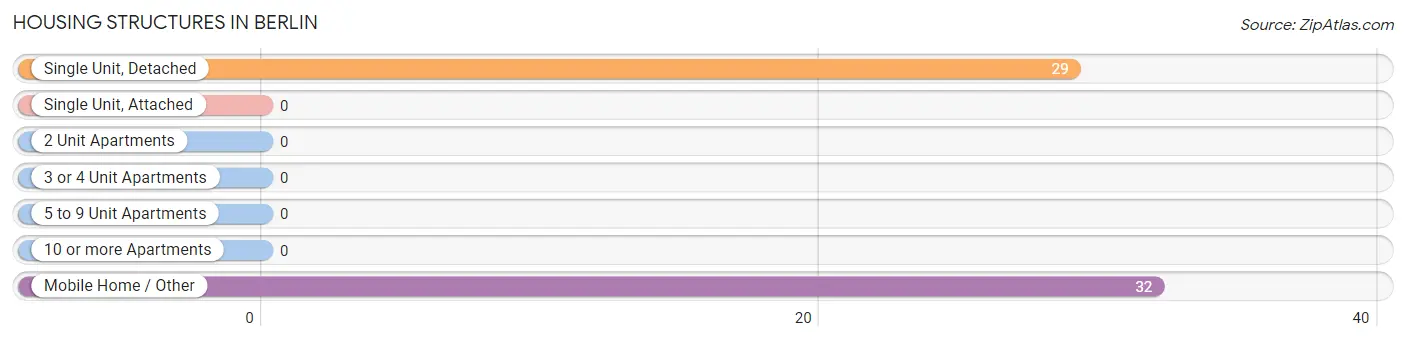
| Structure Type | # Housing Units | % Housing Units |
| Single Unit, Detached | 29 | 47.5% |
| Single Unit, Attached | 0 | 0.0% |
| 2 Unit Apartments | 0 | 0.0% |
| 3 or 4 Unit Apartments | 0 | 0.0% |
| 5 to 9 Unit Apartments | 0 | 0.0% |
| 10 or more Apartments | 0 | 0.0% |
| Mobile Home / Other | 32 | 52.5% |
| Total | 61 | 100.0% |
Housing Structures by Occupancy in Berlin
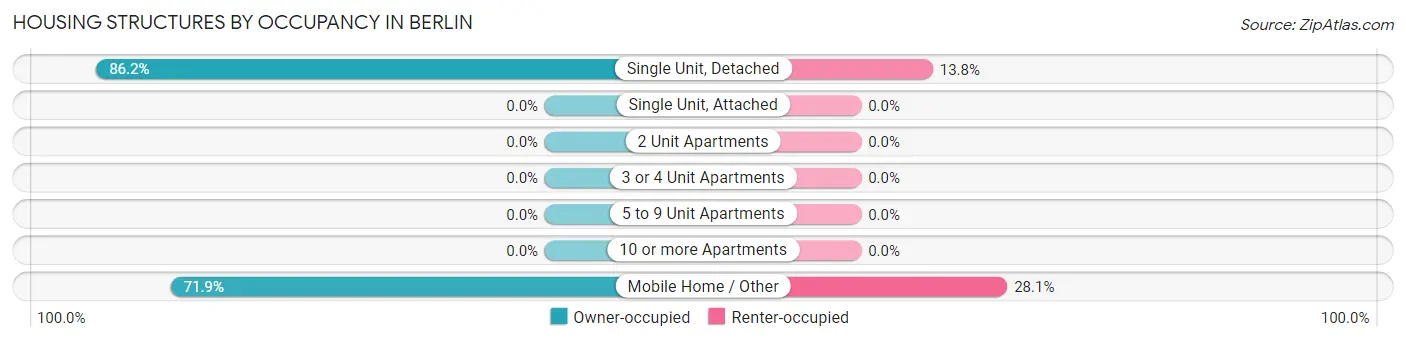
| Structure Type | Owner-occupied | Renter-occupied |
| Single Unit, Detached | 25 (86.2%) | 4 (13.8%) |
| Single Unit, Attached | 0 (0.0%) | 0 (0.0%) |
| 2 Unit Apartments | 0 (0.0%) | 0 (0.0%) |
| 3 or 4 Unit Apartments | 0 (0.0%) | 0 (0.0%) |
| 5 to 9 Unit Apartments | 0 (0.0%) | 0 (0.0%) |
| 10 or more Apartments | 0 (0.0%) | 0 (0.0%) |
| Mobile Home / Other | 23 (71.9%) | 9 (28.1%) |
| Total | 48 (78.7%) | 13 (21.3%) |
Housing Structures by Number of Rooms in Berlin
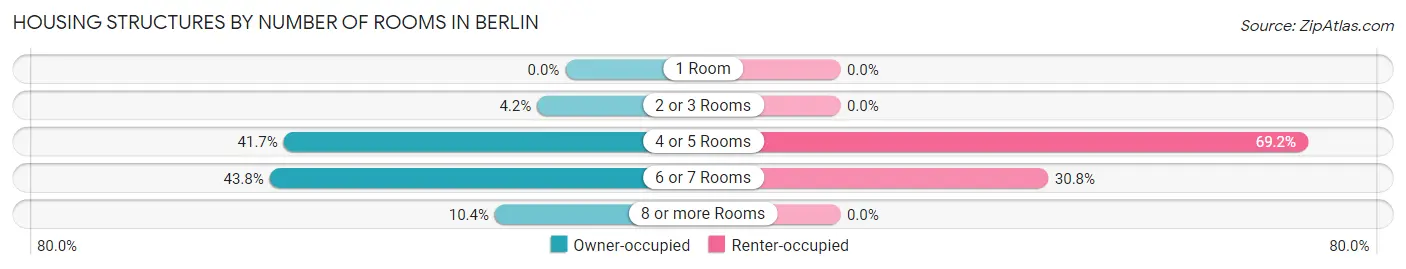
| Number of Rooms | Owner-occupied | Renter-occupied |
| 1 Room | 0 (0.0%) | 0 (0.0%) |
| 2 or 3 Rooms | 2 (4.2%) | 0 (0.0%) |
| 4 or 5 Rooms | 20 (41.7%) | 9 (69.2%) |
| 6 or 7 Rooms | 21 (43.8%) | 4 (30.8%) |
| 8 or more Rooms | 5 (10.4%) | 0 (0.0%) |
| Total | 48 (100.0%) | 13 (100.0%) |
Housing Structure by Heating Type in Berlin
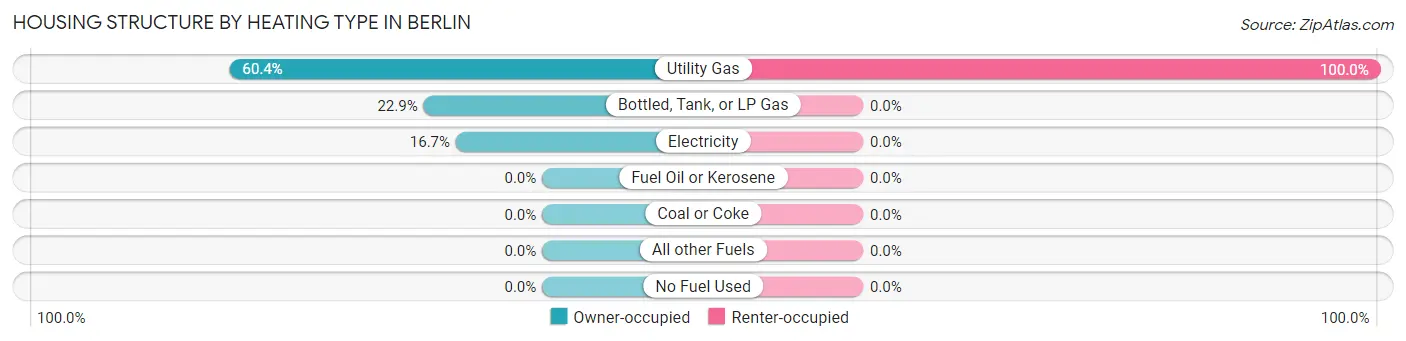
| Heating Type | Owner-occupied | Renter-occupied |
| Utility Gas | 29 (60.4%) | 13 (100.0%) |
| Bottled, Tank, or LP Gas | 11 (22.9%) | 0 (0.0%) |
| Electricity | 8 (16.7%) | 0 (0.0%) |
| Fuel Oil or Kerosene | 0 (0.0%) | 0 (0.0%) |
| Coal or Coke | 0 (0.0%) | 0 (0.0%) |
| All other Fuels | 0 (0.0%) | 0 (0.0%) |
| No Fuel Used | 0 (0.0%) | 0 (0.0%) |
| Total | 48 (100.0%) | 13 (100.0%) |
Household Vehicle Usage in Berlin
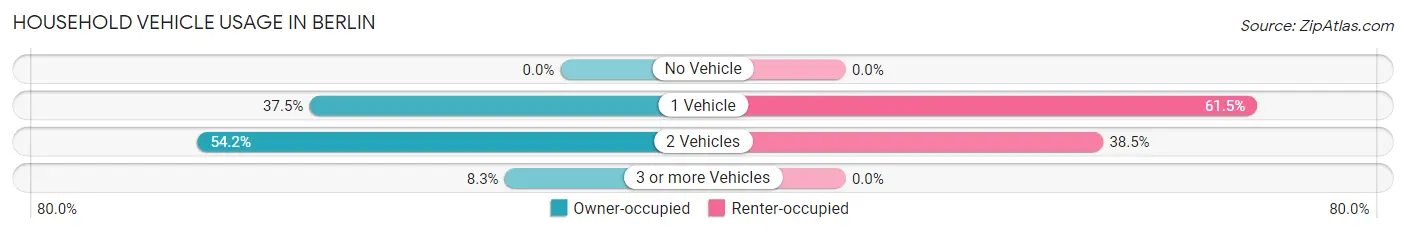
| Vehicles per Household | Owner-occupied | Renter-occupied |
| No Vehicle | 0 (0.0%) | 0 (0.0%) |
| 1 Vehicle | 18 (37.5%) | 8 (61.5%) |
| 2 Vehicles | 26 (54.2%) | 5 (38.5%) |
| 3 or more Vehicles | 4 (8.3%) | 0 (0.0%) |
| Total | 48 (100.0%) | 13 (100.0%) |
Real Estate & Mortgages in Berlin
Real Estate and Mortgage Overview in Berlin
| Characteristic | Without Mortgage | With Mortgage |
| Housing Units | 20 | 28 |
| Median Property Value | - | - |
| Median Household Income | $83,250 | $0 |
| Monthly Housing Costs | $457 | $2 |
| Real Estate Taxes | $199 | $0 |
Property Value by Mortgage Status in Berlin
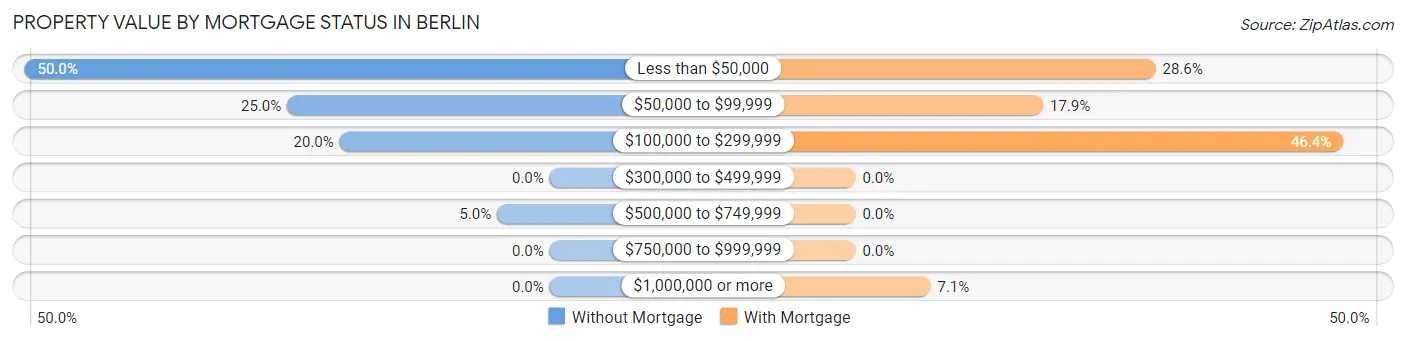
| Property Value | Without Mortgage | With Mortgage |
| Less than $50,000 | 10 (50.0%) | 8 (28.6%) |
| $50,000 to $99,999 | 5 (25.0%) | 5 (17.9%) |
| $100,000 to $299,999 | 4 (20.0%) | 13 (46.4%) |
| $300,000 to $499,999 | 0 (0.0%) | 0 (0.0%) |
| $500,000 to $749,999 | 1 (5.0%) | 0 (0.0%) |
| $750,000 to $999,999 | 0 (0.0%) | 0 (0.0%) |
| $1,000,000 or more | 0 (0.0%) | 2 (7.1%) |
| Total | 20 (100.0%) | 28 (100.0%) |
Household Income by Mortgage Status in Berlin
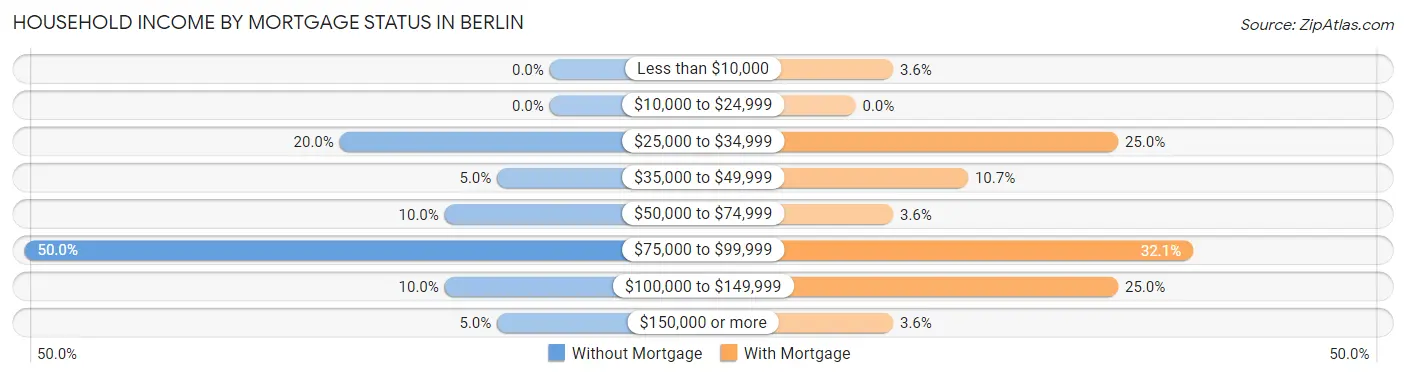
| Household Income | Without Mortgage | With Mortgage |
| Less than $10,000 | 0 (0.0%) | 1 (3.6%) |
| $10,000 to $24,999 | 0 (0.0%) | 0 (0.0%) |
| $25,000 to $34,999 | 4 (20.0%) | 7 (25.0%) |
| $35,000 to $49,999 | 1 (5.0%) | 3 (10.7%) |
| $50,000 to $74,999 | 2 (10.0%) | 1 (3.6%) |
| $75,000 to $99,999 | 10 (50.0%) | 9 (32.1%) |
| $100,000 to $149,999 | 2 (10.0%) | 7 (25.0%) |
| $150,000 or more | 1 (5.0%) | 1 (3.6%) |
| Total | 20 (100.0%) | 28 (100.0%) |
Property Value to Household Income Ratio in Berlin
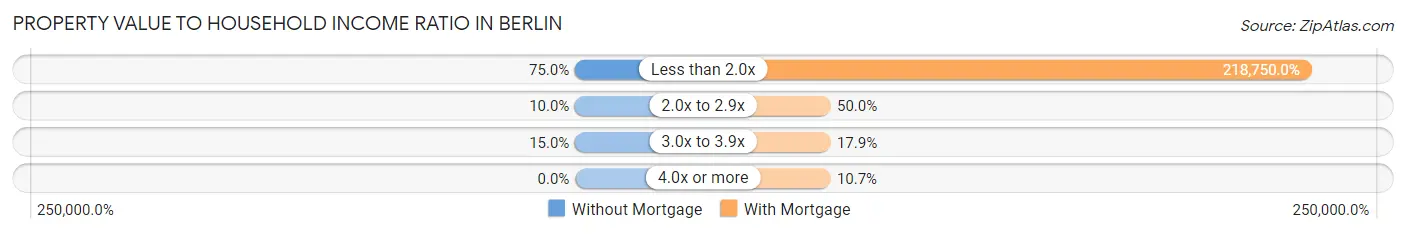
| Value-to-Income Ratio | Without Mortgage | With Mortgage |
| Less than 2.0x | 15 (75.0%) | 61,250 (218,750.0%) |
| 2.0x to 2.9x | 2 (10.0%) | 14 (50.0%) |
| 3.0x to 3.9x | 3 (15.0%) | 5 (17.9%) |
| 4.0x or more | 0 (0.0%) | 3 (10.7%) |
| Total | 20 (100.0%) | 28 (100.0%) |
Real Estate Taxes by Mortgage Status in Berlin
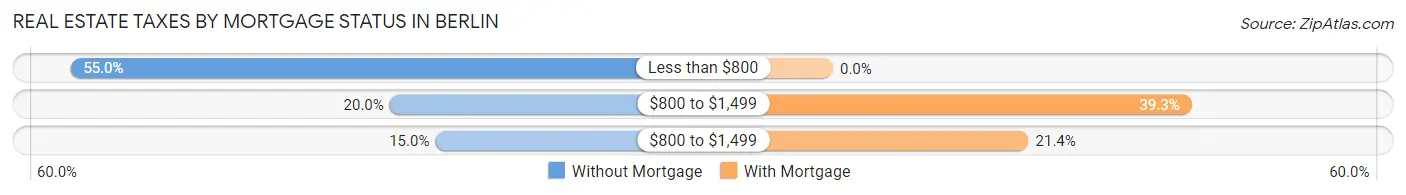
| Property Taxes | Without Mortgage | With Mortgage |
| Less than $800 | 11 (55.0%) | 0 (0.0%) |
| $800 to $1,499 | 4 (20.0%) | 11 (39.3%) |
| $800 to $1,499 | 3 (15.0%) | 6 (21.4%) |
| Total | 20 (100.0%) | 28 (100.0%) |
Health & Disability in Berlin
Health Insurance Coverage by Age in Berlin
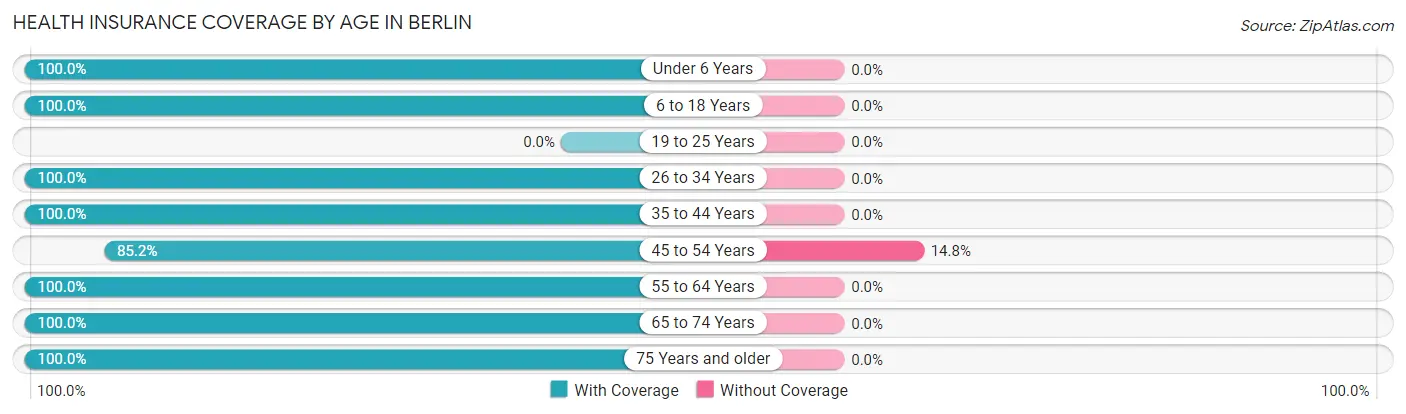
| Age Bracket | With Coverage | Without Coverage |
| Under 6 Years | 3 (100.0%) | 0 (0.0%) |
| 6 to 18 Years | 3 (100.0%) | 0 (0.0%) |
| 19 to 25 Years | 0 (0.0%) | 0 (0.0%) |
| 26 to 34 Years | 14 (100.0%) | 0 (0.0%) |
| 35 to 44 Years | 9 (100.0%) | 0 (0.0%) |
| 45 to 54 Years | 23 (85.2%) | 4 (14.8%) |
| 55 to 64 Years | 30 (100.0%) | 0 (0.0%) |
| 65 to 74 Years | 8 (100.0%) | 0 (0.0%) |
| 75 Years and older | 14 (100.0%) | 0 (0.0%) |
| Total | 104 (96.3%) | 4 (3.7%) |
Health Insurance Coverage by Citizenship Status in Berlin
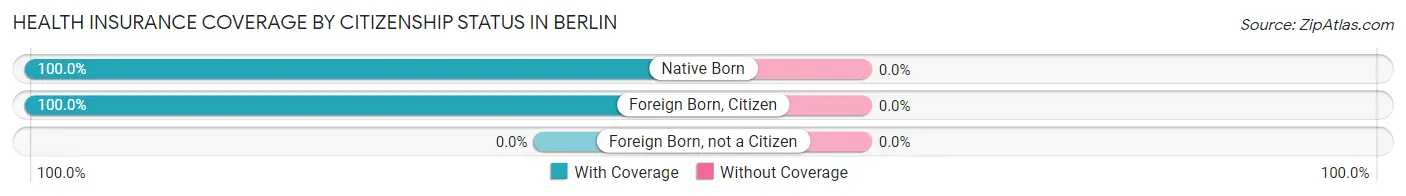
| Citizenship Status | With Coverage | Without Coverage |
| Native Born | 3 (100.0%) | 0 (0.0%) |
| Foreign Born, Citizen | 3 (100.0%) | 0 (0.0%) |
| Foreign Born, not a Citizen | 0 (0.0%) | 0 (0.0%) |
Health Insurance Coverage by Household Income in Berlin
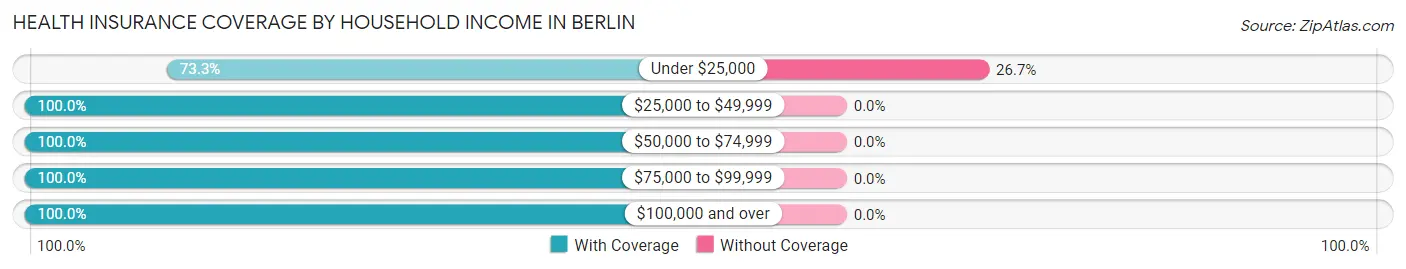
| Household Income | With Coverage | Without Coverage |
| Under $25,000 | 11 (73.3%) | 4 (26.7%) |
| $25,000 to $49,999 | 12 (100.0%) | 0 (0.0%) |
| $50,000 to $74,999 | 34 (100.0%) | 0 (0.0%) |
| $75,000 to $99,999 | 35 (100.0%) | 0 (0.0%) |
| $100,000 and over | 12 (100.0%) | 0 (0.0%) |
Public vs Private Health Insurance Coverage by Age in Berlin
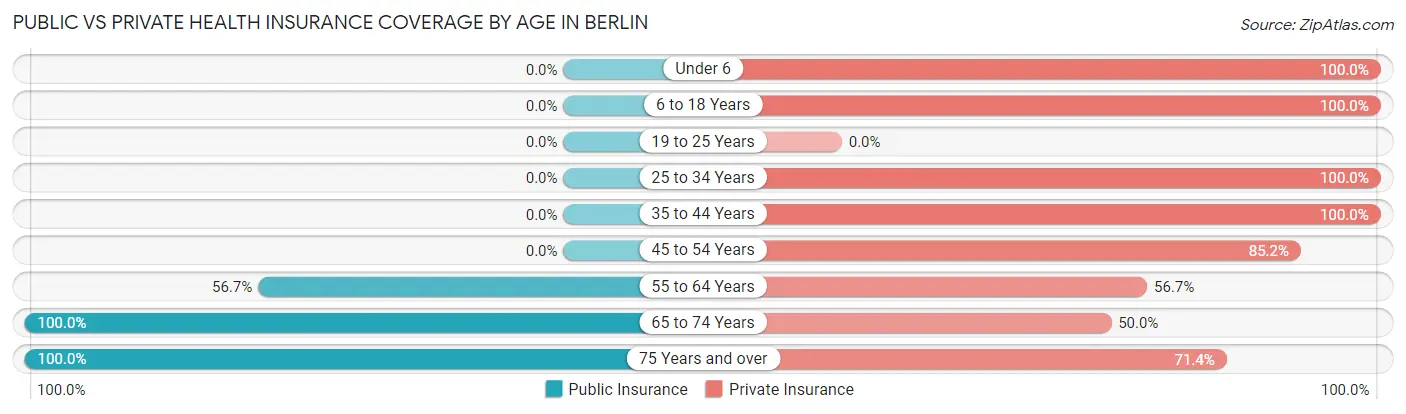
| Age Bracket | Public Insurance | Private Insurance |
| Under 6 | 0 (0.0%) | 3 (100.0%) |
| 6 to 18 Years | 0 (0.0%) | 3 (100.0%) |
| 19 to 25 Years | 0 (0.0%) | 0 (0.0%) |
| 25 to 34 Years | 0 (0.0%) | 14 (100.0%) |
| 35 to 44 Years | 0 (0.0%) | 9 (100.0%) |
| 45 to 54 Years | 0 (0.0%) | 23 (85.2%) |
| 55 to 64 Years | 17 (56.7%) | 17 (56.7%) |
| 65 to 74 Years | 8 (100.0%) | 4 (50.0%) |
| 75 Years and over | 14 (100.0%) | 10 (71.4%) |
| Total | 39 (36.1%) | 83 (76.8%) |
Disability Status by Sex by Age in Berlin
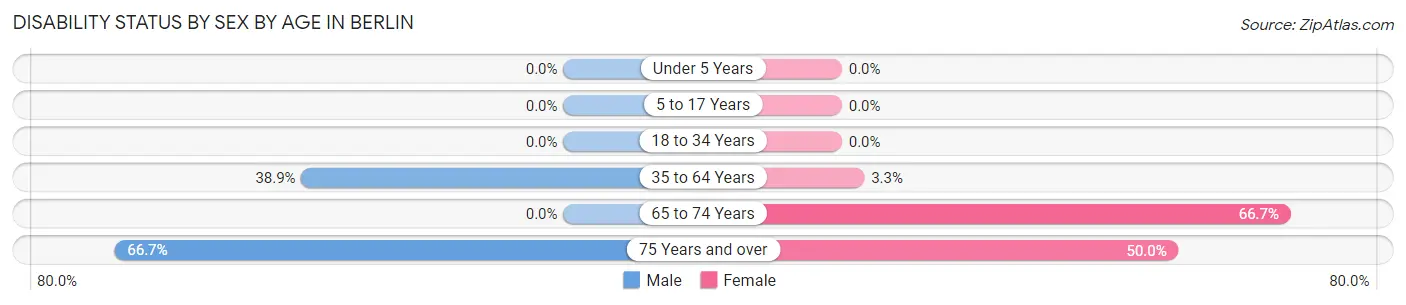
| Age Bracket | Male | Female |
| Under 5 Years | 0 (0.0%) | 0 (0.0%) |
| 5 to 17 Years | 0 (0.0%) | 0 (0.0%) |
| 18 to 34 Years | 0 (0.0%) | 0 (0.0%) |
| 35 to 64 Years | 14 (38.9%) | 1 (3.3%) |
| 65 to 74 Years | 0 (0.0%) | 4 (66.7%) |
| 75 Years and over | 4 (66.7%) | 4 (50.0%) |
Disability Class by Sex by Age in Berlin
Disability Class: Hearing Difficulty
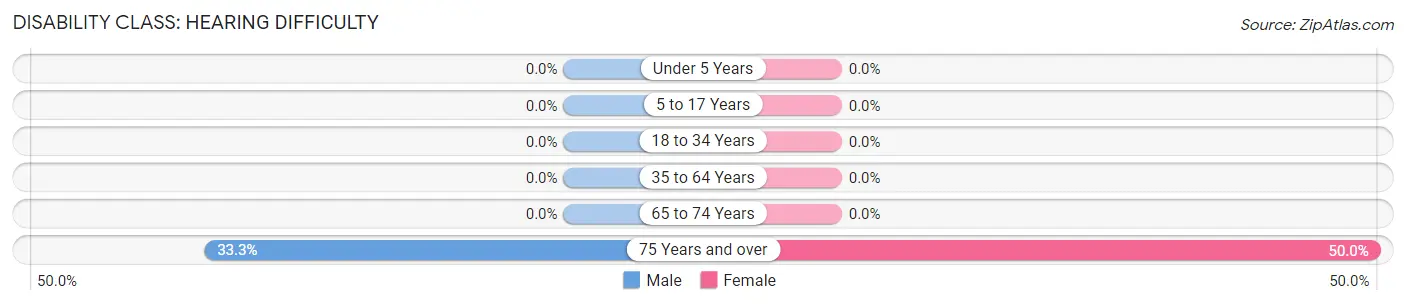
| Age Bracket | Male | Female |
| Under 5 Years | 0 (0.0%) | 0 (0.0%) |
| 5 to 17 Years | 0 (0.0%) | 0 (0.0%) |
| 18 to 34 Years | 0 (0.0%) | 0 (0.0%) |
| 35 to 64 Years | 0 (0.0%) | 0 (0.0%) |
| 65 to 74 Years | 0 (0.0%) | 0 (0.0%) |
| 75 Years and over | 2 (33.3%) | 4 (50.0%) |
Disability Class: Vision Difficulty
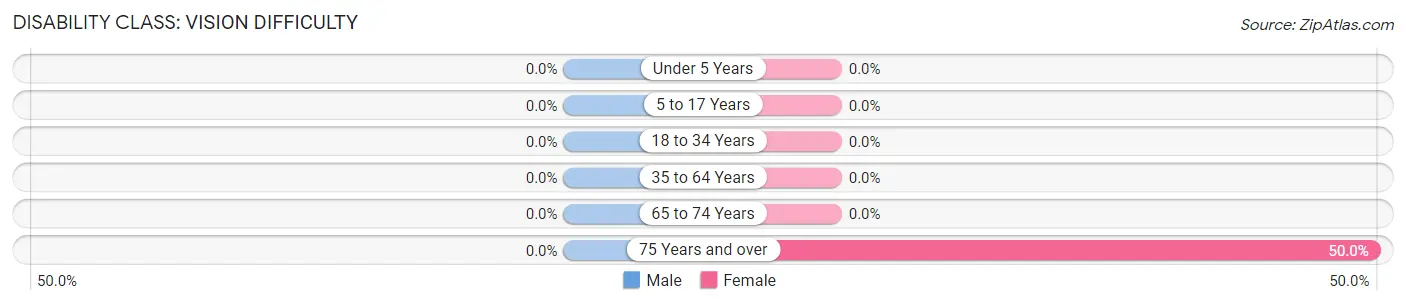
| Age Bracket | Male | Female |
| Under 5 Years | 0 (0.0%) | 0 (0.0%) |
| 5 to 17 Years | 0 (0.0%) | 0 (0.0%) |
| 18 to 34 Years | 0 (0.0%) | 0 (0.0%) |
| 35 to 64 Years | 0 (0.0%) | 0 (0.0%) |
| 65 to 74 Years | 0 (0.0%) | 0 (0.0%) |
| 75 Years and over | 0 (0.0%) | 4 (50.0%) |
Disability Class: Cognitive Difficulty
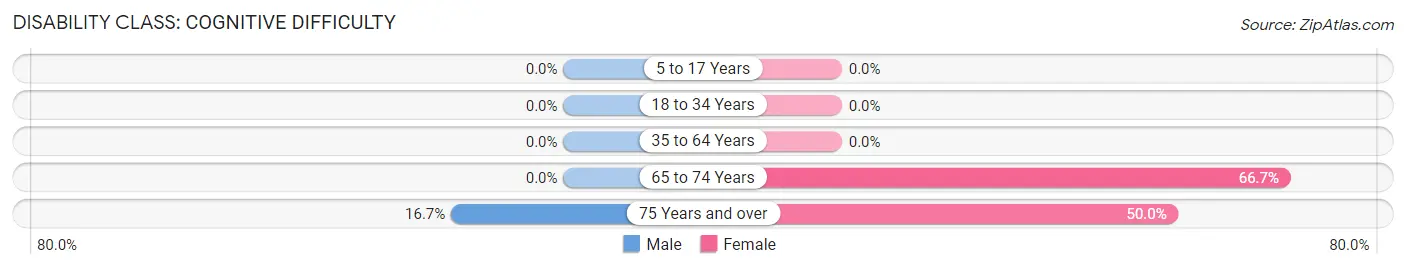
| Age Bracket | Male | Female |
| 5 to 17 Years | 0 (0.0%) | 0 (0.0%) |
| 18 to 34 Years | 0 (0.0%) | 0 (0.0%) |
| 35 to 64 Years | 0 (0.0%) | 0 (0.0%) |
| 65 to 74 Years | 0 (0.0%) | 4 (66.7%) |
| 75 Years and over | 1 (16.7%) | 4 (50.0%) |
Disability Class: Ambulatory Difficulty
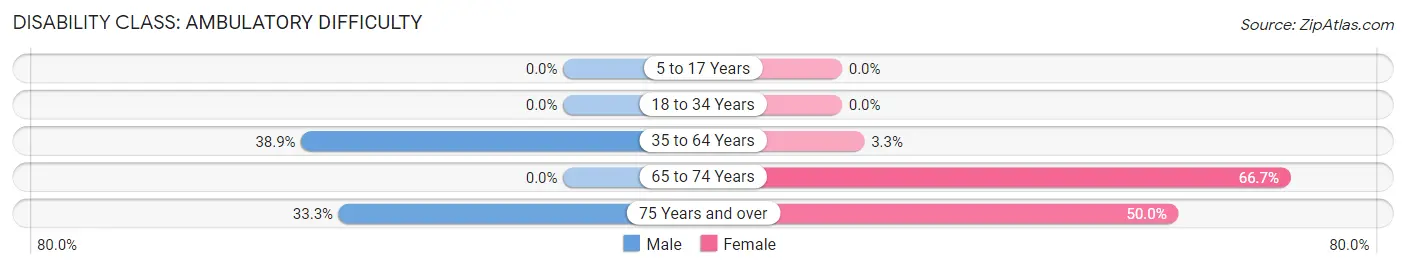
| Age Bracket | Male | Female |
| 5 to 17 Years | 0 (0.0%) | 0 (0.0%) |
| 18 to 34 Years | 0 (0.0%) | 0 (0.0%) |
| 35 to 64 Years | 14 (38.9%) | 1 (3.3%) |
| 65 to 74 Years | 0 (0.0%) | 4 (66.7%) |
| 75 Years and over | 2 (33.3%) | 4 (50.0%) |
Disability Class: Self-Care Difficulty
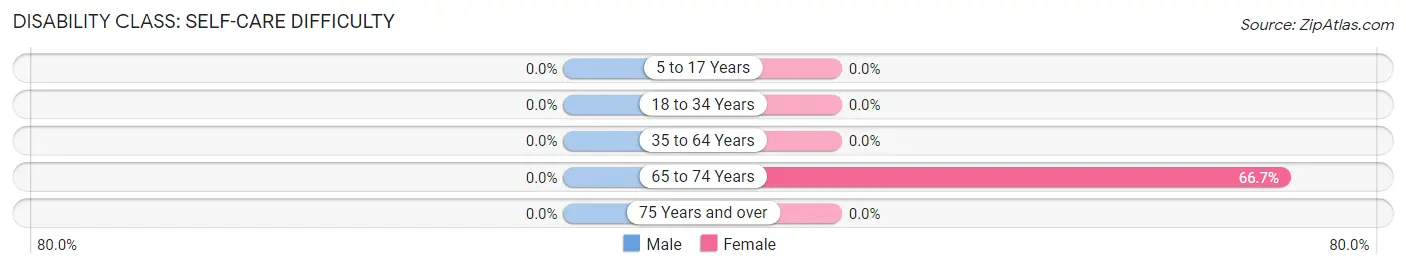
| Age Bracket | Male | Female |
| 5 to 17 Years | 0 (0.0%) | 0 (0.0%) |
| 18 to 34 Years | 0 (0.0%) | 0 (0.0%) |
| 35 to 64 Years | 0 (0.0%) | 0 (0.0%) |
| 65 to 74 Years | 0 (0.0%) | 4 (66.7%) |
| 75 Years and over | 0 (0.0%) | 0 (0.0%) |
Technology Access in Berlin
Computing Device Access in Berlin
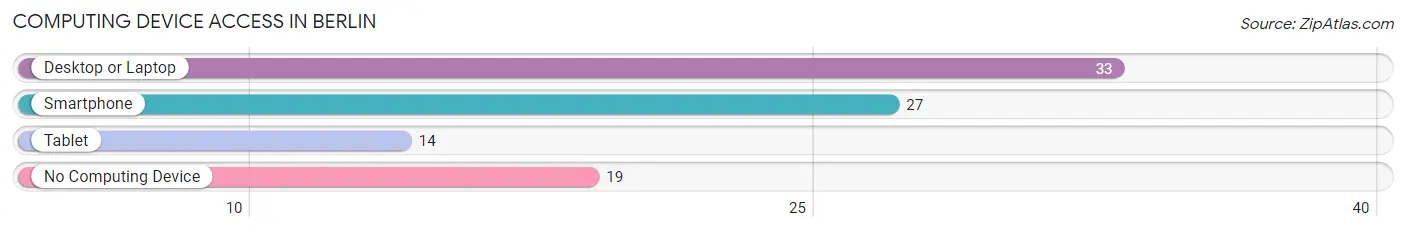
| Device Type | # Households | % Households |
| Desktop or Laptop | 33 | 54.1% |
| Smartphone | 27 | 44.3% |
| Tablet | 14 | 23.0% |
| No Computing Device | 19 | 31.1% |
| Total | 61 | 100.0% |
Internet Access in Berlin
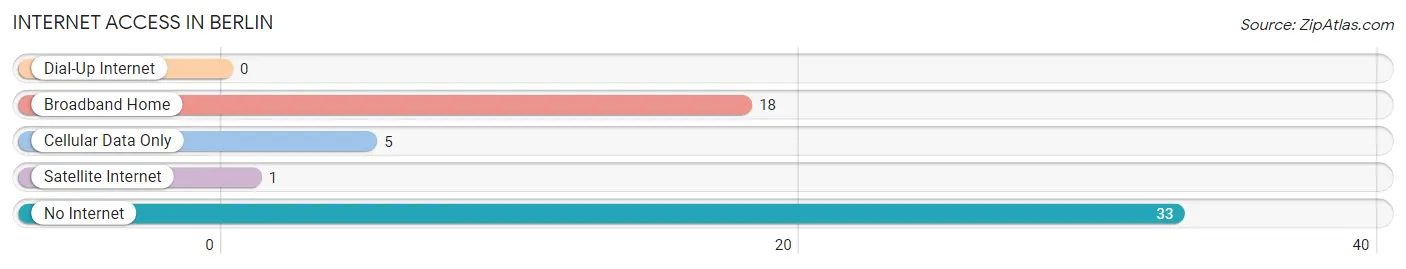
| Internet Type | # Households | % Households |
| Dial-Up Internet | 0 | 0.0% |
| Broadband Home | 18 | 29.5% |
| Cellular Data Only | 5 | 8.2% |
| Satellite Internet | 1 | 1.6% |
| No Internet | 33 | 54.1% |
| Total | 61 | 100.0% |
Berlin Summary
Berlin, Illinois is a small village located in the western part of the state, in Jo Daviess County. It is situated on the banks of the Galena River, and is surrounded by rolling hills and lush forests. The village has a population of just over 500 people, and is known for its small-town charm and friendly atmosphere.
History
Berlin was founded in 1835 by a group of German immigrants who had come to the area in search of a better life. The village was named after the German city of Berlin, and the settlers quickly established a thriving community. The village was incorporated in 1854, and the first mayor was elected in 1855.
The village grew steadily over the years, and by the turn of the century, it had become a popular tourist destination. The Galena River was a major draw for visitors, and the village was home to several resorts and hotels. The village also had a thriving business district, with several stores and businesses.
In the early 1900s, the village was home to a large number of German immigrants, and the village was known for its German culture and traditions. The village was also home to a large number of Italian immigrants, and the two cultures blended together to create a unique and vibrant community.
Geography
Berlin is located in the western part of the state, in Jo Daviess County. The village is situated on the banks of the Galena River, and is surrounded by rolling hills and lush forests. The village is located about 25 miles from the city of Galena, and is about an hour and a half drive from the state capital of Springfield.
The village is located in a temperate climate, with warm summers and cold winters. The average temperature in the summer is around 75 degrees Fahrenheit, and the average temperature in the winter is around 25 degrees Fahrenheit.
Economy
The economy of Berlin is largely based on tourism and agriculture. The village is home to several resorts and hotels, which attract visitors from all over the state and beyond. The village is also home to several farms, which produce a variety of crops, including corn, soybeans, and wheat.
The village also has a thriving business district, with several stores and businesses. The village is home to several restaurants, bars, and other businesses, which provide employment for many of the village’s residents.
Demographics
As of the 2010 census, the population of Berlin was 514. The village is predominantly white, with 92.3% of the population identifying as white. The village is also home to a small number of African Americans, Hispanics, and Asians. The median household income in the village is $45,000, and the median age is 44.
Berlin is a small village with a rich history and a vibrant culture. The village is home to a diverse population, and is known for its small-town charm and friendly atmosphere. The village is a popular tourist destination, and is home to several resorts and hotels. The village also has a thriving business district, with several stores and businesses. The village is a great place to live, work, and visit.
Common Questions
What is Per Capita Income in Berlin?
Per Capita income in Berlin is $34,145.
What is the Median Family Income in Berlin?
Median Family Income in Berlin is $82,625.
What is the Median Household income in Berlin?
Median Household Income in Berlin is $63,750.
What is Income or Wage Gap in Berlin?
Income or Wage Gap in Berlin is 6.7%.
Women in Berlin earn 93.3 cents for every dollar earned by a man.
What is Inequality or Gini Index in Berlin?
Inequality or Gini Index in Berlin is 0.34.
What is the Total Population of Berlin?
Total Population of Berlin is 108.
What is the Total Male Population of Berlin?
Total Male Population of Berlin is 53.
What is the Total Female Population of Berlin?
Total Female Population of Berlin is 55.
What is the Ratio of Males per 100 Females in Berlin?
There are 96.36 Males per 100 Females in Berlin.
What is the Ratio of Females per 100 Males in Berlin?
There are 103.77 Females per 100 Males in Berlin.
What is the Median Population Age in Berlin?
Median Population Age in Berlin is 53.5 Years.
What is the Average Family Size in Berlin
Average Family Size in Berlin is 2.4 People.
What is the Average Household Size in Berlin
Average Household Size in Berlin is 1.8 People.
How Large is the Labor Force in Berlin?
There are 66 People in the Labor Forcein in Berlin.
What is the Percentage of People in the Labor Force in Berlin?
64.7% of People are in the Labor Force in Berlin.