Venetian Village, IL Map & Demographics
Venetian Village Map
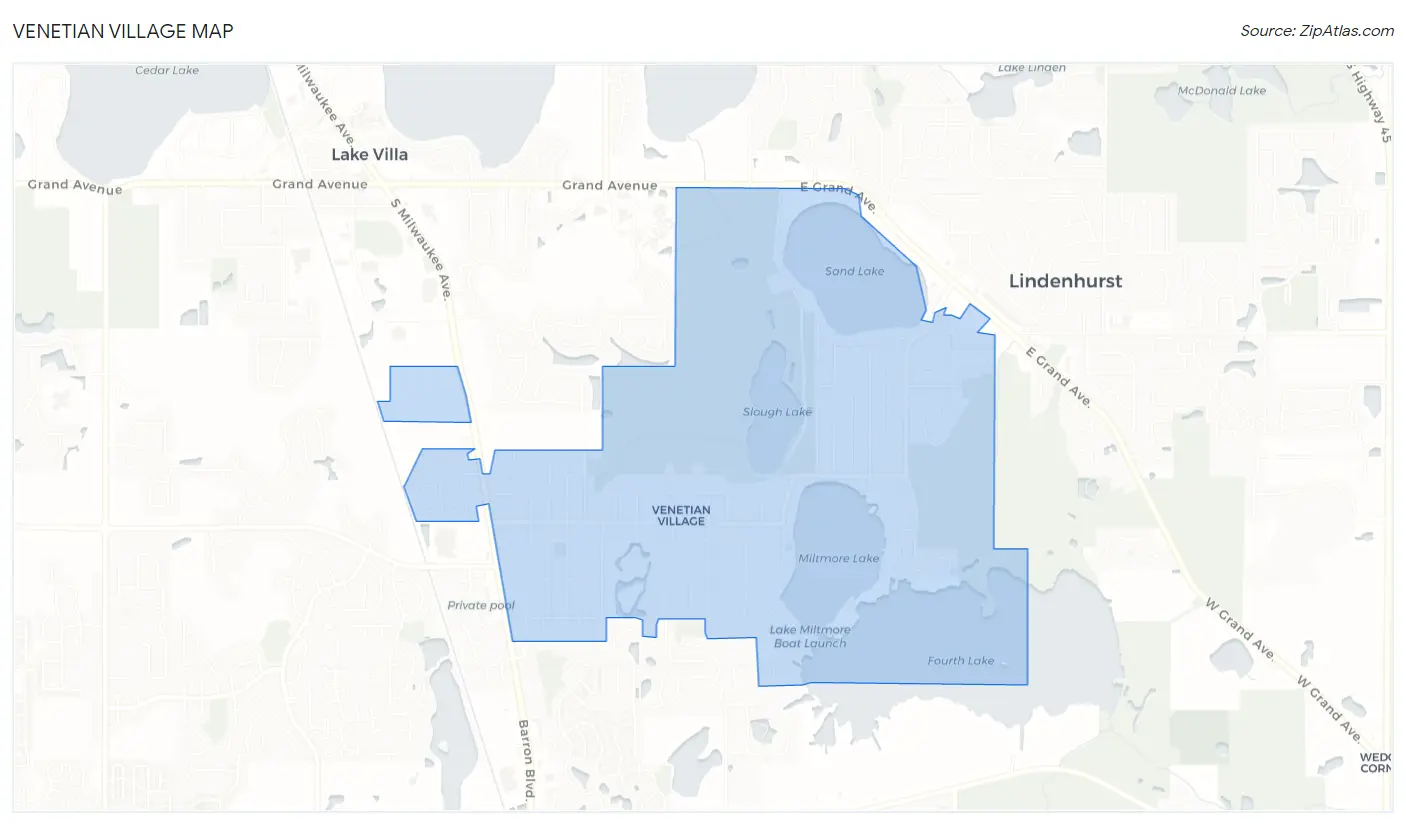
Venetian Village Overview
$36,434
PER CAPITA INCOME
$86,250
AVG FAMILY INCOME
$92,500
AVG HOUSEHOLD INCOME
44.0%
WAGE / INCOME GAP [ % ]
56.0¢/ $1
WAGE / INCOME GAP [ $ ]
0.32
INEQUALITY / GINI INDEX
2,723
TOTAL POPULATION
1,318
MALE POPULATION
1,405
FEMALE POPULATION
93.81
MALES / 100 FEMALES
106.60
FEMALES / 100 MALES
38.3
MEDIAN AGE
3.1
AVG FAMILY SIZE
2.7
AVG HOUSEHOLD SIZE
1,434
LABOR FORCE [ PEOPLE ]
68.3%
PERCENT IN LABOR FORCE
3.2%
UNEMPLOYMENT RATE
Income in Venetian Village
Income Overview in Venetian Village
Per Capita Income in Venetian Village is $36,434, while median incomes of families and households are $86,250 and $92,500 respectively.
| Characteristic | Number | Measure |
| Per Capita Income | 2,723 | $36,434 |
| Median Family Income | 788 | $86,250 |
| Mean Family Income | 788 | $99,944 |
| Median Household Income | 1,000 | $92,500 |
| Mean Household Income | 1,000 | $98,024 |
| Income Deficit | 788 | $0 |
| Wage / Income Gap (%) | 2,723 | 44.04% |
| Wage / Income Gap ($) | 2,723 | 55.96¢ per $1 |
| Gini / Inequality Index | 2,723 | 0.32 |
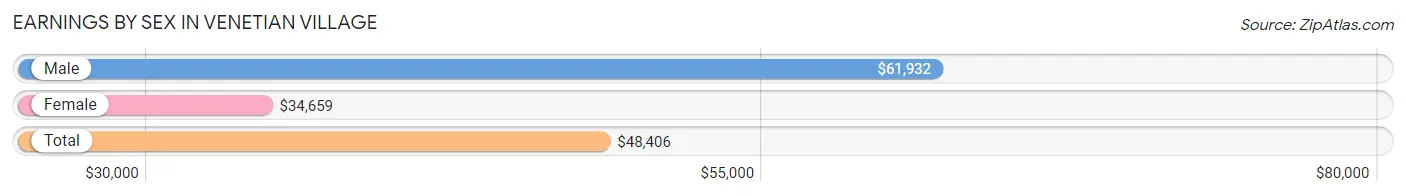
Earnings by Sex in Venetian Village
Average Earnings in Venetian Village are $48,406, $61,932 for men and $34,659 for women, a difference of 44.0%.
| Sex | Number | Average Earnings |
| Male | 786 (51.9%) | $61,932 |
| Female | 729 (48.1%) | $34,659 |
| Total | 1,515 (100.0%) | $48,406 |
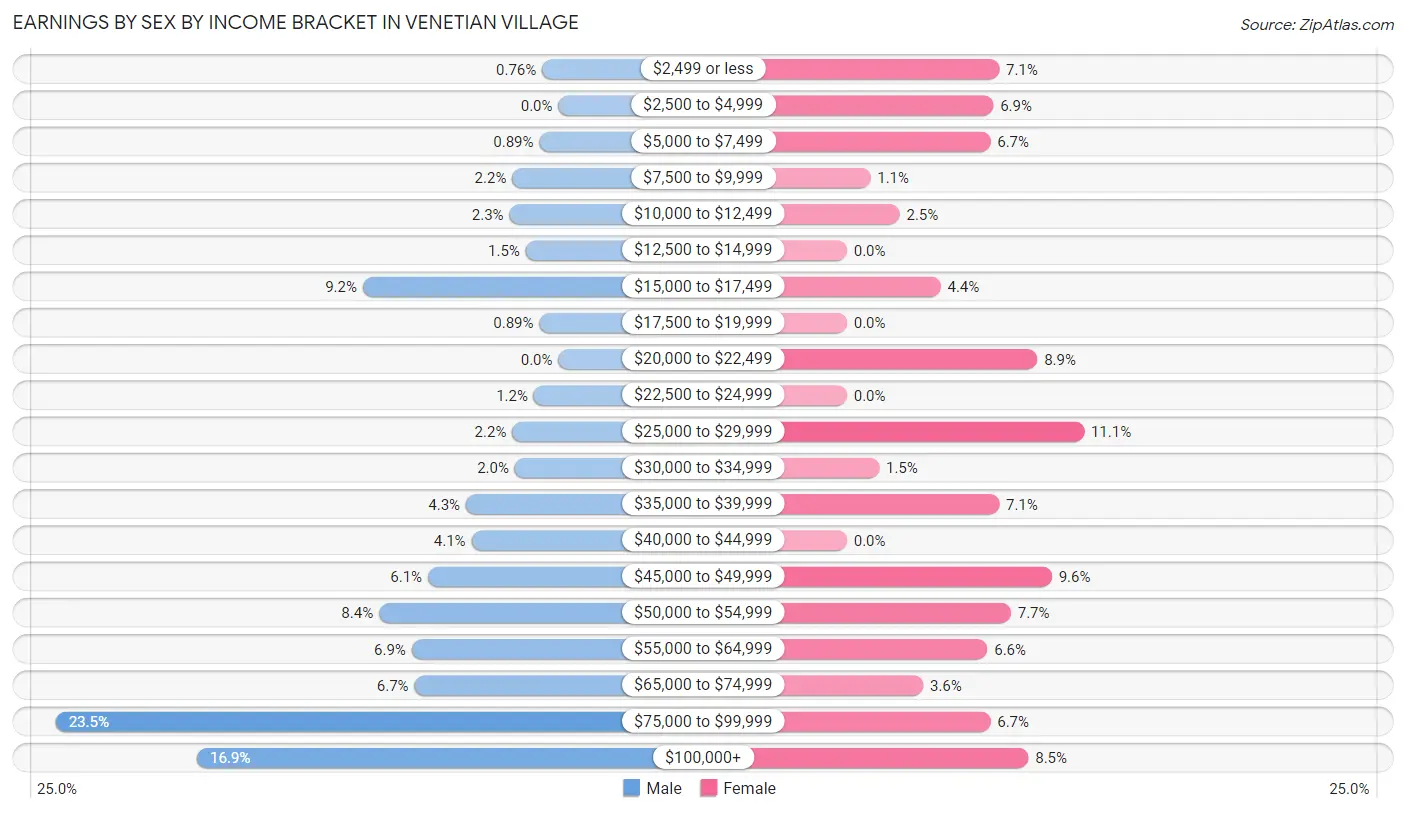
Earnings by Sex by Income Bracket in Venetian Village
The most common earnings brackets in Venetian Village are $75,000 to $99,999 for men (185 | 23.5%) and $25,000 to $29,999 for women (81 | 11.1%).
| Income | Male | Female |
| $2,499 or less | 6 (0.8%) | 52 (7.1%) |
| $2,500 to $4,999 | 0 (0.0%) | 50 (6.9%) |
| $5,000 to $7,499 | 7 (0.9%) | 49 (6.7%) |
| $7,500 to $9,999 | 17 (2.2%) | 8 (1.1%) |
| $10,000 to $12,499 | 18 (2.3%) | 18 (2.5%) |
| $12,500 to $14,999 | 12 (1.5%) | 0 (0.0%) |
| $15,000 to $17,499 | 72 (9.2%) | 32 (4.4%) |
| $17,500 to $19,999 | 7 (0.9%) | 0 (0.0%) |
| $20,000 to $22,499 | 0 (0.0%) | 65 (8.9%) |
| $22,500 to $24,999 | 9 (1.1%) | 0 (0.0%) |
| $25,000 to $29,999 | 17 (2.2%) | 81 (11.1%) |
| $30,000 to $34,999 | 16 (2.0%) | 11 (1.5%) |
| $35,000 to $39,999 | 34 (4.3%) | 52 (7.1%) |
| $40,000 to $44,999 | 32 (4.1%) | 0 (0.0%) |
| $45,000 to $49,999 | 48 (6.1%) | 70 (9.6%) |
| $50,000 to $54,999 | 66 (8.4%) | 56 (7.7%) |
| $55,000 to $64,999 | 54 (6.9%) | 48 (6.6%) |
| $65,000 to $74,999 | 53 (6.7%) | 26 (3.6%) |
| $75,000 to $99,999 | 185 (23.5%) | 49 (6.7%) |
| $100,000+ | 133 (16.9%) | 62 (8.5%) |
| Total | 786 (100.0%) | 729 (100.0%) |
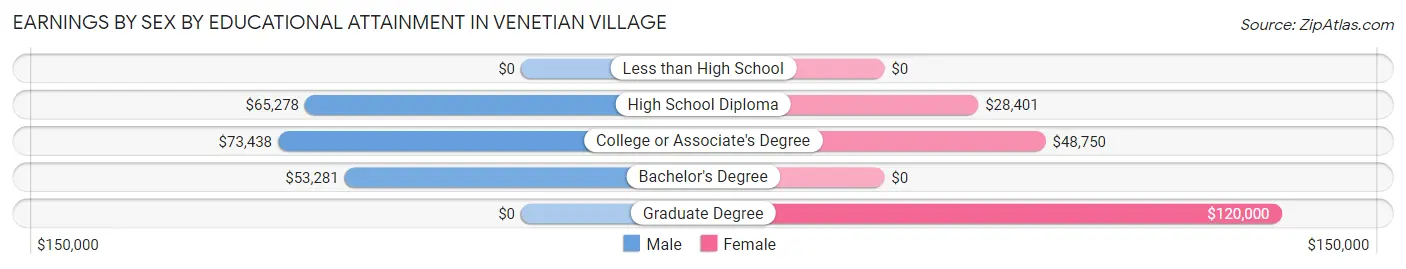
Earnings by Sex by Educational Attainment in Venetian Village
Average earnings in Venetian Village are $62,159 for men and $35,500 for women, a difference of 42.9%. Men with an educational attainment of college or associate's degree enjoy the highest average annual earnings of $73,438, while those with bachelor's degree education earn the least with $53,281. Women with an educational attainment of graduate degree earn the most with the average annual earnings of $120,000, while those with high school diploma education have the smallest earnings of $28,401.
| Educational Attainment | Male Income | Female Income |
| Less than High School | - | - |
| High School Diploma | $65,278 | $28,401 |
| College or Associate's Degree | $73,438 | $48,750 |
| Bachelor's Degree | $53,281 | $0 |
| Graduate Degree | - | - |
| Total | $62,159 | $35,500 |
Family Income in Venetian Village
Family Income Brackets in Venetian Village
According to the Venetian Village family income data, there are 214 families falling into the $100,000 to $149,999 income range, which is the most common income bracket and makes up 27.2% of all families.
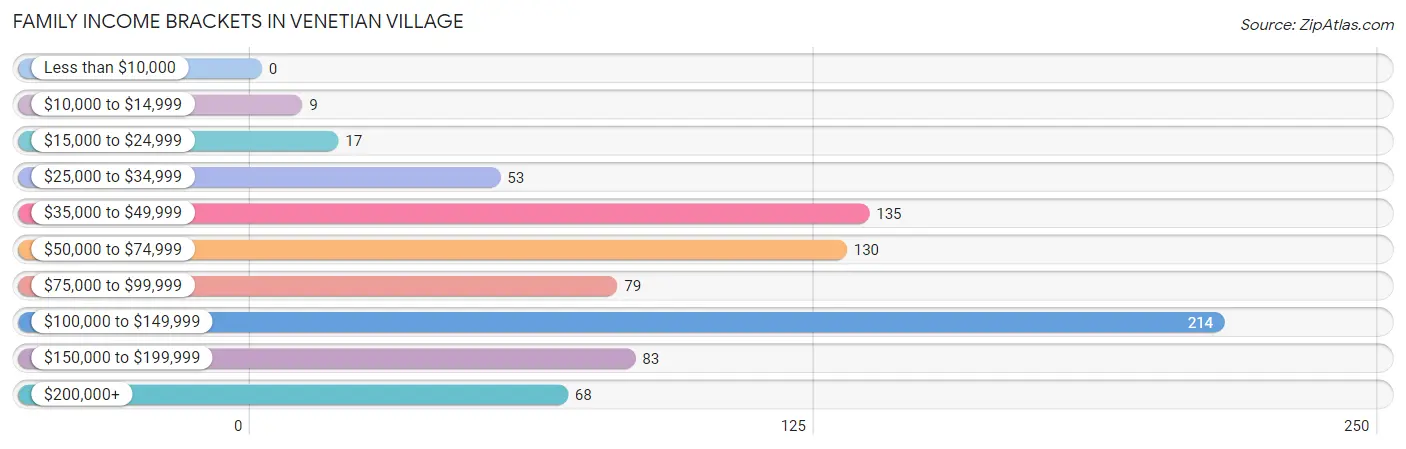
| Income Bracket | # Families | % Families |
| Less than $10,000 | 0 | 0.0% |
| $10,000 to $14,999 | 9 | 1.1% |
| $15,000 to $24,999 | 17 | 2.2% |
| $25,000 to $34,999 | 53 | 6.7% |
| $35,000 to $49,999 | 135 | 17.1% |
| $50,000 to $74,999 | 130 | 16.5% |
| $75,000 to $99,999 | 79 | 10.0% |
| $100,000 to $149,999 | 214 | 27.2% |
| $150,000 to $199,999 | 83 | 10.5% |
| $200,000+ | 68 | 8.6% |
Family Income by Famaliy Size in Venetian Village
6-person families (44 | 5.6%) account for the highest median family income in Venetian Village with $173,167 per family, while 2-person families (433 | 54.9%) have the highest median income of $40,268 per family member.
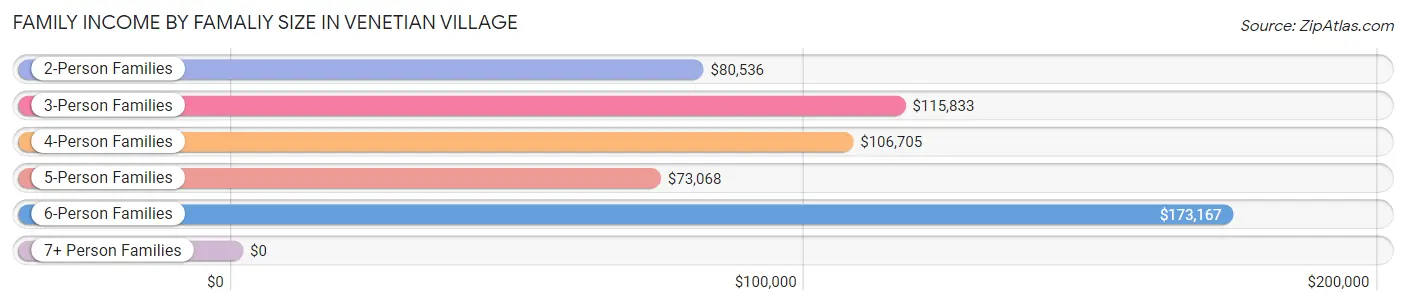
| Income Bracket | # Families | Median Income |
| 2-Person Families | 433 (54.9%) | $80,536 |
| 3-Person Families | 118 (15.0%) | $115,833 |
| 4-Person Families | 119 (15.1%) | $106,705 |
| 5-Person Families | 74 (9.4%) | $73,068 |
| 6-Person Families | 44 (5.6%) | $173,167 |
| 7+ Person Families | 0 (0.0%) | $0 |
| Total | 788 (100.0%) | $86,250 |
Family Income by Number of Earners in Venetian Village
The median family income in Venetian Village is $86,250, with families comprising 3+ earners (101) having the highest median family income of $132,734, while families with no earners (93) have the lowest median family income of $49,219, accounting for 12.8% and 11.8% of families, respectively.
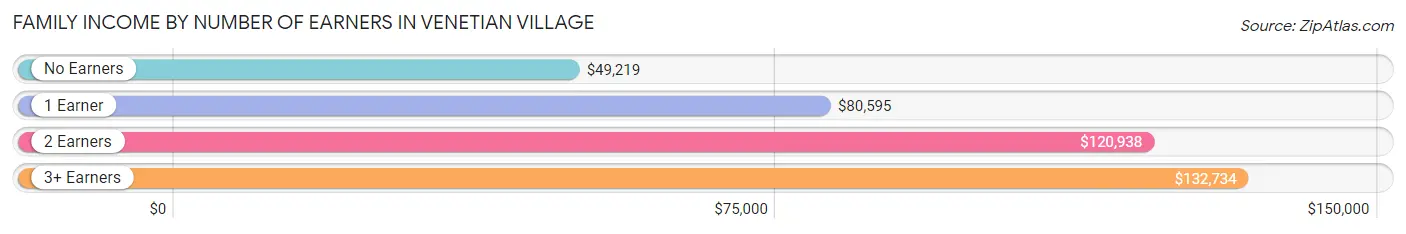
| Number of Earners | # Families | Median Income |
| No Earners | 93 (11.8%) | $49,219 |
| 1 Earner | 246 (31.2%) | $80,595 |
| 2 Earners | 348 (44.2%) | $120,938 |
| 3+ Earners | 101 (12.8%) | $132,734 |
| Total | 788 (100.0%) | $86,250 |
Household Income in Venetian Village
Household Income Brackets in Venetian Village
With 281 households falling in the category, the $100,000 to $149,999 income range is the most frequent in Venetian Village, accounting for 28.1% of all households.
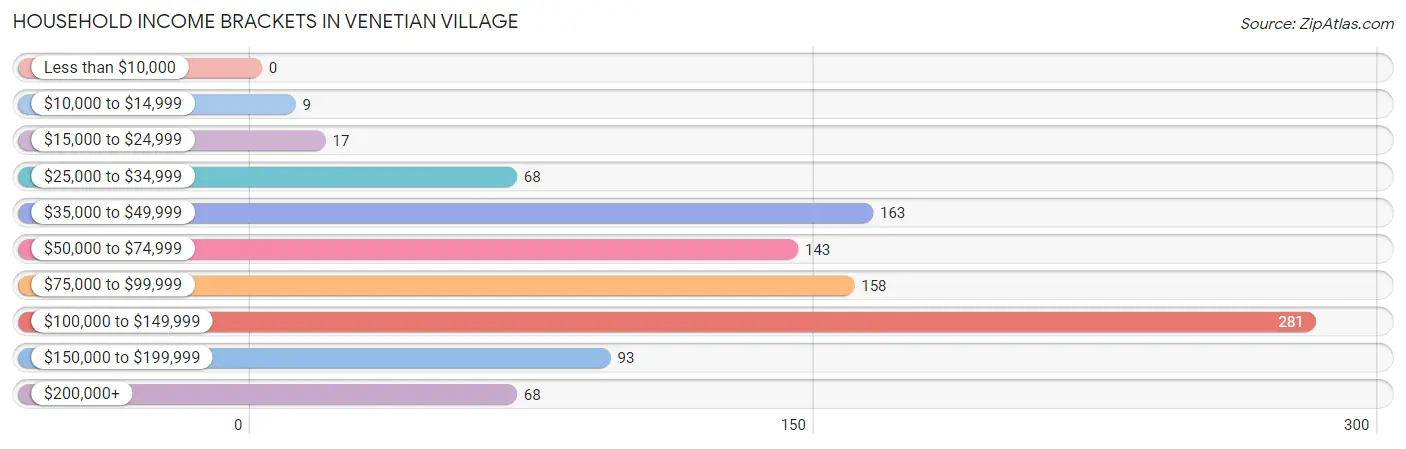
| Income Bracket | # Households | % Households |
| Less than $10,000 | 0 | 0.0% |
| $10,000 to $14,999 | 9 | 0.9% |
| $15,000 to $24,999 | 17 | 1.7% |
| $25,000 to $34,999 | 68 | 6.8% |
| $35,000 to $49,999 | 163 | 16.3% |
| $50,000 to $74,999 | 143 | 14.3% |
| $75,000 to $99,999 | 158 | 15.8% |
| $100,000 to $149,999 | 281 | 28.1% |
| $150,000 to $199,999 | 93 | 9.3% |
| $200,000+ | 68 | 6.8% |
Household Income by Householder Age in Venetian Village
The median household income in Venetian Village is $92,500, with the highest median household income of $116,156 found in the 25 to 44 years age bracket for the primary householder. A total of 339 households (33.9%) fall into this category. Meanwhile, the 15 to 24 years age bracket for the primary householder has the lowest median household income of $0, with 25 households (2.5%) in this group.
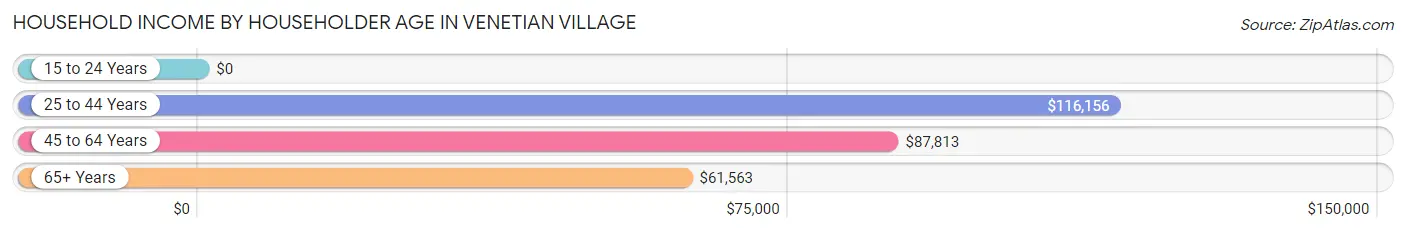
| Income Bracket | # Households | Median Income |
| 15 to 24 Years | 25 (2.5%) | $0 |
| 25 to 44 Years | 339 (33.9%) | $116,156 |
| 45 to 64 Years | 416 (41.6%) | $87,813 |
| 65+ Years | 220 (22.0%) | $61,563 |
| Total | 1,000 (100.0%) | $92,500 |
Poverty in Venetian Village
Income Below Poverty by Sex and Age in Venetian Village
With 1.1% poverty level for males and 2.6% for females among the residents of Venetian Village, 65 to 74 year old males and 16 and 17 year old females are the most vulnerable to poverty, with 15 males (10.8%) and 7 females (58.3%) in their respective age groups living below the poverty level.
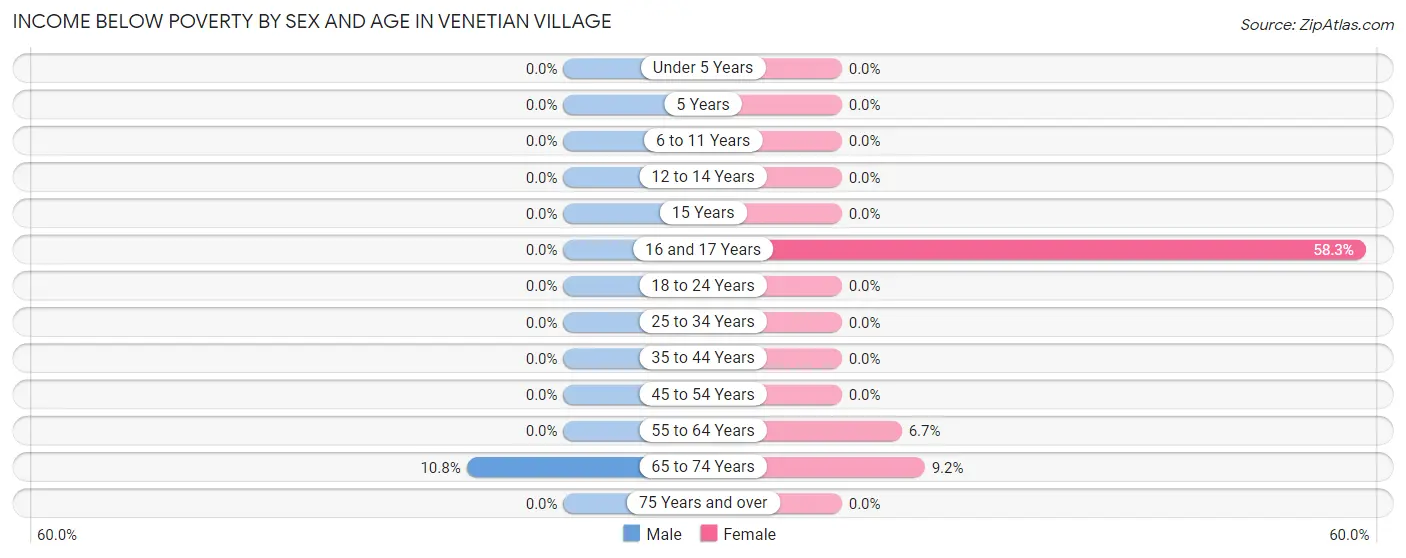
| Age Bracket | Male | Female |
| Under 5 Years | 0 (0.0%) | 0 (0.0%) |
| 5 Years | 0 (0.0%) | 0 (0.0%) |
| 6 to 11 Years | 0 (0.0%) | 0 (0.0%) |
| 12 to 14 Years | 0 (0.0%) | 0 (0.0%) |
| 15 Years | 0 (0.0%) | 0 (0.0%) |
| 16 and 17 Years | 0 (0.0%) | 7 (58.3%) |
| 18 to 24 Years | 0 (0.0%) | 0 (0.0%) |
| 25 to 34 Years | 0 (0.0%) | 0 (0.0%) |
| 35 to 44 Years | 0 (0.0%) | 0 (0.0%) |
| 45 to 54 Years | 0 (0.0%) | 0 (0.0%) |
| 55 to 64 Years | 0 (0.0%) | 18 (6.7%) |
| 65 to 74 Years | 15 (10.8%) | 11 (9.2%) |
| 75 Years and over | 0 (0.0%) | 0 (0.0%) |
| Total | 15 (1.1%) | 36 (2.6%) |
Income Above Poverty by Sex and Age in Venetian Village
According to the poverty statistics in Venetian Village, males aged under 5 years and females aged under 5 years are the age groups that are most secure financially, with 100.0% of males and 100.0% of females in these age groups living above the poverty line.
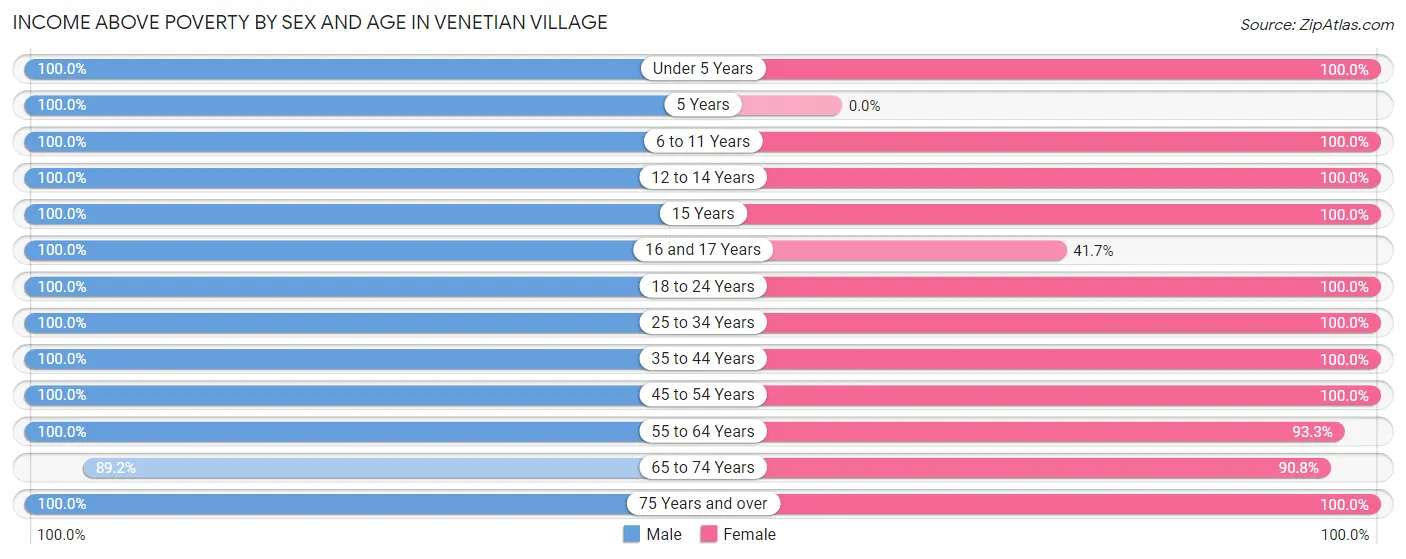
| Age Bracket | Male | Female |
| Under 5 Years | 73 (100.0%) | 91 (100.0%) |
| 5 Years | 16 (100.0%) | 0 (0.0%) |
| 6 to 11 Years | 94 (100.0%) | 114 (100.0%) |
| 12 to 14 Years | 77 (100.0%) | 77 (100.0%) |
| 15 Years | 35 (100.0%) | 46 (100.0%) |
| 16 and 17 Years | 5 (100.0%) | 5 (41.7%) |
| 18 to 24 Years | 83 (100.0%) | 90 (100.0%) |
| 25 to 34 Years | 196 (100.0%) | 235 (100.0%) |
| 35 to 44 Years | 132 (100.0%) | 138 (100.0%) |
| 45 to 54 Years | 202 (100.0%) | 106 (100.0%) |
| 55 to 64 Years | 170 (100.0%) | 252 (93.3%) |
| 65 to 74 Years | 124 (89.2%) | 108 (90.8%) |
| 75 Years and over | 96 (100.0%) | 107 (100.0%) |
| Total | 1,303 (98.9%) | 1,369 (97.4%) |
Income Below Poverty Among Married-Couple Families in Venetian Village
The poverty statistics for married-couple families in Venetian Village show that 2.6% or 15 of the total 585 families live below the poverty line. Families with 1 or 2 children have the highest poverty rate of 3.3%, comprising of 6 families. On the other hand, families with 3 or 4 children have the lowest poverty rate of 0.0%, which includes 0 families.
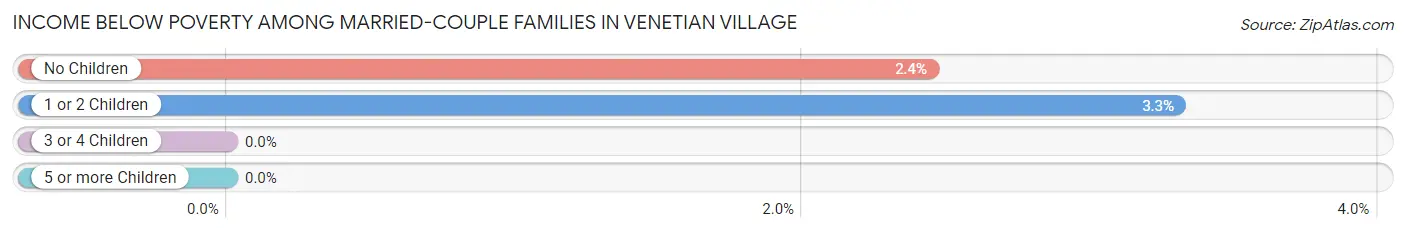
| Children | Above Poverty | Below Poverty |
| No Children | 360 (97.6%) | 9 (2.4%) |
| 1 or 2 Children | 176 (96.7%) | 6 (3.3%) |
| 3 or 4 Children | 34 (100.0%) | 0 (0.0%) |
| 5 or more Children | 0 (0.0%) | 0 (0.0%) |
| Total | 570 (97.4%) | 15 (2.6%) |
Income Below Poverty Among Single-Parent Households in Venetian Village
| Children | Single Father | Single Mother |
| No Children | 0 (0.0%) | 0 (0.0%) |
| 1 or 2 Children | 0 (0.0%) | 0 (0.0%) |
| 3 or 4 Children | 0 (0.0%) | 0 (0.0%) |
| 5 or more Children | 0 (0.0%) | 0 (0.0%) |
| Total | 0 (0.0%) | 0 (0.0%) |
Income Below Poverty Among Married-Couple vs Single-Parent Households in Venetian Village
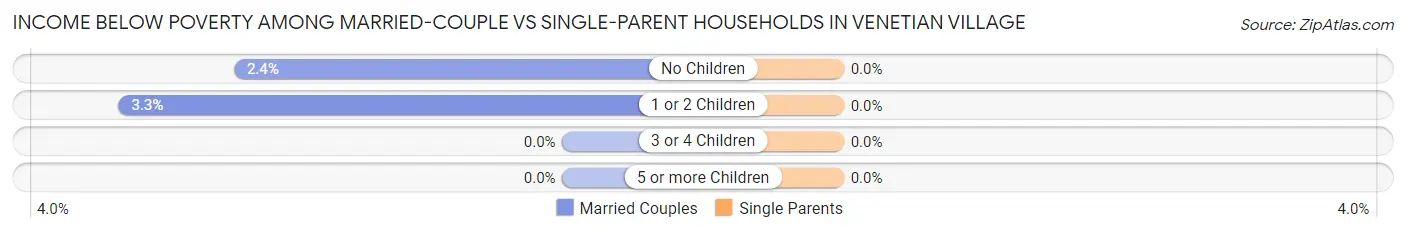
| Children | Married-Couple Families | Single-Parent Households |
| No Children | 9 (2.4%) | 0 (0.0%) |
| 1 or 2 Children | 6 (3.3%) | 0 (0.0%) |
| 3 or 4 Children | 0 (0.0%) | 0 (0.0%) |
| 5 or more Children | 0 (0.0%) | 0 (0.0%) |
| Total | 15 (2.6%) | 0 (0.0%) |
Race in Venetian Village
The most populous races in Venetian Village are White / Caucasian (2,315 | 85.0%), Hispanic or Latino (551 | 20.2%), and Two or more Races (246 | 9.0%).
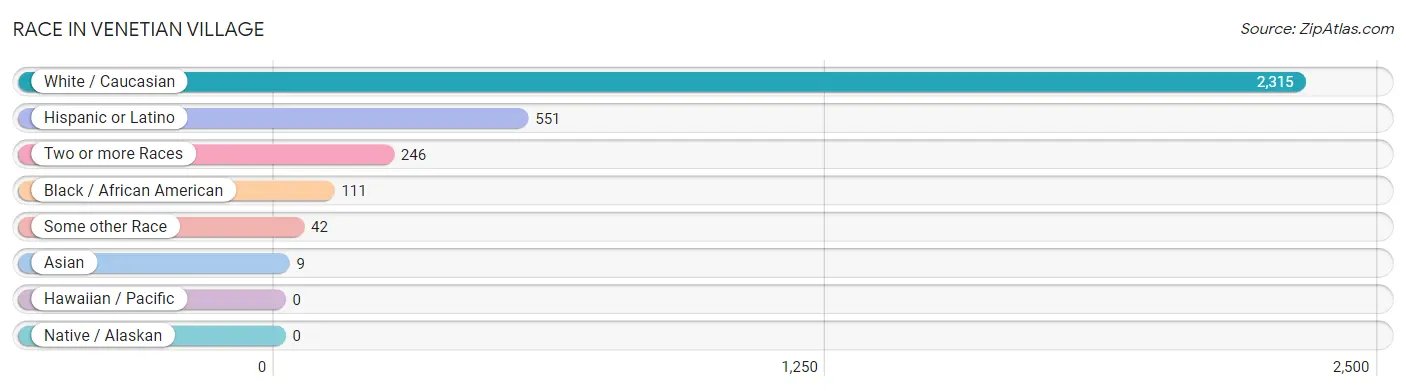
| Race | # Population | % Population |
| Asian | 9 | 0.3% |
| Black / African American | 111 | 4.1% |
| Hawaiian / Pacific | 0 | 0.0% |
| Hispanic or Latino | 551 | 20.2% |
| Native / Alaskan | 0 | 0.0% |
| White / Caucasian | 2,315 | 85.0% |
| Two or more Races | 246 | 9.0% |
| Some other Race | 42 | 1.5% |
| Total | 2,723 | 100.0% |
Ancestry in Venetian Village
The most populous ancestries reported in Venetian Village are German (786 | 28.9%), Irish (614 | 22.6%), Mexican (385 | 14.1%), Polish (225 | 8.3%), and Puerto Rican (166 | 6.1%), together accounting for 79.9% of all Venetian Village residents.
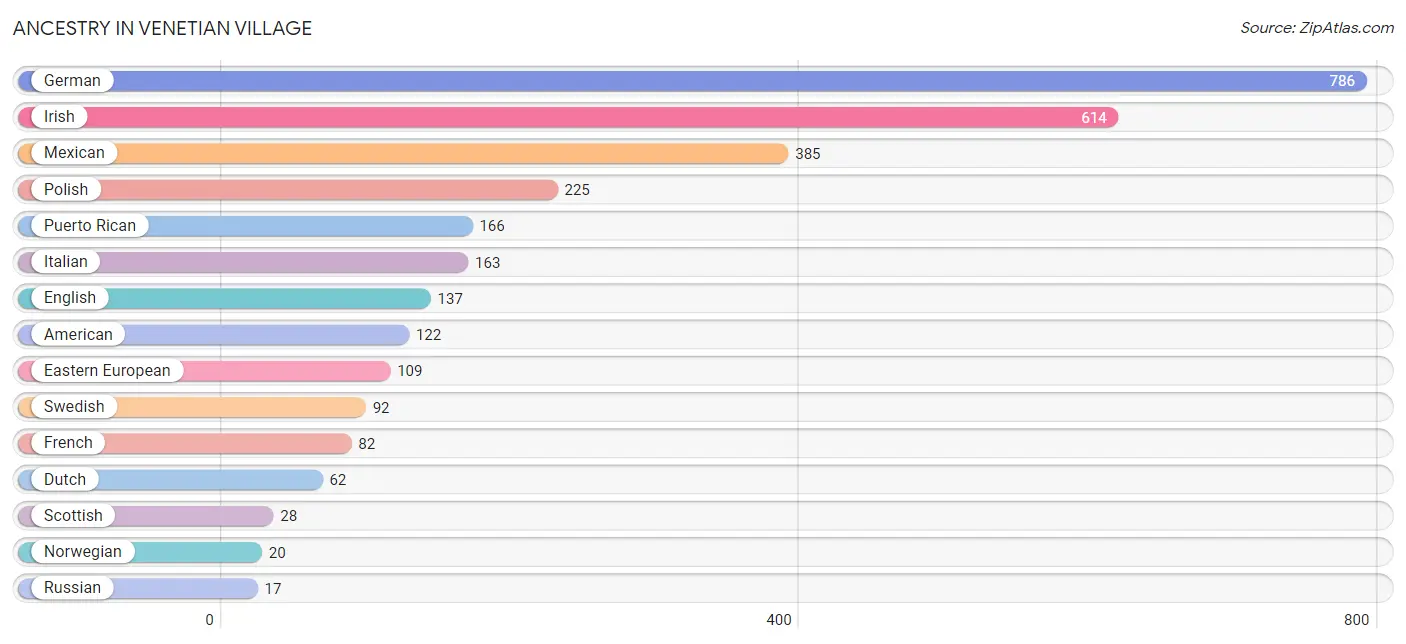
| Ancestry | # Population | % Population |
| American | 122 | 4.5% |
| Canadian | 10 | 0.4% |
| Czech | 8 | 0.3% |
| Czechoslovakian | 8 | 0.3% |
| Danish | 10 | 0.4% |
| Dutch | 62 | 2.3% |
| Eastern European | 109 | 4.0% |
| English | 137 | 5.0% |
| European | 9 | 0.3% |
| Finnish | 10 | 0.4% |
| French | 82 | 3.0% |
| German | 786 | 28.9% |
| Hungarian | 6 | 0.2% |
| Irish | 614 | 22.6% |
| Italian | 163 | 6.0% |
| Lithuanian | 10 | 0.4% |
| Luxembourger | 8 | 0.3% |
| Mexican | 385 | 14.1% |
| Norwegian | 20 | 0.7% |
| Pakistani | 16 | 0.6% |
| Polish | 225 | 8.3% |
| Puerto Rican | 166 | 6.1% |
| Romanian | 8 | 0.3% |
| Russian | 17 | 0.6% |
| Scottish | 28 | 1.0% |
| Serbian | 9 | 0.3% |
| Slovak | 17 | 0.6% |
| Swedish | 92 | 3.4% |
| Trinidadian and Tobagonian | 16 | 0.6% |
| Ukrainian | 17 | 0.6% |
| Yugoslavian | 8 | 0.3% | View All 31 Rows |
Immigrants in Venetian Village
The most numerous immigrant groups reported in Venetian Village came from Latin America (95 | 3.5%), Europe (92 | 3.4%), Central America (86 | 3.2%), Mexico (86 | 3.2%), and Eastern Europe (58 | 2.1%), together accounting for 15.3% of all Venetian Village residents.
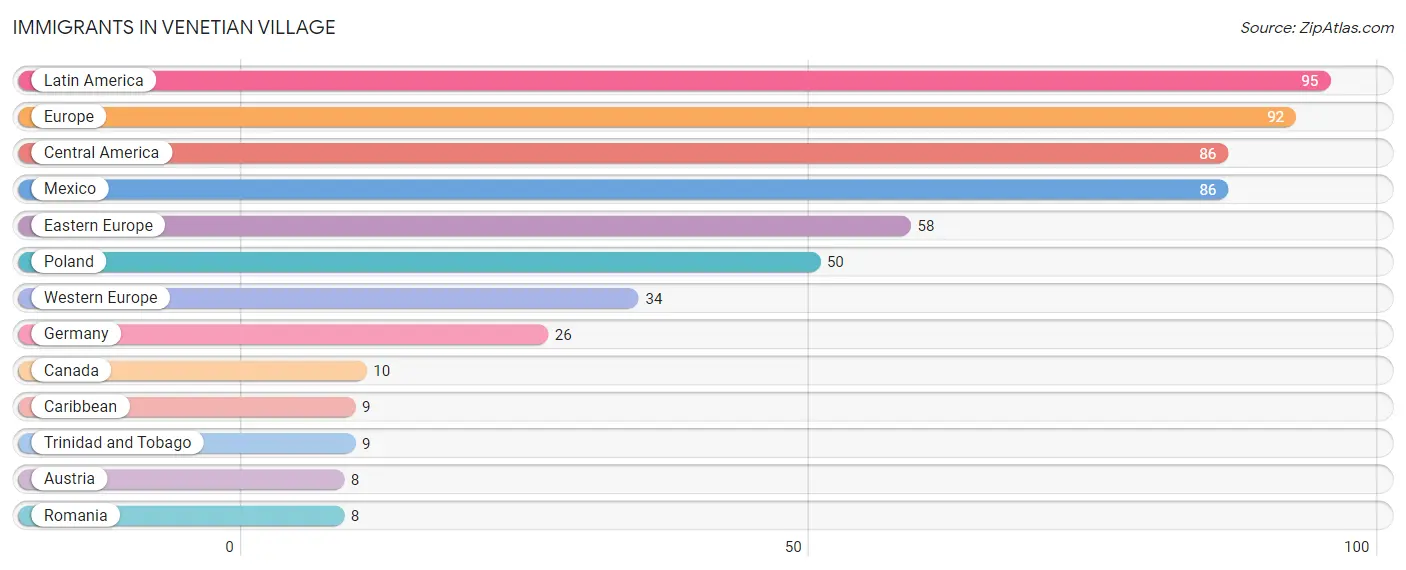
| Immigration Origin | # Population | % Population |
| Austria | 8 | 0.3% |
| Canada | 10 | 0.4% |
| Caribbean | 9 | 0.3% |
| Central America | 86 | 3.2% |
| Eastern Europe | 58 | 2.1% |
| Europe | 92 | 3.4% |
| Germany | 26 | 0.9% |
| Latin America | 95 | 3.5% |
| Mexico | 86 | 3.2% |
| Poland | 50 | 1.8% |
| Romania | 8 | 0.3% |
| Trinidad and Tobago | 9 | 0.3% |
| Western Europe | 34 | 1.3% | View All 13 Rows |
Sex and Age in Venetian Village
Sex and Age in Venetian Village
The most populous age groups in Venetian Village are 30 to 34 Years (159 | 12.1%) for men and 55 to 59 Years (219 | 15.6%) for women.
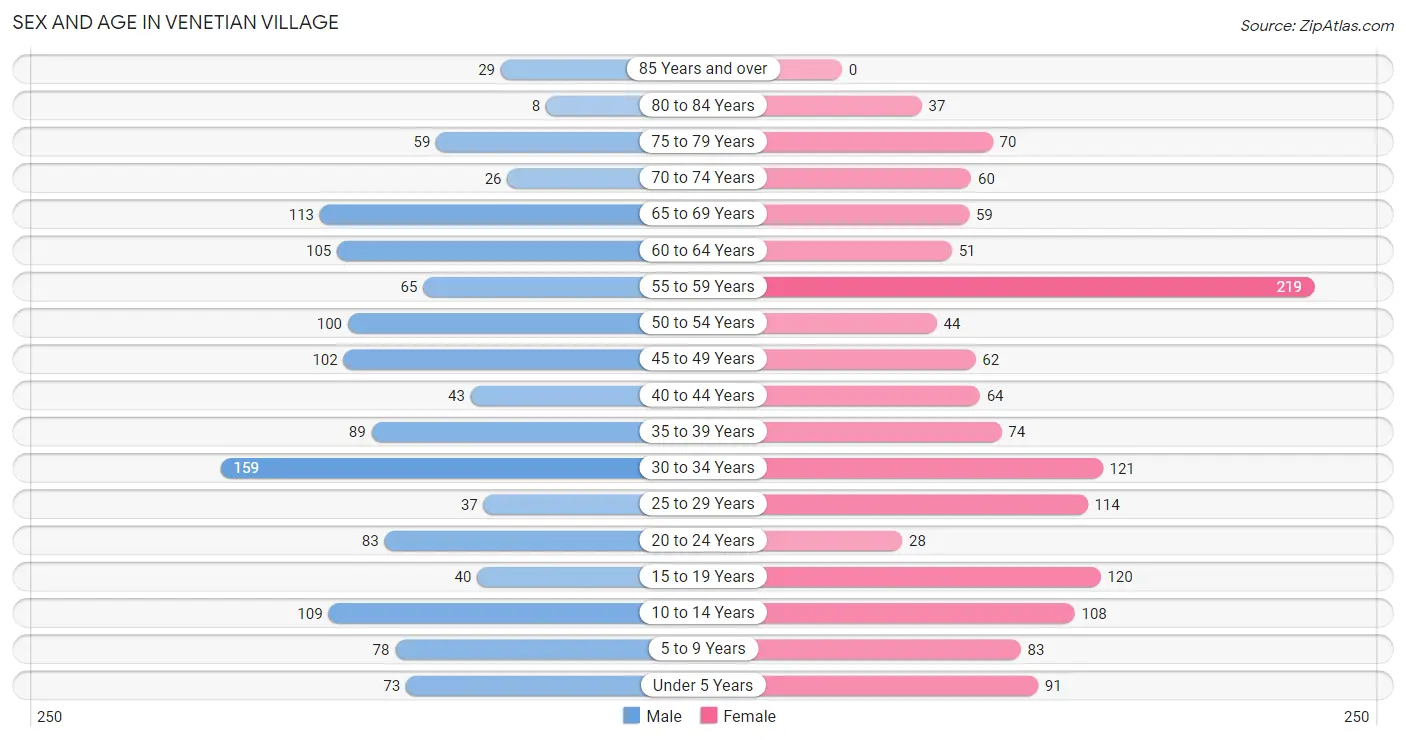
| Age Bracket | Male | Female |
| Under 5 Years | 73 (5.5%) | 91 (6.5%) |
| 5 to 9 Years | 78 (5.9%) | 83 (5.9%) |
| 10 to 14 Years | 109 (8.3%) | 108 (7.7%) |
| 15 to 19 Years | 40 (3.0%) | 120 (8.5%) |
| 20 to 24 Years | 83 (6.3%) | 28 (2.0%) |
| 25 to 29 Years | 37 (2.8%) | 114 (8.1%) |
| 30 to 34 Years | 159 (12.1%) | 121 (8.6%) |
| 35 to 39 Years | 89 (6.8%) | 74 (5.3%) |
| 40 to 44 Years | 43 (3.3%) | 64 (4.6%) |
| 45 to 49 Years | 102 (7.7%) | 62 (4.4%) |
| 50 to 54 Years | 100 (7.6%) | 44 (3.1%) |
| 55 to 59 Years | 65 (4.9%) | 219 (15.6%) |
| 60 to 64 Years | 105 (8.0%) | 51 (3.6%) |
| 65 to 69 Years | 113 (8.6%) | 59 (4.2%) |
| 70 to 74 Years | 26 (2.0%) | 60 (4.3%) |
| 75 to 79 Years | 59 (4.5%) | 70 (5.0%) |
| 80 to 84 Years | 8 (0.6%) | 37 (2.6%) |
| 85 Years and over | 29 (2.2%) | 0 (0.0%) |
| Total | 1,318 (100.0%) | 1,405 (100.0%) |
Families and Households in Venetian Village
Median Family Size in Venetian Village
The median family size in Venetian Village is 3.07 persons per family, with single male/father families (69 | 8.8%) accounting for the largest median family size of 3.93 persons per family. On the other hand, single female/mother families (134 | 17.0%) represent the smallest median family size with 2.39 persons per family.
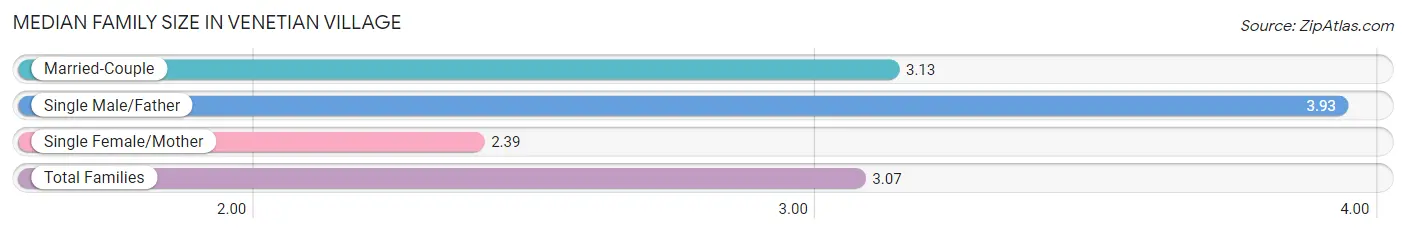
| Family Type | # Families | Family Size |
| Married-Couple | 585 (74.2%) | 3.13 |
| Single Male/Father | 69 (8.8%) | 3.93 |
| Single Female/Mother | 134 (17.0%) | 2.39 |
| Total Families | 788 (100.0%) | 3.07 |
Median Household Size in Venetian Village
The median household size in Venetian Village is 2.72 persons per household, with single male/father households (69 | 6.9%) accounting for the largest median household size of 3.93 persons per household. non-family households (212 | 21.2%) represent the smallest median household size with 1.34 persons per household.
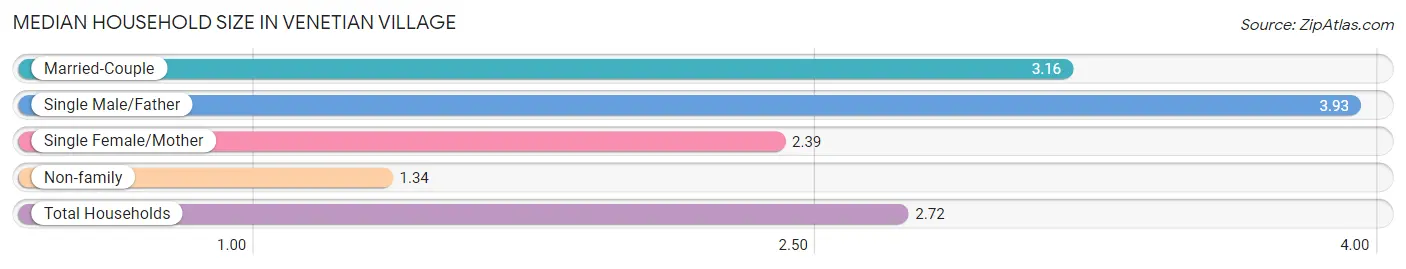
| Household Type | # Households | Household Size |
| Married-Couple | 585 (58.5%) | 3.16 |
| Single Male/Father | 69 (6.9%) | 3.93 |
| Single Female/Mother | 134 (13.4%) | 2.39 |
| Non-family | 212 (21.2%) | 1.34 |
| Total Households | 1,000 (100.0%) | 2.72 |
Household Size by Marriage Status in Venetian Village
Out of a total of 1,000 households in Venetian Village, 788 (78.8%) are family households, while 212 (21.2%) are nonfamily households. The most numerous type of family households are 2-person households, comprising 427, and the most common type of nonfamily households are 1-person households, comprising 147.
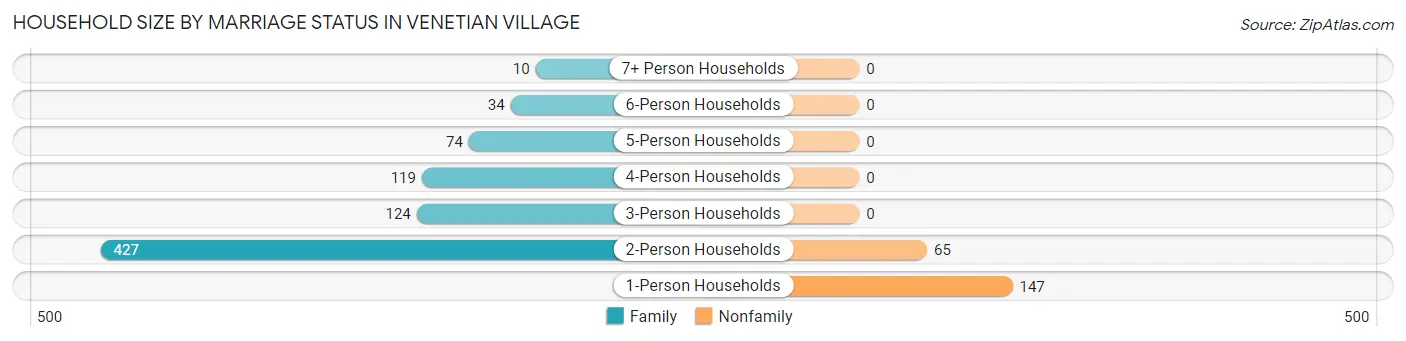
| Household Size | Family Households | Nonfamily Households |
| 1-Person Households | - | 147 (14.7%) |
| 2-Person Households | 427 (42.7%) | 65 (6.5%) |
| 3-Person Households | 124 (12.4%) | 0 (0.0%) |
| 4-Person Households | 119 (11.9%) | 0 (0.0%) |
| 5-Person Households | 74 (7.4%) | 0 (0.0%) |
| 6-Person Households | 34 (3.4%) | 0 (0.0%) |
| 7+ Person Households | 10 (1.0%) | 0 (0.0%) |
| Total | 788 (78.8%) | 212 (21.2%) |
Female Fertility in Venetian Village
Fertility by Age in Venetian Village
Average fertility rate in Venetian Village is 56.0 births per 1,000 women. Women in the age bracket of 20 to 34 years have the highest fertility rate with 129.0 births per 1,000 women. Women in the age bracket of 20 to 34 years acount for 100.0% of all women with births.
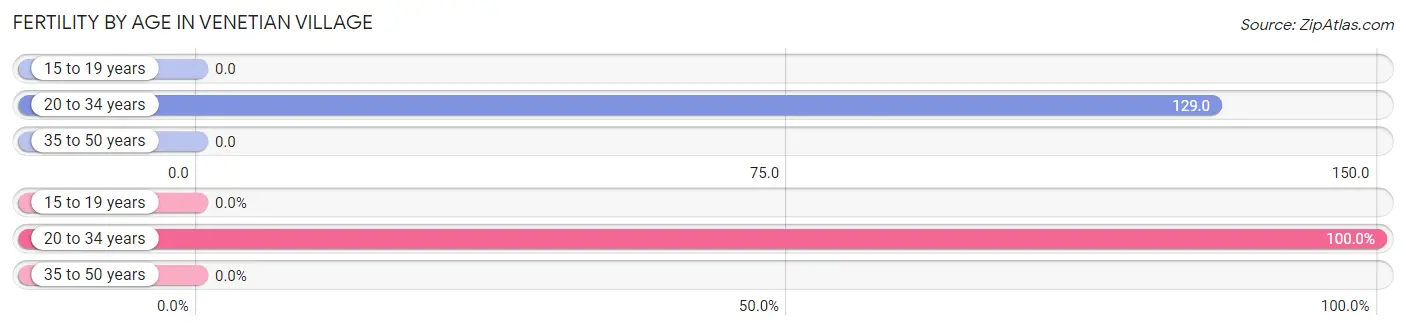
| Age Bracket | Women with Births | Births / 1,000 Women |
| 15 to 19 years | 0 (0.0%) | 0.0 |
| 20 to 34 years | 34 (100.0%) | 129.0 |
| 35 to 50 years | 0 (0.0%) | 0.0 |
| Total | 34 (100.0%) | 56.0 |
Fertility by Age by Marriage Status in Venetian Village
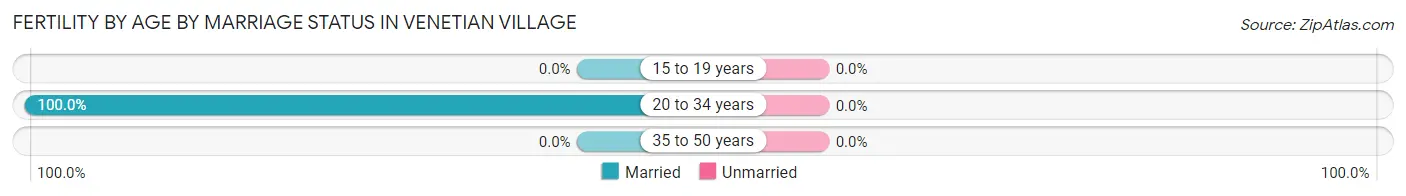
| Age Bracket | Married | Unmarried |
| 15 to 19 years | 0 (0.0%) | 0 (0.0%) |
| 20 to 34 years | 34 (100.0%) | 0 (0.0%) |
| 35 to 50 years | 0 (0.0%) | 0 (0.0%) |
| Total | 34 (100.0%) | 0 (0.0%) |
Fertility by Education in Venetian Village
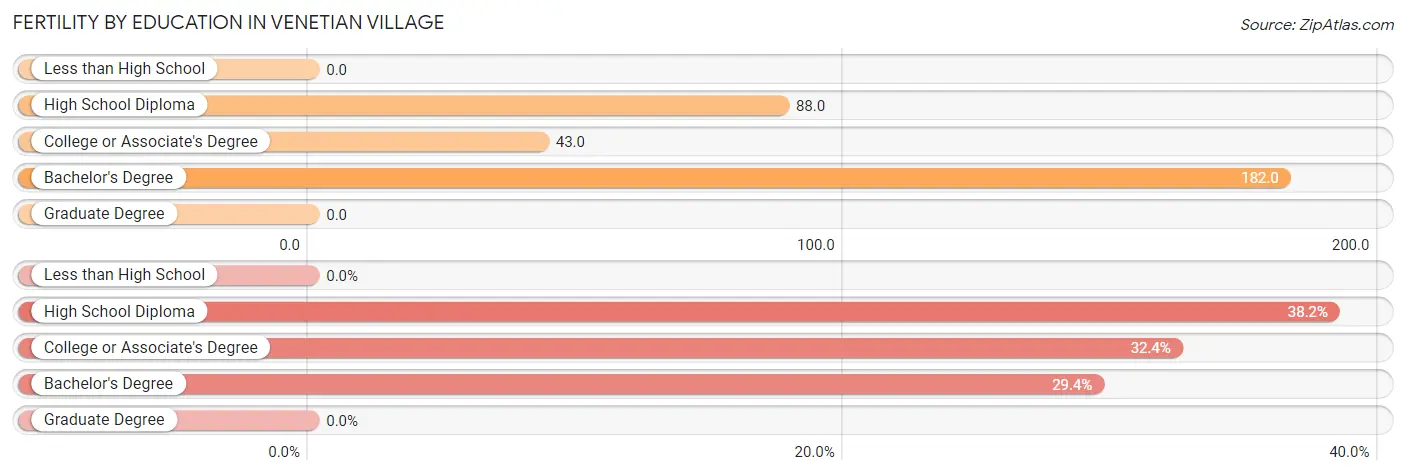
| Educational Attainment | Women with Births | Births / 1,000 Women |
| Less than High School | 0 (0.0%) | 0.0 |
| High School Diploma | 13 (38.2%) | 88.0 |
| College or Associate's Degree | 11 (32.4%) | 43.0 |
| Bachelor's Degree | 10 (29.4%) | 182.0 |
| Graduate Degree | 0 (0.0%) | 0.0 |
| Total | 34 (100.0%) | 56.0 |
Fertility by Education by Marriage Status in Venetian Village
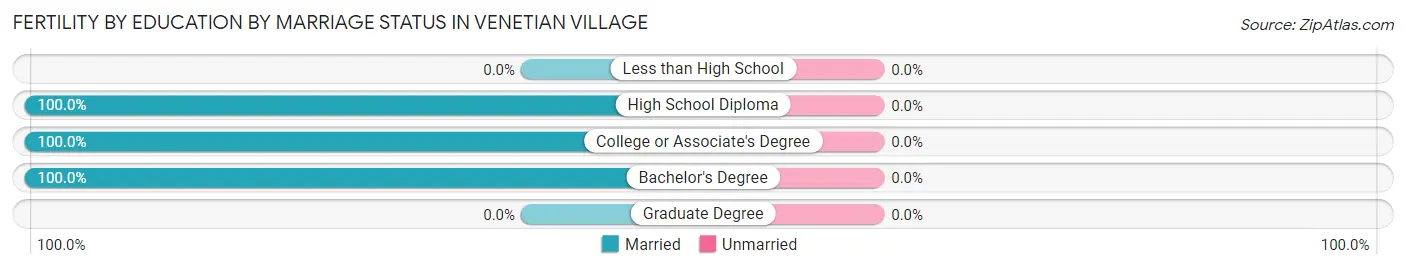
| Educational Attainment | Married | Unmarried |
| Less than High School | 0 (0.0%) | 0 (0.0%) |
| High School Diploma | 13 (100.0%) | 0 (0.0%) |
| College or Associate's Degree | 11 (100.0%) | 0 (0.0%) |
| Bachelor's Degree | 10 (100.0%) | 0 (0.0%) |
| Graduate Degree | 0 (0.0%) | 0 (0.0%) |
| Total | 34 (100.0%) | 0 (0.0%) |
Employment Characteristics in Venetian Village
Employment by Class of Employer in Venetian Village
Among the 1,369 employed individuals in Venetian Village, private company employees (952 | 69.5%), self-employed (not incorporated) (153 | 11.2%), and local government employees (105 | 7.7%) make up the most common classes of employment.
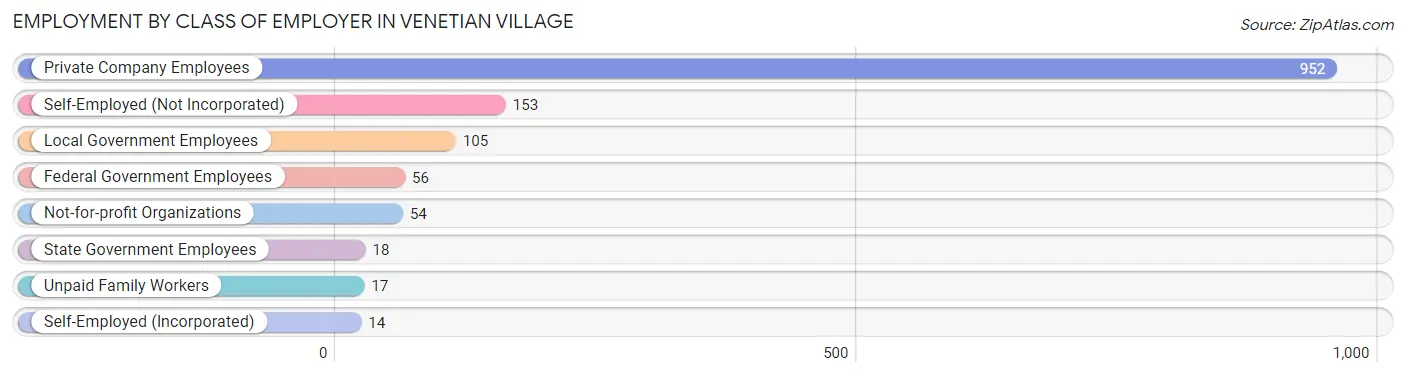
| Employer Class | # Employees | % Employees |
| Private Company Employees | 952 | 69.5% |
| Self-Employed (Incorporated) | 14 | 1.0% |
| Self-Employed (Not Incorporated) | 153 | 11.2% |
| Not-for-profit Organizations | 54 | 3.9% |
| Local Government Employees | 105 | 7.7% |
| State Government Employees | 18 | 1.3% |
| Federal Government Employees | 56 | 4.1% |
| Unpaid Family Workers | 17 | 1.2% |
| Total | 1,369 | 100.0% |
Employment Status by Age in Venetian Village
According to the labor force statistics for Venetian Village, out of the total population over 16 years of age (2,100), 68.3% or 1,434 individuals are in the labor force, with 3.2% or 46 of them unemployed. The age group with the highest labor force participation rate is 35 to 44 years, with 100.0% or 270 individuals in the labor force. Within the labor force, the 20 to 24 years age range has the highest percentage of unemployed individuals, with 29.3% or 29 of them being unemployed.
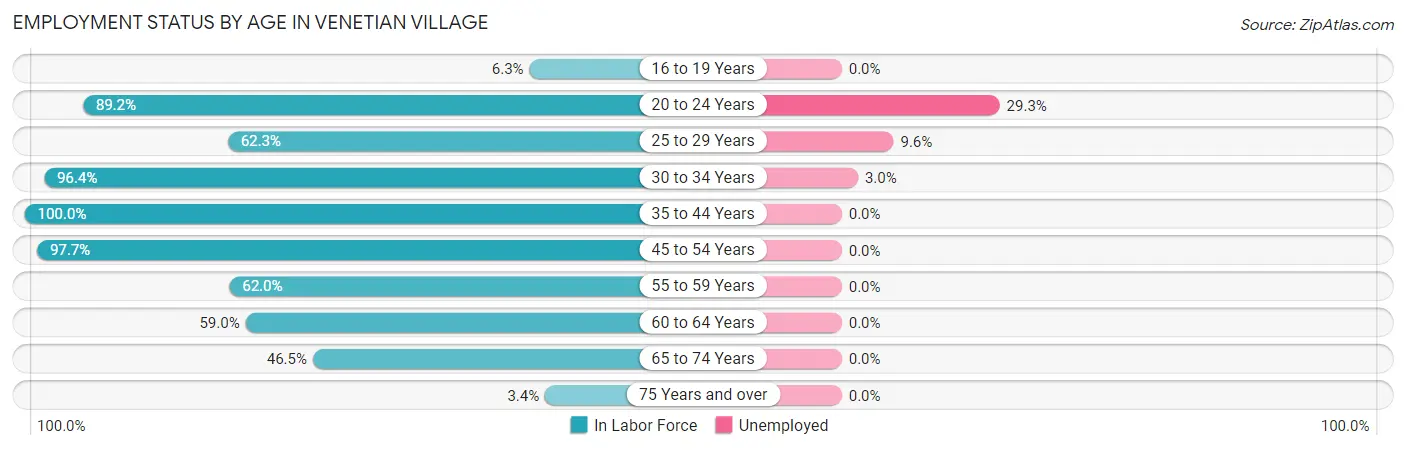
| Age Bracket | In Labor Force | Unemployed |
| 16 to 19 Years | 5 (6.3%) | 0 (0.0%) |
| 20 to 24 Years | 99 (89.2%) | 29 (29.3%) |
| 25 to 29 Years | 94 (62.3%) | 9 (9.6%) |
| 30 to 34 Years | 270 (96.4%) | 8 (3.0%) |
| 35 to 44 Years | 270 (100.0%) | 0 (0.0%) |
| 45 to 54 Years | 301 (97.7%) | 0 (0.0%) |
| 55 to 59 Years | 176 (62.0%) | 0 (0.0%) |
| 60 to 64 Years | 92 (59.0%) | 0 (0.0%) |
| 65 to 74 Years | 120 (46.5%) | 0 (0.0%) |
| 75 Years and over | 7 (3.4%) | 0 (0.0%) |
| Total | 1,434 (68.3%) | 46 (3.2%) |
Employment Status by Educational Attainment in Venetian Village
According to labor force statistics for Venetian Village, 83.0% of individuals (1,203) out of the total population between 25 and 64 years of age (1,449) are in the labor force, with 1.4% or 17 of them being unemployed. The group with the highest labor force participation rate are those with the educational attainment of college / associate degree, with 87.4% or 471 individuals in the labor force. Within the labor force, individuals with college / associate degree education have the highest percentage of unemployment, with 3.6% or 17 of them being unemployed.
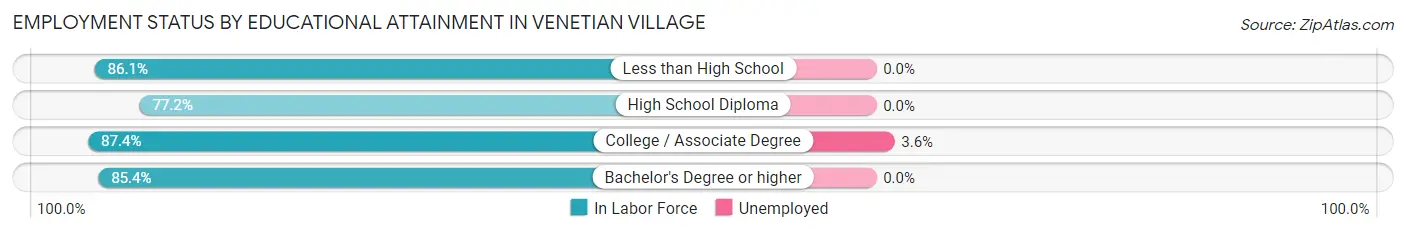
| Educational Attainment | In Labor Force | Unemployed |
| Less than High School | 142 (86.1%) | 0 (0.0%) |
| High School Diploma | 438 (77.2%) | 0 (0.0%) |
| College / Associate Degree | 471 (87.4%) | 19 (3.6%) |
| Bachelor's Degree or higher | 152 (85.4%) | 0 (0.0%) |
| Total | 1,203 (83.0%) | 20 (1.4%) |
Employment Occupations by Sex in Venetian Village
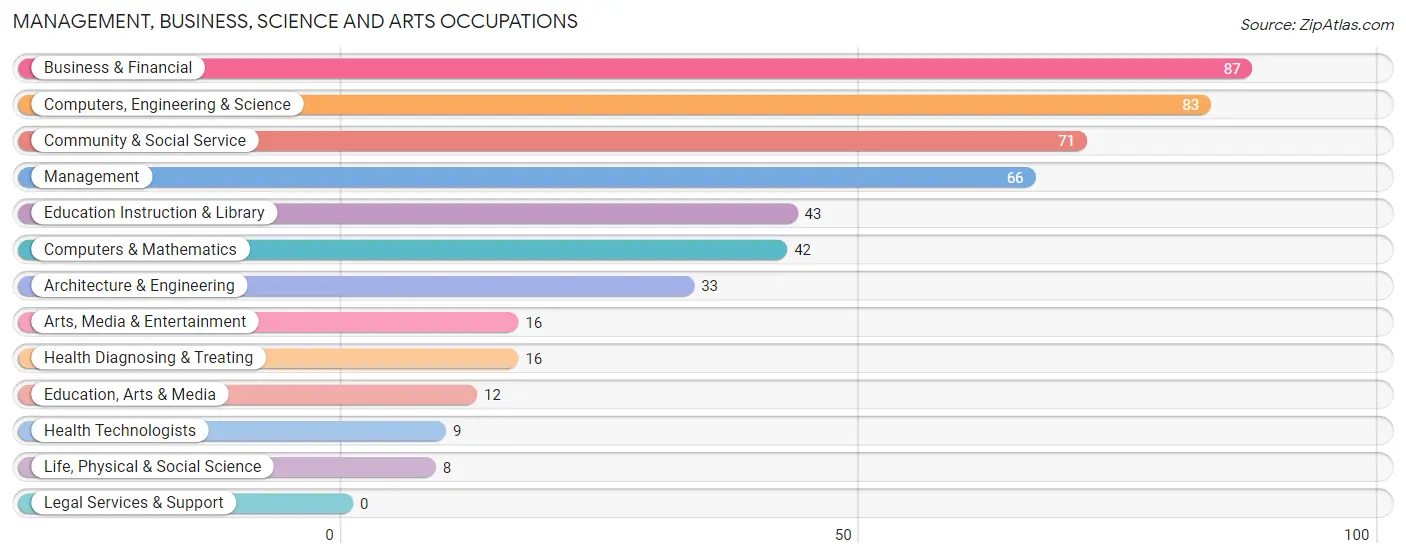
Management, Business, Science and Arts Occupations
The most common Management, Business, Science and Arts occupations in Venetian Village are Business & Financial (87 | 6.3%), Computers, Engineering & Science (83 | 6.0%), Community & Social Service (71 | 5.1%), Management (66 | 4.8%), and Education Instruction & Library (43 | 3.1%).
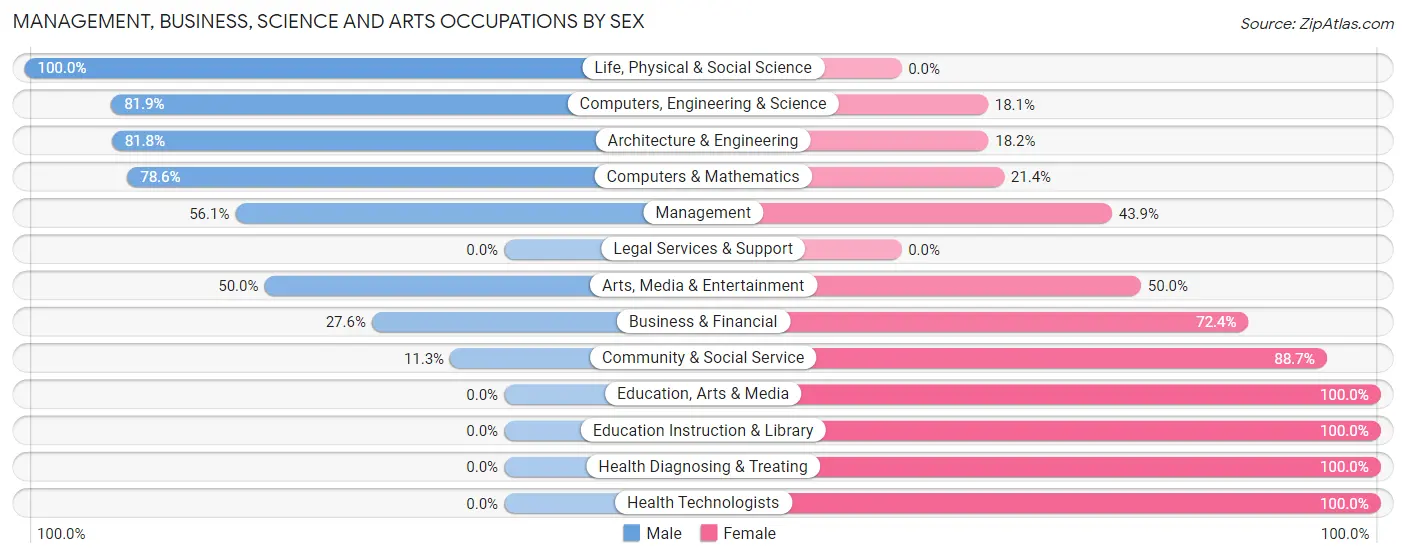
Management, Business, Science and Arts Occupations by Sex
Within the Management, Business, Science and Arts occupations in Venetian Village, the most male-oriented occupations are Life, Physical & Social Science (100.0%), Computers, Engineering & Science (81.9%), and Architecture & Engineering (81.8%), while the most female-oriented occupations are Education, Arts & Media (100.0%), Education Instruction & Library (100.0%), and Health Diagnosing & Treating (100.0%).
| Occupation | Male | Female |
| Management | 37 (56.1%) | 29 (43.9%) |
| Business & Financial | 24 (27.6%) | 63 (72.4%) |
| Computers, Engineering & Science | 68 (81.9%) | 15 (18.1%) |
| Computers & Mathematics | 33 (78.6%) | 9 (21.4%) |
| Architecture & Engineering | 27 (81.8%) | 6 (18.2%) |
| Life, Physical & Social Science | 8 (100.0%) | 0 (0.0%) |
| Community & Social Service | 8 (11.3%) | 63 (88.7%) |
| Education, Arts & Media | 0 (0.0%) | 12 (100.0%) |
| Legal Services & Support | 0 (0.0%) | 0 (0.0%) |
| Education Instruction & Library | 0 (0.0%) | 43 (100.0%) |
| Arts, Media & Entertainment | 8 (50.0%) | 8 (50.0%) |
| Health Diagnosing & Treating | 0 (0.0%) | 16 (100.0%) |
| Health Technologists | 0 (0.0%) | 9 (100.0%) |
| Total (Category) | 137 (42.4%) | 186 (57.6%) |
| Total (Overall) | 738 (53.2%) | 650 (46.8%) |
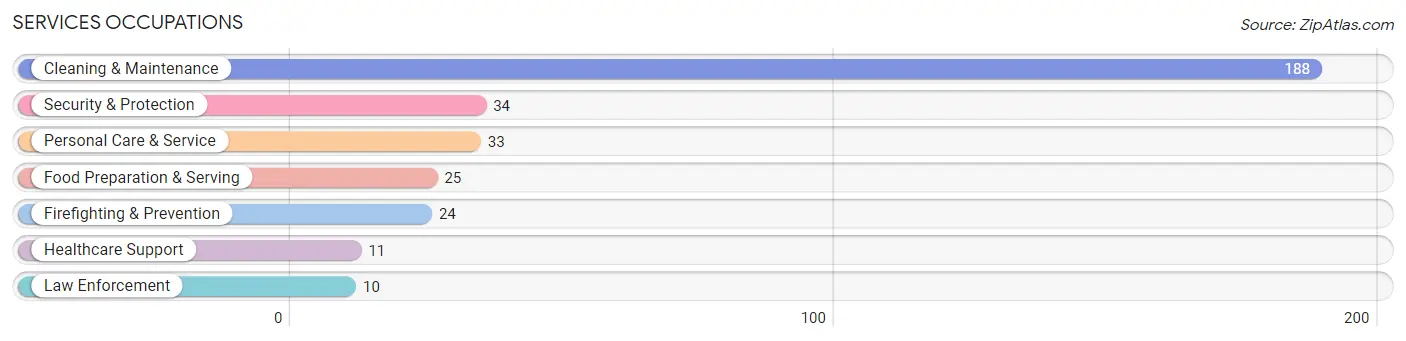
Services Occupations
The most common Services occupations in Venetian Village are Cleaning & Maintenance (188 | 13.5%), Security & Protection (34 | 2.5%), Personal Care & Service (33 | 2.4%), Food Preparation & Serving (25 | 1.8%), and Firefighting & Prevention (24 | 1.7%).
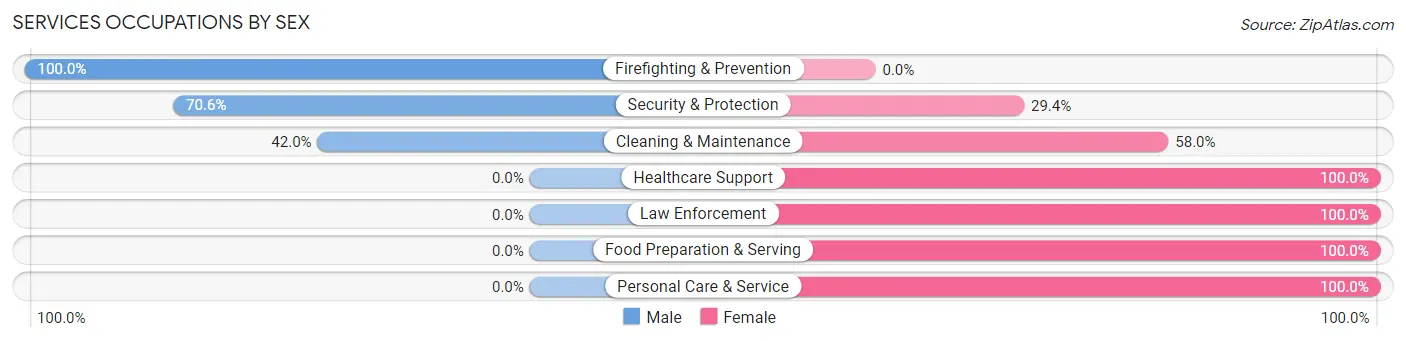
Services Occupations by Sex
Within the Services occupations in Venetian Village, the most male-oriented occupations are Firefighting & Prevention (100.0%), Security & Protection (70.6%), and Cleaning & Maintenance (42.0%), while the most female-oriented occupations are Healthcare Support (100.0%), Law Enforcement (100.0%), and Food Preparation & Serving (100.0%).
| Occupation | Male | Female |
| Healthcare Support | 0 (0.0%) | 11 (100.0%) |
| Security & Protection | 24 (70.6%) | 10 (29.4%) |
| Firefighting & Prevention | 24 (100.0%) | 0 (0.0%) |
| Law Enforcement | 0 (0.0%) | 10 (100.0%) |
| Food Preparation & Serving | 0 (0.0%) | 25 (100.0%) |
| Cleaning & Maintenance | 79 (42.0%) | 109 (58.0%) |
| Personal Care & Service | 0 (0.0%) | 33 (100.0%) |
| Total (Category) | 103 (35.4%) | 188 (64.6%) |
| Total (Overall) | 738 (53.2%) | 650 (46.8%) |
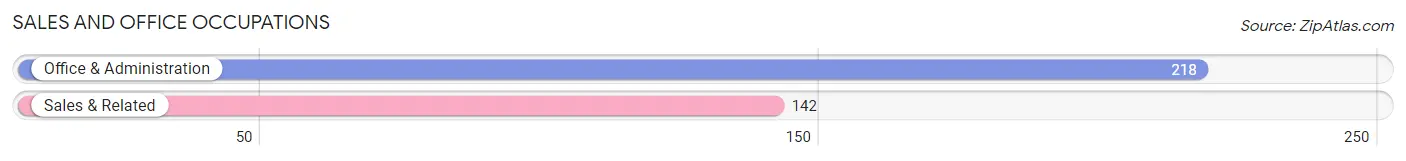
Sales and Office Occupations
The most common Sales and Office occupations in Venetian Village are Office & Administration (218 | 15.7%), and Sales & Related (142 | 10.2%).
Sales and Office Occupations by Sex
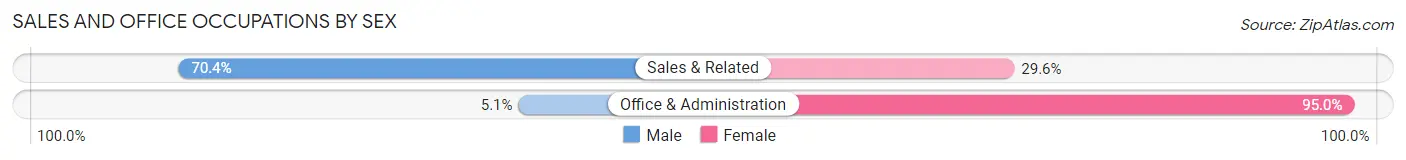
| Occupation | Male | Female |
| Sales & Related | 100 (70.4%) | 42 (29.6%) |
| Office & Administration | 11 (5.1%) | 207 (95.0%) |
| Total (Category) | 111 (30.8%) | 249 (69.2%) |
| Total (Overall) | 738 (53.2%) | 650 (46.8%) |
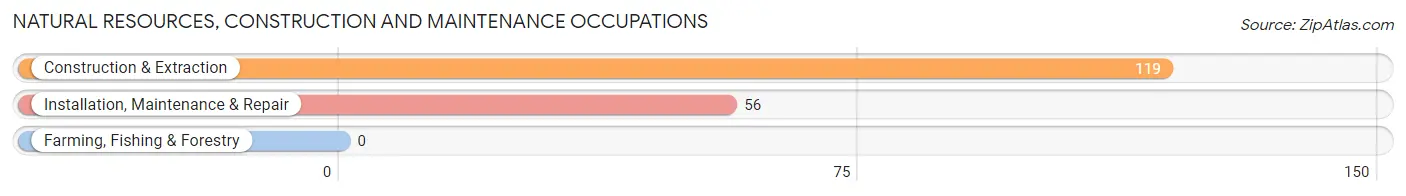
Natural Resources, Construction and Maintenance Occupations
The most common Natural Resources, Construction and Maintenance occupations in Venetian Village are Construction & Extraction (119 | 8.6%), and Installation, Maintenance & Repair (56 | 4.0%).
Natural Resources, Construction and Maintenance Occupations by Sex
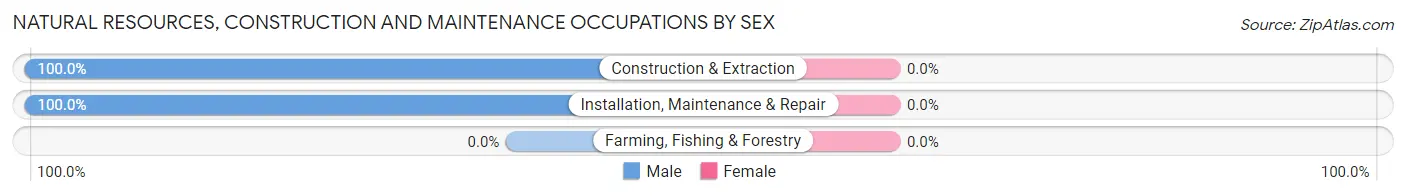
| Occupation | Male | Female |
| Farming, Fishing & Forestry | 0 (0.0%) | 0 (0.0%) |
| Construction & Extraction | 119 (100.0%) | 0 (0.0%) |
| Installation, Maintenance & Repair | 56 (100.0%) | 0 (0.0%) |
| Total (Category) | 175 (100.0%) | 0 (0.0%) |
| Total (Overall) | 738 (53.2%) | 650 (46.8%) |
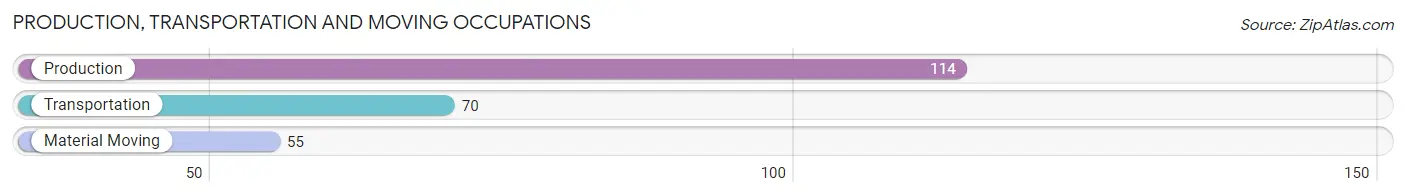
Production, Transportation and Moving Occupations
The most common Production, Transportation and Moving occupations in Venetian Village are Production (114 | 8.2%), Transportation (70 | 5.0%), and Material Moving (55 | 4.0%).
Production, Transportation and Moving Occupations by Sex
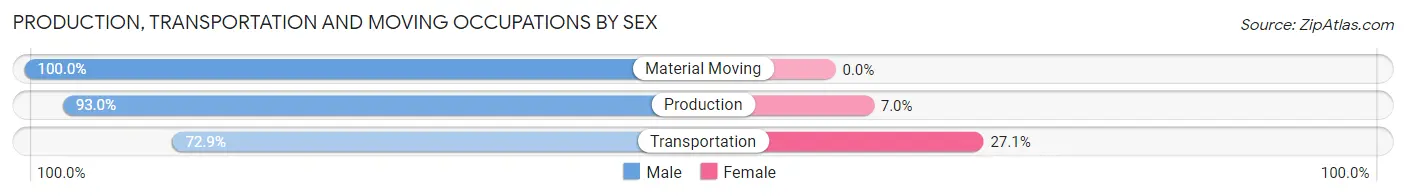
| Occupation | Male | Female |
| Production | 106 (93.0%) | 8 (7.0%) |
| Transportation | 51 (72.9%) | 19 (27.1%) |
| Material Moving | 55 (100.0%) | 0 (0.0%) |
| Total (Category) | 212 (88.7%) | 27 (11.3%) |
| Total (Overall) | 738 (53.2%) | 650 (46.8%) |
Employment Industries by Sex in Venetian Village
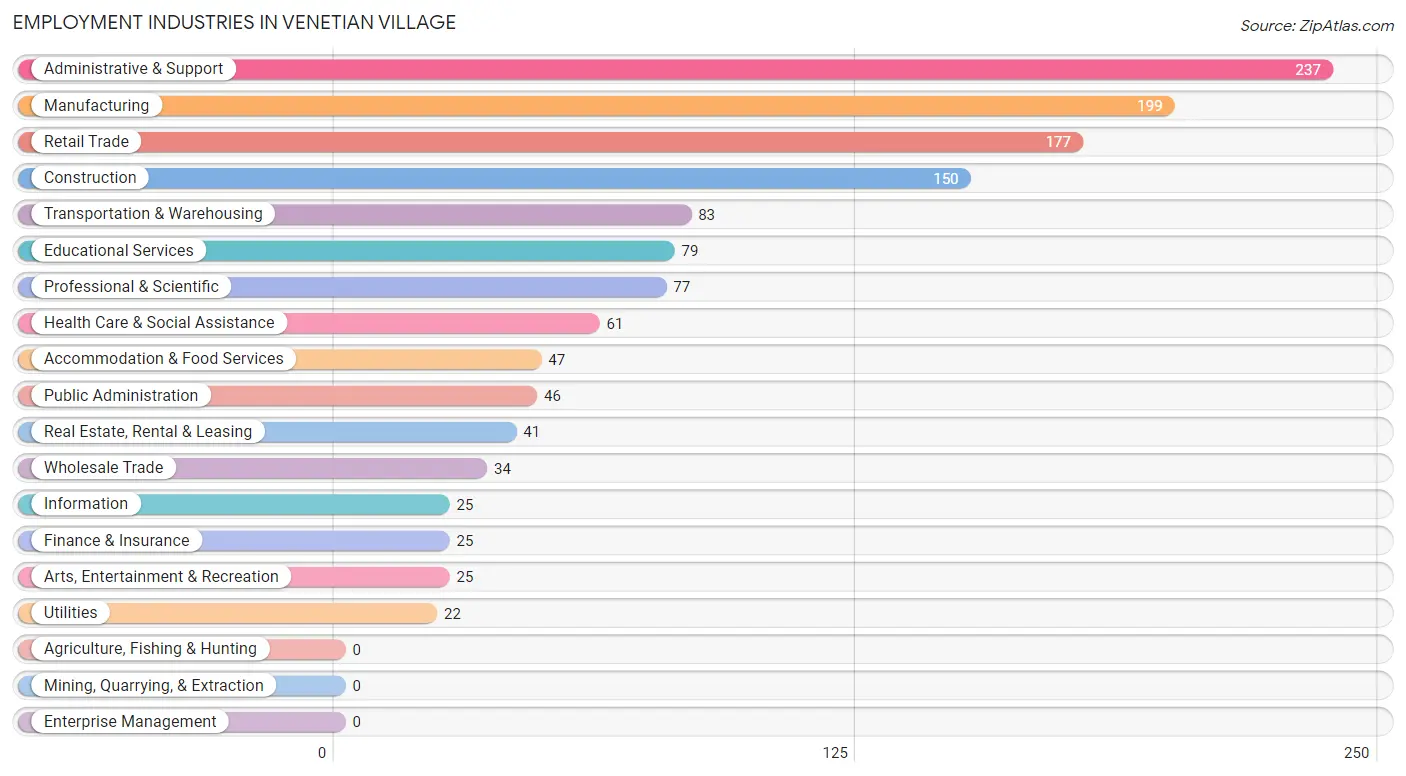
Employment Industries in Venetian Village
The major employment industries in Venetian Village include Administrative & Support (237 | 17.1%), Manufacturing (199 | 14.3%), Retail Trade (177 | 12.8%), Construction (150 | 10.8%), and Transportation & Warehousing (83 | 6.0%).
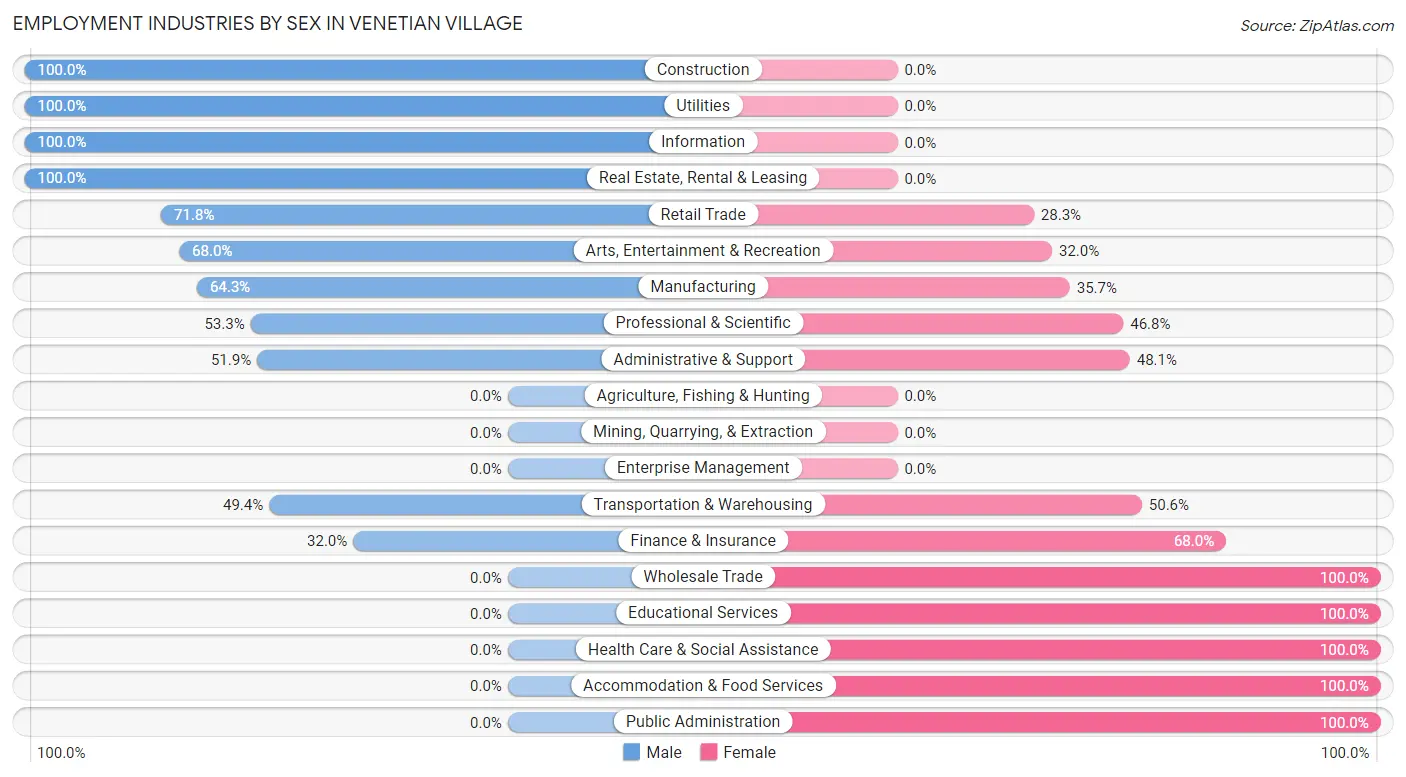
Employment Industries by Sex in Venetian Village
The Venetian Village industries that see more men than women are Construction (100.0%), Utilities (100.0%), and Information (100.0%), whereas the industries that tend to have a higher number of women are Wholesale Trade (100.0%), Educational Services (100.0%), and Health Care & Social Assistance (100.0%).
| Industry | Male | Female |
| Agriculture, Fishing & Hunting | 0 (0.0%) | 0 (0.0%) |
| Mining, Quarrying, & Extraction | 0 (0.0%) | 0 (0.0%) |
| Construction | 150 (100.0%) | 0 (0.0%) |
| Manufacturing | 128 (64.3%) | 71 (35.7%) |
| Wholesale Trade | 0 (0.0%) | 34 (100.0%) |
| Retail Trade | 127 (71.8%) | 50 (28.2%) |
| Transportation & Warehousing | 41 (49.4%) | 42 (50.6%) |
| Utilities | 22 (100.0%) | 0 (0.0%) |
| Information | 25 (100.0%) | 0 (0.0%) |
| Finance & Insurance | 8 (32.0%) | 17 (68.0%) |
| Real Estate, Rental & Leasing | 41 (100.0%) | 0 (0.0%) |
| Professional & Scientific | 41 (53.2%) | 36 (46.8%) |
| Enterprise Management | 0 (0.0%) | 0 (0.0%) |
| Administrative & Support | 123 (51.9%) | 114 (48.1%) |
| Educational Services | 0 (0.0%) | 79 (100.0%) |
| Health Care & Social Assistance | 0 (0.0%) | 61 (100.0%) |
| Arts, Entertainment & Recreation | 17 (68.0%) | 8 (32.0%) |
| Accommodation & Food Services | 0 (0.0%) | 47 (100.0%) |
| Public Administration | 0 (0.0%) | 46 (100.0%) |
| Total | 738 (53.2%) | 650 (46.8%) |
Education in Venetian Village
School Enrollment in Venetian Village
The most common levels of schooling among the 628 students in Venetian Village are high school (183 | 29.1%), middle school (176 | 28.0%), and elementary school (98 | 15.6%).
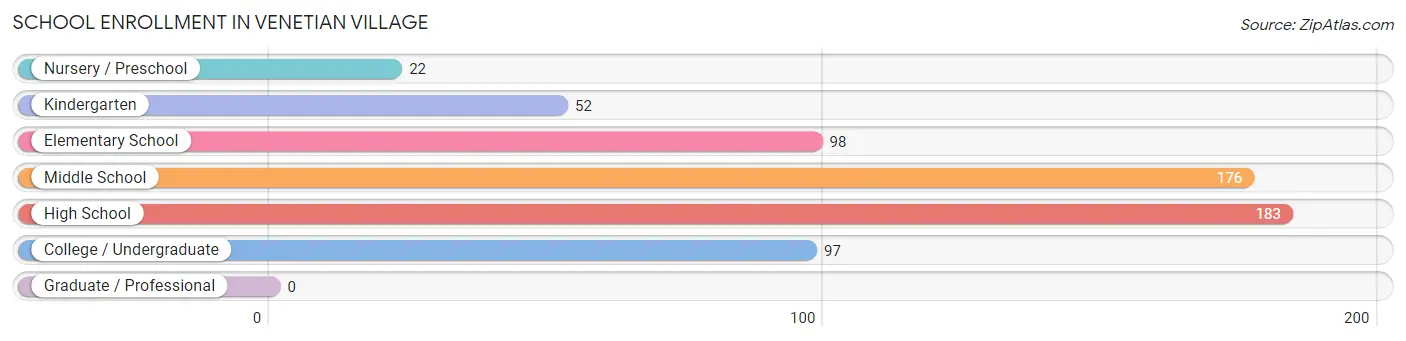
| School Level | # Students | % Students |
| Nursery / Preschool | 22 | 3.5% |
| Kindergarten | 52 | 8.3% |
| Elementary School | 98 | 15.6% |
| Middle School | 176 | 28.0% |
| High School | 183 | 29.1% |
| College / Undergraduate | 97 | 15.4% |
| Graduate / Professional | 0 | 0.0% |
| Total | 628 | 100.0% |
School Enrollment by Age by Funding Source in Venetian Village
Out of a total of 628 students who are enrolled in schools in Venetian Village, 11 (1.8%) attend a private institution, while the remaining 617 (98.2%) are enrolled in public schools. The age group of 25 to 34 year olds has the highest likelihood of being enrolled in private schools, with 11 (52.4% in the age bracket) enrolled. Conversely, the age group of 3 to 4 year olds has the lowest likelihood of being enrolled in a private school, with 11 (100.0% in the age bracket) attending a public institution.
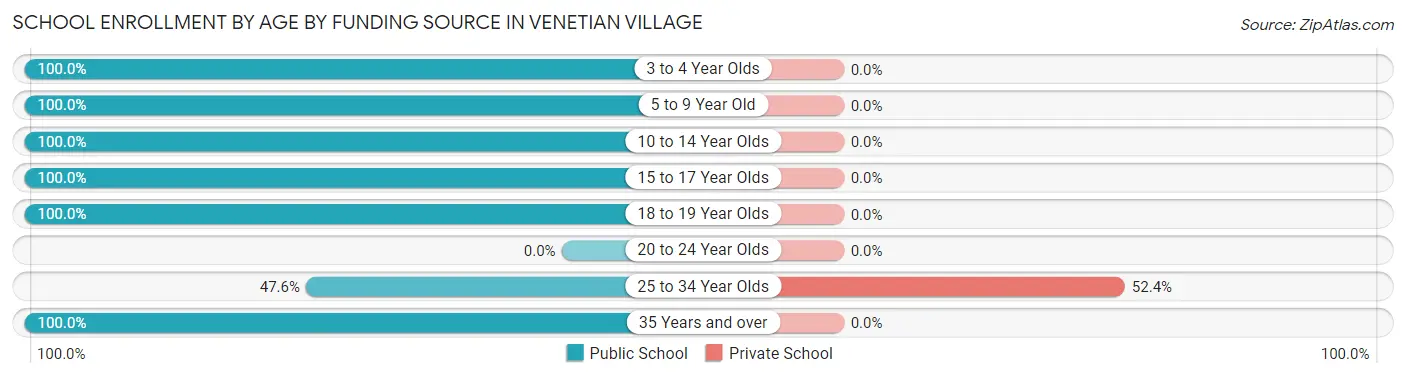
| Age Bracket | Public School | Private School |
| 3 to 4 Year Olds | 11 (100.0%) | 0 (0.0%) |
| 5 to 9 Year Old | 161 (100.0%) | 0 (0.0%) |
| 10 to 14 Year Olds | 217 (100.0%) | 0 (0.0%) |
| 15 to 17 Year Olds | 98 (100.0%) | 0 (0.0%) |
| 18 to 19 Year Olds | 62 (100.0%) | 0 (0.0%) |
| 20 to 24 Year Olds | 0 (0.0%) | 0 (0.0%) |
| 25 to 34 Year Olds | 10 (47.6%) | 11 (52.4%) |
| 35 Years and over | 58 (100.0%) | 0 (0.0%) |
| Total | 617 (98.2%) | 11 (1.8%) |
Educational Attainment by Field of Study in Venetian Village
Social sciences (67 | 22.8%), business (57 | 19.4%), arts & humanities (36 | 12.2%), science & technology (26 | 8.8%), and visual & performing arts (26 | 8.8%) are the most common fields of study among 294 individuals in Venetian Village who have obtained a bachelor's degree or higher.
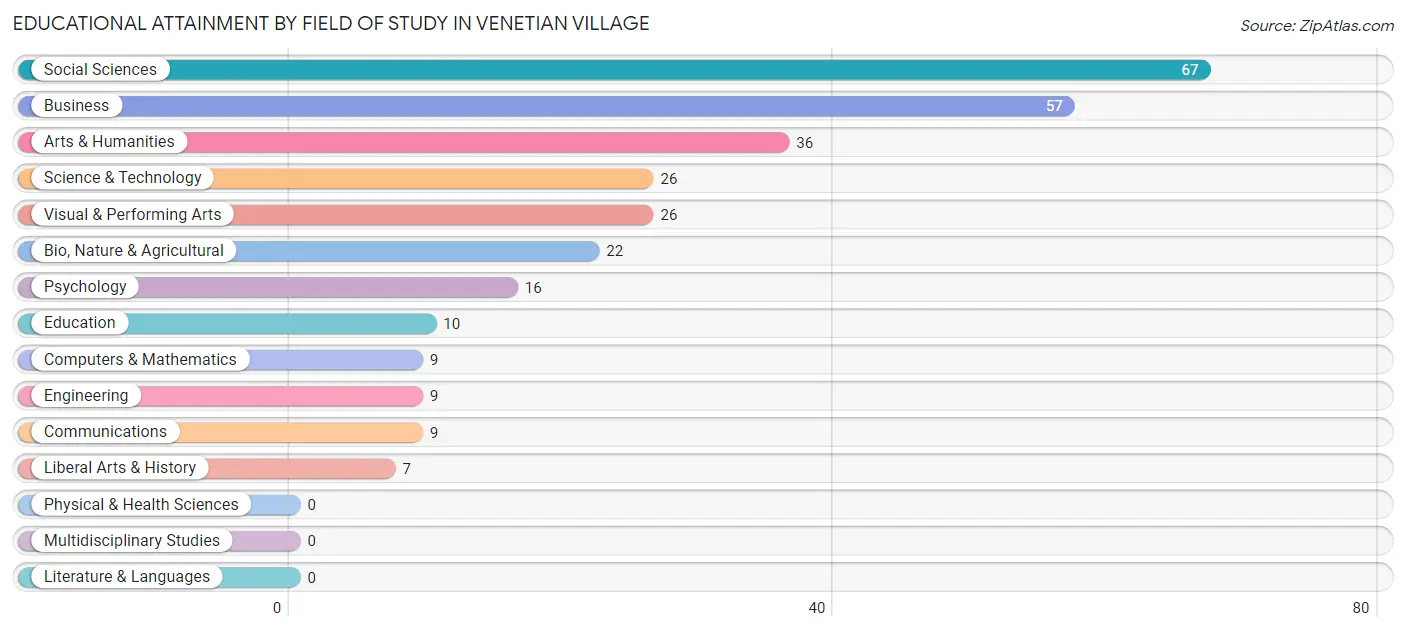
| Field of Study | # Graduates | % Graduates |
| Computers & Mathematics | 9 | 3.1% |
| Bio, Nature & Agricultural | 22 | 7.5% |
| Physical & Health Sciences | 0 | 0.0% |
| Psychology | 16 | 5.4% |
| Social Sciences | 67 | 22.8% |
| Engineering | 9 | 3.1% |
| Multidisciplinary Studies | 0 | 0.0% |
| Science & Technology | 26 | 8.8% |
| Business | 57 | 19.4% |
| Education | 10 | 3.4% |
| Literature & Languages | 0 | 0.0% |
| Liberal Arts & History | 7 | 2.4% |
| Visual & Performing Arts | 26 | 8.8% |
| Communications | 9 | 3.1% |
| Arts & Humanities | 36 | 12.2% |
| Total | 294 | 100.0% |
Transportation & Commute in Venetian Village
Vehicle Availability by Sex in Venetian Village
The most prevalent vehicle ownership categories in Venetian Village are males with 2 vehicles (413, accounting for 56.7%) and females with 2 vehicles (408, making up 64.4%).
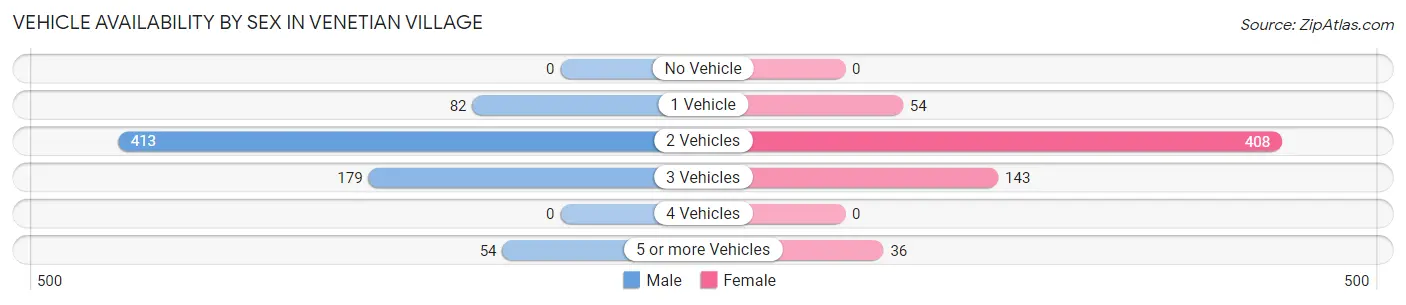
| Vehicles Available | Male | Female |
| No Vehicle | 0 (0.0%) | 0 (0.0%) |
| 1 Vehicle | 82 (11.3%) | 54 (8.4%) |
| 2 Vehicles | 413 (56.7%) | 408 (63.6%) |
| 3 Vehicles | 179 (24.6%) | 143 (22.3%) |
| 4 Vehicles | 0 (0.0%) | 0 (0.0%) |
| 5 or more Vehicles | 54 (7.4%) | 36 (5.6%) |
| Total | 728 (100.0%) | 641 (100.0%) |
Commute Time in Venetian Village
The most frequently occuring commute durations in Venetian Village are 15 to 19 minutes (257 commuters, 21.8%), 30 to 34 minutes (193 commuters, 16.4%), and 20 to 24 minutes (173 commuters, 14.7%).
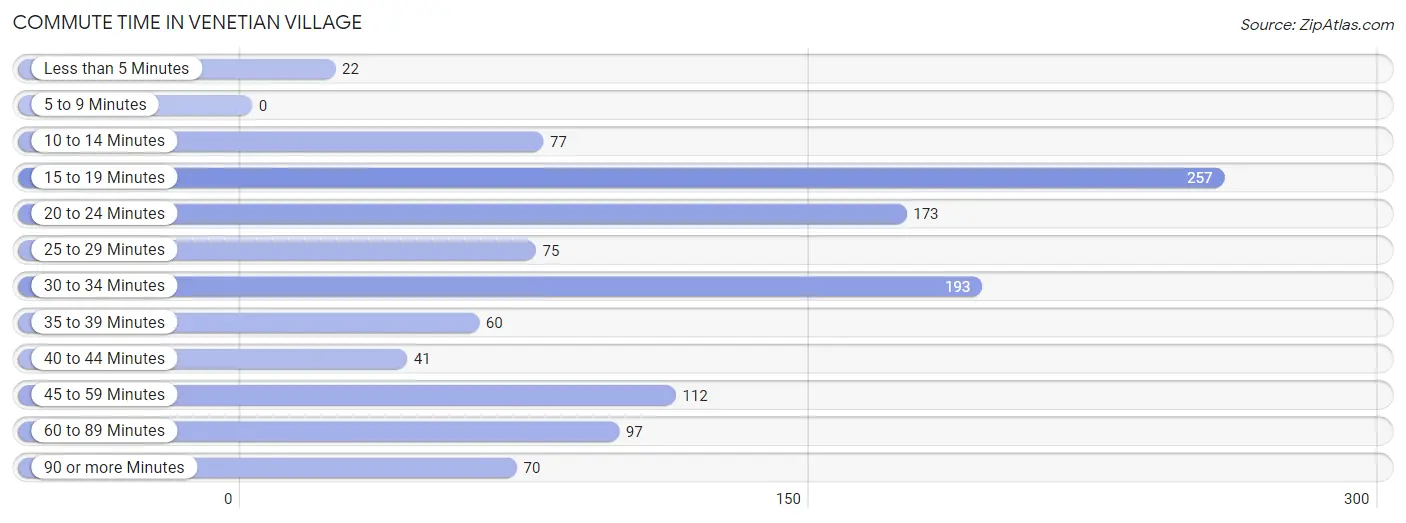
| Commute Time | # Commuters | % Commuters |
| Less than 5 Minutes | 22 | 1.9% |
| 5 to 9 Minutes | 0 | 0.0% |
| 10 to 14 Minutes | 77 | 6.5% |
| 15 to 19 Minutes | 257 | 21.8% |
| 20 to 24 Minutes | 173 | 14.7% |
| 25 to 29 Minutes | 75 | 6.4% |
| 30 to 34 Minutes | 193 | 16.4% |
| 35 to 39 Minutes | 60 | 5.1% |
| 40 to 44 Minutes | 41 | 3.5% |
| 45 to 59 Minutes | 112 | 9.5% |
| 60 to 89 Minutes | 97 | 8.2% |
| 90 or more Minutes | 70 | 5.9% |
Commute Time by Sex in Venetian Village
The most common commute times in Venetian Village are 15 to 19 minutes (111 commuters, 18.0%) for males and 15 to 19 minutes (146 commuters, 26.0%) for females.
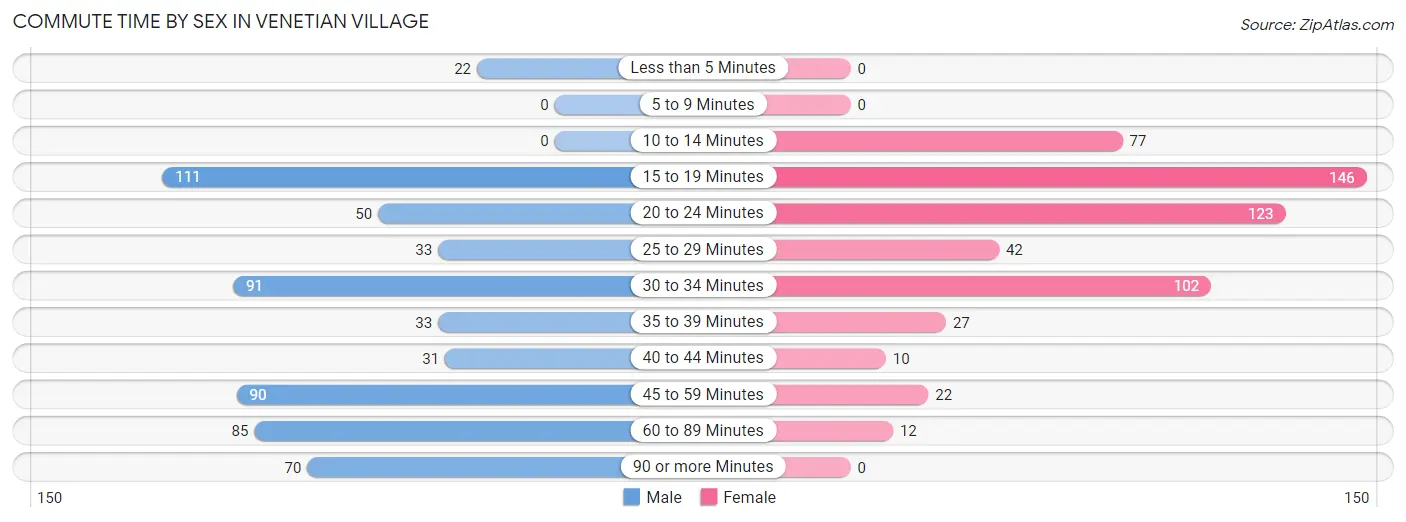
| Commute Time | Male | Female |
| Less than 5 Minutes | 22 (3.6%) | 0 (0.0%) |
| 5 to 9 Minutes | 0 (0.0%) | 0 (0.0%) |
| 10 to 14 Minutes | 0 (0.0%) | 77 (13.7%) |
| 15 to 19 Minutes | 111 (18.0%) | 146 (26.0%) |
| 20 to 24 Minutes | 50 (8.1%) | 123 (21.9%) |
| 25 to 29 Minutes | 33 (5.4%) | 42 (7.5%) |
| 30 to 34 Minutes | 91 (14.8%) | 102 (18.2%) |
| 35 to 39 Minutes | 33 (5.4%) | 27 (4.8%) |
| 40 to 44 Minutes | 31 (5.0%) | 10 (1.8%) |
| 45 to 59 Minutes | 90 (14.6%) | 22 (3.9%) |
| 60 to 89 Minutes | 85 (13.8%) | 12 (2.1%) |
| 90 or more Minutes | 70 (11.4%) | 0 (0.0%) |
Time of Departure to Work by Sex in Venetian Village
The most frequent times of departure to work in Venetian Village are 12:00 AM to 4:59 AM (185, 30.0%) for males and 7:00 AM to 7:29 AM (87, 15.5%) for females.
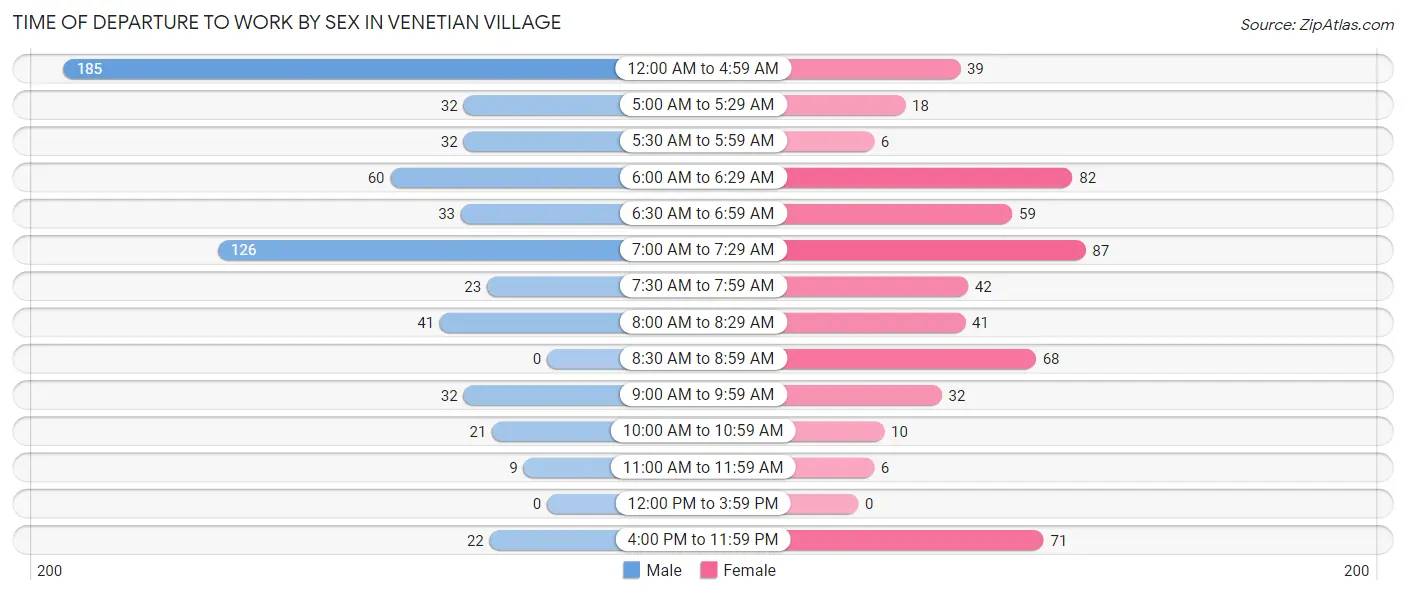
| Time of Departure | Male | Female |
| 12:00 AM to 4:59 AM | 185 (30.0%) | 39 (7.0%) |
| 5:00 AM to 5:29 AM | 32 (5.2%) | 18 (3.2%) |
| 5:30 AM to 5:59 AM | 32 (5.2%) | 6 (1.1%) |
| 6:00 AM to 6:29 AM | 60 (9.7%) | 82 (14.6%) |
| 6:30 AM to 6:59 AM | 33 (5.4%) | 59 (10.5%) |
| 7:00 AM to 7:29 AM | 126 (20.4%) | 87 (15.5%) |
| 7:30 AM to 7:59 AM | 23 (3.7%) | 42 (7.5%) |
| 8:00 AM to 8:29 AM | 41 (6.7%) | 41 (7.3%) |
| 8:30 AM to 8:59 AM | 0 (0.0%) | 68 (12.1%) |
| 9:00 AM to 9:59 AM | 32 (5.2%) | 32 (5.7%) |
| 10:00 AM to 10:59 AM | 21 (3.4%) | 10 (1.8%) |
| 11:00 AM to 11:59 AM | 9 (1.5%) | 6 (1.1%) |
| 12:00 PM to 3:59 PM | 0 (0.0%) | 0 (0.0%) |
| 4:00 PM to 11:59 PM | 22 (3.6%) | 71 (12.7%) |
| Total | 616 (100.0%) | 561 (100.0%) |
Housing Occupancy in Venetian Village
Occupancy by Ownership in Venetian Village
Of the total 1,000 dwellings in Venetian Village, owner-occupied units account for 862 (86.2%), while renter-occupied units make up 138 (13.8%).
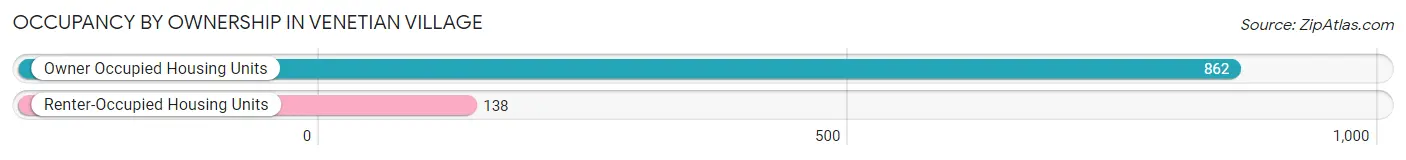
| Occupancy | # Housing Units | % Housing Units |
| Owner Occupied Housing Units | 862 | 86.2% |
| Renter-Occupied Housing Units | 138 | 13.8% |
| Total Occupied Housing Units | 1,000 | 100.0% |
Occupancy by Household Size in Venetian Village
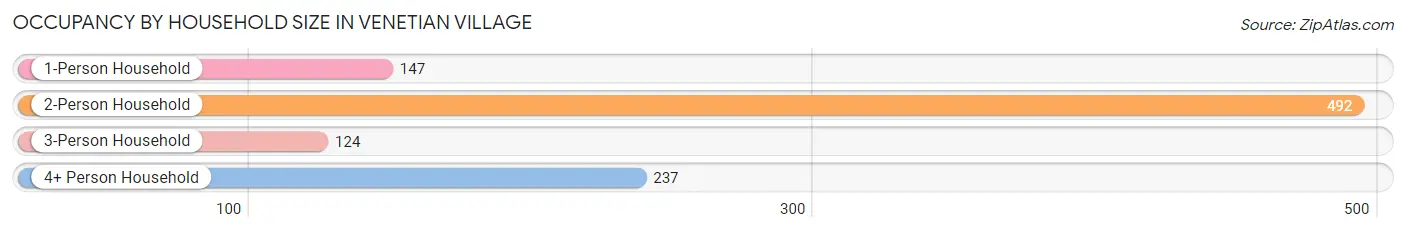
| Household Size | # Housing Units | % Housing Units |
| 1-Person Household | 147 | 14.7% |
| 2-Person Household | 492 | 49.2% |
| 3-Person Household | 124 | 12.4% |
| 4+ Person Household | 237 | 23.7% |
| Total Housing Units | 1,000 | 100.0% |
Occupancy by Ownership by Household Size in Venetian Village
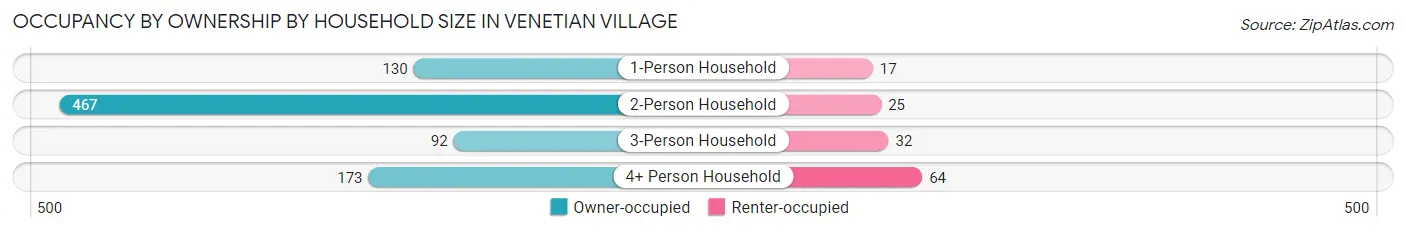
| Household Size | Owner-occupied | Renter-occupied |
| 1-Person Household | 130 (88.4%) | 17 (11.6%) |
| 2-Person Household | 467 (94.9%) | 25 (5.1%) |
| 3-Person Household | 92 (74.2%) | 32 (25.8%) |
| 4+ Person Household | 173 (73.0%) | 64 (27.0%) |
| Total Housing Units | 862 (86.2%) | 138 (13.8%) |
Occupancy by Educational Attainment in Venetian Village
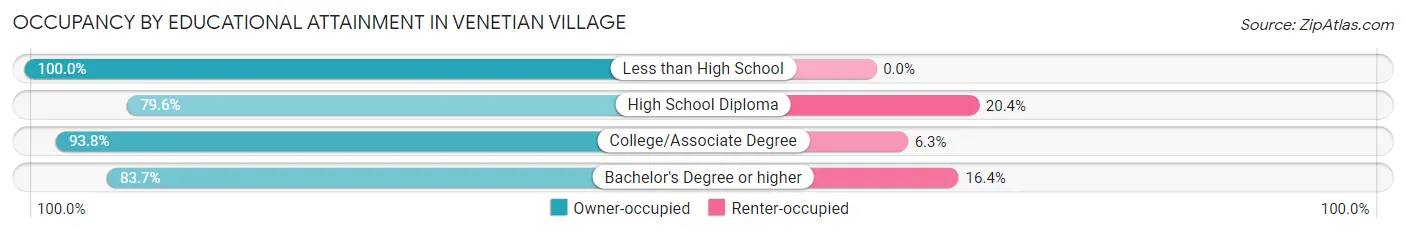
| Household Size | Owner-occupied | Renter-occupied |
| Less than High School | 47 (100.0%) | 0 (0.0%) |
| High School Diploma | 352 (79.6%) | 90 (20.4%) |
| College/Associate Degree | 330 (93.8%) | 22 (6.2%) |
| Bachelor's Degree or higher | 133 (83.7%) | 26 (16.4%) |
Occupancy by Age of Householder in Venetian Village
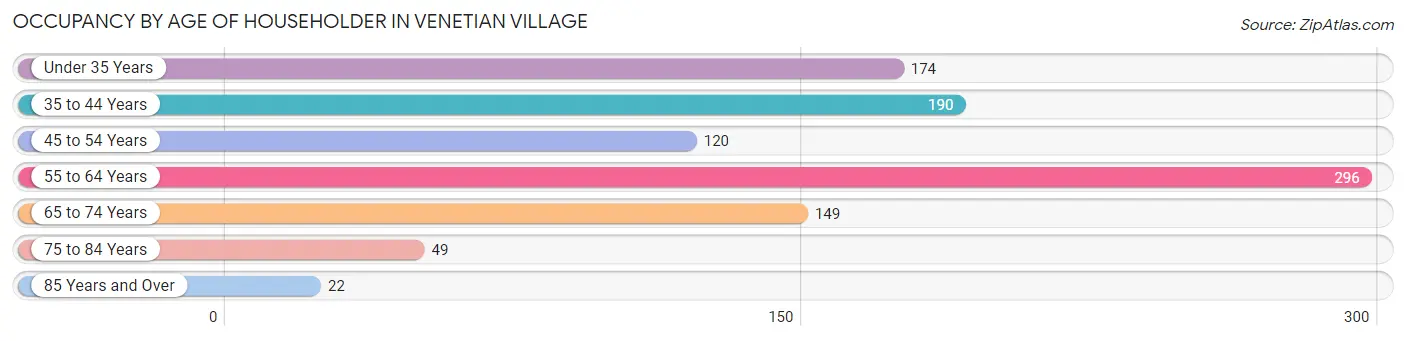
| Age Bracket | # Households | % Households |
| Under 35 Years | 174 | 17.4% |
| 35 to 44 Years | 190 | 19.0% |
| 45 to 54 Years | 120 | 12.0% |
| 55 to 64 Years | 296 | 29.6% |
| 65 to 74 Years | 149 | 14.9% |
| 75 to 84 Years | 49 | 4.9% |
| 85 Years and Over | 22 | 2.2% |
| Total | 1,000 | 100.0% |
Housing Finances in Venetian Village
Median Income by Occupancy in Venetian Village
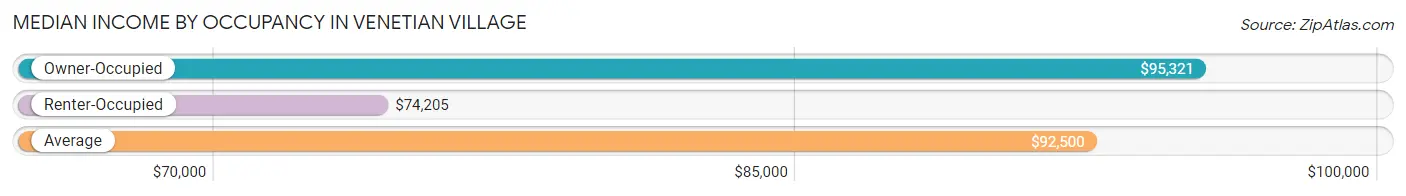
| Occupancy Type | # Households | Median Income |
| Owner-Occupied | 862 (86.2%) | $95,321 |
| Renter-Occupied | 138 (13.8%) | $74,205 |
| Average | 1,000 (100.0%) | $92,500 |
Occupancy by Householder Income Bracket in Venetian Village
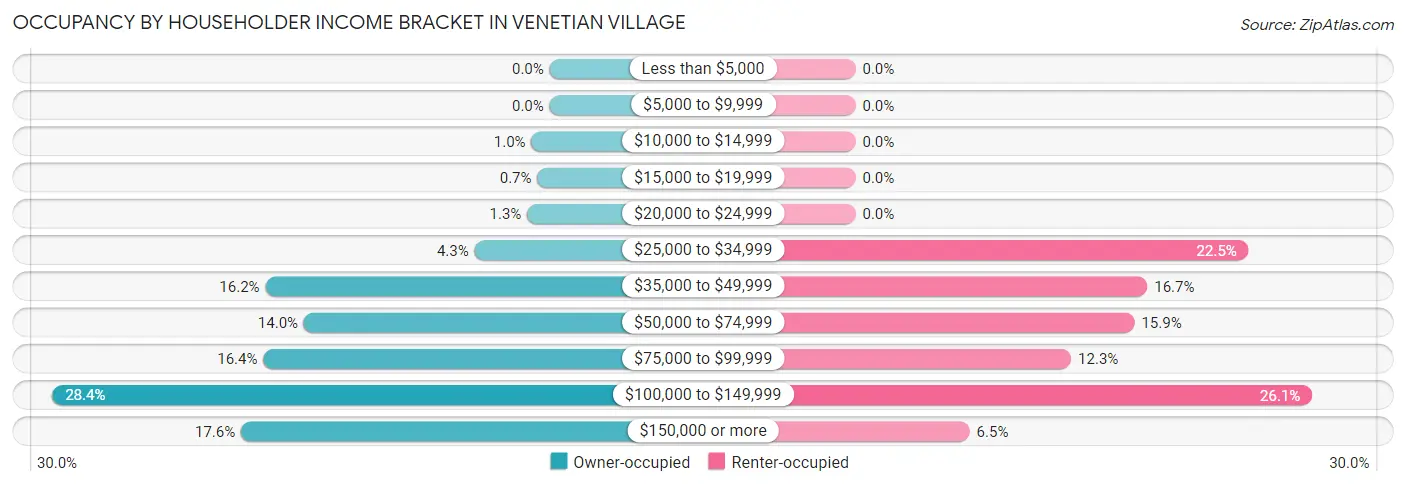
| Income Bracket | Owner-occupied | Renter-occupied |
| Less than $5,000 | 0 (0.0%) | 0 (0.0%) |
| $5,000 to $9,999 | 0 (0.0%) | 0 (0.0%) |
| $10,000 to $14,999 | 9 (1.0%) | 0 (0.0%) |
| $15,000 to $19,999 | 6 (0.7%) | 0 (0.0%) |
| $20,000 to $24,999 | 11 (1.3%) | 0 (0.0%) |
| $25,000 to $34,999 | 37 (4.3%) | 31 (22.5%) |
| $35,000 to $49,999 | 140 (16.2%) | 23 (16.7%) |
| $50,000 to $74,999 | 121 (14.0%) | 22 (15.9%) |
| $75,000 to $99,999 | 141 (16.4%) | 17 (12.3%) |
| $100,000 to $149,999 | 245 (28.4%) | 36 (26.1%) |
| $150,000 or more | 152 (17.6%) | 9 (6.5%) |
| Total | 862 (100.0%) | 138 (100.0%) |
Monthly Housing Cost Tiers in Venetian Village
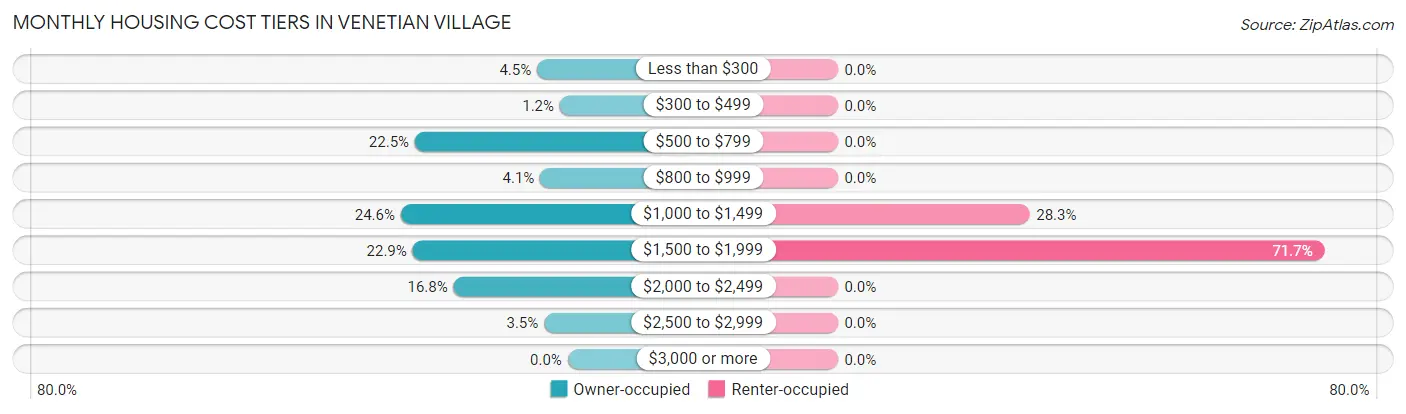
| Monthly Cost | Owner-occupied | Renter-occupied |
| Less than $300 | 39 (4.5%) | 0 (0.0%) |
| $300 to $499 | 10 (1.2%) | 0 (0.0%) |
| $500 to $799 | 194 (22.5%) | 0 (0.0%) |
| $800 to $999 | 35 (4.1%) | 0 (0.0%) |
| $1,000 to $1,499 | 212 (24.6%) | 39 (28.3%) |
| $1,500 to $1,999 | 197 (22.9%) | 99 (71.7%) |
| $2,000 to $2,499 | 145 (16.8%) | 0 (0.0%) |
| $2,500 to $2,999 | 30 (3.5%) | 0 (0.0%) |
| $3,000 or more | 0 (0.0%) | 0 (0.0%) |
| Total | 862 (100.0%) | 138 (100.0%) |
Physical Housing Characteristics in Venetian Village
Housing Structures in Venetian Village
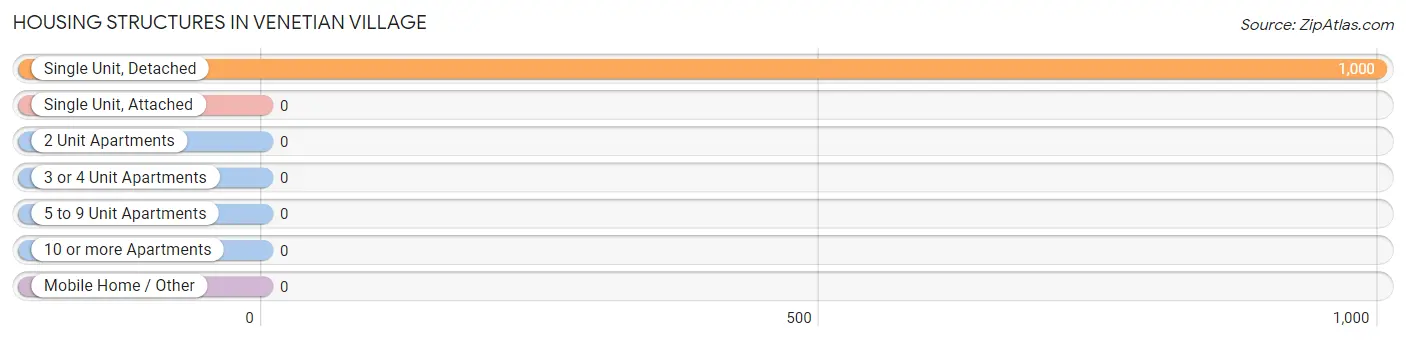
| Structure Type | # Housing Units | % Housing Units |
| Single Unit, Detached | 1,000 | 100.0% |
| Single Unit, Attached | 0 | 0.0% |
| 2 Unit Apartments | 0 | 0.0% |
| 3 or 4 Unit Apartments | 0 | 0.0% |
| 5 to 9 Unit Apartments | 0 | 0.0% |
| 10 or more Apartments | 0 | 0.0% |
| Mobile Home / Other | 0 | 0.0% |
| Total | 1,000 | 100.0% |
Housing Structures by Occupancy in Venetian Village
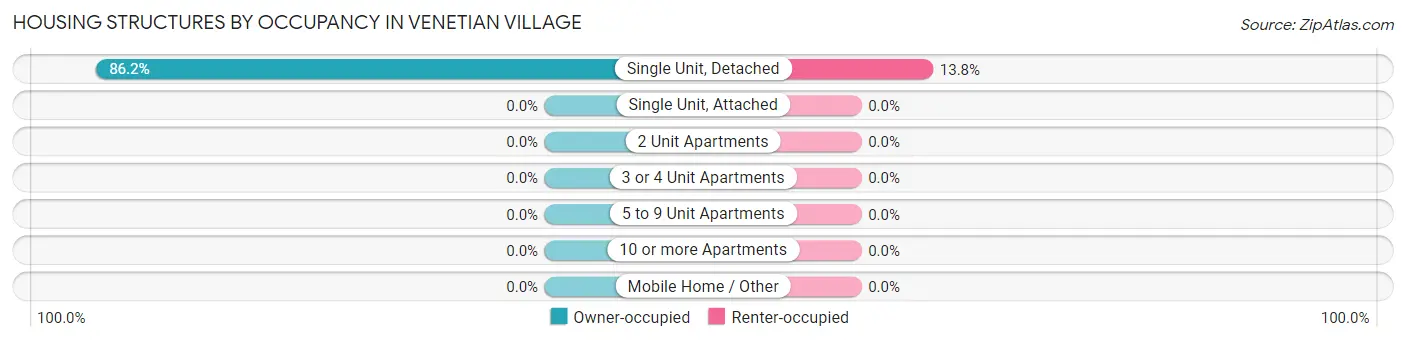
| Structure Type | Owner-occupied | Renter-occupied |
| Single Unit, Detached | 862 (86.2%) | 138 (13.8%) |
| Single Unit, Attached | 0 (0.0%) | 0 (0.0%) |
| 2 Unit Apartments | 0 (0.0%) | 0 (0.0%) |
| 3 or 4 Unit Apartments | 0 (0.0%) | 0 (0.0%) |
| 5 to 9 Unit Apartments | 0 (0.0%) | 0 (0.0%) |
| 10 or more Apartments | 0 (0.0%) | 0 (0.0%) |
| Mobile Home / Other | 0 (0.0%) | 0 (0.0%) |
| Total | 862 (86.2%) | 138 (13.8%) |
Housing Structures by Number of Rooms in Venetian Village
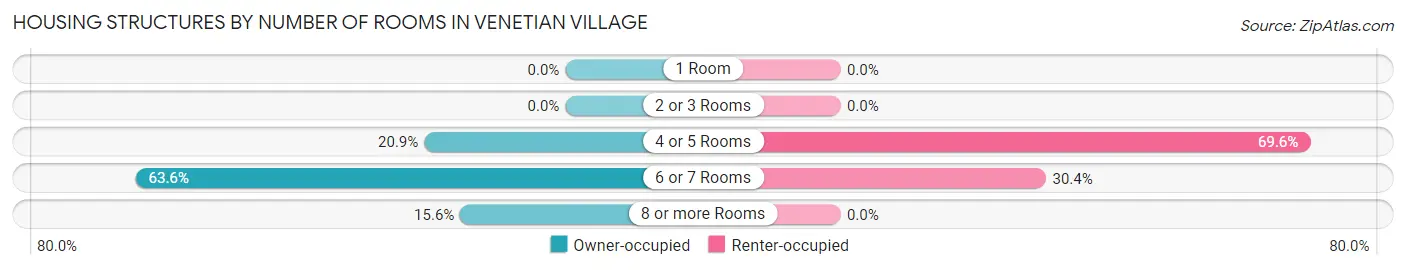
| Number of Rooms | Owner-occupied | Renter-occupied |
| 1 Room | 0 (0.0%) | 0 (0.0%) |
| 2 or 3 Rooms | 0 (0.0%) | 0 (0.0%) |
| 4 or 5 Rooms | 180 (20.9%) | 96 (69.6%) |
| 6 or 7 Rooms | 548 (63.6%) | 42 (30.4%) |
| 8 or more Rooms | 134 (15.5%) | 0 (0.0%) |
| Total | 862 (100.0%) | 138 (100.0%) |
Housing Structure by Heating Type in Venetian Village
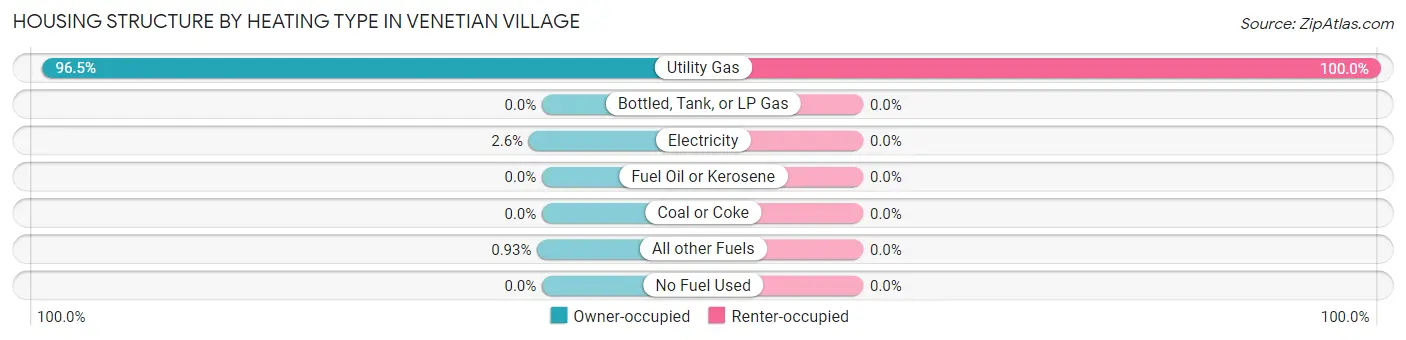
| Heating Type | Owner-occupied | Renter-occupied |
| Utility Gas | 832 (96.5%) | 138 (100.0%) |
| Bottled, Tank, or LP Gas | 0 (0.0%) | 0 (0.0%) |
| Electricity | 22 (2.5%) | 0 (0.0%) |
| Fuel Oil or Kerosene | 0 (0.0%) | 0 (0.0%) |
| Coal or Coke | 0 (0.0%) | 0 (0.0%) |
| All other Fuels | 8 (0.9%) | 0 (0.0%) |
| No Fuel Used | 0 (0.0%) | 0 (0.0%) |
| Total | 862 (100.0%) | 138 (100.0%) |
Household Vehicle Usage in Venetian Village
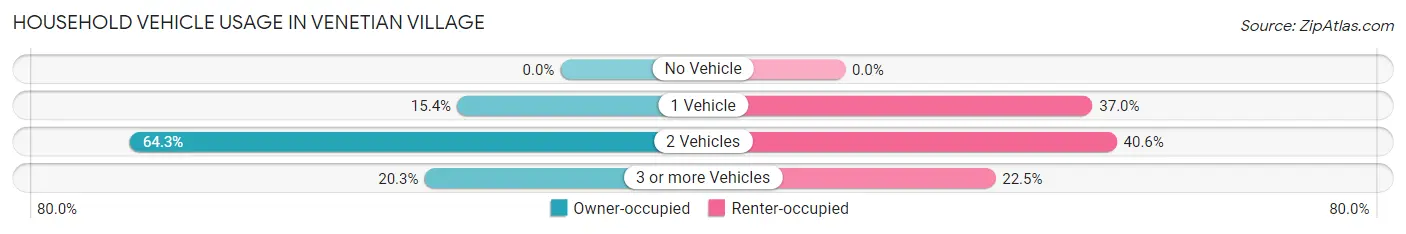
| Vehicles per Household | Owner-occupied | Renter-occupied |
| No Vehicle | 0 (0.0%) | 0 (0.0%) |
| 1 Vehicle | 133 (15.4%) | 51 (37.0%) |
| 2 Vehicles | 554 (64.3%) | 56 (40.6%) |
| 3 or more Vehicles | 175 (20.3%) | 31 (22.5%) |
| Total | 862 (100.0%) | 138 (100.0%) |
Real Estate & Mortgages in Venetian Village
Real Estate and Mortgage Overview in Venetian Village
| Characteristic | Without Mortgage | With Mortgage |
| Housing Units | 184 | 678 |
| Median Property Value | $205,700 | $203,100 |
| Median Household Income | $74,167 | $113 |
| Monthly Housing Costs | $633 | $0 |
| Real Estate Taxes | $4,717 | $0 |
Property Value by Mortgage Status in Venetian Village
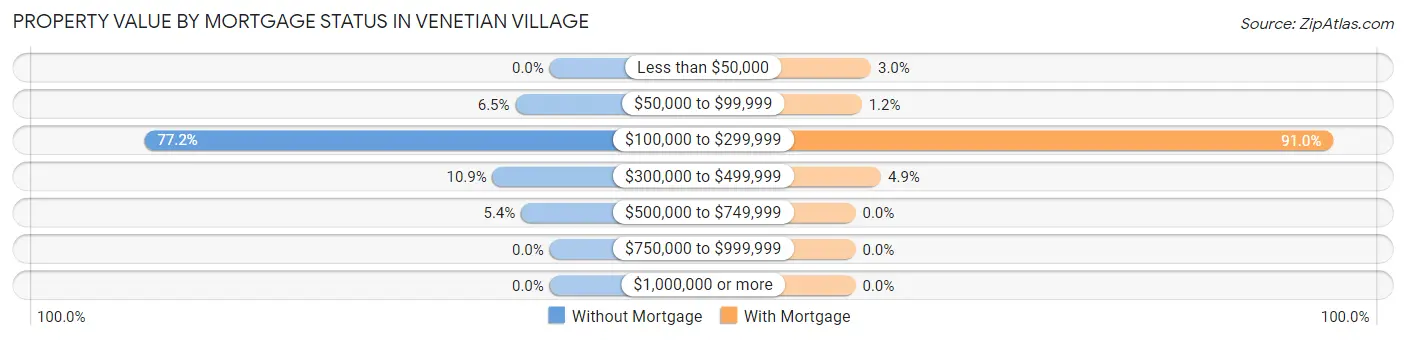
| Property Value | Without Mortgage | With Mortgage |
| Less than $50,000 | 0 (0.0%) | 20 (2.9%) |
| $50,000 to $99,999 | 12 (6.5%) | 8 (1.2%) |
| $100,000 to $299,999 | 142 (77.2%) | 617 (91.0%) |
| $300,000 to $499,999 | 20 (10.9%) | 33 (4.9%) |
| $500,000 to $749,999 | 10 (5.4%) | 0 (0.0%) |
| $750,000 to $999,999 | 0 (0.0%) | 0 (0.0%) |
| $1,000,000 or more | 0 (0.0%) | 0 (0.0%) |
| Total | 184 (100.0%) | 678 (100.0%) |
Household Income by Mortgage Status in Venetian Village
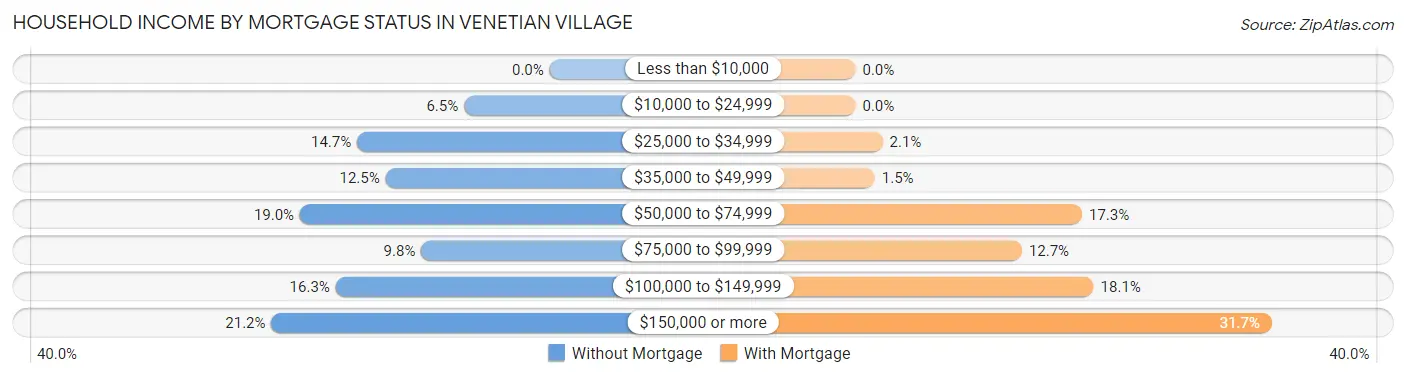
| Household Income | Without Mortgage | With Mortgage |
| Less than $10,000 | 0 (0.0%) | 0 (0.0%) |
| $10,000 to $24,999 | 12 (6.5%) | 0 (0.0%) |
| $25,000 to $34,999 | 27 (14.7%) | 14 (2.1%) |
| $35,000 to $49,999 | 23 (12.5%) | 10 (1.5%) |
| $50,000 to $74,999 | 35 (19.0%) | 117 (17.3%) |
| $75,000 to $99,999 | 18 (9.8%) | 86 (12.7%) |
| $100,000 to $149,999 | 30 (16.3%) | 123 (18.1%) |
| $150,000 or more | 39 (21.2%) | 215 (31.7%) |
| Total | 184 (100.0%) | 678 (100.0%) |
Property Value to Household Income Ratio in Venetian Village
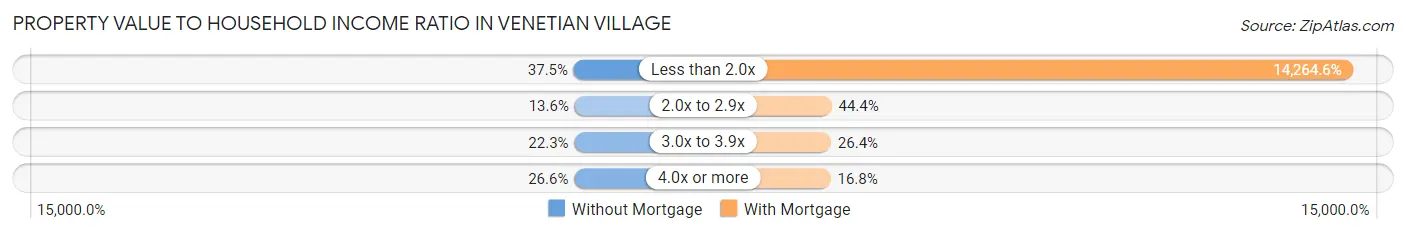
| Value-to-Income Ratio | Without Mortgage | With Mortgage |
| Less than 2.0x | 69 (37.5%) | 96,714 (14,264.6%) |
| 2.0x to 2.9x | 25 (13.6%) | 301 (44.4%) |
| 3.0x to 3.9x | 41 (22.3%) | 179 (26.4%) |
| 4.0x or more | 49 (26.6%) | 114 (16.8%) |
| Total | 184 (100.0%) | 678 (100.0%) |
Real Estate Taxes by Mortgage Status in Venetian Village
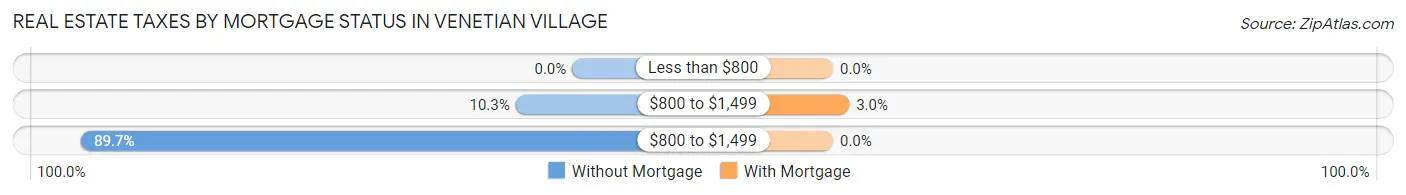
| Property Taxes | Without Mortgage | With Mortgage |
| Less than $800 | 0 (0.0%) | 0 (0.0%) |
| $800 to $1,499 | 19 (10.3%) | 20 (2.9%) |
| $800 to $1,499 | 165 (89.7%) | 0 (0.0%) |
| Total | 184 (100.0%) | 678 (100.0%) |
Health & Disability in Venetian Village
Health Insurance Coverage by Age in Venetian Village
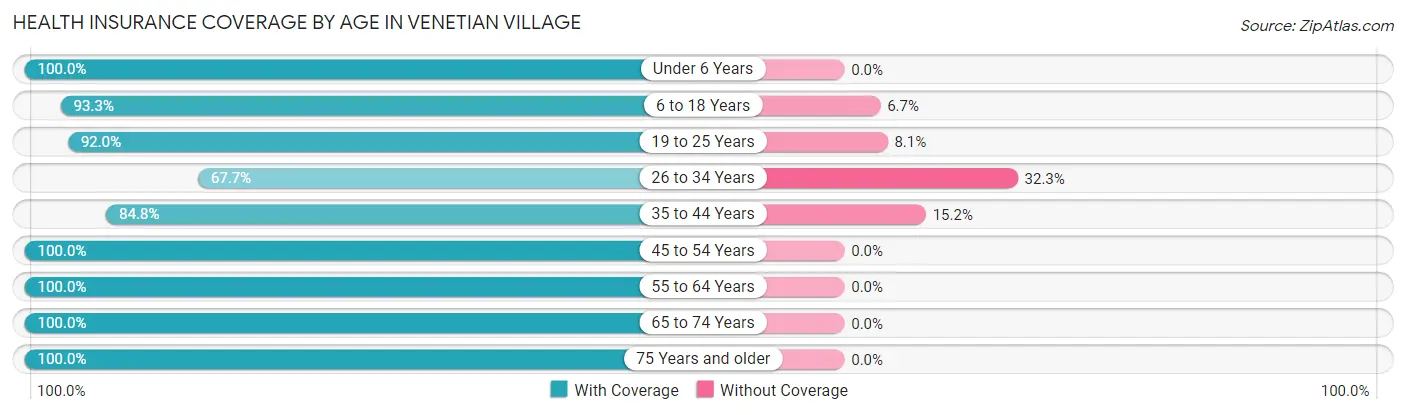
| Age Bracket | With Coverage | Without Coverage |
| Under 6 Years | 180 (100.0%) | 0 (0.0%) |
| 6 to 18 Years | 487 (93.3%) | 35 (6.7%) |
| 19 to 25 Years | 137 (91.9%) | 12 (8.1%) |
| 26 to 34 Years | 266 (67.7%) | 127 (32.3%) |
| 35 to 44 Years | 229 (84.8%) | 41 (15.2%) |
| 45 to 54 Years | 308 (100.0%) | 0 (0.0%) |
| 55 to 64 Years | 440 (100.0%) | 0 (0.0%) |
| 65 to 74 Years | 258 (100.0%) | 0 (0.0%) |
| 75 Years and older | 203 (100.0%) | 0 (0.0%) |
| Total | 2,508 (92.1%) | 215 (7.9%) |
Health Insurance Coverage by Citizenship Status in Venetian Village
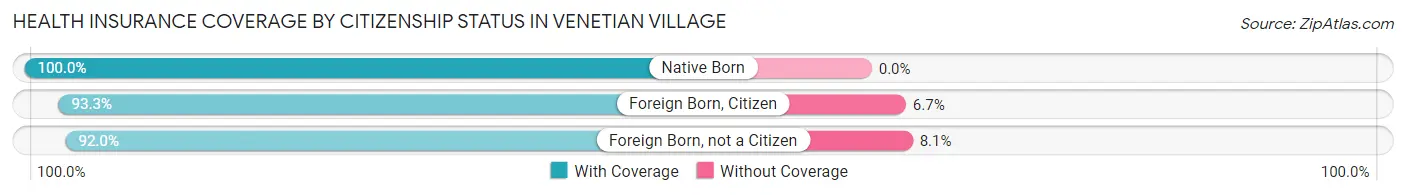
| Citizenship Status | With Coverage | Without Coverage |
| Native Born | 180 (100.0%) | 0 (0.0%) |
| Foreign Born, Citizen | 487 (93.3%) | 35 (6.7%) |
| Foreign Born, not a Citizen | 137 (91.9%) | 12 (8.1%) |
Health Insurance Coverage by Household Income in Venetian Village
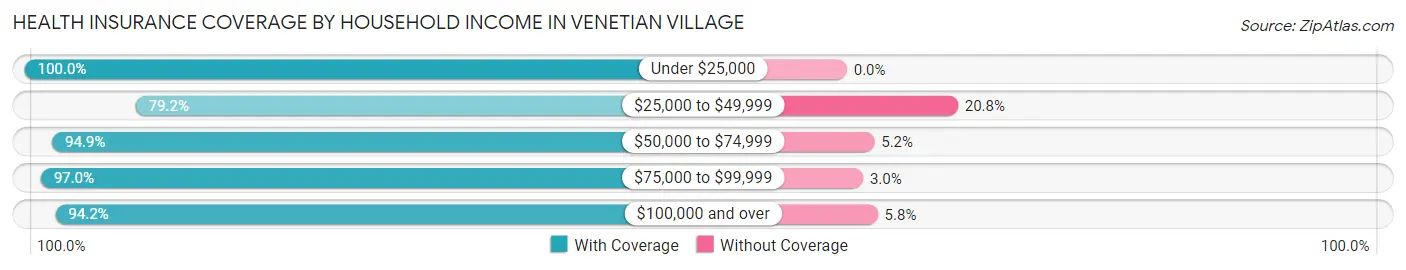
| Household Income | With Coverage | Without Coverage |
| Under $25,000 | 59 (100.0%) | 0 (0.0%) |
| $25,000 to $49,999 | 400 (79.2%) | 105 (20.8%) |
| $50,000 to $74,999 | 460 (94.9%) | 25 (5.1%) |
| $75,000 to $99,999 | 416 (97.0%) | 13 (3.0%) |
| $100,000 and over | 1,173 (94.2%) | 72 (5.8%) |
Public vs Private Health Insurance Coverage by Age in Venetian Village
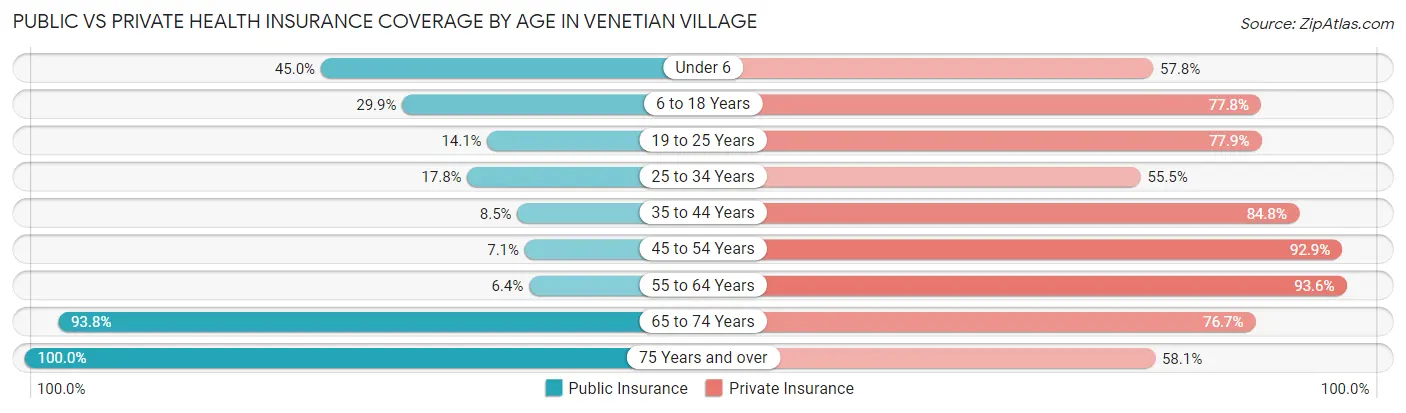
| Age Bracket | Public Insurance | Private Insurance |
| Under 6 | 81 (45.0%) | 104 (57.8%) |
| 6 to 18 Years | 156 (29.9%) | 406 (77.8%) |
| 19 to 25 Years | 21 (14.1%) | 116 (77.8%) |
| 25 to 34 Years | 70 (17.8%) | 218 (55.5%) |
| 35 to 44 Years | 23 (8.5%) | 229 (84.8%) |
| 45 to 54 Years | 22 (7.1%) | 286 (92.9%) |
| 55 to 64 Years | 28 (6.4%) | 412 (93.6%) |
| 65 to 74 Years | 242 (93.8%) | 198 (76.7%) |
| 75 Years and over | 203 (100.0%) | 118 (58.1%) |
| Total | 846 (31.1%) | 2,087 (76.6%) |
Disability Status by Sex by Age in Venetian Village
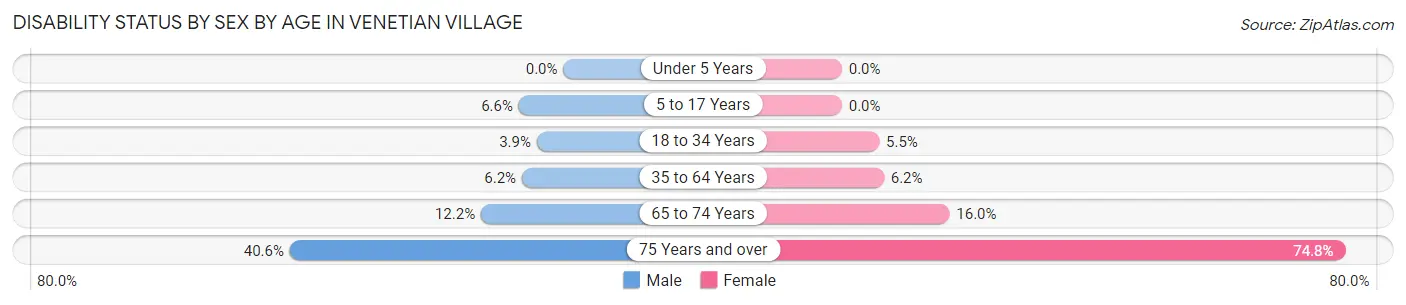
| Age Bracket | Male | Female |
| Under 5 Years | 0 (0.0%) | 0 (0.0%) |
| 5 to 17 Years | 15 (6.6%) | 0 (0.0%) |
| 18 to 34 Years | 11 (3.9%) | 18 (5.5%) |
| 35 to 64 Years | 31 (6.1%) | 32 (6.2%) |
| 65 to 74 Years | 17 (12.2%) | 19 (16.0%) |
| 75 Years and over | 39 (40.6%) | 80 (74.8%) |
Disability Class by Sex by Age in Venetian Village
Disability Class: Hearing Difficulty
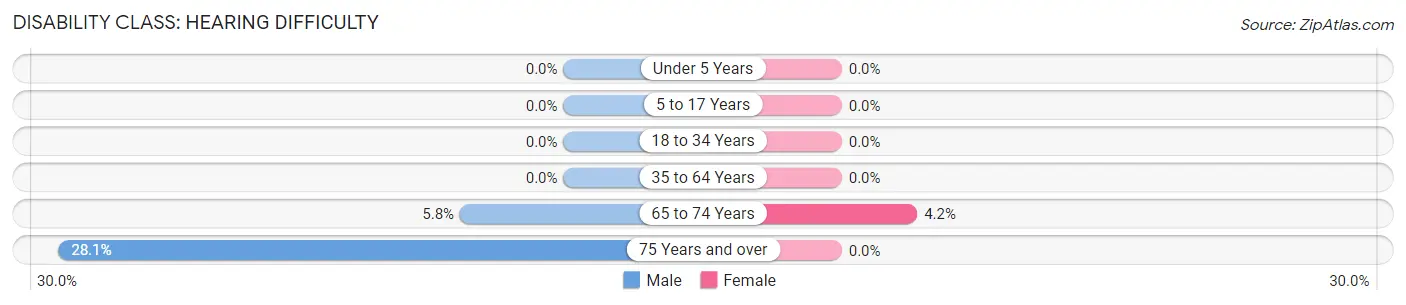
| Age Bracket | Male | Female |
| Under 5 Years | 0 (0.0%) | 0 (0.0%) |
| 5 to 17 Years | 0 (0.0%) | 0 (0.0%) |
| 18 to 34 Years | 0 (0.0%) | 0 (0.0%) |
| 35 to 64 Years | 0 (0.0%) | 0 (0.0%) |
| 65 to 74 Years | 8 (5.8%) | 5 (4.2%) |
| 75 Years and over | 27 (28.1%) | 0 (0.0%) |
Disability Class: Vision Difficulty
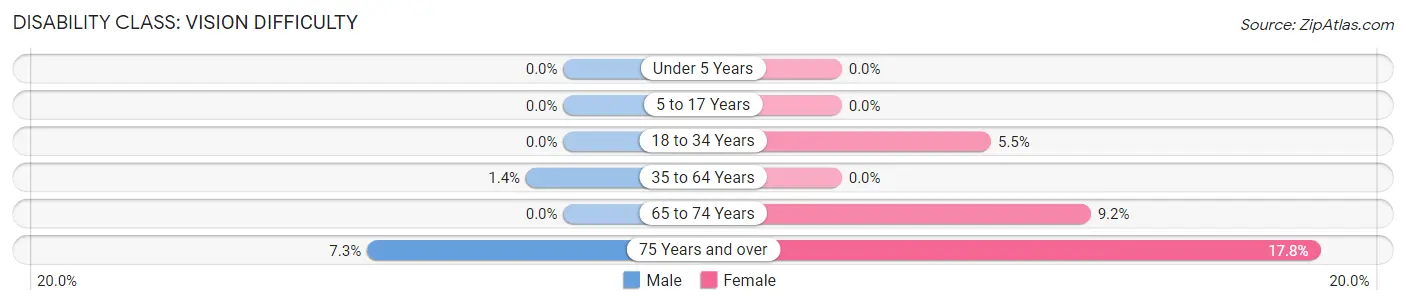
| Age Bracket | Male | Female |
| Under 5 Years | 0 (0.0%) | 0 (0.0%) |
| 5 to 17 Years | 0 (0.0%) | 0 (0.0%) |
| 18 to 34 Years | 0 (0.0%) | 18 (5.5%) |
| 35 to 64 Years | 7 (1.4%) | 0 (0.0%) |
| 65 to 74 Years | 0 (0.0%) | 11 (9.2%) |
| 75 Years and over | 7 (7.3%) | 19 (17.8%) |
Disability Class: Cognitive Difficulty
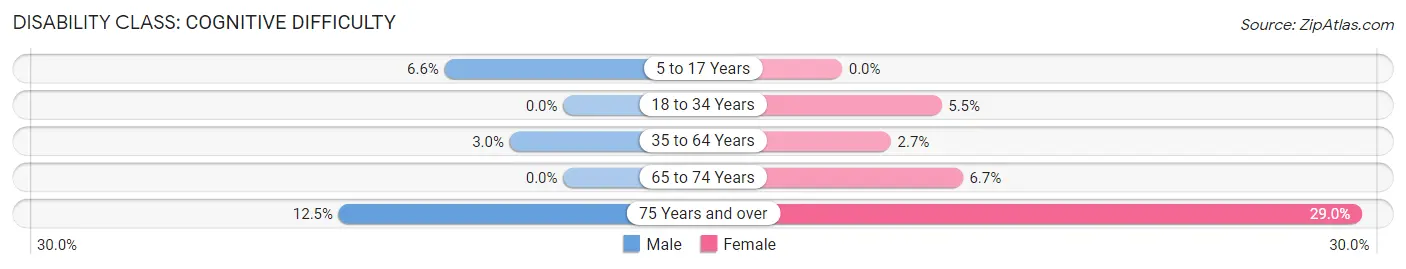
| Age Bracket | Male | Female |
| 5 to 17 Years | 15 (6.6%) | 0 (0.0%) |
| 18 to 34 Years | 0 (0.0%) | 18 (5.5%) |
| 35 to 64 Years | 15 (3.0%) | 14 (2.7%) |
| 65 to 74 Years | 0 (0.0%) | 8 (6.7%) |
| 75 Years and over | 12 (12.5%) | 31 (29.0%) |
Disability Class: Ambulatory Difficulty
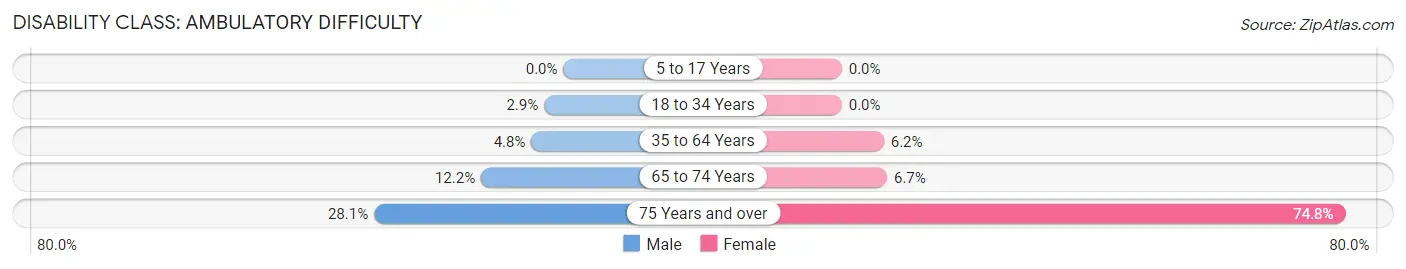
| Age Bracket | Male | Female |
| 5 to 17 Years | 0 (0.0%) | 0 (0.0%) |
| 18 to 34 Years | 8 (2.9%) | 0 (0.0%) |
| 35 to 64 Years | 24 (4.8%) | 32 (6.2%) |
| 65 to 74 Years | 17 (12.2%) | 8 (6.7%) |
| 75 Years and over | 27 (28.1%) | 80 (74.8%) |
Disability Class: Self-Care Difficulty
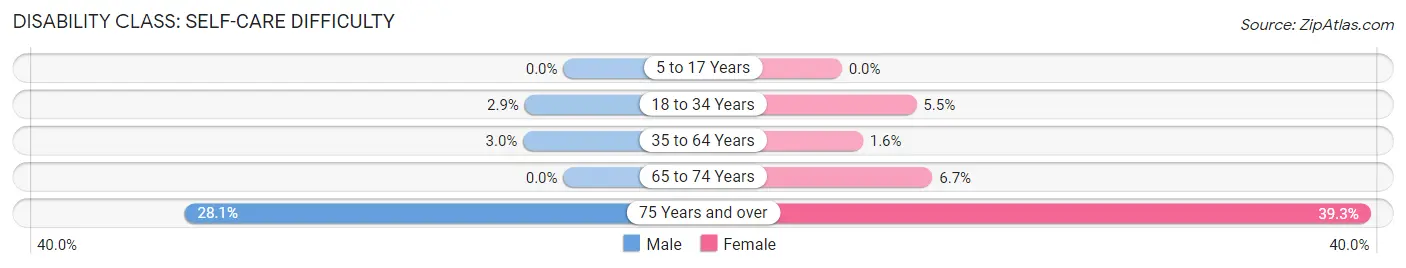
| Age Bracket | Male | Female |
| 5 to 17 Years | 0 (0.0%) | 0 (0.0%) |
| 18 to 34 Years | 8 (2.9%) | 18 (5.5%) |
| 35 to 64 Years | 15 (3.0%) | 8 (1.6%) |
| 65 to 74 Years | 0 (0.0%) | 8 (6.7%) |
| 75 Years and over | 27 (28.1%) | 42 (39.3%) |
Technology Access in Venetian Village
Computing Device Access in Venetian Village
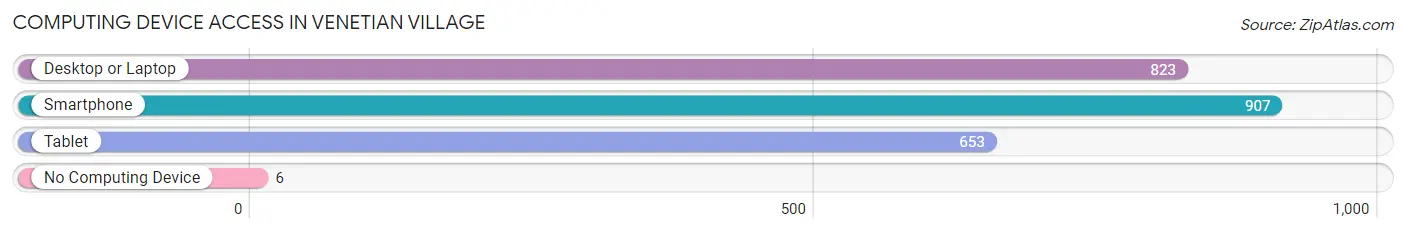
| Device Type | # Households | % Households |
| Desktop or Laptop | 823 | 82.3% |
| Smartphone | 907 | 90.7% |
| Tablet | 653 | 65.3% |
| No Computing Device | 6 | 0.6% |
| Total | 1,000 | 100.0% |
Internet Access in Venetian Village
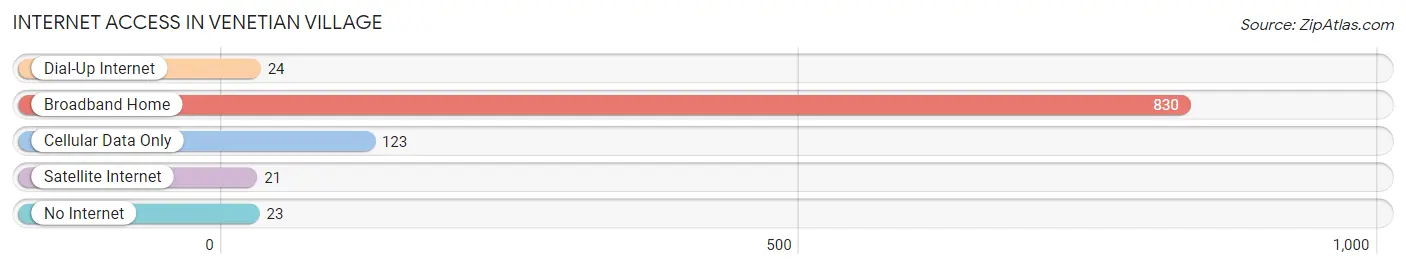
| Internet Type | # Households | % Households |
| Dial-Up Internet | 24 | 2.4% |
| Broadband Home | 830 | 83.0% |
| Cellular Data Only | 123 | 12.3% |
| Satellite Internet | 21 | 2.1% |
| No Internet | 23 | 2.3% |
| Total | 1,000 | 100.0% |
Venetian Village Summary
Venetian Village is a small village located in Lake County, Illinois, United States. It is situated on the western shore of Lake Michigan, about 40 miles north of Chicago. The village has a population of approximately 1,000 people and covers an area of 0.6 square miles.
History
The area that is now Venetian Village was first settled in the early 1800s by a group of German immigrants. The village was originally known as “Venetian” and was named after the Venetian Republic, which was a major trading power in the Mediterranean during the Middle Ages. The village was officially incorporated in 1891 and was later renamed Venetian Village in 1921.
The village was a popular summer destination for wealthy Chicagoans in the early 20th century. Many of the original homes in the village were built in the late 1800s and early 1900s and are still standing today. The village also has a number of historic sites, including the Venetian Village Hall, which was built in 1891 and is listed on the National Register of Historic Places.
Geography
Venetian Village is located on the western shore of Lake Michigan, about 40 miles north of Chicago. The village is situated on a small peninsula that juts out into the lake. The village is surrounded by the lake on three sides and is bordered by the towns of Winthrop Harbor and Zion to the north and south, respectively.
The village has a total area of 0.6 square miles, all of which is land. The terrain is mostly flat and the village is located at an elevation of 645 feet above sea level. The climate in Venetian Village is classified as humid continental, with hot summers and cold winters.
Economy
The economy of Venetian Village is largely based on tourism and recreation. The village is a popular summer destination for tourists from Chicago and other nearby cities. The village also has a number of small businesses, including restaurants, shops, and other services.
The village also has a number of marinas and boat docks, which attract visitors from all over the region. The village is also home to a number of small manufacturing companies, which produce a variety of products, including furniture, clothing, and electronics.
Demographics
As of the 2010 census, the population of Venetian Village was 1,000 people. The racial makeup of the village was 97.2% White, 0.7% African American, 0.3% Native American, 0.3% Asian, and 1.5% from other races. The median household income in the village was $50,000, and the median age was 44 years.
The village is served by the Zion-Benton Township High School District, which includes two high schools, Zion-Benton Township High School and Zion-Benton Township Alternative High School. The village is also home to a number of churches, including the Venetian Village United Methodist Church and the Venetian Village Baptist Church.
Common Questions
What is Per Capita Income in Venetian Village?
Per Capita income in Venetian Village is $36,434.
What is the Median Family Income in Venetian Village?
Median Family Income in Venetian Village is $86,250.
What is the Median Household income in Venetian Village?
Median Household Income in Venetian Village is $92,500.
What is Income or Wage Gap in Venetian Village?
Income or Wage Gap in Venetian Village is 44.0%.
Women in Venetian Village earn 56.0 cents for every dollar earned by a man.
What is Inequality or Gini Index in Venetian Village?
Inequality or Gini Index in Venetian Village is 0.32.
What is the Total Population of Venetian Village?
Total Population of Venetian Village is 2,723.
What is the Total Male Population of Venetian Village?
Total Male Population of Venetian Village is 1,318.
What is the Total Female Population of Venetian Village?
Total Female Population of Venetian Village is 1,405.
What is the Ratio of Males per 100 Females in Venetian Village?
There are 93.81 Males per 100 Females in Venetian Village.
What is the Ratio of Females per 100 Males in Venetian Village?
There are 106.60 Females per 100 Males in Venetian Village.
What is the Median Population Age in Venetian Village?
Median Population Age in Venetian Village is 38.3 Years.
What is the Average Family Size in Venetian Village
Average Family Size in Venetian Village is 3.1 People.
What is the Average Household Size in Venetian Village
Average Household Size in Venetian Village is 2.7 People.
How Large is the Labor Force in Venetian Village?
There are 1,434 People in the Labor Forcein in Venetian Village.
What is the Percentage of People in the Labor Force in Venetian Village?
68.3% of People are in the Labor Force in Venetian Village.
What is the Unemployment Rate in Venetian Village?
Unemployment Rate in Venetian Village is 3.2%.