Zip Codes with the Highest Percentage of Population Employed in Administrative & Support Services in Quincy, IL
RELATED REPORTS & OPTIONS
Administrative & Support Services
Quincy
Compare Zip Codes
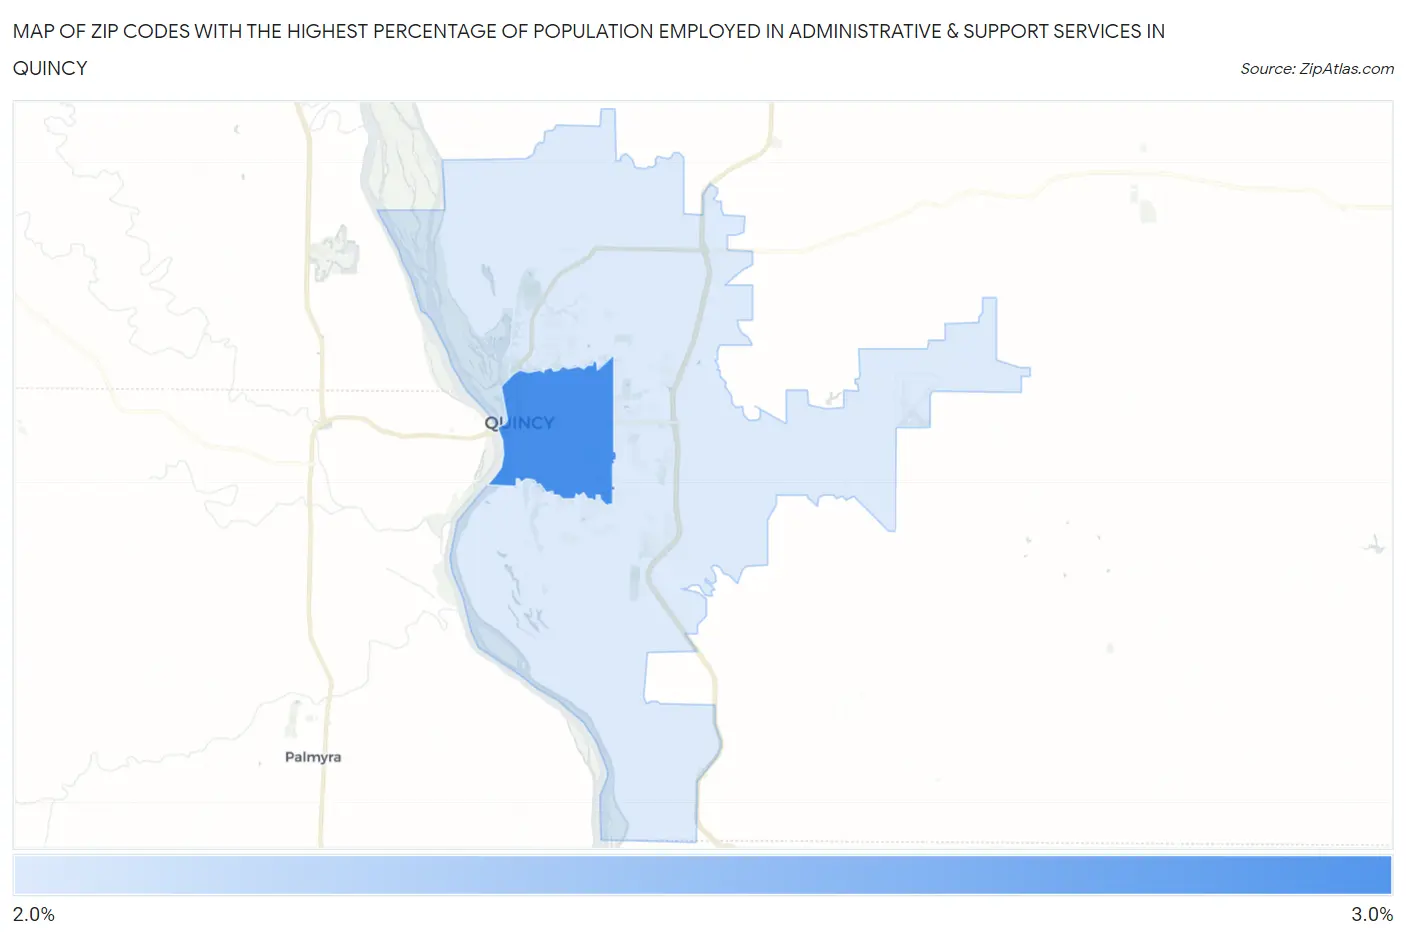
Map of Zip Codes with the Highest Percentage of Population Employed in Administrative & Support Services in Quincy
2.1%
2.5%
Zip Codes with the Highest Percentage of Population Employed in Administrative & Support Services in Quincy, IL
| Zip Code | % Employed | vs State | vs National | |
| 1. | 62301 | 2.5% | 4.0%(-1.50)#736 | 4.1%(-1.63)#18,043 |
| 2. | 62305 | 2.1% | 4.0%(-1.95)#858 | 4.1%(-2.08)#20,303 |
1
Common Questions
What are the Top Zip Codes with the Highest Percentage of Population Employed in Administrative & Support Services in Quincy, IL?
Top Zip Codes with the Highest Percentage of Population Employed in Administrative & Support Services in Quincy, IL are:
What zip code has the Highest Percentage of Population Employed in Administrative & Support Services in Quincy, IL?
62301 has the Highest Percentage of Population Employed in Administrative & Support Services in Quincy, IL with 2.5%.
What is the Percentage of Population Employed in Administrative & Support Services in Quincy, IL?
Percentage of Population Employed in Administrative & Support Services in Quincy is 2.2%.
What is the Percentage of Population Employed in Administrative & Support Services in Illinois?
Percentage of Population Employed in Administrative & Support Services in Illinois is 4.0%.
What is the Percentage of Population Employed in Administrative & Support Services in the United States?
Percentage of Population Employed in Administrative & Support Services in the United States is 4.1%.