Clear Lake, IL Map & Demographics
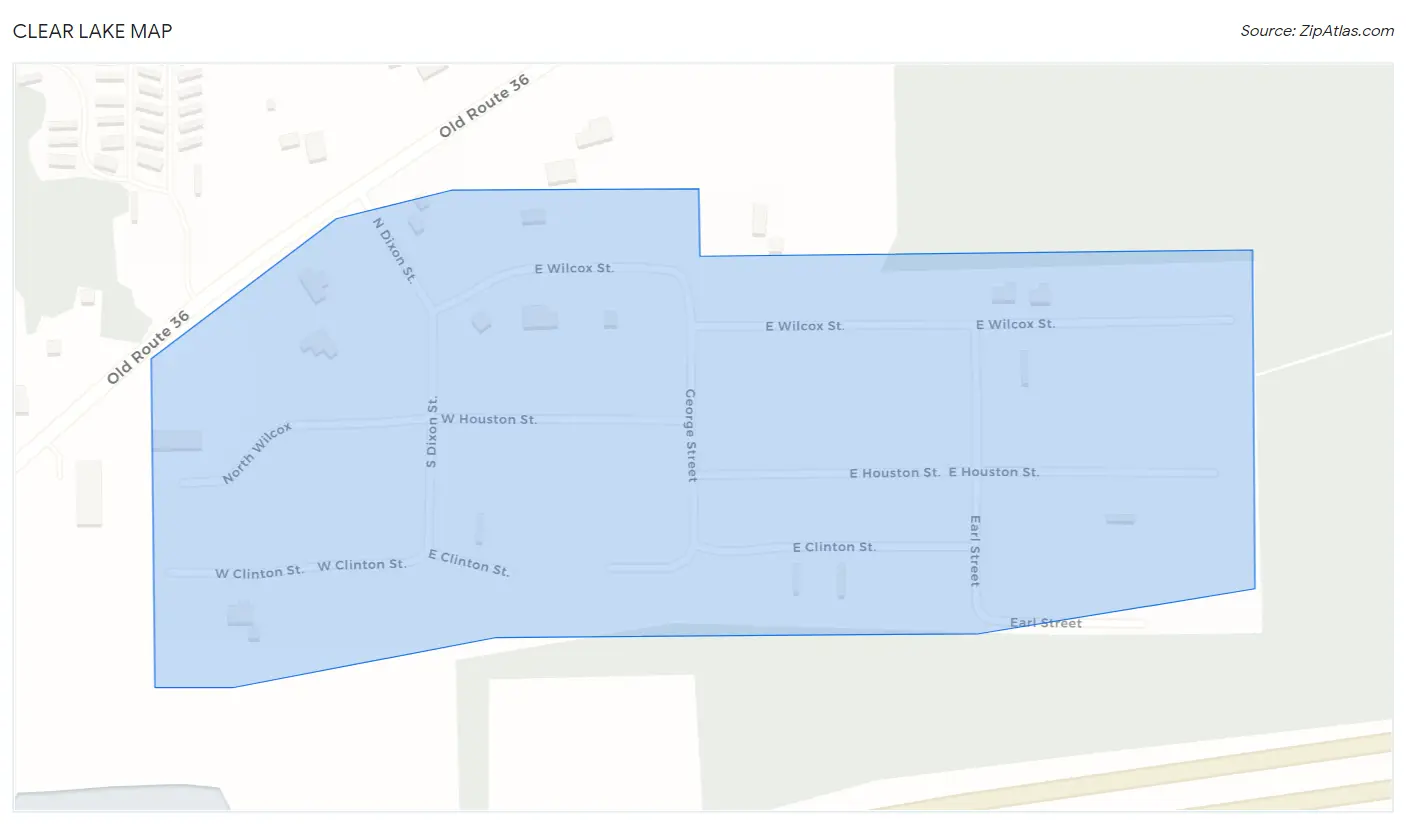
Clear Lake Map
Clear Lake Overview
$25,925
PER CAPITA INCOME
$68,125
AVG FAMILY INCOME
$55,625
AVG HOUSEHOLD INCOME
24.9%
WAGE / INCOME GAP [ % ]
75.1¢/ $1
WAGE / INCOME GAP [ $ ]
$13,814
FAMILY INCOME DEFICIT
0.39
INEQUALITY / GINI INDEX
316
TOTAL POPULATION
169
MALE POPULATION
147
FEMALE POPULATION
114.97
MALES / 100 FEMALES
86.98
FEMALES / 100 MALES
36.2
MEDIAN AGE
3.2
AVG FAMILY SIZE
2.2
AVG HOUSEHOLD SIZE
177
LABOR FORCE [ PEOPLE ]
68.3%
PERCENT IN LABOR FORCE
21.5%
UNEMPLOYMENT RATE
Clear Lake Area Codes
Income in Clear Lake
Income Overview in Clear Lake
Per Capita Income in Clear Lake is $25,925, while median incomes of families and households are $68,125 and $55,625 respectively.
| Characteristic | Number | Measure |
| Per Capita Income | 316 | $25,925 |
| Median Family Income | 68 | $68,125 |
| Mean Family Income | 68 | $64,568 |
| Median Household Income | 142 | $55,625 |
| Mean Household Income | 142 | $56,792 |
| Income Deficit | 68 | $13,814 |
| Wage / Income Gap (%) | 316 | 24.91% |
| Wage / Income Gap ($) | 316 | 75.09¢ per $1 |
| Gini / Inequality Index | 316 | 0.39 |
Earnings by Sex in Clear Lake
Average Earnings in Clear Lake are $37,308, $34,167 for men and $45,500 for women, a difference of 24.9%.
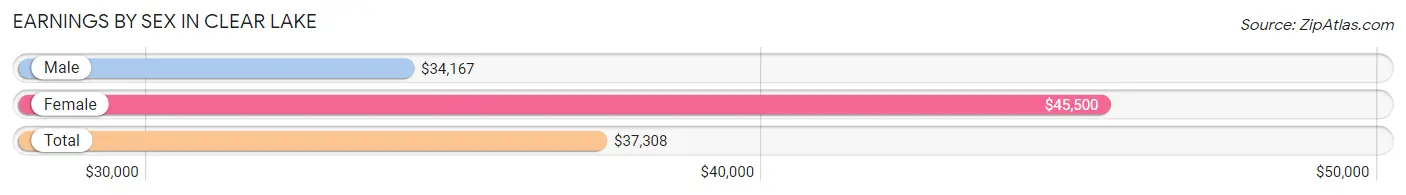
| Sex | Number | Average Earnings |
| Male | 78 (51.3%) | $34,167 |
| Female | 74 (48.7%) | $45,500 |
| Total | 152 (100.0%) | $37,308 |
Earnings by Sex by Income Bracket in Clear Lake
The most common earnings brackets in Clear Lake are $25,000 to $29,999 for men (27 | 34.6%) and $45,000 to $49,999 for women (21 | 28.4%).
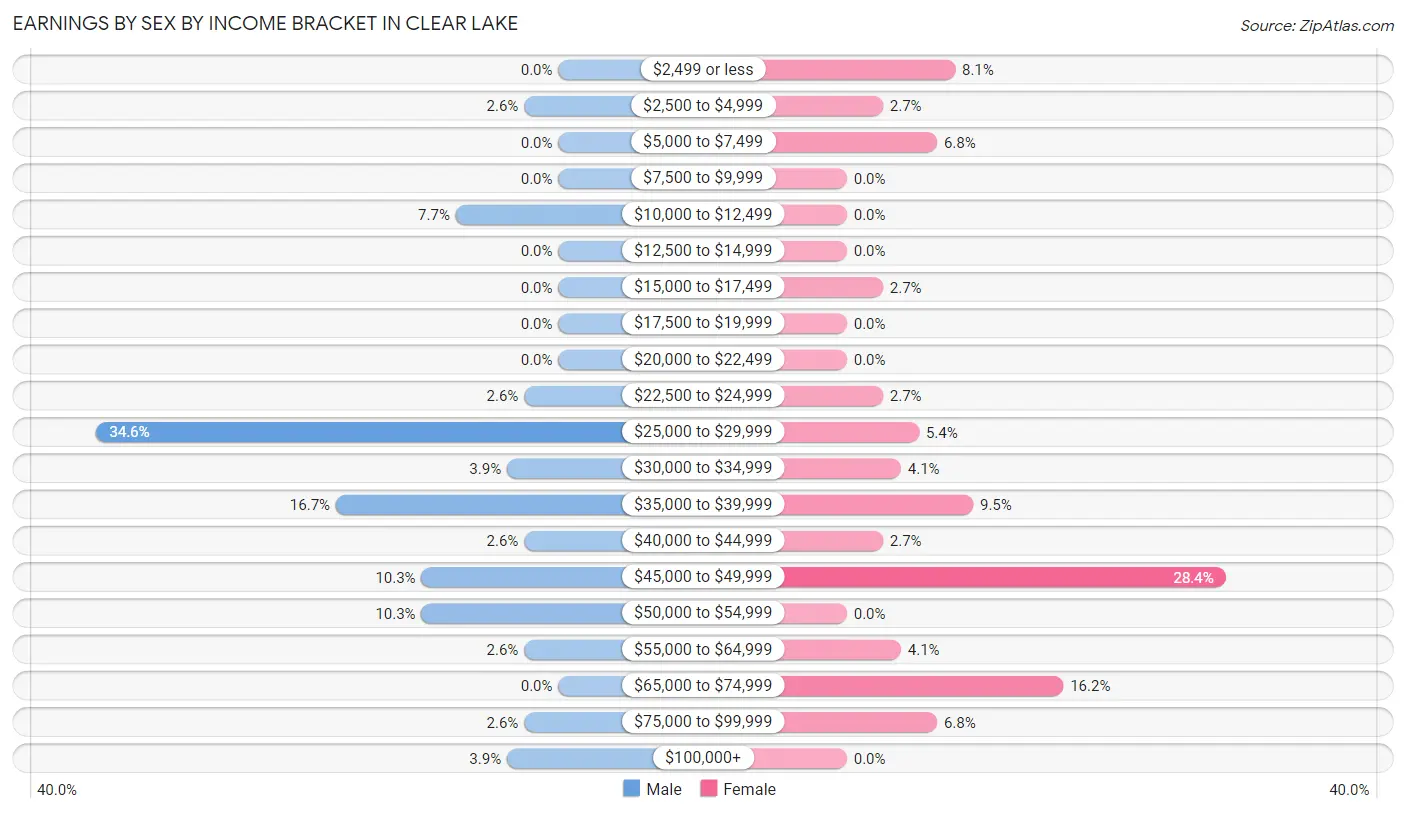
| Income | Male | Female |
| $2,499 or less | 0 (0.0%) | 6 (8.1%) |
| $2,500 to $4,999 | 2 (2.6%) | 2 (2.7%) |
| $5,000 to $7,499 | 0 (0.0%) | 5 (6.8%) |
| $7,500 to $9,999 | 0 (0.0%) | 0 (0.0%) |
| $10,000 to $12,499 | 6 (7.7%) | 0 (0.0%) |
| $12,500 to $14,999 | 0 (0.0%) | 0 (0.0%) |
| $15,000 to $17,499 | 0 (0.0%) | 2 (2.7%) |
| $17,500 to $19,999 | 0 (0.0%) | 0 (0.0%) |
| $20,000 to $22,499 | 0 (0.0%) | 0 (0.0%) |
| $22,500 to $24,999 | 2 (2.6%) | 2 (2.7%) |
| $25,000 to $29,999 | 27 (34.6%) | 4 (5.4%) |
| $30,000 to $34,999 | 3 (3.8%) | 3 (4.1%) |
| $35,000 to $39,999 | 13 (16.7%) | 7 (9.5%) |
| $40,000 to $44,999 | 2 (2.6%) | 2 (2.7%) |
| $45,000 to $49,999 | 8 (10.3%) | 21 (28.4%) |
| $50,000 to $54,999 | 8 (10.3%) | 0 (0.0%) |
| $55,000 to $64,999 | 2 (2.6%) | 3 (4.1%) |
| $65,000 to $74,999 | 0 (0.0%) | 12 (16.2%) |
| $75,000 to $99,999 | 2 (2.6%) | 5 (6.8%) |
| $100,000+ | 3 (3.8%) | 0 (0.0%) |
| Total | 78 (100.0%) | 74 (100.0%) |
Earnings by Sex by Educational Attainment in Clear Lake
Average earnings in Clear Lake are $37,500 for men and $45,500 for women, a difference of 17.6%. Men with an educational attainment of high school diploma enjoy the highest average annual earnings of $29,911, while those with high school diploma education earn the least with $29,911. Women with an educational attainment of college or associate's degree earn the most with the average annual earnings of $51,250, while those with high school diploma education have the smallest earnings of $33,333.
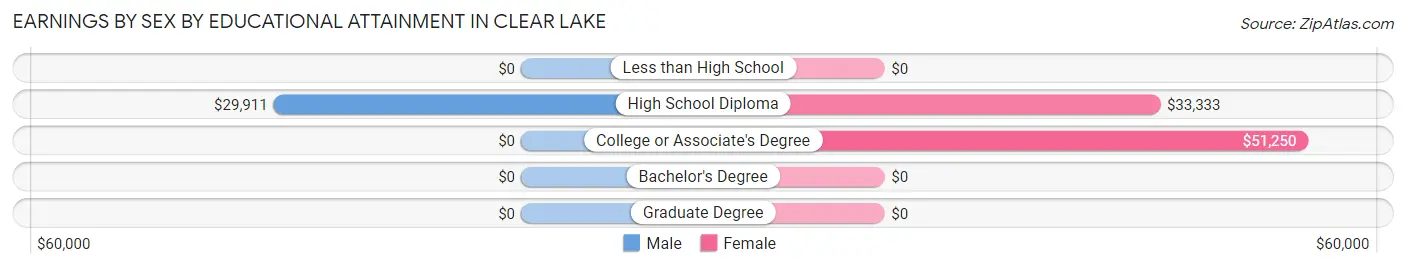
| Educational Attainment | Male Income | Female Income |
| Less than High School | - | - |
| High School Diploma | $29,911 | $33,333 |
| College or Associate's Degree | - | - |
| Bachelor's Degree | - | - |
| Graduate Degree | - | - |
| Total | $37,500 | $45,500 |
Family Income in Clear Lake
Family Income Brackets in Clear Lake
According to the Clear Lake family income data, there are 24 families falling into the $50,000 to $74,999 income range, which is the most common income bracket and makes up 35.3% of all families.
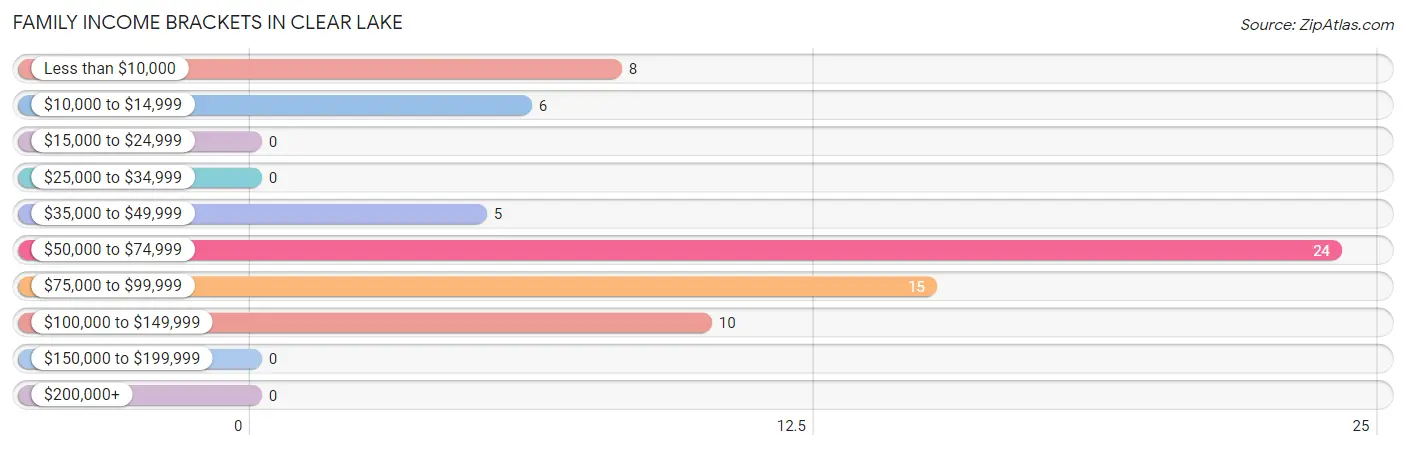
| Income Bracket | # Families | % Families |
| Less than $10,000 | 8 | 11.8% |
| $10,000 to $14,999 | 6 | 8.8% |
| $15,000 to $24,999 | 0 | 0.0% |
| $25,000 to $34,999 | 0 | 0.0% |
| $35,000 to $49,999 | 5 | 7.4% |
| $50,000 to $74,999 | 24 | 35.3% |
| $75,000 to $99,999 | 15 | 22.1% |
| $100,000 to $149,999 | 10 | 14.7% |
| $150,000 to $199,999 | 0 | 0.0% |
| $200,000+ | 0 | 0.0% |
Family Income by Famaliy Size in Clear Lake
4-person families (19 | 27.9%) account for the highest median family income in Clear Lake with $86,705 per family, while 2-person families (27 | 39.7%) have the highest median income of $34,219 per family member.
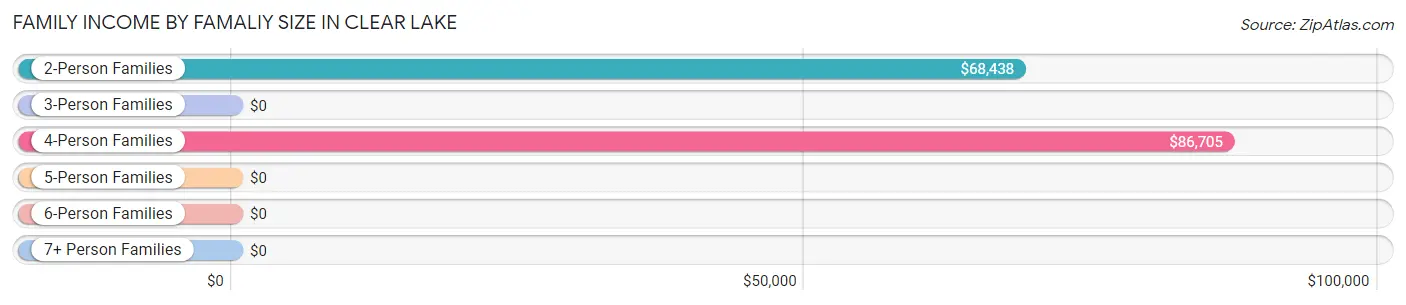
| Income Bracket | # Families | Median Income |
| 2-Person Families | 27 (39.7%) | $68,438 |
| 3-Person Families | 17 (25.0%) | $0 |
| 4-Person Families | 19 (27.9%) | $86,705 |
| 5-Person Families | 0 (0.0%) | $0 |
| 6-Person Families | 5 (7.3%) | $0 |
| 7+ Person Families | 0 (0.0%) | $0 |
| Total | 68 (100.0%) | $68,125 |
Family Income by Number of Earners in Clear Lake
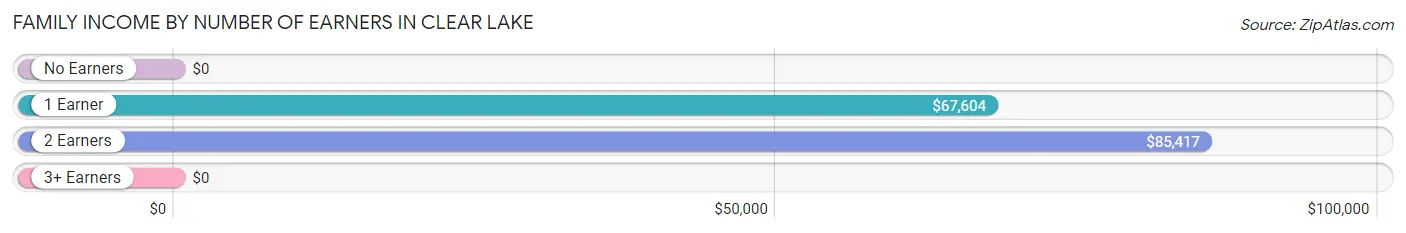
| Number of Earners | # Families | Median Income |
| No Earners | 10 (14.7%) | $0 |
| 1 Earner | 27 (39.7%) | $67,604 |
| 2 Earners | 23 (33.8%) | $85,417 |
| 3+ Earners | 8 (11.8%) | $0 |
| Total | 68 (100.0%) | $68,125 |
Household Income in Clear Lake
Household Income Brackets in Clear Lake
With 33 households falling in the category, the $50,000 to $74,999 income range is the most frequent in Clear Lake, accounting for 23.2% of all households.
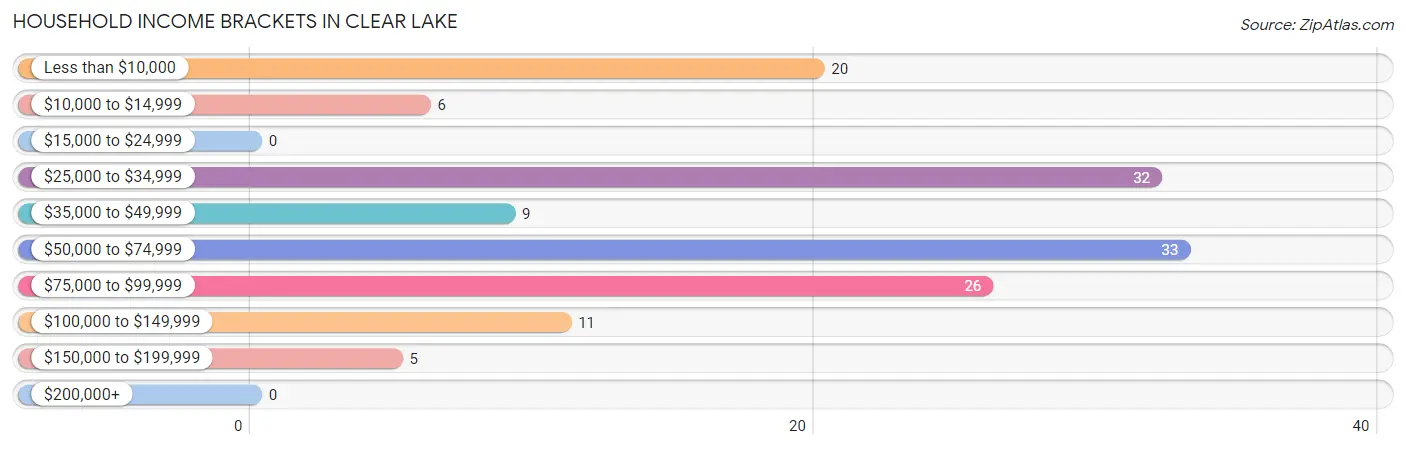
| Income Bracket | # Households | % Households |
| Less than $10,000 | 20 | 14.1% |
| $10,000 to $14,999 | 6 | 4.2% |
| $15,000 to $24,999 | 0 | 0.0% |
| $25,000 to $34,999 | 32 | 22.5% |
| $35,000 to $49,999 | 9 | 6.3% |
| $50,000 to $74,999 | 33 | 23.2% |
| $75,000 to $99,999 | 26 | 18.3% |
| $100,000 to $149,999 | 11 | 7.7% |
| $150,000 to $199,999 | 5 | 3.5% |
| $200,000+ | 0 | 0.0% |
Household Income by Householder Age in Clear Lake
The median household income in Clear Lake is $55,625, with the highest median household income of $68,958 found in the 25 to 44 years age bracket for the primary householder. A total of 52 households (36.6%) fall into this category.
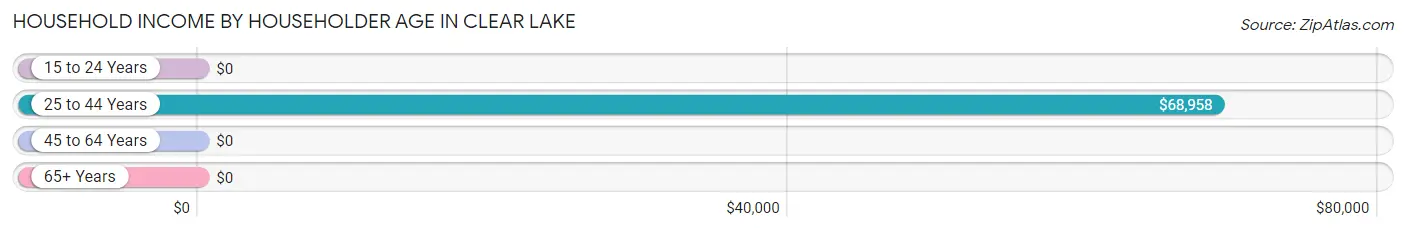
| Income Bracket | # Households | Median Income |
| 15 to 24 Years | 0 (0.0%) | $0 |
| 25 to 44 Years | 52 (36.6%) | $68,958 |
| 45 to 64 Years | 65 (45.8%) | $0 |
| 65+ Years | 25 (17.6%) | $0 |
| Total | 142 (100.0%) | $55,625 |
Poverty in Clear Lake
Income Below Poverty by Sex and Age in Clear Lake
With 21.3% poverty level for males and 12.2% for females among the residents of Clear Lake, 75 year old and over males and 75 year old and over females are the most vulnerable to poverty, with 5 males (62.5%) and 6 females (100.0%) in their respective age groups living below the poverty level.
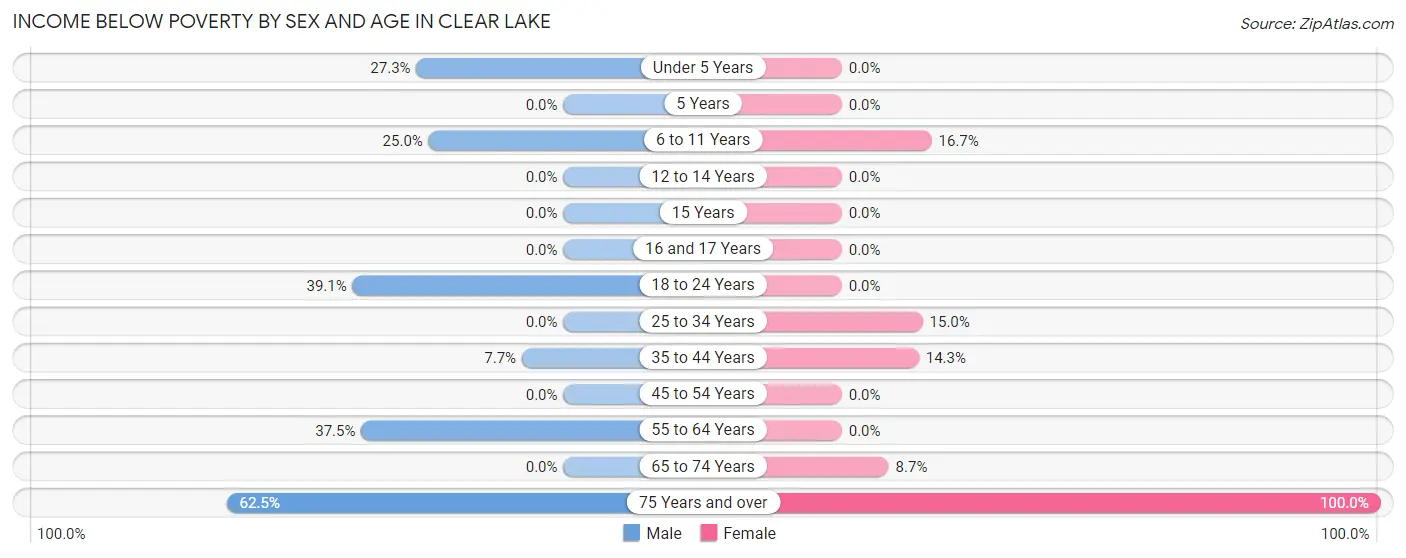
| Age Bracket | Male | Female |
| Under 5 Years | 6 (27.3%) | 0 (0.0%) |
| 5 Years | 0 (0.0%) | 0 (0.0%) |
| 6 to 11 Years | 2 (25.0%) | 2 (16.7%) |
| 12 to 14 Years | 0 (0.0%) | 0 (0.0%) |
| 15 Years | 0 (0.0%) | 0 (0.0%) |
| 16 and 17 Years | 0 (0.0%) | 0 (0.0%) |
| 18 to 24 Years | 9 (39.1%) | 0 (0.0%) |
| 25 to 34 Years | 0 (0.0%) | 6 (15.0%) |
| 35 to 44 Years | 2 (7.7%) | 2 (14.3%) |
| 45 to 54 Years | 0 (0.0%) | 0 (0.0%) |
| 55 to 64 Years | 12 (37.5%) | 0 (0.0%) |
| 65 to 74 Years | 0 (0.0%) | 2 (8.7%) |
| 75 Years and over | 5 (62.5%) | 6 (100.0%) |
| Total | 36 (21.3%) | 18 (12.2%) |
Income Above Poverty by Sex and Age in Clear Lake
According to the poverty statistics in Clear Lake, males aged 12 to 14 years and females aged under 5 years are the age groups that are most secure financially, with 100.0% of males and 100.0% of females in these age groups living above the poverty line.
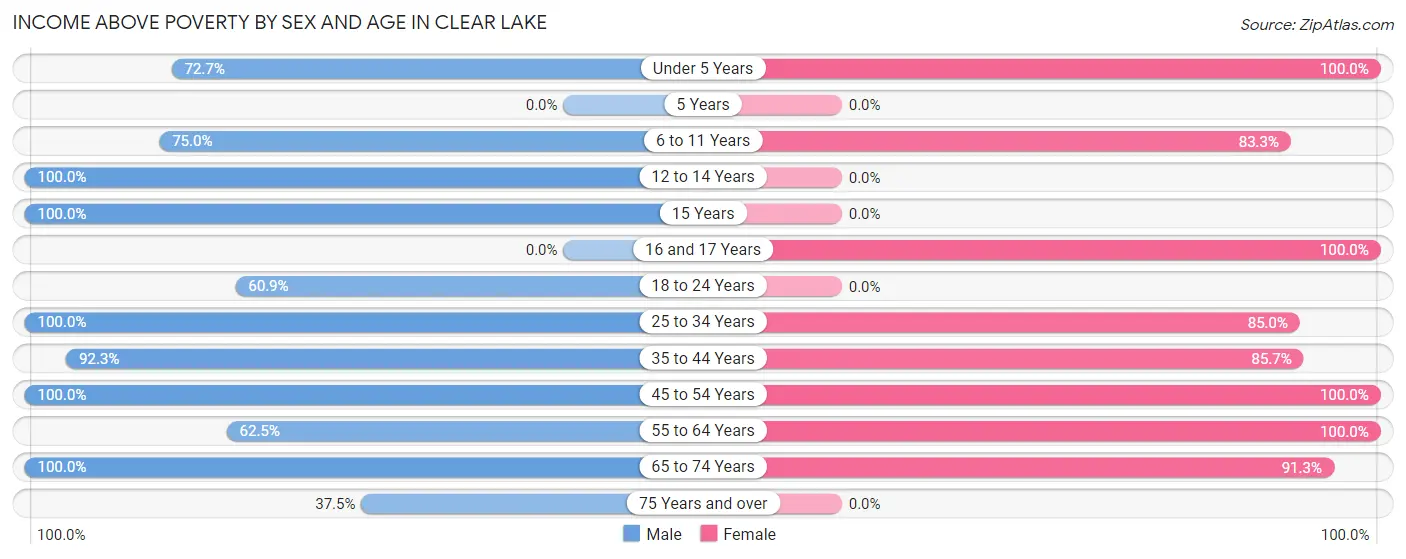
| Age Bracket | Male | Female |
| Under 5 Years | 16 (72.7%) | 1 (100.0%) |
| 5 Years | 0 (0.0%) | 0 (0.0%) |
| 6 to 11 Years | 6 (75.0%) | 10 (83.3%) |
| 12 to 14 Years | 10 (100.0%) | 0 (0.0%) |
| 15 Years | 4 (100.0%) | 0 (0.0%) |
| 16 and 17 Years | 0 (0.0%) | 3 (100.0%) |
| 18 to 24 Years | 14 (60.9%) | 0 (0.0%) |
| 25 to 34 Years | 28 (100.0%) | 34 (85.0%) |
| 35 to 44 Years | 24 (92.3%) | 12 (85.7%) |
| 45 to 54 Years | 4 (100.0%) | 10 (100.0%) |
| 55 to 64 Years | 20 (62.5%) | 38 (100.0%) |
| 65 to 74 Years | 4 (100.0%) | 21 (91.3%) |
| 75 Years and over | 3 (37.5%) | 0 (0.0%) |
| Total | 133 (78.7%) | 129 (87.8%) |
Income Below Poverty Among Married-Couple Families in Clear Lake
The poverty statistics for married-couple families in Clear Lake show that 23.0% or 14 of the total 61 families live below the poverty line. Families with 1 or 2 children have the highest poverty rate of 33.3%, comprising of 8 families. On the other hand, families with 3 or 4 children have the lowest poverty rate of 0.0%, which includes 0 families.
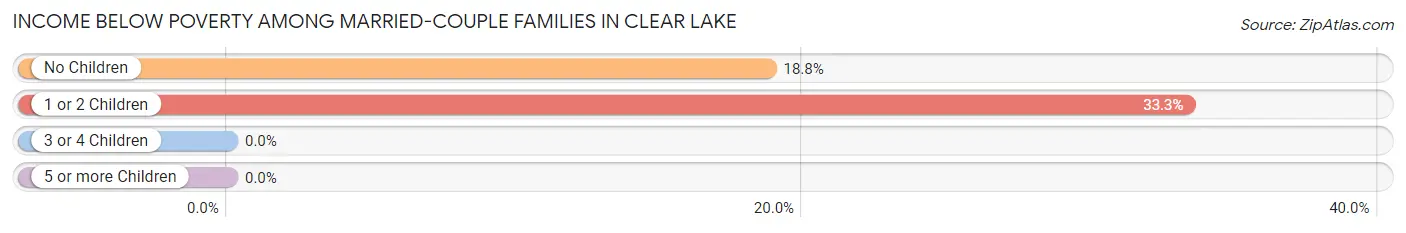
| Children | Above Poverty | Below Poverty |
| No Children | 26 (81.2%) | 6 (18.8%) |
| 1 or 2 Children | 16 (66.7%) | 8 (33.3%) |
| 3 or 4 Children | 5 (100.0%) | 0 (0.0%) |
| 5 or more Children | 0 (0.0%) | 0 (0.0%) |
| Total | 47 (77.0%) | 14 (23.0%) |
Income Below Poverty Among Single-Parent Households in Clear Lake
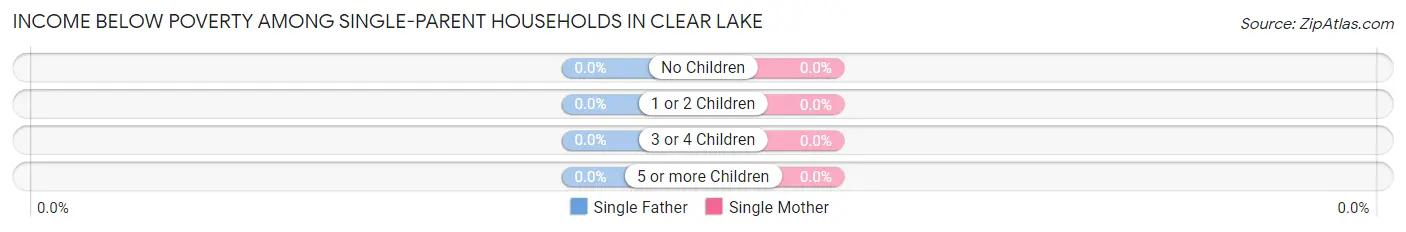
| Children | Single Father | Single Mother |
| No Children | 0 (0.0%) | 0 (0.0%) |
| 1 or 2 Children | 0 (0.0%) | 0 (0.0%) |
| 3 or 4 Children | 0 (0.0%) | 0 (0.0%) |
| 5 or more Children | 0 (0.0%) | 0 (0.0%) |
| Total | 0 (0.0%) | 0 (0.0%) |
Income Below Poverty Among Married-Couple vs Single-Parent Households in Clear Lake
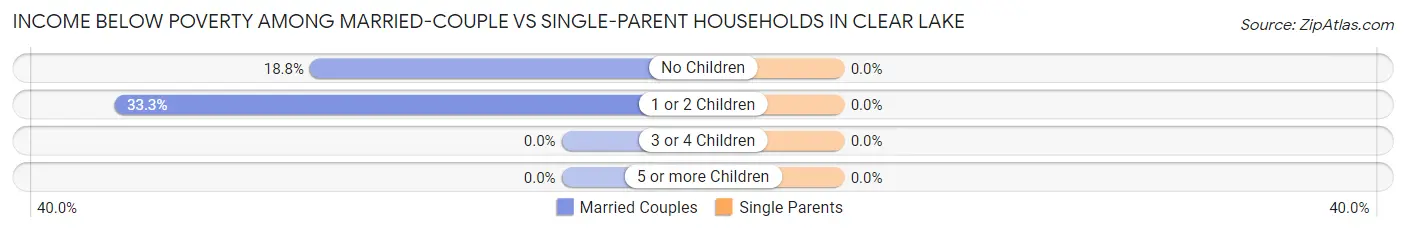
| Children | Married-Couple Families | Single-Parent Households |
| No Children | 6 (18.8%) | 0 (0.0%) |
| 1 or 2 Children | 8 (33.3%) | 0 (0.0%) |
| 3 or 4 Children | 0 (0.0%) | 0 (0.0%) |
| 5 or more Children | 0 (0.0%) | 0 (0.0%) |
| Total | 14 (23.0%) | 0 (0.0%) |
Race in Clear Lake
The most populous races in Clear Lake are White / Caucasian (279 | 88.3%), Two or more Races (37 | 11.7%), and Hispanic or Latino (29 | 9.2%).
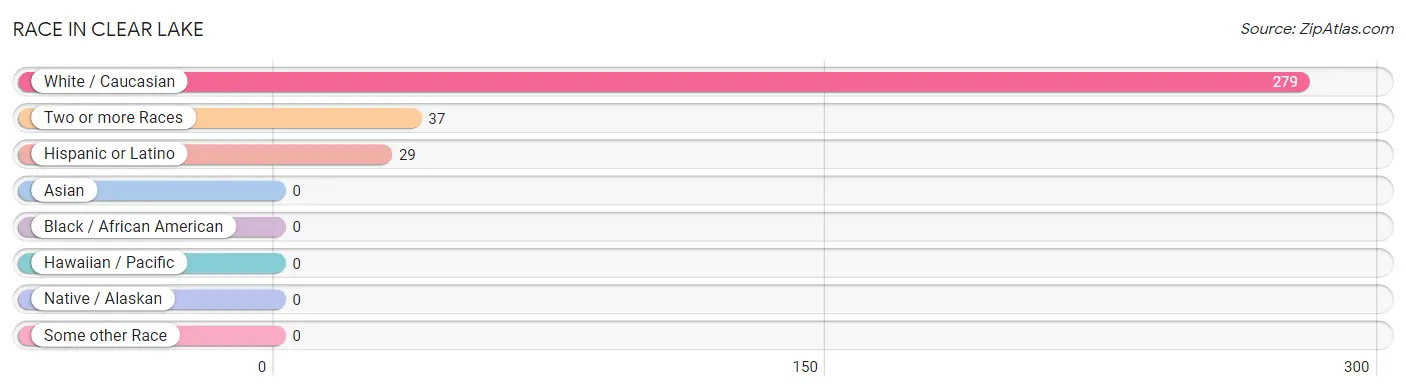
| Race | # Population | % Population |
| Asian | 0 | 0.0% |
| Black / African American | 0 | 0.0% |
| Hawaiian / Pacific | 0 | 0.0% |
| Hispanic or Latino | 29 | 9.2% |
| Native / Alaskan | 0 | 0.0% |
| White / Caucasian | 279 | 88.3% |
| Two or more Races | 37 | 11.7% |
| Some other Race | 0 | 0.0% |
| Total | 316 | 100.0% |
Ancestry in Clear Lake
The most populous ancestries reported in Clear Lake are German (67 | 21.2%), Irish (39 | 12.3%), Mexican (29 | 9.2%), English (27 | 8.5%), and American (24 | 7.6%), together accounting for 58.8% of all Clear Lake residents.
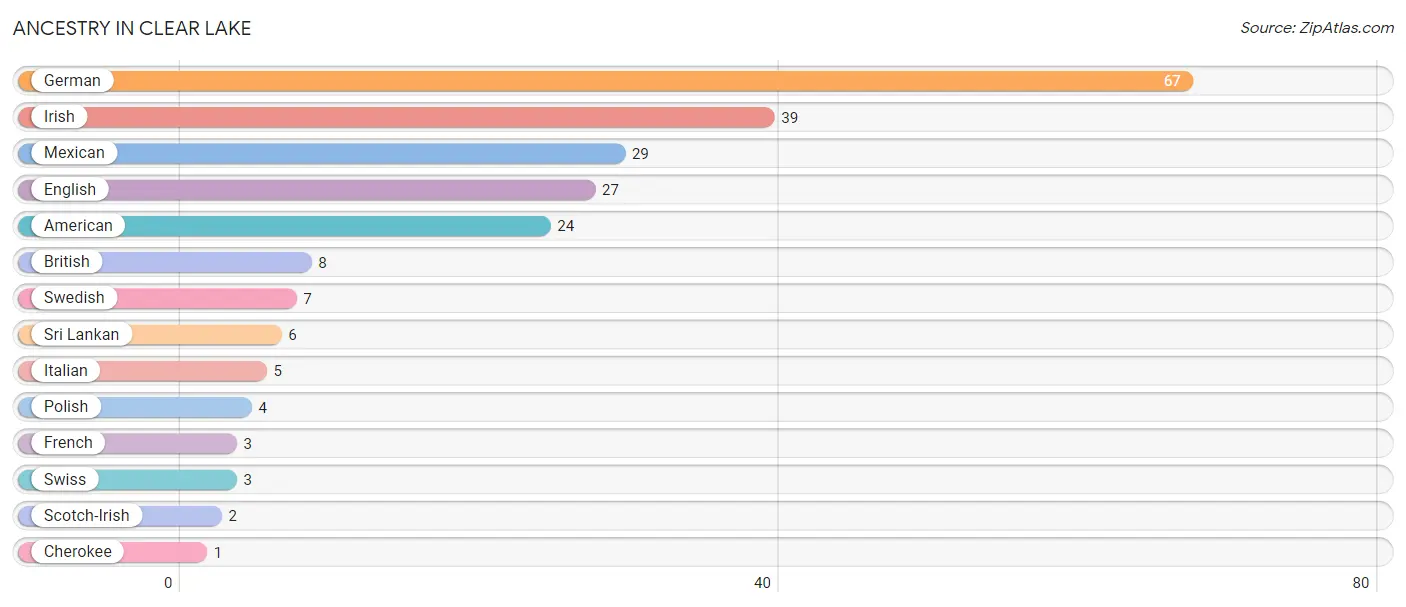
| Ancestry | # Population | % Population |
| American | 24 | 7.6% |
| British | 8 | 2.5% |
| Cherokee | 1 | 0.3% |
| English | 27 | 8.5% |
| French | 3 | 0.9% |
| German | 67 | 21.2% |
| Irish | 39 | 12.3% |
| Italian | 5 | 1.6% |
| Mexican | 29 | 9.2% |
| Polish | 4 | 1.3% |
| Scotch-Irish | 2 | 0.6% |
| Sri Lankan | 6 | 1.9% |
| Swedish | 7 | 2.2% |
| Swiss | 3 | 0.9% | View All 14 Rows |
Immigrants in Clear Lake
The most numerous immigrant groups reported in Clear Lake came from Central America (18 | 5.7%), Latin America (18 | 5.7%), Mexico (18 | 5.7%), and Canada (2 | 0.6%), together accounting for 17.7% of all Clear Lake residents.
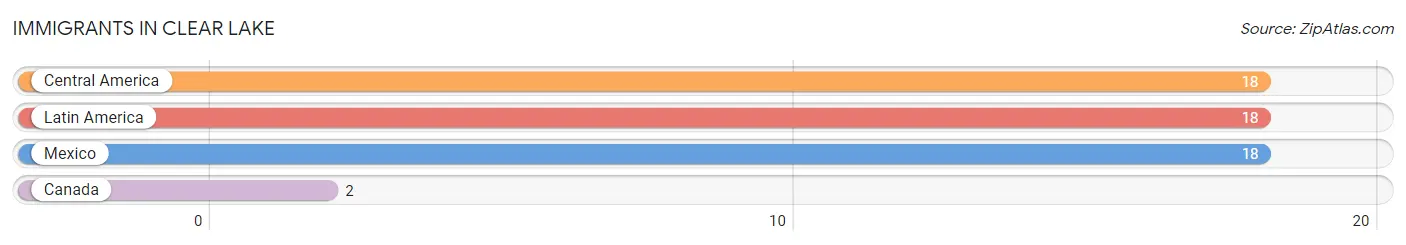
| Immigration Origin | # Population | % Population |
| Canada | 2 | 0.6% |
| Central America | 18 | 5.7% |
| Latin America | 18 | 5.7% |
| Mexico | 18 | 5.7% | View All 4 Rows |
Sex and Age in Clear Lake
Sex and Age in Clear Lake
The most populous age groups in Clear Lake are Under 5 Years (22 | 13.0%) for men and 55 to 59 Years (34 | 23.1%) for women.
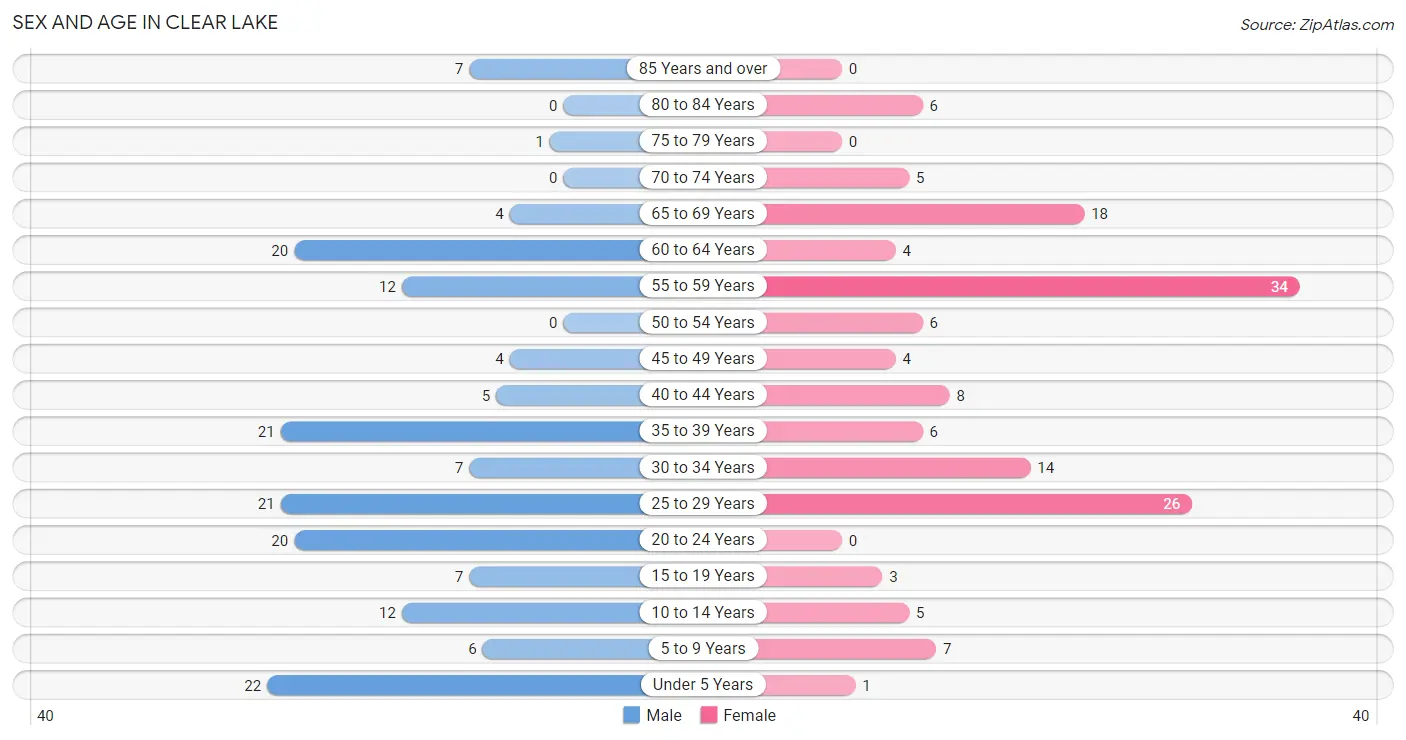
| Age Bracket | Male | Female |
| Under 5 Years | 22 (13.0%) | 1 (0.7%) |
| 5 to 9 Years | 6 (3.5%) | 7 (4.8%) |
| 10 to 14 Years | 12 (7.1%) | 5 (3.4%) |
| 15 to 19 Years | 7 (4.1%) | 3 (2.0%) |
| 20 to 24 Years | 20 (11.8%) | 0 (0.0%) |
| 25 to 29 Years | 21 (12.4%) | 26 (17.7%) |
| 30 to 34 Years | 7 (4.1%) | 14 (9.5%) |
| 35 to 39 Years | 21 (12.4%) | 6 (4.1%) |
| 40 to 44 Years | 5 (3.0%) | 8 (5.4%) |
| 45 to 49 Years | 4 (2.4%) | 4 (2.7%) |
| 50 to 54 Years | 0 (0.0%) | 6 (4.1%) |
| 55 to 59 Years | 12 (7.1%) | 34 (23.1%) |
| 60 to 64 Years | 20 (11.8%) | 4 (2.7%) |
| 65 to 69 Years | 4 (2.4%) | 18 (12.2%) |
| 70 to 74 Years | 0 (0.0%) | 5 (3.4%) |
| 75 to 79 Years | 1 (0.6%) | 0 (0.0%) |
| 80 to 84 Years | 0 (0.0%) | 6 (4.1%) |
| 85 Years and over | 7 (4.1%) | 0 (0.0%) |
| Total | 169 (100.0%) | 147 (100.0%) |
Families and Households in Clear Lake
Median Family Size in Clear Lake
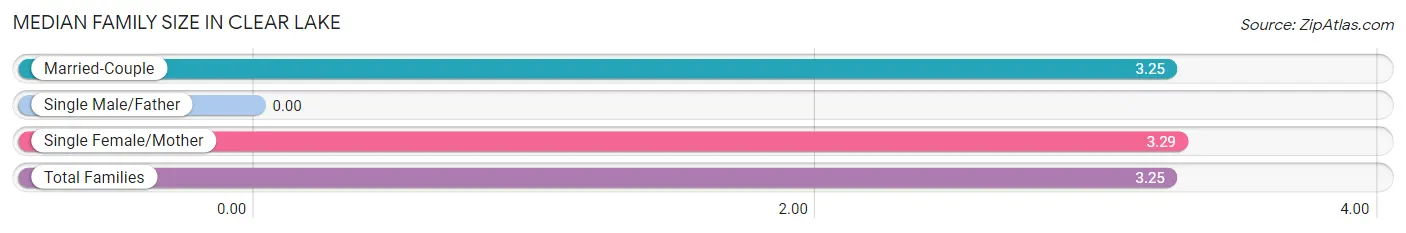
| Family Type | # Families | Family Size |
| Married-Couple | 61 (89.7%) | 3.25 |
| Single Male/Father | 0 (0.0%) | - |
| Single Female/Mother | 7 (10.3%) | 3.29 |
| Total Families | 68 (100.0%) | 3.25 |
Median Household Size in Clear Lake
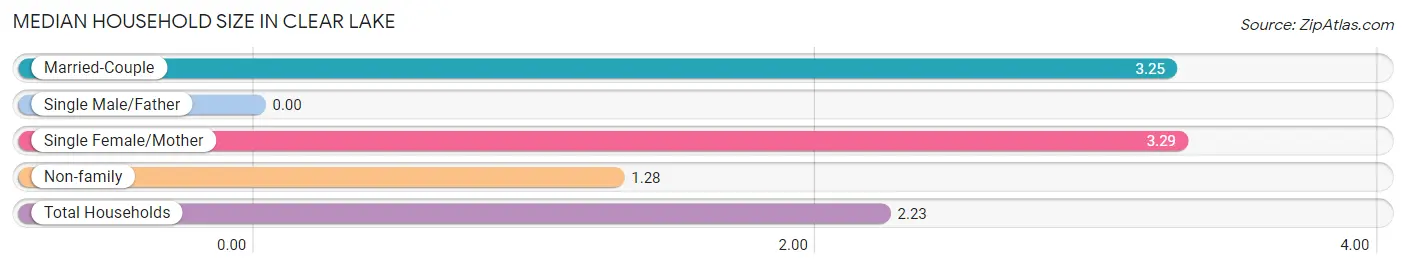
| Household Type | # Households | Household Size |
| Married-Couple | 61 (43.0%) | 3.25 |
| Single Male/Father | 0 (0.0%) | - |
| Single Female/Mother | 7 (4.9%) | 3.29 |
| Non-family | 74 (52.1%) | 1.28 |
| Total Households | 142 (100.0%) | 2.23 |
Household Size by Marriage Status in Clear Lake
Out of a total of 142 households in Clear Lake, 68 (47.9%) are family households, while 74 (52.1%) are nonfamily households. The most numerous type of family households are 2-person households, comprising 27, and the most common type of nonfamily households are 1-person households, comprising 59.
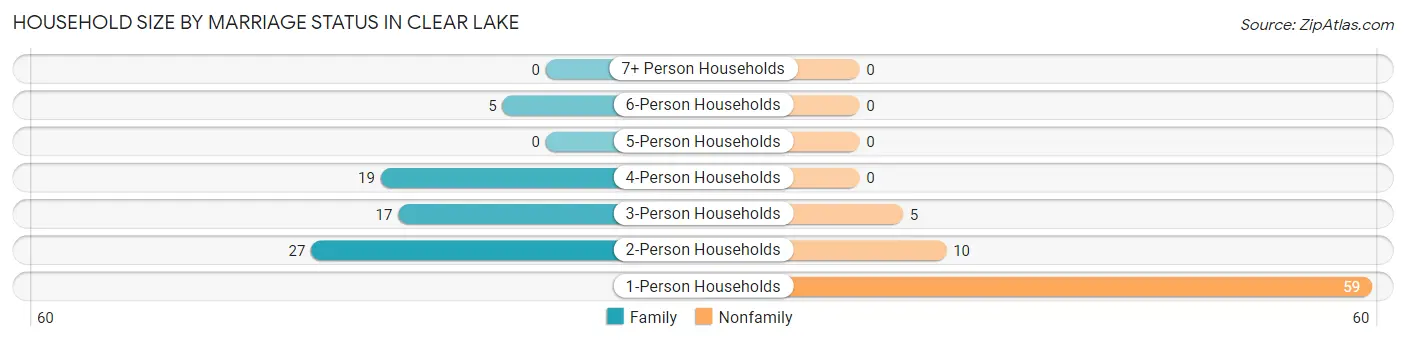
| Household Size | Family Households | Nonfamily Households |
| 1-Person Households | - | 59 (41.5%) |
| 2-Person Households | 27 (19.0%) | 10 (7.0%) |
| 3-Person Households | 17 (12.0%) | 5 (3.5%) |
| 4-Person Households | 19 (13.4%) | 0 (0.0%) |
| 5-Person Households | 0 (0.0%) | 0 (0.0%) |
| 6-Person Households | 5 (3.5%) | 0 (0.0%) |
| 7+ Person Households | 0 (0.0%) | 0 (0.0%) |
| Total | 68 (47.9%) | 74 (52.1%) |
Female Fertility in Clear Lake
Fertility by Age in Clear Lake
| Age Bracket | Women with Births | Births / 1,000 Women |
| 15 to 19 years | 0 (0.0%) | 0.0 |
| 20 to 34 years | 0 (0.0%) | 0.0 |
| 35 to 50 years | 0 (0.0%) | 0.0 |
| Total | 0 (0.0%) | 0.0 |
Fertility by Age by Marriage Status in Clear Lake
| Age Bracket | Married | Unmarried |
| 15 to 19 years | 0 (0.0%) | 0 (0.0%) |
| 20 to 34 years | 0 (0.0%) | 0 (0.0%) |
| 35 to 50 years | 0 (0.0%) | 0 (0.0%) |
| Total | 0 (0.0%) | 0 (0.0%) |
Fertility by Education in Clear Lake
| Educational Attainment | Women with Births | Births / 1,000 Women |
| Less than High School | 0 (0.0%) | 0.0 |
| High School Diploma | 0 (0.0%) | 0.0 |
| College or Associate's Degree | 0 (0.0%) | 0.0 |
| Bachelor's Degree | 0 (0.0%) | 0.0 |
| Graduate Degree | 0 (0.0%) | 0.0 |
| Total | 0 (0.0%) | 0.0 |
Fertility by Education by Marriage Status in Clear Lake
| Educational Attainment | Married | Unmarried |
| Less than High School | 0 (0.0%) | 0 (0.0%) |
| High School Diploma | 0 (0.0%) | 0 (0.0%) |
| College or Associate's Degree | 0 (0.0%) | 0 (0.0%) |
| Bachelor's Degree | 0 (0.0%) | 0 (0.0%) |
| Graduate Degree | 0 (0.0%) | 0 (0.0%) |
| Total | 0 (0.0%) | 0 (0.0%) |
Employment Characteristics in Clear Lake
Employment by Class of Employer in Clear Lake
Among the 137 employed individuals in Clear Lake, private company employees (90 | 65.7%), not-for-profit organizations (14 | 10.2%), and state government employees (11 | 8.0%) make up the most common classes of employment.
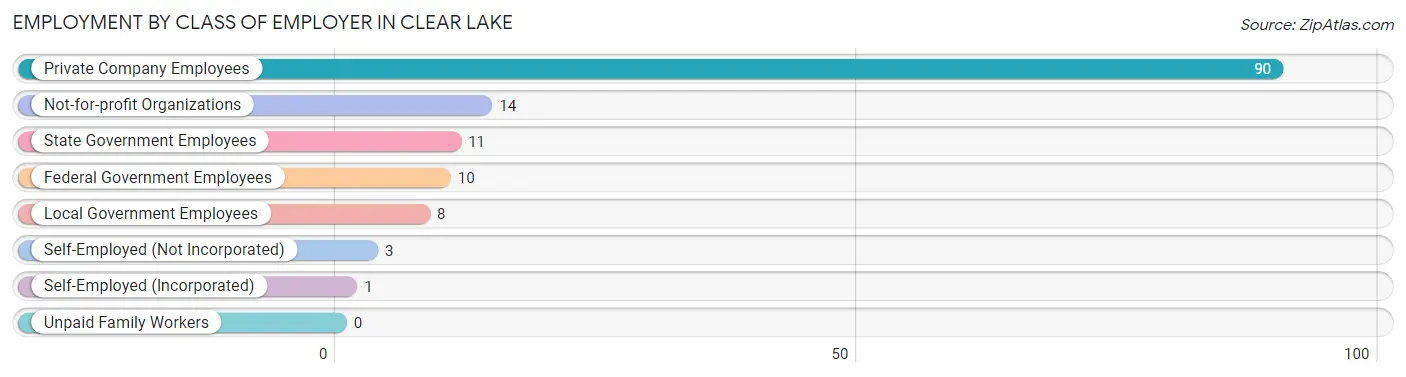
| Employer Class | # Employees | % Employees |
| Private Company Employees | 90 | 65.7% |
| Self-Employed (Incorporated) | 1 | 0.7% |
| Self-Employed (Not Incorporated) | 3 | 2.2% |
| Not-for-profit Organizations | 14 | 10.2% |
| Local Government Employees | 8 | 5.8% |
| State Government Employees | 11 | 8.0% |
| Federal Government Employees | 10 | 7.3% |
| Unpaid Family Workers | 0 | 0.0% |
| Total | 137 | 100.0% |
Employment Status by Age in Clear Lake
According to the labor force statistics for Clear Lake, out of the total population over 16 years of age (259), 68.3% or 177 individuals are in the labor force, with 21.5% or 38 of them unemployed. The age group with the highest labor force participation rate is 20 to 24 years, with 100.0% or 20 individuals in the labor force. Within the labor force, the 20 to 24 years age range has the highest percentage of unemployed individuals, with 45.0% or 9 of them being unemployed.
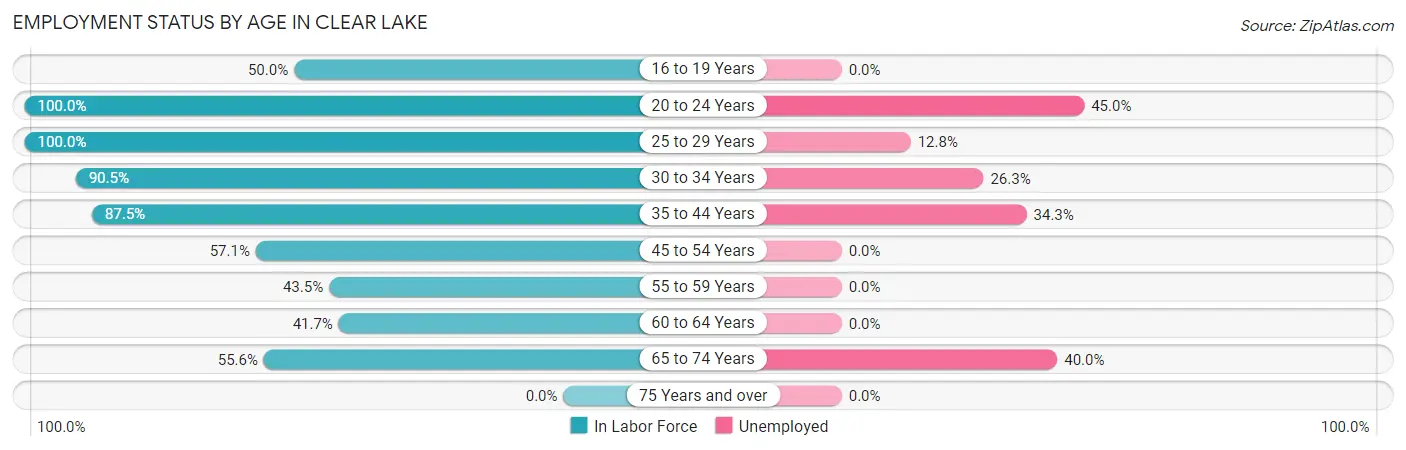
| Age Bracket | In Labor Force | Unemployed |
| 16 to 19 Years | 3 (50.0%) | 0 (0.0%) |
| 20 to 24 Years | 20 (100.0%) | 9 (45.0%) |
| 25 to 29 Years | 47 (100.0%) | 6 (12.8%) |
| 30 to 34 Years | 19 (90.5%) | 5 (26.3%) |
| 35 to 44 Years | 35 (87.5%) | 12 (34.3%) |
| 45 to 54 Years | 8 (57.1%) | 0 (0.0%) |
| 55 to 59 Years | 20 (43.5%) | 0 (0.0%) |
| 60 to 64 Years | 10 (41.7%) | 0 (0.0%) |
| 65 to 74 Years | 15 (55.6%) | 6 (40.0%) |
| 75 Years and over | 0 (0.0%) | 0 (0.0%) |
| Total | 177 (68.3%) | 38 (21.5%) |
Employment Status by Educational Attainment in Clear Lake
According to labor force statistics for Clear Lake, 72.4% of individuals (139) out of the total population between 25 and 64 years of age (192) are in the labor force, with 16.5% or 23 of them being unemployed. The group with the highest labor force participation rate are those with the educational attainment of bachelor's degree or higher, with 100.0% or 11 individuals in the labor force. Within the labor force, individuals with college / associate degree education have the highest percentage of unemployment, with 23.5% or 12 of them being unemployed.
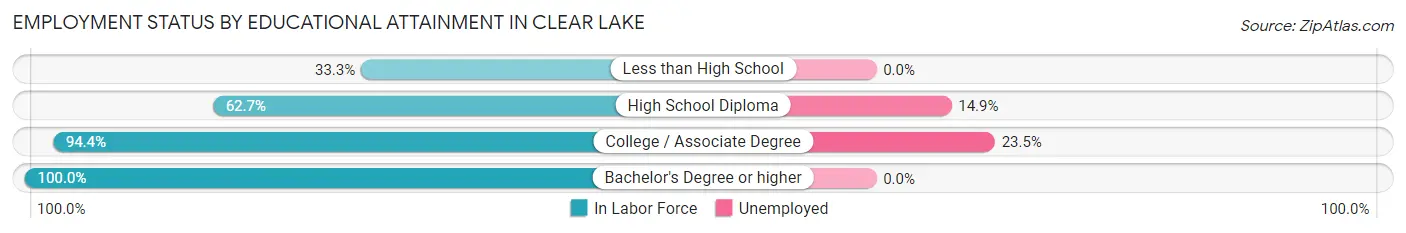
| Educational Attainment | In Labor Force | Unemployed |
| Less than High School | 3 (33.3%) | 0 (0.0%) |
| High School Diploma | 74 (62.7%) | 18 (14.9%) |
| College / Associate Degree | 51 (94.4%) | 13 (23.5%) |
| Bachelor's Degree or higher | 11 (100.0%) | 0 (0.0%) |
| Total | 139 (72.4%) | 32 (16.5%) |
Employment Occupations by Sex in Clear Lake
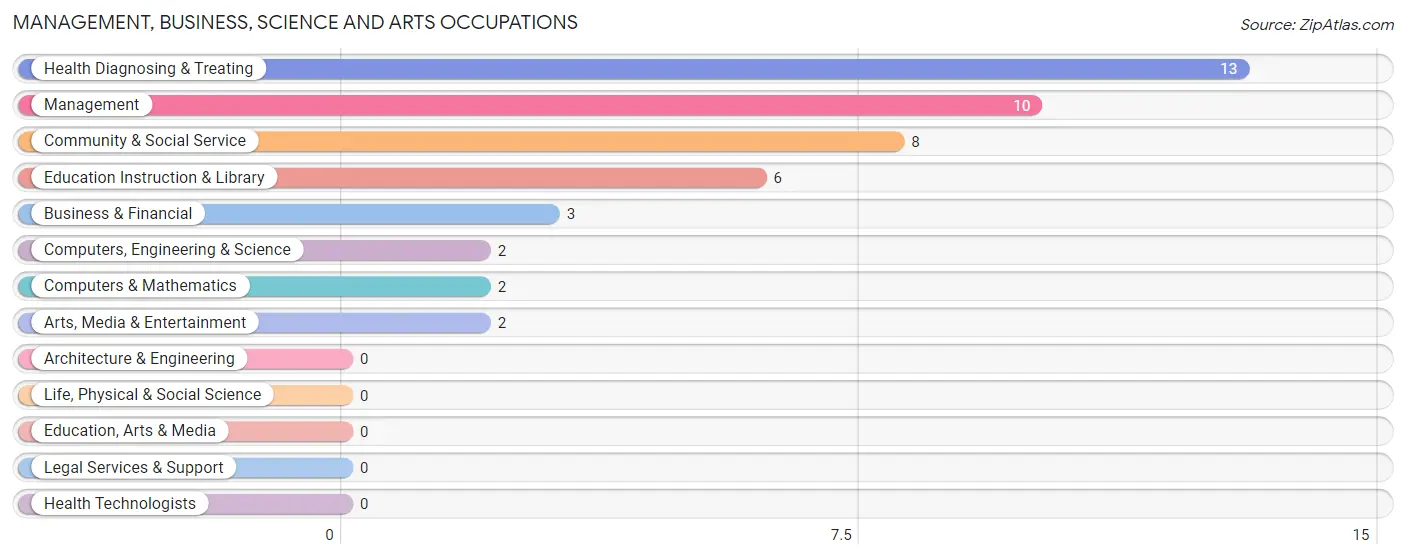
Management, Business, Science and Arts Occupations
The most common Management, Business, Science and Arts occupations in Clear Lake are Health Diagnosing & Treating (13 | 9.3%), Management (10 | 7.2%), Community & Social Service (8 | 5.8%), Education Instruction & Library (6 | 4.3%), and Business & Financial (3 | 2.2%).
Management, Business, Science and Arts Occupations by Sex
Within the Management, Business, Science and Arts occupations in Clear Lake, the most male-oriented occupations are Computers, Engineering & Science (100.0%), Computers & Mathematics (100.0%), and Community & Social Service (100.0%), while the most female-oriented occupations are Business & Financial (100.0%), Health Diagnosing & Treating (100.0%), and Management (70.0%).
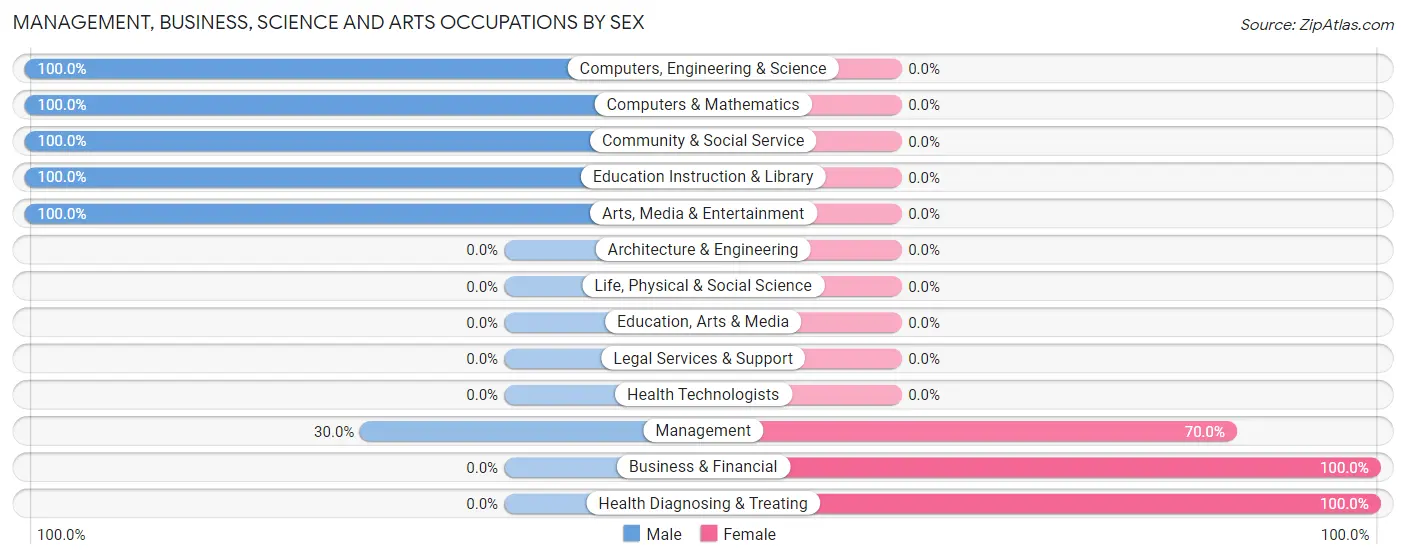
| Occupation | Male | Female |
| Management | 3 (30.0%) | 7 (70.0%) |
| Business & Financial | 0 (0.0%) | 3 (100.0%) |
| Computers, Engineering & Science | 2 (100.0%) | 0 (0.0%) |
| Computers & Mathematics | 2 (100.0%) | 0 (0.0%) |
| Architecture & Engineering | 0 (0.0%) | 0 (0.0%) |
| Life, Physical & Social Science | 0 (0.0%) | 0 (0.0%) |
| Community & Social Service | 8 (100.0%) | 0 (0.0%) |
| Education, Arts & Media | 0 (0.0%) | 0 (0.0%) |
| Legal Services & Support | 0 (0.0%) | 0 (0.0%) |
| Education Instruction & Library | 6 (100.0%) | 0 (0.0%) |
| Arts, Media & Entertainment | 2 (100.0%) | 0 (0.0%) |
| Health Diagnosing & Treating | 0 (0.0%) | 13 (100.0%) |
| Health Technologists | 0 (0.0%) | 0 (0.0%) |
| Total (Category) | 13 (36.1%) | 23 (63.9%) |
| Total (Overall) | 76 (54.7%) | 63 (45.3%) |
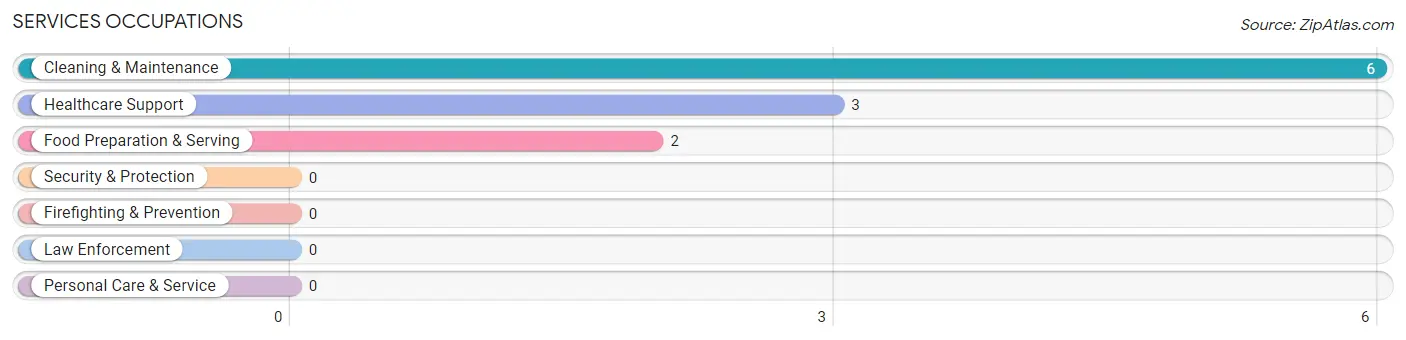
Services Occupations
The most common Services occupations in Clear Lake are Cleaning & Maintenance (6 | 4.3%), Healthcare Support (3 | 2.2%), and Food Preparation & Serving (2 | 1.4%).
Services Occupations by Sex
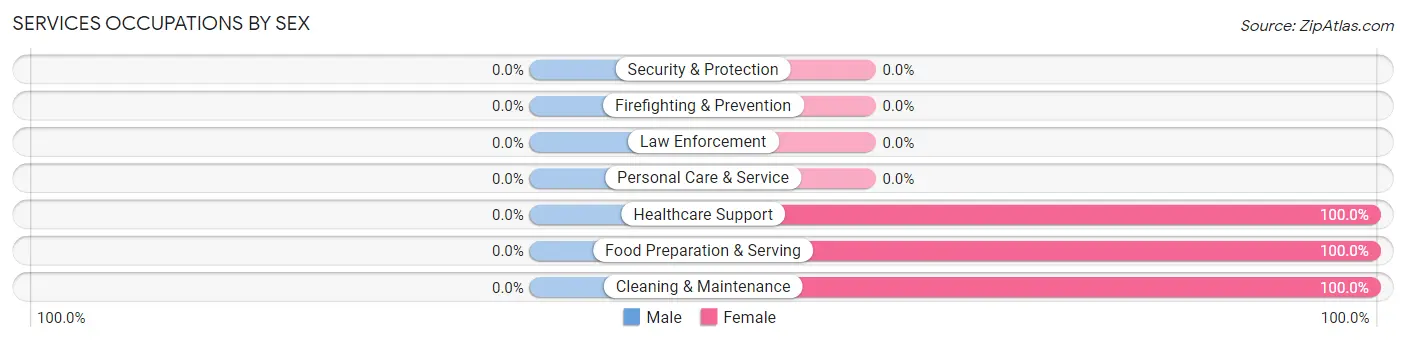
| Occupation | Male | Female |
| Healthcare Support | 0 (0.0%) | 3 (100.0%) |
| Security & Protection | 0 (0.0%) | 0 (0.0%) |
| Firefighting & Prevention | 0 (0.0%) | 0 (0.0%) |
| Law Enforcement | 0 (0.0%) | 0 (0.0%) |
| Food Preparation & Serving | 0 (0.0%) | 2 (100.0%) |
| Cleaning & Maintenance | 0 (0.0%) | 6 (100.0%) |
| Personal Care & Service | 0 (0.0%) | 0 (0.0%) |
| Total (Category) | 0 (0.0%) | 11 (100.0%) |
| Total (Overall) | 76 (54.7%) | 63 (45.3%) |
Sales and Office Occupations
The most common Sales and Office occupations in Clear Lake are , and Office & Administration (32 | 23.0%).
Sales and Office Occupations by Sex
| Occupation | Male | Female |
| Sales & Related | 0 (0.0%) | 0 (0.0%) |
| Office & Administration | 3 (9.4%) | 29 (90.6%) |
| Total (Category) | 3 (9.4%) | 29 (90.6%) |
| Total (Overall) | 76 (54.7%) | 63 (45.3%) |
Natural Resources, Construction and Maintenance Occupations
The most common Natural Resources, Construction and Maintenance occupations in Clear Lake are Installation, Maintenance & Repair (10 | 7.2%), and Construction & Extraction (5 | 3.6%).
Natural Resources, Construction and Maintenance Occupations by Sex
| Occupation | Male | Female |
| Farming, Fishing & Forestry | 0 (0.0%) | 0 (0.0%) |
| Construction & Extraction | 5 (100.0%) | 0 (0.0%) |
| Installation, Maintenance & Repair | 10 (100.0%) | 0 (0.0%) |
| Total (Category) | 15 (100.0%) | 0 (0.0%) |
| Total (Overall) | 76 (54.7%) | 63 (45.3%) |
Production, Transportation and Moving Occupations
The most common Production, Transportation and Moving occupations in Clear Lake are Production (27 | 19.4%), Transportation (12 | 8.6%), and Material Moving (6 | 4.3%).
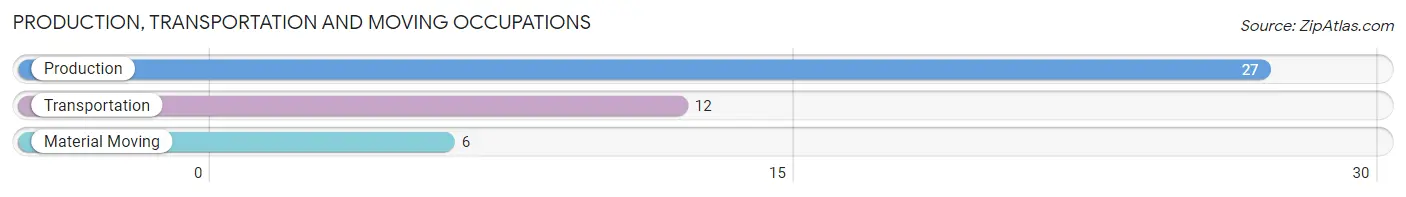
Production, Transportation and Moving Occupations by Sex
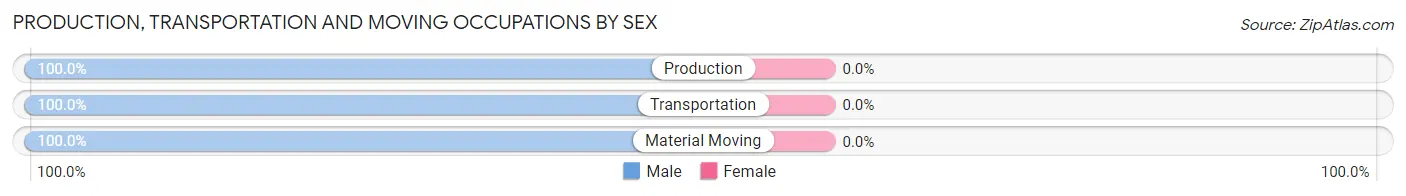
| Occupation | Male | Female |
| Production | 27 (100.0%) | 0 (0.0%) |
| Transportation | 12 (100.0%) | 0 (0.0%) |
| Material Moving | 6 (100.0%) | 0 (0.0%) |
| Total (Category) | 45 (100.0%) | 0 (0.0%) |
| Total (Overall) | 76 (54.7%) | 63 (45.3%) |
Employment Industries by Sex in Clear Lake
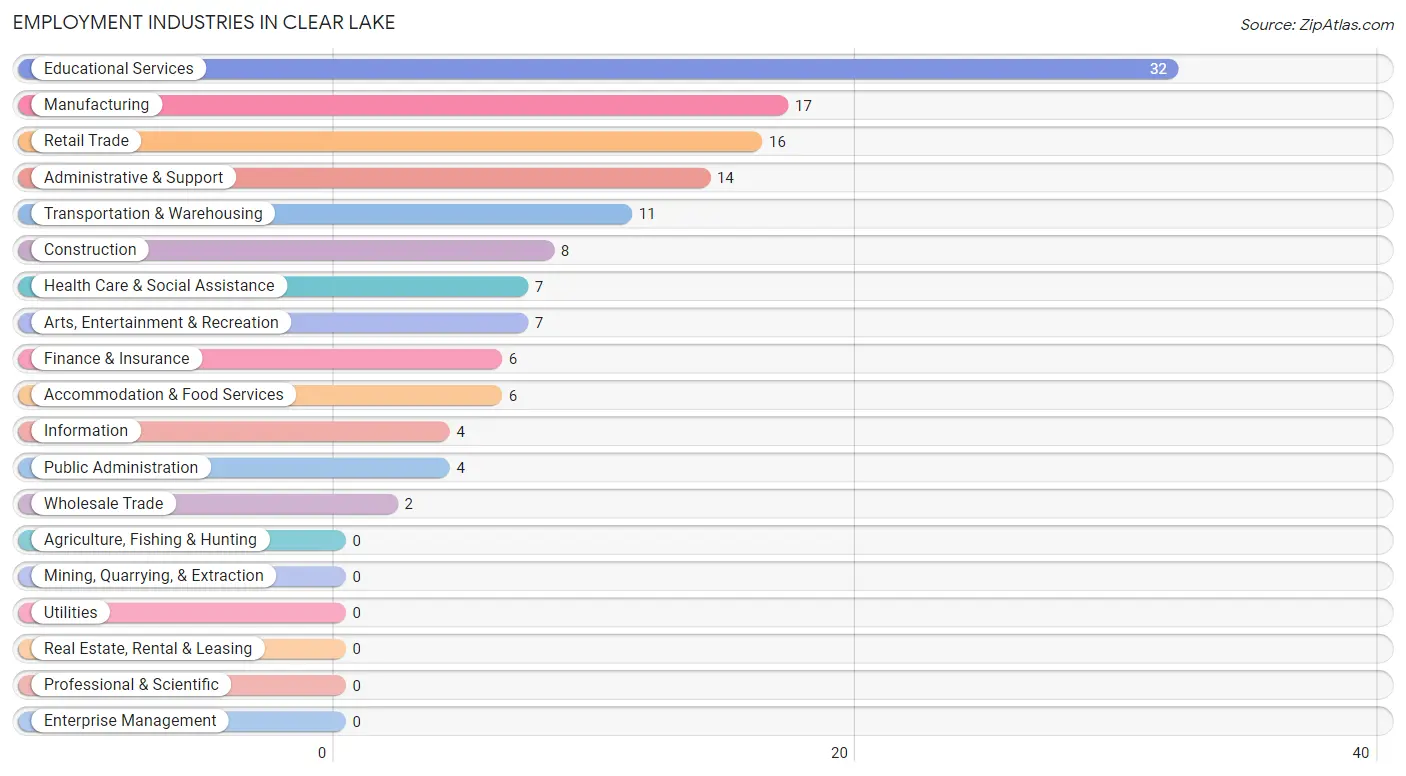
Employment Industries in Clear Lake
The major employment industries in Clear Lake include Educational Services (32 | 23.0%), Manufacturing (17 | 12.2%), Retail Trade (16 | 11.5%), Administrative & Support (14 | 10.1%), and Transportation & Warehousing (11 | 7.9%).
Employment Industries by Sex in Clear Lake
The Clear Lake industries that see more men than women are Construction (100.0%), Manufacturing (100.0%), and Wholesale Trade (100.0%), whereas the industries that tend to have a higher number of women are Finance & Insurance (100.0%), Health Care & Social Assistance (100.0%), and Accommodation & Food Services (100.0%).
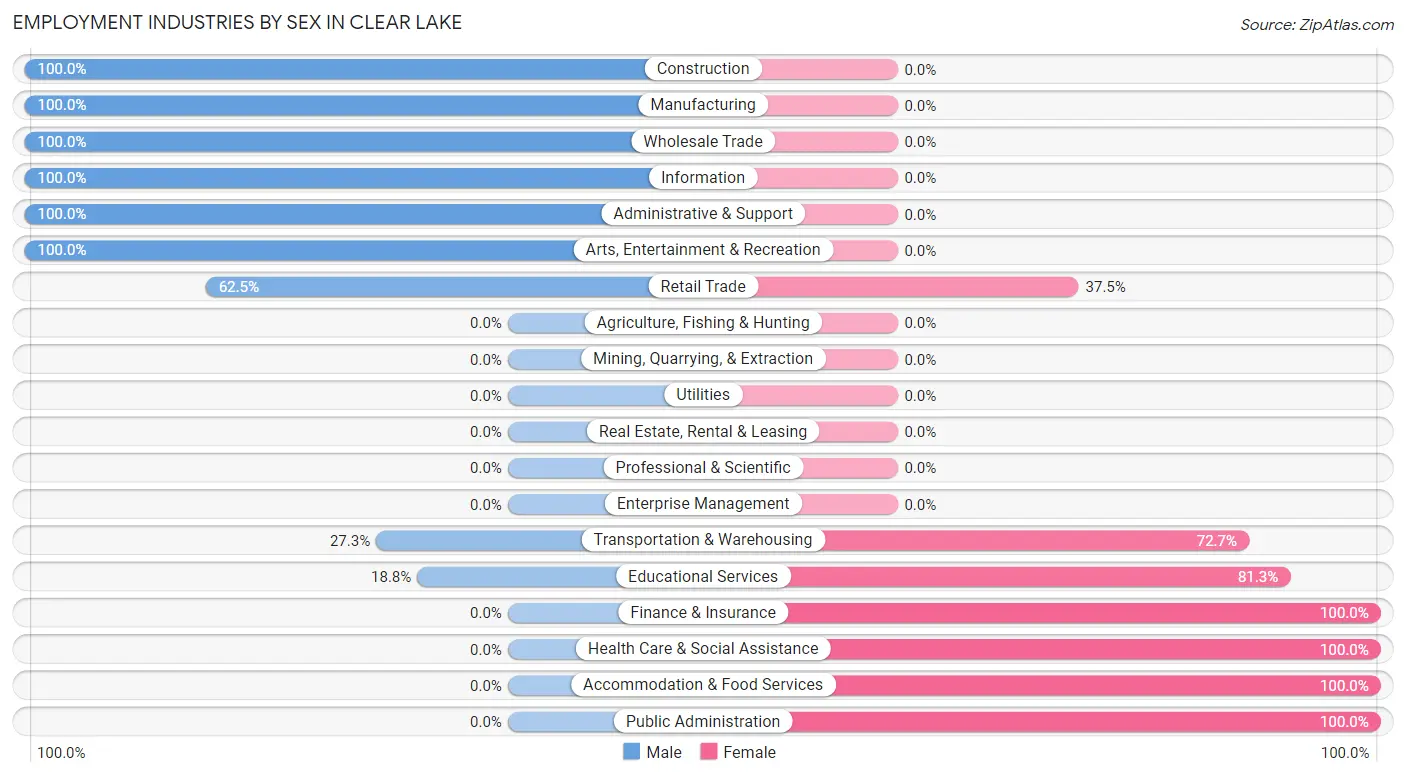
| Industry | Male | Female |
| Agriculture, Fishing & Hunting | 0 (0.0%) | 0 (0.0%) |
| Mining, Quarrying, & Extraction | 0 (0.0%) | 0 (0.0%) |
| Construction | 8 (100.0%) | 0 (0.0%) |
| Manufacturing | 17 (100.0%) | 0 (0.0%) |
| Wholesale Trade | 2 (100.0%) | 0 (0.0%) |
| Retail Trade | 10 (62.5%) | 6 (37.5%) |
| Transportation & Warehousing | 3 (27.3%) | 8 (72.7%) |
| Utilities | 0 (0.0%) | 0 (0.0%) |
| Information | 4 (100.0%) | 0 (0.0%) |
| Finance & Insurance | 0 (0.0%) | 6 (100.0%) |
| Real Estate, Rental & Leasing | 0 (0.0%) | 0 (0.0%) |
| Professional & Scientific | 0 (0.0%) | 0 (0.0%) |
| Enterprise Management | 0 (0.0%) | 0 (0.0%) |
| Administrative & Support | 14 (100.0%) | 0 (0.0%) |
| Educational Services | 6 (18.8%) | 26 (81.2%) |
| Health Care & Social Assistance | 0 (0.0%) | 7 (100.0%) |
| Arts, Entertainment & Recreation | 7 (100.0%) | 0 (0.0%) |
| Accommodation & Food Services | 0 (0.0%) | 6 (100.0%) |
| Public Administration | 0 (0.0%) | 4 (100.0%) |
| Total | 76 (54.7%) | 63 (45.3%) |
Education in Clear Lake
School Enrollment in Clear Lake
The most common levels of schooling among the 66 students in Clear Lake are nursery / preschool (17 | 25.8%), middle school (17 | 25.8%), and elementary school (13 | 19.7%).
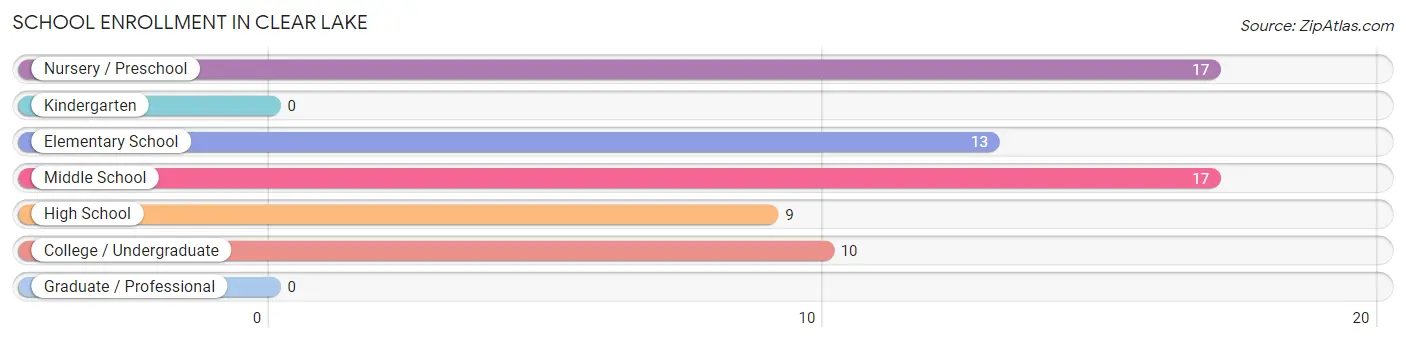
| School Level | # Students | % Students |
| Nursery / Preschool | 17 | 25.8% |
| Kindergarten | 0 | 0.0% |
| Elementary School | 13 | 19.7% |
| Middle School | 17 | 25.8% |
| High School | 9 | 13.6% |
| College / Undergraduate | 10 | 15.1% |
| Graduate / Professional | 0 | 0.0% |
| Total | 66 | 100.0% |
School Enrollment by Age by Funding Source in Clear Lake
Out of a total of 66 students who are enrolled in schools in Clear Lake, 5 (7.6%) attend a private institution, while the remaining 61 (92.4%) are enrolled in public schools. The age group of 35 years and over has the highest likelihood of being enrolled in private schools, with 2 (50.0% in the age bracket) enrolled. Conversely, the age group of 3 to 4 year olds has the lowest likelihood of being enrolled in a private school, with 17 (100.0% in the age bracket) attending a public institution.
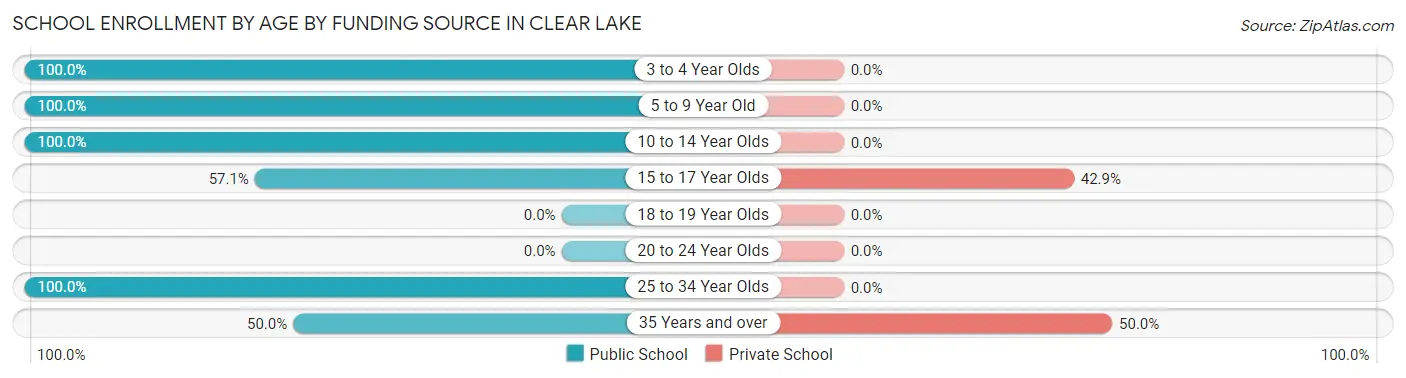
| Age Bracket | Public School | Private School |
| 3 to 4 Year Olds | 17 (100.0%) | 0 (0.0%) |
| 5 to 9 Year Old | 13 (100.0%) | 0 (0.0%) |
| 10 to 14 Year Olds | 17 (100.0%) | 0 (0.0%) |
| 15 to 17 Year Olds | 4 (57.1%) | 3 (42.9%) |
| 18 to 19 Year Olds | 0 (0.0%) | 0 (0.0%) |
| 20 to 24 Year Olds | 0 (0.0%) | 0 (0.0%) |
| 25 to 34 Year Olds | 8 (100.0%) | 0 (0.0%) |
| 35 Years and over | 2 (50.0%) | 2 (50.0%) |
| Total | 61 (92.4%) | 5 (7.6%) |
Educational Attainment by Field of Study in Clear Lake
Education (14 | 82.4%), and business (3 | 17.6%) are the most common fields of study among 17 individuals in Clear Lake who have obtained a bachelor's degree or higher.
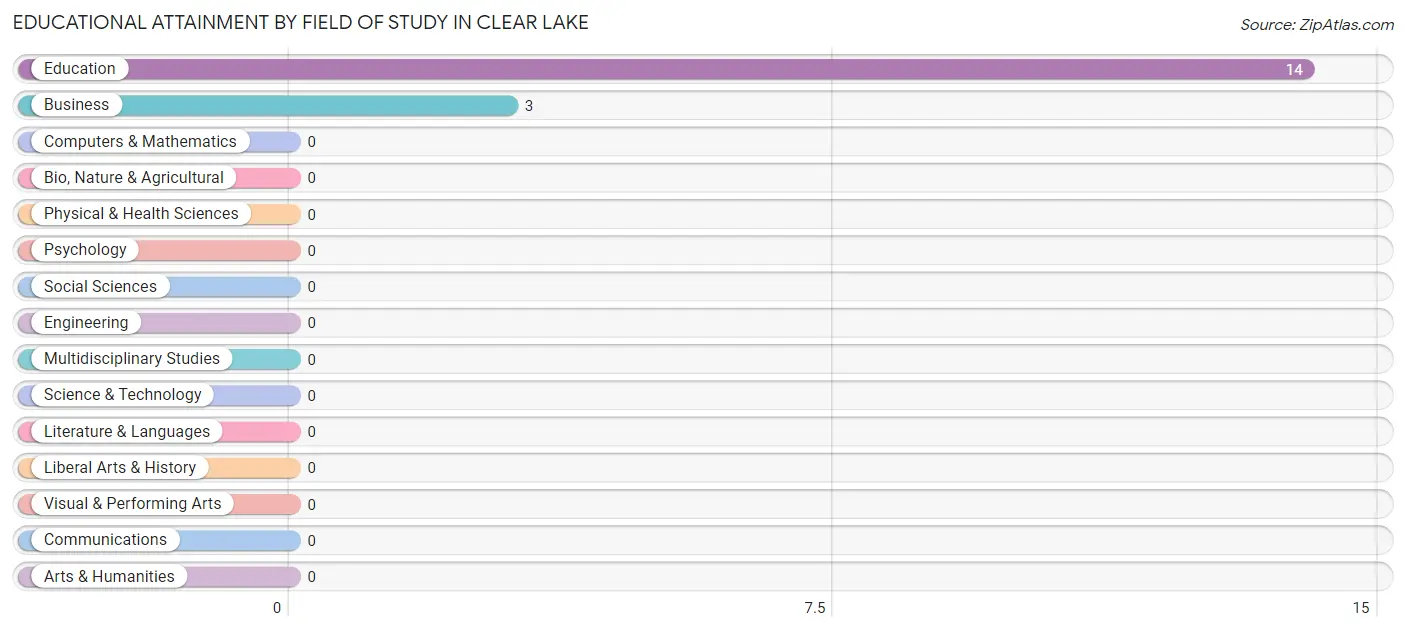
| Field of Study | # Graduates | % Graduates |
| Computers & Mathematics | 0 | 0.0% |
| Bio, Nature & Agricultural | 0 | 0.0% |
| Physical & Health Sciences | 0 | 0.0% |
| Psychology | 0 | 0.0% |
| Social Sciences | 0 | 0.0% |
| Engineering | 0 | 0.0% |
| Multidisciplinary Studies | 0 | 0.0% |
| Science & Technology | 0 | 0.0% |
| Business | 3 | 17.6% |
| Education | 14 | 82.4% |
| Literature & Languages | 0 | 0.0% |
| Liberal Arts & History | 0 | 0.0% |
| Visual & Performing Arts | 0 | 0.0% |
| Communications | 0 | 0.0% |
| Arts & Humanities | 0 | 0.0% |
| Total | 17 | 100.0% |
Transportation & Commute in Clear Lake
Vehicle Availability by Sex in Clear Lake
The most prevalent vehicle ownership categories in Clear Lake are males with 2 vehicles (48, accounting for 64.9%) and females with 2 vehicles (46, making up 76.2%).
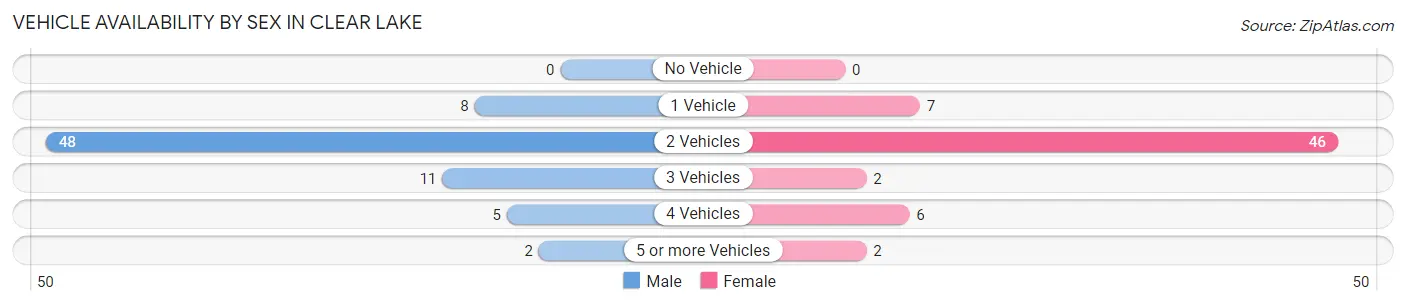
| Vehicles Available | Male | Female |
| No Vehicle | 0 (0.0%) | 0 (0.0%) |
| 1 Vehicle | 8 (10.8%) | 7 (11.1%) |
| 2 Vehicles | 48 (64.9%) | 46 (73.0%) |
| 3 Vehicles | 11 (14.9%) | 2 (3.2%) |
| 4 Vehicles | 5 (6.8%) | 6 (9.5%) |
| 5 or more Vehicles | 2 (2.7%) | 2 (3.2%) |
| Total | 74 (100.0%) | 63 (100.0%) |
Commute Time in Clear Lake
The most frequently occuring commute durations in Clear Lake are 15 to 19 minutes (39 commuters, 29.1%), 10 to 14 minutes (33 commuters, 24.6%), and 25 to 29 minutes (23 commuters, 17.2%).
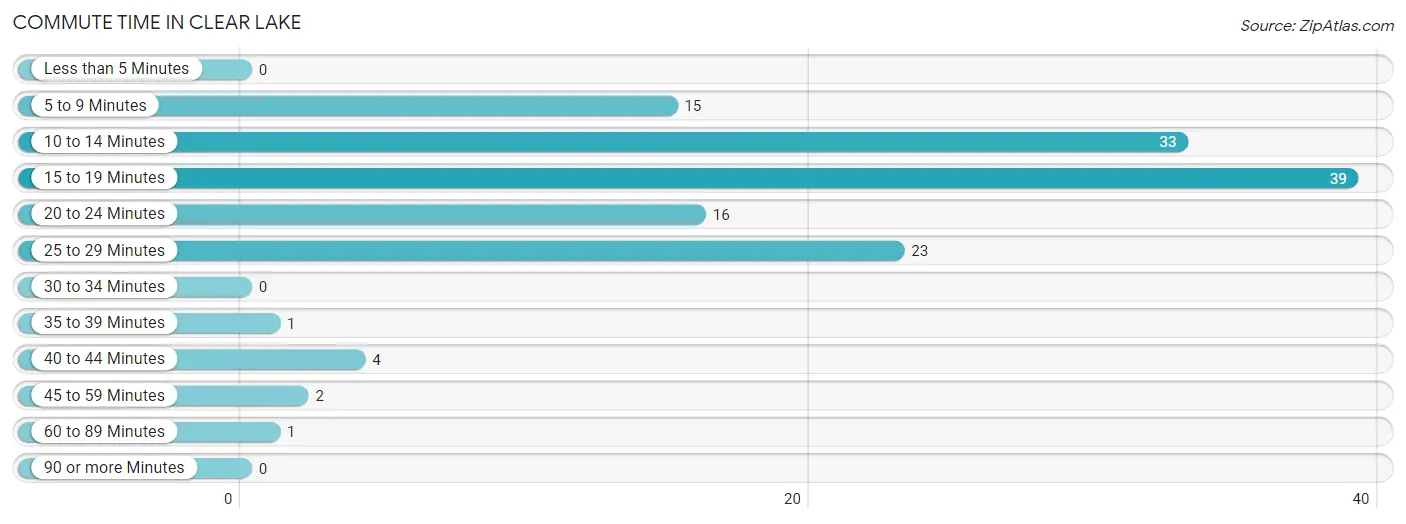
| Commute Time | # Commuters | % Commuters |
| Less than 5 Minutes | 0 | 0.0% |
| 5 to 9 Minutes | 15 | 11.2% |
| 10 to 14 Minutes | 33 | 24.6% |
| 15 to 19 Minutes | 39 | 29.1% |
| 20 to 24 Minutes | 16 | 11.9% |
| 25 to 29 Minutes | 23 | 17.2% |
| 30 to 34 Minutes | 0 | 0.0% |
| 35 to 39 Minutes | 1 | 0.7% |
| 40 to 44 Minutes | 4 | 3.0% |
| 45 to 59 Minutes | 2 | 1.5% |
| 60 to 89 Minutes | 1 | 0.7% |
| 90 or more Minutes | 0 | 0.0% |
Commute Time by Sex in Clear Lake
The most common commute times in Clear Lake are 15 to 19 minutes (29 commuters, 39.2%) for males and 25 to 29 minutes (23 commuters, 38.3%) for females.
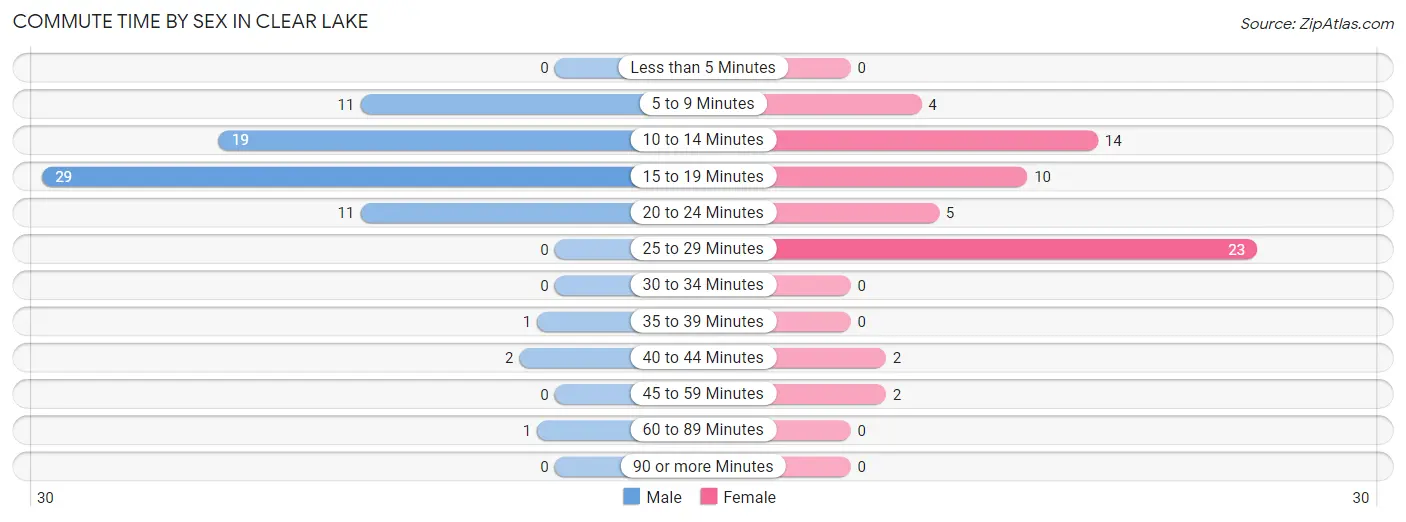
| Commute Time | Male | Female |
| Less than 5 Minutes | 0 (0.0%) | 0 (0.0%) |
| 5 to 9 Minutes | 11 (14.9%) | 4 (6.7%) |
| 10 to 14 Minutes | 19 (25.7%) | 14 (23.3%) |
| 15 to 19 Minutes | 29 (39.2%) | 10 (16.7%) |
| 20 to 24 Minutes | 11 (14.9%) | 5 (8.3%) |
| 25 to 29 Minutes | 0 (0.0%) | 23 (38.3%) |
| 30 to 34 Minutes | 0 (0.0%) | 0 (0.0%) |
| 35 to 39 Minutes | 1 (1.3%) | 0 (0.0%) |
| 40 to 44 Minutes | 2 (2.7%) | 2 (3.3%) |
| 45 to 59 Minutes | 0 (0.0%) | 2 (3.3%) |
| 60 to 89 Minutes | 1 (1.3%) | 0 (0.0%) |
| 90 or more Minutes | 0 (0.0%) | 0 (0.0%) |
Time of Departure to Work by Sex in Clear Lake
The most frequent times of departure to work in Clear Lake are 8:00 AM to 8:29 AM (29, 39.2%) for males and 6:30 AM to 6:59 AM (16, 26.7%) for females.
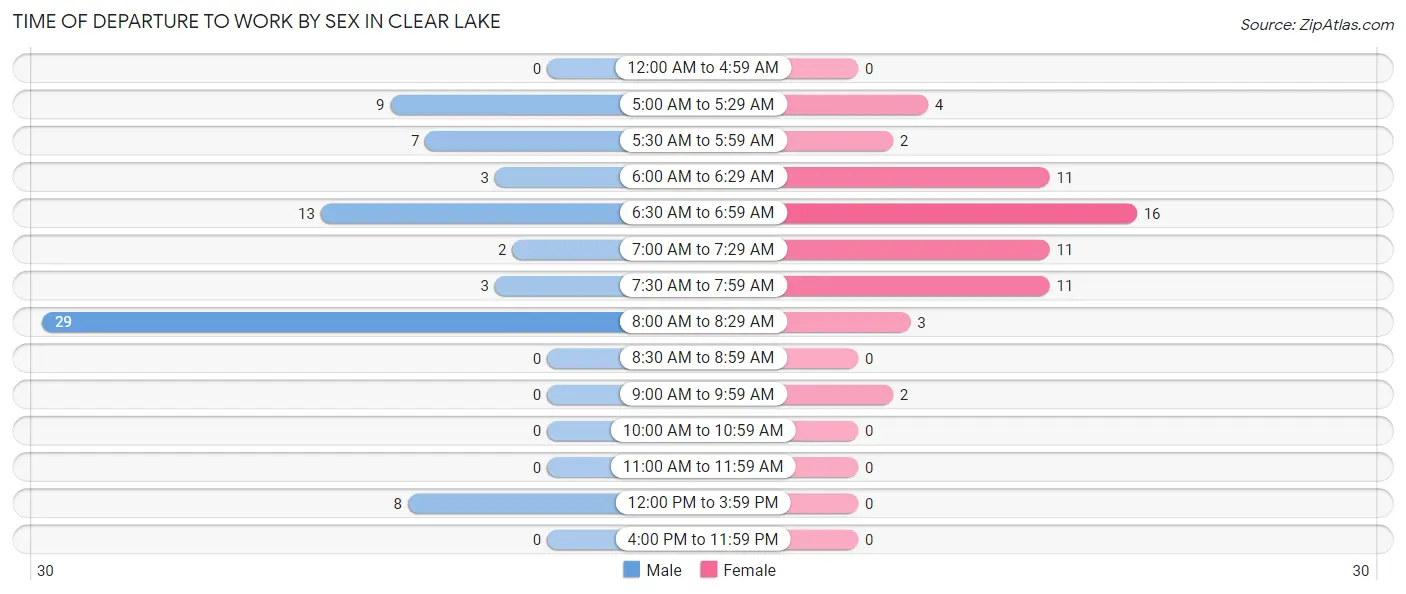
| Time of Departure | Male | Female |
| 12:00 AM to 4:59 AM | 0 (0.0%) | 0 (0.0%) |
| 5:00 AM to 5:29 AM | 9 (12.2%) | 4 (6.7%) |
| 5:30 AM to 5:59 AM | 7 (9.5%) | 2 (3.3%) |
| 6:00 AM to 6:29 AM | 3 (4.1%) | 11 (18.3%) |
| 6:30 AM to 6:59 AM | 13 (17.6%) | 16 (26.7%) |
| 7:00 AM to 7:29 AM | 2 (2.7%) | 11 (18.3%) |
| 7:30 AM to 7:59 AM | 3 (4.1%) | 11 (18.3%) |
| 8:00 AM to 8:29 AM | 29 (39.2%) | 3 (5.0%) |
| 8:30 AM to 8:59 AM | 0 (0.0%) | 0 (0.0%) |
| 9:00 AM to 9:59 AM | 0 (0.0%) | 2 (3.3%) |
| 10:00 AM to 10:59 AM | 0 (0.0%) | 0 (0.0%) |
| 11:00 AM to 11:59 AM | 0 (0.0%) | 0 (0.0%) |
| 12:00 PM to 3:59 PM | 8 (10.8%) | 0 (0.0%) |
| 4:00 PM to 11:59 PM | 0 (0.0%) | 0 (0.0%) |
| Total | 74 (100.0%) | 60 (100.0%) |
Housing Occupancy in Clear Lake
Occupancy by Ownership in Clear Lake
Of the total 142 dwellings in Clear Lake, owner-occupied units account for 122 (85.9%), while renter-occupied units make up 20 (14.1%).
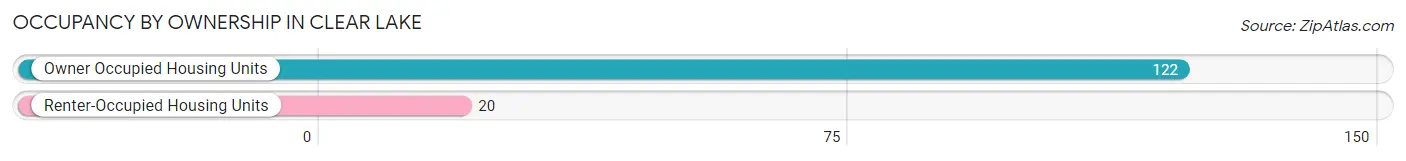
| Occupancy | # Housing Units | % Housing Units |
| Owner Occupied Housing Units | 122 | 85.9% |
| Renter-Occupied Housing Units | 20 | 14.1% |
| Total Occupied Housing Units | 142 | 100.0% |
Occupancy by Household Size in Clear Lake
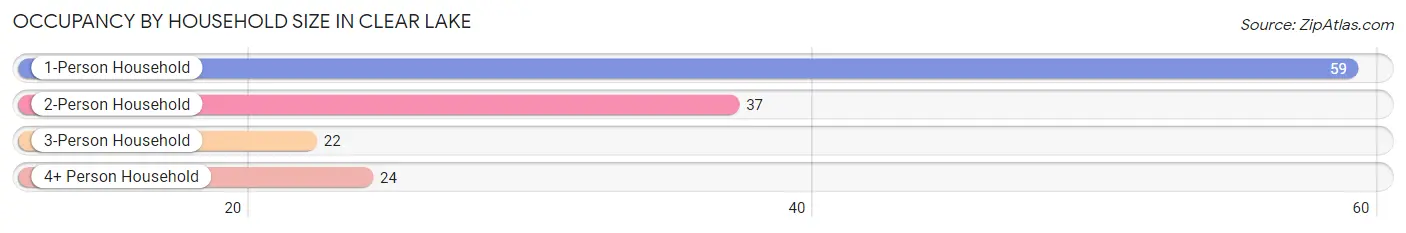
| Household Size | # Housing Units | % Housing Units |
| 1-Person Household | 59 | 41.5% |
| 2-Person Household | 37 | 26.1% |
| 3-Person Household | 22 | 15.5% |
| 4+ Person Household | 24 | 16.9% |
| Total Housing Units | 142 | 100.0% |
Occupancy by Ownership by Household Size in Clear Lake
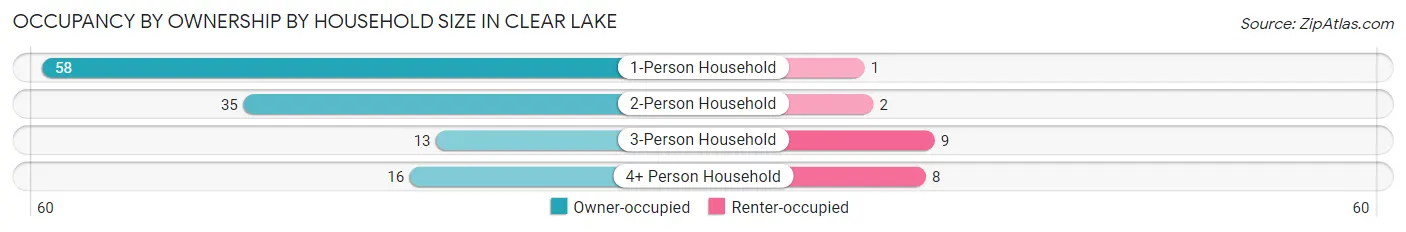
| Household Size | Owner-occupied | Renter-occupied |
| 1-Person Household | 58 (98.3%) | 1 (1.7%) |
| 2-Person Household | 35 (94.6%) | 2 (5.4%) |
| 3-Person Household | 13 (59.1%) | 9 (40.9%) |
| 4+ Person Household | 16 (66.7%) | 8 (33.3%) |
| Total Housing Units | 122 (85.9%) | 20 (14.1%) |
Occupancy by Educational Attainment in Clear Lake
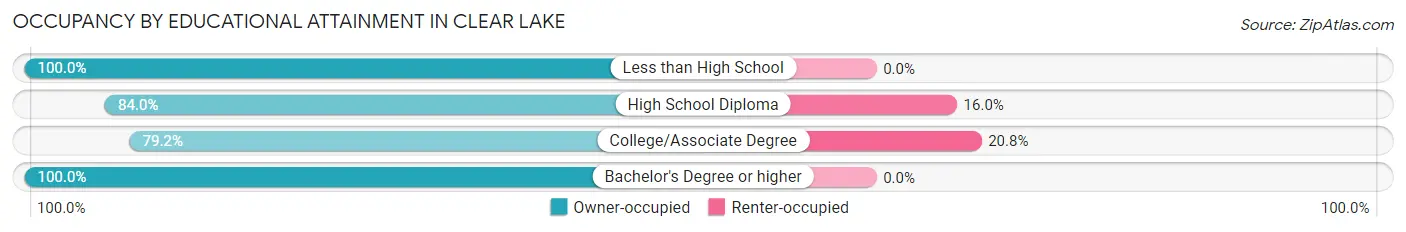
| Household Size | Owner-occupied | Renter-occupied |
| Less than High School | 7 (100.0%) | 0 (0.0%) |
| High School Diploma | 79 (84.0%) | 15 (16.0%) |
| College/Associate Degree | 19 (79.2%) | 5 (20.8%) |
| Bachelor's Degree or higher | 17 (100.0%) | 0 (0.0%) |
Occupancy by Age of Householder in Clear Lake
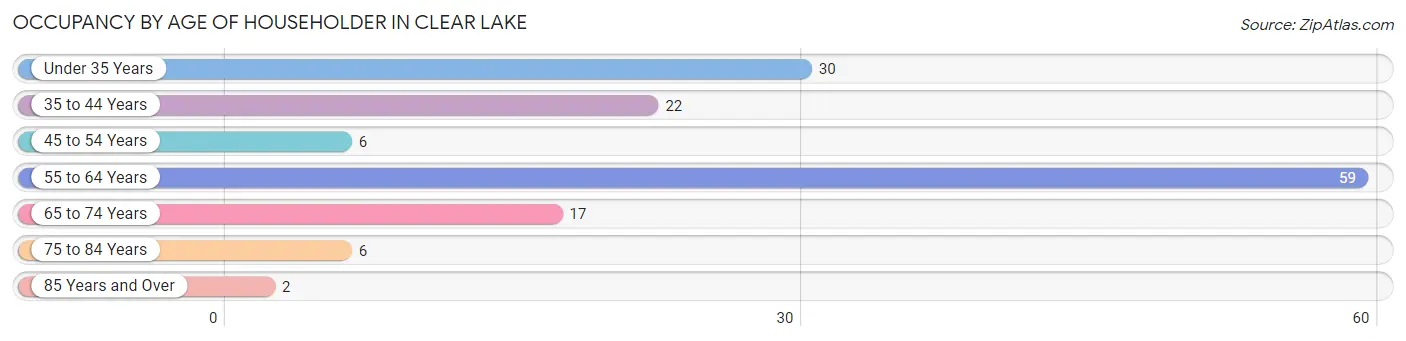
| Age Bracket | # Households | % Households |
| Under 35 Years | 30 | 21.1% |
| 35 to 44 Years | 22 | 15.5% |
| 45 to 54 Years | 6 | 4.2% |
| 55 to 64 Years | 59 | 41.5% |
| 65 to 74 Years | 17 | 12.0% |
| 75 to 84 Years | 6 | 4.2% |
| 85 Years and Over | 2 | 1.4% |
| Total | 142 | 100.0% |
Housing Finances in Clear Lake
Median Income by Occupancy in Clear Lake
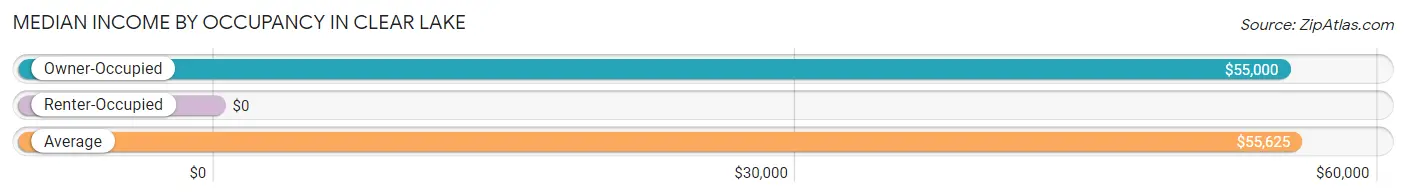
| Occupancy Type | # Households | Median Income |
| Owner-Occupied | 122 (85.9%) | $55,000 |
| Renter-Occupied | 20 (14.1%) | $0 |
| Average | 142 (100.0%) | $55,625 |
Occupancy by Householder Income Bracket in Clear Lake
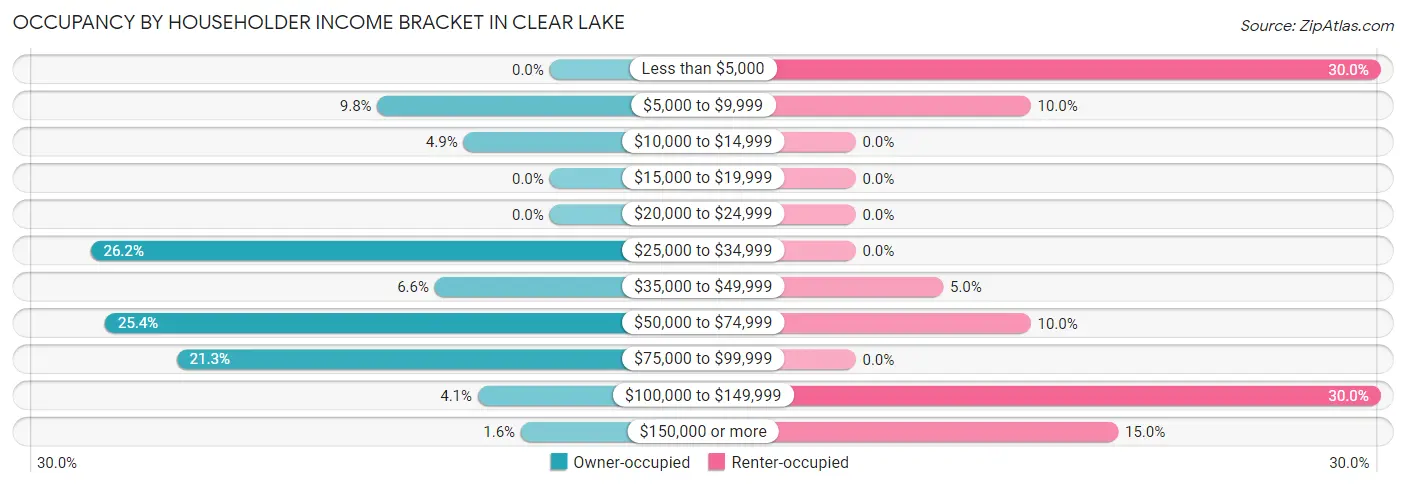
| Income Bracket | Owner-occupied | Renter-occupied |
| Less than $5,000 | 0 (0.0%) | 6 (30.0%) |
| $5,000 to $9,999 | 12 (9.8%) | 2 (10.0%) |
| $10,000 to $14,999 | 6 (4.9%) | 0 (0.0%) |
| $15,000 to $19,999 | 0 (0.0%) | 0 (0.0%) |
| $20,000 to $24,999 | 0 (0.0%) | 0 (0.0%) |
| $25,000 to $34,999 | 32 (26.2%) | 0 (0.0%) |
| $35,000 to $49,999 | 8 (6.6%) | 1 (5.0%) |
| $50,000 to $74,999 | 31 (25.4%) | 2 (10.0%) |
| $75,000 to $99,999 | 26 (21.3%) | 0 (0.0%) |
| $100,000 to $149,999 | 5 (4.1%) | 6 (30.0%) |
| $150,000 or more | 2 (1.6%) | 3 (15.0%) |
| Total | 122 (100.0%) | 20 (100.0%) |
Monthly Housing Cost Tiers in Clear Lake
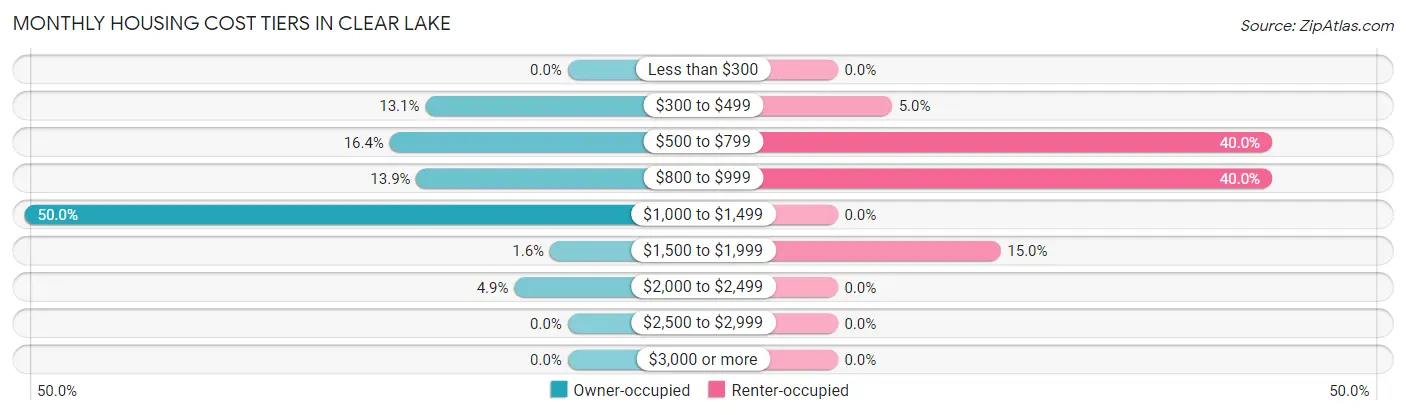
| Monthly Cost | Owner-occupied | Renter-occupied |
| Less than $300 | 0 (0.0%) | 0 (0.0%) |
| $300 to $499 | 16 (13.1%) | 1 (5.0%) |
| $500 to $799 | 20 (16.4%) | 8 (40.0%) |
| $800 to $999 | 17 (13.9%) | 8 (40.0%) |
| $1,000 to $1,499 | 61 (50.0%) | 0 (0.0%) |
| $1,500 to $1,999 | 2 (1.6%) | 3 (15.0%) |
| $2,000 to $2,499 | 6 (4.9%) | 0 (0.0%) |
| $2,500 to $2,999 | 0 (0.0%) | 0 (0.0%) |
| $3,000 or more | 0 (0.0%) | 0 (0.0%) |
| Total | 122 (100.0%) | 20 (100.0%) |
Physical Housing Characteristics in Clear Lake
Housing Structures in Clear Lake
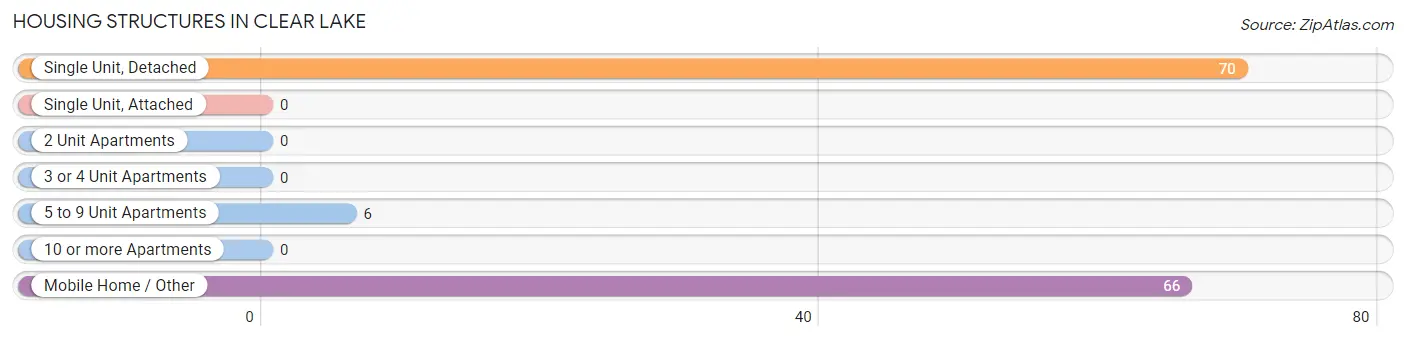
| Structure Type | # Housing Units | % Housing Units |
| Single Unit, Detached | 70 | 49.3% |
| Single Unit, Attached | 0 | 0.0% |
| 2 Unit Apartments | 0 | 0.0% |
| 3 or 4 Unit Apartments | 0 | 0.0% |
| 5 to 9 Unit Apartments | 6 | 4.2% |
| 10 or more Apartments | 0 | 0.0% |
| Mobile Home / Other | 66 | 46.5% |
| Total | 142 | 100.0% |
Housing Structures by Occupancy in Clear Lake
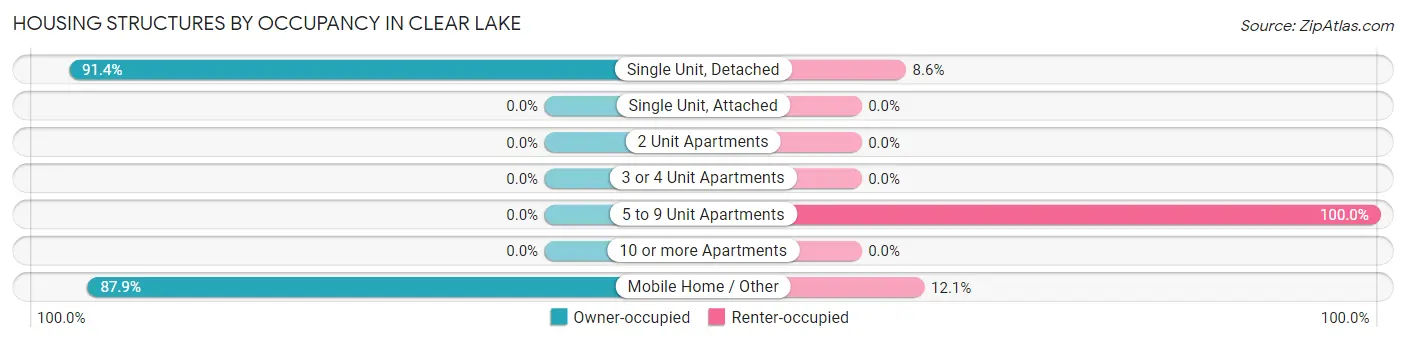
| Structure Type | Owner-occupied | Renter-occupied |
| Single Unit, Detached | 64 (91.4%) | 6 (8.6%) |
| Single Unit, Attached | 0 (0.0%) | 0 (0.0%) |
| 2 Unit Apartments | 0 (0.0%) | 0 (0.0%) |
| 3 or 4 Unit Apartments | 0 (0.0%) | 0 (0.0%) |
| 5 to 9 Unit Apartments | 0 (0.0%) | 6 (100.0%) |
| 10 or more Apartments | 0 (0.0%) | 0 (0.0%) |
| Mobile Home / Other | 58 (87.9%) | 8 (12.1%) |
| Total | 122 (85.9%) | 20 (14.1%) |
Housing Structures by Number of Rooms in Clear Lake
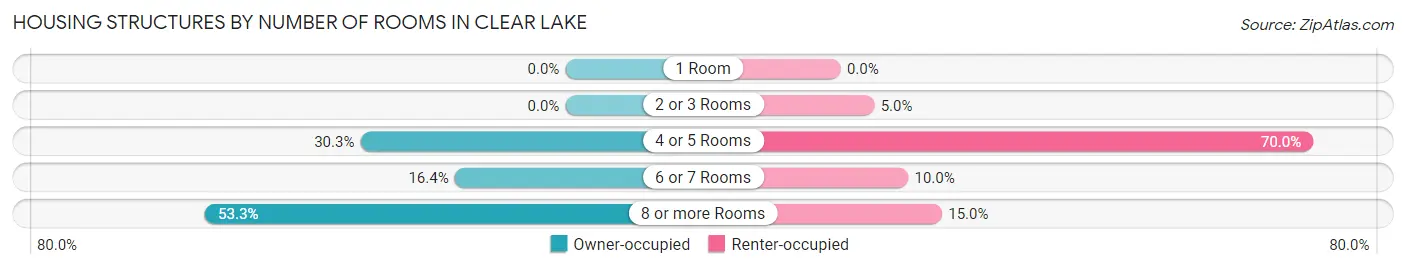
| Number of Rooms | Owner-occupied | Renter-occupied |
| 1 Room | 0 (0.0%) | 0 (0.0%) |
| 2 or 3 Rooms | 0 (0.0%) | 1 (5.0%) |
| 4 or 5 Rooms | 37 (30.3%) | 14 (70.0%) |
| 6 or 7 Rooms | 20 (16.4%) | 2 (10.0%) |
| 8 or more Rooms | 65 (53.3%) | 3 (15.0%) |
| Total | 122 (100.0%) | 20 (100.0%) |
Housing Structure by Heating Type in Clear Lake
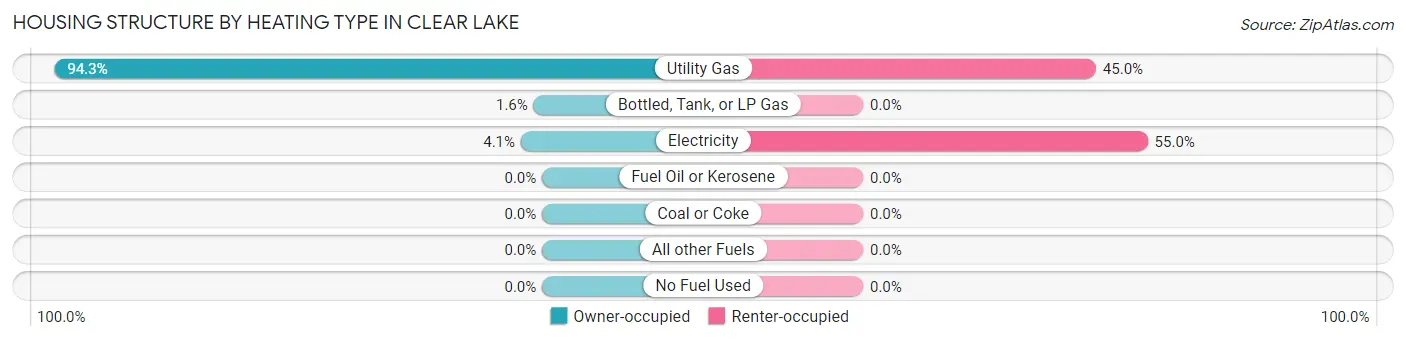
| Heating Type | Owner-occupied | Renter-occupied |
| Utility Gas | 115 (94.3%) | 9 (45.0%) |
| Bottled, Tank, or LP Gas | 2 (1.6%) | 0 (0.0%) |
| Electricity | 5 (4.1%) | 11 (55.0%) |
| Fuel Oil or Kerosene | 0 (0.0%) | 0 (0.0%) |
| Coal or Coke | 0 (0.0%) | 0 (0.0%) |
| All other Fuels | 0 (0.0%) | 0 (0.0%) |
| No Fuel Used | 0 (0.0%) | 0 (0.0%) |
| Total | 122 (100.0%) | 20 (100.0%) |
Household Vehicle Usage in Clear Lake
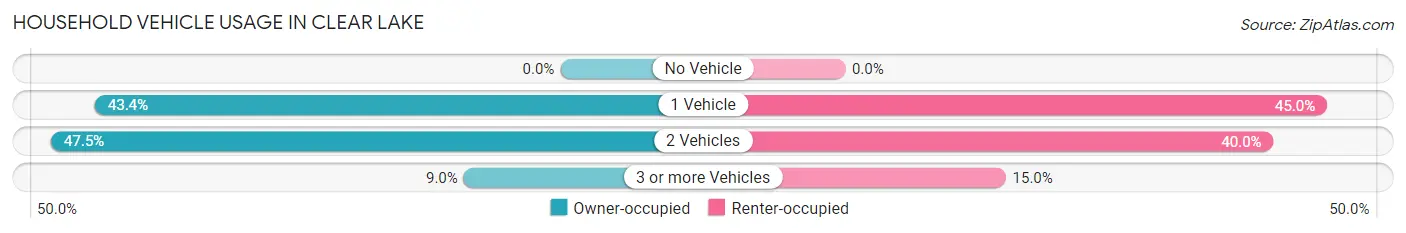
| Vehicles per Household | Owner-occupied | Renter-occupied |
| No Vehicle | 0 (0.0%) | 0 (0.0%) |
| 1 Vehicle | 53 (43.4%) | 9 (45.0%) |
| 2 Vehicles | 58 (47.5%) | 8 (40.0%) |
| 3 or more Vehicles | 11 (9.0%) | 3 (15.0%) |
| Total | 122 (100.0%) | 20 (100.0%) |
Real Estate & Mortgages in Clear Lake
Real Estate and Mortgage Overview in Clear Lake
| Characteristic | Without Mortgage | With Mortgage |
| Housing Units | 22 | 100 |
| Median Property Value | $86,300 | $90,000 |
| Median Household Income | $56,250 | $0 |
| Monthly Housing Costs | $383 | $0 |
| Real Estate Taxes | $925 | $0 |
Property Value by Mortgage Status in Clear Lake
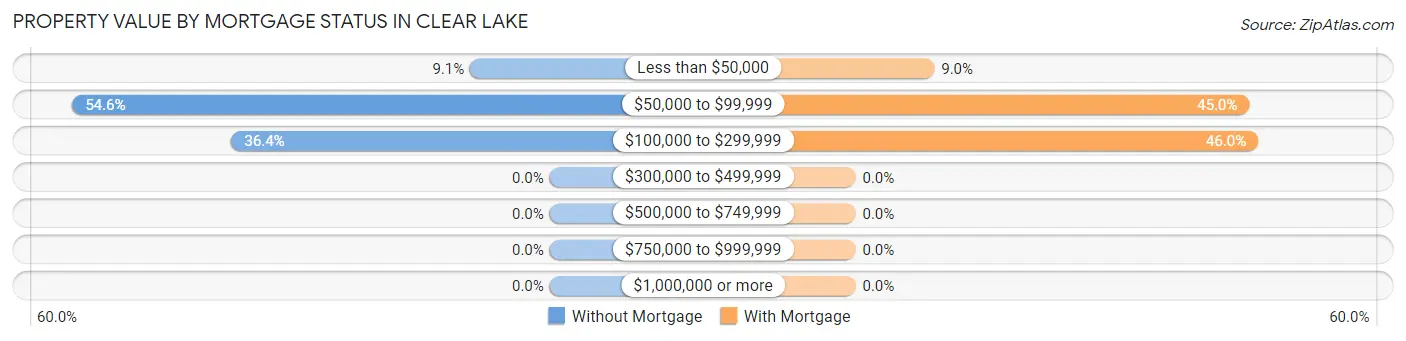
| Property Value | Without Mortgage | With Mortgage |
| Less than $50,000 | 2 (9.1%) | 9 (9.0%) |
| $50,000 to $99,999 | 12 (54.5%) | 45 (45.0%) |
| $100,000 to $299,999 | 8 (36.4%) | 46 (46.0%) |
| $300,000 to $499,999 | 0 (0.0%) | 0 (0.0%) |
| $500,000 to $749,999 | 0 (0.0%) | 0 (0.0%) |
| $750,000 to $999,999 | 0 (0.0%) | 0 (0.0%) |
| $1,000,000 or more | 0 (0.0%) | 0 (0.0%) |
| Total | 22 (100.0%) | 100 (100.0%) |
Household Income by Mortgage Status in Clear Lake
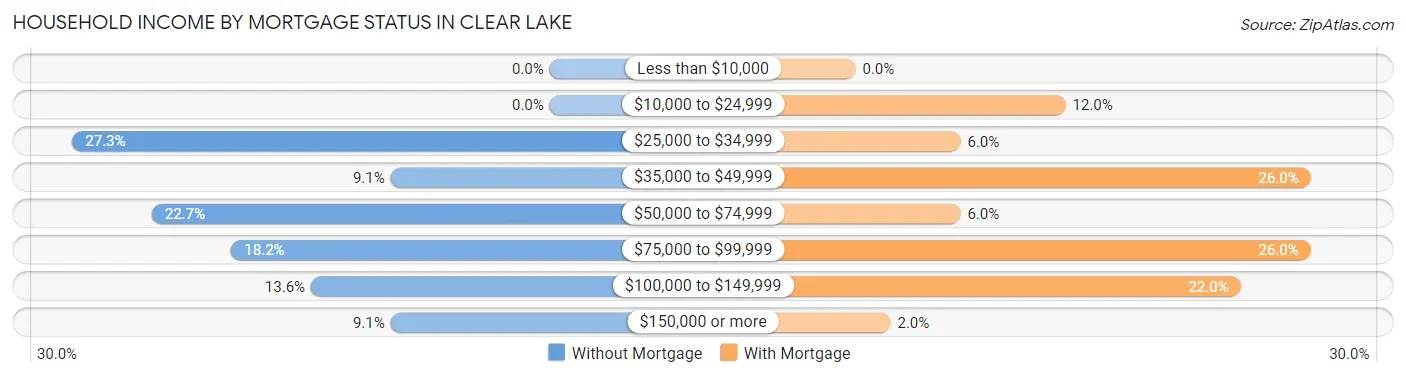
| Household Income | Without Mortgage | With Mortgage |
| Less than $10,000 | 0 (0.0%) | 0 (0.0%) |
| $10,000 to $24,999 | 0 (0.0%) | 12 (12.0%) |
| $25,000 to $34,999 | 6 (27.3%) | 6 (6.0%) |
| $35,000 to $49,999 | 2 (9.1%) | 26 (26.0%) |
| $50,000 to $74,999 | 5 (22.7%) | 6 (6.0%) |
| $75,000 to $99,999 | 4 (18.2%) | 26 (26.0%) |
| $100,000 to $149,999 | 3 (13.6%) | 22 (22.0%) |
| $150,000 or more | 2 (9.1%) | 2 (2.0%) |
| Total | 22 (100.0%) | 100 (100.0%) |
Property Value to Household Income Ratio in Clear Lake
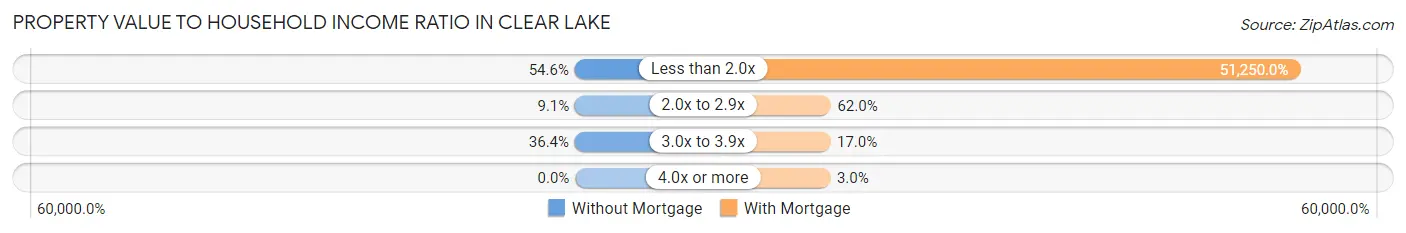
| Value-to-Income Ratio | Without Mortgage | With Mortgage |
| Less than 2.0x | 12 (54.5%) | 51,250 (51,250.0%) |
| 2.0x to 2.9x | 2 (9.1%) | 62 (62.0%) |
| 3.0x to 3.9x | 8 (36.4%) | 17 (17.0%) |
| 4.0x or more | 0 (0.0%) | 3 (3.0%) |
| Total | 22 (100.0%) | 100 (100.0%) |
Real Estate Taxes by Mortgage Status in Clear Lake
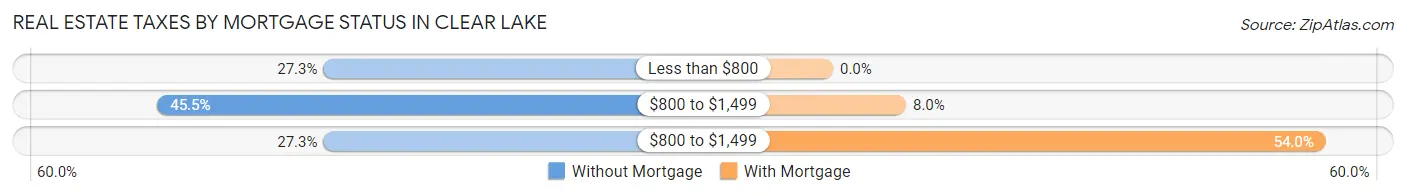
| Property Taxes | Without Mortgage | With Mortgage |
| Less than $800 | 6 (27.3%) | 0 (0.0%) |
| $800 to $1,499 | 10 (45.5%) | 8 (8.0%) |
| $800 to $1,499 | 6 (27.3%) | 54 (54.0%) |
| Total | 22 (100.0%) | 100 (100.0%) |
Health & Disability in Clear Lake
Health Insurance Coverage by Age in Clear Lake
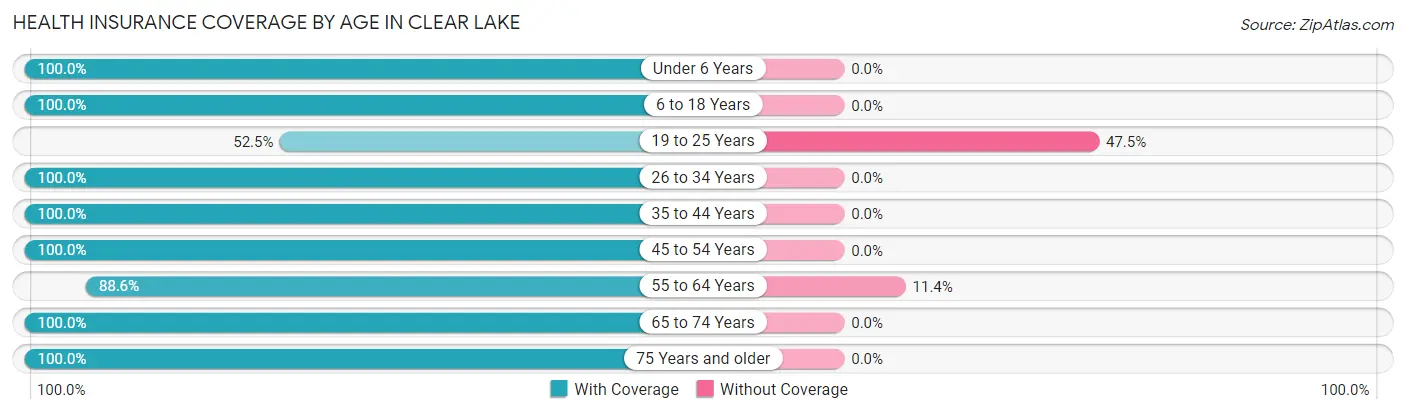
| Age Bracket | With Coverage | Without Coverage |
| Under 6 Years | 23 (100.0%) | 0 (0.0%) |
| 6 to 18 Years | 37 (100.0%) | 0 (0.0%) |
| 19 to 25 Years | 21 (52.5%) | 19 (47.5%) |
| 26 to 34 Years | 51 (100.0%) | 0 (0.0%) |
| 35 to 44 Years | 40 (100.0%) | 0 (0.0%) |
| 45 to 54 Years | 14 (100.0%) | 0 (0.0%) |
| 55 to 64 Years | 62 (88.6%) | 8 (11.4%) |
| 65 to 74 Years | 27 (100.0%) | 0 (0.0%) |
| 75 Years and older | 14 (100.0%) | 0 (0.0%) |
| Total | 289 (91.5%) | 27 (8.5%) |
Health Insurance Coverage by Citizenship Status in Clear Lake
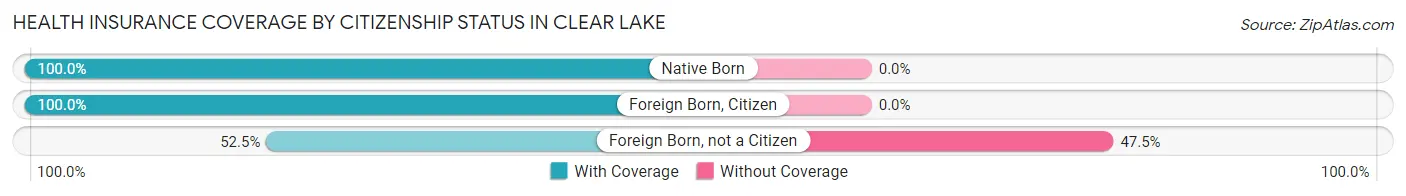
| Citizenship Status | With Coverage | Without Coverage |
| Native Born | 23 (100.0%) | 0 (0.0%) |
| Foreign Born, Citizen | 37 (100.0%) | 0 (0.0%) |
| Foreign Born, not a Citizen | 21 (52.5%) | 19 (47.5%) |
Health Insurance Coverage by Household Income in Clear Lake
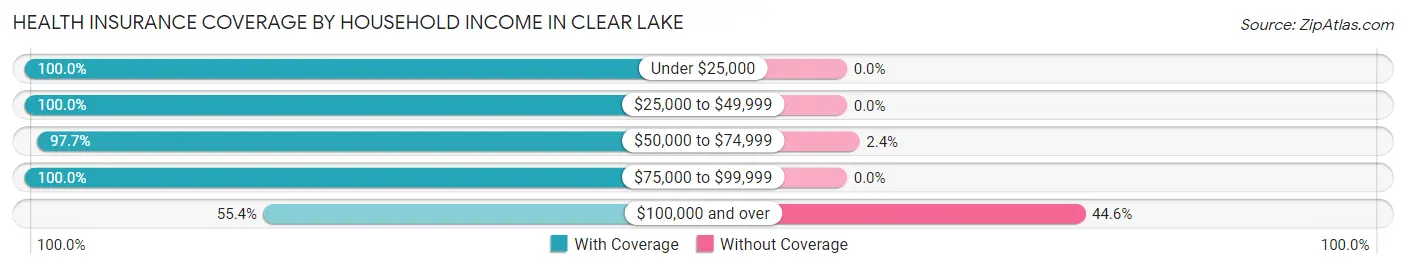
| Household Income | With Coverage | Without Coverage |
| Under $25,000 | 52 (100.0%) | 0 (0.0%) |
| $25,000 to $49,999 | 48 (100.0%) | 0 (0.0%) |
| $50,000 to $74,999 | 83 (97.7%) | 2 (2.4%) |
| $75,000 to $99,999 | 75 (100.0%) | 0 (0.0%) |
| $100,000 and over | 31 (55.4%) | 25 (44.6%) |
Public vs Private Health Insurance Coverage by Age in Clear Lake
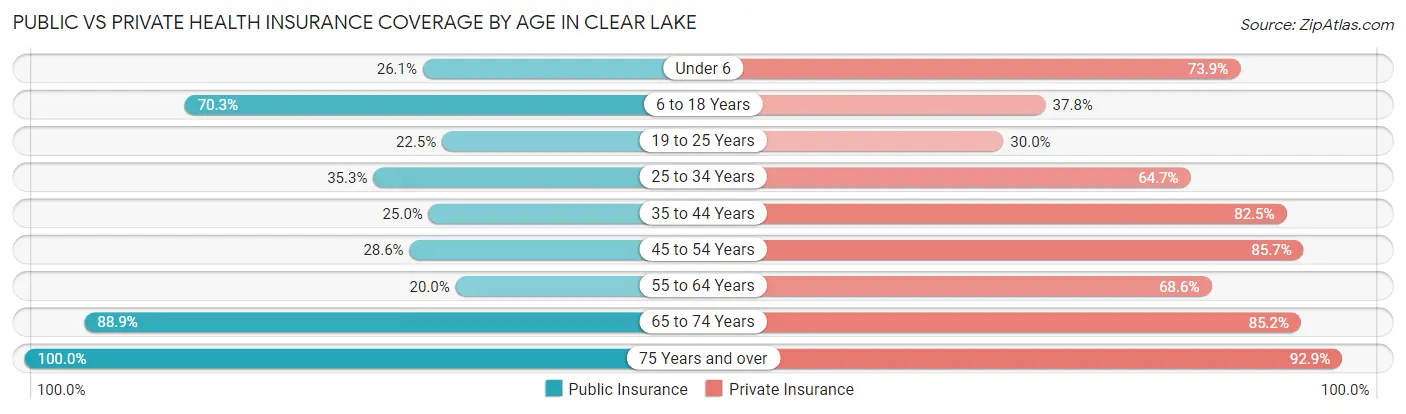
| Age Bracket | Public Insurance | Private Insurance |
| Under 6 | 6 (26.1%) | 17 (73.9%) |
| 6 to 18 Years | 26 (70.3%) | 14 (37.8%) |
| 19 to 25 Years | 9 (22.5%) | 12 (30.0%) |
| 25 to 34 Years | 18 (35.3%) | 33 (64.7%) |
| 35 to 44 Years | 10 (25.0%) | 33 (82.5%) |
| 45 to 54 Years | 4 (28.6%) | 12 (85.7%) |
| 55 to 64 Years | 14 (20.0%) | 48 (68.6%) |
| 65 to 74 Years | 24 (88.9%) | 23 (85.2%) |
| 75 Years and over | 14 (100.0%) | 13 (92.9%) |
| Total | 125 (39.6%) | 205 (64.9%) |
Disability Status by Sex by Age in Clear Lake
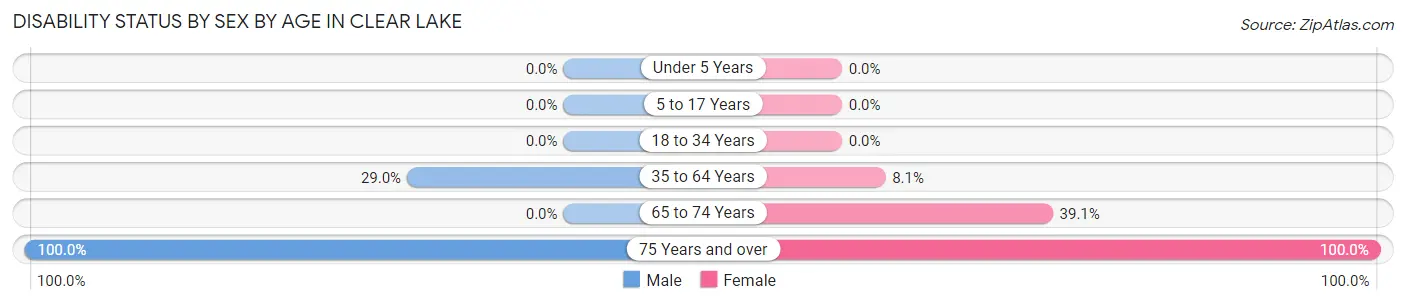
| Age Bracket | Male | Female |
| Under 5 Years | 0 (0.0%) | 0 (0.0%) |
| 5 to 17 Years | 0 (0.0%) | 0 (0.0%) |
| 18 to 34 Years | 0 (0.0%) | 0 (0.0%) |
| 35 to 64 Years | 18 (29.0%) | 5 (8.1%) |
| 65 to 74 Years | 0 (0.0%) | 9 (39.1%) |
| 75 Years and over | 8 (100.0%) | 6 (100.0%) |
Disability Class by Sex by Age in Clear Lake
Disability Class: Hearing Difficulty
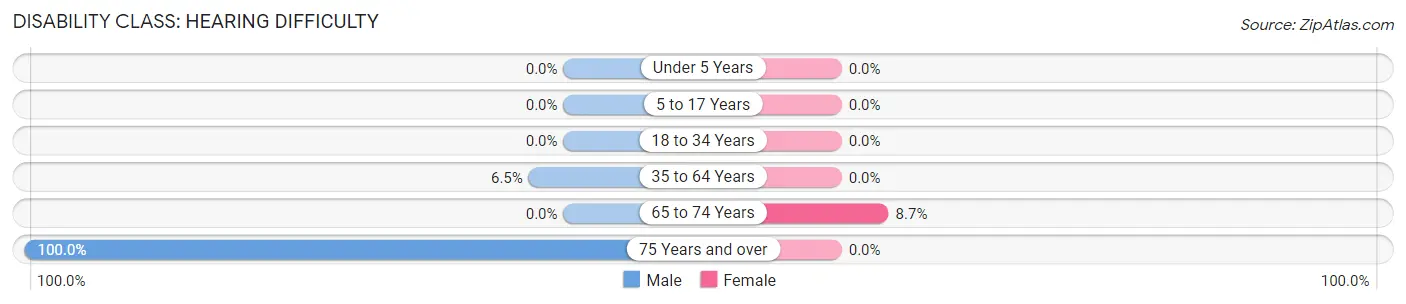
| Age Bracket | Male | Female |
| Under 5 Years | 0 (0.0%) | 0 (0.0%) |
| 5 to 17 Years | 0 (0.0%) | 0 (0.0%) |
| 18 to 34 Years | 0 (0.0%) | 0 (0.0%) |
| 35 to 64 Years | 4 (6.5%) | 0 (0.0%) |
| 65 to 74 Years | 0 (0.0%) | 2 (8.7%) |
| 75 Years and over | 8 (100.0%) | 0 (0.0%) |
Disability Class: Vision Difficulty
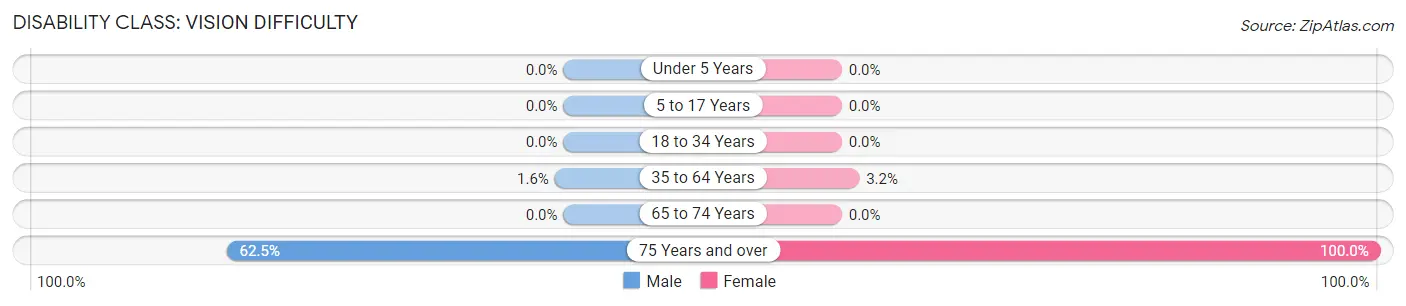
| Age Bracket | Male | Female |
| Under 5 Years | 0 (0.0%) | 0 (0.0%) |
| 5 to 17 Years | 0 (0.0%) | 0 (0.0%) |
| 18 to 34 Years | 0 (0.0%) | 0 (0.0%) |
| 35 to 64 Years | 1 (1.6%) | 2 (3.2%) |
| 65 to 74 Years | 0 (0.0%) | 0 (0.0%) |
| 75 Years and over | 5 (62.5%) | 6 (100.0%) |
Disability Class: Cognitive Difficulty
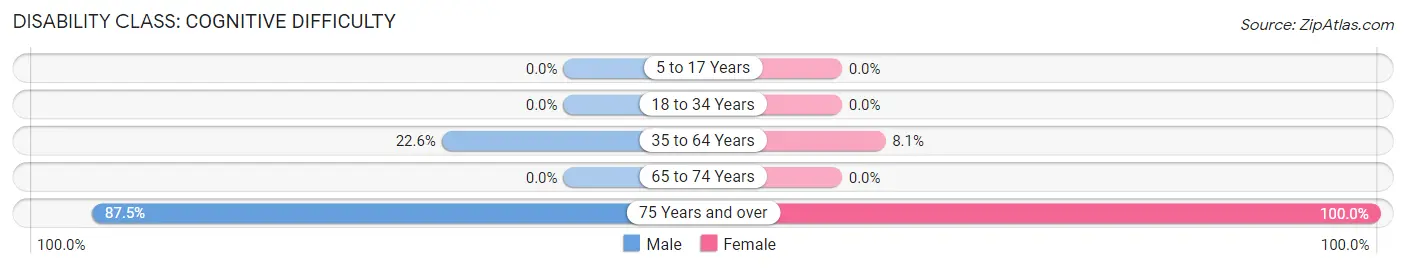
| Age Bracket | Male | Female |
| 5 to 17 Years | 0 (0.0%) | 0 (0.0%) |
| 18 to 34 Years | 0 (0.0%) | 0 (0.0%) |
| 35 to 64 Years | 14 (22.6%) | 5 (8.1%) |
| 65 to 74 Years | 0 (0.0%) | 0 (0.0%) |
| 75 Years and over | 7 (87.5%) | 6 (100.0%) |
Disability Class: Ambulatory Difficulty
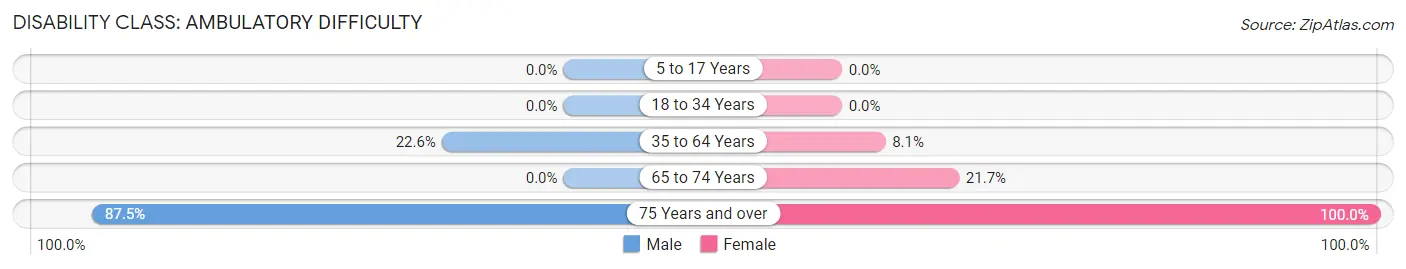
| Age Bracket | Male | Female |
| 5 to 17 Years | 0 (0.0%) | 0 (0.0%) |
| 18 to 34 Years | 0 (0.0%) | 0 (0.0%) |
| 35 to 64 Years | 14 (22.6%) | 5 (8.1%) |
| 65 to 74 Years | 0 (0.0%) | 5 (21.7%) |
| 75 Years and over | 7 (87.5%) | 6 (100.0%) |
Disability Class: Self-Care Difficulty
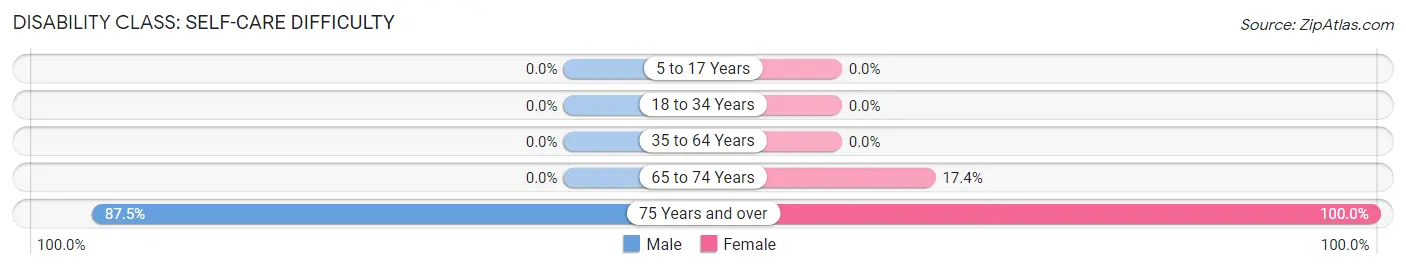
| Age Bracket | Male | Female |
| 5 to 17 Years | 0 (0.0%) | 0 (0.0%) |
| 18 to 34 Years | 0 (0.0%) | 0 (0.0%) |
| 35 to 64 Years | 0 (0.0%) | 0 (0.0%) |
| 65 to 74 Years | 0 (0.0%) | 4 (17.4%) |
| 75 Years and over | 7 (87.5%) | 6 (100.0%) |
Technology Access in Clear Lake
Computing Device Access in Clear Lake
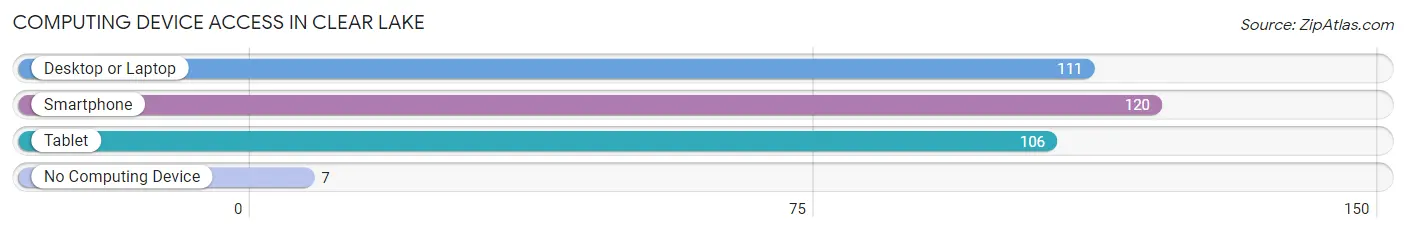
| Device Type | # Households | % Households |
| Desktop or Laptop | 111 | 78.2% |
| Smartphone | 120 | 84.5% |
| Tablet | 106 | 74.7% |
| No Computing Device | 7 | 4.9% |
| Total | 142 | 100.0% |
Internet Access in Clear Lake
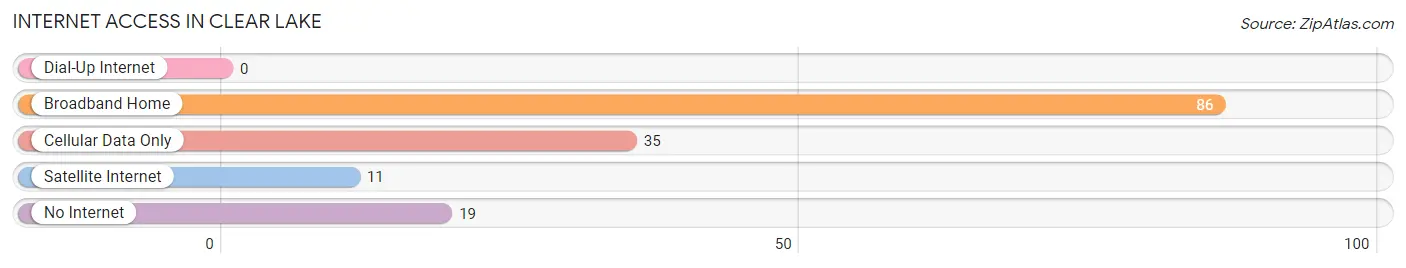
| Internet Type | # Households | % Households |
| Dial-Up Internet | 0 | 0.0% |
| Broadband Home | 86 | 60.6% |
| Cellular Data Only | 35 | 24.6% |
| Satellite Internet | 11 | 7.7% |
| No Internet | 19 | 13.4% |
| Total | 142 | 100.0% |
Clear Lake Summary
History
Clear Lake is a small village located in McHenry County, Illinois. It is situated on the banks of the Fox River, about 40 miles northwest of Chicago. The village was first settled in 1836 by a group of settlers from New York. The village was originally known as "Clear Lake Settlement" and was later changed to Clear Lake.
The village was incorporated in 1872 and was named after the nearby lake. The lake was named for its clear, blue waters. The village was a popular destination for vacationers in the late 19th and early 20th centuries. The village was also home to a number of resorts, including the Clear Lake Hotel, which was built in 1876.
The village was also home to a number of industries, including a brickyard, a sawmill, and a flour mill. The village was also home to a number of churches, including the First Congregational Church, which was founded in 1876.
Geography
Clear Lake is located in McHenry County, Illinois. It is situated on the banks of the Fox River, about 40 miles northwest of Chicago. The village is located in a rural area, with rolling hills and wooded areas. The village is surrounded by farmland and is home to a number of small lakes, including Clear Lake.
The village has a total area of 1.2 square miles, all of which is land. The village is located at an elevation of 745 feet above sea level.
Economy
The economy of Clear Lake is largely based on agriculture and tourism. The village is home to a number of farms, which produce a variety of crops, including corn, soybeans, and wheat. The village is also home to a number of small businesses, including restaurants, shops, and a golf course.
The village is also home to a number of tourist attractions, including the Clear Lake Hotel, which was built in 1876. The hotel is a popular destination for visitors, who come to enjoy the lake and the surrounding countryside.
Demographics
As of the 2010 census, the village had a population of 1,845. The population density was 1,521.7 people per square mile. The racial makeup of the village was 97.3% White, 0.2% African American, 0.2% Native American, 0.4% Asian, 0.1% Pacific Islander, 0.7% from other races, and 1.1% from two or more races. Hispanic or Latino of any race were 2.2% of the population.
The median income for a household in the village was $50,938, and the median income for a family was $60,000. The per capita income for the village was $25,938. About 4.3% of families and 5.7% of the population were below the poverty line, including 8.3% of those under age 18 and 4.2% of those age 65 or over.
Common Questions
What is Per Capita Income in Clear Lake?
Per Capita income in Clear Lake is $25,925.
What is the Median Family Income in Clear Lake?
Median Family Income in Clear Lake is $68,125.
What is the Median Household income in Clear Lake?
Median Household Income in Clear Lake is $55,625.
What is Income or Wage Gap in Clear Lake?
Income or Wage Gap in Clear Lake is 24.9%.
Women in Clear Lake earn 75.1 cents for every dollar earned by a man.
What is Family Income Deficit in Clear Lake?
Family Income Deficit in Clear Lake is $13,814.
Families that are below poverty line in Clear Lake earn $13,814 less on average than the poverty threshold level.
What is Inequality or Gini Index in Clear Lake?
Inequality or Gini Index in Clear Lake is 0.39.
What is the Total Population of Clear Lake?
Total Population of Clear Lake is 316.
What is the Total Male Population of Clear Lake?
Total Male Population of Clear Lake is 169.
What is the Total Female Population of Clear Lake?
Total Female Population of Clear Lake is 147.
What is the Ratio of Males per 100 Females in Clear Lake?
There are 114.97 Males per 100 Females in Clear Lake.
What is the Ratio of Females per 100 Males in Clear Lake?
There are 86.98 Females per 100 Males in Clear Lake.
What is the Median Population Age in Clear Lake?
Median Population Age in Clear Lake is 36.2 Years.
What is the Average Family Size in Clear Lake
Average Family Size in Clear Lake is 3.2 People.
What is the Average Household Size in Clear Lake
Average Household Size in Clear Lake is 2.2 People.
How Large is the Labor Force in Clear Lake?
There are 177 People in the Labor Forcein in Clear Lake.
What is the Percentage of People in the Labor Force in Clear Lake?
68.3% of People are in the Labor Force in Clear Lake.
What is the Unemployment Rate in Clear Lake?
Unemployment Rate in Clear Lake is 21.5%.