Zip Codes with the Highest Percentage of Population Employed in Administrative & Support Services in Champaign, IL
RELATED REPORTS & OPTIONS
Administrative & Support Services
Champaign
Compare Zip Codes
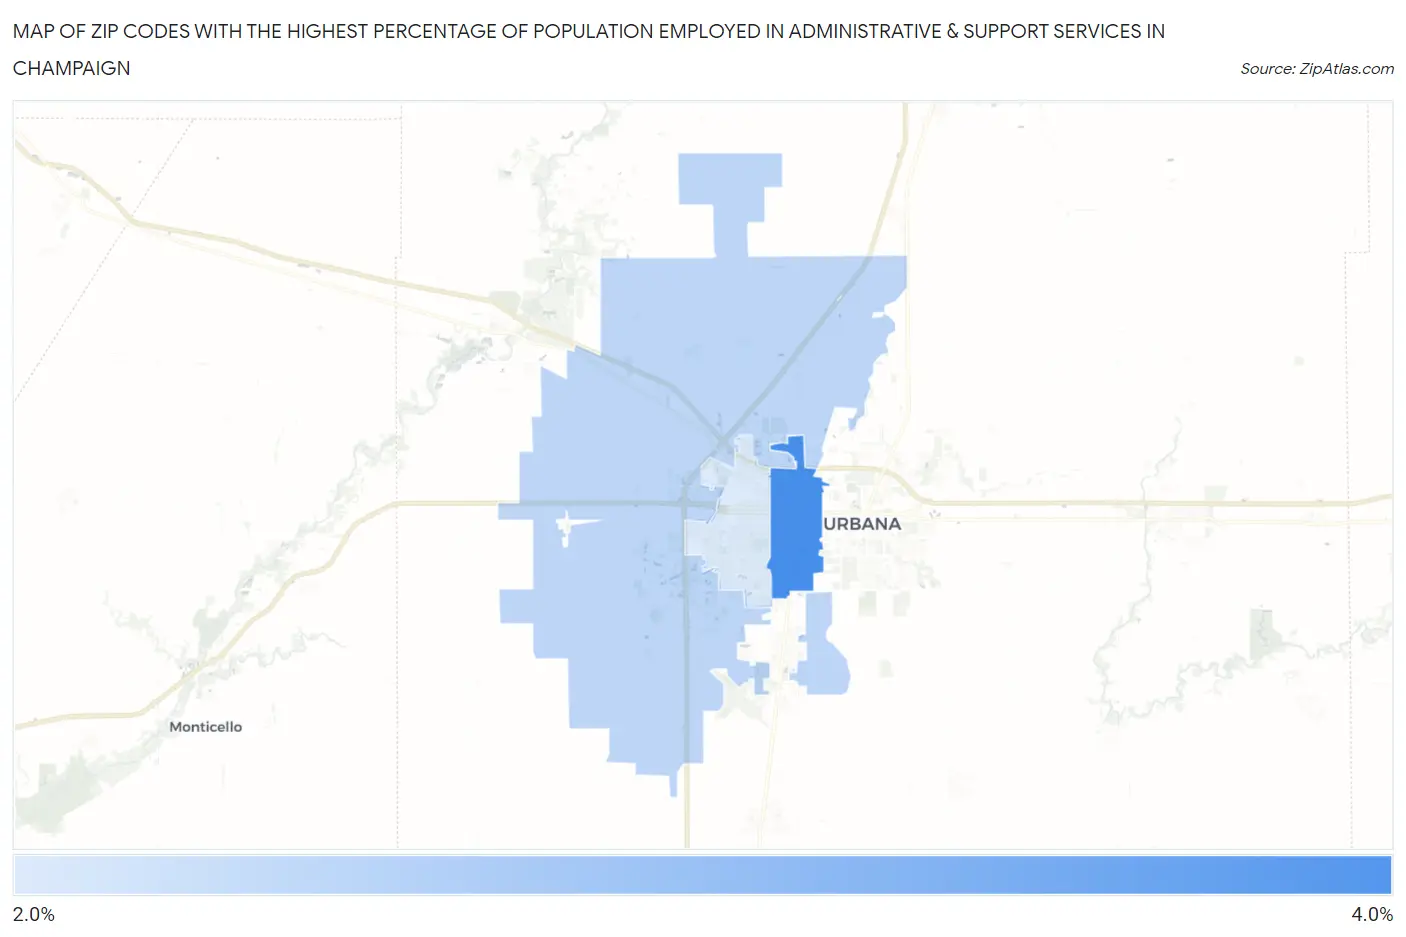
Map of Zip Codes with the Highest Percentage of Population Employed in Administrative & Support Services in Champaign
2.6%
3.4%
Zip Codes with the Highest Percentage of Population Employed in Administrative & Support Services in Champaign, IL
| Zip Code | % Employed | vs State | vs National | |
| 1. | 61820 | 3.4% | 4.0%(-0.608)#516 | 4.1%(-0.741)#13,393 |
| 2. | 61822 | 2.7% | 4.0%(-1.28)#685 | 4.1%(-1.41)#16,893 |
| 3. | 61821 | 2.6% | 4.0%(-1.47)#728 | 4.1%(-1.60)#17,872 |
1
Common Questions
What are the Top Zip Codes with the Highest Percentage of Population Employed in Administrative & Support Services in Champaign, IL?
Top Zip Codes with the Highest Percentage of Population Employed in Administrative & Support Services in Champaign, IL are:
What zip code has the Highest Percentage of Population Employed in Administrative & Support Services in Champaign, IL?
61820 has the Highest Percentage of Population Employed in Administrative & Support Services in Champaign, IL with 3.4%.
What is the Percentage of Population Employed in Administrative & Support Services in Champaign, IL?
Percentage of Population Employed in Administrative & Support Services in Champaign is 2.8%.
What is the Percentage of Population Employed in Administrative & Support Services in Illinois?
Percentage of Population Employed in Administrative & Support Services in Illinois is 4.0%.
What is the Percentage of Population Employed in Administrative & Support Services in the United States?
Percentage of Population Employed in Administrative & Support Services in the United States is 4.1%.