Zip Codes with the Highest Percentage of Population Employed in Administrative & Support Services in Glenview, IL
RELATED REPORTS & OPTIONS
Administrative & Support Services
Glenview
Compare Zip Codes
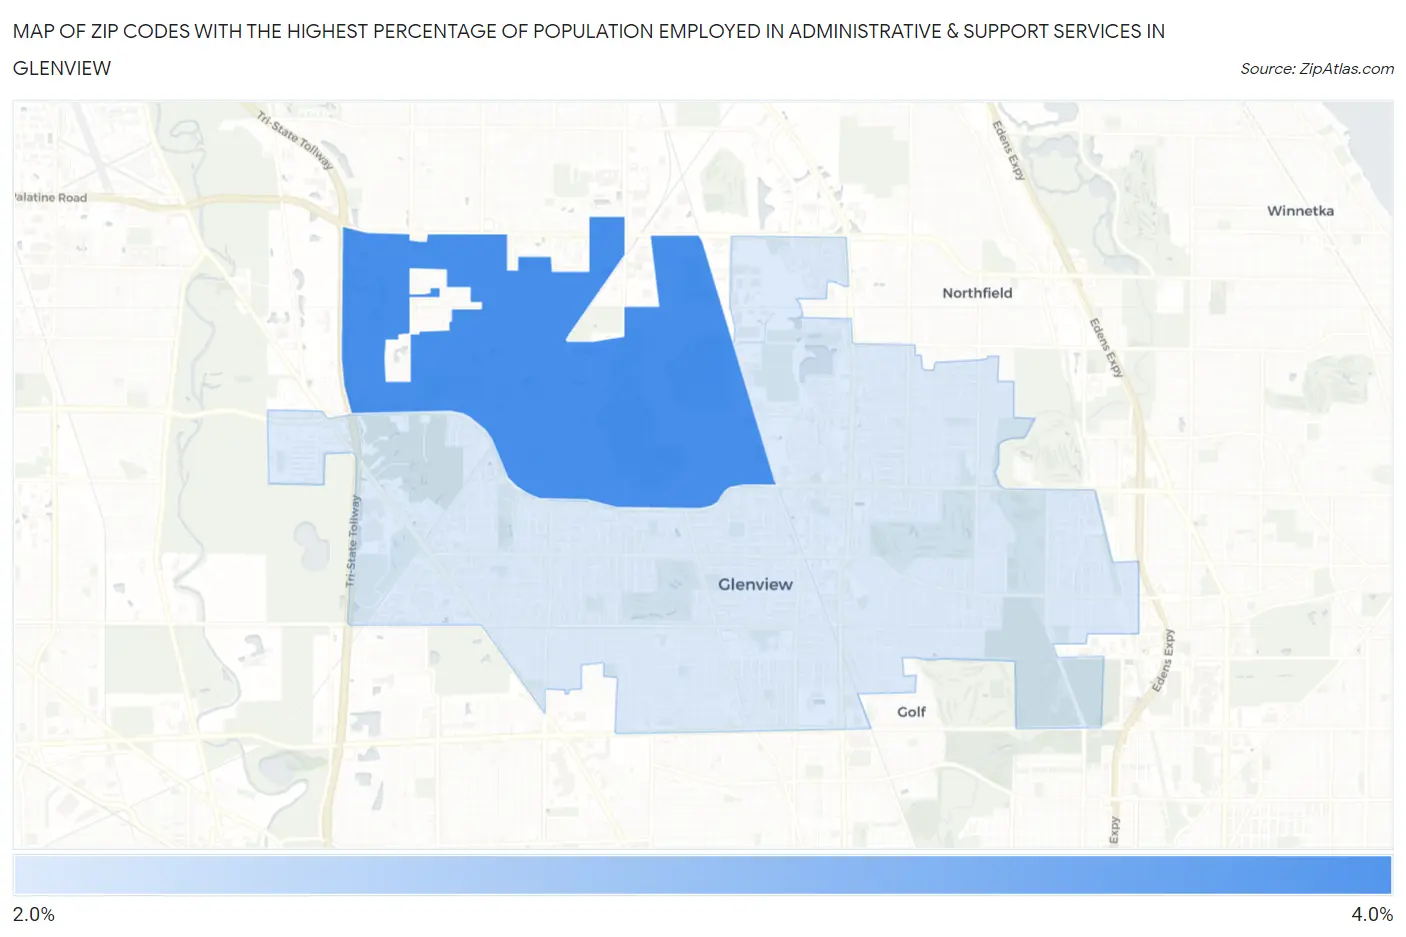
Map of Zip Codes with the Highest Percentage of Population Employed in Administrative & Support Services in Glenview
2.3%
3.4%
Zip Codes with the Highest Percentage of Population Employed in Administrative & Support Services in Glenview, IL
| Zip Code | % Employed | vs State | vs National | |
| 1. | 60026 | 3.4% | 4.0%(-0.637)#526 | 4.1%(-0.769)#13,544 |
| 2. | 60025 | 2.3% | 4.0%(-1.68)#787 | 4.1%(-1.82)#19,028 |
1
Common Questions
What are the Top Zip Codes with the Highest Percentage of Population Employed in Administrative & Support Services in Glenview, IL?
Top Zip Codes with the Highest Percentage of Population Employed in Administrative & Support Services in Glenview, IL are:
What zip code has the Highest Percentage of Population Employed in Administrative & Support Services in Glenview, IL?
60026 has the Highest Percentage of Population Employed in Administrative & Support Services in Glenview, IL with 3.4%.
What is the Percentage of Population Employed in Administrative & Support Services in Glenview, IL?
Percentage of Population Employed in Administrative & Support Services in Glenview is 2.1%.
What is the Percentage of Population Employed in Administrative & Support Services in Illinois?
Percentage of Population Employed in Administrative & Support Services in Illinois is 4.0%.
What is the Percentage of Population Employed in Administrative & Support Services in the United States?
Percentage of Population Employed in Administrative & Support Services in the United States is 4.1%.