Zip Codes with the Highest Percentage of Population Employed in Administrative & Support Services in Aurora, IL

RELATED REPORTS & OPTIONS

Administrative & Support Services
Population
Families and Households
Female Fertility
Female Fertility (Unmarried)
Race (Community Size)
Race (Percentage)
Ancestry (Community Size)
AfricanAlbanianAmericanArabArgentineanArmenianAustrianBelgianBhutaneseBlackfeetBolivianBritishBulgarianBurmeseCambodianCanadianCentral AmericanCentral American IndianCherokeeChippewaColombianCroatianCubanCzechCzechoslovakianDanishDominicanDutchEastern EuropeanEcuadorianEnglishEuropeanFinnishFrenchFrench CanadianGermanGreekGuatemalanHonduranHungarianIndian (Asian)IndonesianIranianIraqiIrishItalianJamaicanKoreanLaotianLebaneseLithuanianLuxembourgerMacedonianMalaysianMexicanMexican American IndianNative HawaiianNavajoNicaraguanNigerianNorthern EuropeanNorwegianPakistaniPalestinianPennsylvania GermanPeruvianPolishPortuguesePuerto RicanRomanianRussianSalvadoranScandinavianScotch-IrishScottishSerbianSiouxSlavicSlovakSloveneSouth AmericanSpaniardSpanishSri LankanSubsaharan AfricanSwedishSwissSyrianThaiTrinidadian and TobagonianTurkishUgandanUkrainianVenezuelanVietnameseWelshYugoslavian
Ancestry (Percentage)
AfricanAlbanianAmericanArabArgentineanArmenianAustrianBelgianBhutaneseBlackfeetBolivianBritishBulgarianBurmeseCambodianCanadianCentral AmericanCentral American IndianCherokeeChippewaColombianCroatianCubanCzechCzechoslovakianDanishDominicanDutchEastern EuropeanEcuadorianEnglishEuropeanFinnishFrenchFrench CanadianGermanGreekGuatemalanHonduranHungarianIndian (Asian)IndonesianIranianIraqiIrishItalianJamaicanKoreanLaotianLebaneseLithuanianLuxembourgerMacedonianMalaysianMexicanMexican American IndianNative HawaiianNavajoNicaraguanNigerianNorthern EuropeanNorwegianPakistaniPalestinianPennsylvania GermanPeruvianPolishPortuguesePuerto RicanRomanianRussianSalvadoranScandinavianScotch-IrishScottishSerbianSiouxSlavicSlovakSloveneSouth AmericanSpaniardSpanishSri LankanSubsaharan AfricanSwedishSwissSyrianThaiTrinidadian and TobagonianTurkishUgandanUkrainianVenezuelanVietnameseWelshYugoslavian
Immigrant Origin (Total)
Immigrant Origin (Percentage)
Income
Income (Families)
Income (Households)
Poverty
Poverty (Families)
Unemployment
Employment Occupations
Employment Industries
Employer Class
Commute Time
Commute Means
School Enrollment
Education by Degree Field
Occupancy
Finances
Physical Characteristics
Aurora
Compare Zip Codes
Comparison Subject

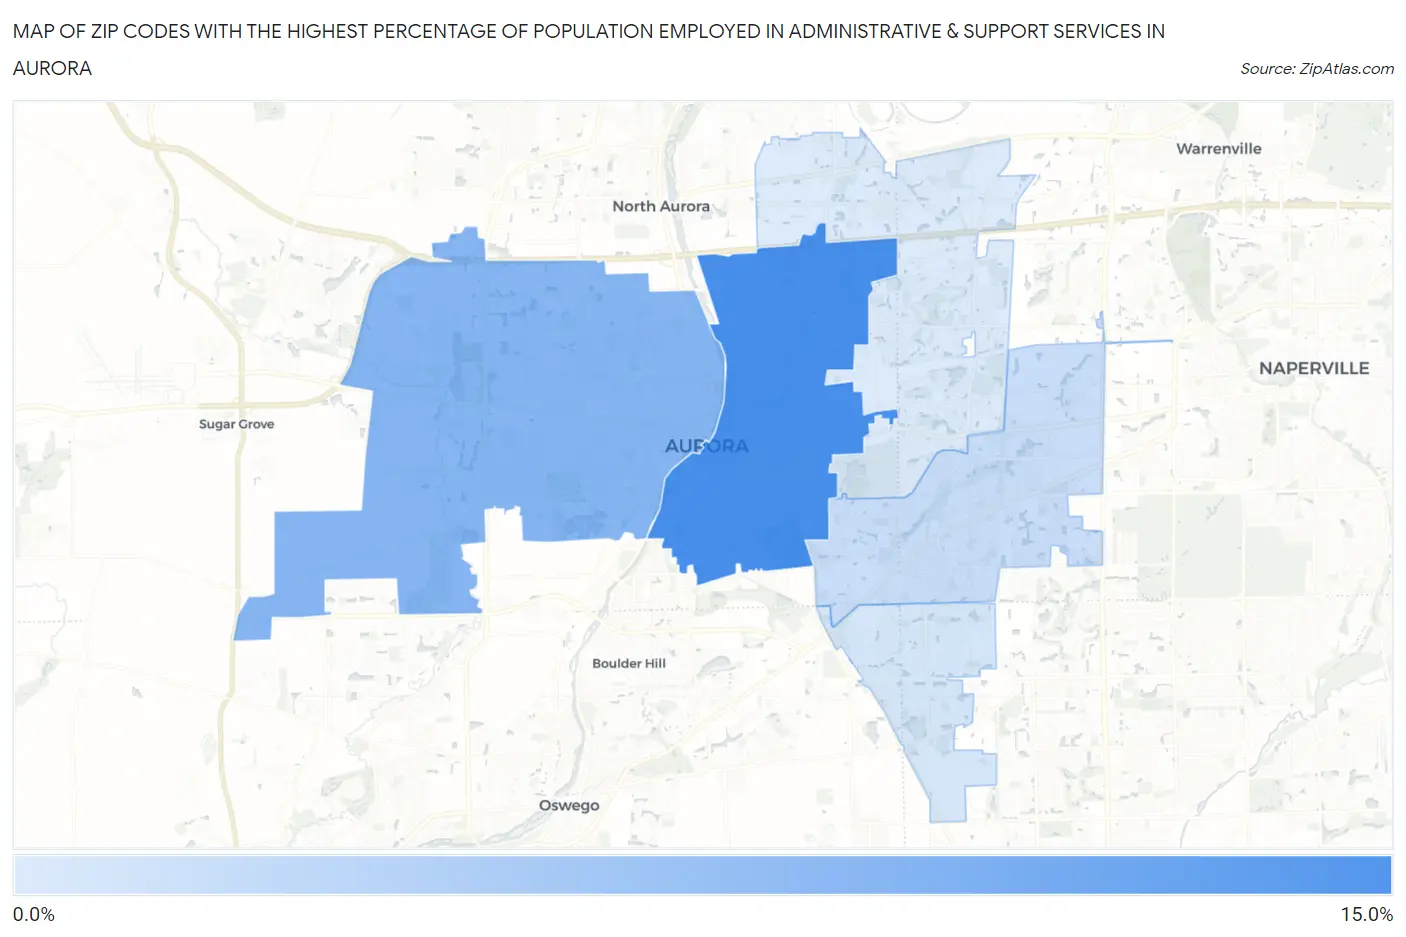
Map of Zip Codes with the Highest Percentage of Population Employed in Administrative & Support Services in Aurora

0.0%
15.0%
Zip Codes with the Highest Percentage of Population Employed in Administrative & Support Services in Aurora Map

Zip Codes with the Highest Percentage of Population Employed in Administrative & Support Services in Aurora, IL

Zip Code % Employed vs State vs National
1.6050510.2%4.0%(+6.19)#404.1%(+6.06)#1,223
2.605066.8%4.0%(+2.83)#1264.1%(+2.70)#3,420
3.605043.5%4.0%(-0.530)#4974.1%(-0.663)#13,037
4.605032.7%4.0%(-1.28)#6864.1%(-1.42)#16,915
5.605022.4%4.0%(-1.60)#7644.1%(-1.74)#18,575

Common Questions

What are the Top 3 Zip Codes with the Highest Percentage of Population Employed in Administrative & Support Services in Aurora, IL?
Top 3 Zip Codes with the Highest Percentage of Population Employed in Administrative & Support Services in Aurora, IL are:
#1
10.2%
#2
6.8%
#3
3.5%
What zip code has the Highest Percentage of Population Employed in Administrative & Support Services in Aurora, IL?
60505 has the Highest Percentage of Population Employed in Administrative & Support Services in Aurora, IL with 10.2%.
What is the Percentage of Population Employed in Administrative & Support Services in Aurora, IL?
Percentage of Population Employed in Administrative & Support Services in Aurora is 6.0%.
What is the Percentage of Population Employed in Administrative & Support Services in Illinois?
Percentage of Population Employed in Administrative & Support Services in Illinois is 4.0%.
What is the Percentage of Population Employed in Administrative & Support Services in the United States?
Percentage of Population Employed in Administrative & Support Services in the United States is 4.1%.