Zip Codes with the Highest Percentage of Population Employed in Administrative & Support Services in Downers Grove, IL
RELATED REPORTS & OPTIONS
Administrative & Support Services
Downers Grove
Compare Zip Codes
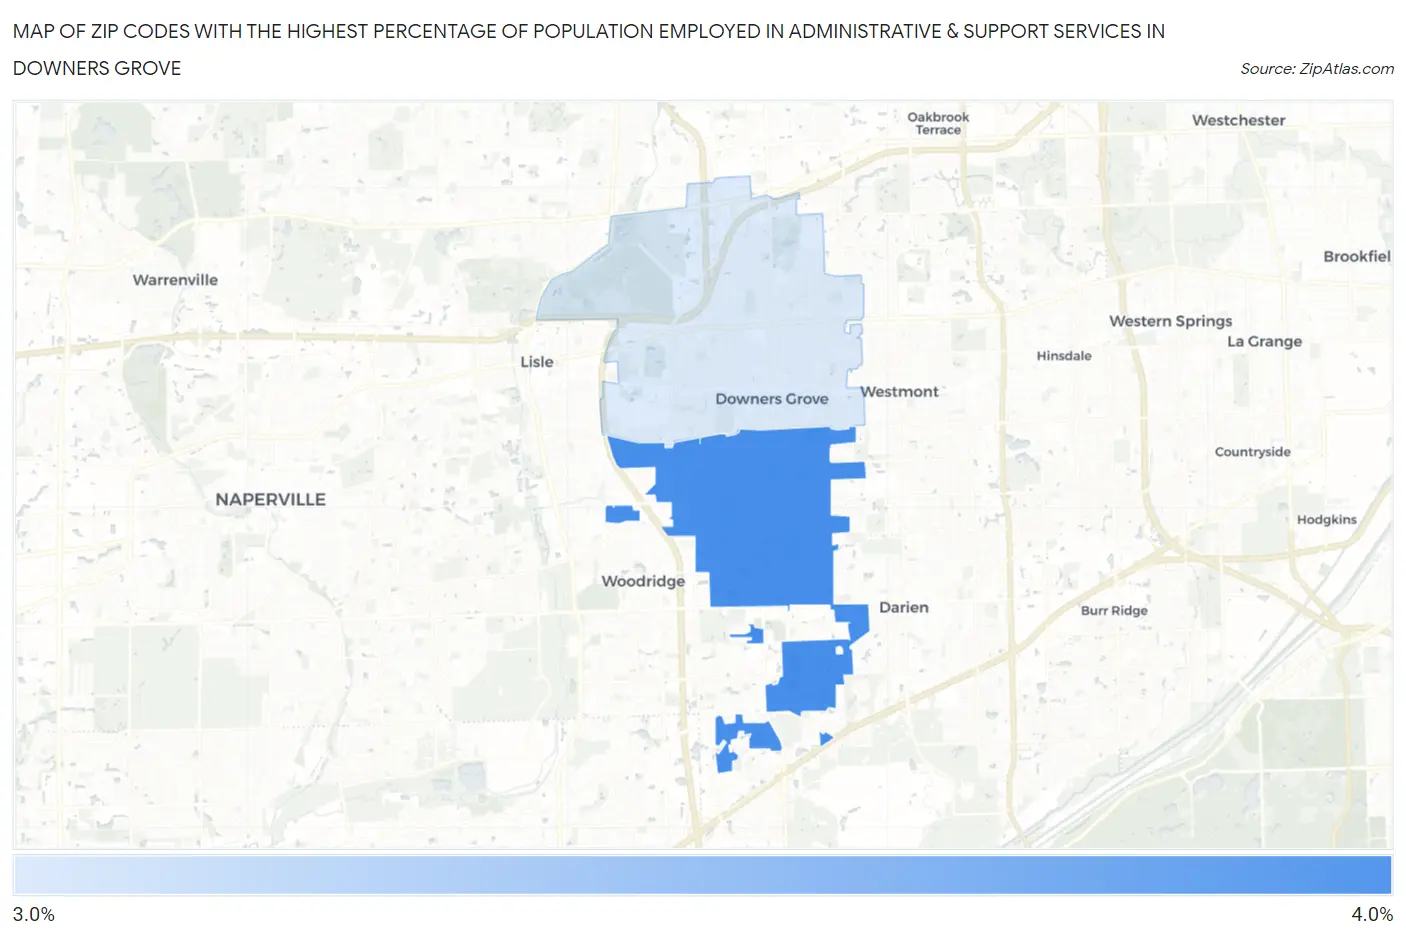
Map of Zip Codes with the Highest Percentage of Population Employed in Administrative & Support Services in Downers Grove
3.4%
3.6%
Zip Codes with the Highest Percentage of Population Employed in Administrative & Support Services in Downers Grove, IL
| Zip Code | % Employed | vs State | vs National | |
| 1. | 60516 | 3.6% | 4.0%(-0.380)#464 | 4.1%(-0.512)#12,288 |
| 2. | 60515 | 3.4% | 4.0%(-0.606)#515 | 4.1%(-0.739)#13,382 |
1
Common Questions
What are the Top Zip Codes with the Highest Percentage of Population Employed in Administrative & Support Services in Downers Grove, IL?
Top Zip Codes with the Highest Percentage of Population Employed in Administrative & Support Services in Downers Grove, IL are:
What zip code has the Highest Percentage of Population Employed in Administrative & Support Services in Downers Grove, IL?
60516 has the Highest Percentage of Population Employed in Administrative & Support Services in Downers Grove, IL with 3.6%.
What is the Percentage of Population Employed in Administrative & Support Services in Downers Grove, IL?
Percentage of Population Employed in Administrative & Support Services in Downers Grove is 3.7%.
What is the Percentage of Population Employed in Administrative & Support Services in Illinois?
Percentage of Population Employed in Administrative & Support Services in Illinois is 4.0%.
What is the Percentage of Population Employed in Administrative & Support Services in the United States?
Percentage of Population Employed in Administrative & Support Services in the United States is 4.1%.