Leland, IL Map & Demographics
Leland Map
Leland Overview
$32,927
PER CAPITA INCOME
$80,417
AVG FAMILY INCOME
$75,250
AVG HOUSEHOLD INCOME
54.0%
WAGE / INCOME GAP [ % ]
46.0¢/ $1
WAGE / INCOME GAP [ $ ]
0.37
INEQUALITY / GINI INDEX
1,156
TOTAL POPULATION
554
MALE POPULATION
602
FEMALE POPULATION
92.03
MALES / 100 FEMALES
108.66
FEMALES / 100 MALES
39.3
MEDIAN AGE
2.9
AVG FAMILY SIZE
2.5
AVG HOUSEHOLD SIZE
603
LABOR FORCE [ PEOPLE ]
63.9%
PERCENT IN LABOR FORCE
8.3%
UNEMPLOYMENT RATE
Leland Zip Codes
Leland Area Codes
Income in Leland
Income Overview in Leland
Per Capita Income in Leland is $32,927, while median incomes of families and households are $80,417 and $75,250 respectively.
| Characteristic | Number | Measure |
| Per Capita Income | 1,156 | $32,927 |
| Median Family Income | 340 | $80,417 |
| Mean Family Income | 340 | $92,592 |
| Median Household Income | 462 | $75,250 |
| Mean Household Income | 462 | $82,440 |
| Income Deficit | 340 | $0 |
| Wage / Income Gap (%) | 1,156 | 53.99% |
| Wage / Income Gap ($) | 1,156 | 46.01¢ per $1 |
| Gini / Inequality Index | 1,156 | 0.37 |
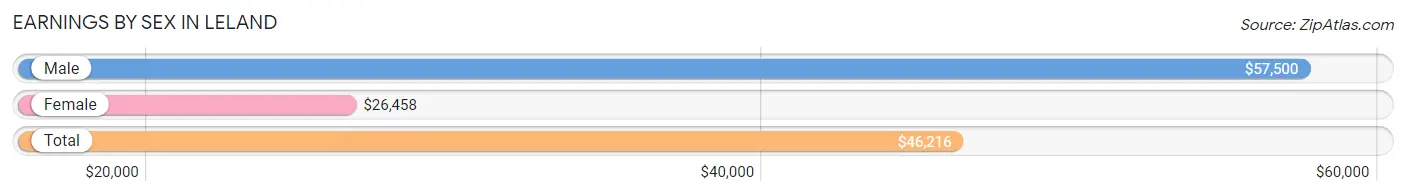
Earnings by Sex in Leland
Average Earnings in Leland are $46,216, $57,500 for men and $26,458 for women, a difference of 54.0%.
| Sex | Number | Average Earnings |
| Male | 398 (62.0%) | $57,500 |
| Female | 244 (38.0%) | $26,458 |
| Total | 642 (100.0%) | $46,216 |
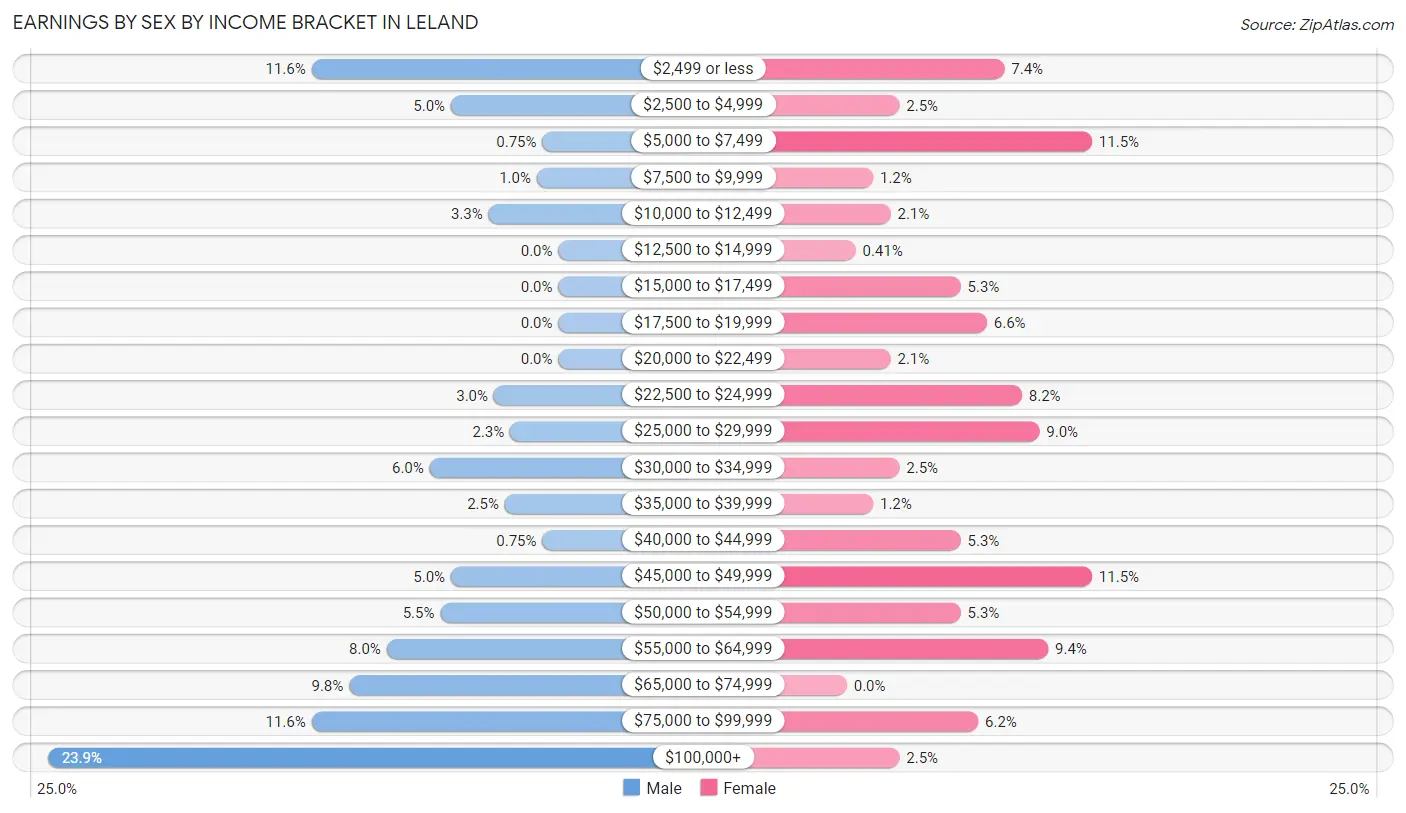
Earnings by Sex by Income Bracket in Leland
The most common earnings brackets in Leland are $100,000+ for men (95 | 23.9%) and $5,000 to $7,499 for women (28 | 11.5%).
| Income | Male | Female |
| $2,499 or less | 46 (11.6%) | 18 (7.4%) |
| $2,500 to $4,999 | 20 (5.0%) | 6 (2.5%) |
| $5,000 to $7,499 | 3 (0.7%) | 28 (11.5%) |
| $7,500 to $9,999 | 4 (1.0%) | 3 (1.2%) |
| $10,000 to $12,499 | 13 (3.3%) | 5 (2.1%) |
| $12,500 to $14,999 | 0 (0.0%) | 1 (0.4%) |
| $15,000 to $17,499 | 0 (0.0%) | 13 (5.3%) |
| $17,500 to $19,999 | 0 (0.0%) | 16 (6.6%) |
| $20,000 to $22,499 | 0 (0.0%) | 5 (2.1%) |
| $22,500 to $24,999 | 12 (3.0%) | 20 (8.2%) |
| $25,000 to $29,999 | 9 (2.3%) | 22 (9.0%) |
| $30,000 to $34,999 | 24 (6.0%) | 6 (2.5%) |
| $35,000 to $39,999 | 10 (2.5%) | 3 (1.2%) |
| $40,000 to $44,999 | 3 (0.7%) | 13 (5.3%) |
| $45,000 to $49,999 | 20 (5.0%) | 28 (11.5%) |
| $50,000 to $54,999 | 22 (5.5%) | 13 (5.3%) |
| $55,000 to $64,999 | 32 (8.0%) | 23 (9.4%) |
| $65,000 to $74,999 | 39 (9.8%) | 0 (0.0%) |
| $75,000 to $99,999 | 46 (11.6%) | 15 (6.1%) |
| $100,000+ | 95 (23.9%) | 6 (2.5%) |
| Total | 398 (100.0%) | 244 (100.0%) |
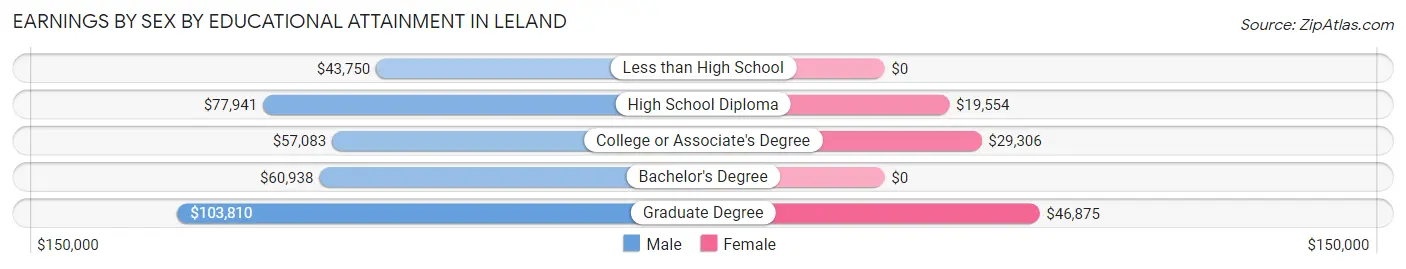
Earnings by Sex by Educational Attainment in Leland
Average earnings in Leland are $66,538 for men and $25,313 for women, a difference of 62.0%. Men with an educational attainment of graduate degree enjoy the highest average annual earnings of $103,810, while those with less than high school education earn the least with $43,750. Women with an educational attainment of graduate degree earn the most with the average annual earnings of $46,875, while those with high school diploma education have the smallest earnings of $19,554.
| Educational Attainment | Male Income | Female Income |
| Less than High School | $43,750 | $0 |
| High School Diploma | $77,941 | $19,554 |
| College or Associate's Degree | $57,083 | $29,306 |
| Bachelor's Degree | $60,938 | $0 |
| Graduate Degree | $103,810 | $46,875 |
| Total | $66,538 | $25,313 |
Family Income in Leland
Family Income Brackets in Leland
According to the Leland family income data, there are 98 families falling into the $100,000 to $149,999 income range, which is the most common income bracket and makes up 28.8% of all families.
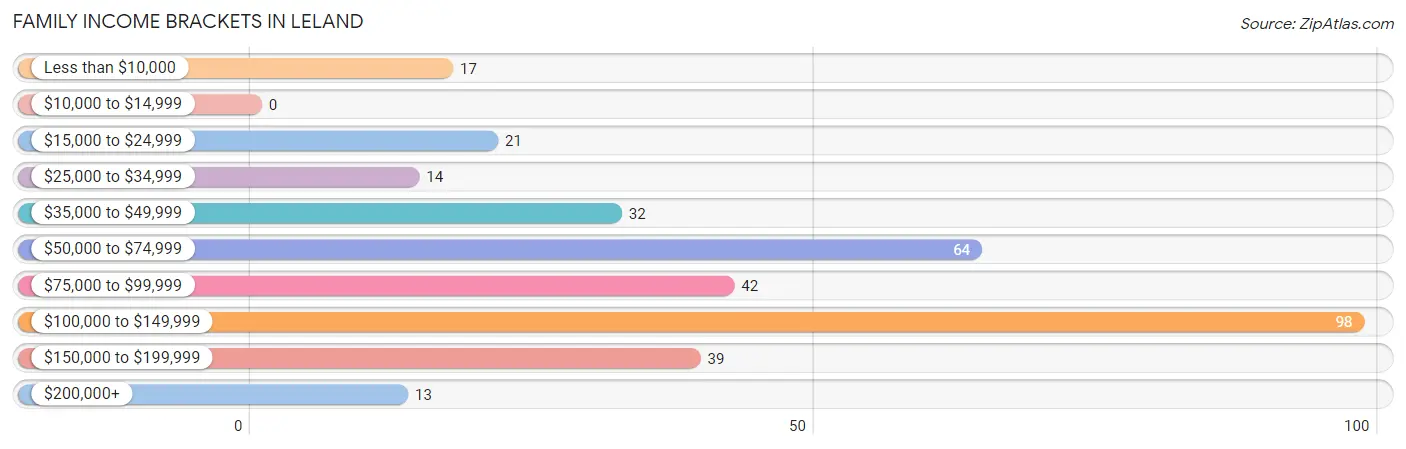
| Income Bracket | # Families | % Families |
| Less than $10,000 | 17 | 5.0% |
| $10,000 to $14,999 | 0 | 0.0% |
| $15,000 to $24,999 | 21 | 6.2% |
| $25,000 to $34,999 | 14 | 4.1% |
| $35,000 to $49,999 | 32 | 9.4% |
| $50,000 to $74,999 | 64 | 18.8% |
| $75,000 to $99,999 | 42 | 12.4% |
| $100,000 to $149,999 | 98 | 28.8% |
| $150,000 to $199,999 | 39 | 11.5% |
| $200,000+ | 13 | 3.8% |
Family Income by Famaliy Size in Leland
4-person families (46 | 13.5%) account for the highest median family income in Leland with $156,875 per family, while 4-person families (46 | 13.5%) have the highest median income of $39,219 per family member.
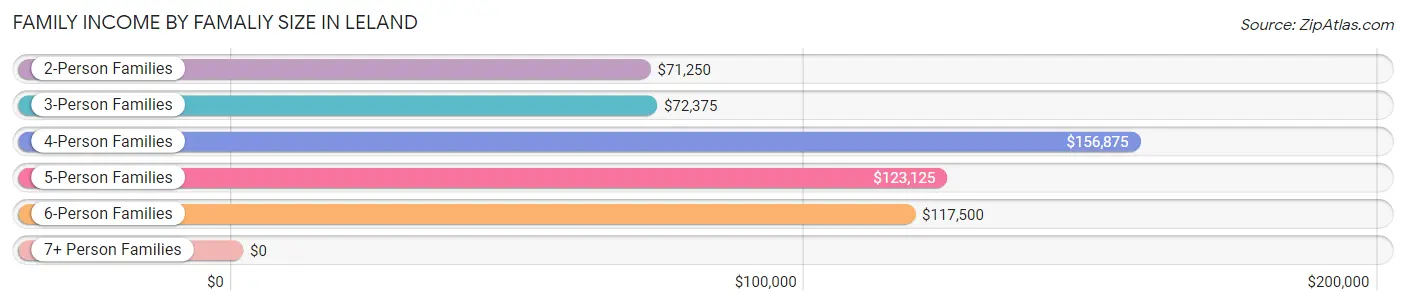
| Income Bracket | # Families | Median Income |
| 2-Person Families | 164 (48.2%) | $71,250 |
| 3-Person Families | 99 (29.1%) | $72,375 |
| 4-Person Families | 46 (13.5%) | $156,875 |
| 5-Person Families | 14 (4.1%) | $123,125 |
| 6-Person Families | 10 (2.9%) | $117,500 |
| 7+ Person Families | 7 (2.1%) | $0 |
| Total | 340 (100.0%) | $80,417 |
Family Income by Number of Earners in Leland
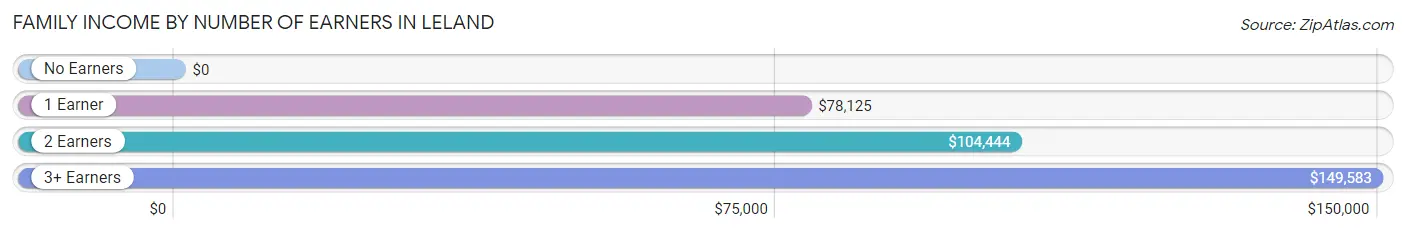
| Number of Earners | # Families | Median Income |
| No Earners | 37 (10.9%) | $0 |
| 1 Earner | 130 (38.2%) | $78,125 |
| 2 Earners | 154 (45.3%) | $104,444 |
| 3+ Earners | 19 (5.6%) | $149,583 |
| Total | 340 (100.0%) | $80,417 |
Household Income in Leland
Household Income Brackets in Leland
With 116 households falling in the category, the $100,000 to $149,999 income range is the most frequent in Leland, accounting for 25.1% of all households. In contrast, only 8 households (1.7%) fall into the $10,000 to $14,999 income bracket, making it the least populous group.
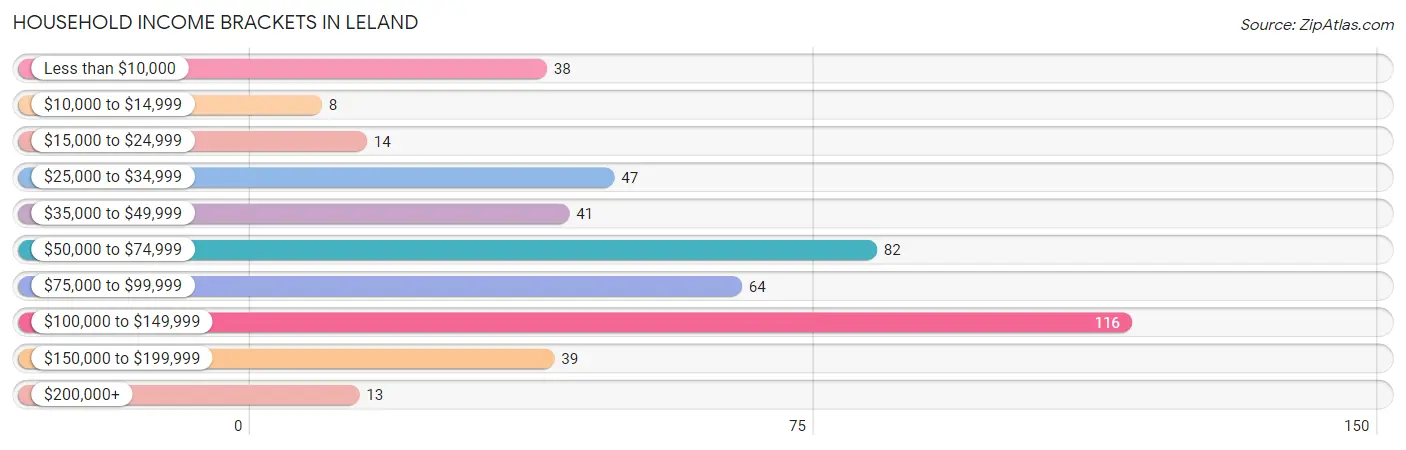
| Income Bracket | # Households | % Households |
| Less than $10,000 | 38 | 8.2% |
| $10,000 to $14,999 | 8 | 1.7% |
| $15,000 to $24,999 | 14 | 3.0% |
| $25,000 to $34,999 | 47 | 10.2% |
| $35,000 to $49,999 | 41 | 8.9% |
| $50,000 to $74,999 | 82 | 17.7% |
| $75,000 to $99,999 | 64 | 13.9% |
| $100,000 to $149,999 | 116 | 25.1% |
| $150,000 to $199,999 | 39 | 8.4% |
| $200,000+ | 13 | 2.8% |
Household Income by Householder Age in Leland
The median household income in Leland is $75,250, with the highest median household income of $114,185 found in the 25 to 44 years age bracket for the primary householder. A total of 167 households (36.1%) fall into this category. Meanwhile, the 15 to 24 years age bracket for the primary householder has the lowest median household income of $0, with 8 households (1.7%) in this group.
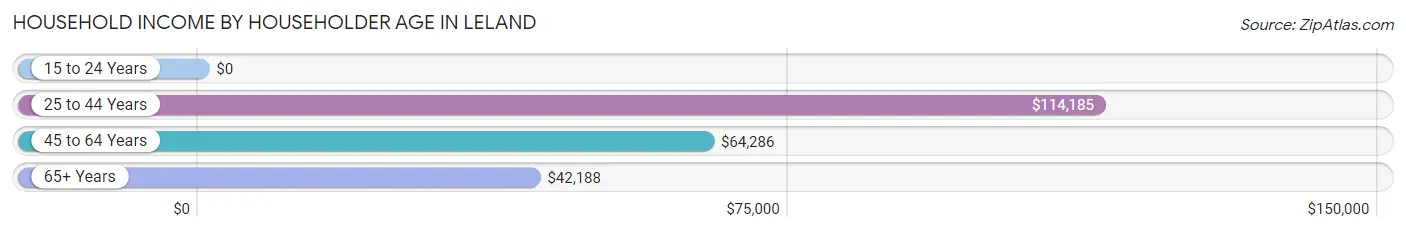
| Income Bracket | # Households | Median Income |
| 15 to 24 Years | 8 (1.7%) | $0 |
| 25 to 44 Years | 167 (36.1%) | $114,185 |
| 45 to 64 Years | 204 (44.2%) | $64,286 |
| 65+ Years | 83 (18.0%) | $42,188 |
| Total | 462 (100.0%) | $75,250 |
Poverty in Leland
Income Below Poverty by Sex and Age in Leland
With 4.9% poverty level for males and 14.1% for females among the residents of Leland, under 5 year old males and under 5 year old females are the most vulnerable to poverty, with 6 males (60.0%) and 15 females (35.7%) in their respective age groups living below the poverty level.
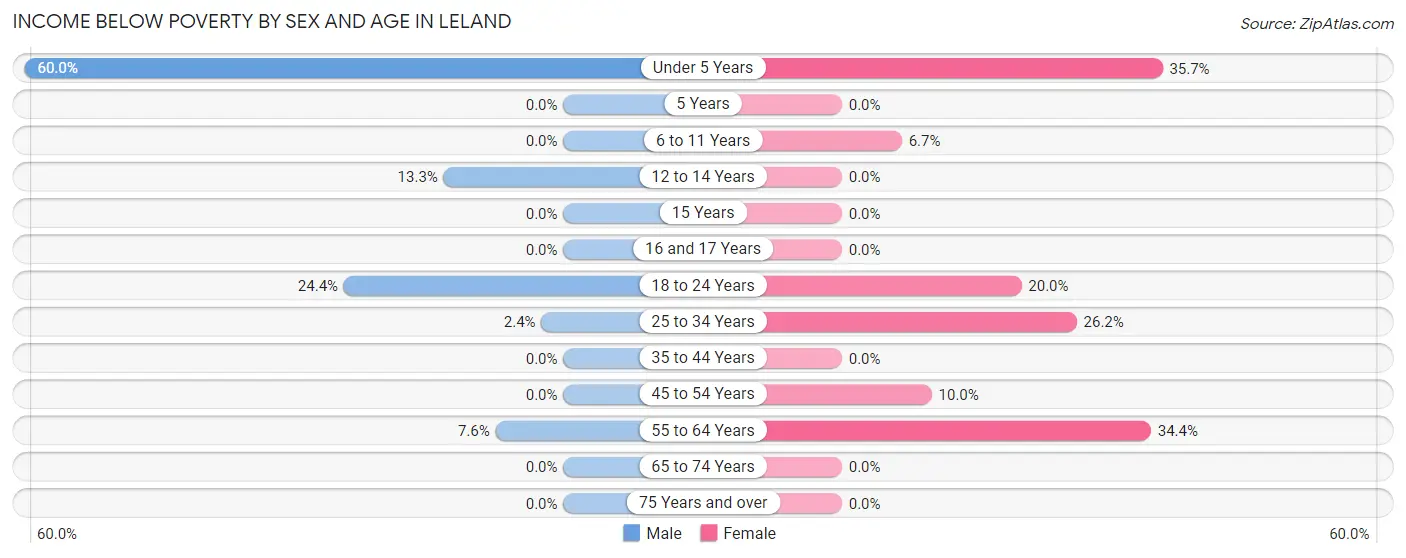
| Age Bracket | Male | Female |
| Under 5 Years | 6 (60.0%) | 15 (35.7%) |
| 5 Years | 0 (0.0%) | 0 (0.0%) |
| 6 to 11 Years | 0 (0.0%) | 3 (6.7%) |
| 12 to 14 Years | 4 (13.3%) | 0 (0.0%) |
| 15 Years | 0 (0.0%) | 0 (0.0%) |
| 16 and 17 Years | 0 (0.0%) | 0 (0.0%) |
| 18 to 24 Years | 11 (24.4%) | 8 (20.0%) |
| 25 to 34 Years | 2 (2.4%) | 17 (26.2%) |
| 35 to 44 Years | 0 (0.0%) | 0 (0.0%) |
| 45 to 54 Years | 0 (0.0%) | 10 (10.0%) |
| 55 to 64 Years | 4 (7.5%) | 32 (34.4%) |
| 65 to 74 Years | 0 (0.0%) | 0 (0.0%) |
| 75 Years and over | 0 (0.0%) | 0 (0.0%) |
| Total | 27 (4.9%) | 85 (14.1%) |
Income Above Poverty by Sex and Age in Leland
According to the poverty statistics in Leland, males aged 5 years and females aged 5 years are the age groups that are most secure financially, with 100.0% of males and 100.0% of females in these age groups living above the poverty line.
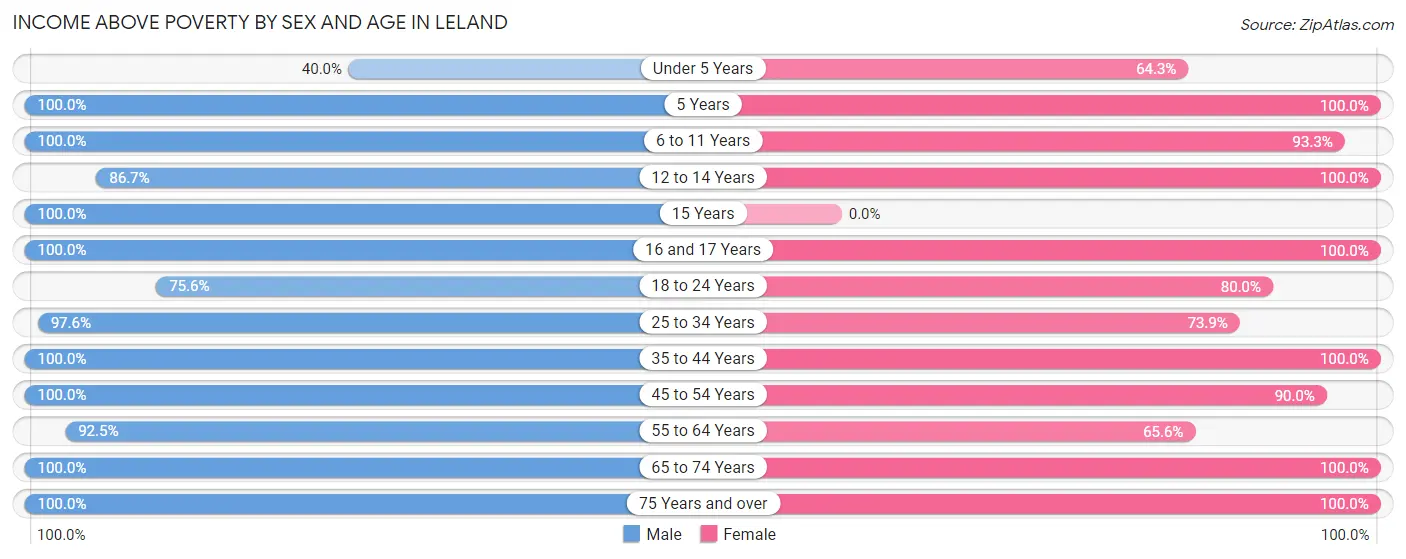
| Age Bracket | Male | Female |
| Under 5 Years | 4 (40.0%) | 27 (64.3%) |
| 5 Years | 5 (100.0%) | 4 (100.0%) |
| 6 to 11 Years | 32 (100.0%) | 42 (93.3%) |
| 12 to 14 Years | 26 (86.7%) | 38 (100.0%) |
| 15 Years | 6 (100.0%) | 0 (0.0%) |
| 16 and 17 Years | 53 (100.0%) | 8 (100.0%) |
| 18 to 24 Years | 34 (75.6%) | 32 (80.0%) |
| 25 to 34 Years | 80 (97.6%) | 48 (73.9%) |
| 35 to 44 Years | 82 (100.0%) | 94 (100.0%) |
| 45 to 54 Years | 97 (100.0%) | 90 (90.0%) |
| 55 to 64 Years | 49 (92.4%) | 61 (65.6%) |
| 65 to 74 Years | 38 (100.0%) | 23 (100.0%) |
| 75 Years and over | 21 (100.0%) | 50 (100.0%) |
| Total | 527 (95.1%) | 517 (85.9%) |
Income Below Poverty Among Married-Couple Families in Leland
The poverty statistics for married-couple families in Leland show that 0.8% or 2 of the total 246 families live below the poverty line. Families with 1 or 2 children have the highest poverty rate of 2.2%, comprising of 2 families. On the other hand, families with no children have the lowest poverty rate of 0.0%, which includes 0 families.
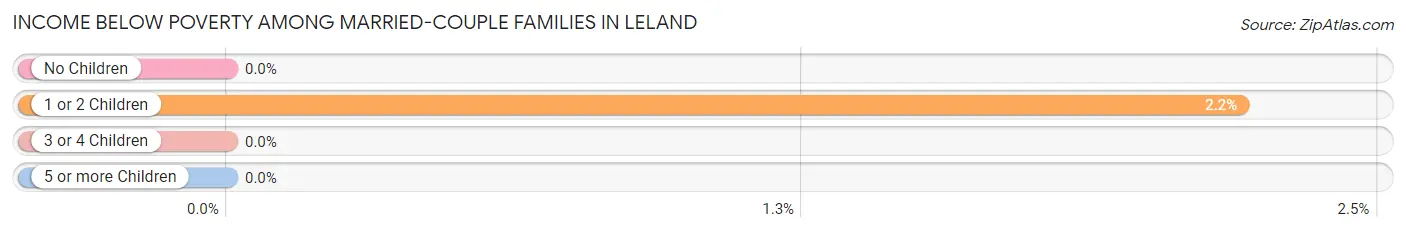
| Children | Above Poverty | Below Poverty |
| No Children | 135 (100.0%) | 0 (0.0%) |
| 1 or 2 Children | 89 (97.8%) | 2 (2.2%) |
| 3 or 4 Children | 20 (100.0%) | 0 (0.0%) |
| 5 or more Children | 0 (0.0%) | 0 (0.0%) |
| Total | 244 (99.2%) | 2 (0.8%) |
Income Below Poverty Among Single-Parent Households in Leland
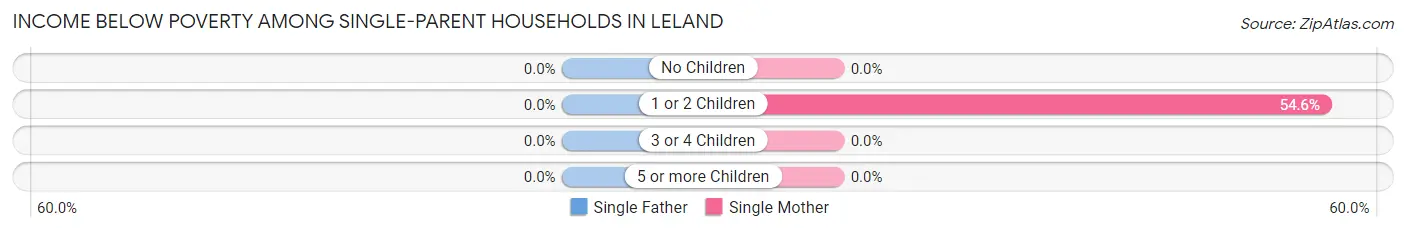
| Children | Single Father | Single Mother |
| No Children | 0 (0.0%) | 0 (0.0%) |
| 1 or 2 Children | 0 (0.0%) | 24 (54.5%) |
| 3 or 4 Children | 0 (0.0%) | 0 (0.0%) |
| 5 or more Children | 0 (0.0%) | 0 (0.0%) |
| Total | 0 (0.0%) | 24 (38.7%) |
Income Below Poverty Among Married-Couple vs Single-Parent Households in Leland
The poverty data for Leland shows that 2 of the married-couple family households (0.8%) and 24 of the single-parent households (25.5%) are living below the poverty level. Within the married-couple family households, those with 1 or 2 children have the highest poverty rate, with 2 households (2.2%) falling below the poverty line. Among the single-parent households, those with 1 or 2 children have the highest poverty rate, with 24 household (36.9%) living below poverty.
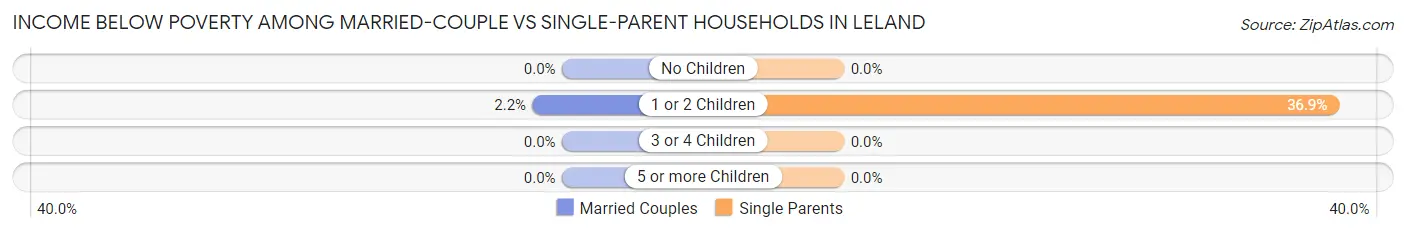
| Children | Married-Couple Families | Single-Parent Households |
| No Children | 0 (0.0%) | 0 (0.0%) |
| 1 or 2 Children | 2 (2.2%) | 24 (36.9%) |
| 3 or 4 Children | 0 (0.0%) | 0 (0.0%) |
| 5 or more Children | 0 (0.0%) | 0 (0.0%) |
| Total | 2 (0.8%) | 24 (25.5%) |
Race in Leland
The most populous races in Leland are White / Caucasian (1,099 | 95.1%), Hispanic or Latino (62 | 5.4%), and Two or more Races (35 | 3.0%).
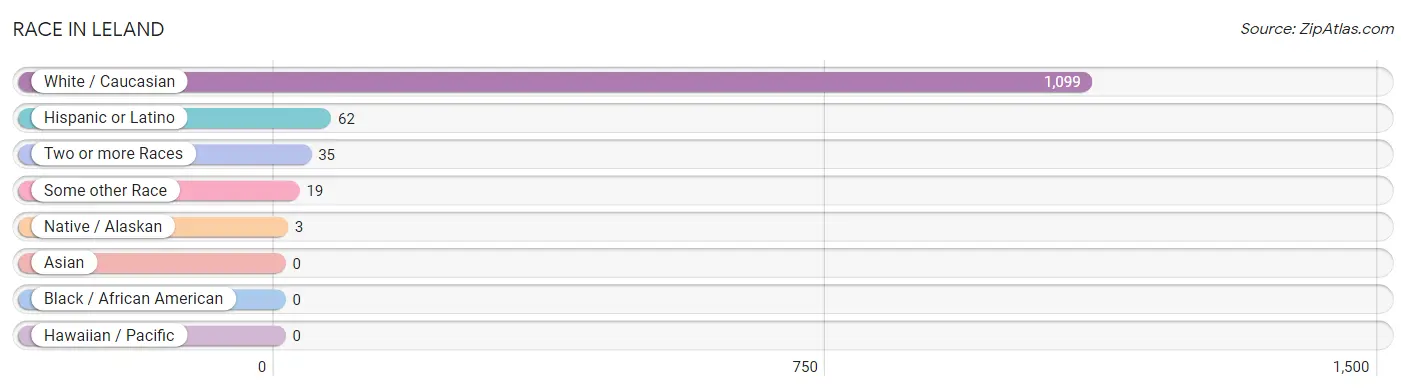
| Race | # Population | % Population |
| Asian | 0 | 0.0% |
| Black / African American | 0 | 0.0% |
| Hawaiian / Pacific | 0 | 0.0% |
| Hispanic or Latino | 62 | 5.4% |
| Native / Alaskan | 3 | 0.3% |
| White / Caucasian | 1,099 | 95.1% |
| Two or more Races | 35 | 3.0% |
| Some other Race | 19 | 1.6% |
| Total | 1,156 | 100.0% |
Ancestry in Leland
The most populous ancestries reported in Leland are German (254 | 22.0%), Irish (203 | 17.6%), French (105 | 9.1%), Norwegian (96 | 8.3%), and Polish (93 | 8.0%), together accounting for 64.9% of all Leland residents.
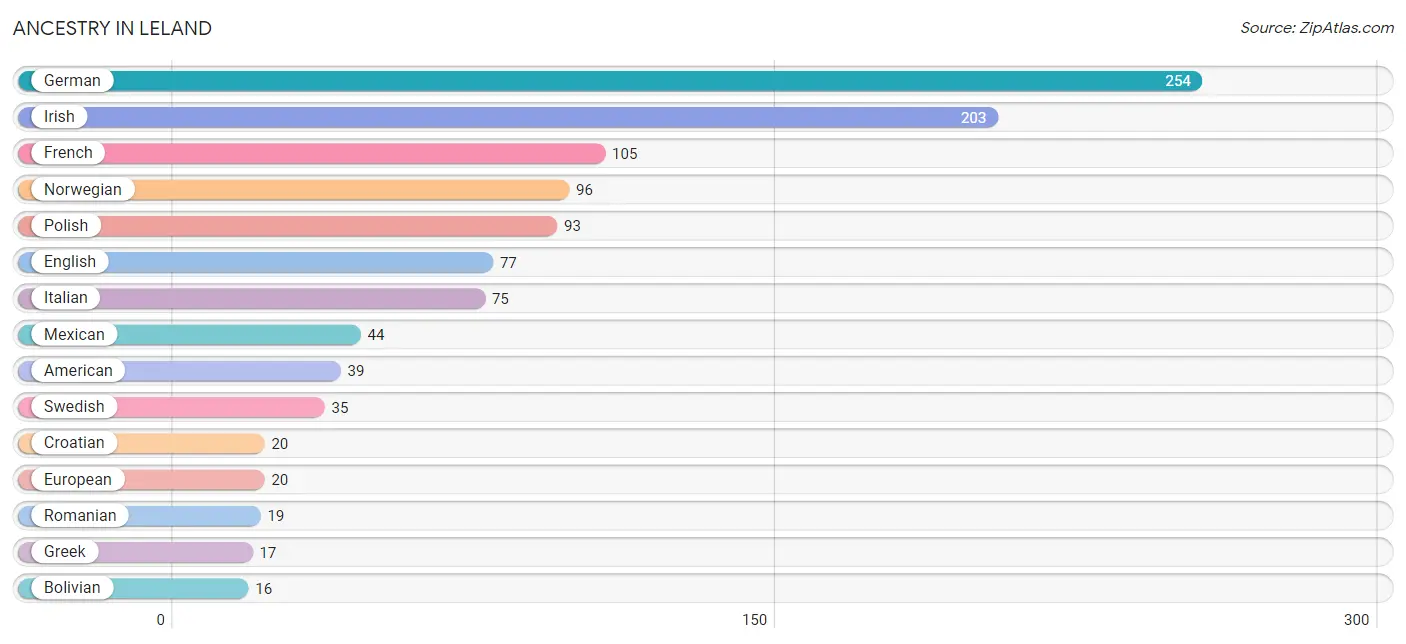
| Ancestry | # Population | % Population |
| American | 39 | 3.4% |
| Austrian | 2 | 0.2% |
| Bolivian | 16 | 1.4% |
| Brazilian | 1 | 0.1% |
| British | 2 | 0.2% |
| Croatian | 20 | 1.7% |
| Czech | 12 | 1.0% |
| Danish | 6 | 0.5% |
| Dutch | 13 | 1.1% |
| Eastern European | 11 | 0.9% |
| English | 77 | 6.7% |
| European | 20 | 1.7% |
| French | 105 | 9.1% |
| French Canadian | 3 | 0.3% |
| German | 254 | 22.0% |
| Greek | 17 | 1.5% |
| Irish | 203 | 17.6% |
| Italian | 75 | 6.5% |
| Mexican | 44 | 3.8% |
| Mexican American Indian | 3 | 0.3% |
| Norwegian | 96 | 8.3% |
| Polish | 93 | 8.0% |
| Puerto Rican | 2 | 0.2% |
| Romanian | 19 | 1.6% |
| Scotch-Irish | 14 | 1.2% |
| Scottish | 8 | 0.7% |
| Serbian | 16 | 1.4% |
| South American | 16 | 1.4% |
| Swedish | 35 | 3.0% | View All 29 Rows |
Immigrants in Leland
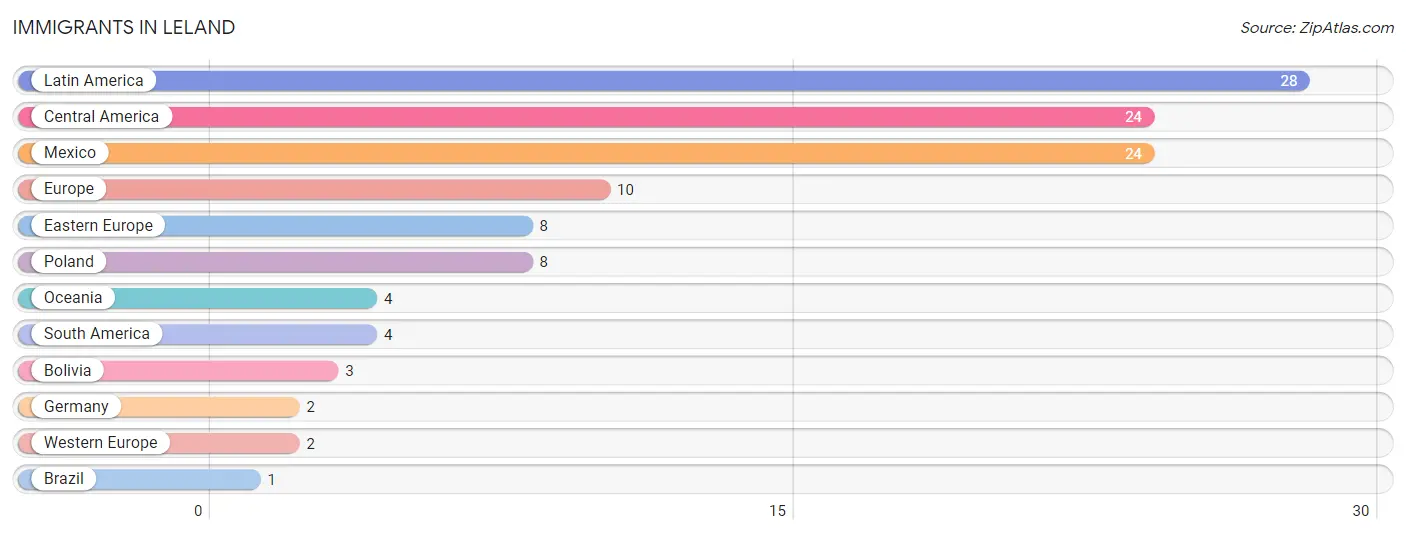
The most numerous immigrant groups reported in Leland came from Latin America (28 | 2.4%), Central America (24 | 2.1%), Mexico (24 | 2.1%), Europe (10 | 0.9%), and Eastern Europe (8 | 0.7%), together accounting for 8.1% of all Leland residents.
| Immigration Origin | # Population | % Population |
| Bolivia | 3 | 0.3% |
| Brazil | 1 | 0.1% |
| Central America | 24 | 2.1% |
| Eastern Europe | 8 | 0.7% |
| Europe | 10 | 0.9% |
| Germany | 2 | 0.2% |
| Latin America | 28 | 2.4% |
| Mexico | 24 | 2.1% |
| Oceania | 4 | 0.4% |
| Poland | 8 | 0.7% |
| South America | 4 | 0.4% |
| Western Europe | 2 | 0.2% | View All 12 Rows |
Sex and Age in Leland
Sex and Age in Leland
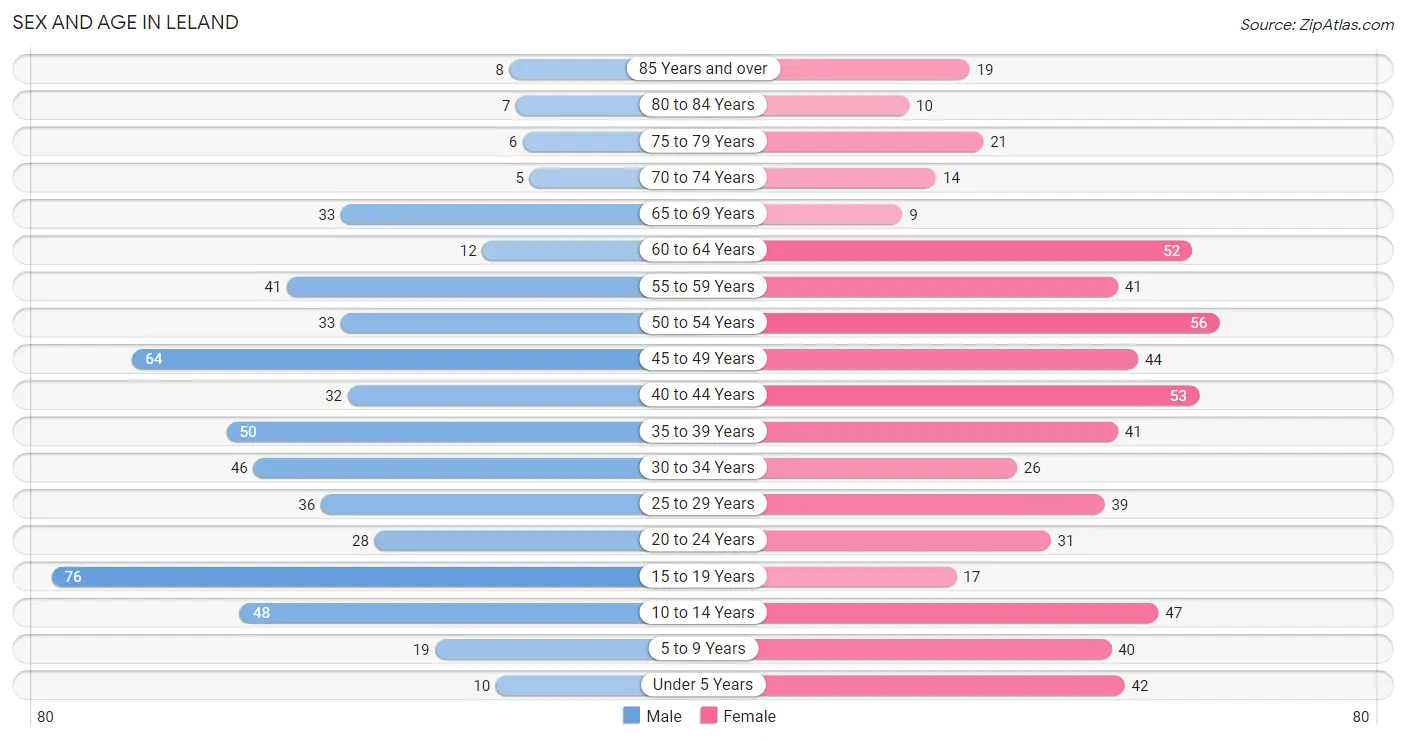
The most populous age groups in Leland are 15 to 19 Years (76 | 13.7%) for men and 50 to 54 Years (56 | 9.3%) for women.
| Age Bracket | Male | Female |
| Under 5 Years | 10 (1.8%) | 42 (7.0%) |
| 5 to 9 Years | 19 (3.4%) | 40 (6.6%) |
| 10 to 14 Years | 48 (8.7%) | 47 (7.8%) |
| 15 to 19 Years | 76 (13.7%) | 17 (2.8%) |
| 20 to 24 Years | 28 (5.1%) | 31 (5.1%) |
| 25 to 29 Years | 36 (6.5%) | 39 (6.5%) |
| 30 to 34 Years | 46 (8.3%) | 26 (4.3%) |
| 35 to 39 Years | 50 (9.0%) | 41 (6.8%) |
| 40 to 44 Years | 32 (5.8%) | 53 (8.8%) |
| 45 to 49 Years | 64 (11.6%) | 44 (7.3%) |
| 50 to 54 Years | 33 (6.0%) | 56 (9.3%) |
| 55 to 59 Years | 41 (7.4%) | 41 (6.8%) |
| 60 to 64 Years | 12 (2.2%) | 52 (8.6%) |
| 65 to 69 Years | 33 (6.0%) | 9 (1.5%) |
| 70 to 74 Years | 5 (0.9%) | 14 (2.3%) |
| 75 to 79 Years | 6 (1.1%) | 21 (3.5%) |
| 80 to 84 Years | 7 (1.3%) | 10 (1.7%) |
| 85 Years and over | 8 (1.4%) | 19 (3.2%) |
| Total | 554 (100.0%) | 602 (100.0%) |
Families and Households in Leland
Median Family Size in Leland
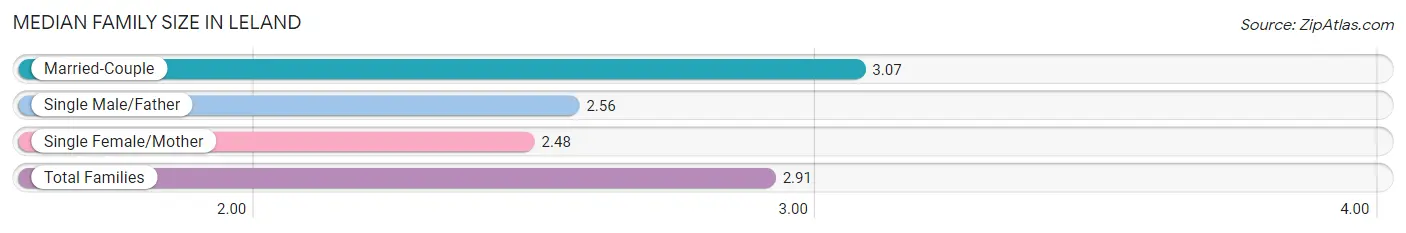
The median family size in Leland is 2.91 persons per family, with married-couple families (246 | 72.4%) accounting for the largest median family size of 3.07 persons per family. On the other hand, single female/mother families (62 | 18.2%) represent the smallest median family size with 2.48 persons per family.
| Family Type | # Families | Family Size |
| Married-Couple | 246 (72.4%) | 3.07 |
| Single Male/Father | 32 (9.4%) | 2.56 |
| Single Female/Mother | 62 (18.2%) | 2.48 |
| Total Families | 340 (100.0%) | 2.91 |
Median Household Size in Leland
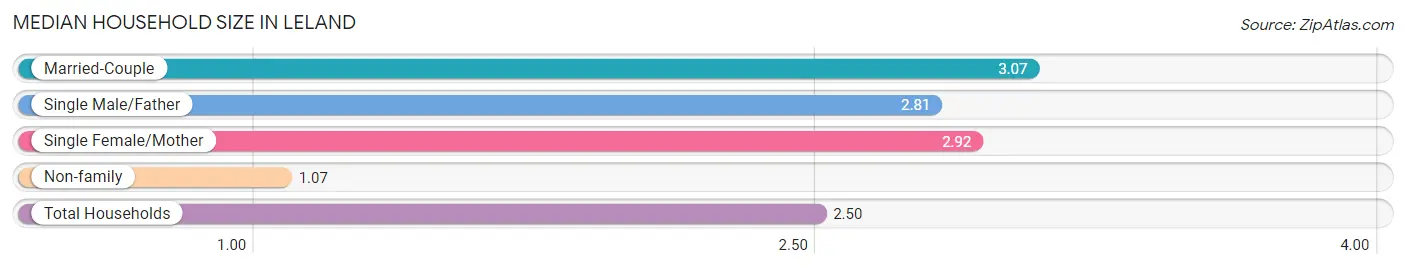
The median household size in Leland is 2.50 persons per household, with married-couple households (246 | 53.2%) accounting for the largest median household size of 3.07 persons per household. non-family households (122 | 26.4%) represent the smallest median household size with 1.07 persons per household.
| Household Type | # Households | Household Size |
| Married-Couple | 246 (53.2%) | 3.07 |
| Single Male/Father | 32 (6.9%) | 2.81 |
| Single Female/Mother | 62 (13.4%) | 2.92 |
| Non-family | 122 (26.4%) | 1.07 |
| Total Households | 462 (100.0%) | 2.50 |
Household Size by Marriage Status in Leland
Out of a total of 462 households in Leland, 340 (73.6%) are family households, while 122 (26.4%) are nonfamily households. The most numerous type of family households are 2-person households, comprising 136, and the most common type of nonfamily households are 1-person households, comprising 111.
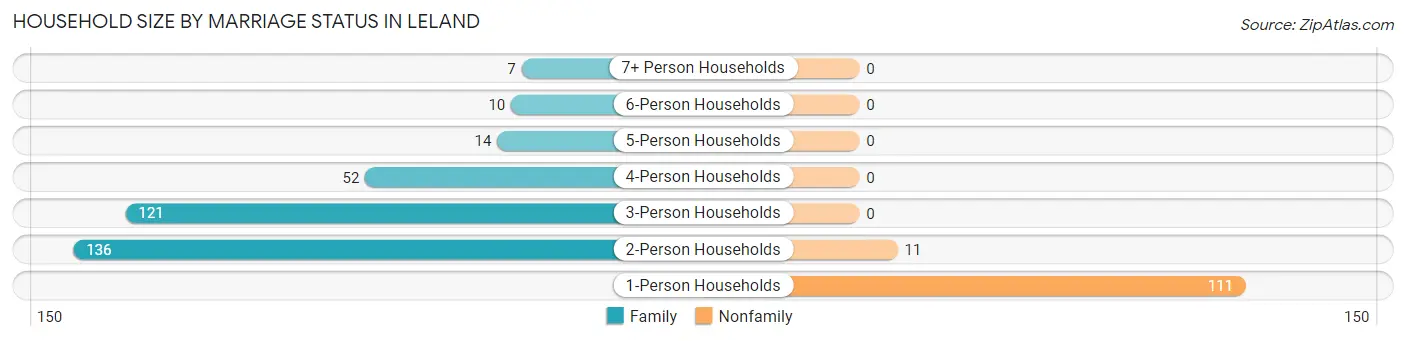
| Household Size | Family Households | Nonfamily Households |
| 1-Person Households | - | 111 (24.0%) |
| 2-Person Households | 136 (29.4%) | 11 (2.4%) |
| 3-Person Households | 121 (26.2%) | 0 (0.0%) |
| 4-Person Households | 52 (11.3%) | 0 (0.0%) |
| 5-Person Households | 14 (3.0%) | 0 (0.0%) |
| 6-Person Households | 10 (2.2%) | 0 (0.0%) |
| 7+ Person Households | 7 (1.5%) | 0 (0.0%) |
| Total | 340 (73.6%) | 122 (26.4%) |
Female Fertility in Leland
Fertility by Age in Leland
Average fertility rate in Leland is 38.0 births per 1,000 women. Women in the age bracket of 35 to 50 years have the highest fertility rate with 66.0 births per 1,000 women. Women in the age bracket of 35 to 50 years acount for 100.0% of all women with births.
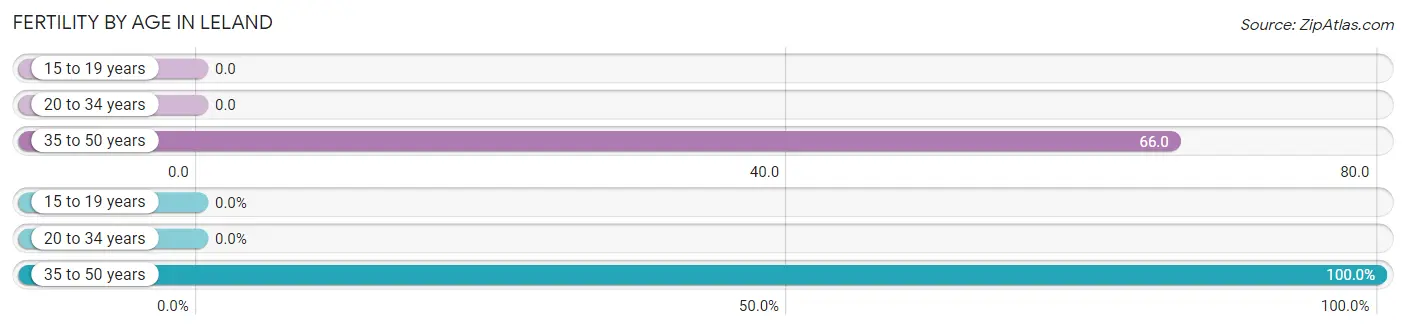
| Age Bracket | Women with Births | Births / 1,000 Women |
| 15 to 19 years | 0 (0.0%) | 0.0 |
| 20 to 34 years | 0 (0.0%) | 0.0 |
| 35 to 50 years | 10 (100.0%) | 66.0 |
| Total | 10 (100.0%) | 38.0 |
Fertility by Age by Marriage Status in Leland
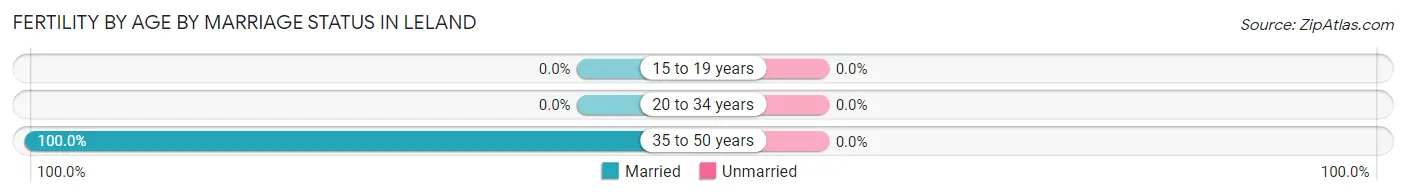
| Age Bracket | Married | Unmarried |
| 15 to 19 years | 0 (0.0%) | 0 (0.0%) |
| 20 to 34 years | 0 (0.0%) | 0 (0.0%) |
| 35 to 50 years | 10 (100.0%) | 0 (0.0%) |
| Total | 10 (100.0%) | 0 (0.0%) |
Fertility by Education in Leland
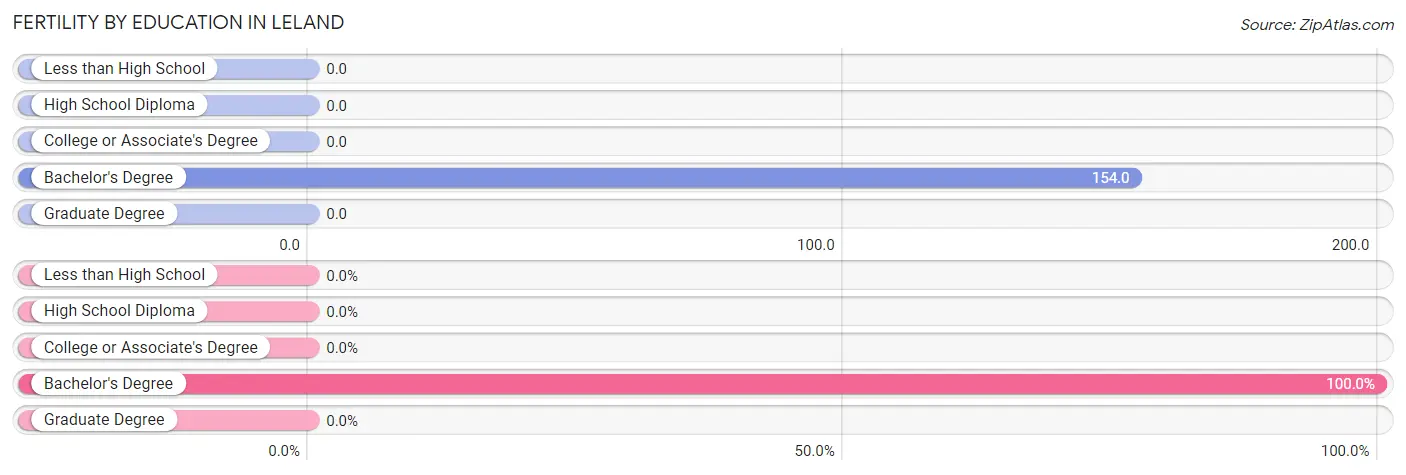
| Educational Attainment | Women with Births | Births / 1,000 Women |
| Less than High School | 0 (0.0%) | 0.0 |
| High School Diploma | 0 (0.0%) | 0.0 |
| College or Associate's Degree | 0 (0.0%) | 0.0 |
| Bachelor's Degree | 10 (100.0%) | 154.0 |
| Graduate Degree | 0 (0.0%) | 0.0 |
| Total | 10 (100.0%) | 38.0 |
Fertility by Education by Marriage Status in Leland
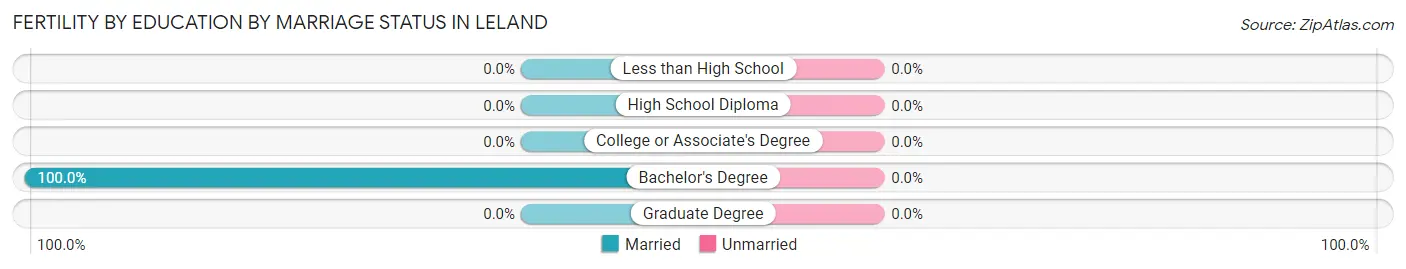
| Educational Attainment | Married | Unmarried |
| Less than High School | 0 (0.0%) | 0 (0.0%) |
| High School Diploma | 0 (0.0%) | 0 (0.0%) |
| College or Associate's Degree | 0 (0.0%) | 0 (0.0%) |
| Bachelor's Degree | 10 (100.0%) | 0 (0.0%) |
| Graduate Degree | 0 (0.0%) | 0 (0.0%) |
| Total | 10 (100.0%) | 0 (0.0%) |
Employment Characteristics in Leland
Employment by Class of Employer in Leland
Among the 528 employed individuals in Leland, private company employees (366 | 69.3%), not-for-profit organizations (59 | 11.2%), and local government employees (51 | 9.7%) make up the most common classes of employment.
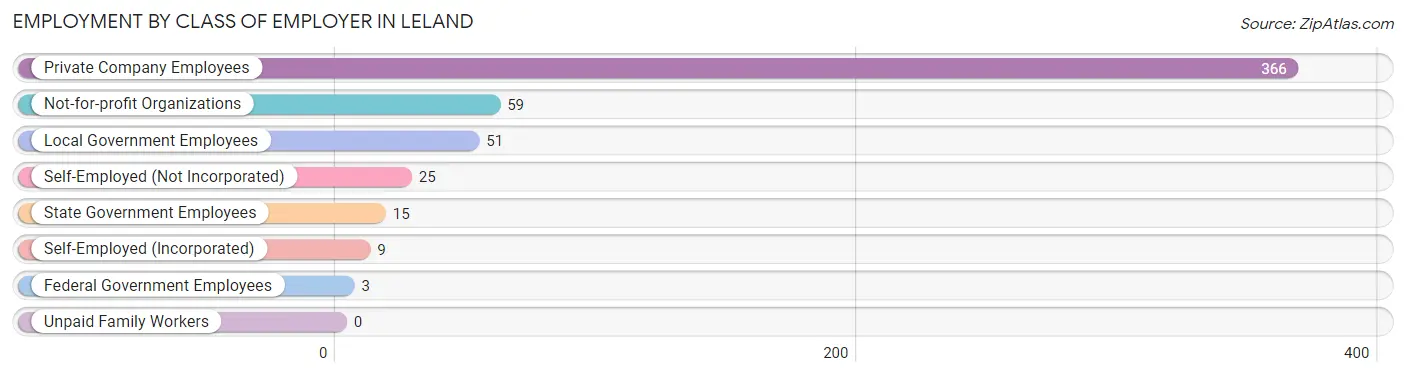
| Employer Class | # Employees | % Employees |
| Private Company Employees | 366 | 69.3% |
| Self-Employed (Incorporated) | 9 | 1.7% |
| Self-Employed (Not Incorporated) | 25 | 4.7% |
| Not-for-profit Organizations | 59 | 11.2% |
| Local Government Employees | 51 | 9.7% |
| State Government Employees | 15 | 2.8% |
| Federal Government Employees | 3 | 0.6% |
| Unpaid Family Workers | 0 | 0.0% |
| Total | 528 | 100.0% |
Employment Status by Age in Leland
According to the labor force statistics for Leland, out of the total population over 16 years of age (944), 63.9% or 603 individuals are in the labor force, with 8.3% or 50 of them unemployed. The age group with the highest labor force participation rate is 25 to 29 years, with 88.0% or 66 individuals in the labor force. Within the labor force, the 16 to 19 years age range has the highest percentage of unemployed individuals, with 75.6% or 31 of them being unemployed.
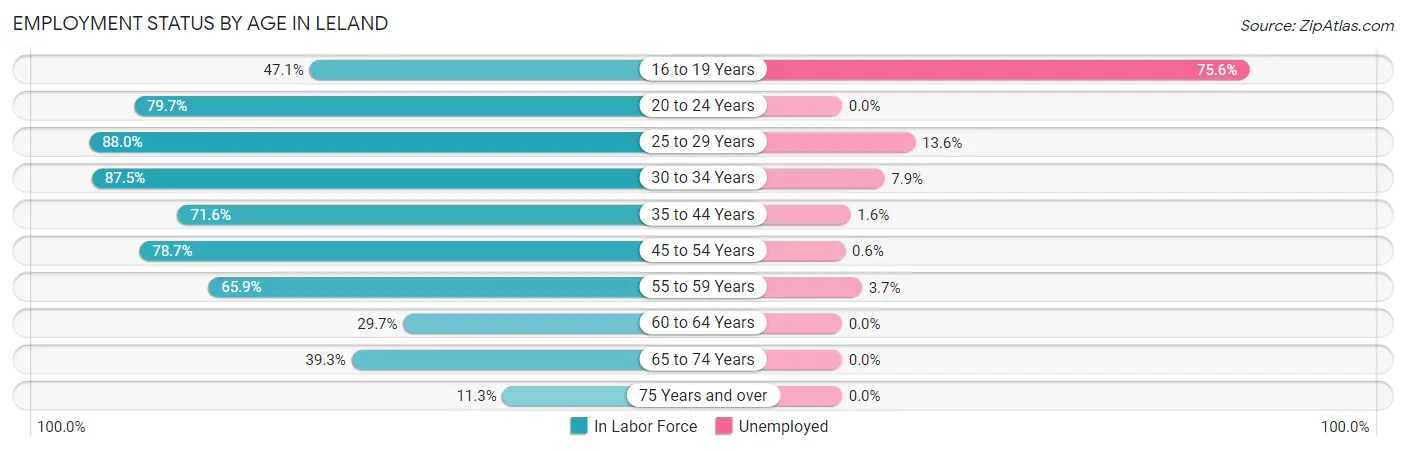
| Age Bracket | In Labor Force | Unemployed |
| 16 to 19 Years | 41 (47.1%) | 31 (75.6%) |
| 20 to 24 Years | 47 (79.7%) | 0 (0.0%) |
| 25 to 29 Years | 66 (88.0%) | 9 (13.6%) |
| 30 to 34 Years | 63 (87.5%) | 5 (7.9%) |
| 35 to 44 Years | 126 (71.6%) | 2 (1.6%) |
| 45 to 54 Years | 155 (78.7%) | 1 (0.6%) |
| 55 to 59 Years | 54 (65.9%) | 2 (3.7%) |
| 60 to 64 Years | 19 (29.7%) | 0 (0.0%) |
| 65 to 74 Years | 24 (39.3%) | 0 (0.0%) |
| 75 Years and over | 8 (11.3%) | 0 (0.0%) |
| Total | 603 (63.9%) | 50 (8.3%) |
Employment Status by Educational Attainment in Leland
According to labor force statistics for Leland, 72.5% of individuals (483) out of the total population between 25 and 64 years of age (666) are in the labor force, with 3.9% or 19 of them being unemployed. The group with the highest labor force participation rate are those with the educational attainment of high school diploma, with 77.6% or 149 individuals in the labor force. Within the labor force, individuals with less than high school education have the highest percentage of unemployment, with 63.2% or 12 of them being unemployed.
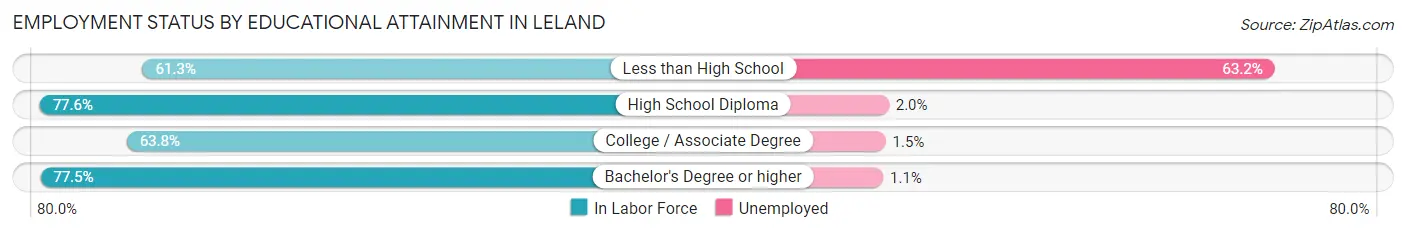
| Educational Attainment | In Labor Force | Unemployed |
| Less than High School | 19 (61.3%) | 20 (63.2%) |
| High School Diploma | 149 (77.6%) | 4 (2.0%) |
| College / Associate Degree | 132 (63.8%) | 3 (1.5%) |
| Bachelor's Degree or higher | 183 (77.5%) | 3 (1.1%) |
| Total | 483 (72.5%) | 26 (3.9%) |
Employment Occupations by Sex in Leland
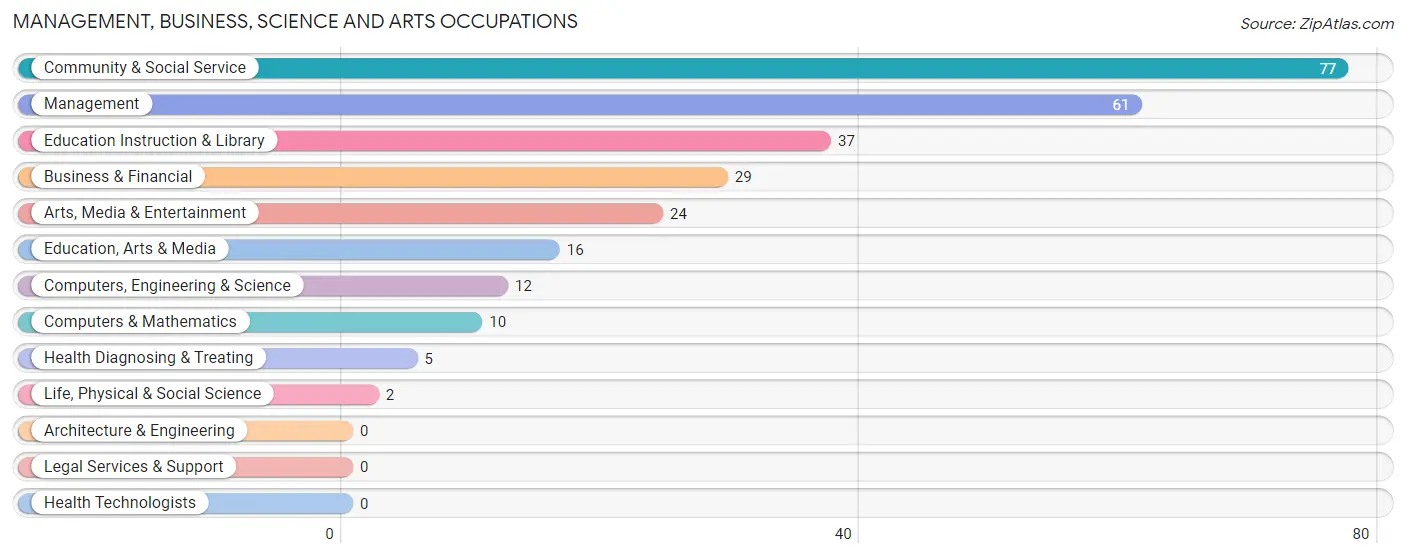
Management, Business, Science and Arts Occupations
The most common Management, Business, Science and Arts occupations in Leland are Community & Social Service (77 | 13.9%), Management (61 | 11.0%), Education Instruction & Library (37 | 6.7%), Business & Financial (29 | 5.2%), and Arts, Media & Entertainment (24 | 4.3%).
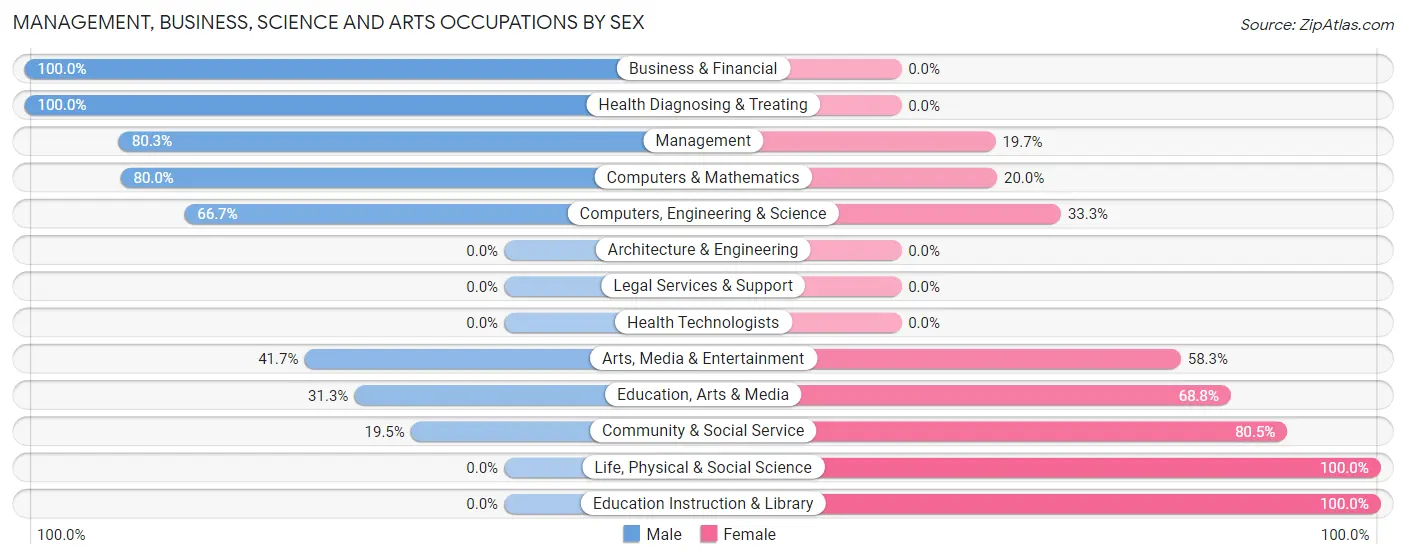
Management, Business, Science and Arts Occupations by Sex
Within the Management, Business, Science and Arts occupations in Leland, the most male-oriented occupations are Business & Financial (100.0%), Health Diagnosing & Treating (100.0%), and Management (80.3%), while the most female-oriented occupations are Life, Physical & Social Science (100.0%), Education Instruction & Library (100.0%), and Community & Social Service (80.5%).
| Occupation | Male | Female |
| Management | 49 (80.3%) | 12 (19.7%) |
| Business & Financial | 29 (100.0%) | 0 (0.0%) |
| Computers, Engineering & Science | 8 (66.7%) | 4 (33.3%) |
| Computers & Mathematics | 8 (80.0%) | 2 (20.0%) |
| Architecture & Engineering | 0 (0.0%) | 0 (0.0%) |
| Life, Physical & Social Science | 0 (0.0%) | 2 (100.0%) |
| Community & Social Service | 15 (19.5%) | 62 (80.5%) |
| Education, Arts & Media | 5 (31.2%) | 11 (68.8%) |
| Legal Services & Support | 0 (0.0%) | 0 (0.0%) |
| Education Instruction & Library | 0 (0.0%) | 37 (100.0%) |
| Arts, Media & Entertainment | 10 (41.7%) | 14 (58.3%) |
| Health Diagnosing & Treating | 5 (100.0%) | 0 (0.0%) |
| Health Technologists | 0 (0.0%) | 0 (0.0%) |
| Total (Category) | 106 (57.6%) | 78 (42.4%) |
| Total (Overall) | 352 (63.6%) | 201 (36.3%) |
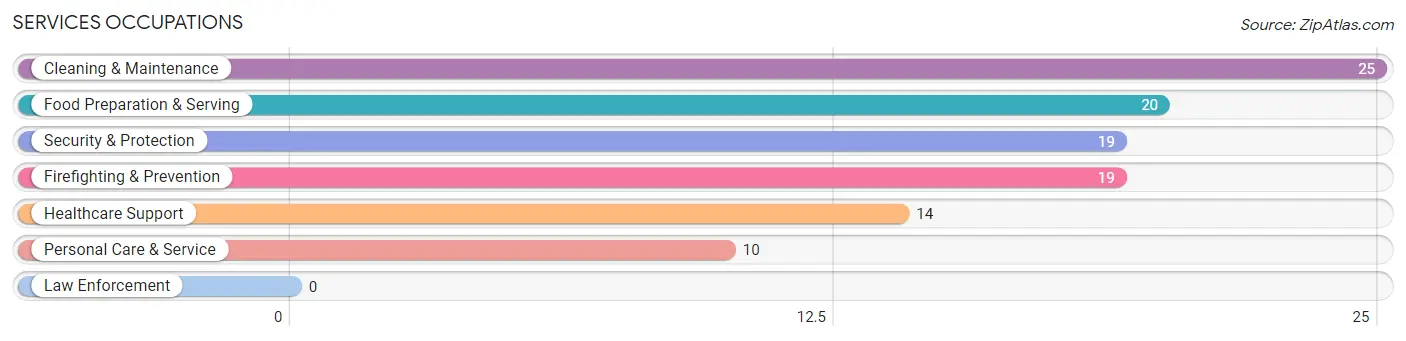
Services Occupations
The most common Services occupations in Leland are Cleaning & Maintenance (25 | 4.5%), Food Preparation & Serving (20 | 3.6%), Security & Protection (19 | 3.4%), Firefighting & Prevention (19 | 3.4%), and Healthcare Support (14 | 2.5%).
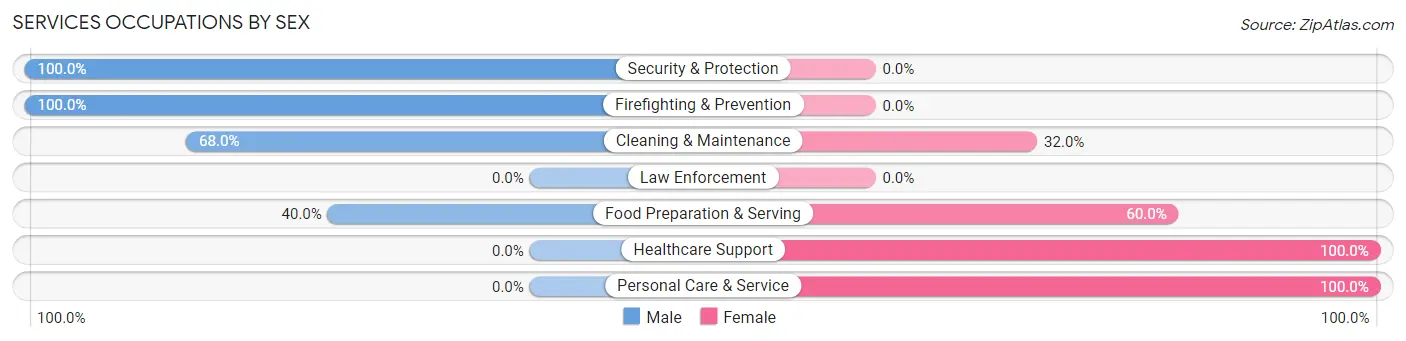
Services Occupations by Sex
Within the Services occupations in Leland, the most male-oriented occupations are Security & Protection (100.0%), Firefighting & Prevention (100.0%), and Cleaning & Maintenance (68.0%), while the most female-oriented occupations are Healthcare Support (100.0%), Personal Care & Service (100.0%), and Food Preparation & Serving (60.0%).
| Occupation | Male | Female |
| Healthcare Support | 0 (0.0%) | 14 (100.0%) |
| Security & Protection | 19 (100.0%) | 0 (0.0%) |
| Firefighting & Prevention | 19 (100.0%) | 0 (0.0%) |
| Law Enforcement | 0 (0.0%) | 0 (0.0%) |
| Food Preparation & Serving | 8 (40.0%) | 12 (60.0%) |
| Cleaning & Maintenance | 17 (68.0%) | 8 (32.0%) |
| Personal Care & Service | 0 (0.0%) | 10 (100.0%) |
| Total (Category) | 44 (50.0%) | 44 (50.0%) |
| Total (Overall) | 352 (63.6%) | 201 (36.3%) |
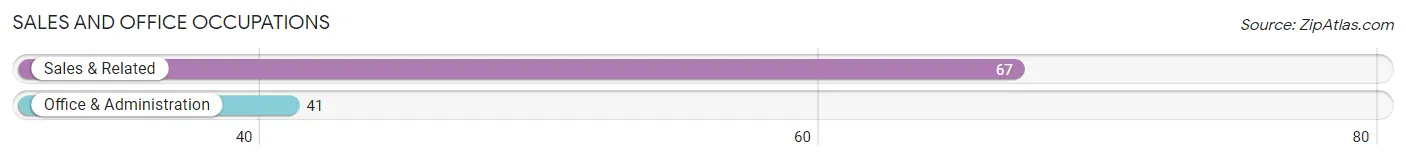
Sales and Office Occupations
The most common Sales and Office occupations in Leland are Sales & Related (67 | 12.1%), and Office & Administration (41 | 7.4%).
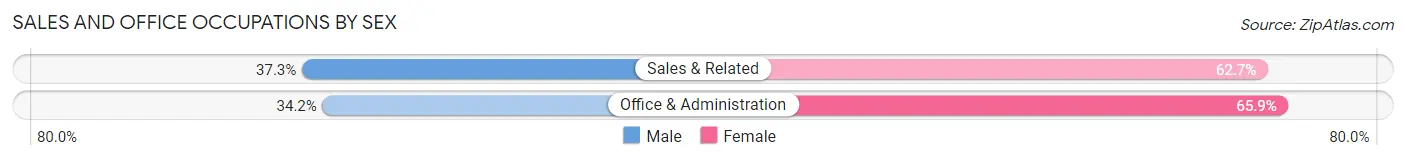
Sales and Office Occupations by Sex
| Occupation | Male | Female |
| Sales & Related | 25 (37.3%) | 42 (62.7%) |
| Office & Administration | 14 (34.2%) | 27 (65.8%) |
| Total (Category) | 39 (36.1%) | 69 (63.9%) |
| Total (Overall) | 352 (63.6%) | 201 (36.3%) |
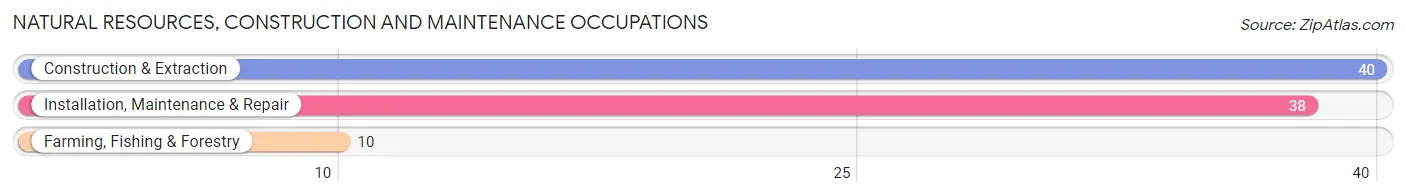
Natural Resources, Construction and Maintenance Occupations
The most common Natural Resources, Construction and Maintenance occupations in Leland are Construction & Extraction (40 | 7.2%), Installation, Maintenance & Repair (38 | 6.9%), and Farming, Fishing & Forestry (10 | 1.8%).
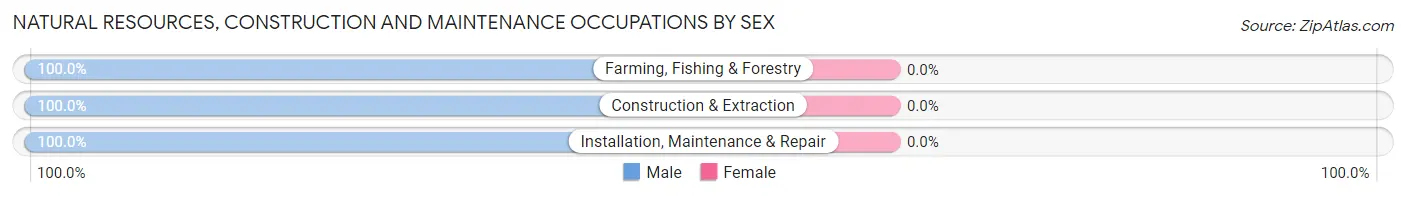
Natural Resources, Construction and Maintenance Occupations by Sex
| Occupation | Male | Female |
| Farming, Fishing & Forestry | 10 (100.0%) | 0 (0.0%) |
| Construction & Extraction | 40 (100.0%) | 0 (0.0%) |
| Installation, Maintenance & Repair | 38 (100.0%) | 0 (0.0%) |
| Total (Category) | 88 (100.0%) | 0 (0.0%) |
| Total (Overall) | 352 (63.6%) | 201 (36.3%) |
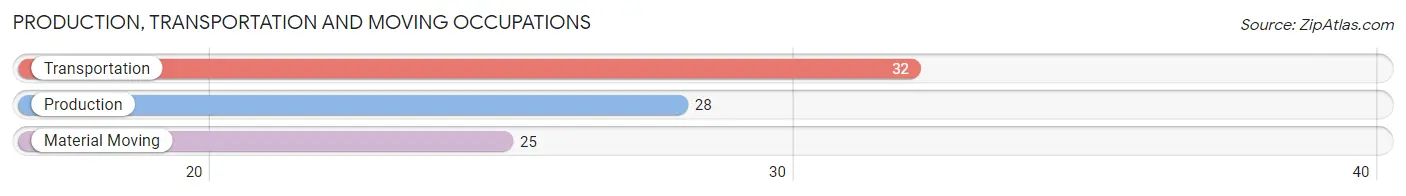
Production, Transportation and Moving Occupations
The most common Production, Transportation and Moving occupations in Leland are Transportation (32 | 5.8%), Production (28 | 5.1%), and Material Moving (25 | 4.5%).
Production, Transportation and Moving Occupations by Sex
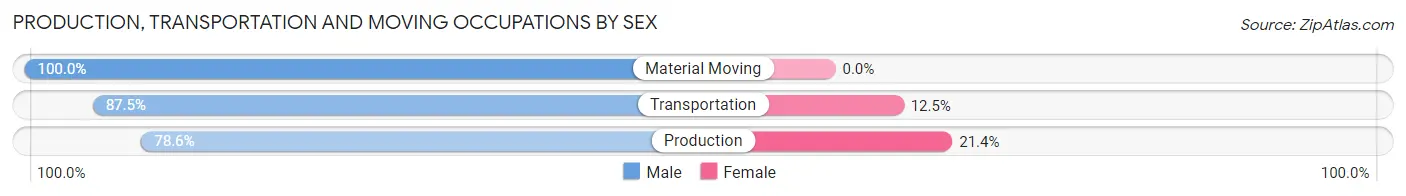
| Occupation | Male | Female |
| Production | 22 (78.6%) | 6 (21.4%) |
| Transportation | 28 (87.5%) | 4 (12.5%) |
| Material Moving | 25 (100.0%) | 0 (0.0%) |
| Total (Category) | 75 (88.2%) | 10 (11.8%) |
| Total (Overall) | 352 (63.6%) | 201 (36.3%) |
Employment Industries by Sex in Leland
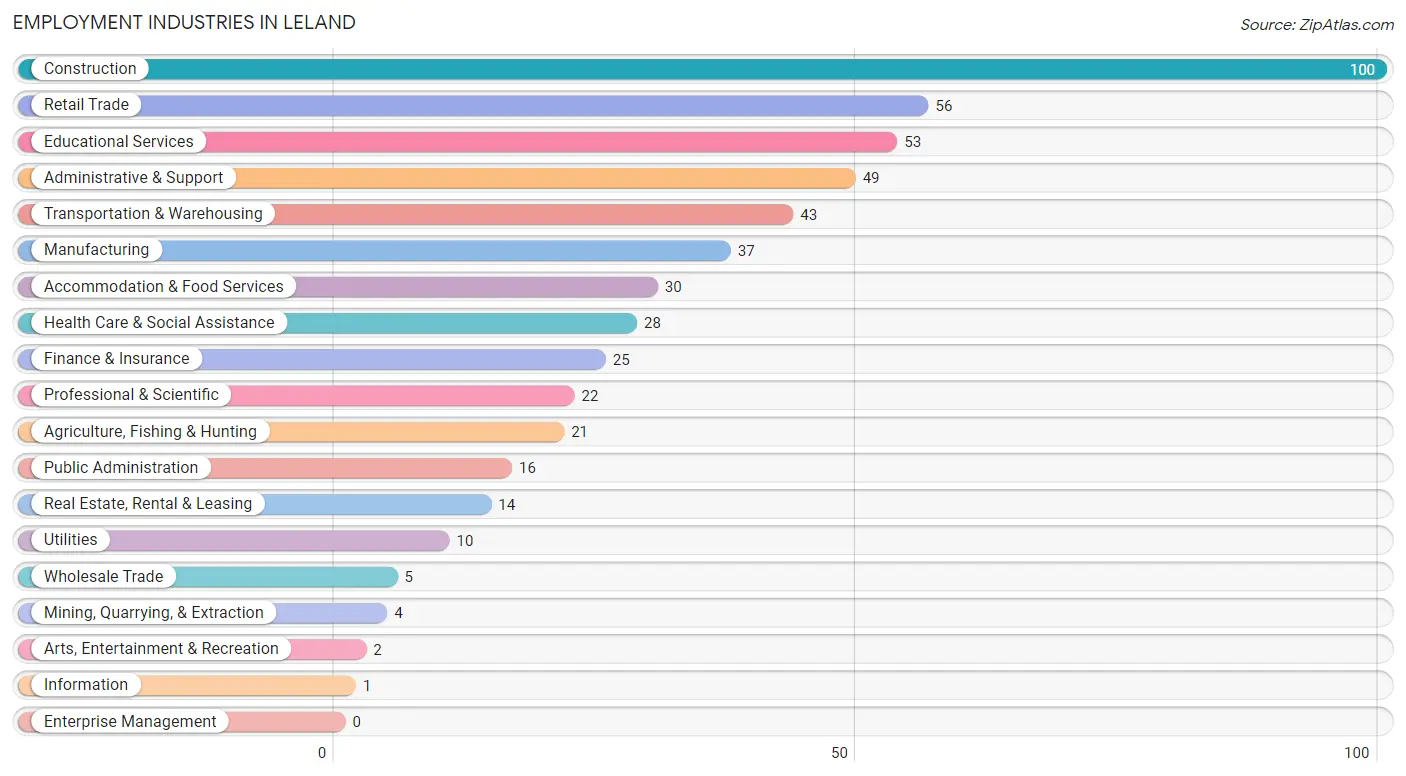
Employment Industries in Leland
The major employment industries in Leland include Construction (100 | 18.1%), Retail Trade (56 | 10.1%), Educational Services (53 | 9.6%), Administrative & Support (49 | 8.9%), and Transportation & Warehousing (43 | 7.8%).
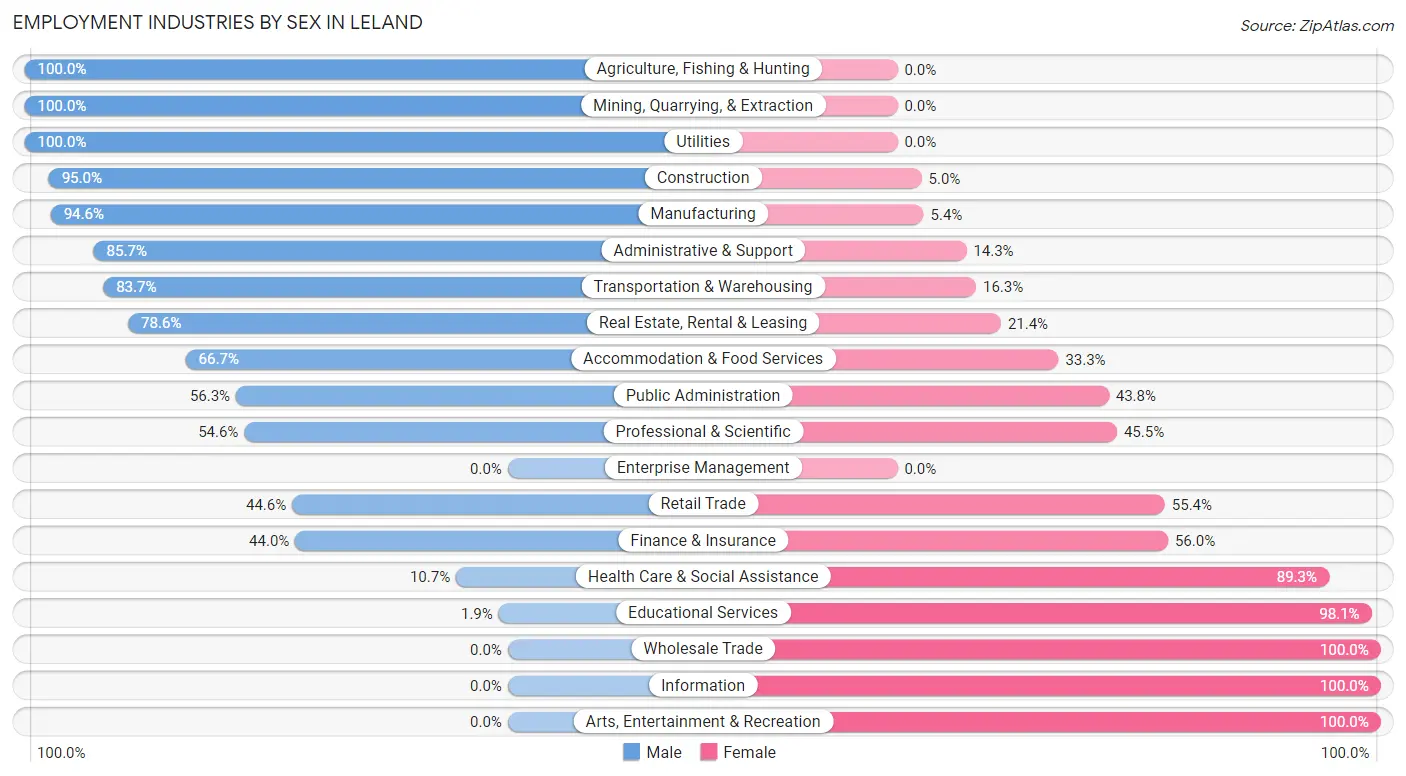
Employment Industries by Sex in Leland
The Leland industries that see more men than women are Agriculture, Fishing & Hunting (100.0%), Mining, Quarrying, & Extraction (100.0%), and Utilities (100.0%), whereas the industries that tend to have a higher number of women are Wholesale Trade (100.0%), Information (100.0%), and Arts, Entertainment & Recreation (100.0%).
| Industry | Male | Female |
| Agriculture, Fishing & Hunting | 21 (100.0%) | 0 (0.0%) |
| Mining, Quarrying, & Extraction | 4 (100.0%) | 0 (0.0%) |
| Construction | 95 (95.0%) | 5 (5.0%) |
| Manufacturing | 35 (94.6%) | 2 (5.4%) |
| Wholesale Trade | 0 (0.0%) | 5 (100.0%) |
| Retail Trade | 25 (44.6%) | 31 (55.4%) |
| Transportation & Warehousing | 36 (83.7%) | 7 (16.3%) |
| Utilities | 10 (100.0%) | 0 (0.0%) |
| Information | 0 (0.0%) | 1 (100.0%) |
| Finance & Insurance | 11 (44.0%) | 14 (56.0%) |
| Real Estate, Rental & Leasing | 11 (78.6%) | 3 (21.4%) |
| Professional & Scientific | 12 (54.5%) | 10 (45.5%) |
| Enterprise Management | 0 (0.0%) | 0 (0.0%) |
| Administrative & Support | 42 (85.7%) | 7 (14.3%) |
| Educational Services | 1 (1.9%) | 52 (98.1%) |
| Health Care & Social Assistance | 3 (10.7%) | 25 (89.3%) |
| Arts, Entertainment & Recreation | 0 (0.0%) | 2 (100.0%) |
| Accommodation & Food Services | 20 (66.7%) | 10 (33.3%) |
| Public Administration | 9 (56.2%) | 7 (43.8%) |
| Total | 352 (63.6%) | 201 (36.3%) |
Education in Leland
School Enrollment in Leland
The most common levels of schooling among the 283 students in Leland are high school (97 | 34.3%), middle school (72 | 25.4%), and elementary school (46 | 16.3%).
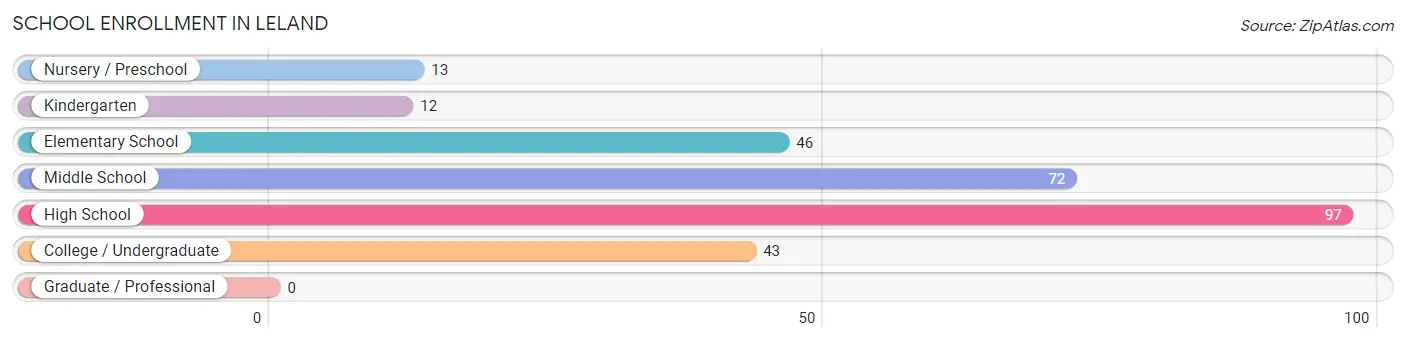
| School Level | # Students | % Students |
| Nursery / Preschool | 13 | 4.6% |
| Kindergarten | 12 | 4.2% |
| Elementary School | 46 | 16.3% |
| Middle School | 72 | 25.4% |
| High School | 97 | 34.3% |
| College / Undergraduate | 43 | 15.2% |
| Graduate / Professional | 0 | 0.0% |
| Total | 283 | 100.0% |
School Enrollment by Age by Funding Source in Leland
Out of a total of 283 students who are enrolled in schools in Leland, 29 (10.2%) attend a private institution, while the remaining 254 (89.8%) are enrolled in public schools. The age group of 25 to 34 year olds has the highest likelihood of being enrolled in private schools, with 11 (40.7% in the age bracket) enrolled. Conversely, the age group of 3 to 4 year olds has the lowest likelihood of being enrolled in a private school, with 6 (100.0% in the age bracket) attending a public institution.
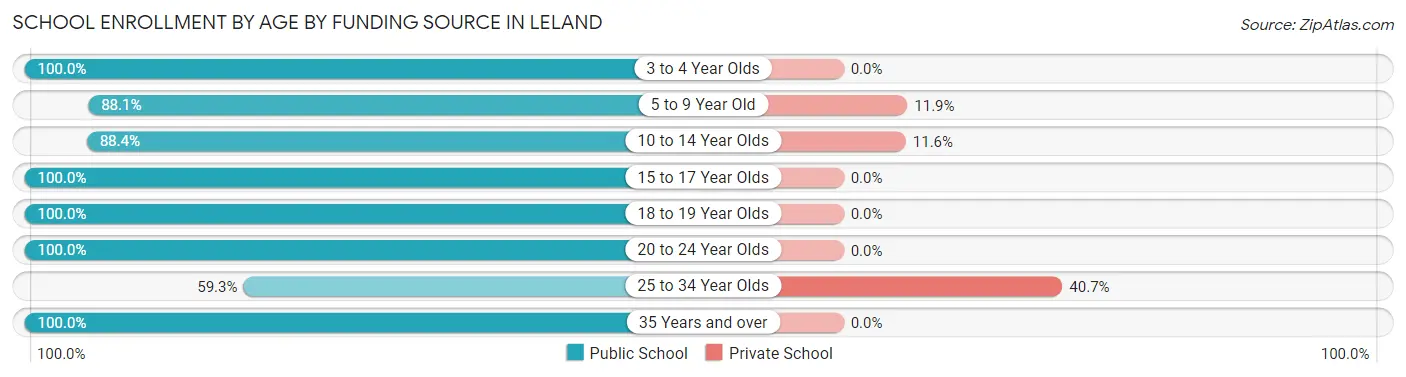
| Age Bracket | Public School | Private School |
| 3 to 4 Year Olds | 6 (100.0%) | 0 (0.0%) |
| 5 to 9 Year Old | 52 (88.1%) | 7 (11.9%) |
| 10 to 14 Year Olds | 84 (88.4%) | 11 (11.6%) |
| 15 to 17 Year Olds | 67 (100.0%) | 0 (0.0%) |
| 18 to 19 Year Olds | 17 (100.0%) | 0 (0.0%) |
| 20 to 24 Year Olds | 4 (100.0%) | 0 (0.0%) |
| 25 to 34 Year Olds | 16 (59.3%) | 11 (40.7%) |
| 35 Years and over | 8 (100.0%) | 0 (0.0%) |
| Total | 254 (89.8%) | 29 (10.2%) |
Educational Attainment by Field of Study in Leland
Business (121 | 46.5%), arts & humanities (43 | 16.5%), education (23 | 8.8%), social sciences (15 | 5.8%), and liberal arts & history (13 | 5.0%) are the most common fields of study among 260 individuals in Leland who have obtained a bachelor's degree or higher.
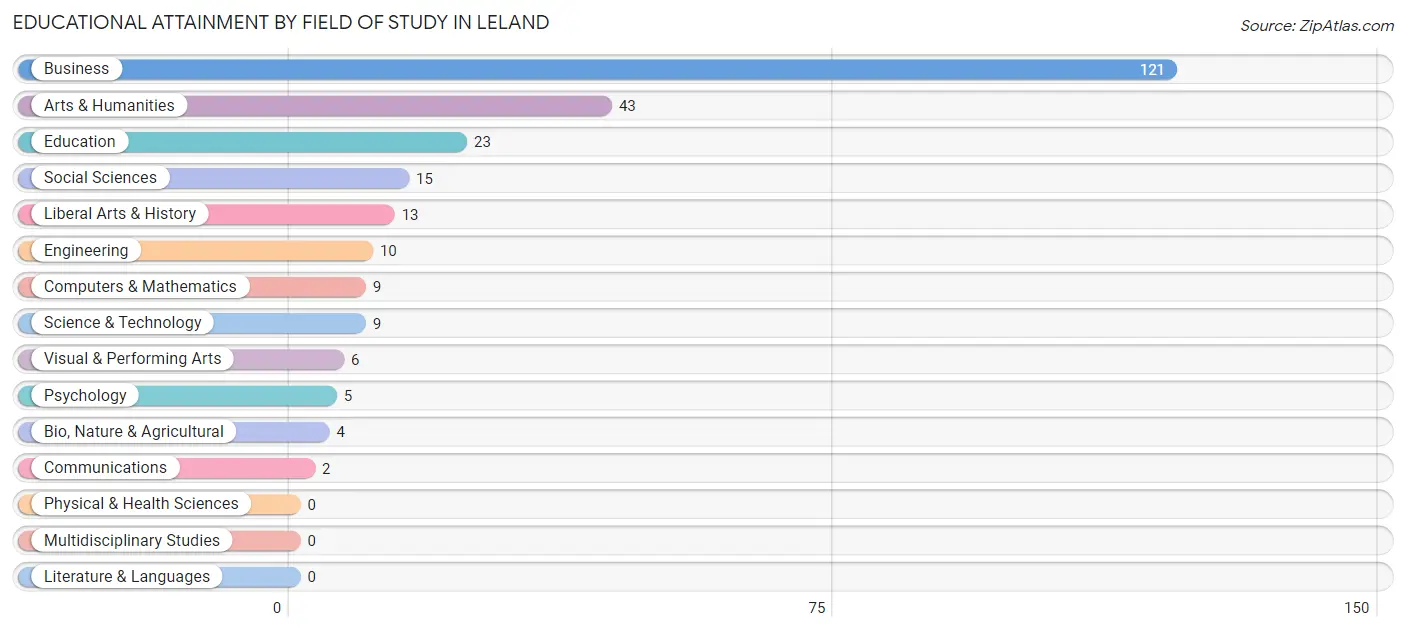
| Field of Study | # Graduates | % Graduates |
| Computers & Mathematics | 9 | 3.5% |
| Bio, Nature & Agricultural | 4 | 1.5% |
| Physical & Health Sciences | 0 | 0.0% |
| Psychology | 5 | 1.9% |
| Social Sciences | 15 | 5.8% |
| Engineering | 10 | 3.8% |
| Multidisciplinary Studies | 0 | 0.0% |
| Science & Technology | 9 | 3.5% |
| Business | 121 | 46.5% |
| Education | 23 | 8.8% |
| Literature & Languages | 0 | 0.0% |
| Liberal Arts & History | 13 | 5.0% |
| Visual & Performing Arts | 6 | 2.3% |
| Communications | 2 | 0.8% |
| Arts & Humanities | 43 | 16.5% |
| Total | 260 | 100.0% |
Transportation & Commute in Leland
Vehicle Availability by Sex in Leland
The most prevalent vehicle ownership categories in Leland are males with 2 vehicles (170, accounting for 51.8%) and females with 2 vehicles (92, making up 85.0%).
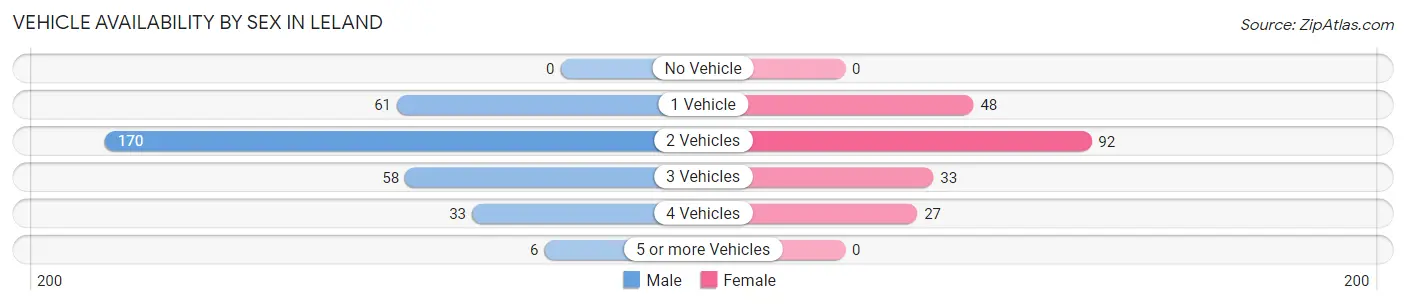
| Vehicles Available | Male | Female |
| No Vehicle | 0 (0.0%) | 0 (0.0%) |
| 1 Vehicle | 61 (18.6%) | 48 (24.0%) |
| 2 Vehicles | 170 (51.8%) | 92 (46.0%) |
| 3 Vehicles | 58 (17.7%) | 33 (16.5%) |
| 4 Vehicles | 33 (10.1%) | 27 (13.5%) |
| 5 or more Vehicles | 6 (1.8%) | 0 (0.0%) |
| Total | 328 (100.0%) | 200 (100.0%) |
Commute Time in Leland
The most frequently occuring commute durations in Leland are 15 to 19 minutes (76 commuters, 15.3%), 45 to 59 minutes (67 commuters, 13.5%), and 30 to 34 minutes (61 commuters, 12.3%).
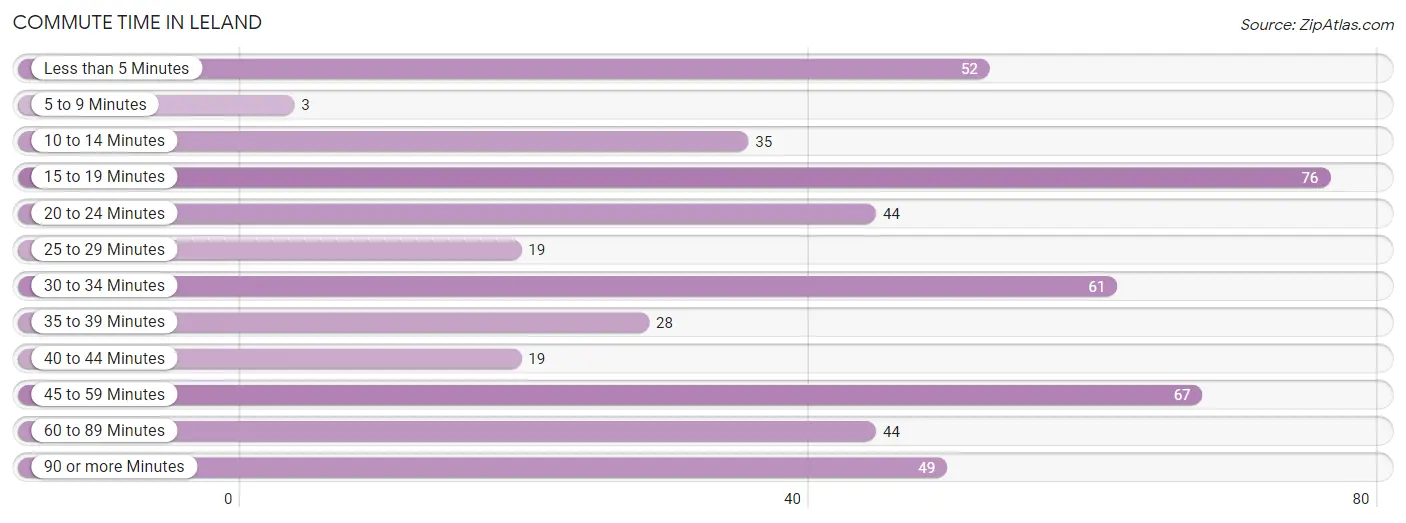
| Commute Time | # Commuters | % Commuters |
| Less than 5 Minutes | 52 | 10.5% |
| 5 to 9 Minutes | 3 | 0.6% |
| 10 to 14 Minutes | 35 | 7.0% |
| 15 to 19 Minutes | 76 | 15.3% |
| 20 to 24 Minutes | 44 | 8.8% |
| 25 to 29 Minutes | 19 | 3.8% |
| 30 to 34 Minutes | 61 | 12.3% |
| 35 to 39 Minutes | 28 | 5.6% |
| 40 to 44 Minutes | 19 | 3.8% |
| 45 to 59 Minutes | 67 | 13.5% |
| 60 to 89 Minutes | 44 | 8.8% |
| 90 or more Minutes | 49 | 9.9% |
Commute Time by Sex in Leland
The most common commute times in Leland are 45 to 59 minutes (55 commuters, 17.1%) for males and less than 5 minutes (41 commuters, 23.3%) for females.
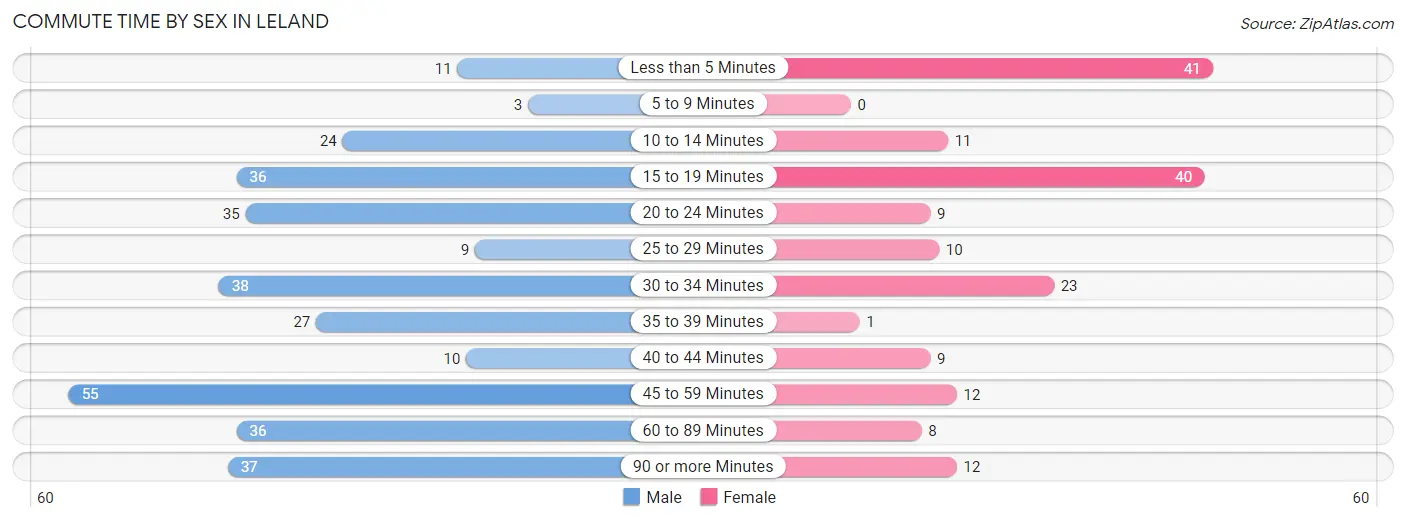
| Commute Time | Male | Female |
| Less than 5 Minutes | 11 (3.4%) | 41 (23.3%) |
| 5 to 9 Minutes | 3 (0.9%) | 0 (0.0%) |
| 10 to 14 Minutes | 24 (7.5%) | 11 (6.2%) |
| 15 to 19 Minutes | 36 (11.2%) | 40 (22.7%) |
| 20 to 24 Minutes | 35 (10.9%) | 9 (5.1%) |
| 25 to 29 Minutes | 9 (2.8%) | 10 (5.7%) |
| 30 to 34 Minutes | 38 (11.8%) | 23 (13.1%) |
| 35 to 39 Minutes | 27 (8.4%) | 1 (0.6%) |
| 40 to 44 Minutes | 10 (3.1%) | 9 (5.1%) |
| 45 to 59 Minutes | 55 (17.1%) | 12 (6.8%) |
| 60 to 89 Minutes | 36 (11.2%) | 8 (4.5%) |
| 90 or more Minutes | 37 (11.5%) | 12 (6.8%) |
Time of Departure to Work by Sex in Leland
The most frequent times of departure to work in Leland are 6:00 AM to 6:29 AM (60, 18.7%) for males and 7:30 AM to 7:59 AM (29, 16.5%) for females.
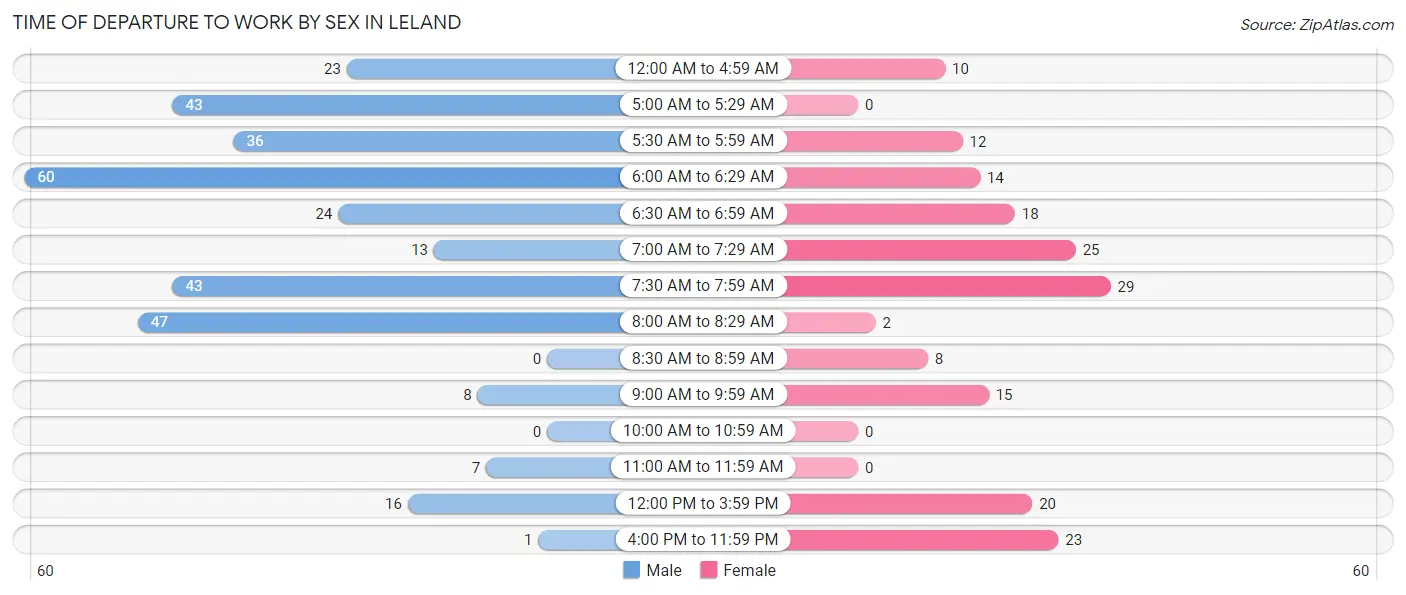
| Time of Departure | Male | Female |
| 12:00 AM to 4:59 AM | 23 (7.2%) | 10 (5.7%) |
| 5:00 AM to 5:29 AM | 43 (13.4%) | 0 (0.0%) |
| 5:30 AM to 5:59 AM | 36 (11.2%) | 12 (6.8%) |
| 6:00 AM to 6:29 AM | 60 (18.7%) | 14 (8.0%) |
| 6:30 AM to 6:59 AM | 24 (7.5%) | 18 (10.2%) |
| 7:00 AM to 7:29 AM | 13 (4.1%) | 25 (14.2%) |
| 7:30 AM to 7:59 AM | 43 (13.4%) | 29 (16.5%) |
| 8:00 AM to 8:29 AM | 47 (14.6%) | 2 (1.1%) |
| 8:30 AM to 8:59 AM | 0 (0.0%) | 8 (4.5%) |
| 9:00 AM to 9:59 AM | 8 (2.5%) | 15 (8.5%) |
| 10:00 AM to 10:59 AM | 0 (0.0%) | 0 (0.0%) |
| 11:00 AM to 11:59 AM | 7 (2.2%) | 0 (0.0%) |
| 12:00 PM to 3:59 PM | 16 (5.0%) | 20 (11.4%) |
| 4:00 PM to 11:59 PM | 1 (0.3%) | 23 (13.1%) |
| Total | 321 (100.0%) | 176 (100.0%) |
Housing Occupancy in Leland
Occupancy by Ownership in Leland
Of the total 462 dwellings in Leland, owner-occupied units account for 376 (81.4%), while renter-occupied units make up 86 (18.6%).
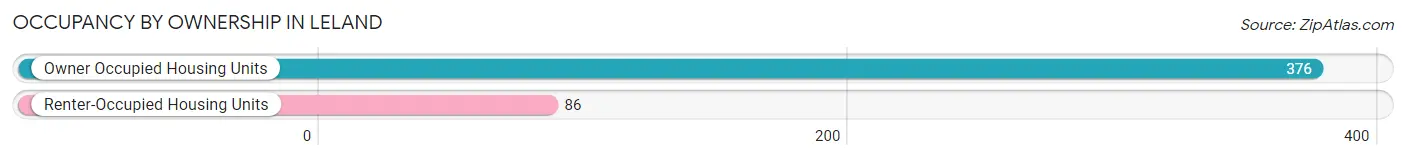
| Occupancy | # Housing Units | % Housing Units |
| Owner Occupied Housing Units | 376 | 81.4% |
| Renter-Occupied Housing Units | 86 | 18.6% |
| Total Occupied Housing Units | 462 | 100.0% |
Occupancy by Household Size in Leland
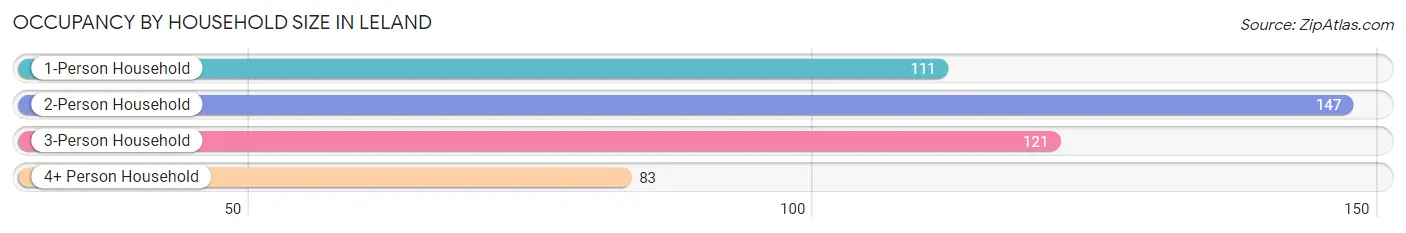
| Household Size | # Housing Units | % Housing Units |
| 1-Person Household | 111 | 24.0% |
| 2-Person Household | 147 | 31.8% |
| 3-Person Household | 121 | 26.2% |
| 4+ Person Household | 83 | 18.0% |
| Total Housing Units | 462 | 100.0% |
Occupancy by Ownership by Household Size in Leland
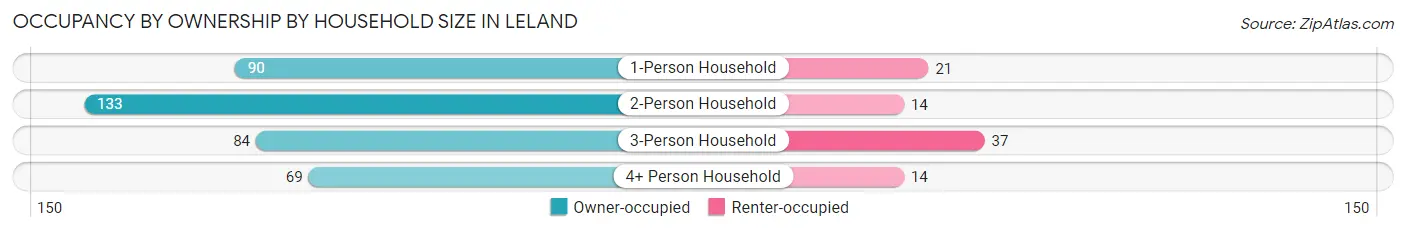
| Household Size | Owner-occupied | Renter-occupied |
| 1-Person Household | 90 (81.1%) | 21 (18.9%) |
| 2-Person Household | 133 (90.5%) | 14 (9.5%) |
| 3-Person Household | 84 (69.4%) | 37 (30.6%) |
| 4+ Person Household | 69 (83.1%) | 14 (16.9%) |
| Total Housing Units | 376 (81.4%) | 86 (18.6%) |
Occupancy by Educational Attainment in Leland
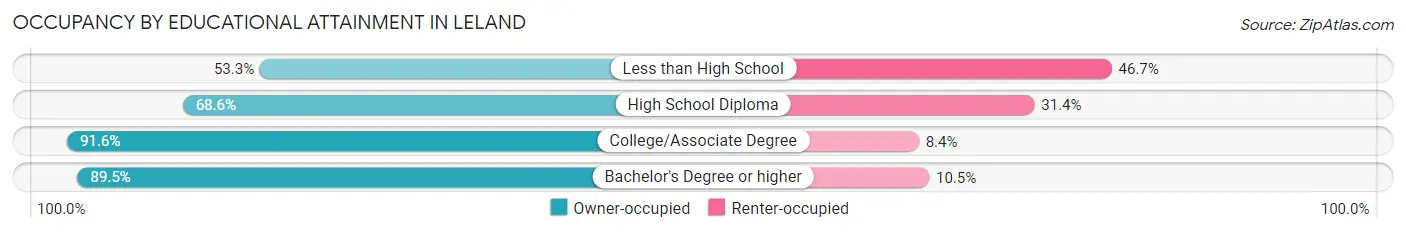
| Household Size | Owner-occupied | Renter-occupied |
| Less than High School | 8 (53.3%) | 7 (46.7%) |
| High School Diploma | 116 (68.6%) | 53 (31.4%) |
| College/Associate Degree | 141 (91.6%) | 13 (8.4%) |
| Bachelor's Degree or higher | 111 (89.5%) | 13 (10.5%) |
Occupancy by Age of Householder in Leland
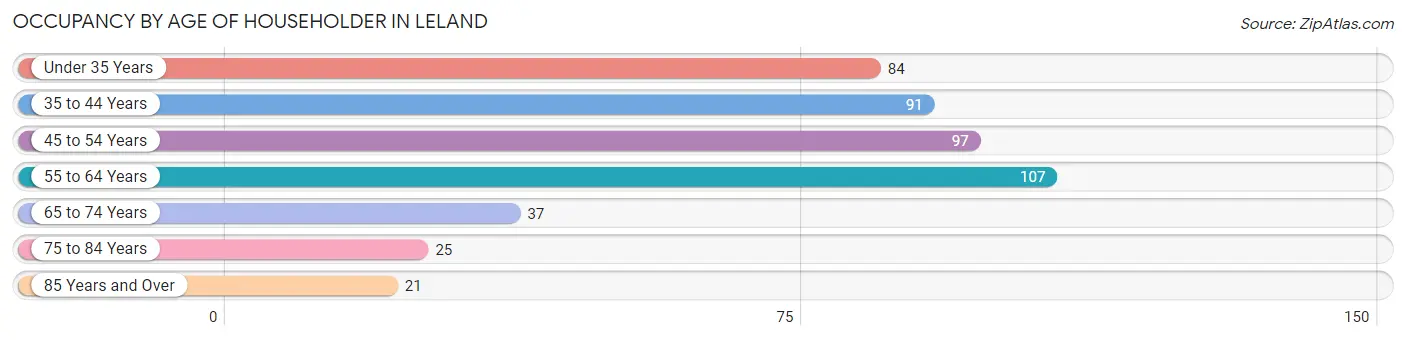
| Age Bracket | # Households | % Households |
| Under 35 Years | 84 | 18.2% |
| 35 to 44 Years | 91 | 19.7% |
| 45 to 54 Years | 97 | 21.0% |
| 55 to 64 Years | 107 | 23.2% |
| 65 to 74 Years | 37 | 8.0% |
| 75 to 84 Years | 25 | 5.4% |
| 85 Years and Over | 21 | 4.5% |
| Total | 462 | 100.0% |
Housing Finances in Leland
Median Income by Occupancy in Leland
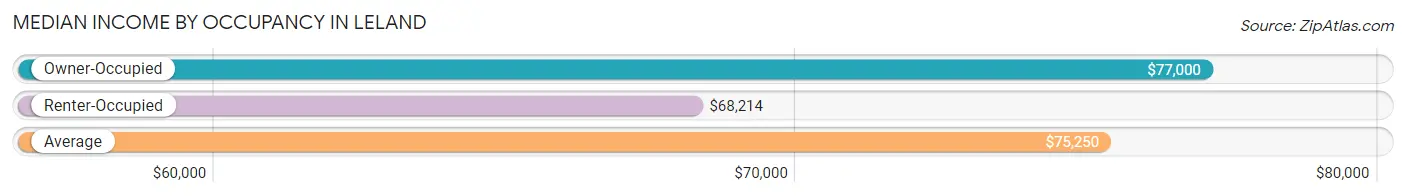
| Occupancy Type | # Households | Median Income |
| Owner-Occupied | 376 (81.4%) | $77,000 |
| Renter-Occupied | 86 (18.6%) | $68,214 |
| Average | 462 (100.0%) | $75,250 |
Occupancy by Householder Income Bracket in Leland
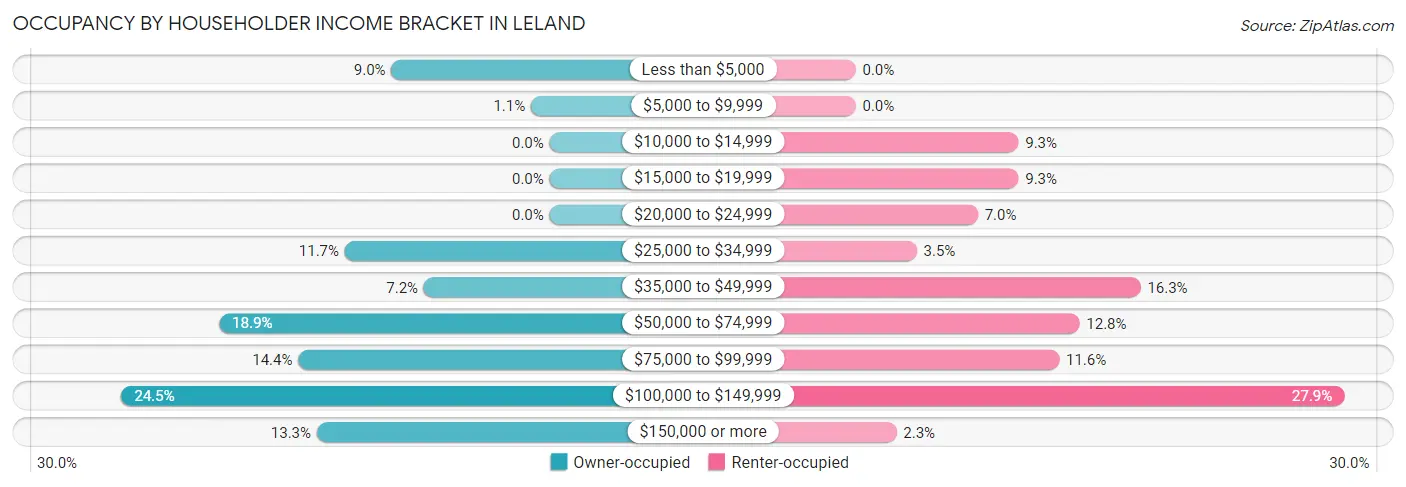
| Income Bracket | Owner-occupied | Renter-occupied |
| Less than $5,000 | 34 (9.0%) | 0 (0.0%) |
| $5,000 to $9,999 | 4 (1.1%) | 0 (0.0%) |
| $10,000 to $14,999 | 0 (0.0%) | 8 (9.3%) |
| $15,000 to $19,999 | 0 (0.0%) | 8 (9.3%) |
| $20,000 to $24,999 | 0 (0.0%) | 6 (7.0%) |
| $25,000 to $34,999 | 44 (11.7%) | 3 (3.5%) |
| $35,000 to $49,999 | 27 (7.2%) | 14 (16.3%) |
| $50,000 to $74,999 | 71 (18.9%) | 11 (12.8%) |
| $75,000 to $99,999 | 54 (14.4%) | 10 (11.6%) |
| $100,000 to $149,999 | 92 (24.5%) | 24 (27.9%) |
| $150,000 or more | 50 (13.3%) | 2 (2.3%) |
| Total | 376 (100.0%) | 86 (100.0%) |
Monthly Housing Cost Tiers in Leland
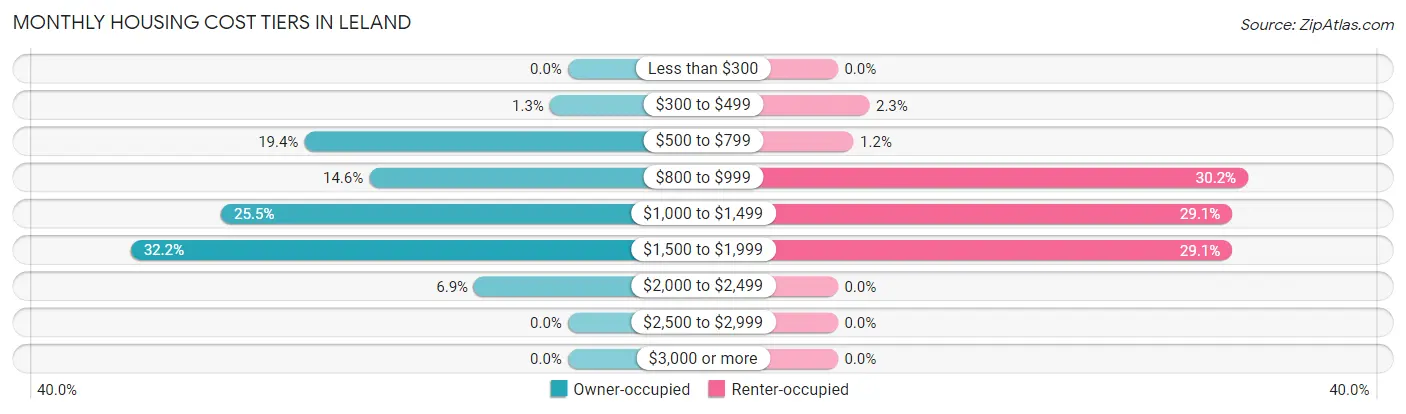
| Monthly Cost | Owner-occupied | Renter-occupied |
| Less than $300 | 0 (0.0%) | 0 (0.0%) |
| $300 to $499 | 5 (1.3%) | 2 (2.3%) |
| $500 to $799 | 73 (19.4%) | 1 (1.2%) |
| $800 to $999 | 55 (14.6%) | 26 (30.2%) |
| $1,000 to $1,499 | 96 (25.5%) | 25 (29.1%) |
| $1,500 to $1,999 | 121 (32.2%) | 25 (29.1%) |
| $2,000 to $2,499 | 26 (6.9%) | 0 (0.0%) |
| $2,500 to $2,999 | 0 (0.0%) | 0 (0.0%) |
| $3,000 or more | 0 (0.0%) | 0 (0.0%) |
| Total | 376 (100.0%) | 86 (100.0%) |
Physical Housing Characteristics in Leland
Housing Structures in Leland
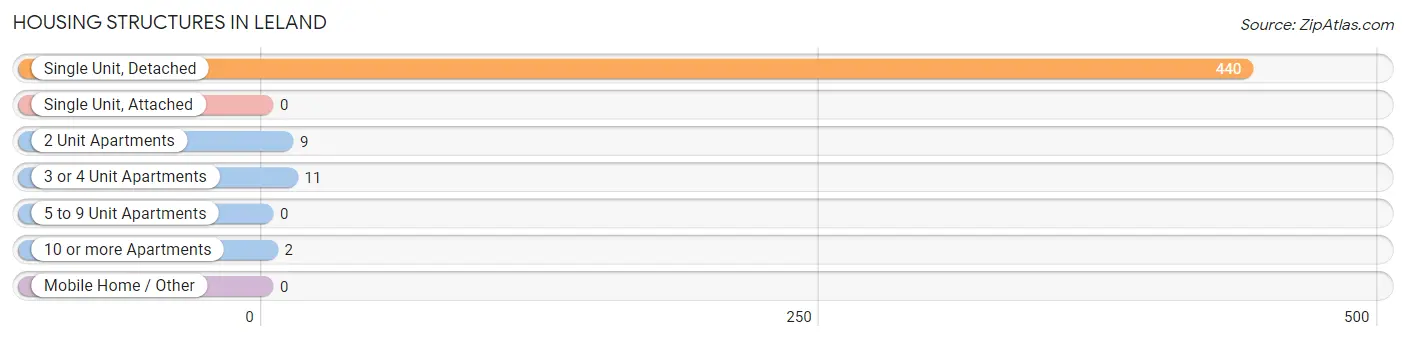
| Structure Type | # Housing Units | % Housing Units |
| Single Unit, Detached | 440 | 95.2% |
| Single Unit, Attached | 0 | 0.0% |
| 2 Unit Apartments | 9 | 1.9% |
| 3 or 4 Unit Apartments | 11 | 2.4% |
| 5 to 9 Unit Apartments | 0 | 0.0% |
| 10 or more Apartments | 2 | 0.4% |
| Mobile Home / Other | 0 | 0.0% |
| Total | 462 | 100.0% |
Housing Structures by Occupancy in Leland
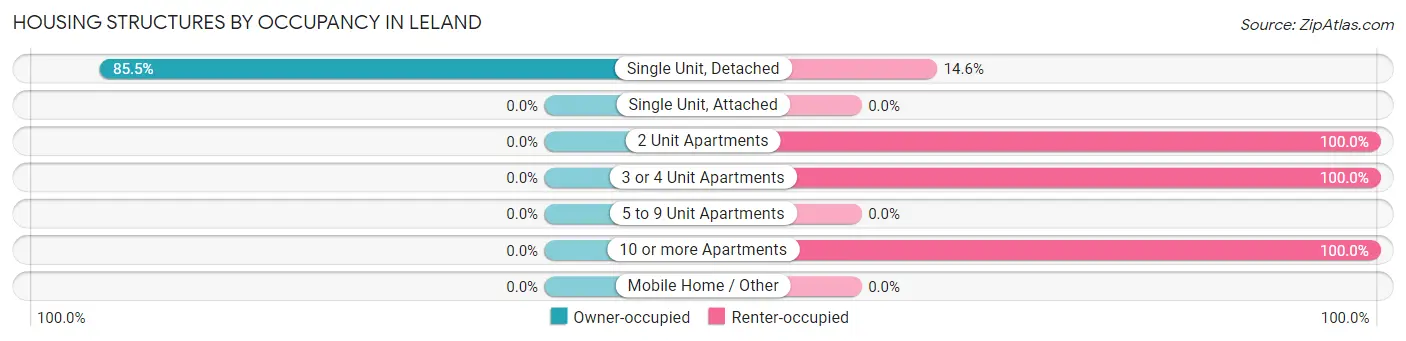
| Structure Type | Owner-occupied | Renter-occupied |
| Single Unit, Detached | 376 (85.5%) | 64 (14.5%) |
| Single Unit, Attached | 0 (0.0%) | 0 (0.0%) |
| 2 Unit Apartments | 0 (0.0%) | 9 (100.0%) |
| 3 or 4 Unit Apartments | 0 (0.0%) | 11 (100.0%) |
| 5 to 9 Unit Apartments | 0 (0.0%) | 0 (0.0%) |
| 10 or more Apartments | 0 (0.0%) | 2 (100.0%) |
| Mobile Home / Other | 0 (0.0%) | 0 (0.0%) |
| Total | 376 (81.4%) | 86 (18.6%) |
Housing Structures by Number of Rooms in Leland
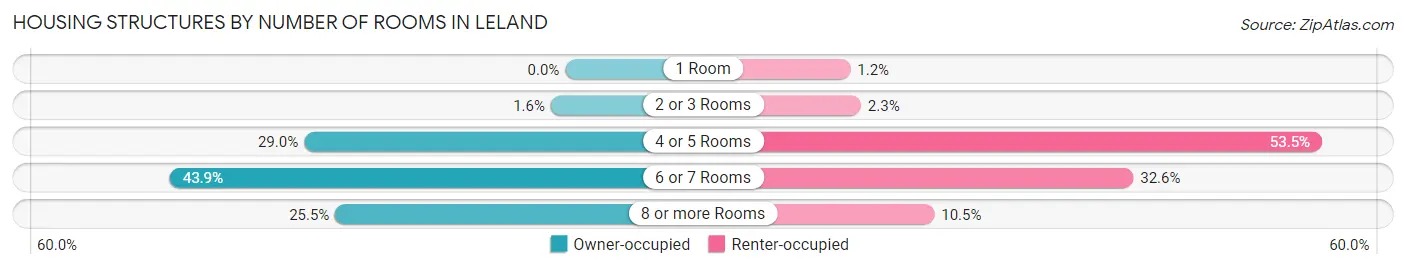
| Number of Rooms | Owner-occupied | Renter-occupied |
| 1 Room | 0 (0.0%) | 1 (1.2%) |
| 2 or 3 Rooms | 6 (1.6%) | 2 (2.3%) |
| 4 or 5 Rooms | 109 (29.0%) | 46 (53.5%) |
| 6 or 7 Rooms | 165 (43.9%) | 28 (32.6%) |
| 8 or more Rooms | 96 (25.5%) | 9 (10.5%) |
| Total | 376 (100.0%) | 86 (100.0%) |
Housing Structure by Heating Type in Leland
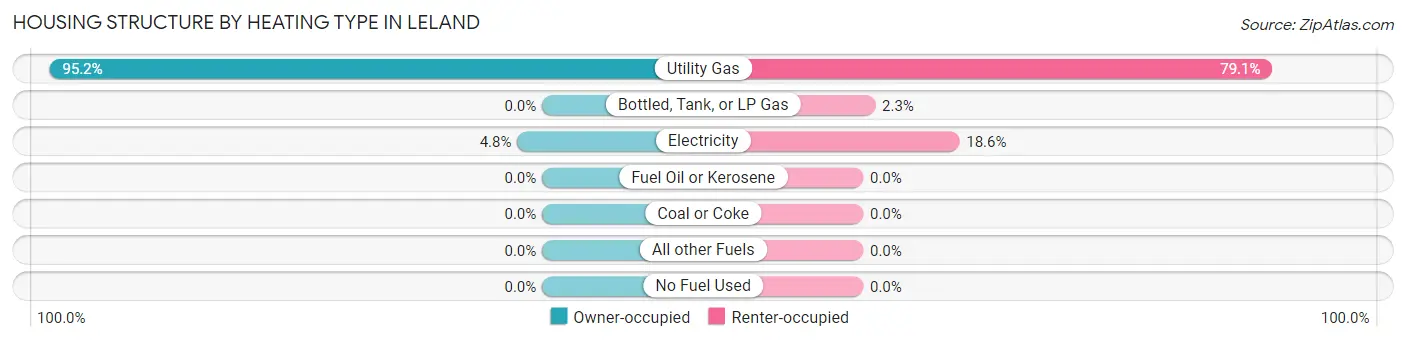
| Heating Type | Owner-occupied | Renter-occupied |
| Utility Gas | 358 (95.2%) | 68 (79.1%) |
| Bottled, Tank, or LP Gas | 0 (0.0%) | 2 (2.3%) |
| Electricity | 18 (4.8%) | 16 (18.6%) |
| Fuel Oil or Kerosene | 0 (0.0%) | 0 (0.0%) |
| Coal or Coke | 0 (0.0%) | 0 (0.0%) |
| All other Fuels | 0 (0.0%) | 0 (0.0%) |
| No Fuel Used | 0 (0.0%) | 0 (0.0%) |
| Total | 376 (100.0%) | 86 (100.0%) |
Household Vehicle Usage in Leland
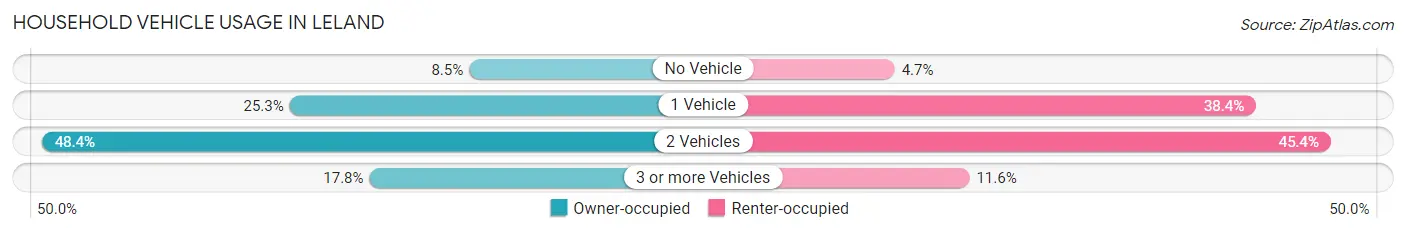
| Vehicles per Household | Owner-occupied | Renter-occupied |
| No Vehicle | 32 (8.5%) | 4 (4.6%) |
| 1 Vehicle | 95 (25.3%) | 33 (38.4%) |
| 2 Vehicles | 182 (48.4%) | 39 (45.4%) |
| 3 or more Vehicles | 67 (17.8%) | 10 (11.6%) |
| Total | 376 (100.0%) | 86 (100.0%) |
Real Estate & Mortgages in Leland
Real Estate and Mortgage Overview in Leland
| Characteristic | Without Mortgage | With Mortgage |
| Housing Units | 111 | 265 |
| Median Property Value | $145,500 | $171,700 |
| Median Household Income | $66,875 | $30 |
| Monthly Housing Costs | $703 | $0 |
| Real Estate Taxes | $4,397 | $0 |
Property Value by Mortgage Status in Leland
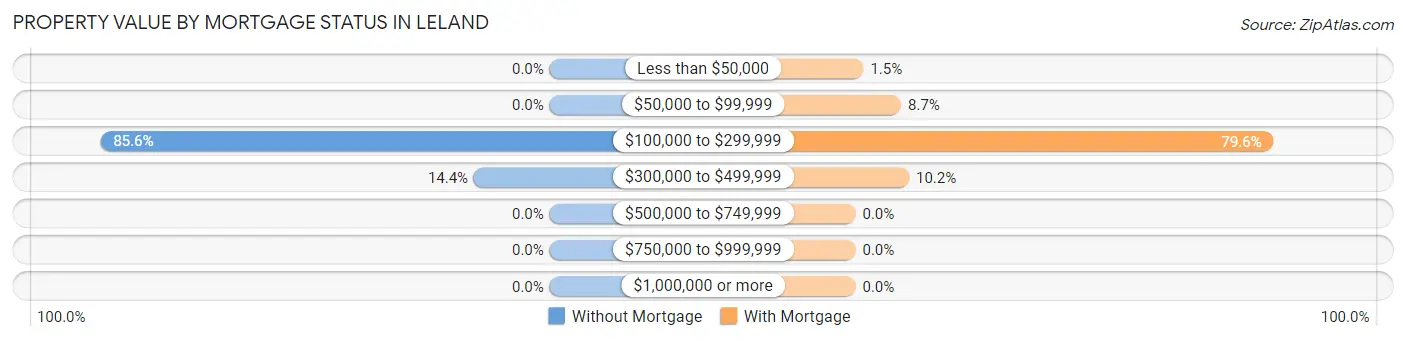
| Property Value | Without Mortgage | With Mortgage |
| Less than $50,000 | 0 (0.0%) | 4 (1.5%) |
| $50,000 to $99,999 | 0 (0.0%) | 23 (8.7%) |
| $100,000 to $299,999 | 95 (85.6%) | 211 (79.6%) |
| $300,000 to $499,999 | 16 (14.4%) | 27 (10.2%) |
| $500,000 to $749,999 | 0 (0.0%) | 0 (0.0%) |
| $750,000 to $999,999 | 0 (0.0%) | 0 (0.0%) |
| $1,000,000 or more | 0 (0.0%) | 0 (0.0%) |
| Total | 111 (100.0%) | 265 (100.0%) |
Household Income by Mortgage Status in Leland
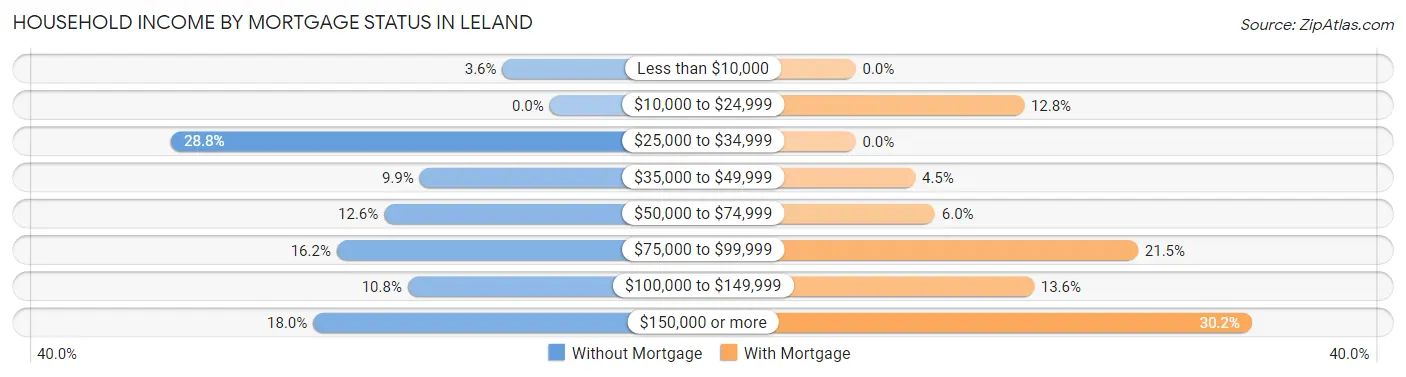
| Household Income | Without Mortgage | With Mortgage |
| Less than $10,000 | 4 (3.6%) | 0 (0.0%) |
| $10,000 to $24,999 | 0 (0.0%) | 34 (12.8%) |
| $25,000 to $34,999 | 32 (28.8%) | 0 (0.0%) |
| $35,000 to $49,999 | 11 (9.9%) | 12 (4.5%) |
| $50,000 to $74,999 | 14 (12.6%) | 16 (6.0%) |
| $75,000 to $99,999 | 18 (16.2%) | 57 (21.5%) |
| $100,000 to $149,999 | 12 (10.8%) | 36 (13.6%) |
| $150,000 or more | 20 (18.0%) | 80 (30.2%) |
| Total | 111 (100.0%) | 265 (100.0%) |
Property Value to Household Income Ratio in Leland
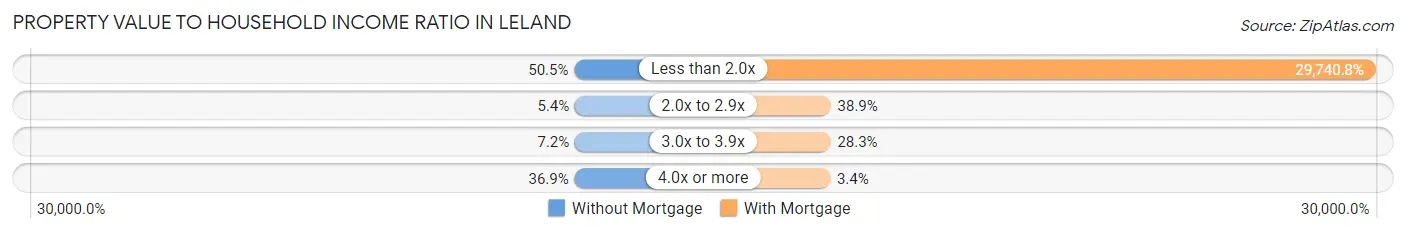
| Value-to-Income Ratio | Without Mortgage | With Mortgage |
| Less than 2.0x | 56 (50.4%) | 78,813 (29,740.8%) |
| 2.0x to 2.9x | 6 (5.4%) | 103 (38.9%) |
| 3.0x to 3.9x | 8 (7.2%) | 75 (28.3%) |
| 4.0x or more | 41 (36.9%) | 9 (3.4%) |
| Total | 111 (100.0%) | 265 (100.0%) |
Real Estate Taxes by Mortgage Status in Leland
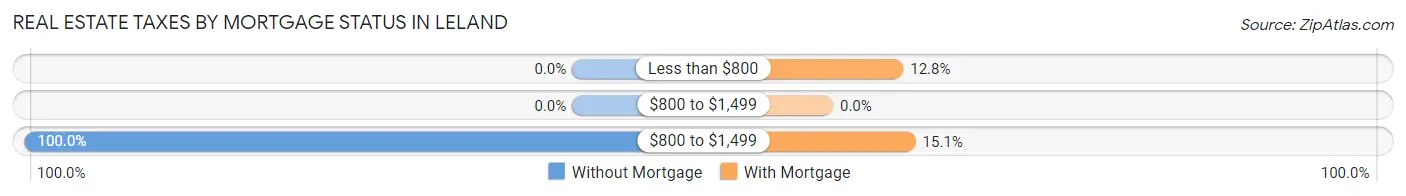
| Property Taxes | Without Mortgage | With Mortgage |
| Less than $800 | 0 (0.0%) | 34 (12.8%) |
| $800 to $1,499 | 0 (0.0%) | 0 (0.0%) |
| $800 to $1,499 | 111 (100.0%) | 40 (15.1%) |
| Total | 111 (100.0%) | 265 (100.0%) |
Health & Disability in Leland
Health Insurance Coverage by Age in Leland
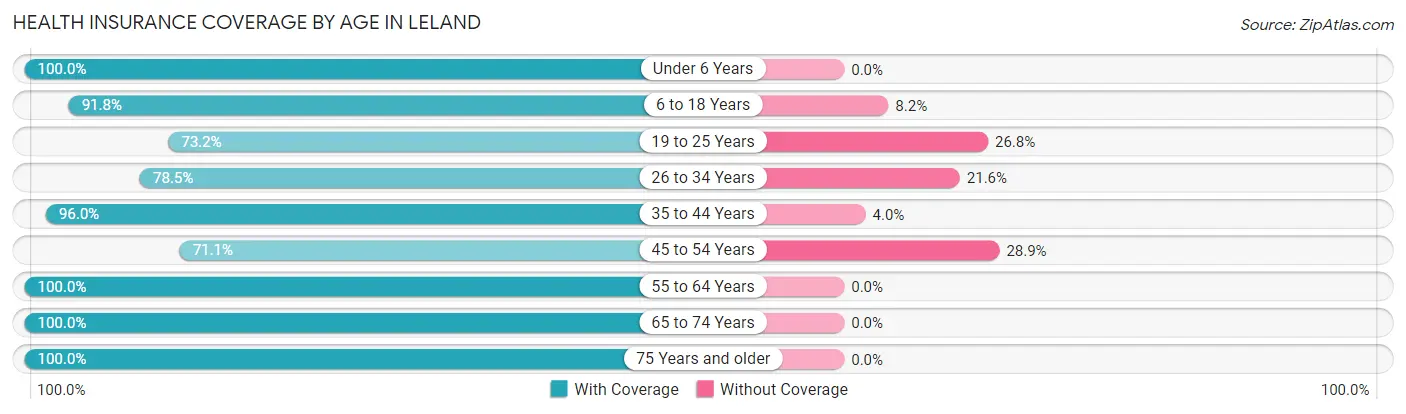
| Age Bracket | With Coverage | Without Coverage |
| Under 6 Years | 61 (100.0%) | 0 (0.0%) |
| 6 to 18 Years | 212 (91.8%) | 19 (8.2%) |
| 19 to 25 Years | 71 (73.2%) | 26 (26.8%) |
| 26 to 34 Years | 91 (78.4%) | 25 (21.5%) |
| 35 to 44 Years | 169 (96.0%) | 7 (4.0%) |
| 45 to 54 Years | 140 (71.1%) | 57 (28.9%) |
| 55 to 64 Years | 146 (100.0%) | 0 (0.0%) |
| 65 to 74 Years | 61 (100.0%) | 0 (0.0%) |
| 75 Years and older | 71 (100.0%) | 0 (0.0%) |
| Total | 1,022 (88.4%) | 134 (11.6%) |
Health Insurance Coverage by Citizenship Status in Leland
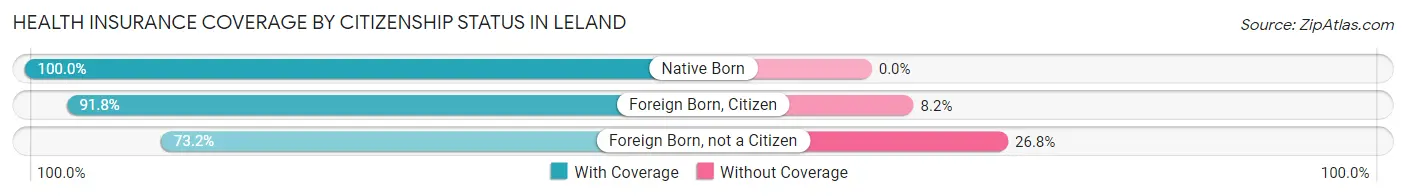
| Citizenship Status | With Coverage | Without Coverage |
| Native Born | 61 (100.0%) | 0 (0.0%) |
| Foreign Born, Citizen | 212 (91.8%) | 19 (8.2%) |
| Foreign Born, not a Citizen | 71 (73.2%) | 26 (26.8%) |
Health Insurance Coverage by Household Income in Leland
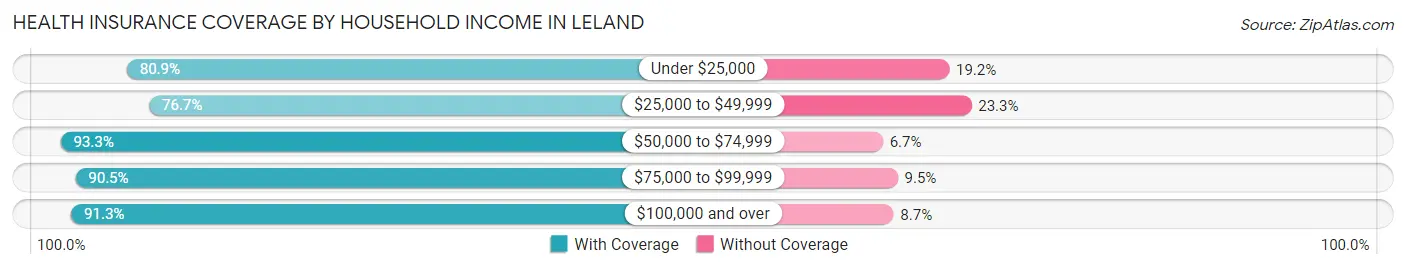
| Household Income | With Coverage | Without Coverage |
| Under $25,000 | 76 (80.8%) | 18 (19.2%) |
| $25,000 to $49,999 | 138 (76.7%) | 42 (23.3%) |
| $50,000 to $74,999 | 194 (93.3%) | 14 (6.7%) |
| $75,000 to $99,999 | 133 (90.5%) | 14 (9.5%) |
| $100,000 and over | 481 (91.3%) | 46 (8.7%) |
Public vs Private Health Insurance Coverage by Age in Leland
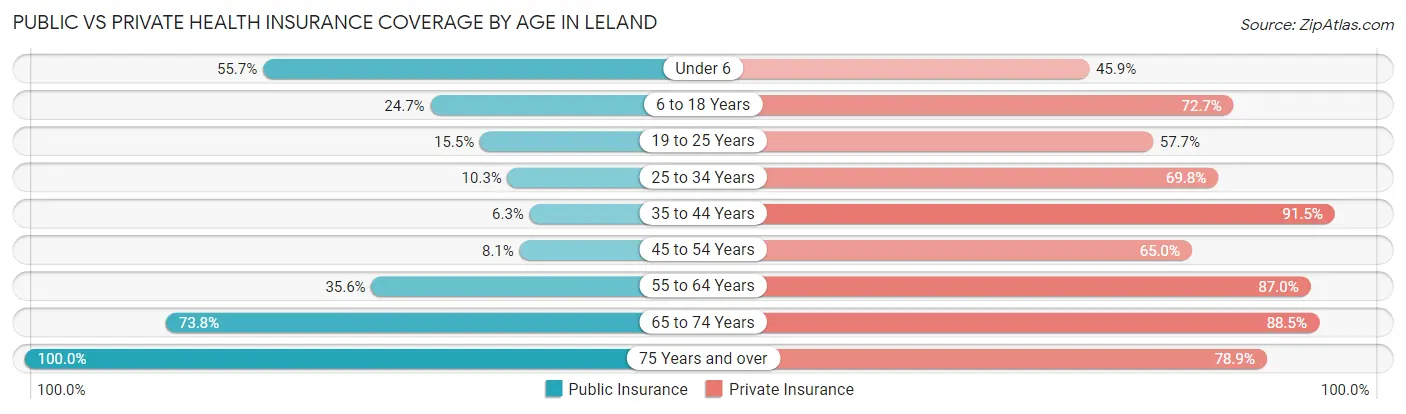
| Age Bracket | Public Insurance | Private Insurance |
| Under 6 | 34 (55.7%) | 28 (45.9%) |
| 6 to 18 Years | 57 (24.7%) | 168 (72.7%) |
| 19 to 25 Years | 15 (15.5%) | 56 (57.7%) |
| 25 to 34 Years | 12 (10.3%) | 81 (69.8%) |
| 35 to 44 Years | 11 (6.2%) | 161 (91.5%) |
| 45 to 54 Years | 16 (8.1%) | 128 (65.0%) |
| 55 to 64 Years | 52 (35.6%) | 127 (87.0%) |
| 65 to 74 Years | 45 (73.8%) | 54 (88.5%) |
| 75 Years and over | 71 (100.0%) | 56 (78.9%) |
| Total | 313 (27.1%) | 859 (74.3%) |
Disability Status by Sex by Age in Leland
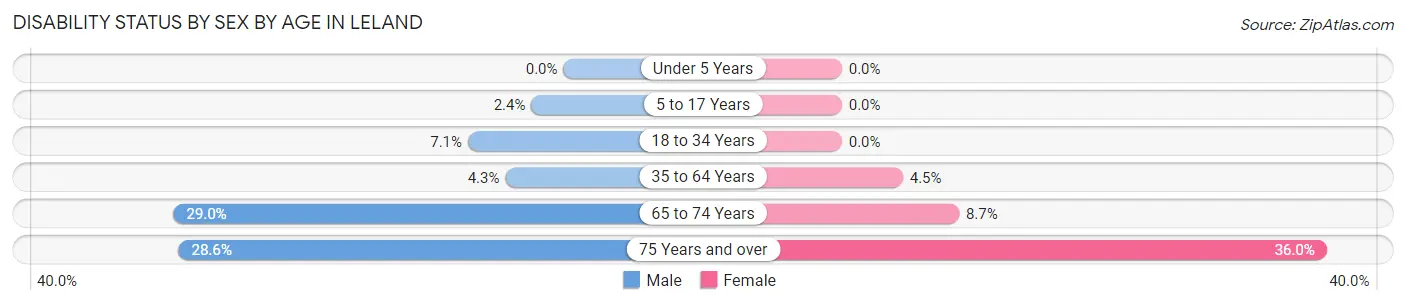
| Age Bracket | Male | Female |
| Under 5 Years | 0 (0.0%) | 0 (0.0%) |
| 5 to 17 Years | 3 (2.4%) | 0 (0.0%) |
| 18 to 34 Years | 9 (7.1%) | 0 (0.0%) |
| 35 to 64 Years | 10 (4.3%) | 13 (4.5%) |
| 65 to 74 Years | 11 (28.9%) | 2 (8.7%) |
| 75 Years and over | 6 (28.6%) | 18 (36.0%) |
Disability Class by Sex by Age in Leland
Disability Class: Hearing Difficulty
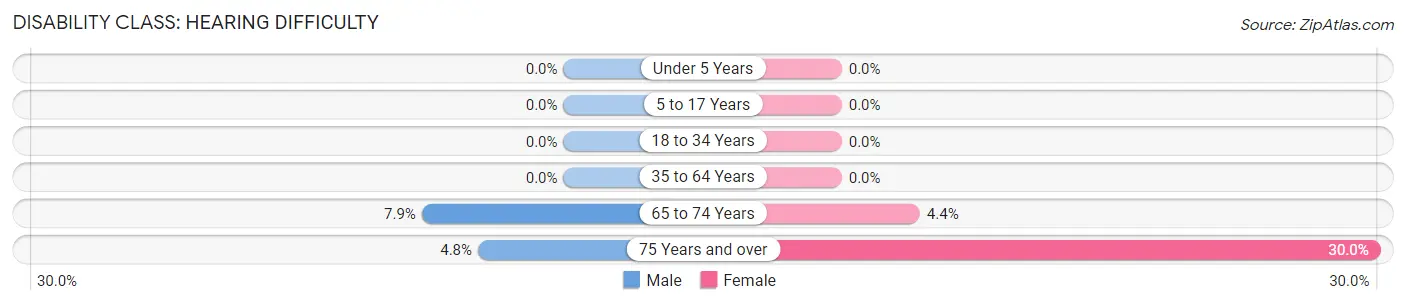
| Age Bracket | Male | Female |
| Under 5 Years | 0 (0.0%) | 0 (0.0%) |
| 5 to 17 Years | 0 (0.0%) | 0 (0.0%) |
| 18 to 34 Years | 0 (0.0%) | 0 (0.0%) |
| 35 to 64 Years | 0 (0.0%) | 0 (0.0%) |
| 65 to 74 Years | 3 (7.9%) | 1 (4.3%) |
| 75 Years and over | 1 (4.8%) | 15 (30.0%) |
Disability Class: Vision Difficulty
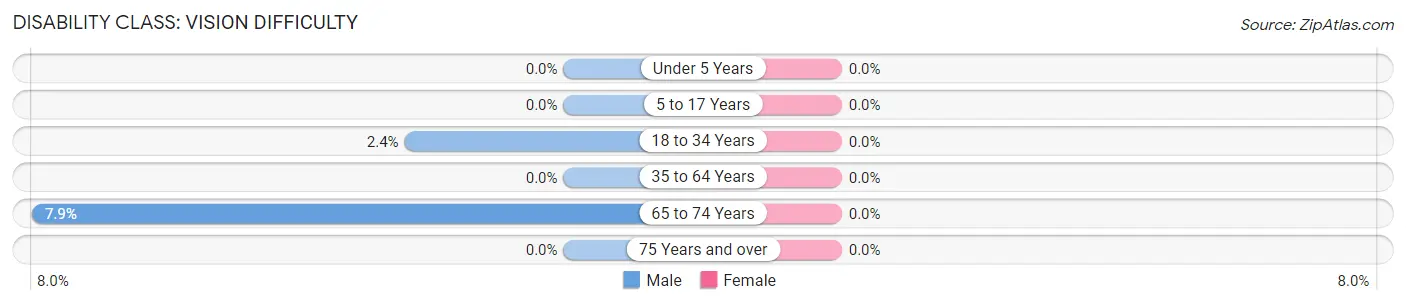
| Age Bracket | Male | Female |
| Under 5 Years | 0 (0.0%) | 0 (0.0%) |
| 5 to 17 Years | 0 (0.0%) | 0 (0.0%) |
| 18 to 34 Years | 3 (2.4%) | 0 (0.0%) |
| 35 to 64 Years | 0 (0.0%) | 0 (0.0%) |
| 65 to 74 Years | 3 (7.9%) | 0 (0.0%) |
| 75 Years and over | 0 (0.0%) | 0 (0.0%) |
Disability Class: Cognitive Difficulty
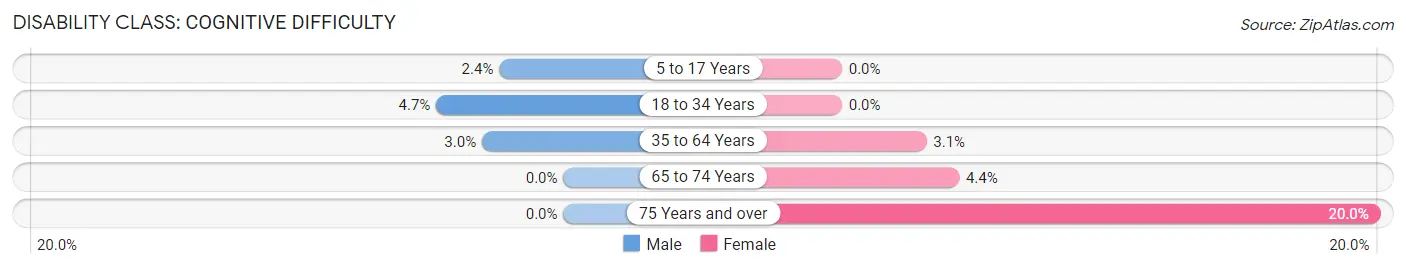
| Age Bracket | Male | Female |
| 5 to 17 Years | 3 (2.4%) | 0 (0.0%) |
| 18 to 34 Years | 6 (4.7%) | 0 (0.0%) |
| 35 to 64 Years | 7 (3.0%) | 9 (3.1%) |
| 65 to 74 Years | 0 (0.0%) | 1 (4.3%) |
| 75 Years and over | 0 (0.0%) | 10 (20.0%) |
Disability Class: Ambulatory Difficulty
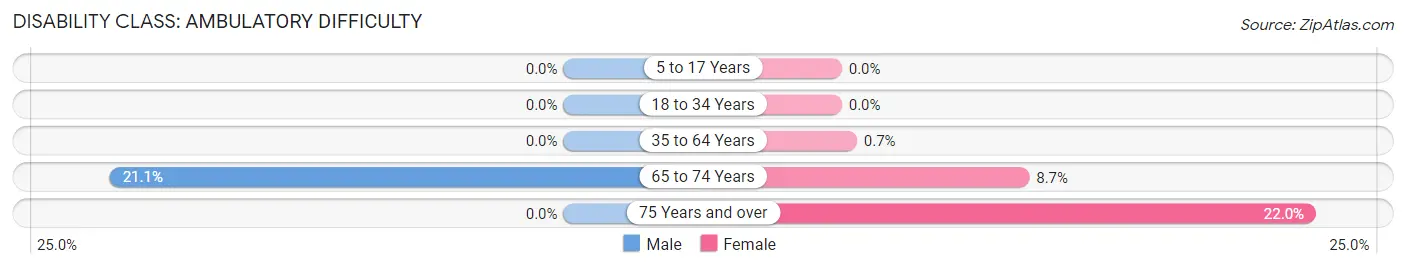
| Age Bracket | Male | Female |
| 5 to 17 Years | 0 (0.0%) | 0 (0.0%) |
| 18 to 34 Years | 0 (0.0%) | 0 (0.0%) |
| 35 to 64 Years | 0 (0.0%) | 2 (0.7%) |
| 65 to 74 Years | 8 (21.0%) | 2 (8.7%) |
| 75 Years and over | 0 (0.0%) | 11 (22.0%) |
Disability Class: Self-Care Difficulty
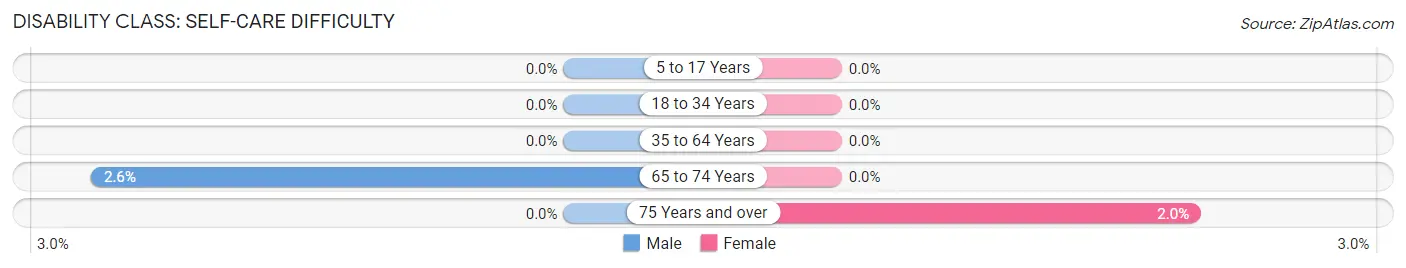
| Age Bracket | Male | Female |
| 5 to 17 Years | 0 (0.0%) | 0 (0.0%) |
| 18 to 34 Years | 0 (0.0%) | 0 (0.0%) |
| 35 to 64 Years | 0 (0.0%) | 0 (0.0%) |
| 65 to 74 Years | 1 (2.6%) | 0 (0.0%) |
| 75 Years and over | 0 (0.0%) | 1 (2.0%) |
Technology Access in Leland
Computing Device Access in Leland
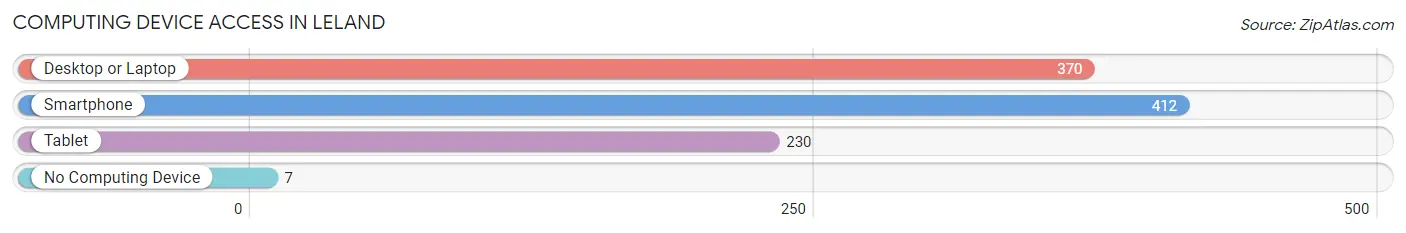
| Device Type | # Households | % Households |
| Desktop or Laptop | 370 | 80.1% |
| Smartphone | 412 | 89.2% |
| Tablet | 230 | 49.8% |
| No Computing Device | 7 | 1.5% |
| Total | 462 | 100.0% |
Internet Access in Leland
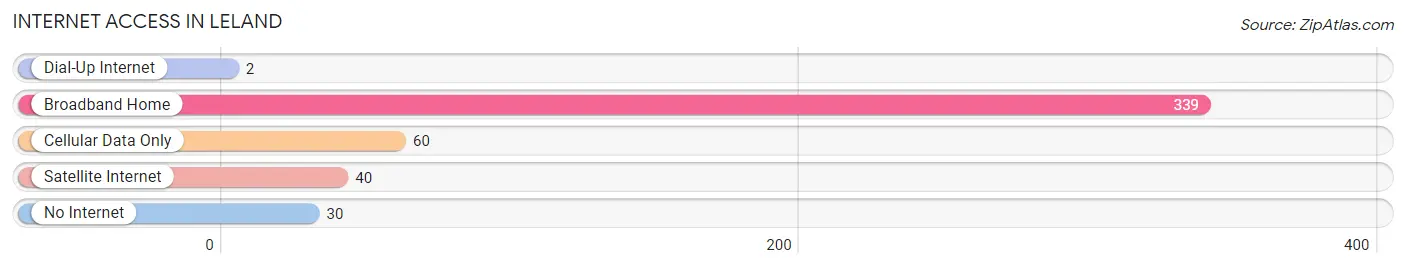
| Internet Type | # Households | % Households |
| Dial-Up Internet | 2 | 0.4% |
| Broadband Home | 339 | 73.4% |
| Cellular Data Only | 60 | 13.0% |
| Satellite Internet | 40 | 8.7% |
| No Internet | 30 | 6.5% |
| Total | 462 | 100.0% |
Leland Summary
Leland, Illinois is a small village located in LaSalle County, Illinois. It is situated on the banks of the Vermilion River, approximately 25 miles southwest of the city of Chicago. The village has a population of approximately 1,400 people and covers an area of 0.7 square miles.
History
The area that is now Leland was first settled in the early 1800s by a group of French-Canadian immigrants. The village was originally known as “La Salle” after the explorer René-Robert Cavelier, Sieur de La Salle. The village was officially incorporated in 1867 and was renamed Leland in honor of the first postmaster, William Leland.
In the late 1800s, the village was a thriving agricultural community. The main crops grown in the area were corn, wheat, oats, and hay. The village also had a number of small businesses, including a blacksmith, a general store, and a hotel.
In the early 1900s, the village began to experience a decline in population as many of the residents moved away to larger cities in search of better job opportunities. The village was also affected by the Great Depression, which caused many of the businesses to close.
Geography
Leland is located in LaSalle County, Illinois. It is situated on the banks of the Vermilion River, approximately 25 miles southwest of the city of Chicago. The village has a total area of 0.7 square miles, all of which is land.
The village is located in a flat, open area with few trees. The soil is mostly sandy loam, which is ideal for growing crops. The climate is humid continental, with hot summers and cold winters.
Economy
The economy of Leland is largely based on agriculture. The main crops grown in the area are corn, wheat, oats, and hay. The village also has a number of small businesses, including a general store, a hardware store, and a restaurant.
The village is also home to a number of manufacturing companies, including a plastics factory and a metal fabrication plant. The village is also home to a number of small businesses, including a bakery, a florist, and a furniture store.
Demographics
As of the 2010 census, the population of Leland was 1,400. The racial makeup of the village was 97.3% White, 0.7% African American, 0.3% Native American, 0.3% Asian, and 1.3% from other races. The median household income was $45,000, and the median family income was $50,000.
The village is served by the Leland Community Unit School District, which consists of one elementary school, one middle school, and one high school. The village is also home to a number of churches, including the First Baptist Church, the United Methodist Church, and the Church of the Nazarene.
Conclusion
Leland, Illinois is a small village located in LaSalle County, Illinois. It is situated on the banks of the Vermilion River, approximately 25 miles southwest of the city of Chicago. The village has a population of approximately 1,400 people and covers an area of 0.7 square miles. The economy of the village is largely based on agriculture, with a number of small businesses also located in the area. The racial makeup of the village is predominantly White, with a small percentage of African American, Native American, and Asian residents. The village is served by the Leland Community Unit School District and is home to a number of churches.
Common Questions
What is Per Capita Income in Leland?
Per Capita income in Leland is $32,927.
What is the Median Family Income in Leland?
Median Family Income in Leland is $80,417.
What is the Median Household income in Leland?
Median Household Income in Leland is $75,250.
What is Income or Wage Gap in Leland?
Income or Wage Gap in Leland is 54.0%.
Women in Leland earn 46.0 cents for every dollar earned by a man.
What is Inequality or Gini Index in Leland?
Inequality or Gini Index in Leland is 0.37.
What is the Total Population of Leland?
Total Population of Leland is 1,156.
What is the Total Male Population of Leland?
Total Male Population of Leland is 554.
What is the Total Female Population of Leland?
Total Female Population of Leland is 602.
What is the Ratio of Males per 100 Females in Leland?
There are 92.03 Males per 100 Females in Leland.
What is the Ratio of Females per 100 Males in Leland?
There are 108.66 Females per 100 Males in Leland.
What is the Median Population Age in Leland?
Median Population Age in Leland is 39.3 Years.
What is the Average Family Size in Leland
Average Family Size in Leland is 2.9 People.
What is the Average Household Size in Leland
Average Household Size in Leland is 2.5 People.
How Large is the Labor Force in Leland?
There are 603 People in the Labor Forcein in Leland.
What is the Percentage of People in the Labor Force in Leland?
63.9% of People are in the Labor Force in Leland.
What is the Unemployment Rate in Leland?
Unemployment Rate in Leland is 8.3%.