Zip Codes with the Highest Percentage of Population Employed in Administrative & Support Services in Chicago, IL
RELATED REPORTS & OPTIONS
Administrative & Support Services
Chicago
Compare Zip Codes
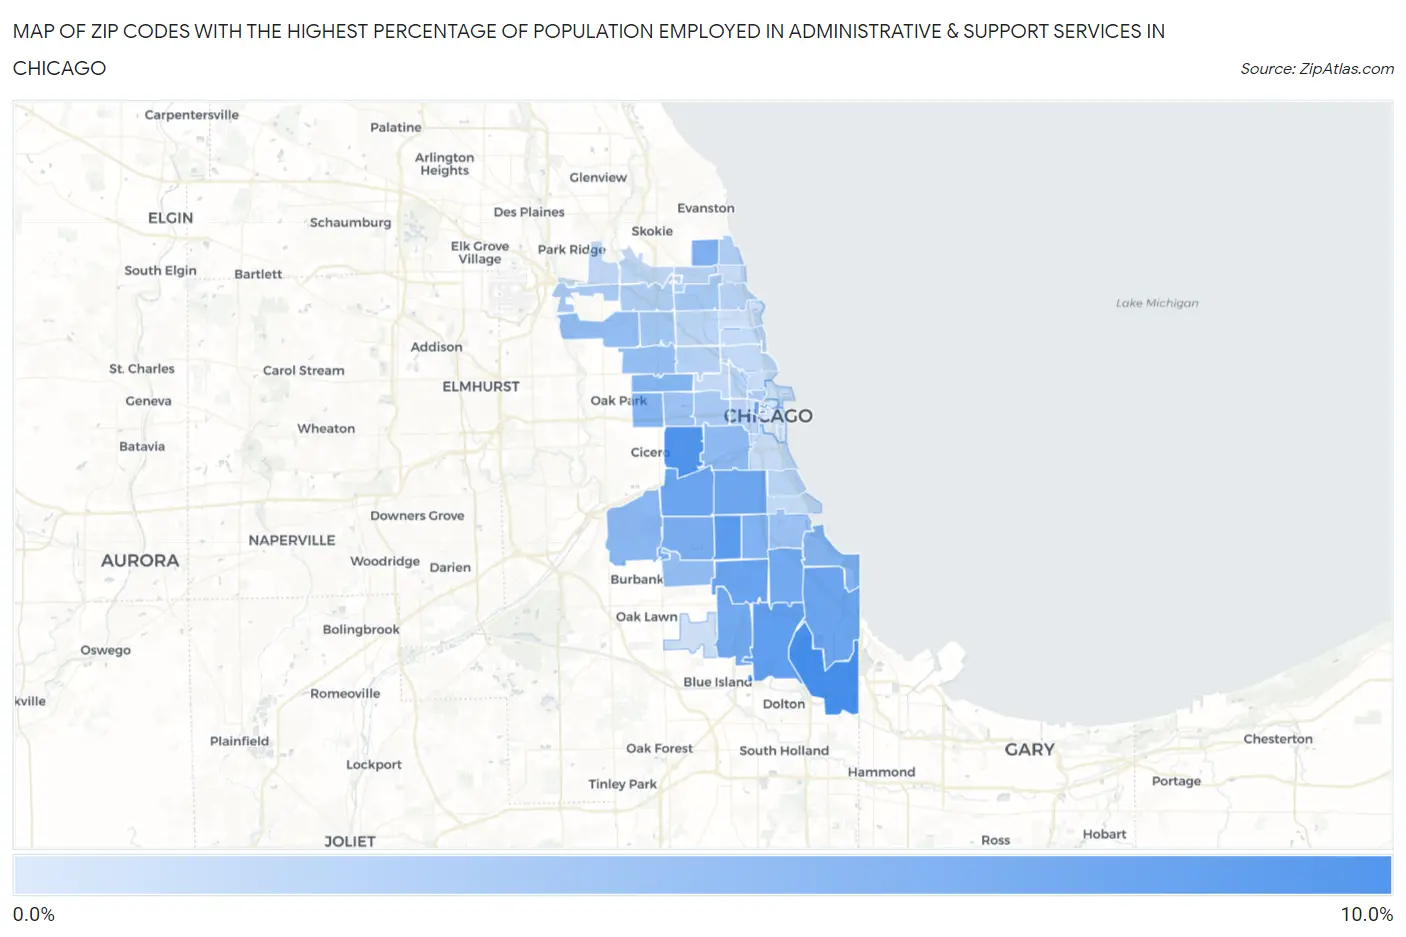
Map of Zip Codes with the Highest Percentage of Population Employed in Administrative & Support Services in Chicago
1.5%
9.9%
Zip Codes with the Highest Percentage of Population Employed in Administrative & Support Services in Chicago, IL
| Zip Code | % Employed | vs State | vs National | |
| 1. | 60633 | 9.9% | 4.0%(+5.85)#45 | 4.1%(+5.72)#1,337 |
| 2. | 60623 | 9.5% | 4.0%(+5.51)#47 | 4.1%(+5.38)#1,456 |
| 3. | 60602 | 9.3% | 4.0%(+5.25)#50 | 4.1%(+5.12)#1,561 |
| 4. | 60636 | 8.6% | 4.0%(+4.59)#67 | 4.1%(+4.46)#1,904 |
| 5. | 60628 | 8.4% | 4.0%(+4.43)#70 | 4.1%(+4.30)#2,000 |
| 6. | 60620 | 8.0% | 4.0%(+3.94)#83 | 4.1%(+3.81)#2,312 |
| 7. | 60617 | 7.8% | 4.0%(+3.77)#88 | 4.1%(+3.64)#2,432 |
| 8. | 60632 | 7.8% | 4.0%(+3.77)#90 | 4.1%(+3.64)#2,435 |
| 9. | 60609 | 7.6% | 4.0%(+3.60)#96 | 4.1%(+3.47)#2,580 |
| 10. | 60619 | 7.4% | 4.0%(+3.36)#104 | 4.1%(+3.23)#2,807 |
| 11. | 60643 | 7.3% | 4.0%(+3.33)#106 | 4.1%(+3.20)#2,840 |
| 12. | 60629 | 7.0% | 4.0%(+2.95)#120 | 4.1%(+2.82)#3,259 |
| 13. | 60645 | 6.7% | 4.0%(+2.65)#136 | 4.1%(+2.52)#3,671 |
| 14. | 60606 | 6.6% | 4.0%(+2.60)#141 | 4.1%(+2.47)#3,739 |
| 15. | 60621 | 6.6% | 4.0%(+2.59)#142 | 4.1%(+2.46)#3,757 |
| 16. | 60651 | 6.5% | 4.0%(+2.45)#148 | 4.1%(+2.32)#3,953 |
| 17. | 60649 | 6.4% | 4.0%(+2.37)#153 | 4.1%(+2.24)#4,092 |
| 18. | 60644 | 6.3% | 4.0%(+2.25)#157 | 4.1%(+2.12)#4,292 |
| 19. | 60638 | 6.0% | 4.0%(+1.97)#168 | 4.1%(+1.84)#4,809 |
| 20. | 60608 | 5.8% | 4.0%(+1.75)#178 | 4.1%(+1.62)#5,214 |
| 21. | 60652 | 5.6% | 4.0%(+1.55)#188 | 4.1%(+1.42)#5,665 |
| 22. | 60634 | 5.5% | 4.0%(+1.44)#201 | 4.1%(+1.31)#5,937 |
| 23. | 60639 | 5.4% | 4.0%(+1.42)#204 | 4.1%(+1.29)#5,982 |
| 24. | 60624 | 5.0% | 4.0%(+1.00)#244 | 4.1%(+0.872)#7,045 |
| 25. | 60637 | 4.9% | 4.0%(+0.931)#254 | 4.1%(+0.798)#7,256 |
| 26. | 60641 | 4.6% | 4.0%(+0.628)#292 | 4.1%(+0.495)#8,208 |
| 27. | 60612 | 4.4% | 4.0%(+0.340)#331 | 4.1%(+0.207)#9,254 |
| 28. | 60625 | 4.3% | 4.0%(+0.282)#341 | 4.1%(+0.149)#9,451 |
| 29. | 60604 | 4.2% | 4.0%(+0.224)#348 | 4.1%(+0.091)#9,657 |
| 30. | 60656 | 4.2% | 4.0%(+0.218)#349 | 4.1%(+0.085)#9,680 |
| 31. | 60654 | 4.1% | 4.0%(+0.068)#378 | 4.1%(-0.065)#10,305 |
| 32. | 60626 | 4.0% | 4.0%(+0.009)#388 | 4.1%(-0.124)#10,584 |
| 33. | 60630 | 3.8% | 4.0%(-0.218)#425 | 4.1%(-0.351)#11,534 |
| 34. | 60647 | 3.6% | 4.0%(-0.449)#475 | 4.1%(-0.581)#12,621 |
| 35. | 60659 | 3.5% | 4.0%(-0.501)#488 | 4.1%(-0.634)#12,878 |
| 36. | 60607 | 3.4% | 4.0%(-0.570)#506 | 4.1%(-0.703)#13,232 |
| 37. | 60640 | 3.4% | 4.0%(-0.614)#519 | 4.1%(-0.746)#13,421 |
| 38. | 60642 | 3.4% | 4.0%(-0.653)#530 | 4.1%(-0.786)#13,628 |
| 39. | 60603 | 3.3% | 4.0%(-0.670)#532 | 4.1%(-0.803)#13,701 |
| 40. | 60653 | 3.3% | 4.0%(-0.679)#534 | 4.1%(-0.812)#13,740 |
| 41. | 60618 | 3.2% | 4.0%(-0.812)#572 | 4.1%(-0.945)#14,452 |
| 42. | 60646 | 2.9% | 4.0%(-1.08)#628 | 4.1%(-1.21)#15,802 |
| 43. | 60622 | 2.9% | 4.0%(-1.11)#640 | 4.1%(-1.24)#15,949 |
| 44. | 60631 | 2.9% | 4.0%(-1.11)#643 | 4.1%(-1.25)#15,978 |
| 45. | 60614 | 2.9% | 4.0%(-1.15)#654 | 4.1%(-1.29)#16,188 |
| 46. | 60657 | 2.8% | 4.0%(-1.23)#673 | 4.1%(-1.36)#16,621 |
| 47. | 60615 | 2.7% | 4.0%(-1.27)#683 | 4.1%(-1.41)#16,864 |
| 48. | 60616 | 2.6% | 4.0%(-1.37)#706 | 4.1%(-1.51)#17,374 |
| 49. | 60660 | 2.6% | 4.0%(-1.38)#708 | 4.1%(-1.51)#17,393 |
| 50. | 60610 | 2.6% | 4.0%(-1.43)#718 | 4.1%(-1.56)#17,664 |
| 51. | 60611 | 2.6% | 4.0%(-1.45)#724 | 4.1%(-1.58)#17,778 |
| 52. | 60613 | 2.3% | 4.0%(-1.67)#785 | 4.1%(-1.81)#18,960 |
| 53. | 60661 | 2.2% | 4.0%(-1.77)#807 | 4.1%(-1.91)#19,442 |
| 54. | 60655 | 2.1% | 4.0%(-1.92)#853 | 4.1%(-2.05)#20,140 |
| 55. | 60601 | 1.9% | 4.0%(-2.10)#900 | 4.1%(-2.23)#21,017 |
| 56. | 60605 | 1.5% | 4.0%(-2.56)#984 | 4.1%(-2.69)#22,905 |
1
Common Questions
What are the Top 10 Zip Codes with the Highest Percentage of Population Employed in Administrative & Support Services in Chicago, IL?
Top 10 Zip Codes with the Highest Percentage of Population Employed in Administrative & Support Services in Chicago, IL are:
What zip code has the Highest Percentage of Population Employed in Administrative & Support Services in Chicago, IL?
60633 has the Highest Percentage of Population Employed in Administrative & Support Services in Chicago, IL with 9.9%.
What is the Percentage of Population Employed in Administrative & Support Services in Chicago, IL?
Percentage of Population Employed in Administrative & Support Services in Chicago is 4.7%.
What is the Percentage of Population Employed in Administrative & Support Services in Illinois?
Percentage of Population Employed in Administrative & Support Services in Illinois is 4.0%.
What is the Percentage of Population Employed in Administrative & Support Services in the United States?
Percentage of Population Employed in Administrative & Support Services in the United States is 4.1%.