Zip Codes with the Highest Percentage of Population Employed in Administrative & Support Services in Wheaton, IL
RELATED REPORTS & OPTIONS
Administrative & Support Services
Wheaton
Compare Zip Codes
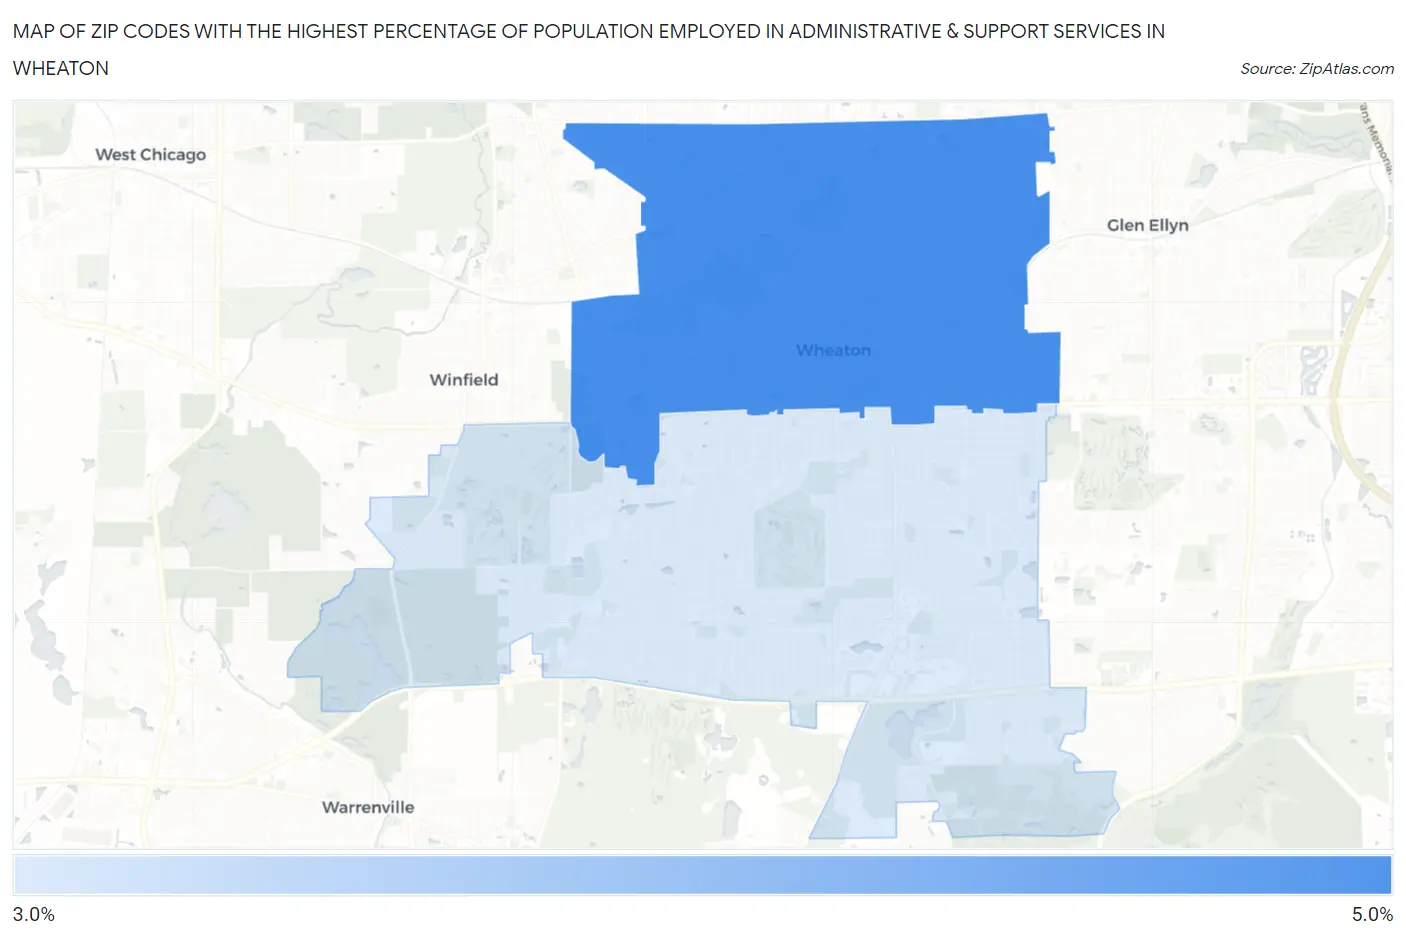
Map of Zip Codes with the Highest Percentage of Population Employed in Administrative & Support Services in Wheaton
3.2%
4.6%
Zip Codes with the Highest Percentage of Population Employed in Administrative & Support Services in Wheaton, IL
| Zip Code | % Employed | vs State | vs National | |
| 1. | 60187 | 4.6% | 4.0%(+0.600)#295 | 4.1%(+0.467)#8,315 |
| 2. | 60189 | 3.2% | 4.0%(-0.792)#567 | 4.1%(-0.925)#14,353 |
1
Common Questions
What are the Top Zip Codes with the Highest Percentage of Population Employed in Administrative & Support Services in Wheaton, IL?
Top Zip Codes with the Highest Percentage of Population Employed in Administrative & Support Services in Wheaton, IL are:
What zip code has the Highest Percentage of Population Employed in Administrative & Support Services in Wheaton, IL?
60187 has the Highest Percentage of Population Employed in Administrative & Support Services in Wheaton, IL with 4.6%.
What is the Percentage of Population Employed in Administrative & Support Services in Wheaton, IL?
Percentage of Population Employed in Administrative & Support Services in Wheaton is 3.7%.
What is the Percentage of Population Employed in Administrative & Support Services in Illinois?
Percentage of Population Employed in Administrative & Support Services in Illinois is 4.0%.
What is the Percentage of Population Employed in Administrative & Support Services in the United States?
Percentage of Population Employed in Administrative & Support Services in the United States is 4.1%.