White City, IL Map & Demographics
White City Map
White City Overview
$43,692
PER CAPITA INCOME
$84,063
AVG FAMILY INCOME
$66,944
AVG HOUSEHOLD INCOME
40.8%
WAGE / INCOME GAP [ % ]
59.2¢/ $1
WAGE / INCOME GAP [ $ ]
0.42
INEQUALITY / GINI INDEX
226
TOTAL POPULATION
120
MALE POPULATION
106
FEMALE POPULATION
113.21
MALES / 100 FEMALES
88.33
FEMALES / 100 MALES
49.0
MEDIAN AGE
2.7
AVG FAMILY SIZE
2.2
AVG HOUSEHOLD SIZE
136
LABOR FORCE [ PEOPLE ]
65.4%
PERCENT IN LABOR FORCE
3.7%
UNEMPLOYMENT RATE
Income in White City
Income Overview in White City
Per Capita Income in White City is $43,692, while median incomes of families and households are $84,063 and $66,944 respectively.
| Characteristic | Number | Measure |
| Per Capita Income | 226 | $43,692 |
| Median Family Income | 67 | $84,063 |
| Mean Family Income | 67 | $111,555 |
| Median Household Income | 102 | $66,944 |
| Mean Household Income | 102 | $94,664 |
| Income Deficit | 67 | $0 |
| Wage / Income Gap (%) | 226 | 40.77% |
| Wage / Income Gap ($) | 226 | 59.23¢ per $1 |
| Gini / Inequality Index | 226 | 0.42 |
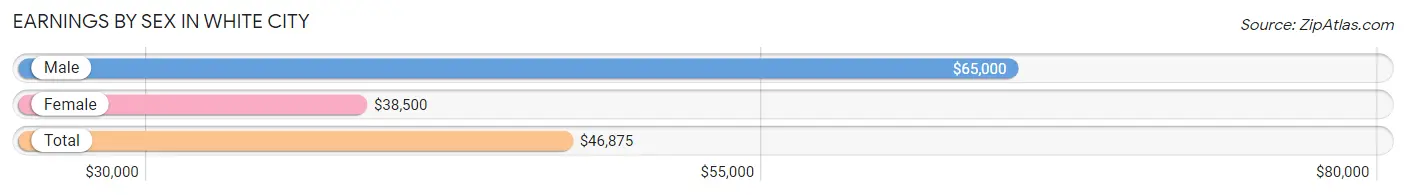
Earnings by Sex in White City
Average Earnings in White City are $46,875, $65,000 for men and $38,500 for women, a difference of 40.8%.
| Sex | Number | Average Earnings |
| Male | 74 (54.4%) | $65,000 |
| Female | 62 (45.6%) | $38,500 |
| Total | 136 (100.0%) | $46,875 |
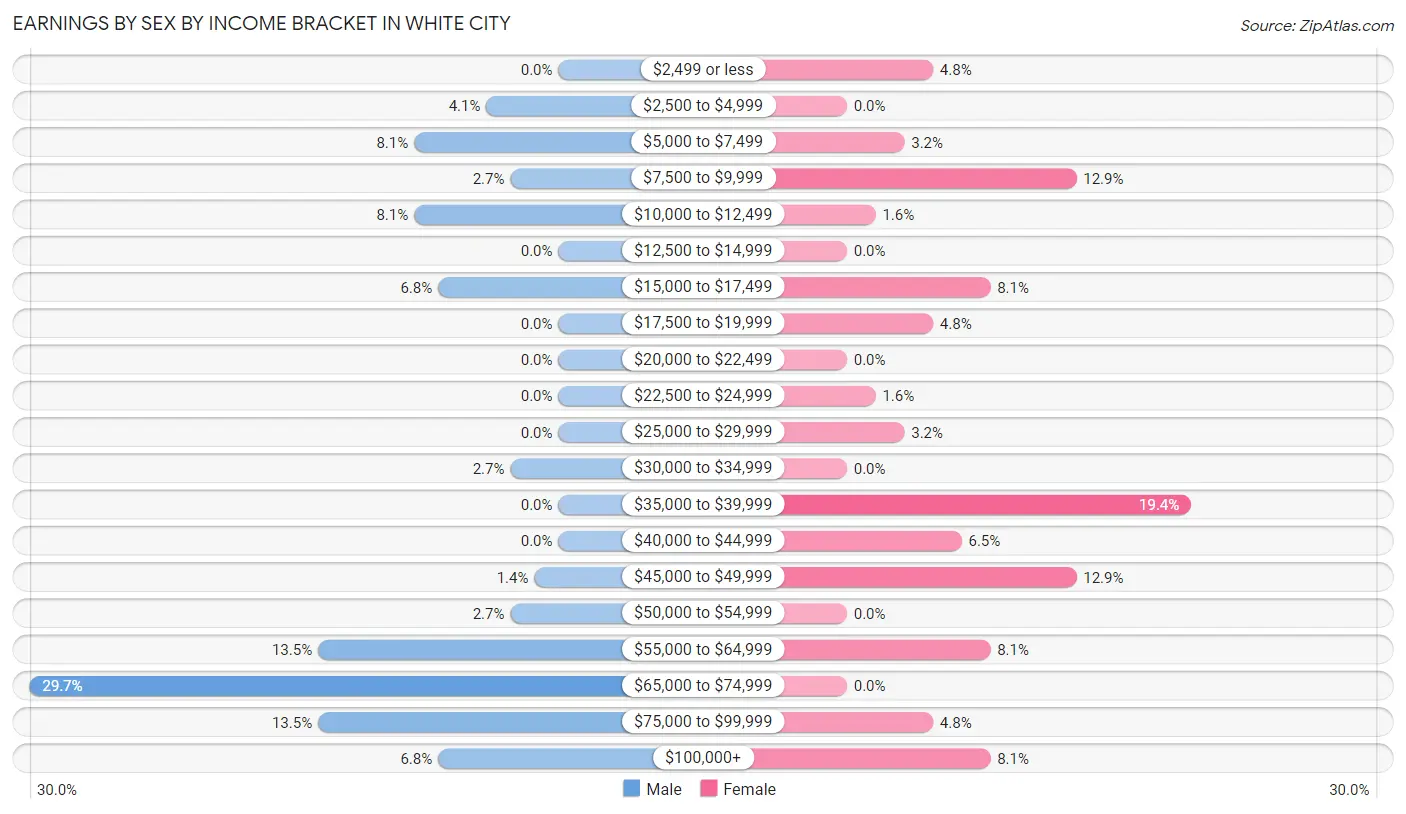
Earnings by Sex by Income Bracket in White City
The most common earnings brackets in White City are $65,000 to $74,999 for men (22 | 29.7%) and $35,000 to $39,999 for women (12 | 19.4%).
| Income | Male | Female |
| $2,499 or less | 0 (0.0%) | 3 (4.8%) |
| $2,500 to $4,999 | 3 (4.1%) | 0 (0.0%) |
| $5,000 to $7,499 | 6 (8.1%) | 2 (3.2%) |
| $7,500 to $9,999 | 2 (2.7%) | 8 (12.9%) |
| $10,000 to $12,499 | 6 (8.1%) | 1 (1.6%) |
| $12,500 to $14,999 | 0 (0.0%) | 0 (0.0%) |
| $15,000 to $17,499 | 5 (6.8%) | 5 (8.1%) |
| $17,500 to $19,999 | 0 (0.0%) | 3 (4.8%) |
| $20,000 to $22,499 | 0 (0.0%) | 0 (0.0%) |
| $22,500 to $24,999 | 0 (0.0%) | 1 (1.6%) |
| $25,000 to $29,999 | 0 (0.0%) | 2 (3.2%) |
| $30,000 to $34,999 | 2 (2.7%) | 0 (0.0%) |
| $35,000 to $39,999 | 0 (0.0%) | 12 (19.4%) |
| $40,000 to $44,999 | 0 (0.0%) | 4 (6.5%) |
| $45,000 to $49,999 | 1 (1.3%) | 8 (12.9%) |
| $50,000 to $54,999 | 2 (2.7%) | 0 (0.0%) |
| $55,000 to $64,999 | 10 (13.5%) | 5 (8.1%) |
| $65,000 to $74,999 | 22 (29.7%) | 0 (0.0%) |
| $75,000 to $99,999 | 10 (13.5%) | 3 (4.8%) |
| $100,000+ | 5 (6.8%) | 5 (8.1%) |
| Total | 74 (100.0%) | 62 (100.0%) |
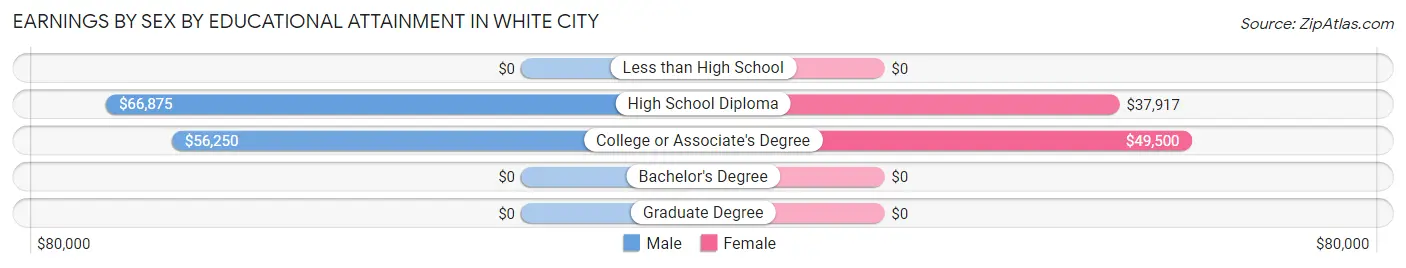
Earnings by Sex by Educational Attainment in White City
Average earnings in White City are $65,625 for men and $39,250 for women, a difference of 40.2%. Men with an educational attainment of high school diploma enjoy the highest average annual earnings of $66,875, while those with college or associate's degree education earn the least with $56,250. Women with an educational attainment of college or associate's degree earn the most with the average annual earnings of $49,500, while those with high school diploma education have the smallest earnings of $37,917.
| Educational Attainment | Male Income | Female Income |
| Less than High School | - | - |
| High School Diploma | $66,875 | $37,917 |
| College or Associate's Degree | $56,250 | $49,500 |
| Bachelor's Degree | - | - |
| Graduate Degree | - | - |
| Total | $65,625 | $39,250 |
Family Income in White City
Family Income Brackets in White City
According to the White City family income data, there are 17 families falling into the $150,000 to $199,999 income range, which is the most common income bracket and makes up 25.4% of all families.
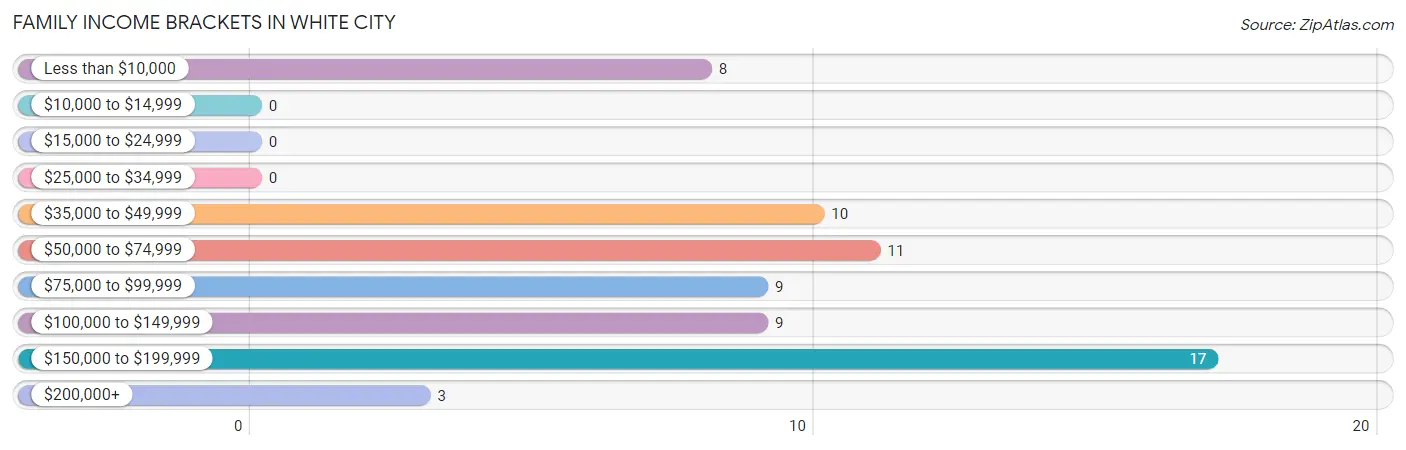
| Income Bracket | # Families | % Families |
| Less than $10,000 | 8 | 11.9% |
| $10,000 to $14,999 | 0 | 0.0% |
| $15,000 to $24,999 | 0 | 0.0% |
| $25,000 to $34,999 | 0 | 0.0% |
| $35,000 to $49,999 | 10 | 14.9% |
| $50,000 to $74,999 | 11 | 16.4% |
| $75,000 to $99,999 | 9 | 13.4% |
| $100,000 to $149,999 | 9 | 13.4% |
| $150,000 to $199,999 | 17 | 25.4% |
| $200,000+ | 3 | 4.5% |
Family Income by Famaliy Size in White City
3-person families (11 | 16.4%) account for the highest median family income in White City with $106,875 per family, while 3-person families (11 | 16.4%) have the highest median income of $35,625 per family member.
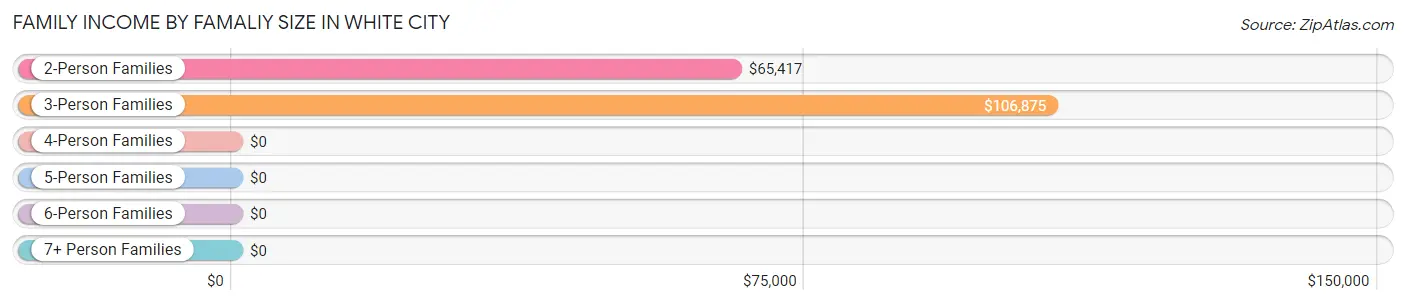
| Income Bracket | # Families | Median Income |
| 2-Person Families | 49 (73.1%) | $65,417 |
| 3-Person Families | 11 (16.4%) | $106,875 |
| 4-Person Families | 0 (0.0%) | $0 |
| 5-Person Families | 5 (7.5%) | $0 |
| 6-Person Families | 0 (0.0%) | $0 |
| 7+ Person Families | 2 (3.0%) | $0 |
| Total | 67 (100.0%) | $84,063 |
Family Income by Number of Earners in White City
The median family income in White City is $84,063, with families comprising 3+ earners (9) having the highest median family income of $173,750, while families with no earners (13) have the lowest median family income of $49,750, accounting for 13.4% and 19.4% of families, respectively.
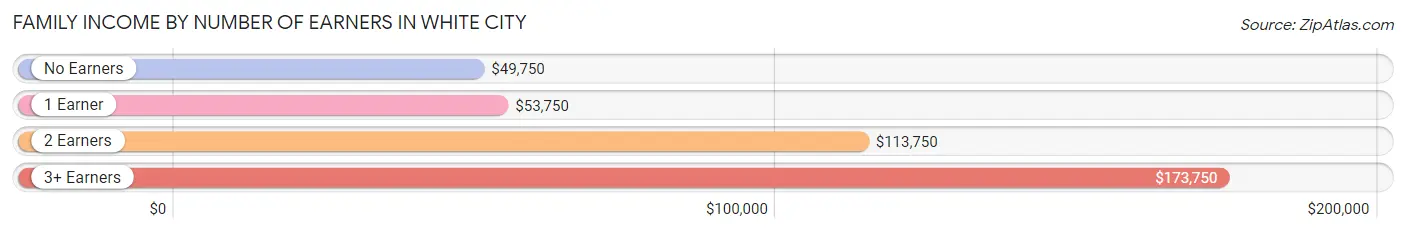
| Number of Earners | # Families | Median Income |
| No Earners | 13 (19.4%) | $49,750 |
| 1 Earner | 25 (37.3%) | $53,750 |
| 2 Earners | 20 (29.8%) | $113,750 |
| 3+ Earners | 9 (13.4%) | $173,750 |
| Total | 67 (100.0%) | $84,063 |
Household Income in White City
Household Income Brackets in White City
With 26 households falling in the category, the $50,000 to $74,999 income range is the most frequent in White City, accounting for 25.5% of all households.
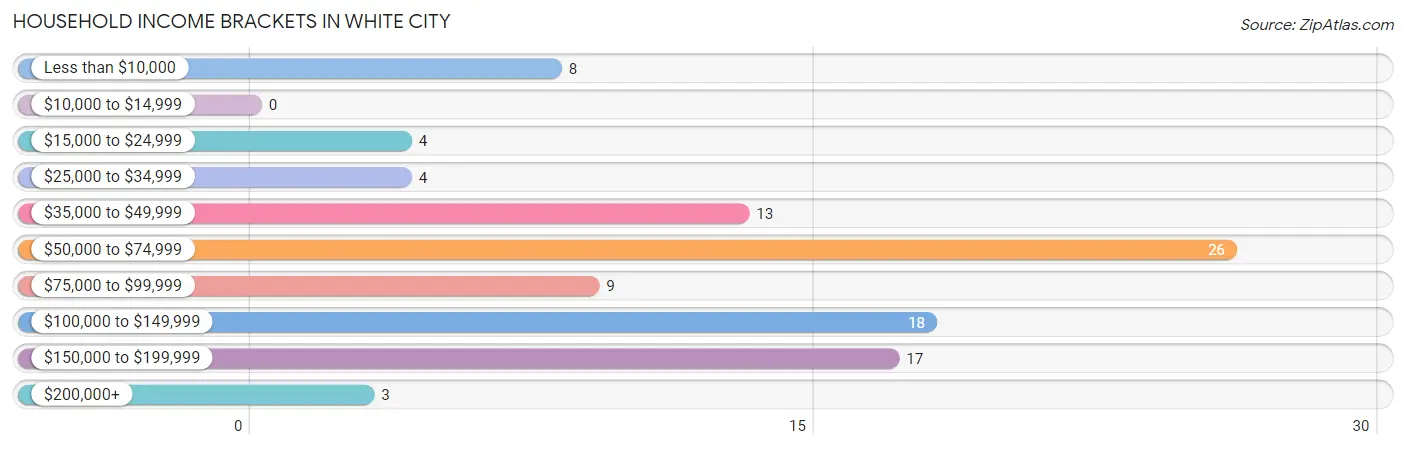
| Income Bracket | # Households | % Households |
| Less than $10,000 | 8 | 7.8% |
| $10,000 to $14,999 | 0 | 0.0% |
| $15,000 to $24,999 | 4 | 3.9% |
| $25,000 to $34,999 | 4 | 3.9% |
| $35,000 to $49,999 | 13 | 12.7% |
| $50,000 to $74,999 | 26 | 25.5% |
| $75,000 to $99,999 | 9 | 8.8% |
| $100,000 to $149,999 | 18 | 17.6% |
| $150,000 to $199,999 | 17 | 16.7% |
| $200,000+ | 3 | 2.9% |
Household Income by Householder Age in White City
The median household income in White City is $66,944, with the highest median household income of $84,375 found in the 25 to 44 years age bracket for the primary householder. A total of 24 households (23.5%) fall into this category.
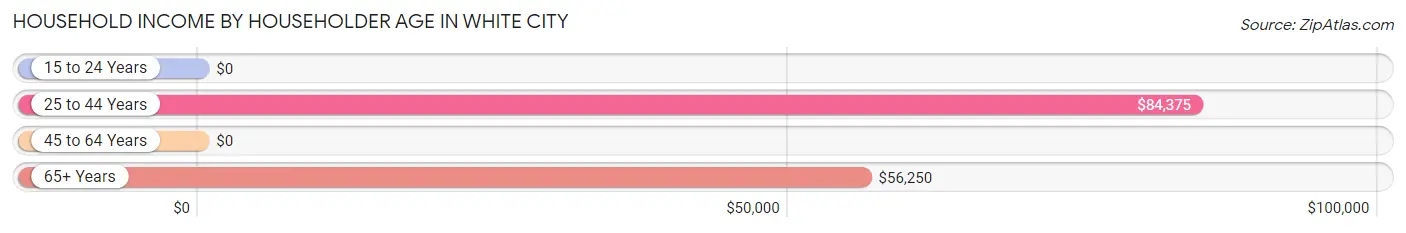
| Income Bracket | # Households | Median Income |
| 15 to 24 Years | 0 (0.0%) | $0 |
| 25 to 44 Years | 24 (23.5%) | $84,375 |
| 45 to 64 Years | 51 (50.0%) | $0 |
| 65+ Years | 27 (26.5%) | $56,250 |
| Total | 102 (100.0%) | $66,944 |
Poverty in White City
Income Below Poverty by Sex and Age in White City
With 8.3% poverty level for males and 9.4% for females among the residents of White City, 35 to 44 year old males and 18 to 24 year old females are the most vulnerable to poverty, with 4 males (19.1%) and 2 females (33.3%) in their respective age groups living below the poverty level.
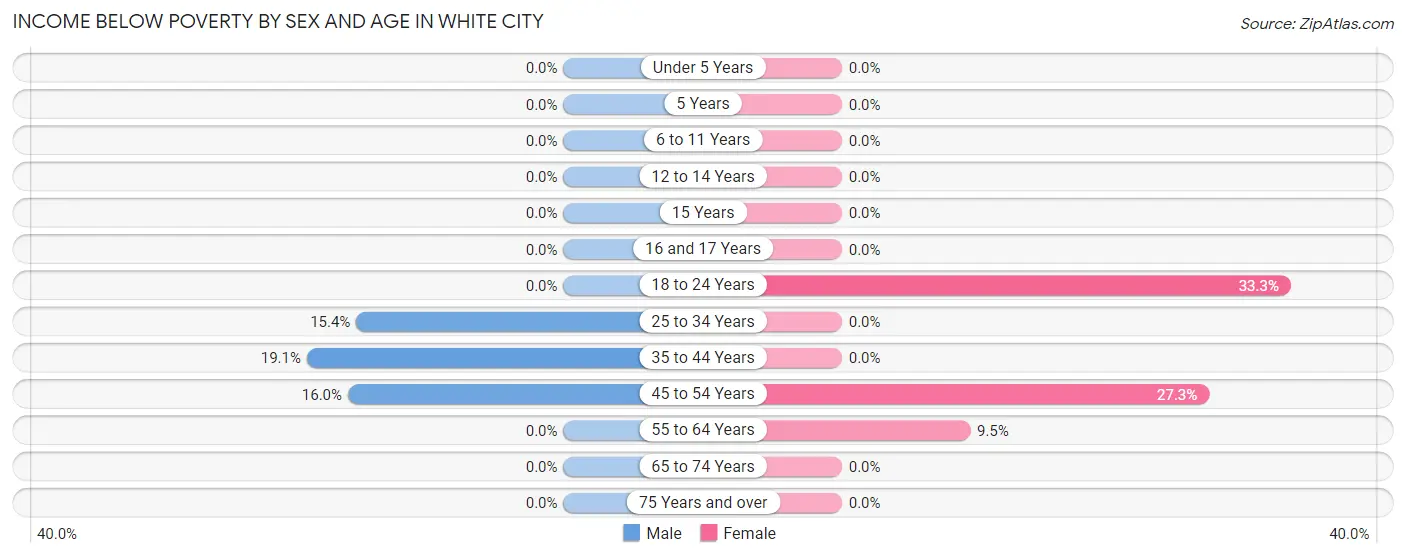
| Age Bracket | Male | Female |
| Under 5 Years | 0 (0.0%) | 0 (0.0%) |
| 5 Years | 0 (0.0%) | 0 (0.0%) |
| 6 to 11 Years | 0 (0.0%) | 0 (0.0%) |
| 12 to 14 Years | 0 (0.0%) | 0 (0.0%) |
| 15 Years | 0 (0.0%) | 0 (0.0%) |
| 16 and 17 Years | 0 (0.0%) | 0 (0.0%) |
| 18 to 24 Years | 0 (0.0%) | 2 (33.3%) |
| 25 to 34 Years | 2 (15.4%) | 0 (0.0%) |
| 35 to 44 Years | 4 (19.1%) | 0 (0.0%) |
| 45 to 54 Years | 4 (16.0%) | 6 (27.3%) |
| 55 to 64 Years | 0 (0.0%) | 2 (9.5%) |
| 65 to 74 Years | 0 (0.0%) | 0 (0.0%) |
| 75 Years and over | 0 (0.0%) | 0 (0.0%) |
| Total | 10 (8.3%) | 10 (9.4%) |
Income Above Poverty by Sex and Age in White City
According to the poverty statistics in White City, males aged under 5 years and females aged under 5 years are the age groups that are most secure financially, with 100.0% of males and 100.0% of females in these age groups living above the poverty line.
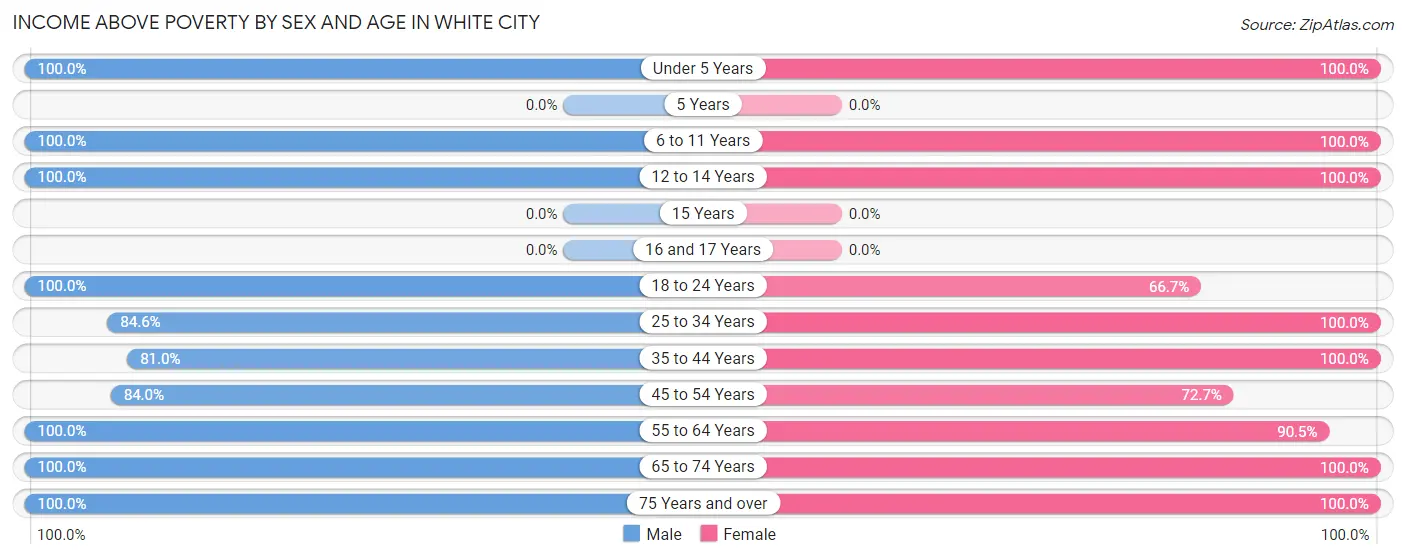
| Age Bracket | Male | Female |
| Under 5 Years | 1 (100.0%) | 1 (100.0%) |
| 5 Years | 0 (0.0%) | 0 (0.0%) |
| 6 to 11 Years | 2 (100.0%) | 2 (100.0%) |
| 12 to 14 Years | 2 (100.0%) | 10 (100.0%) |
| 15 Years | 0 (0.0%) | 0 (0.0%) |
| 16 and 17 Years | 0 (0.0%) | 0 (0.0%) |
| 18 to 24 Years | 14 (100.0%) | 4 (66.7%) |
| 25 to 34 Years | 11 (84.6%) | 9 (100.0%) |
| 35 to 44 Years | 17 (80.9%) | 16 (100.0%) |
| 45 to 54 Years | 21 (84.0%) | 16 (72.7%) |
| 55 to 64 Years | 17 (100.0%) | 19 (90.5%) |
| 65 to 74 Years | 12 (100.0%) | 14 (100.0%) |
| 75 Years and over | 13 (100.0%) | 5 (100.0%) |
| Total | 110 (91.7%) | 96 (90.6%) |
Income Below Poverty Among Married-Couple Families in White City
The poverty statistics for married-couple families in White City show that 8.0% or 4 of the total 50 families live below the poverty line. Families with no children have the highest poverty rate of 10.5%, comprising of 4 families. On the other hand, families with 1 or 2 children have the lowest poverty rate of 0.0%, which includes 0 families.
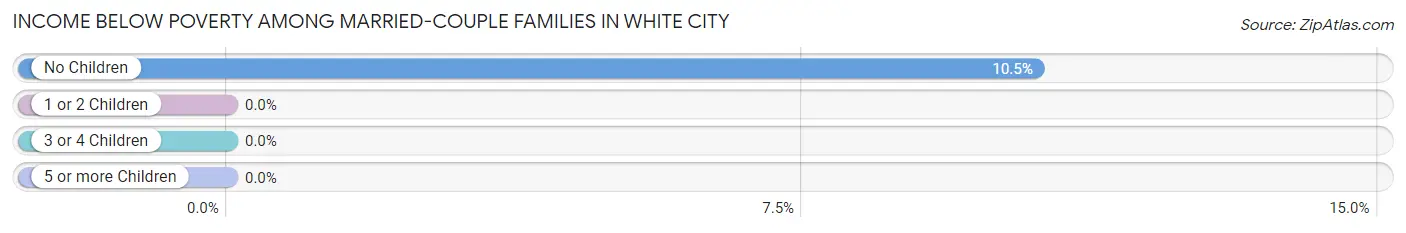
| Children | Above Poverty | Below Poverty |
| No Children | 34 (89.5%) | 4 (10.5%) |
| 1 or 2 Children | 12 (100.0%) | 0 (0.0%) |
| 3 or 4 Children | 0 (0.0%) | 0 (0.0%) |
| 5 or more Children | 0 (0.0%) | 0 (0.0%) |
| Total | 46 (92.0%) | 4 (8.0%) |
Income Below Poverty Among Single-Parent Households in White City
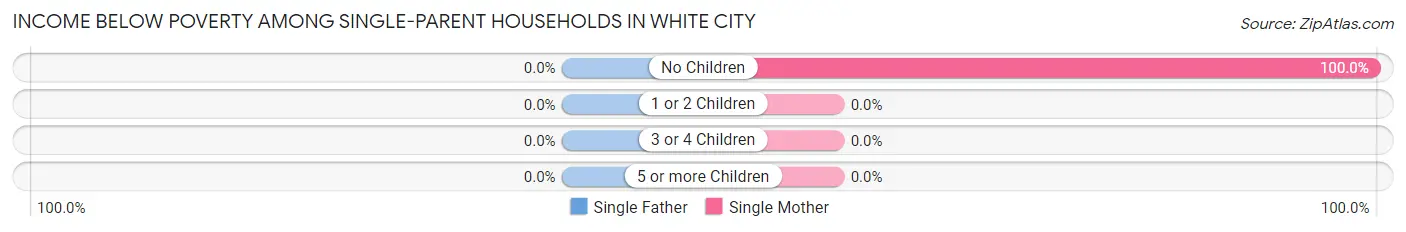
| Children | Single Father | Single Mother |
| No Children | 0 (0.0%) | 4 (100.0%) |
| 1 or 2 Children | 0 (0.0%) | 0 (0.0%) |
| 3 or 4 Children | 0 (0.0%) | 0 (0.0%) |
| 5 or more Children | 0 (0.0%) | 0 (0.0%) |
| Total | 0 (0.0%) | 4 (40.0%) |
Income Below Poverty Among Married-Couple vs Single-Parent Households in White City
The poverty data for White City shows that 4 of the married-couple family households (8.0%) and 4 of the single-parent households (23.5%) are living below the poverty level. Within the married-couple family households, those with no children have the highest poverty rate, with 4 households (10.5%) falling below the poverty line. Among the single-parent households, those with no children have the highest poverty rate, with 4 household (36.4%) living below poverty.
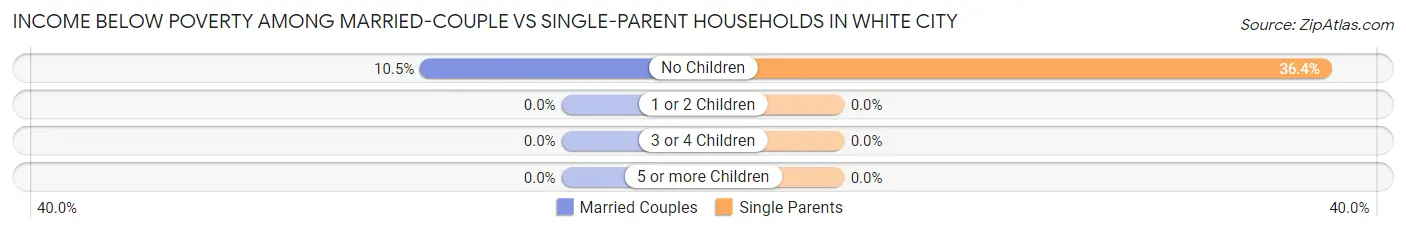
| Children | Married-Couple Families | Single-Parent Households |
| No Children | 4 (10.5%) | 4 (36.4%) |
| 1 or 2 Children | 0 (0.0%) | 0 (0.0%) |
| 3 or 4 Children | 0 (0.0%) | 0 (0.0%) |
| 5 or more Children | 0 (0.0%) | 0 (0.0%) |
| Total | 4 (8.0%) | 4 (23.5%) |
Race in White City
The most populous races in White City are White / Caucasian (222 | 98.2%), Two or more Races (4 | 1.8%), and Hispanic or Latino (2 | 0.9%).
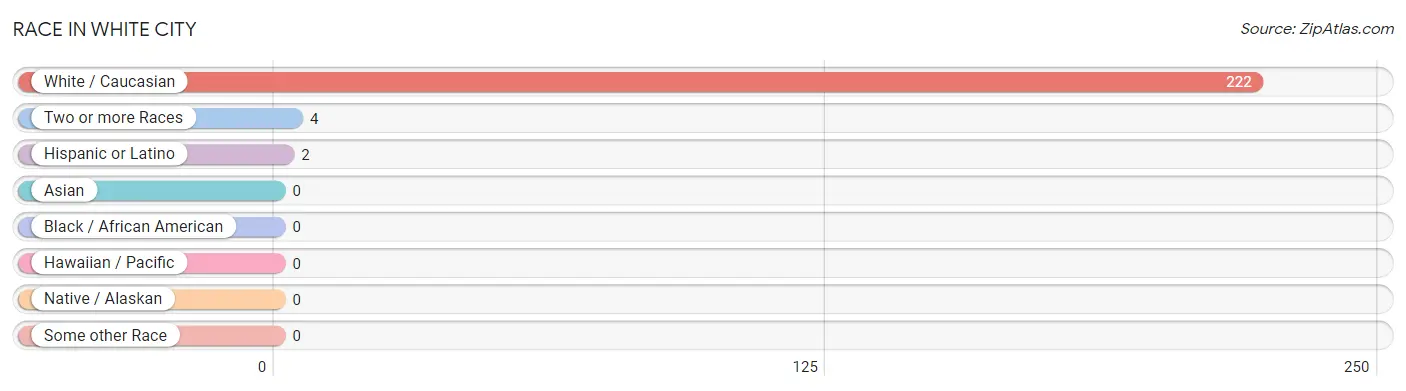
| Race | # Population | % Population |
| Asian | 0 | 0.0% |
| Black / African American | 0 | 0.0% |
| Hawaiian / Pacific | 0 | 0.0% |
| Hispanic or Latino | 2 | 0.9% |
| Native / Alaskan | 0 | 0.0% |
| White / Caucasian | 222 | 98.2% |
| Two or more Races | 4 | 1.8% |
| Some other Race | 0 | 0.0% |
| Total | 226 | 100.0% |
Ancestry in White City
The most populous ancestries reported in White City are German (69 | 30.5%), American (32 | 14.2%), English (26 | 11.5%), Dutch (21 | 9.3%), and Irish (21 | 9.3%), together accounting for 74.8% of all White City residents.
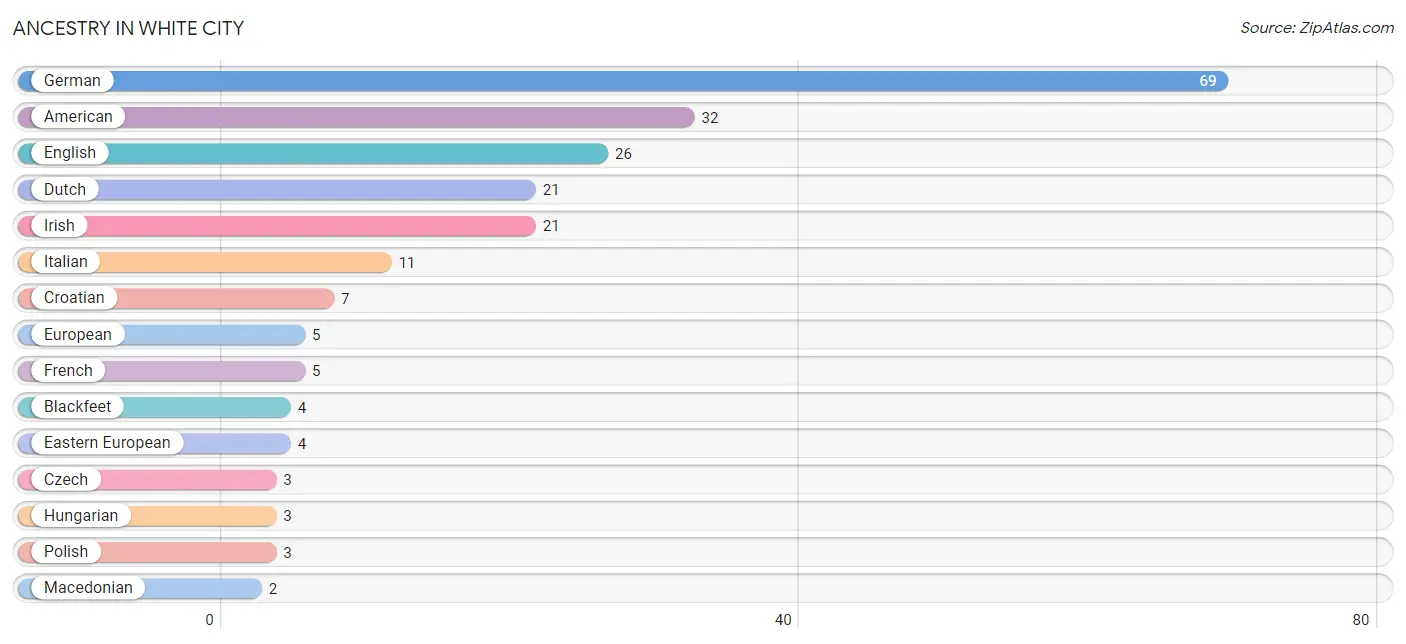
| Ancestry | # Population | % Population |
| American | 32 | 14.2% |
| Blackfeet | 4 | 1.8% |
| Croatian | 7 | 3.1% |
| Czech | 3 | 1.3% |
| Dutch | 21 | 9.3% |
| Eastern European | 4 | 1.8% |
| English | 26 | 11.5% |
| European | 5 | 2.2% |
| French | 5 | 2.2% |
| German | 69 | 30.5% |
| Hungarian | 3 | 1.3% |
| Irish | 21 | 9.3% |
| Italian | 11 | 4.9% |
| Macedonian | 2 | 0.9% |
| Mexican | 2 | 0.9% |
| Norwegian | 2 | 0.9% |
| Polish | 3 | 1.3% |
| Scotch-Irish | 2 | 0.9% |
| Scottish | 2 | 0.9% |
| Yugoslavian | 1 | 0.4% | View All 20 Rows |
Immigrants in White City
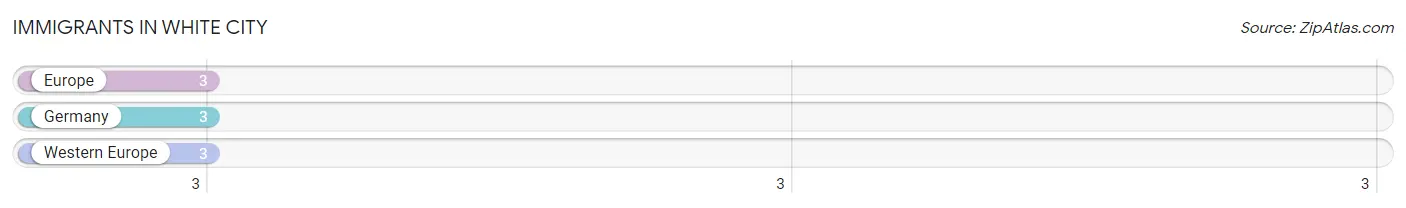
The most numerous immigrant groups reported in White City came from Europe (3 | 1.3%), Germany (3 | 1.3%), and Western Europe (3 | 1.3%), together accounting for 4.0% of all White City residents.
| Immigration Origin | # Population | % Population |
| Europe | 3 | 1.3% |
| Germany | 3 | 1.3% |
| Western Europe | 3 | 1.3% | View All 3 Rows |
Sex and Age in White City
Sex and Age in White City
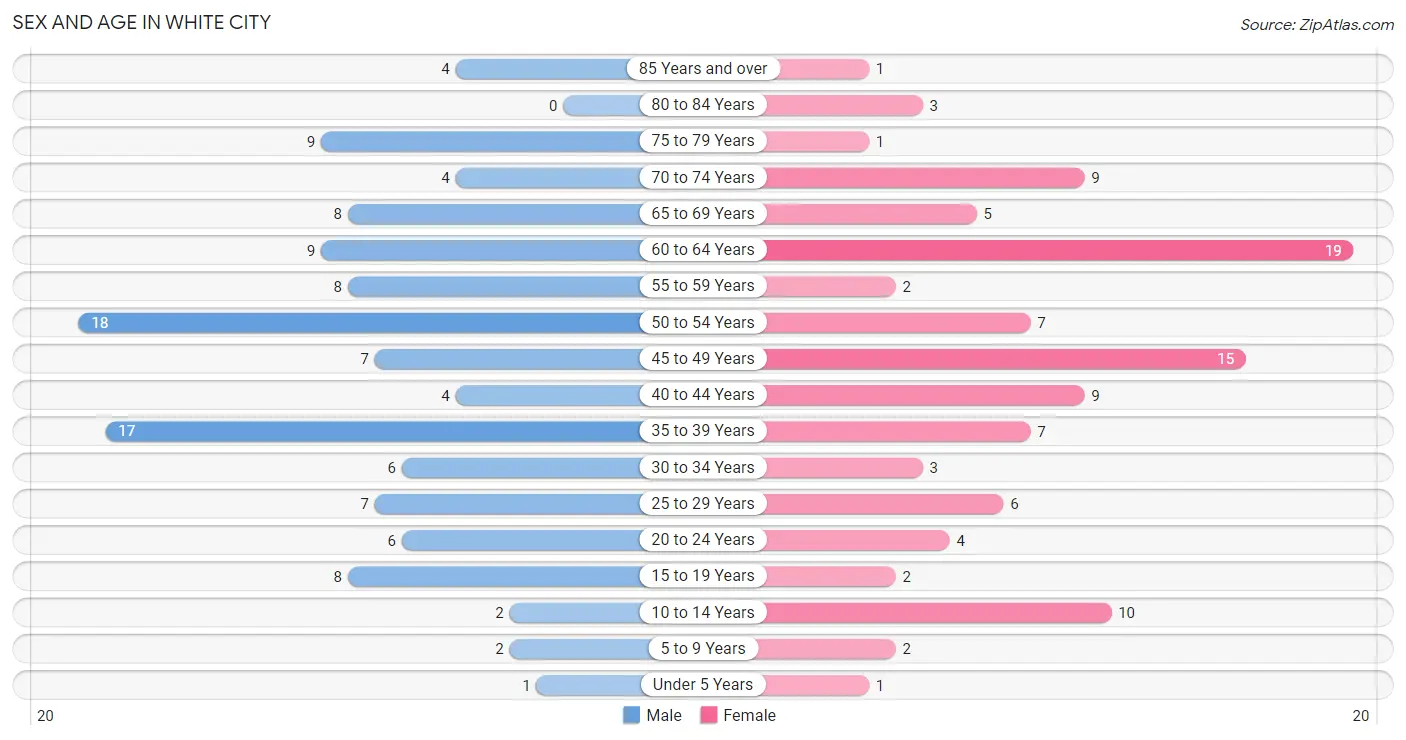
The most populous age groups in White City are 50 to 54 Years (18 | 15.0%) for men and 60 to 64 Years (19 | 17.9%) for women.
| Age Bracket | Male | Female |
| Under 5 Years | 1 (0.8%) | 1 (0.9%) |
| 5 to 9 Years | 2 (1.7%) | 2 (1.9%) |
| 10 to 14 Years | 2 (1.7%) | 10 (9.4%) |
| 15 to 19 Years | 8 (6.7%) | 2 (1.9%) |
| 20 to 24 Years | 6 (5.0%) | 4 (3.8%) |
| 25 to 29 Years | 7 (5.8%) | 6 (5.7%) |
| 30 to 34 Years | 6 (5.0%) | 3 (2.8%) |
| 35 to 39 Years | 17 (14.2%) | 7 (6.6%) |
| 40 to 44 Years | 4 (3.3%) | 9 (8.5%) |
| 45 to 49 Years | 7 (5.8%) | 15 (14.1%) |
| 50 to 54 Years | 18 (15.0%) | 7 (6.6%) |
| 55 to 59 Years | 8 (6.7%) | 2 (1.9%) |
| 60 to 64 Years | 9 (7.5%) | 19 (17.9%) |
| 65 to 69 Years | 8 (6.7%) | 5 (4.7%) |
| 70 to 74 Years | 4 (3.3%) | 9 (8.5%) |
| 75 to 79 Years | 9 (7.5%) | 1 (0.9%) |
| 80 to 84 Years | 0 (0.0%) | 3 (2.8%) |
| 85 Years and over | 4 (3.3%) | 1 (0.9%) |
| Total | 120 (100.0%) | 106 (100.0%) |
Families and Households in White City
Median Family Size in White City
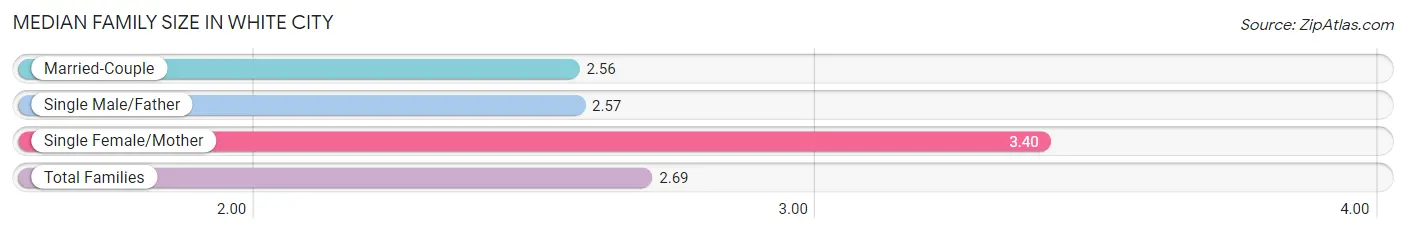
The median family size in White City is 2.69 persons per family, with single female/mother families (10 | 14.9%) accounting for the largest median family size of 3.4 persons per family. On the other hand, married-couple families (50 | 74.6%) represent the smallest median family size with 2.56 persons per family.
| Family Type | # Families | Family Size |
| Married-Couple | 50 (74.6%) | 2.56 |
| Single Male/Father | 7 (10.4%) | 2.57 |
| Single Female/Mother | 10 (14.9%) | 3.40 |
| Total Families | 67 (100.0%) | 2.69 |
Median Household Size in White City
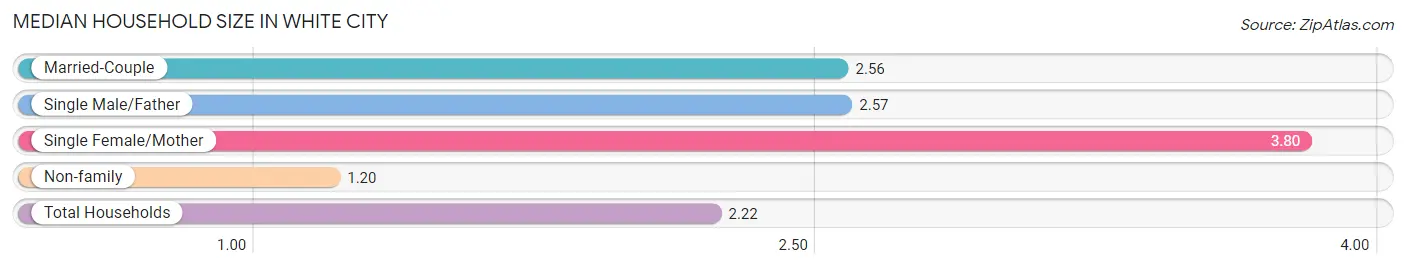
The median household size in White City is 2.22 persons per household, with single female/mother households (10 | 9.8%) accounting for the largest median household size of 3.8 persons per household. non-family households (35 | 34.3%) represent the smallest median household size with 1.20 persons per household.
| Household Type | # Households | Household Size |
| Married-Couple | 50 (49.0%) | 2.56 |
| Single Male/Father | 7 (6.9%) | 2.57 |
| Single Female/Mother | 10 (9.8%) | 3.80 |
| Non-family | 35 (34.3%) | 1.20 |
| Total Households | 102 (100.0%) | 2.22 |
Household Size by Marriage Status in White City
Out of a total of 102 households in White City, 67 (65.7%) are family households, while 35 (34.3%) are nonfamily households. The most numerous type of family households are 2-person households, comprising 45, and the most common type of nonfamily households are 1-person households, comprising 27.
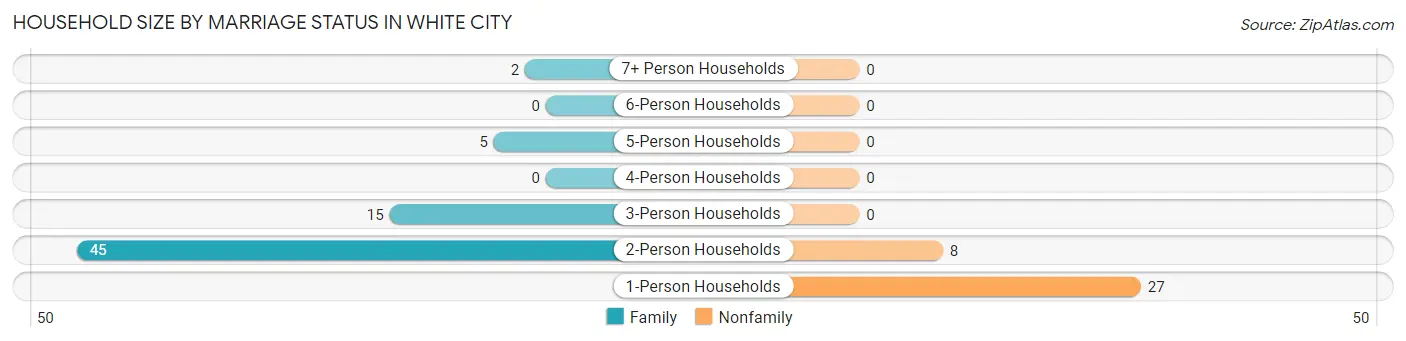
| Household Size | Family Households | Nonfamily Households |
| 1-Person Households | - | 27 (26.5%) |
| 2-Person Households | 45 (44.1%) | 8 (7.8%) |
| 3-Person Households | 15 (14.7%) | 0 (0.0%) |
| 4-Person Households | 0 (0.0%) | 0 (0.0%) |
| 5-Person Households | 5 (4.9%) | 0 (0.0%) |
| 6-Person Households | 0 (0.0%) | 0 (0.0%) |
| 7+ Person Households | 2 (2.0%) | 0 (0.0%) |
| Total | 67 (65.7%) | 35 (34.3%) |
Female Fertility in White City
Fertility by Age in White City
Average fertility rate in White City is 22.0 births per 1,000 women. Women in the age bracket of 20 to 34 years have the highest fertility rate with 77.0 births per 1,000 women. Women in the age bracket of 20 to 34 years acount for 100.0% of all women with births.
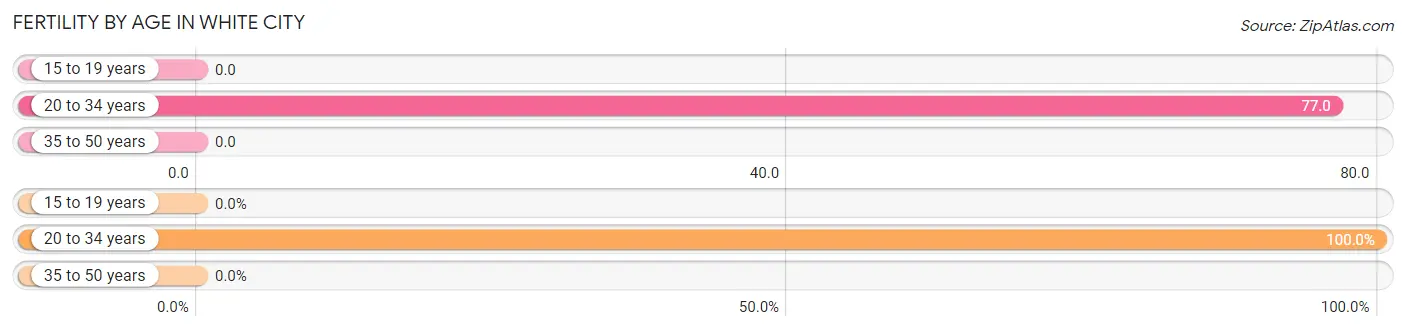
| Age Bracket | Women with Births | Births / 1,000 Women |
| 15 to 19 years | 0 (0.0%) | 0.0 |
| 20 to 34 years | 1 (100.0%) | 77.0 |
| 35 to 50 years | 0 (0.0%) | 0.0 |
| Total | 1 (100.0%) | 22.0 |
Fertility by Age by Marriage Status in White City
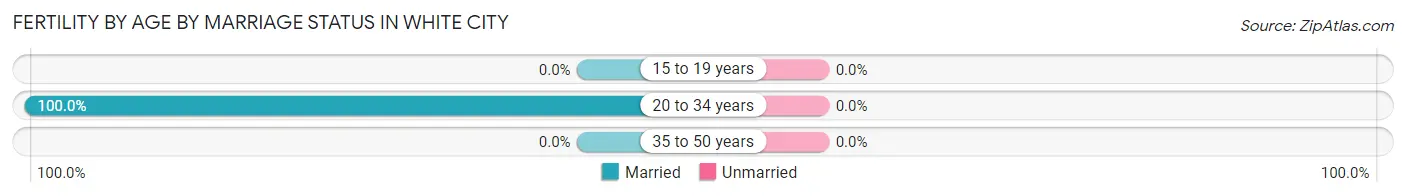
| Age Bracket | Married | Unmarried |
| 15 to 19 years | 0 (0.0%) | 0 (0.0%) |
| 20 to 34 years | 1 (100.0%) | 0 (0.0%) |
| 35 to 50 years | 0 (0.0%) | 0 (0.0%) |
| Total | 1 (100.0%) | 0 (0.0%) |
Fertility by Education in White City
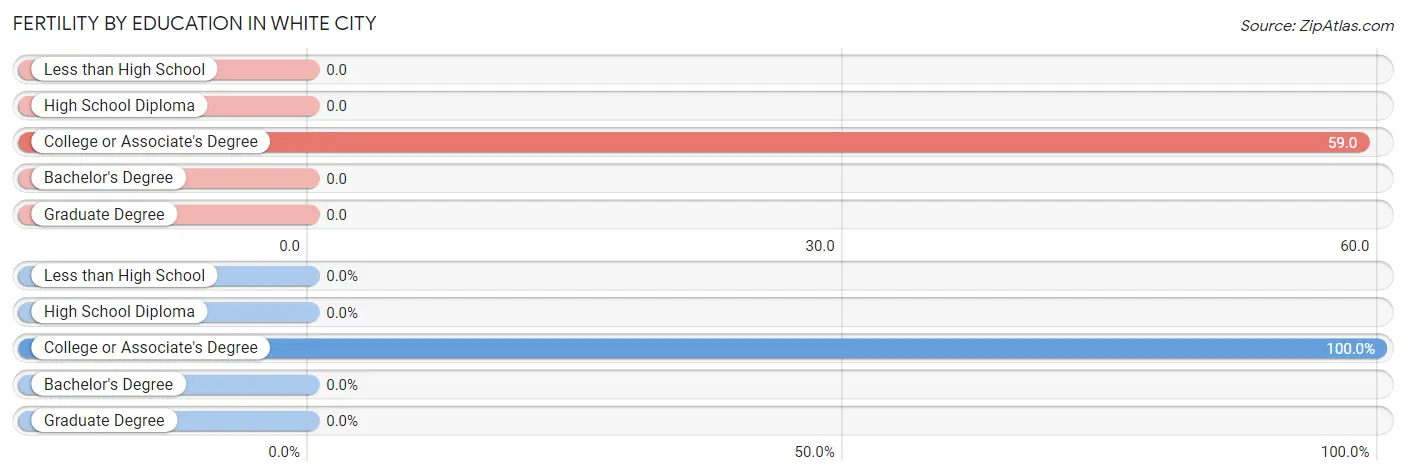
| Educational Attainment | Women with Births | Births / 1,000 Women |
| Less than High School | 0 (0.0%) | 0.0 |
| High School Diploma | 0 (0.0%) | 0.0 |
| College or Associate's Degree | 1 (100.0%) | 59.0 |
| Bachelor's Degree | 0 (0.0%) | 0.0 |
| Graduate Degree | 0 (0.0%) | 0.0 |
| Total | 1 (100.0%) | 22.0 |
Fertility by Education by Marriage Status in White City
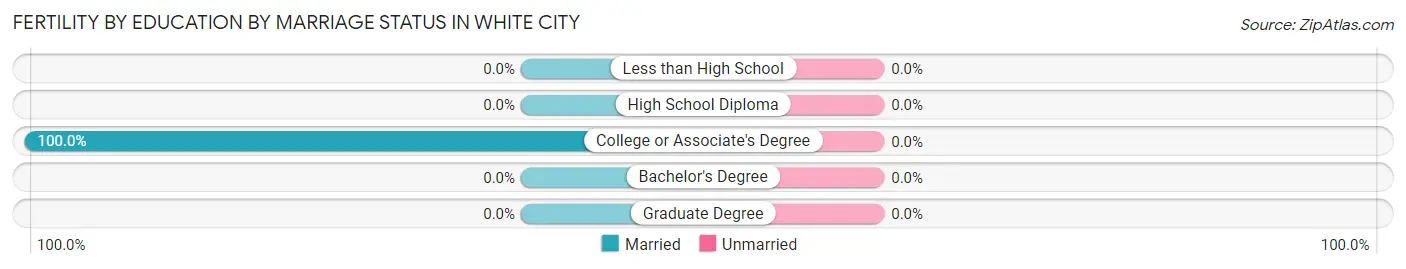
| Educational Attainment | Married | Unmarried |
| Less than High School | 0 (0.0%) | 0 (0.0%) |
| High School Diploma | 0 (0.0%) | 0 (0.0%) |
| College or Associate's Degree | 1 (100.0%) | 0 (0.0%) |
| Bachelor's Degree | 0 (0.0%) | 0 (0.0%) |
| Graduate Degree | 0 (0.0%) | 0 (0.0%) |
| Total | 1 (100.0%) | 0 (0.0%) |
Employment Characteristics in White City
Employment by Class of Employer in White City
Among the 131 employed individuals in White City, private company employees (112 | 85.5%), not-for-profit organizations (7 | 5.3%), and self-employed (incorporated) (5 | 3.8%) make up the most common classes of employment.
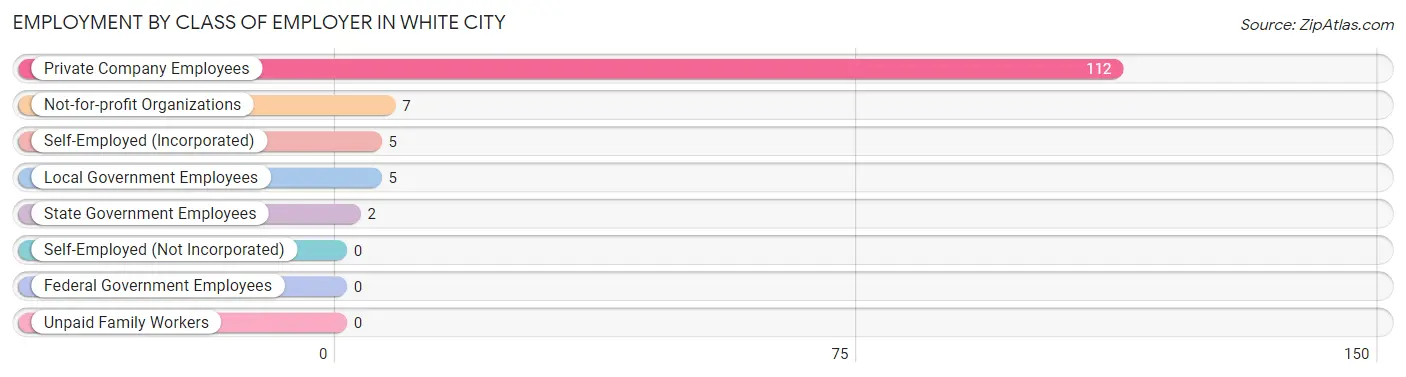
| Employer Class | # Employees | % Employees |
| Private Company Employees | 112 | 85.5% |
| Self-Employed (Incorporated) | 5 | 3.8% |
| Self-Employed (Not Incorporated) | 0 | 0.0% |
| Not-for-profit Organizations | 7 | 5.3% |
| Local Government Employees | 5 | 3.8% |
| State Government Employees | 2 | 1.5% |
| Federal Government Employees | 0 | 0.0% |
| Unpaid Family Workers | 0 | 0.0% |
| Total | 131 | 100.0% |
Employment Status by Age in White City
According to the labor force statistics for White City, out of the total population over 16 years of age (208), 65.4% or 136 individuals are in the labor force, with 3.7% or 5 of them unemployed. The age group with the highest labor force participation rate is 20 to 24 years, with 100.0% or 10 individuals in the labor force. Within the labor force, the 16 to 19 years age range has the highest percentage of unemployed individuals, with 50.0% or 2 of them being unemployed.
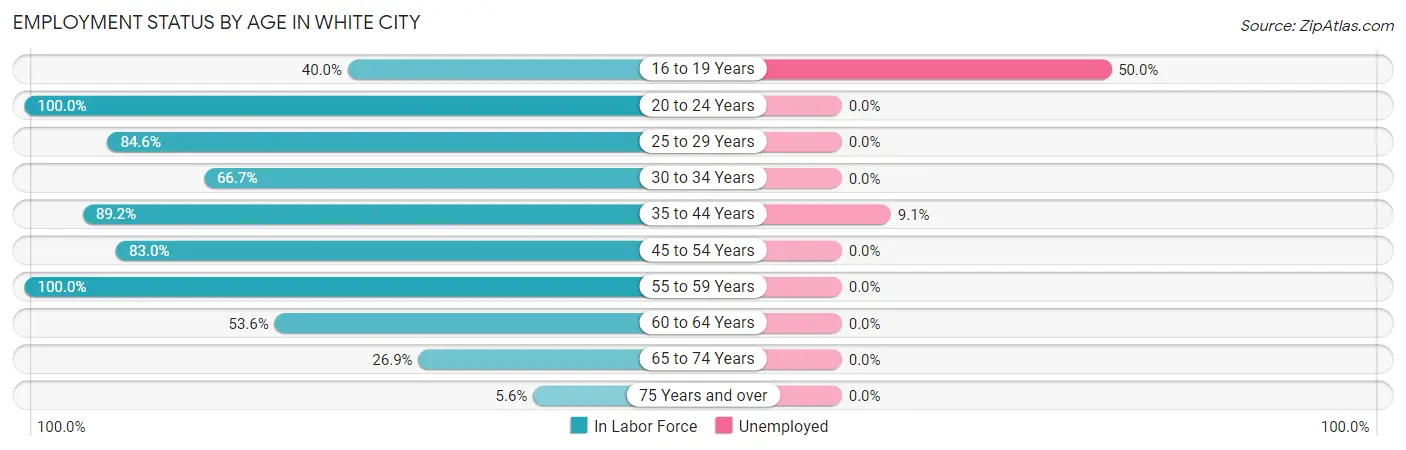
| Age Bracket | In Labor Force | Unemployed |
| 16 to 19 Years | 4 (40.0%) | 2 (50.0%) |
| 20 to 24 Years | 10 (100.0%) | 0 (0.0%) |
| 25 to 29 Years | 11 (84.6%) | 0 (0.0%) |
| 30 to 34 Years | 6 (66.7%) | 0 (0.0%) |
| 35 to 44 Years | 33 (89.2%) | 3 (9.1%) |
| 45 to 54 Years | 39 (83.0%) | 0 (0.0%) |
| 55 to 59 Years | 10 (100.0%) | 0 (0.0%) |
| 60 to 64 Years | 15 (53.6%) | 0 (0.0%) |
| 65 to 74 Years | 7 (26.9%) | 0 (0.0%) |
| 75 Years and over | 1 (5.6%) | 0 (0.0%) |
| Total | 136 (65.4%) | 5 (3.7%) |
Employment Status by Educational Attainment in White City
According to labor force statistics for White City, 79.2% of individuals (114) out of the total population between 25 and 64 years of age (144) are in the labor force, with 2.6% or 3 of them being unemployed. The group with the highest labor force participation rate are those with the educational attainment of less than high school, with 100.0% or 5 individuals in the labor force. Within the labor force, individuals with high school diploma education have the highest percentage of unemployment, with 4.7% or 3 of them being unemployed.
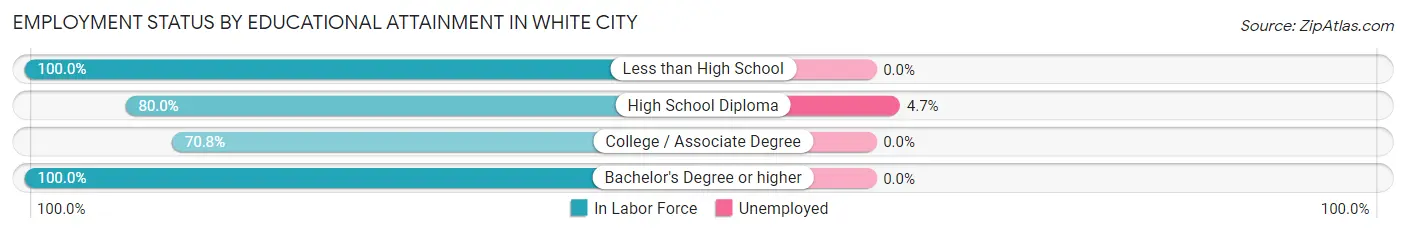
| Educational Attainment | In Labor Force | Unemployed |
| Less than High School | 5 (100.0%) | 0 (0.0%) |
| High School Diploma | 64 (80.0%) | 4 (4.7%) |
| College / Associate Degree | 34 (70.8%) | 0 (0.0%) |
| Bachelor's Degree or higher | 11 (100.0%) | 0 (0.0%) |
| Total | 114 (79.2%) | 4 (2.6%) |
Employment Occupations by Sex in White City
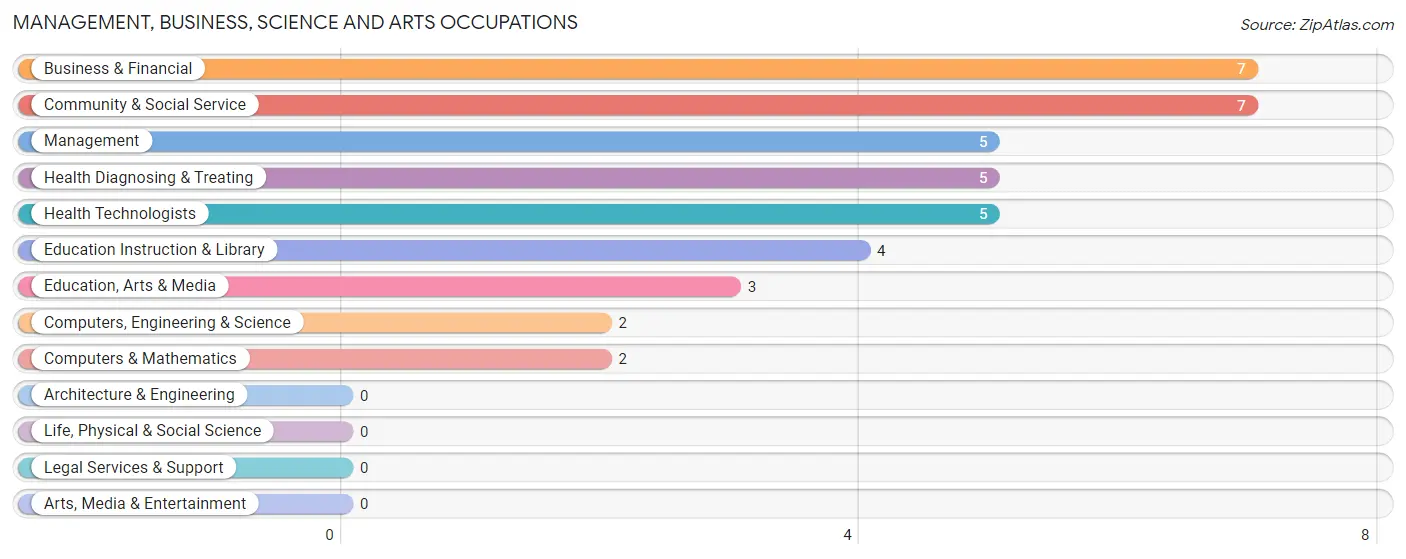
Management, Business, Science and Arts Occupations
The most common Management, Business, Science and Arts occupations in White City are Business & Financial (7 | 5.3%), Community & Social Service (7 | 5.3%), Management (5 | 3.8%), Health Diagnosing & Treating (5 | 3.8%), and Health Technologists (5 | 3.8%).
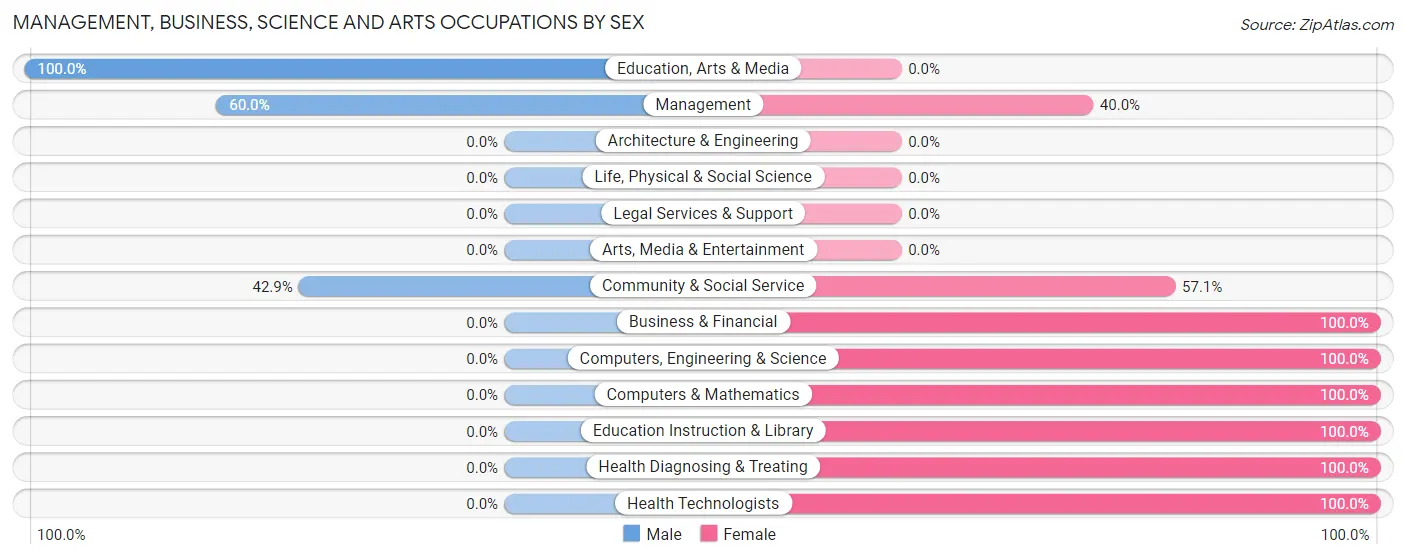
Management, Business, Science and Arts Occupations by Sex
Within the Management, Business, Science and Arts occupations in White City, the most male-oriented occupations are Education, Arts & Media (100.0%), Management (60.0%), and Community & Social Service (42.9%), while the most female-oriented occupations are Business & Financial (100.0%), Computers, Engineering & Science (100.0%), and Computers & Mathematics (100.0%).
| Occupation | Male | Female |
| Management | 3 (60.0%) | 2 (40.0%) |
| Business & Financial | 0 (0.0%) | 7 (100.0%) |
| Computers, Engineering & Science | 0 (0.0%) | 2 (100.0%) |
| Computers & Mathematics | 0 (0.0%) | 2 (100.0%) |
| Architecture & Engineering | 0 (0.0%) | 0 (0.0%) |
| Life, Physical & Social Science | 0 (0.0%) | 0 (0.0%) |
| Community & Social Service | 3 (42.9%) | 4 (57.1%) |
| Education, Arts & Media | 3 (100.0%) | 0 (0.0%) |
| Legal Services & Support | 0 (0.0%) | 0 (0.0%) |
| Education Instruction & Library | 0 (0.0%) | 4 (100.0%) |
| Arts, Media & Entertainment | 0 (0.0%) | 0 (0.0%) |
| Health Diagnosing & Treating | 0 (0.0%) | 5 (100.0%) |
| Health Technologists | 0 (0.0%) | 5 (100.0%) |
| Total (Category) | 6 (23.1%) | 20 (76.9%) |
| Total (Overall) | 71 (54.2%) | 60 (45.8%) |
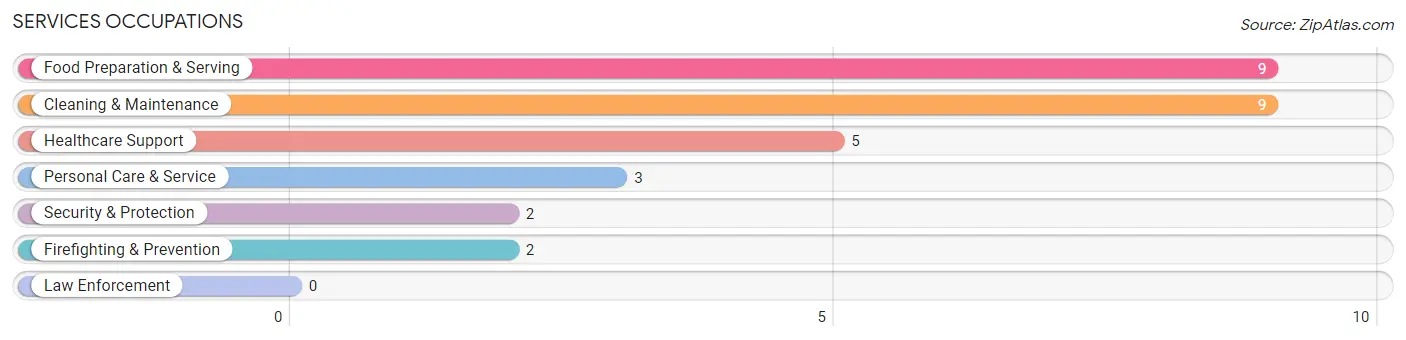
Services Occupations
The most common Services occupations in White City are Food Preparation & Serving (9 | 6.9%), Cleaning & Maintenance (9 | 6.9%), Healthcare Support (5 | 3.8%), Personal Care & Service (3 | 2.3%), and Security & Protection (2 | 1.5%).
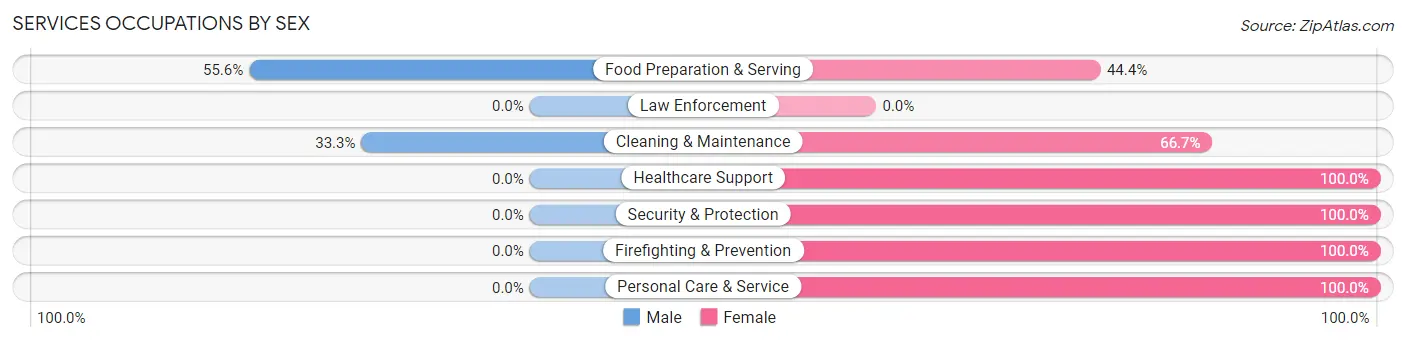
Services Occupations by Sex
Within the Services occupations in White City, the most male-oriented occupations are Food Preparation & Serving (55.6%), and Cleaning & Maintenance (33.3%), while the most female-oriented occupations are Healthcare Support (100.0%), Security & Protection (100.0%), and Firefighting & Prevention (100.0%).
| Occupation | Male | Female |
| Healthcare Support | 0 (0.0%) | 5 (100.0%) |
| Security & Protection | 0 (0.0%) | 2 (100.0%) |
| Firefighting & Prevention | 0 (0.0%) | 2 (100.0%) |
| Law Enforcement | 0 (0.0%) | 0 (0.0%) |
| Food Preparation & Serving | 5 (55.6%) | 4 (44.4%) |
| Cleaning & Maintenance | 3 (33.3%) | 6 (66.7%) |
| Personal Care & Service | 0 (0.0%) | 3 (100.0%) |
| Total (Category) | 8 (28.6%) | 20 (71.4%) |
| Total (Overall) | 71 (54.2%) | 60 (45.8%) |
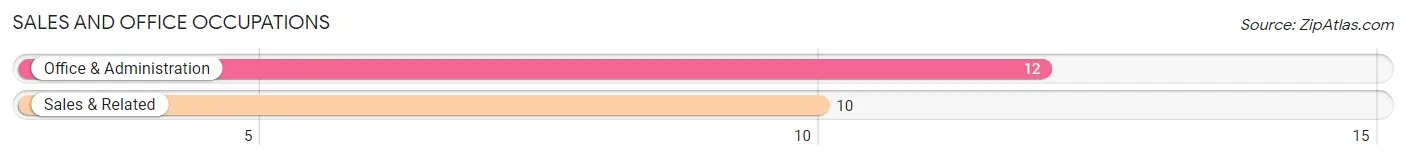
Sales and Office Occupations
The most common Sales and Office occupations in White City are Office & Administration (12 | 9.2%), and Sales & Related (10 | 7.6%).
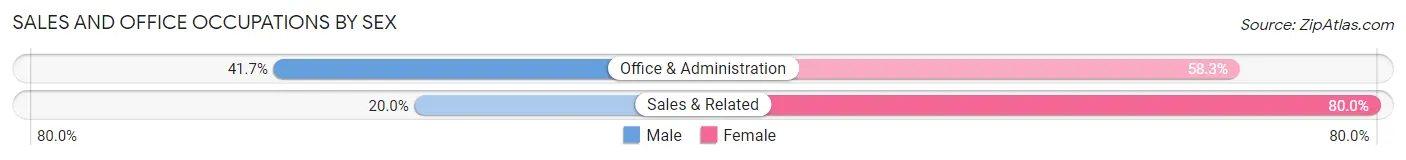
Sales and Office Occupations by Sex
| Occupation | Male | Female |
| Sales & Related | 2 (20.0%) | 8 (80.0%) |
| Office & Administration | 5 (41.7%) | 7 (58.3%) |
| Total (Category) | 7 (31.8%) | 15 (68.2%) |
| Total (Overall) | 71 (54.2%) | 60 (45.8%) |
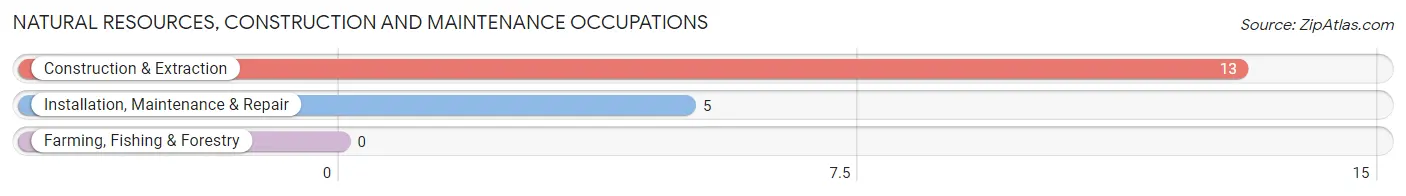
Natural Resources, Construction and Maintenance Occupations
The most common Natural Resources, Construction and Maintenance occupations in White City are Construction & Extraction (13 | 9.9%), and Installation, Maintenance & Repair (5 | 3.8%).
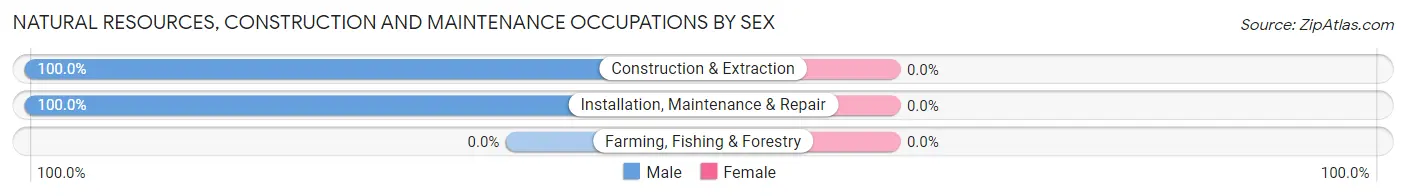
Natural Resources, Construction and Maintenance Occupations by Sex
| Occupation | Male | Female |
| Farming, Fishing & Forestry | 0 (0.0%) | 0 (0.0%) |
| Construction & Extraction | 13 (100.0%) | 0 (0.0%) |
| Installation, Maintenance & Repair | 5 (100.0%) | 0 (0.0%) |
| Total (Category) | 18 (100.0%) | 0 (0.0%) |
| Total (Overall) | 71 (54.2%) | 60 (45.8%) |
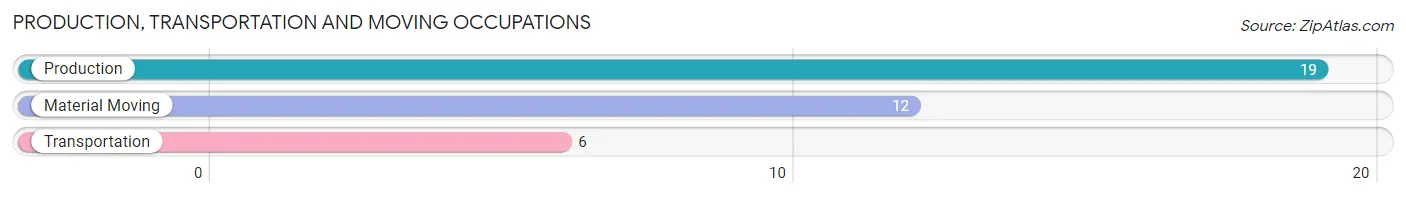
Production, Transportation and Moving Occupations
The most common Production, Transportation and Moving occupations in White City are Production (19 | 14.5%), Material Moving (12 | 9.2%), and Transportation (6 | 4.6%).
Production, Transportation and Moving Occupations by Sex
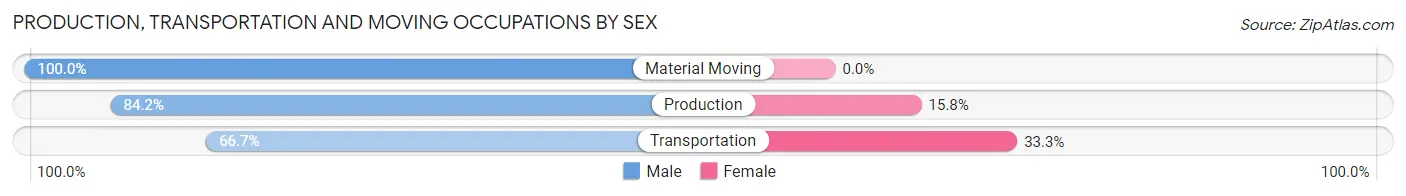
| Occupation | Male | Female |
| Production | 16 (84.2%) | 3 (15.8%) |
| Transportation | 4 (66.7%) | 2 (33.3%) |
| Material Moving | 12 (100.0%) | 0 (0.0%) |
| Total (Category) | 32 (86.5%) | 5 (13.5%) |
| Total (Overall) | 71 (54.2%) | 60 (45.8%) |
Employment Industries by Sex in White City
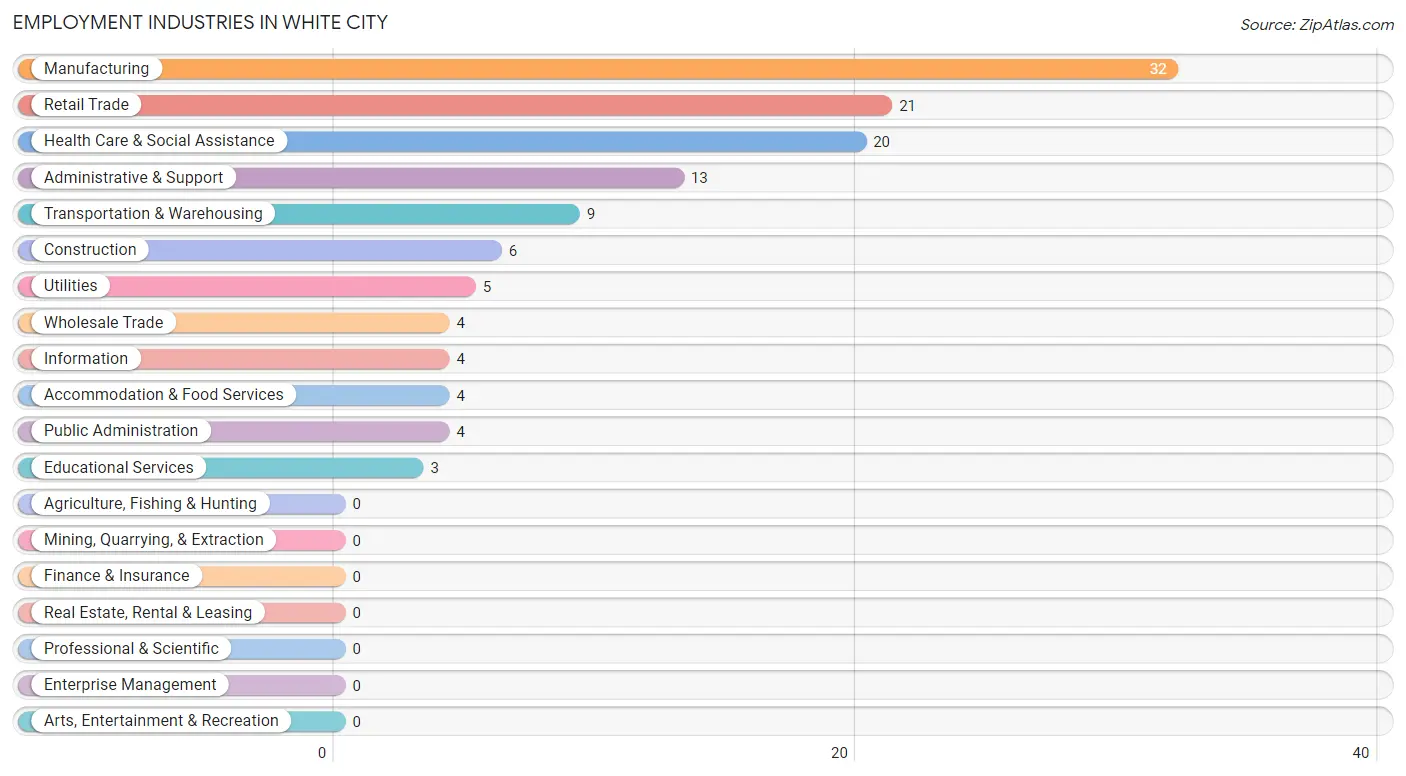
Employment Industries in White City
The major employment industries in White City include Manufacturing (32 | 24.4%), Retail Trade (21 | 16.0%), Health Care & Social Assistance (20 | 15.3%), Administrative & Support (13 | 9.9%), and Transportation & Warehousing (9 | 6.9%).
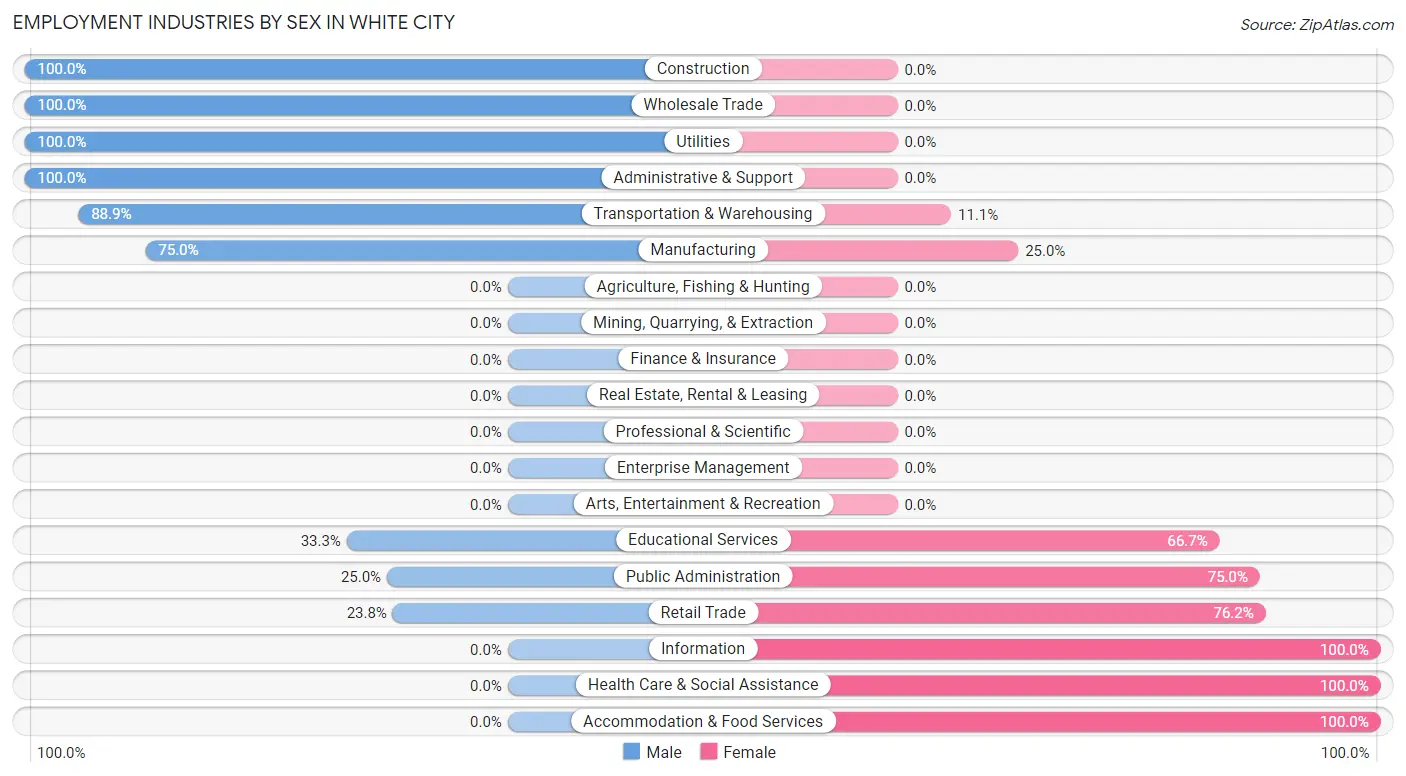
Employment Industries by Sex in White City
The White City industries that see more men than women are Construction (100.0%), Wholesale Trade (100.0%), and Utilities (100.0%), whereas the industries that tend to have a higher number of women are Information (100.0%), Health Care & Social Assistance (100.0%), and Accommodation & Food Services (100.0%).
| Industry | Male | Female |
| Agriculture, Fishing & Hunting | 0 (0.0%) | 0 (0.0%) |
| Mining, Quarrying, & Extraction | 0 (0.0%) | 0 (0.0%) |
| Construction | 6 (100.0%) | 0 (0.0%) |
| Manufacturing | 24 (75.0%) | 8 (25.0%) |
| Wholesale Trade | 4 (100.0%) | 0 (0.0%) |
| Retail Trade | 5 (23.8%) | 16 (76.2%) |
| Transportation & Warehousing | 8 (88.9%) | 1 (11.1%) |
| Utilities | 5 (100.0%) | 0 (0.0%) |
| Information | 0 (0.0%) | 4 (100.0%) |
| Finance & Insurance | 0 (0.0%) | 0 (0.0%) |
| Real Estate, Rental & Leasing | 0 (0.0%) | 0 (0.0%) |
| Professional & Scientific | 0 (0.0%) | 0 (0.0%) |
| Enterprise Management | 0 (0.0%) | 0 (0.0%) |
| Administrative & Support | 13 (100.0%) | 0 (0.0%) |
| Educational Services | 1 (33.3%) | 2 (66.7%) |
| Health Care & Social Assistance | 0 (0.0%) | 20 (100.0%) |
| Arts, Entertainment & Recreation | 0 (0.0%) | 0 (0.0%) |
| Accommodation & Food Services | 0 (0.0%) | 4 (100.0%) |
| Public Administration | 1 (25.0%) | 3 (75.0%) |
| Total | 71 (54.2%) | 60 (45.8%) |
Education in White City
School Enrollment in White City
The most common levels of schooling among the 19 students in White City are middle school (12 | 63.2%), elementary school (4 | 21.0%), and college / undergraduate (2 | 10.5%).
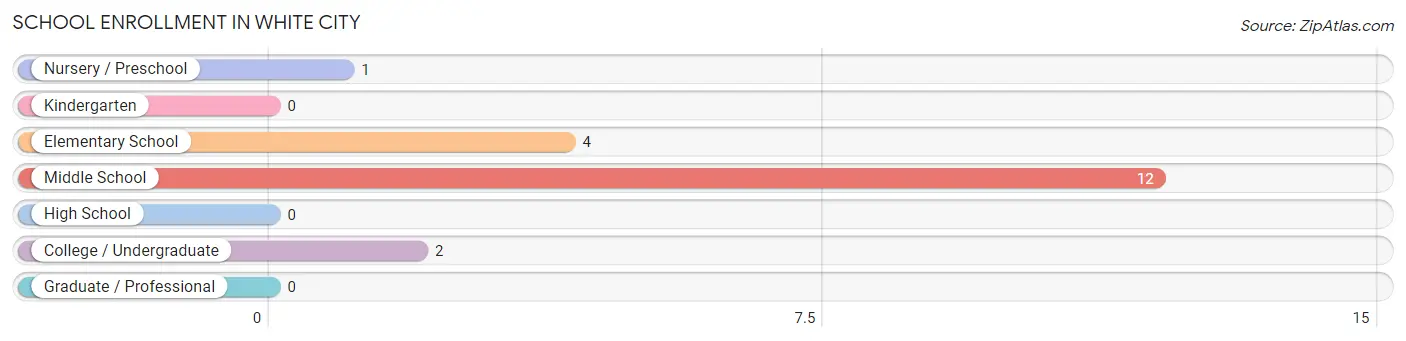
| School Level | # Students | % Students |
| Nursery / Preschool | 1 | 5.3% |
| Kindergarten | 0 | 0.0% |
| Elementary School | 4 | 21.0% |
| Middle School | 12 | 63.2% |
| High School | 0 | 0.0% |
| College / Undergraduate | 2 | 10.5% |
| Graduate / Professional | 0 | 0.0% |
| Total | 19 | 100.0% |
School Enrollment by Age by Funding Source in White City
Out of a total of 19 students who are enrolled in schools in White City, 2 (10.5%) attend a private institution, while the remaining 17 (89.5%) are enrolled in public schools. The age group of 5 to 9 year old has the highest likelihood of being enrolled in private schools, with 2 (50.0% in the age bracket) enrolled. Conversely, the age group of 3 to 4 year olds has the lowest likelihood of being enrolled in a private school, with 1 (100.0% in the age bracket) attending a public institution.
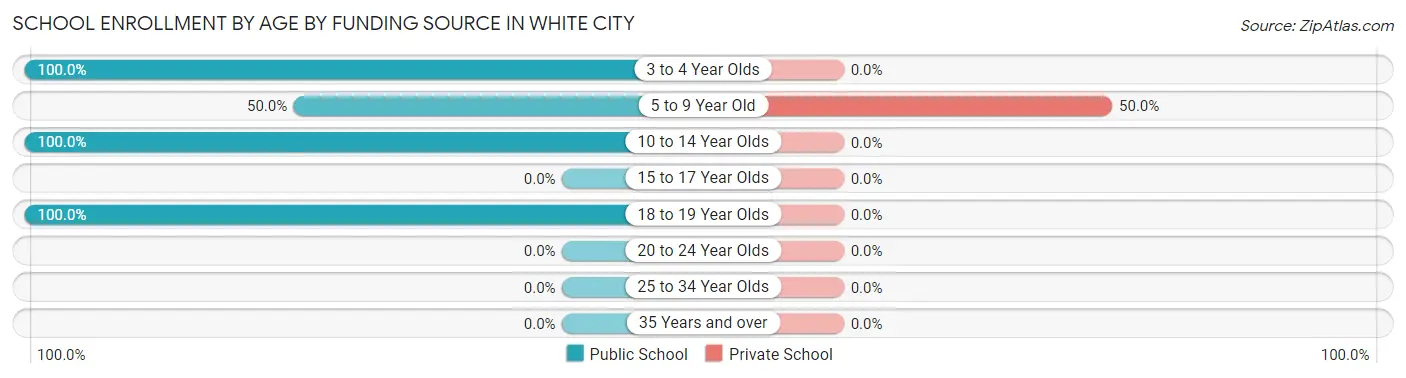
| Age Bracket | Public School | Private School |
| 3 to 4 Year Olds | 1 (100.0%) | 0 (0.0%) |
| 5 to 9 Year Old | 2 (50.0%) | 2 (50.0%) |
| 10 to 14 Year Olds | 12 (100.0%) | 0 (0.0%) |
| 15 to 17 Year Olds | 0 (0.0%) | 0 (0.0%) |
| 18 to 19 Year Olds | 2 (100.0%) | 0 (0.0%) |
| 20 to 24 Year Olds | 0 (0.0%) | 0 (0.0%) |
| 25 to 34 Year Olds | 0 (0.0%) | 0 (0.0%) |
| 35 Years and over | 0 (0.0%) | 0 (0.0%) |
| Total | 17 (89.5%) | 2 (10.5%) |
Educational Attainment by Field of Study in White City
Education (6 | 33.3%), science & technology (3 | 16.7%), business (3 | 16.7%), visual & performing arts (3 | 16.7%), and arts & humanities (2 | 11.1%) are the most common fields of study among 18 individuals in White City who have obtained a bachelor's degree or higher.
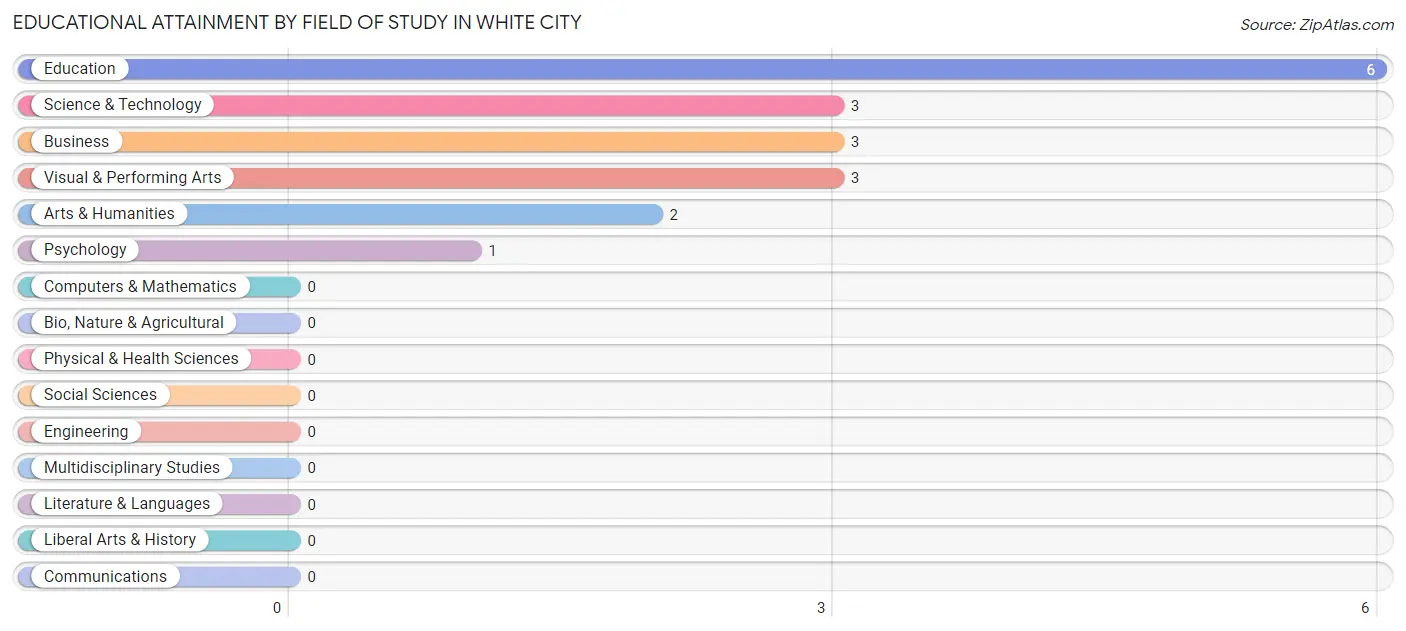
| Field of Study | # Graduates | % Graduates |
| Computers & Mathematics | 0 | 0.0% |
| Bio, Nature & Agricultural | 0 | 0.0% |
| Physical & Health Sciences | 0 | 0.0% |
| Psychology | 1 | 5.6% |
| Social Sciences | 0 | 0.0% |
| Engineering | 0 | 0.0% |
| Multidisciplinary Studies | 0 | 0.0% |
| Science & Technology | 3 | 16.7% |
| Business | 3 | 16.7% |
| Education | 6 | 33.3% |
| Literature & Languages | 0 | 0.0% |
| Liberal Arts & History | 0 | 0.0% |
| Visual & Performing Arts | 3 | 16.7% |
| Communications | 0 | 0.0% |
| Arts & Humanities | 2 | 11.1% |
| Total | 18 | 100.0% |
Transportation & Commute in White City
Vehicle Availability by Sex in White City
The most prevalent vehicle ownership categories in White City are males with 3 vehicles (30, accounting for 42.2%) and females with 3 vehicles (22, making up 50.0%).
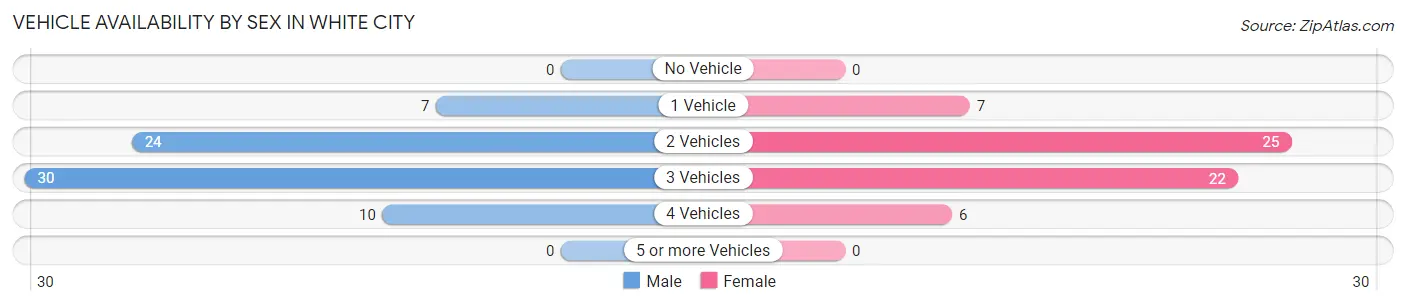
| Vehicles Available | Male | Female |
| No Vehicle | 0 (0.0%) | 0 (0.0%) |
| 1 Vehicle | 7 (9.9%) | 7 (11.7%) |
| 2 Vehicles | 24 (33.8%) | 25 (41.7%) |
| 3 Vehicles | 30 (42.2%) | 22 (36.7%) |
| 4 Vehicles | 10 (14.1%) | 6 (10.0%) |
| 5 or more Vehicles | 0 (0.0%) | 0 (0.0%) |
| Total | 71 (100.0%) | 60 (100.0%) |
Commute Time in White City
The most frequently occuring commute durations in White City are 10 to 14 minutes (26 commuters, 19.9%), 30 to 34 minutes (18 commuters, 13.7%), and 45 to 59 minutes (17 commuters, 13.0%).
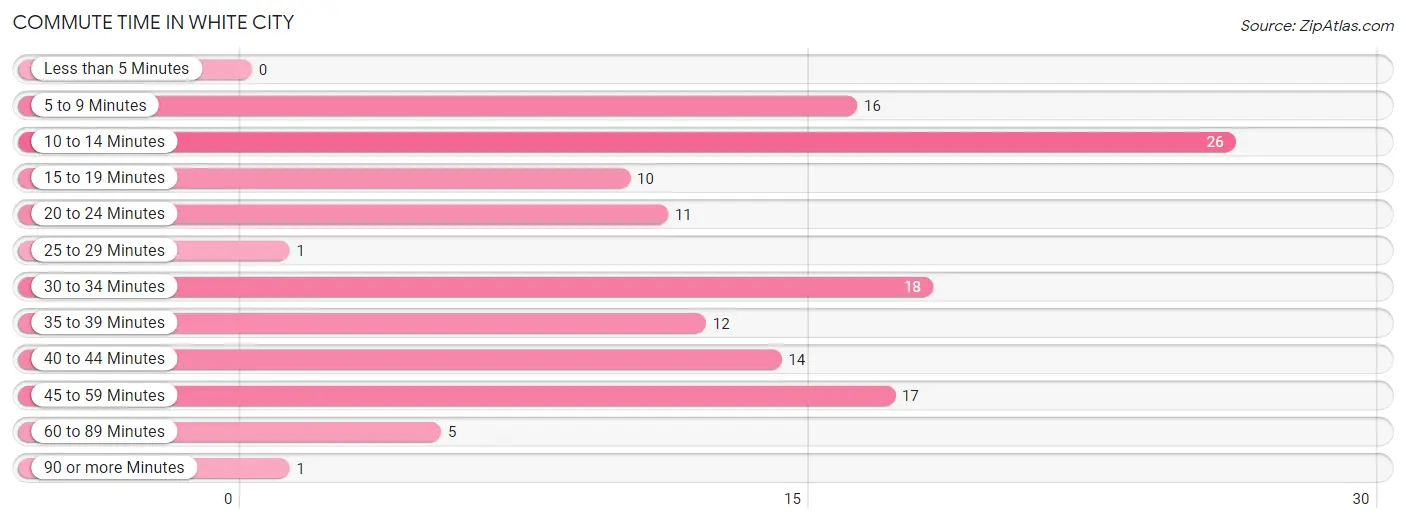
| Commute Time | # Commuters | % Commuters |
| Less than 5 Minutes | 0 | 0.0% |
| 5 to 9 Minutes | 16 | 12.2% |
| 10 to 14 Minutes | 26 | 19.9% |
| 15 to 19 Minutes | 10 | 7.6% |
| 20 to 24 Minutes | 11 | 8.4% |
| 25 to 29 Minutes | 1 | 0.8% |
| 30 to 34 Minutes | 18 | 13.7% |
| 35 to 39 Minutes | 12 | 9.2% |
| 40 to 44 Minutes | 14 | 10.7% |
| 45 to 59 Minutes | 17 | 13.0% |
| 60 to 89 Minutes | 5 | 3.8% |
| 90 or more Minutes | 1 | 0.8% |
Commute Time by Sex in White City
The most common commute times in White City are 10 to 14 minutes (13 commuters, 18.3%) for males and 10 to 14 minutes (13 commuters, 21.7%) for females.
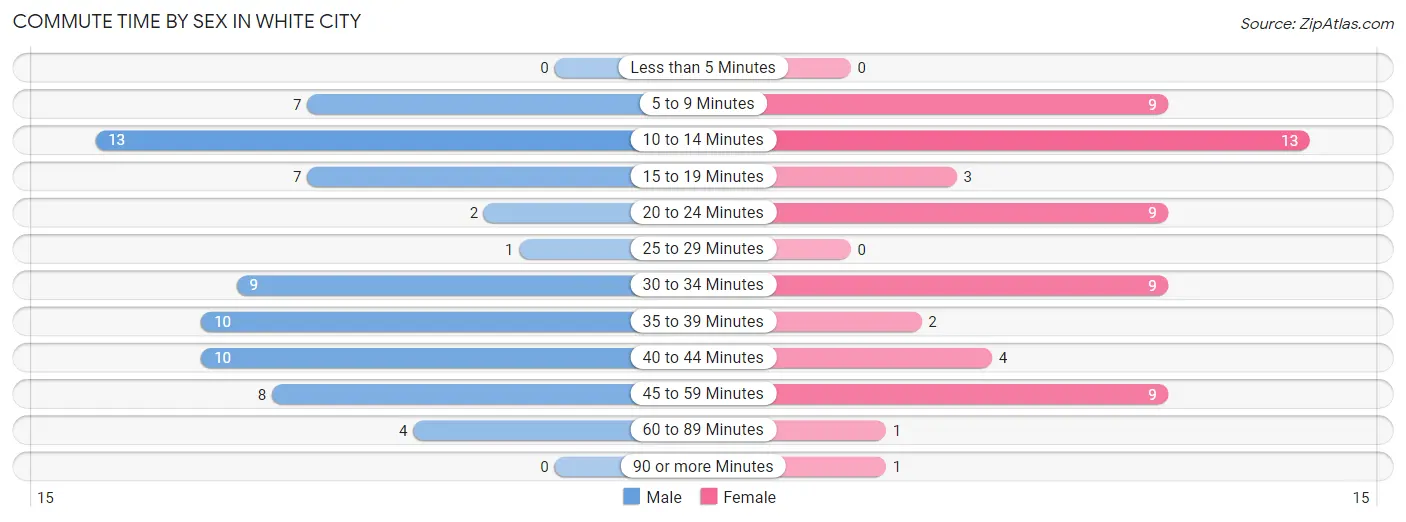
| Commute Time | Male | Female |
| Less than 5 Minutes | 0 (0.0%) | 0 (0.0%) |
| 5 to 9 Minutes | 7 (9.9%) | 9 (15.0%) |
| 10 to 14 Minutes | 13 (18.3%) | 13 (21.7%) |
| 15 to 19 Minutes | 7 (9.9%) | 3 (5.0%) |
| 20 to 24 Minutes | 2 (2.8%) | 9 (15.0%) |
| 25 to 29 Minutes | 1 (1.4%) | 0 (0.0%) |
| 30 to 34 Minutes | 9 (12.7%) | 9 (15.0%) |
| 35 to 39 Minutes | 10 (14.1%) | 2 (3.3%) |
| 40 to 44 Minutes | 10 (14.1%) | 4 (6.7%) |
| 45 to 59 Minutes | 8 (11.3%) | 9 (15.0%) |
| 60 to 89 Minutes | 4 (5.6%) | 1 (1.7%) |
| 90 or more Minutes | 0 (0.0%) | 1 (1.7%) |
Time of Departure to Work by Sex in White City
The most frequent times of departure to work in White City are 12:00 PM to 3:59 PM (17, 23.9%) for males and 6:00 AM to 6:29 AM (11, 18.3%) for females.
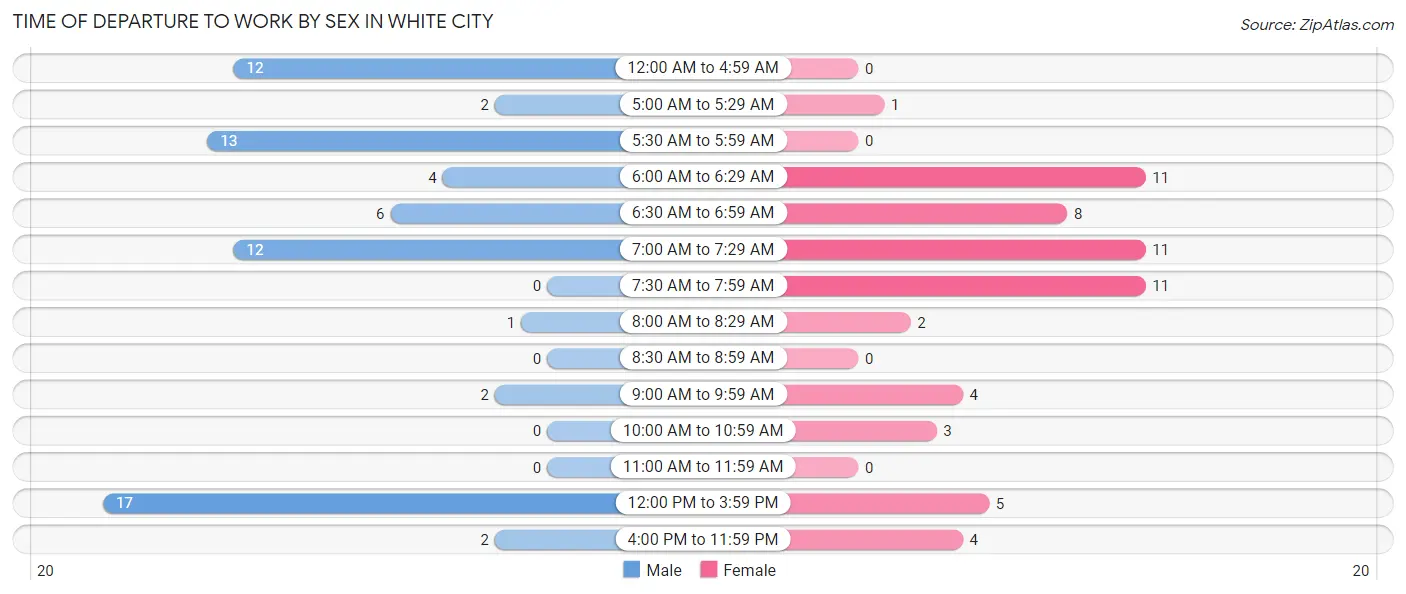
| Time of Departure | Male | Female |
| 12:00 AM to 4:59 AM | 12 (16.9%) | 0 (0.0%) |
| 5:00 AM to 5:29 AM | 2 (2.8%) | 1 (1.7%) |
| 5:30 AM to 5:59 AM | 13 (18.3%) | 0 (0.0%) |
| 6:00 AM to 6:29 AM | 4 (5.6%) | 11 (18.3%) |
| 6:30 AM to 6:59 AM | 6 (8.5%) | 8 (13.3%) |
| 7:00 AM to 7:29 AM | 12 (16.9%) | 11 (18.3%) |
| 7:30 AM to 7:59 AM | 0 (0.0%) | 11 (18.3%) |
| 8:00 AM to 8:29 AM | 1 (1.4%) | 2 (3.3%) |
| 8:30 AM to 8:59 AM | 0 (0.0%) | 0 (0.0%) |
| 9:00 AM to 9:59 AM | 2 (2.8%) | 4 (6.7%) |
| 10:00 AM to 10:59 AM | 0 (0.0%) | 3 (5.0%) |
| 11:00 AM to 11:59 AM | 0 (0.0%) | 0 (0.0%) |
| 12:00 PM to 3:59 PM | 17 (23.9%) | 5 (8.3%) |
| 4:00 PM to 11:59 PM | 2 (2.8%) | 4 (6.7%) |
| Total | 71 (100.0%) | 60 (100.0%) |
Housing Occupancy in White City
Occupancy by Ownership in White City
Of the total 102 dwellings in White City, owner-occupied units account for 100 (98.0%), while renter-occupied units make up 2 (2.0%).
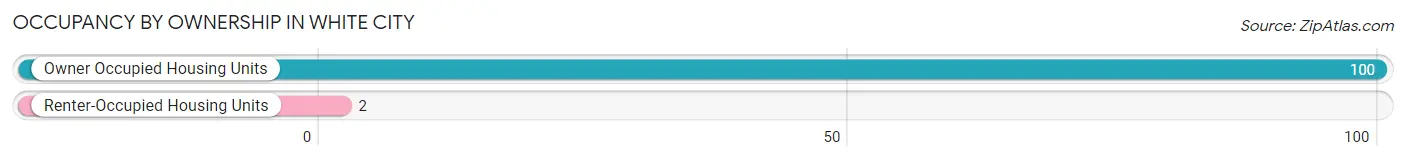
| Occupancy | # Housing Units | % Housing Units |
| Owner Occupied Housing Units | 100 | 98.0% |
| Renter-Occupied Housing Units | 2 | 2.0% |
| Total Occupied Housing Units | 102 | 100.0% |
Occupancy by Household Size in White City
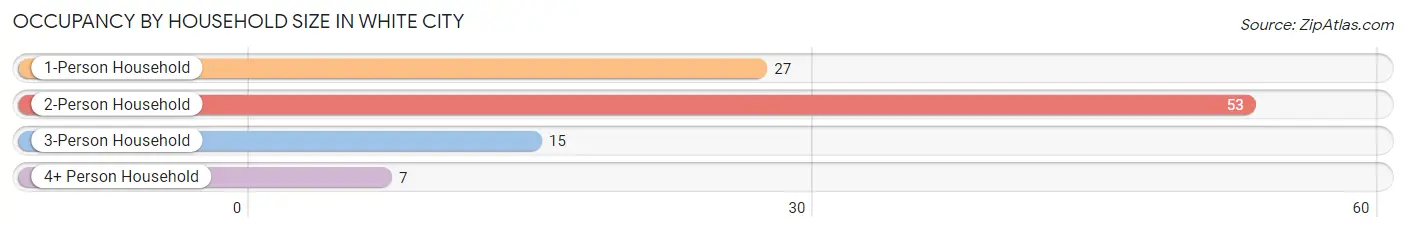
| Household Size | # Housing Units | % Housing Units |
| 1-Person Household | 27 | 26.5% |
| 2-Person Household | 53 | 52.0% |
| 3-Person Household | 15 | 14.7% |
| 4+ Person Household | 7 | 6.9% |
| Total Housing Units | 102 | 100.0% |
Occupancy by Ownership by Household Size in White City
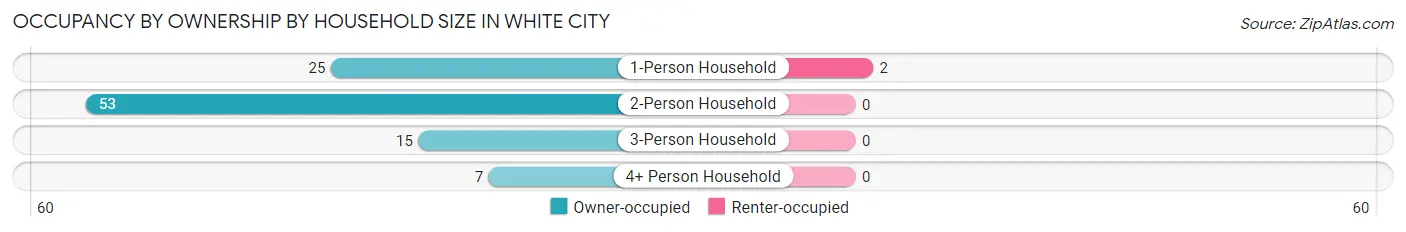
| Household Size | Owner-occupied | Renter-occupied |
| 1-Person Household | 25 (92.6%) | 2 (7.4%) |
| 2-Person Household | 53 (100.0%) | 0 (0.0%) |
| 3-Person Household | 15 (100.0%) | 0 (0.0%) |
| 4+ Person Household | 7 (100.0%) | 0 (0.0%) |
| Total Housing Units | 100 (98.0%) | 2 (2.0%) |
Occupancy by Educational Attainment in White City
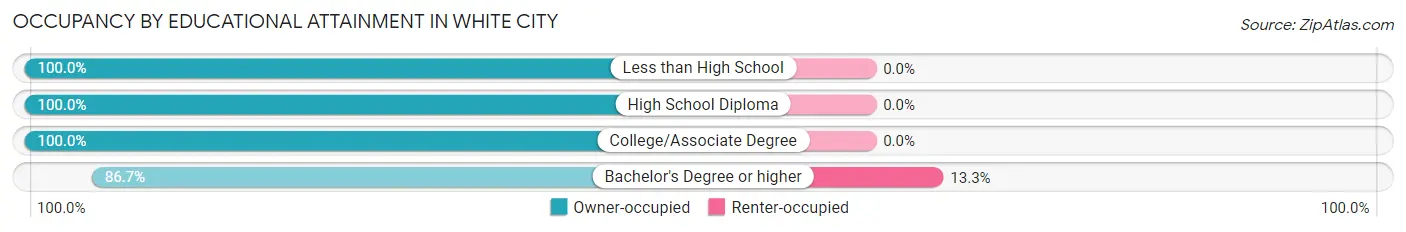
| Household Size | Owner-occupied | Renter-occupied |
| Less than High School | 2 (100.0%) | 0 (0.0%) |
| High School Diploma | 45 (100.0%) | 0 (0.0%) |
| College/Associate Degree | 40 (100.0%) | 0 (0.0%) |
| Bachelor's Degree or higher | 13 (86.7%) | 2 (13.3%) |
Occupancy by Age of Householder in White City
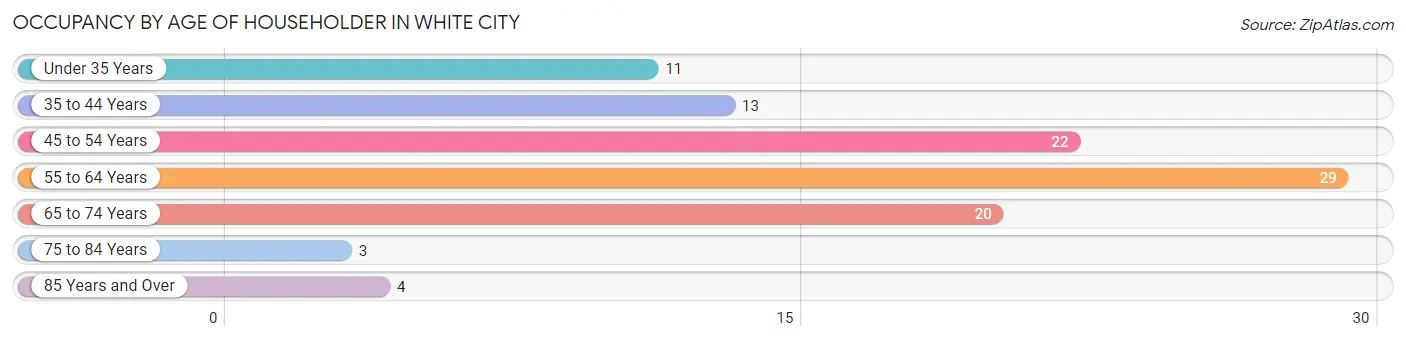
| Age Bracket | # Households | % Households |
| Under 35 Years | 11 | 10.8% |
| 35 to 44 Years | 13 | 12.8% |
| 45 to 54 Years | 22 | 21.6% |
| 55 to 64 Years | 29 | 28.4% |
| 65 to 74 Years | 20 | 19.6% |
| 75 to 84 Years | 3 | 2.9% |
| 85 Years and Over | 4 | 3.9% |
| Total | 102 | 100.0% |
Housing Finances in White City
Median Income by Occupancy in White City
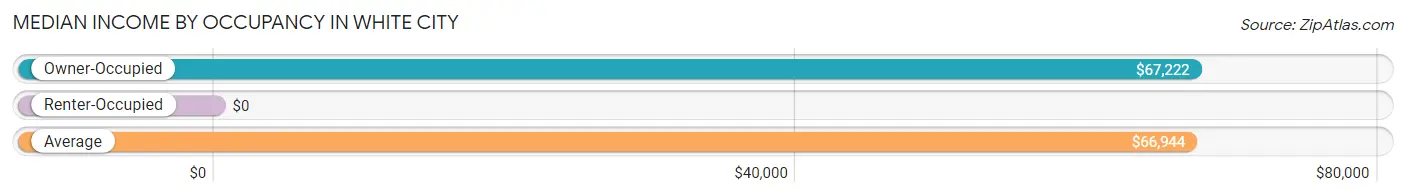
| Occupancy Type | # Households | Median Income |
| Owner-Occupied | 100 (98.0%) | $67,222 |
| Renter-Occupied | 2 (2.0%) | $0 |
| Average | 102 (100.0%) | $66,944 |
Occupancy by Householder Income Bracket in White City
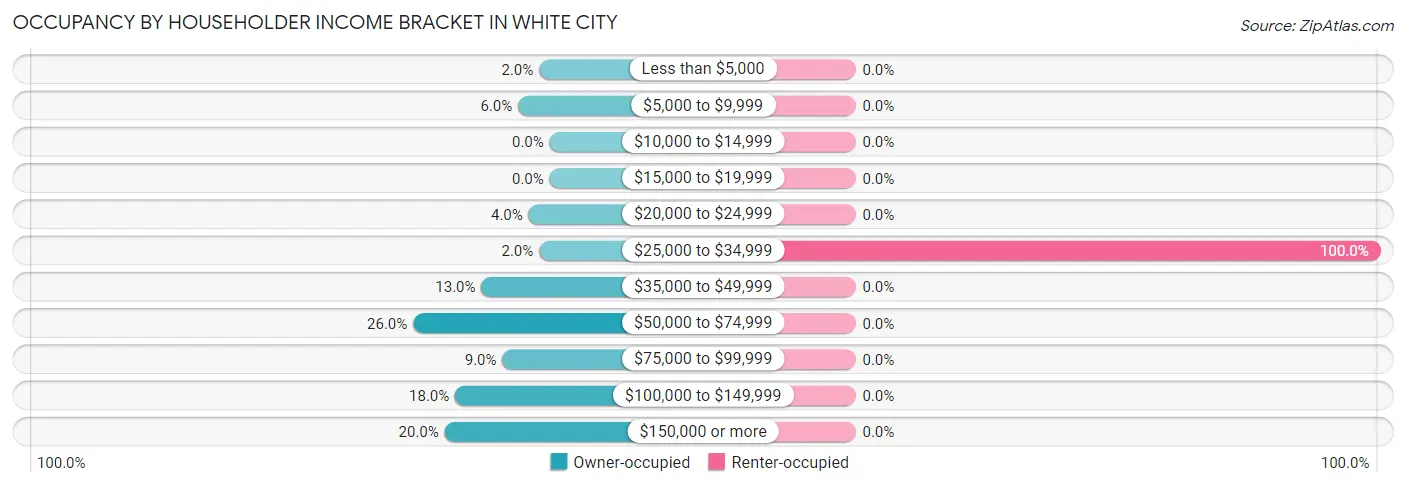
| Income Bracket | Owner-occupied | Renter-occupied |
| Less than $5,000 | 2 (2.0%) | 0 (0.0%) |
| $5,000 to $9,999 | 6 (6.0%) | 0 (0.0%) |
| $10,000 to $14,999 | 0 (0.0%) | 0 (0.0%) |
| $15,000 to $19,999 | 0 (0.0%) | 0 (0.0%) |
| $20,000 to $24,999 | 4 (4.0%) | 0 (0.0%) |
| $25,000 to $34,999 | 2 (2.0%) | 2 (100.0%) |
| $35,000 to $49,999 | 13 (13.0%) | 0 (0.0%) |
| $50,000 to $74,999 | 26 (26.0%) | 0 (0.0%) |
| $75,000 to $99,999 | 9 (9.0%) | 0 (0.0%) |
| $100,000 to $149,999 | 18 (18.0%) | 0 (0.0%) |
| $150,000 or more | 20 (20.0%) | 0 (0.0%) |
| Total | 100 (100.0%) | 2 (100.0%) |
Monthly Housing Cost Tiers in White City
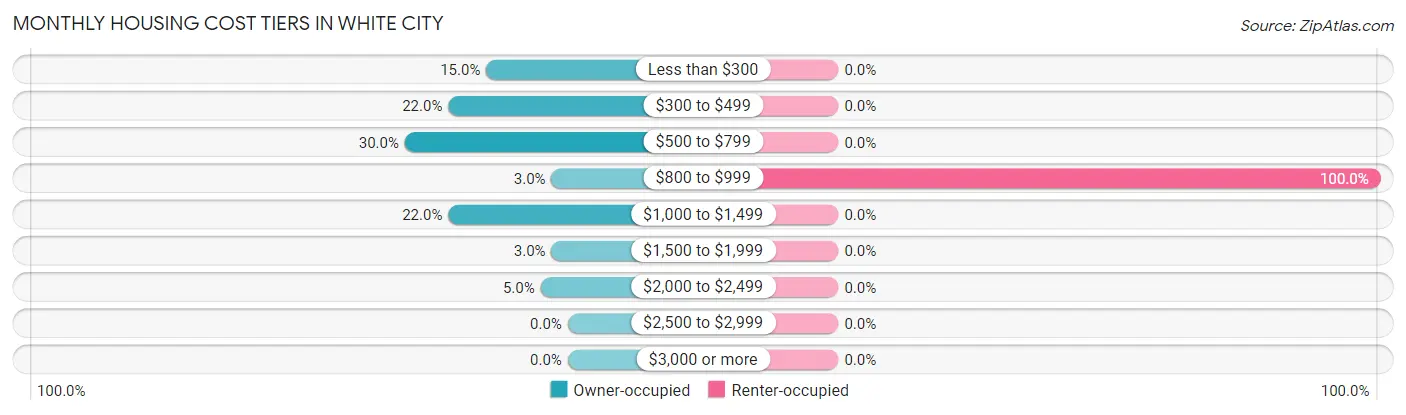
| Monthly Cost | Owner-occupied | Renter-occupied |
| Less than $300 | 15 (15.0%) | 0 (0.0%) |
| $300 to $499 | 22 (22.0%) | 0 (0.0%) |
| $500 to $799 | 30 (30.0%) | 0 (0.0%) |
| $800 to $999 | 3 (3.0%) | 2 (100.0%) |
| $1,000 to $1,499 | 22 (22.0%) | 0 (0.0%) |
| $1,500 to $1,999 | 3 (3.0%) | 0 (0.0%) |
| $2,000 to $2,499 | 5 (5.0%) | 0 (0.0%) |
| $2,500 to $2,999 | 0 (0.0%) | 0 (0.0%) |
| $3,000 or more | 0 (0.0%) | 0 (0.0%) |
| Total | 100 (100.0%) | 2 (100.0%) |
Physical Housing Characteristics in White City
Housing Structures in White City
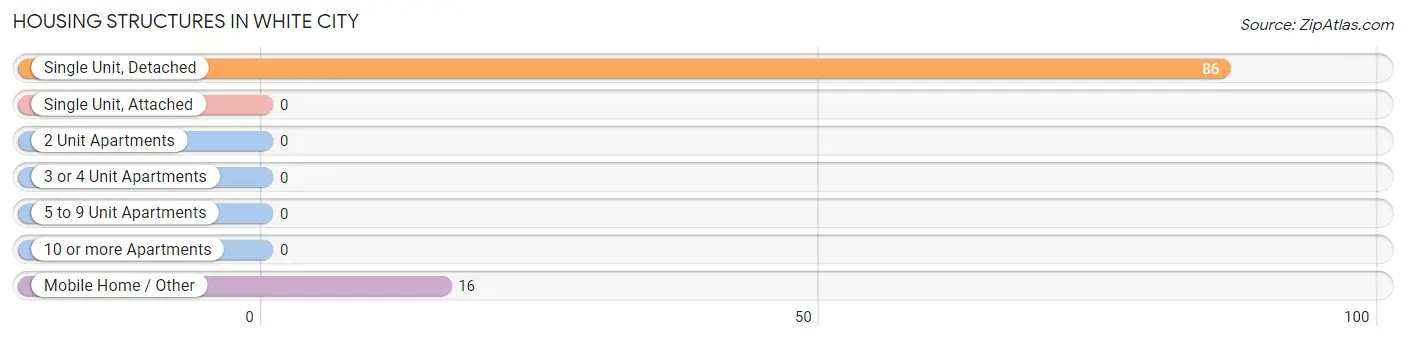
| Structure Type | # Housing Units | % Housing Units |
| Single Unit, Detached | 86 | 84.3% |
| Single Unit, Attached | 0 | 0.0% |
| 2 Unit Apartments | 0 | 0.0% |
| 3 or 4 Unit Apartments | 0 | 0.0% |
| 5 to 9 Unit Apartments | 0 | 0.0% |
| 10 or more Apartments | 0 | 0.0% |
| Mobile Home / Other | 16 | 15.7% |
| Total | 102 | 100.0% |
Housing Structures by Occupancy in White City
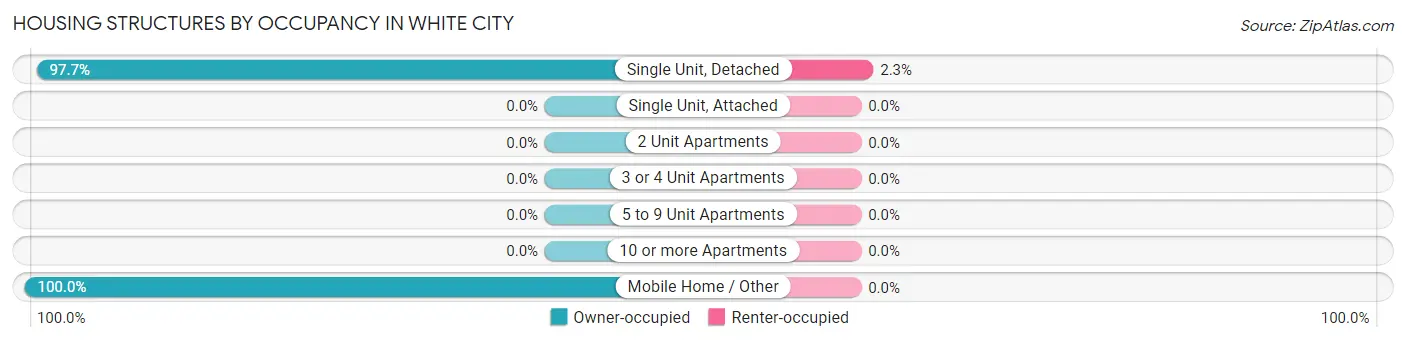
| Structure Type | Owner-occupied | Renter-occupied |
| Single Unit, Detached | 84 (97.7%) | 2 (2.3%) |
| Single Unit, Attached | 0 (0.0%) | 0 (0.0%) |
| 2 Unit Apartments | 0 (0.0%) | 0 (0.0%) |
| 3 or 4 Unit Apartments | 0 (0.0%) | 0 (0.0%) |
| 5 to 9 Unit Apartments | 0 (0.0%) | 0 (0.0%) |
| 10 or more Apartments | 0 (0.0%) | 0 (0.0%) |
| Mobile Home / Other | 16 (100.0%) | 0 (0.0%) |
| Total | 100 (98.0%) | 2 (2.0%) |
Housing Structures by Number of Rooms in White City
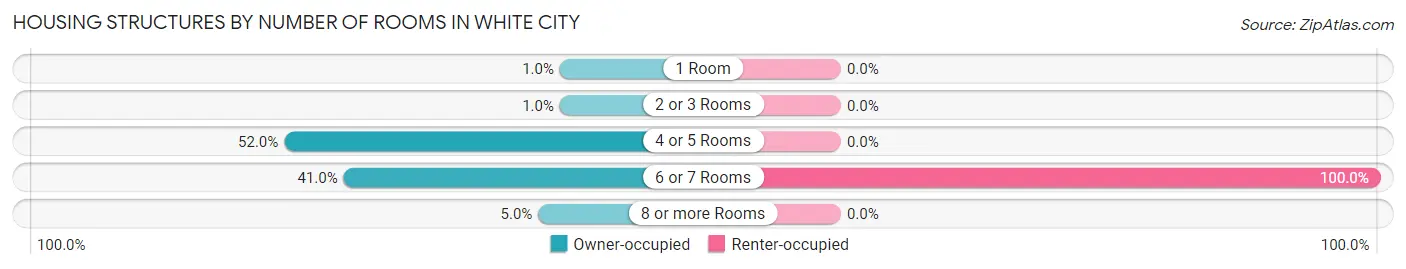
| Number of Rooms | Owner-occupied | Renter-occupied |
| 1 Room | 1 (1.0%) | 0 (0.0%) |
| 2 or 3 Rooms | 1 (1.0%) | 0 (0.0%) |
| 4 or 5 Rooms | 52 (52.0%) | 0 (0.0%) |
| 6 or 7 Rooms | 41 (41.0%) | 2 (100.0%) |
| 8 or more Rooms | 5 (5.0%) | 0 (0.0%) |
| Total | 100 (100.0%) | 2 (100.0%) |
Housing Structure by Heating Type in White City
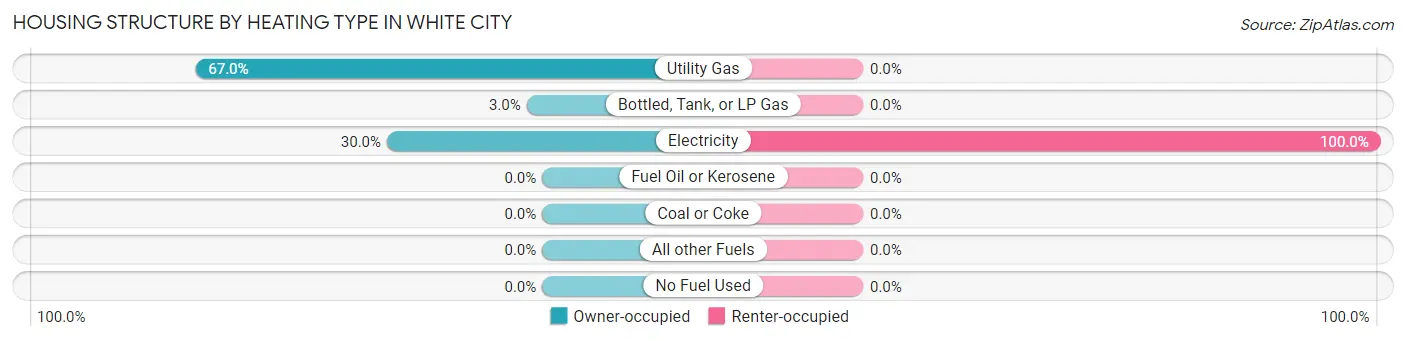
| Heating Type | Owner-occupied | Renter-occupied |
| Utility Gas | 67 (67.0%) | 0 (0.0%) |
| Bottled, Tank, or LP Gas | 3 (3.0%) | 0 (0.0%) |
| Electricity | 30 (30.0%) | 2 (100.0%) |
| Fuel Oil or Kerosene | 0 (0.0%) | 0 (0.0%) |
| Coal or Coke | 0 (0.0%) | 0 (0.0%) |
| All other Fuels | 0 (0.0%) | 0 (0.0%) |
| No Fuel Used | 0 (0.0%) | 0 (0.0%) |
| Total | 100 (100.0%) | 2 (100.0%) |
Household Vehicle Usage in White City
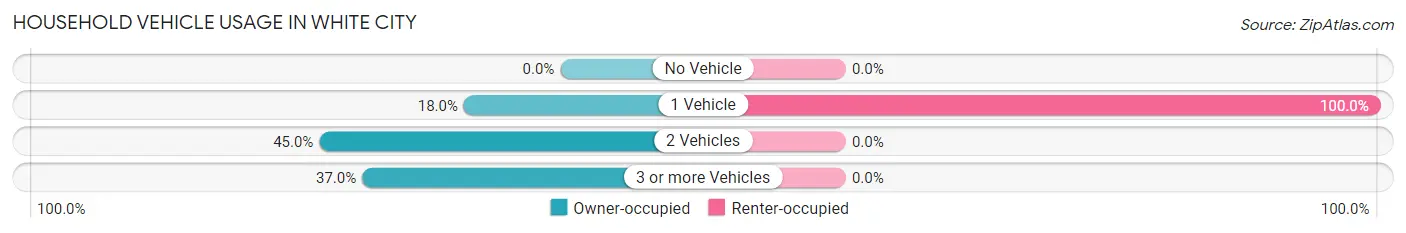
| Vehicles per Household | Owner-occupied | Renter-occupied |
| No Vehicle | 0 (0.0%) | 0 (0.0%) |
| 1 Vehicle | 18 (18.0%) | 2 (100.0%) |
| 2 Vehicles | 45 (45.0%) | 0 (0.0%) |
| 3 or more Vehicles | 37 (37.0%) | 0 (0.0%) |
| Total | 100 (100.0%) | 2 (100.0%) |
Real Estate & Mortgages in White City
Real Estate and Mortgage Overview in White City
| Characteristic | Without Mortgage | With Mortgage |
| Housing Units | 56 | 44 |
| Median Property Value | $73,300 | $125,000 |
| Median Household Income | $66,667 | $11 |
| Monthly Housing Costs | $440 | $0 |
| Real Estate Taxes | - | - |
Property Value by Mortgage Status in White City
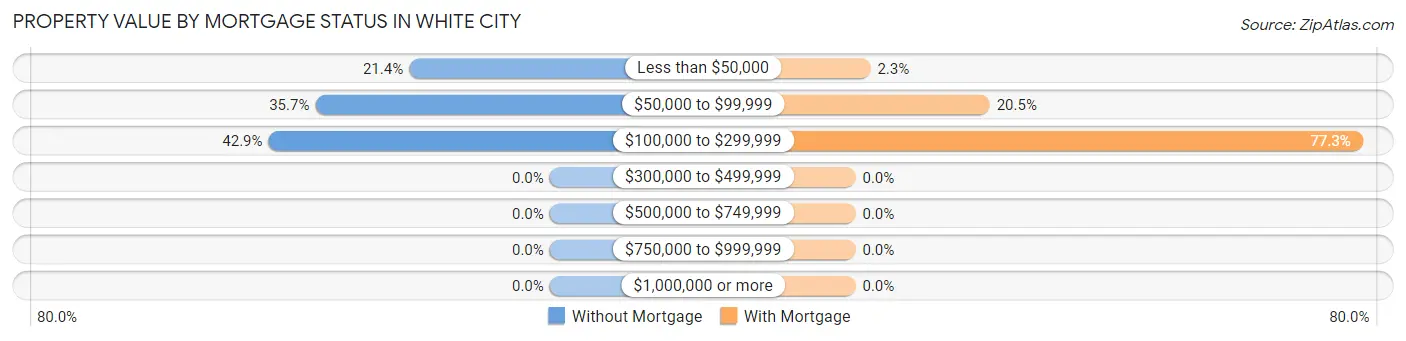
| Property Value | Without Mortgage | With Mortgage |
| Less than $50,000 | 12 (21.4%) | 1 (2.3%) |
| $50,000 to $99,999 | 20 (35.7%) | 9 (20.4%) |
| $100,000 to $299,999 | 24 (42.9%) | 34 (77.3%) |
| $300,000 to $499,999 | 0 (0.0%) | 0 (0.0%) |
| $500,000 to $749,999 | 0 (0.0%) | 0 (0.0%) |
| $750,000 to $999,999 | 0 (0.0%) | 0 (0.0%) |
| $1,000,000 or more | 0 (0.0%) | 0 (0.0%) |
| Total | 56 (100.0%) | 44 (100.0%) |
Household Income by Mortgage Status in White City
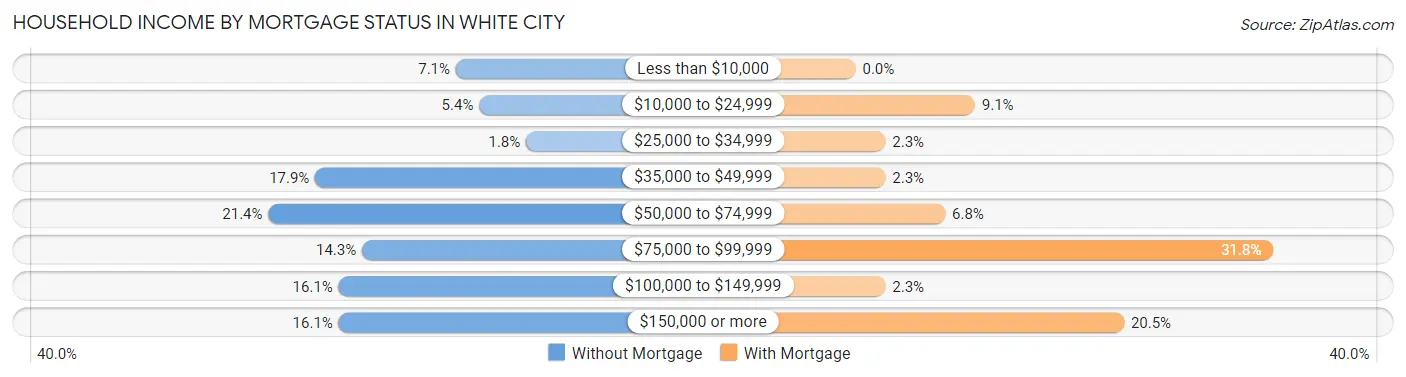
| Household Income | Without Mortgage | With Mortgage |
| Less than $10,000 | 4 (7.1%) | 0 (0.0%) |
| $10,000 to $24,999 | 3 (5.4%) | 4 (9.1%) |
| $25,000 to $34,999 | 1 (1.8%) | 1 (2.3%) |
| $35,000 to $49,999 | 10 (17.9%) | 1 (2.3%) |
| $50,000 to $74,999 | 12 (21.4%) | 3 (6.8%) |
| $75,000 to $99,999 | 8 (14.3%) | 14 (31.8%) |
| $100,000 to $149,999 | 9 (16.1%) | 1 (2.3%) |
| $150,000 or more | 9 (16.1%) | 9 (20.4%) |
| Total | 56 (100.0%) | 44 (100.0%) |
Property Value to Household Income Ratio in White City
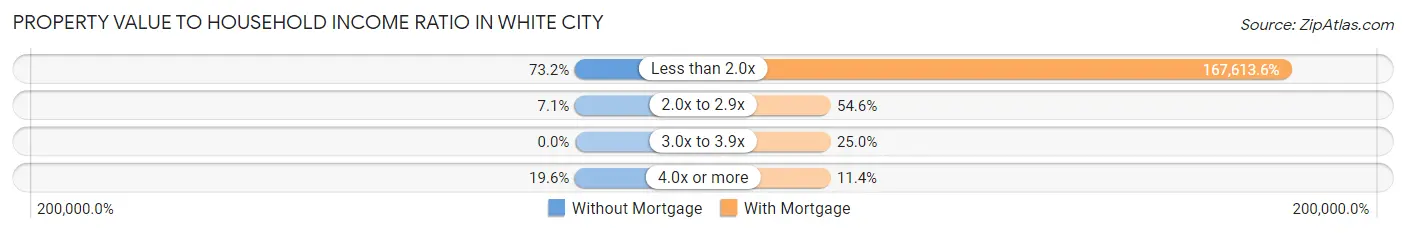
| Value-to-Income Ratio | Without Mortgage | With Mortgage |
| Less than 2.0x | 41 (73.2%) | 73,750 (167,613.6%) |
| 2.0x to 2.9x | 4 (7.1%) | 24 (54.5%) |
| 3.0x to 3.9x | 0 (0.0%) | 11 (25.0%) |
| 4.0x or more | 11 (19.6%) | 5 (11.4%) |
| Total | 56 (100.0%) | 44 (100.0%) |
Real Estate Taxes by Mortgage Status in White City
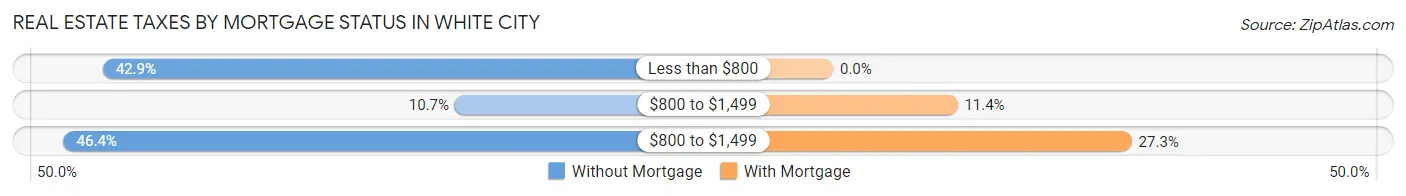
| Property Taxes | Without Mortgage | With Mortgage |
| Less than $800 | 24 (42.9%) | 0 (0.0%) |
| $800 to $1,499 | 6 (10.7%) | 5 (11.4%) |
| $800 to $1,499 | 26 (46.4%) | 12 (27.3%) |
| Total | 56 (100.0%) | 44 (100.0%) |
Health & Disability in White City
Health Insurance Coverage by Age in White City
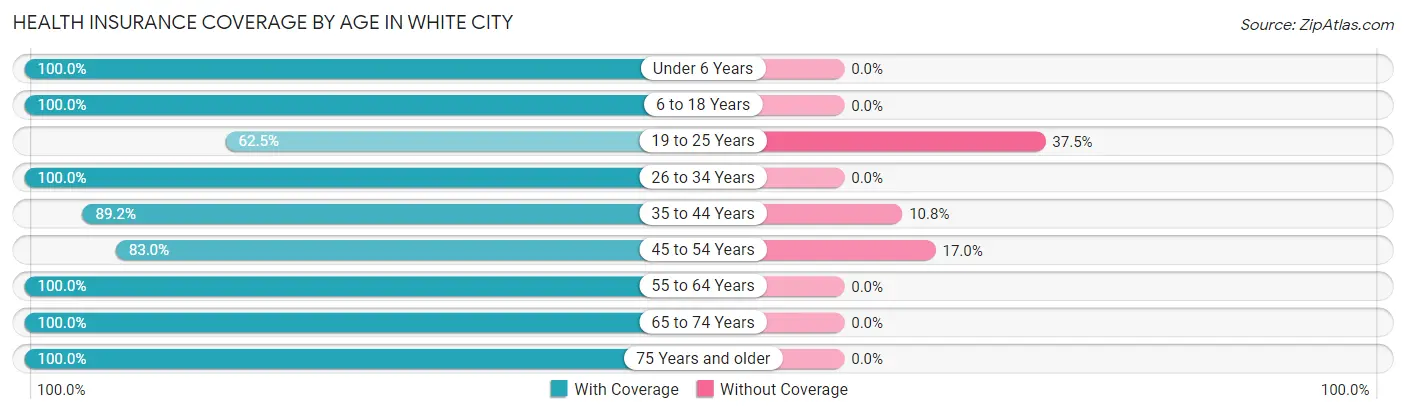
| Age Bracket | With Coverage | Without Coverage |
| Under 6 Years | 2 (100.0%) | 0 (0.0%) |
| 6 to 18 Years | 22 (100.0%) | 0 (0.0%) |
| 19 to 25 Years | 10 (62.5%) | 6 (37.5%) |
| 26 to 34 Years | 20 (100.0%) | 0 (0.0%) |
| 35 to 44 Years | 33 (89.2%) | 4 (10.8%) |
| 45 to 54 Years | 39 (83.0%) | 8 (17.0%) |
| 55 to 64 Years | 38 (100.0%) | 0 (0.0%) |
| 65 to 74 Years | 26 (100.0%) | 0 (0.0%) |
| 75 Years and older | 18 (100.0%) | 0 (0.0%) |
| Total | 208 (92.0%) | 18 (8.0%) |
Health Insurance Coverage by Citizenship Status in White City
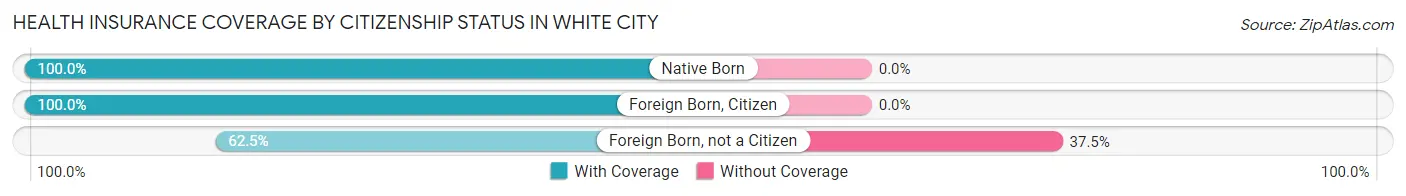
| Citizenship Status | With Coverage | Without Coverage |
| Native Born | 2 (100.0%) | 0 (0.0%) |
| Foreign Born, Citizen | 22 (100.0%) | 0 (0.0%) |
| Foreign Born, not a Citizen | 10 (62.5%) | 6 (37.5%) |
Health Insurance Coverage by Household Income in White City
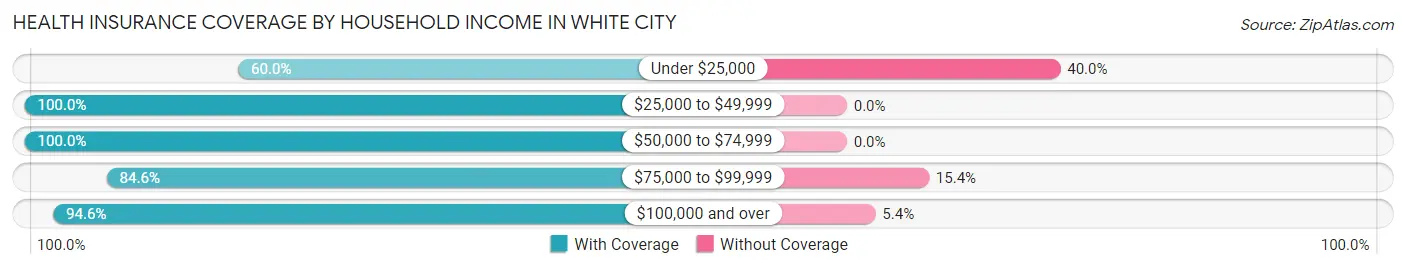
| Household Income | With Coverage | Without Coverage |
| Under $25,000 | 12 (60.0%) | 8 (40.0%) |
| $25,000 to $49,999 | 30 (100.0%) | 0 (0.0%) |
| $50,000 to $74,999 | 38 (100.0%) | 0 (0.0%) |
| $75,000 to $99,999 | 22 (84.6%) | 4 (15.4%) |
| $100,000 and over | 106 (94.6%) | 6 (5.4%) |
Public vs Private Health Insurance Coverage by Age in White City
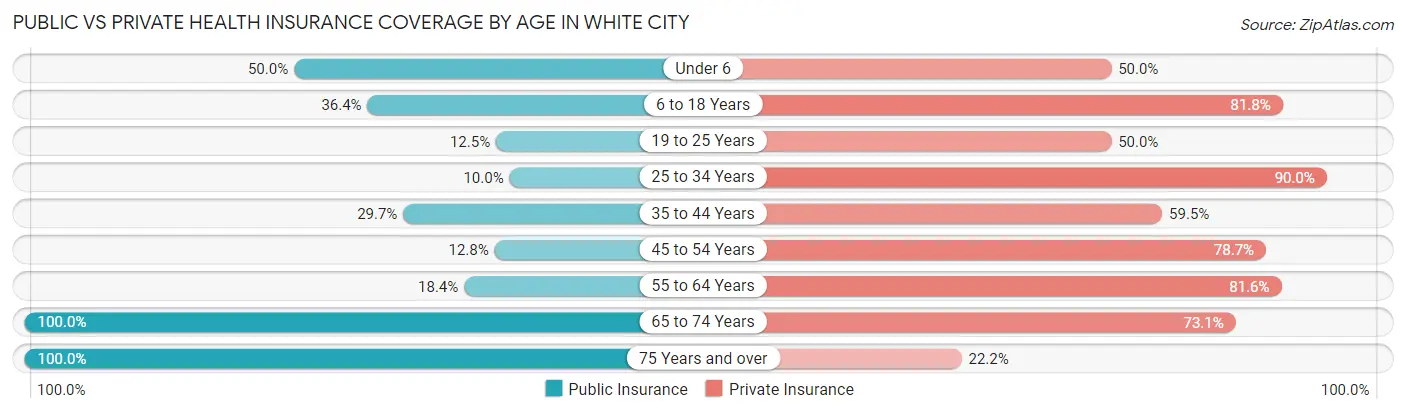
| Age Bracket | Public Insurance | Private Insurance |
| Under 6 | 1 (50.0%) | 1 (50.0%) |
| 6 to 18 Years | 8 (36.4%) | 18 (81.8%) |
| 19 to 25 Years | 2 (12.5%) | 8 (50.0%) |
| 25 to 34 Years | 2 (10.0%) | 18 (90.0%) |
| 35 to 44 Years | 11 (29.7%) | 22 (59.5%) |
| 45 to 54 Years | 6 (12.8%) | 37 (78.7%) |
| 55 to 64 Years | 7 (18.4%) | 31 (81.6%) |
| 65 to 74 Years | 26 (100.0%) | 19 (73.1%) |
| 75 Years and over | 18 (100.0%) | 4 (22.2%) |
| Total | 81 (35.8%) | 158 (69.9%) |
Disability Status by Sex by Age in White City
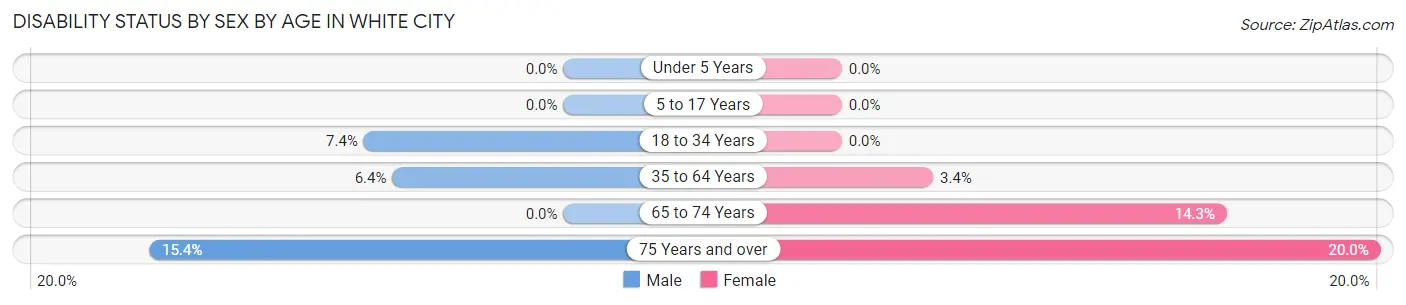
| Age Bracket | Male | Female |
| Under 5 Years | 0 (0.0%) | 0 (0.0%) |
| 5 to 17 Years | 0 (0.0%) | 0 (0.0%) |
| 18 to 34 Years | 2 (7.4%) | 0 (0.0%) |
| 35 to 64 Years | 4 (6.4%) | 2 (3.4%) |
| 65 to 74 Years | 0 (0.0%) | 2 (14.3%) |
| 75 Years and over | 2 (15.4%) | 1 (20.0%) |
Disability Class by Sex by Age in White City
Disability Class: Hearing Difficulty
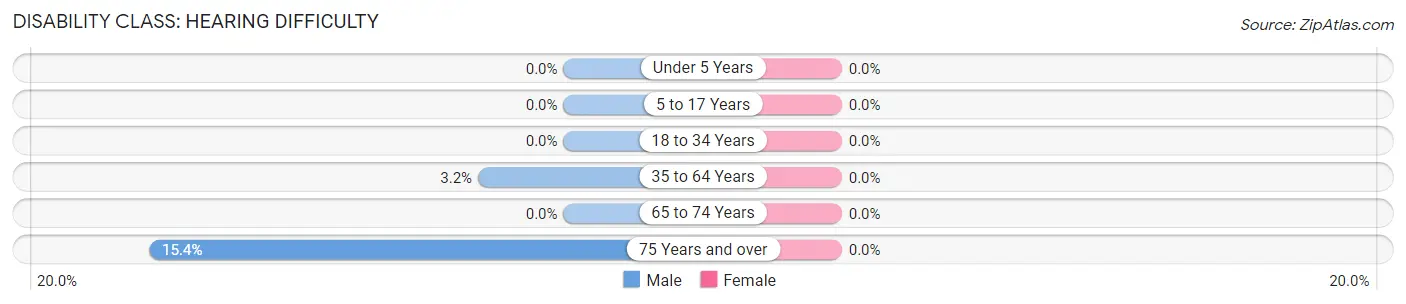
| Age Bracket | Male | Female |
| Under 5 Years | 0 (0.0%) | 0 (0.0%) |
| 5 to 17 Years | 0 (0.0%) | 0 (0.0%) |
| 18 to 34 Years | 0 (0.0%) | 0 (0.0%) |
| 35 to 64 Years | 2 (3.2%) | 0 (0.0%) |
| 65 to 74 Years | 0 (0.0%) | 0 (0.0%) |
| 75 Years and over | 2 (15.4%) | 0 (0.0%) |
Disability Class: Vision Difficulty
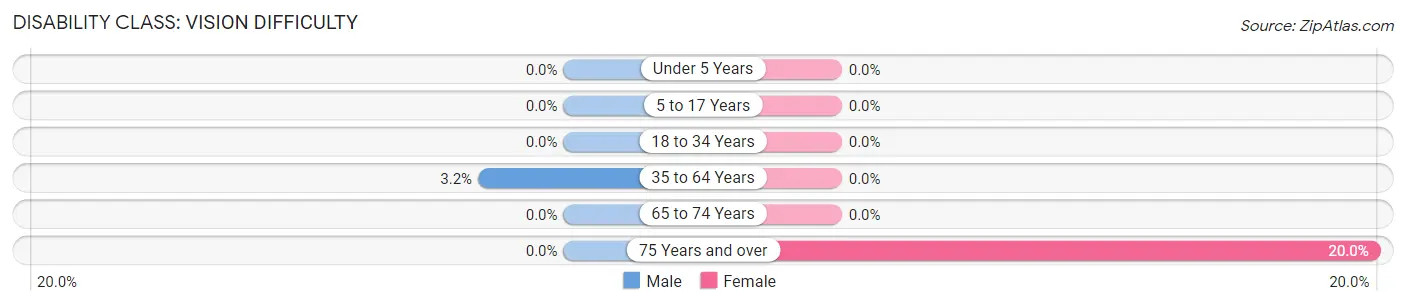
| Age Bracket | Male | Female |
| Under 5 Years | 0 (0.0%) | 0 (0.0%) |
| 5 to 17 Years | 0 (0.0%) | 0 (0.0%) |
| 18 to 34 Years | 0 (0.0%) | 0 (0.0%) |
| 35 to 64 Years | 2 (3.2%) | 0 (0.0%) |
| 65 to 74 Years | 0 (0.0%) | 0 (0.0%) |
| 75 Years and over | 0 (0.0%) | 1 (20.0%) |
Disability Class: Cognitive Difficulty
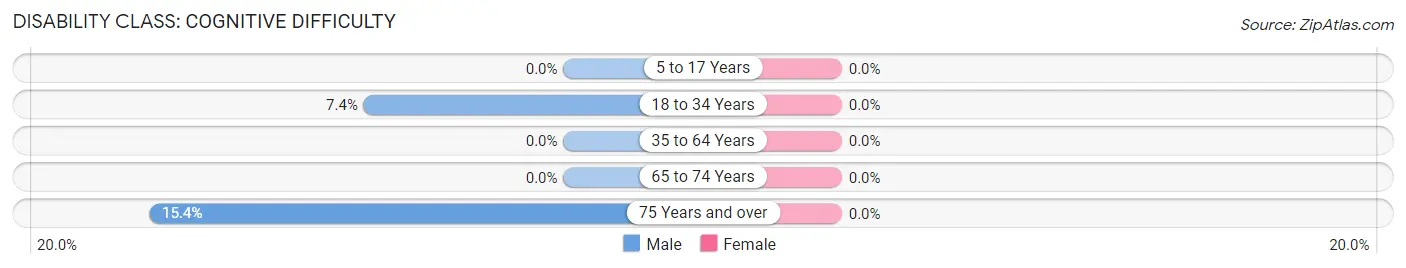
| Age Bracket | Male | Female |
| 5 to 17 Years | 0 (0.0%) | 0 (0.0%) |
| 18 to 34 Years | 2 (7.4%) | 0 (0.0%) |
| 35 to 64 Years | 0 (0.0%) | 0 (0.0%) |
| 65 to 74 Years | 0 (0.0%) | 0 (0.0%) |
| 75 Years and over | 2 (15.4%) | 0 (0.0%) |
Disability Class: Ambulatory Difficulty
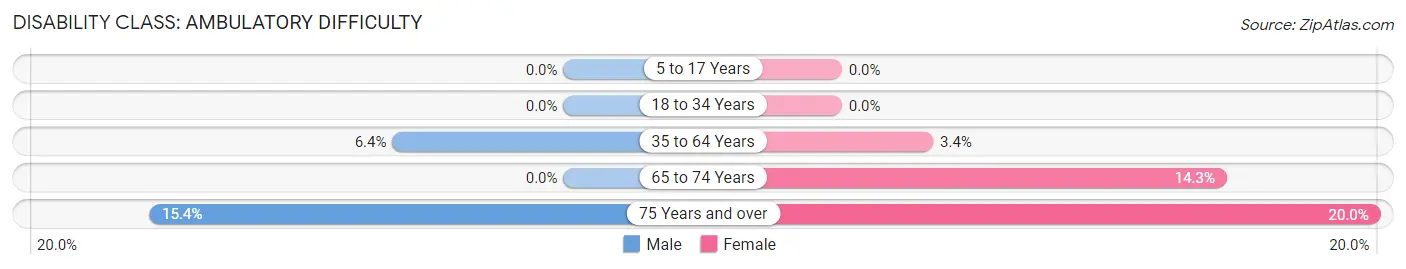
| Age Bracket | Male | Female |
| 5 to 17 Years | 0 (0.0%) | 0 (0.0%) |
| 18 to 34 Years | 0 (0.0%) | 0 (0.0%) |
| 35 to 64 Years | 4 (6.4%) | 2 (3.4%) |
| 65 to 74 Years | 0 (0.0%) | 2 (14.3%) |
| 75 Years and over | 2 (15.4%) | 1 (20.0%) |
Disability Class: Self-Care Difficulty
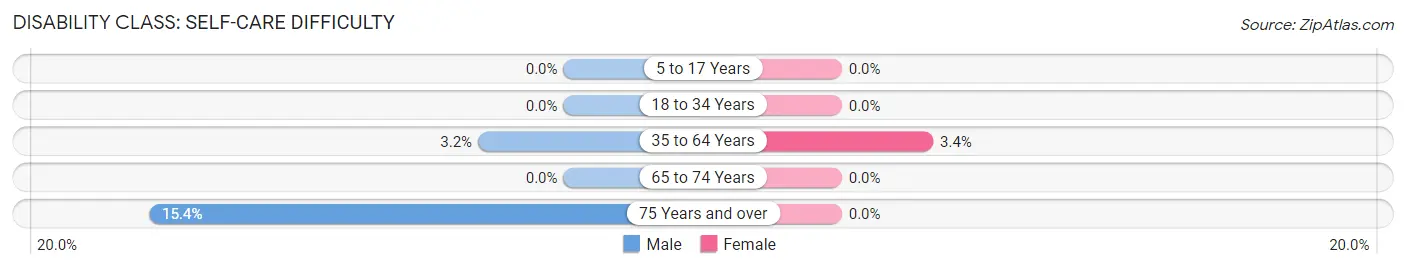
| Age Bracket | Male | Female |
| 5 to 17 Years | 0 (0.0%) | 0 (0.0%) |
| 18 to 34 Years | 0 (0.0%) | 0 (0.0%) |
| 35 to 64 Years | 2 (3.2%) | 2 (3.4%) |
| 65 to 74 Years | 0 (0.0%) | 0 (0.0%) |
| 75 Years and over | 2 (15.4%) | 0 (0.0%) |
Technology Access in White City
Computing Device Access in White City
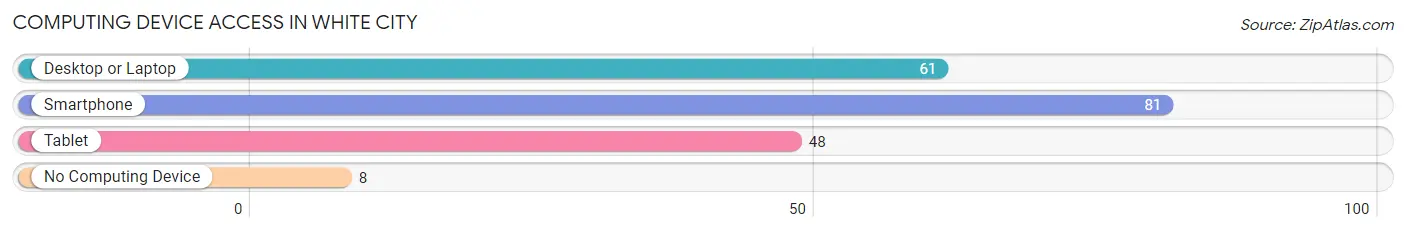
| Device Type | # Households | % Households |
| Desktop or Laptop | 61 | 59.8% |
| Smartphone | 81 | 79.4% |
| Tablet | 48 | 47.1% |
| No Computing Device | 8 | 7.8% |
| Total | 102 | 100.0% |
Internet Access in White City
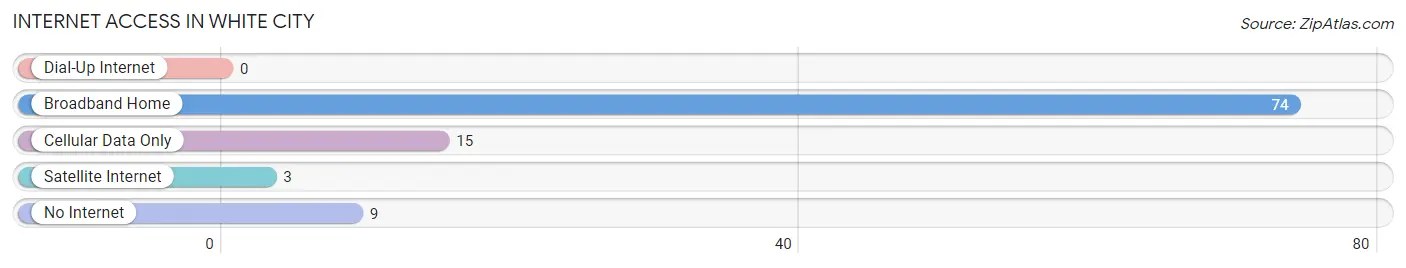
| Internet Type | # Households | % Households |
| Dial-Up Internet | 0 | 0.0% |
| Broadband Home | 74 | 72.6% |
| Cellular Data Only | 15 | 14.7% |
| Satellite Internet | 3 | 2.9% |
| No Internet | 9 | 8.8% |
| Total | 102 | 100.0% |
White City Summary
White City is a small unincorporated community located in the southern part of Macoupin County, Illinois. It is situated about 10 miles south of Carlinville, the county seat. The population of White City was estimated to be around 200 people in 2020.
History
White City was founded in 1871 by a group of settlers from the nearby town of Carlinville. The settlers were looking for a place to build a new community and chose the area due to its proximity to the railroad. The town was named after the white limestone that was found in the area.
The first post office was established in 1872 and the first school was built in 1873. The town grew slowly but steadily over the years and by the early 1900s, it had a population of around 500 people.
The town was home to several businesses, including a general store, a blacksmith shop, a hotel, and a saloon. The town also had a train station, which was used to transport goods and passengers to and from the nearby towns of Carlinville and Staunton.
In the early 1900s, the town was home to a large number of German immigrants. These immigrants brought with them their culture and traditions, which can still be seen in the town today.
Geography
White City is located in the southern part of Macoupin County, Illinois. It is situated about 10 miles south of Carlinville, the county seat. The town is located on the banks of the Macoupin Creek, which flows through the area.
The town is surrounded by rolling hills and farmland. The area is known for its fertile soil and is home to a variety of crops, including corn, soybeans, and wheat.
Economy
The economy of White City is largely based on agriculture. The town is home to several farms, which produce a variety of crops, including corn, soybeans, and wheat.
The town is also home to several small businesses, including a general store, a blacksmith shop, and a saloon. The town also has a train station, which is used to transport goods and passengers to and from the nearby towns of Carlinville and Staunton.
Demographics
The population of White City was estimated to be around 200 people in 2020. The town is predominantly white, with a small minority population. The median household income in the town is around $45,000.
Conclusion
White City is a small unincorporated community located in the southern part of Macoupin County, Illinois. It was founded in 1871 by a group of settlers from the nearby town of Carlinville and has a population of around 200 people. The town is predominantly white, with a small minority population. The economy of White City is largely based on agriculture, with several farms producing a variety of crops. The town also has several small businesses, including a general store, a blacksmith shop, and a saloon.
Common Questions
What is Per Capita Income in White City?
Per Capita income in White City is $43,692.
What is the Median Family Income in White City?
Median Family Income in White City is $84,063.
What is the Median Household income in White City?
Median Household Income in White City is $66,944.
What is Income or Wage Gap in White City?
Income or Wage Gap in White City is 40.8%.
Women in White City earn 59.2 cents for every dollar earned by a man.
What is Inequality or Gini Index in White City?
Inequality or Gini Index in White City is 0.42.
What is the Total Population of White City?
Total Population of White City is 226.
What is the Total Male Population of White City?
Total Male Population of White City is 120.
What is the Total Female Population of White City?
Total Female Population of White City is 106.
What is the Ratio of Males per 100 Females in White City?
There are 113.21 Males per 100 Females in White City.
What is the Ratio of Females per 100 Males in White City?
There are 88.33 Females per 100 Males in White City.
What is the Median Population Age in White City?
Median Population Age in White City is 49.0 Years.
What is the Average Family Size in White City
Average Family Size in White City is 2.7 People.
What is the Average Household Size in White City
Average Household Size in White City is 2.2 People.
How Large is the Labor Force in White City?
There are 136 People in the Labor Forcein in White City.
What is the Percentage of People in the Labor Force in White City?
65.4% of People are in the Labor Force in White City.
What is the Unemployment Rate in White City?
Unemployment Rate in White City is 3.7%.