Naples, IL Map & Demographics
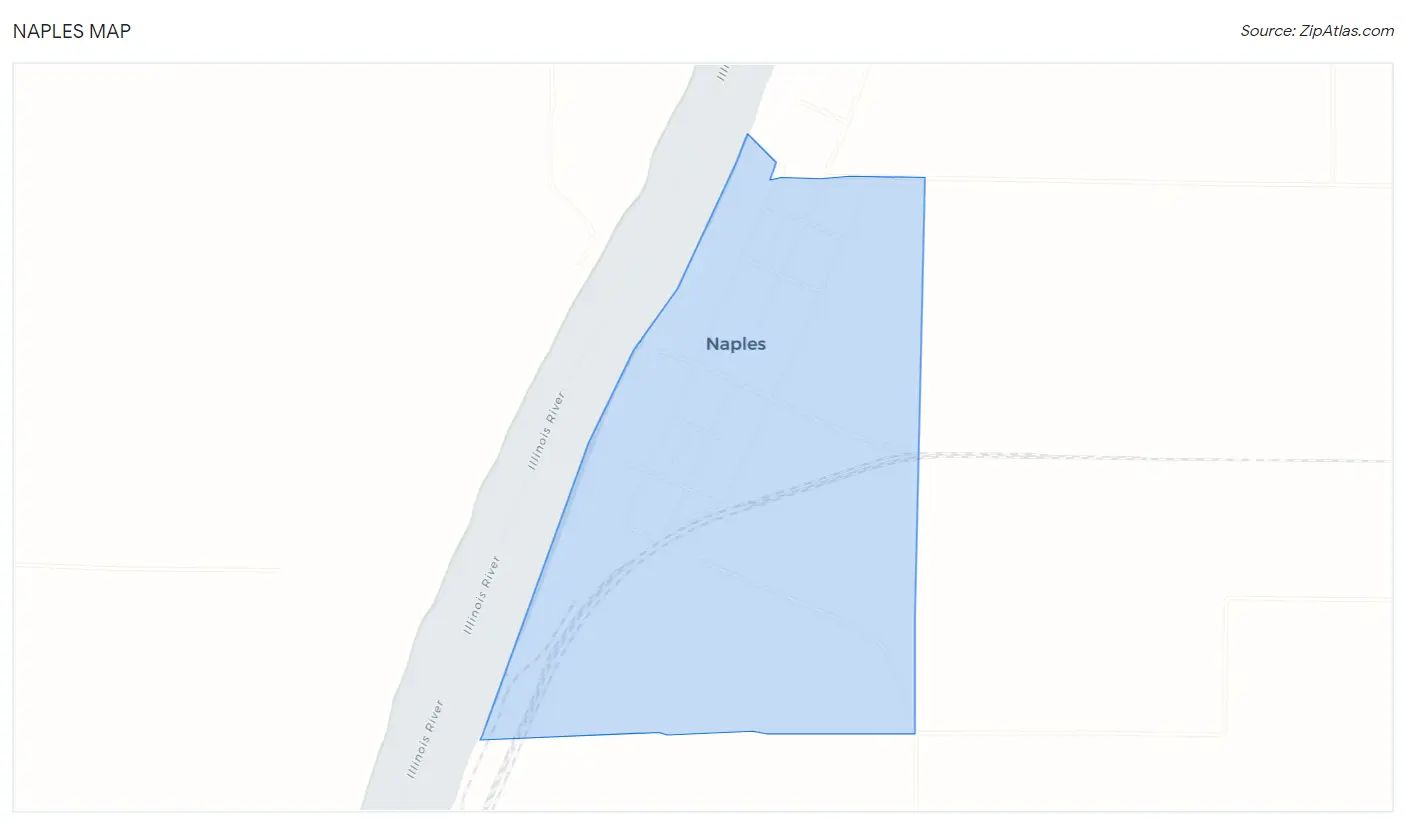
Naples Map
Naples Overview
$36,379
PER CAPITA INCOME
18.0%
WAGE / INCOME GAP [ % ]
82.0¢/ $1
WAGE / INCOME GAP [ $ ]
0.38
INEQUALITY / GINI INDEX
145
TOTAL POPULATION
66
MALE POPULATION
79
FEMALE POPULATION
83.54
MALES / 100 FEMALES
119.70
FEMALES / 100 MALES
47.9
MEDIAN AGE
2.2
AVG FAMILY SIZE
2.1
AVG HOUSEHOLD SIZE
57
LABOR FORCE [ PEOPLE ]
43.2%
PERCENT IN LABOR FORCE
8.8%
UNEMPLOYMENT RATE
Naples Area Codes
Income in Naples
Income Overview in Naples
| Characteristic | Number | Measure |
| Per Capita Income | 145 | $36,379 |
| Median Family Income | 53 | $0 |
| Mean Family Income | 53 | $111,721 |
| Median Household Income | 69 | $0 |
| Mean Household Income | 69 | $92,274 |
| Income Deficit | 53 | $0 |
| Wage / Income Gap (%) | 145 | 18.04% |
| Wage / Income Gap ($) | 145 | 81.96¢ per $1 |
| Gini / Inequality Index | 145 | 0.38 |
Earnings by Sex in Naples
Average Earnings in Naples are $68,661, $64,063 for men and $78,167 for women, a difference of 18.0%.
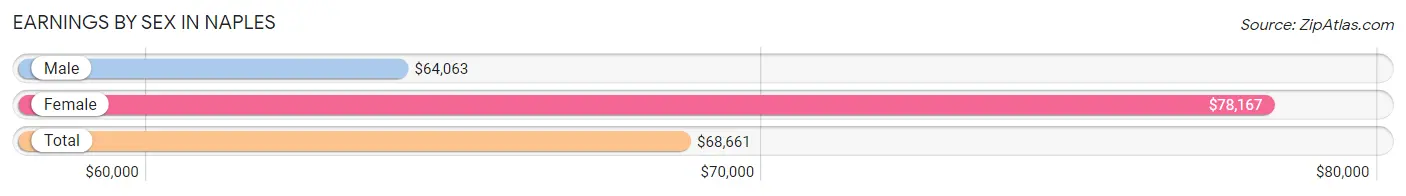
| Sex | Number | Average Earnings |
| Male | 33 (42.9%) | $64,063 |
| Female | 44 (57.1%) | $78,167 |
| Total | 77 (100.0%) | $68,661 |
Earnings by Sex by Income Bracket in Naples
The most common earnings brackets in Naples are $65,000 to $74,999 for men (14 | 42.4%) and $75,000 to $99,999 for women (30 | 68.2%).
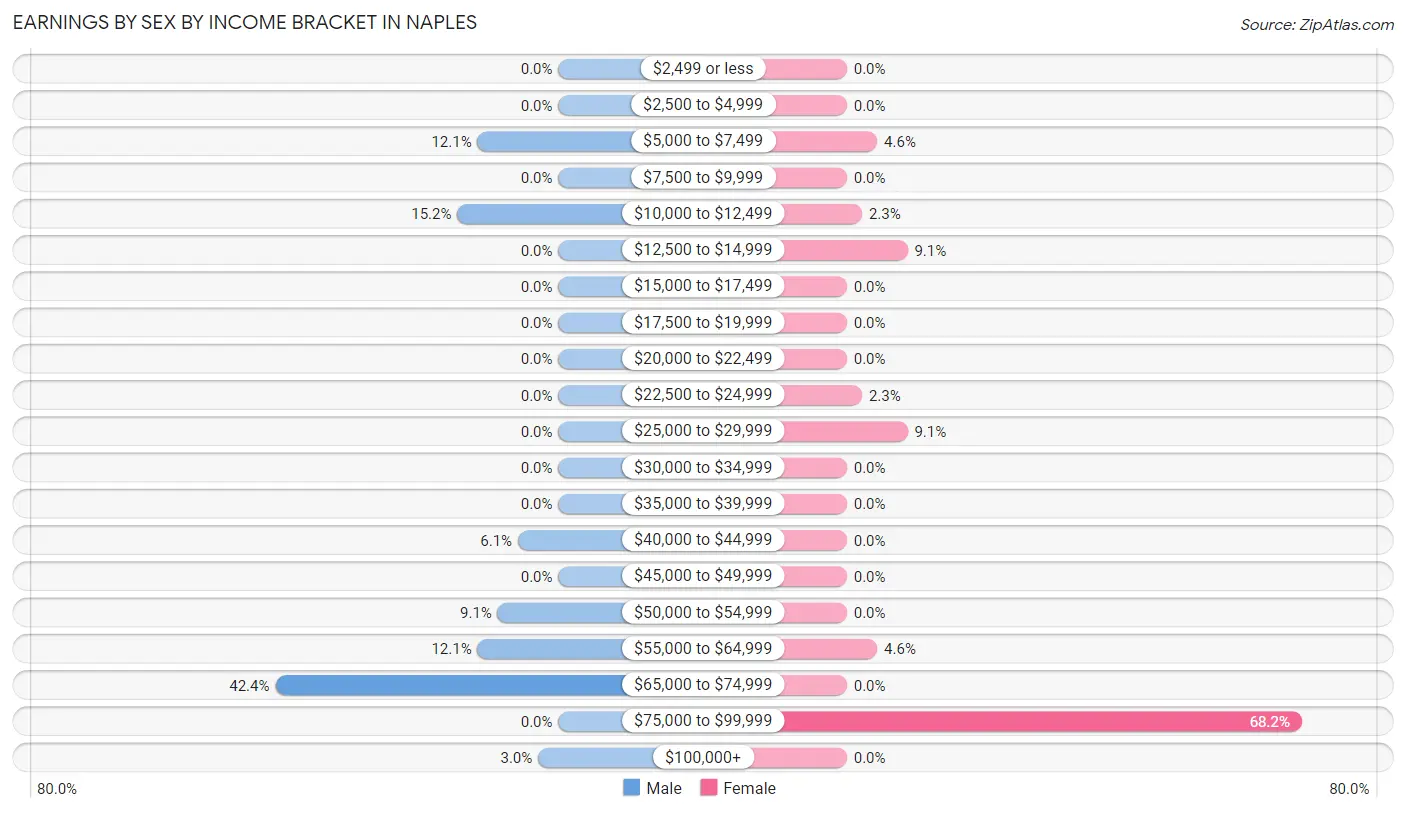
| Income | Male | Female |
| $2,499 or less | 0 (0.0%) | 0 (0.0%) |
| $2,500 to $4,999 | 0 (0.0%) | 0 (0.0%) |
| $5,000 to $7,499 | 4 (12.1%) | 2 (4.5%) |
| $7,500 to $9,999 | 0 (0.0%) | 0 (0.0%) |
| $10,000 to $12,499 | 5 (15.1%) | 1 (2.3%) |
| $12,500 to $14,999 | 0 (0.0%) | 4 (9.1%) |
| $15,000 to $17,499 | 0 (0.0%) | 0 (0.0%) |
| $17,500 to $19,999 | 0 (0.0%) | 0 (0.0%) |
| $20,000 to $22,499 | 0 (0.0%) | 0 (0.0%) |
| $22,500 to $24,999 | 0 (0.0%) | 1 (2.3%) |
| $25,000 to $29,999 | 0 (0.0%) | 4 (9.1%) |
| $30,000 to $34,999 | 0 (0.0%) | 0 (0.0%) |
| $35,000 to $39,999 | 0 (0.0%) | 0 (0.0%) |
| $40,000 to $44,999 | 2 (6.1%) | 0 (0.0%) |
| $45,000 to $49,999 | 0 (0.0%) | 0 (0.0%) |
| $50,000 to $54,999 | 3 (9.1%) | 0 (0.0%) |
| $55,000 to $64,999 | 4 (12.1%) | 2 (4.5%) |
| $65,000 to $74,999 | 14 (42.4%) | 0 (0.0%) |
| $75,000 to $99,999 | 0 (0.0%) | 30 (68.2%) |
| $100,000+ | 1 (3.0%) | 0 (0.0%) |
| Total | 33 (100.0%) | 44 (100.0%) |
Earnings by Sex by Educational Attainment in Naples
Average earnings in Naples are $64,375 for men and $78,250 for women, a difference of 17.7%. Men with an educational attainment of high school diploma enjoy the highest average annual earnings of $67,768, while those with high school diploma education earn the least with $67,768. Women with an educational attainment of high school diploma earn the most with the average annual earnings of $25,833, while those with high school diploma education have the smallest earnings of $25,833.
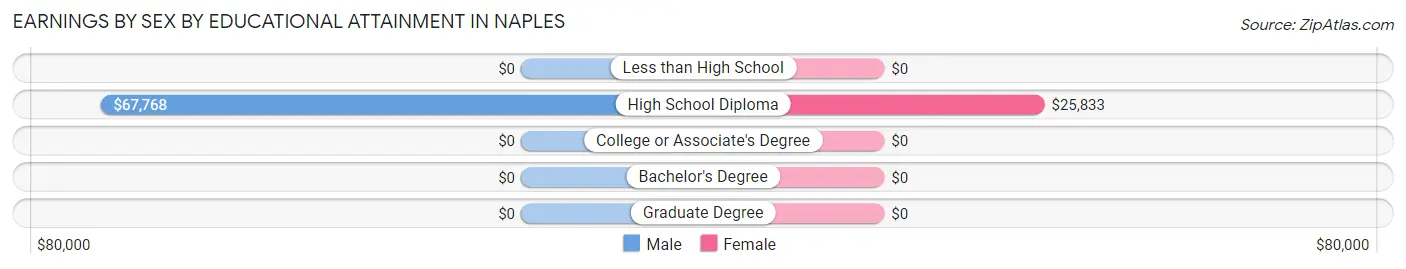
| Educational Attainment | Male Income | Female Income |
| Less than High School | - | - |
| High School Diploma | $67,768 | $25,833 |
| College or Associate's Degree | - | - |
| Bachelor's Degree | - | - |
| Graduate Degree | - | - |
| Total | $64,375 | $78,250 |
Family Income in Naples
Family Income Brackets in Naples
According to the Naples family income data, there are 30 families falling into the $150,000 to $199,999 income range, which is the most common income bracket and makes up 56.6% of all families.
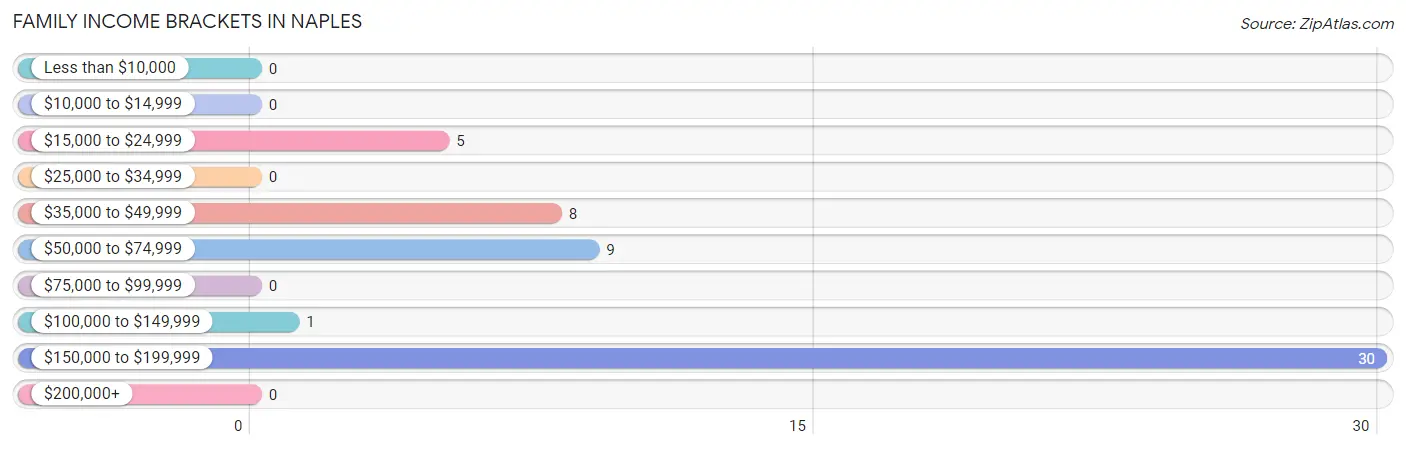
| Income Bracket | # Families | % Families |
| Less than $10,000 | 0 | 0.0% |
| $10,000 to $14,999 | 0 | 0.0% |
| $15,000 to $24,999 | 5 | 9.4% |
| $25,000 to $34,999 | 0 | 0.0% |
| $35,000 to $49,999 | 8 | 15.1% |
| $50,000 to $74,999 | 9 | 17.0% |
| $75,000 to $99,999 | 0 | 0.0% |
| $100,000 to $149,999 | 1 | 1.9% |
| $150,000 to $199,999 | 30 | 56.6% |
| $200,000+ | 0 | 0.0% |
Family Income by Famaliy Size in Naples
2-person families (45 | 84.9%) account for the highest median family income in Naples with $160,625 per family, while 2-person families (45 | 84.9%) have the highest median income of $80,312 per family member.
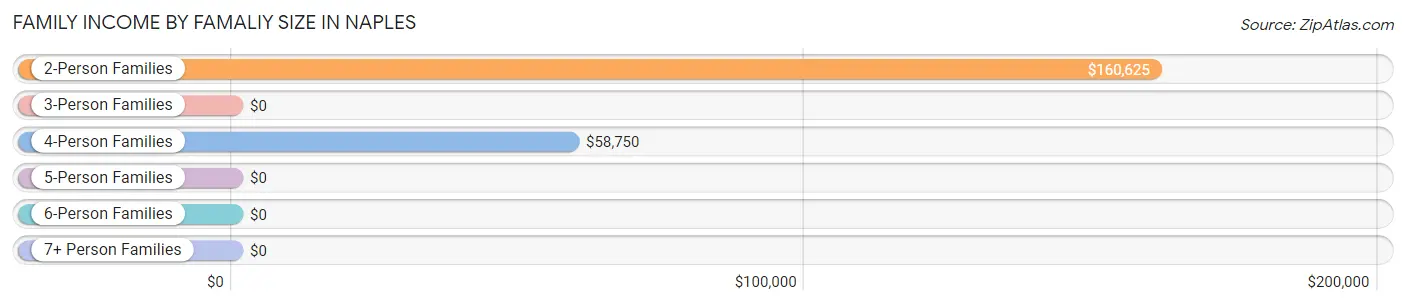
| Income Bracket | # Families | Median Income |
| 2-Person Families | 45 (84.9%) | $160,625 |
| 3-Person Families | 2 (3.8%) | $0 |
| 4-Person Families | 3 (5.7%) | $58,750 |
| 5-Person Families | 3 (5.7%) | $0 |
| 6-Person Families | 0 (0.0%) | $0 |
| 7+ Person Families | 0 (0.0%) | $0 |
| Total | 53 (100.0%) | $0 |
Family Income by Number of Earners in Naples
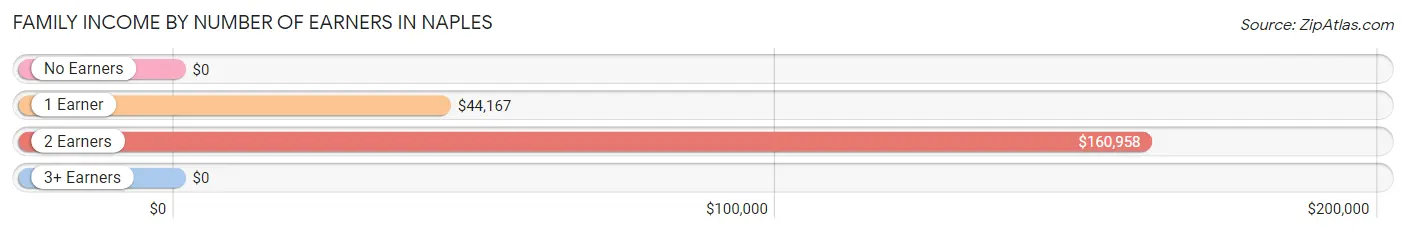
| Number of Earners | # Families | Median Income |
| No Earners | 7 (13.2%) | $0 |
| 1 Earner | 8 (15.1%) | $44,167 |
| 2 Earners | 37 (69.8%) | $160,958 |
| 3+ Earners | 1 (1.9%) | $0 |
| Total | 53 (100.0%) | $0 |
Household Income in Naples
Household Income Brackets in Naples
With 30 households falling in the category, the $150,000 to $199,999 income range is the most frequent in Naples, accounting for 43.5% of all households.
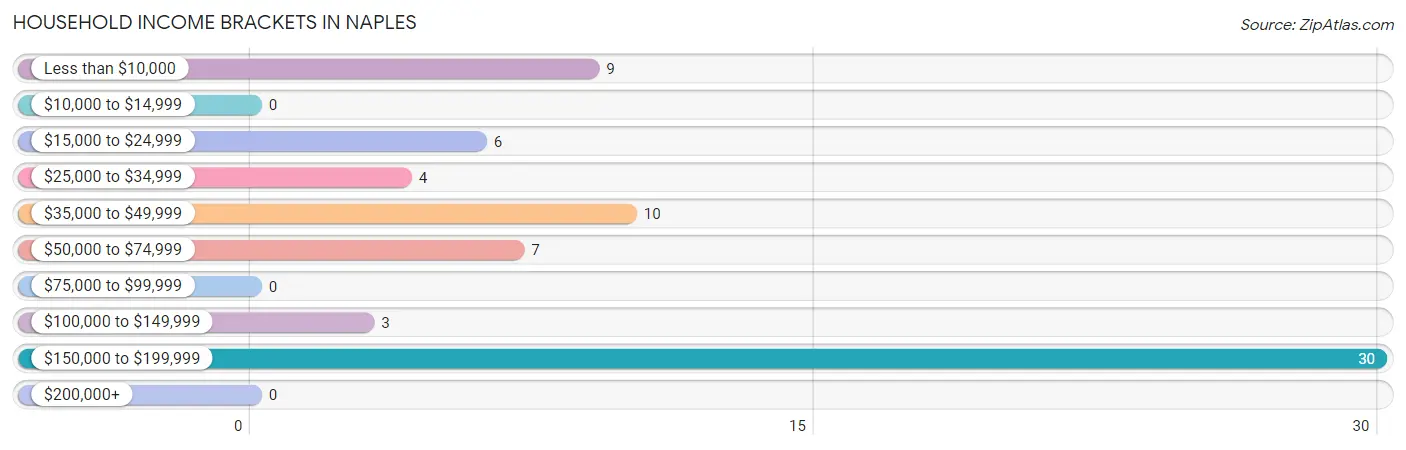
| Income Bracket | # Households | % Households |
| Less than $10,000 | 9 | 13.0% |
| $10,000 to $14,999 | 0 | 0.0% |
| $15,000 to $24,999 | 6 | 8.7% |
| $25,000 to $34,999 | 4 | 5.8% |
| $35,000 to $49,999 | 10 | 14.5% |
| $50,000 to $74,999 | 7 | 10.1% |
| $75,000 to $99,999 | 0 | 0.0% |
| $100,000 to $149,999 | 3 | 4.3% |
| $150,000 to $199,999 | 30 | 43.5% |
| $200,000+ | 0 | 0.0% |
Household Income by Householder Age in Naples
The median household income in Naples is $0, with the highest median household income of $160,667 found in the 45 to 64 years age bracket for the primary householder. A total of 44 households (63.8%) fall into this category.
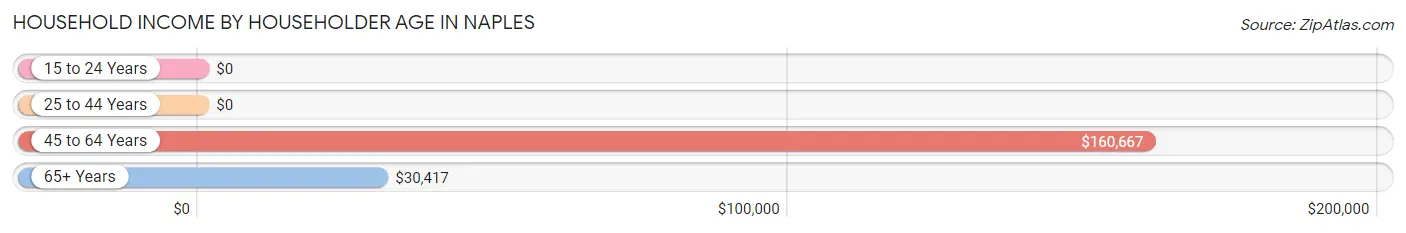
| Income Bracket | # Households | Median Income |
| 15 to 24 Years | 0 (0.0%) | $0 |
| 25 to 44 Years | 6 (8.7%) | $0 |
| 45 to 64 Years | 44 (63.8%) | $160,667 |
| 65+ Years | 19 (27.5%) | $30,417 |
| Total | 69 (100.0%) | $0 |
Poverty in Naples
Income Below Poverty by Sex and Age in Naples
With 13.6% poverty level for males and 8.9% for females among the residents of Naples, 45 to 54 year old males and 25 to 34 year old females are the most vulnerable to poverty, with 2 males (100.0%) and 3 females (42.9%) in their respective age groups living below the poverty level.
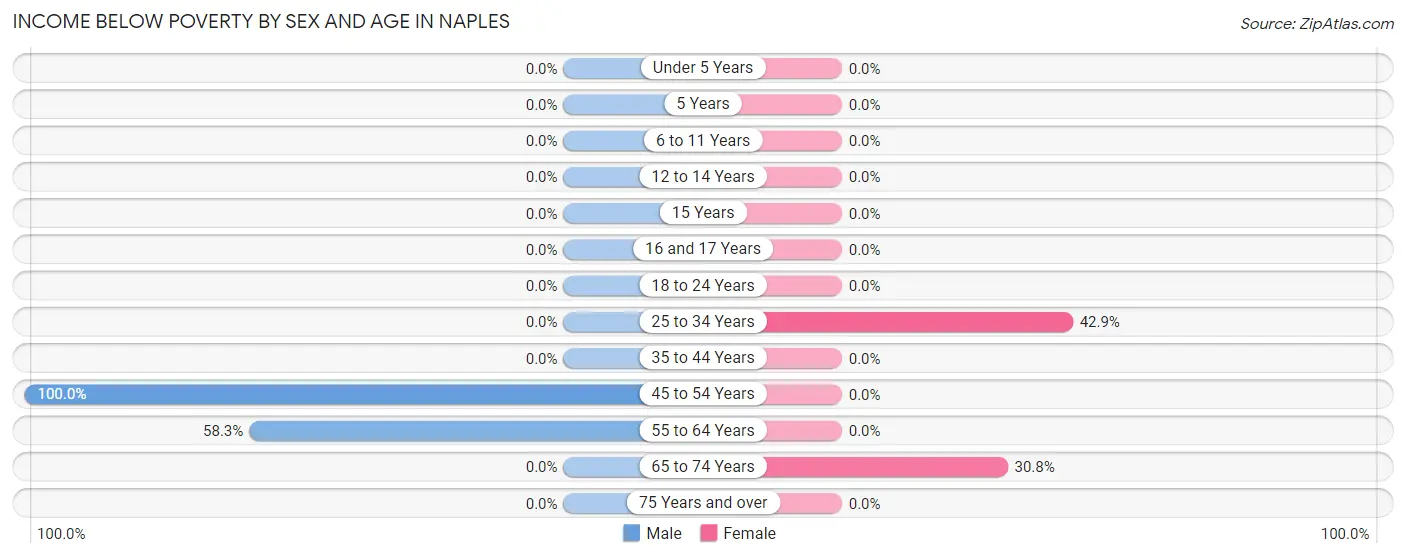
| Age Bracket | Male | Female |
| Under 5 Years | 0 (0.0%) | 0 (0.0%) |
| 5 Years | 0 (0.0%) | 0 (0.0%) |
| 6 to 11 Years | 0 (0.0%) | 0 (0.0%) |
| 12 to 14 Years | 0 (0.0%) | 0 (0.0%) |
| 15 Years | 0 (0.0%) | 0 (0.0%) |
| 16 and 17 Years | 0 (0.0%) | 0 (0.0%) |
| 18 to 24 Years | 0 (0.0%) | 0 (0.0%) |
| 25 to 34 Years | 0 (0.0%) | 3 (42.9%) |
| 35 to 44 Years | 0 (0.0%) | 0 (0.0%) |
| 45 to 54 Years | 2 (100.0%) | 0 (0.0%) |
| 55 to 64 Years | 7 (58.3%) | 0 (0.0%) |
| 65 to 74 Years | 0 (0.0%) | 4 (30.8%) |
| 75 Years and over | 0 (0.0%) | 0 (0.0%) |
| Total | 9 (13.6%) | 7 (8.9%) |
Income Above Poverty by Sex and Age in Naples
According to the poverty statistics in Naples, males aged under 5 years and females aged 5 years are the age groups that are most secure financially, with 100.0% of males and 100.0% of females in these age groups living above the poverty line.
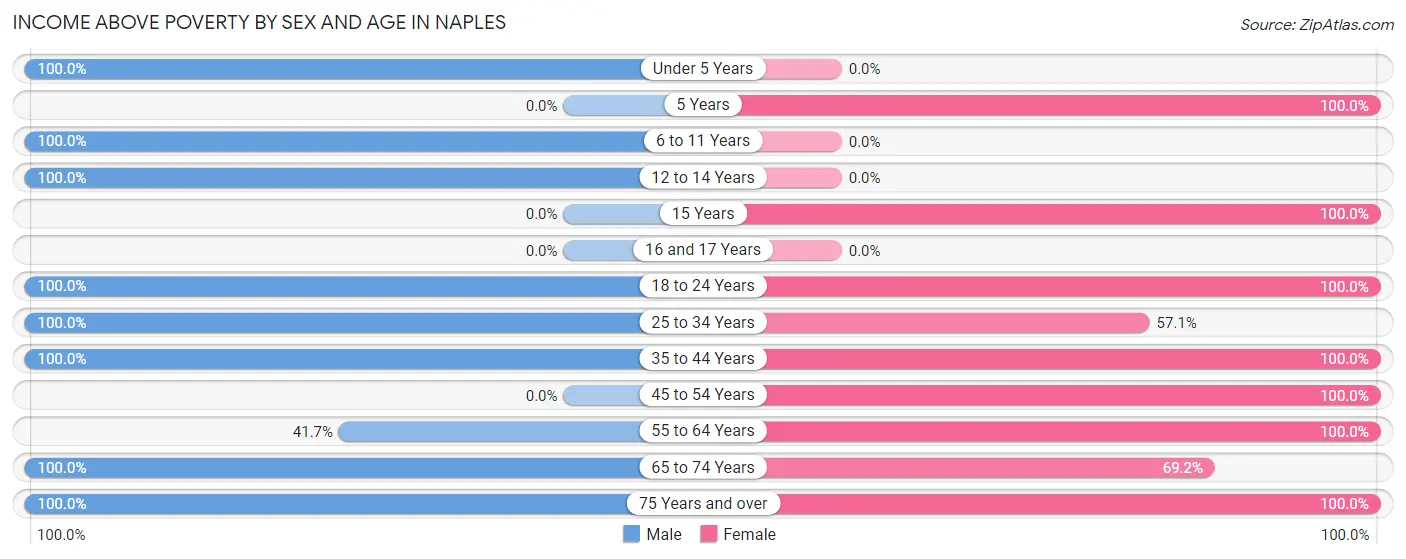
| Age Bracket | Male | Female |
| Under 5 Years | 1 (100.0%) | 0 (0.0%) |
| 5 Years | 0 (0.0%) | 1 (100.0%) |
| 6 to 11 Years | 2 (100.0%) | 0 (0.0%) |
| 12 to 14 Years | 1 (100.0%) | 0 (0.0%) |
| 15 Years | 0 (0.0%) | 8 (100.0%) |
| 16 and 17 Years | 0 (0.0%) | 0 (0.0%) |
| 18 to 24 Years | 6 (100.0%) | 2 (100.0%) |
| 25 to 34 Years | 9 (100.0%) | 4 (57.1%) |
| 35 to 44 Years | 6 (100.0%) | 3 (100.0%) |
| 45 to 54 Years | 0 (0.0%) | 30 (100.0%) |
| 55 to 64 Years | 5 (41.7%) | 8 (100.0%) |
| 65 to 74 Years | 18 (100.0%) | 9 (69.2%) |
| 75 Years and over | 9 (100.0%) | 7 (100.0%) |
| Total | 57 (86.4%) | 72 (91.1%) |
Income Below Poverty Among Married-Couple Families in Naples
| Children | Above Poverty | Below Poverty |
| No Children | 40 (100.0%) | 0 (0.0%) |
| 1 or 2 Children | 4 (100.0%) | 0 (0.0%) |
| 3 or 4 Children | 0 (0.0%) | 0 (0.0%) |
| 5 or more Children | 0 (0.0%) | 0 (0.0%) |
| Total | 44 (100.0%) | 0 (0.0%) |
Income Below Poverty Among Single-Parent Households in Naples
| Children | Single Father | Single Mother |
| No Children | 0 (0.0%) | 0 (0.0%) |
| 1 or 2 Children | 0 (0.0%) | 0 (0.0%) |
| 3 or 4 Children | 0 (0.0%) | 0 (0.0%) |
| 5 or more Children | 0 (0.0%) | 0 (0.0%) |
| Total | 0 (0.0%) | 0 (0.0%) |
Income Below Poverty Among Married-Couple vs Single-Parent Households in Naples
| Children | Married-Couple Families | Single-Parent Households |
| No Children | 0 (0.0%) | 0 (0.0%) |
| 1 or 2 Children | 0 (0.0%) | 0 (0.0%) |
| 3 or 4 Children | 0 (0.0%) | 0 (0.0%) |
| 5 or more Children | 0 (0.0%) | 0 (0.0%) |
| Total | 0 (0.0%) | 0 (0.0%) |
Race in Naples
The most populous races in Naples are White / Caucasian (131 | 90.3%), Two or more Races (14 | 9.7%), and Hispanic or Latino (7 | 4.8%).
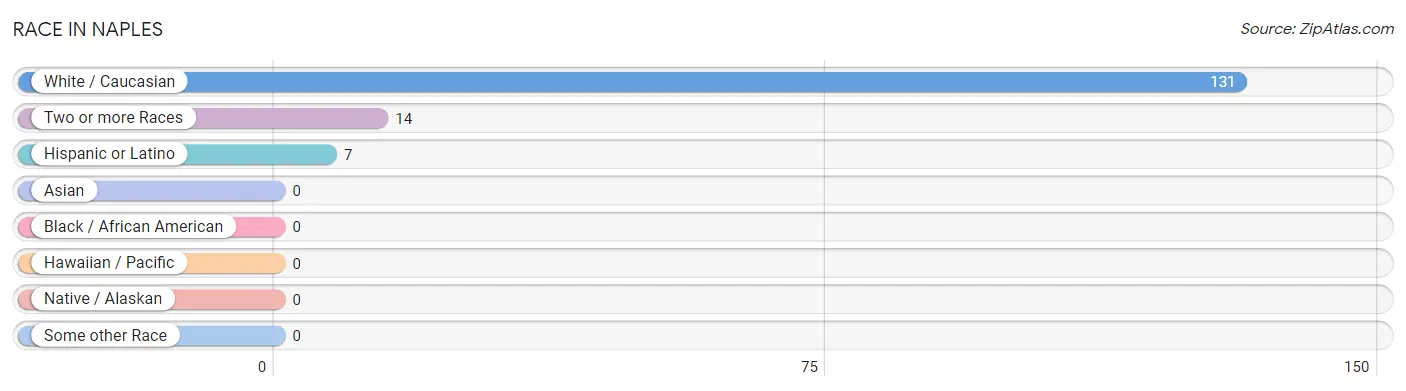
| Race | # Population | % Population |
| Asian | 0 | 0.0% |
| Black / African American | 0 | 0.0% |
| Hawaiian / Pacific | 0 | 0.0% |
| Hispanic or Latino | 7 | 4.8% |
| Native / Alaskan | 0 | 0.0% |
| White / Caucasian | 131 | 90.3% |
| Two or more Races | 14 | 9.7% |
| Some other Race | 0 | 0.0% |
| Total | 145 | 100.0% |
Ancestry in Naples
The most populous ancestries reported in Naples are Lithuanian (30 | 20.7%), Creek (14 | 9.7%), Irish (14 | 9.7%), American (13 | 9.0%), and English (9 | 6.2%), together accounting for 55.2% of all Naples residents.
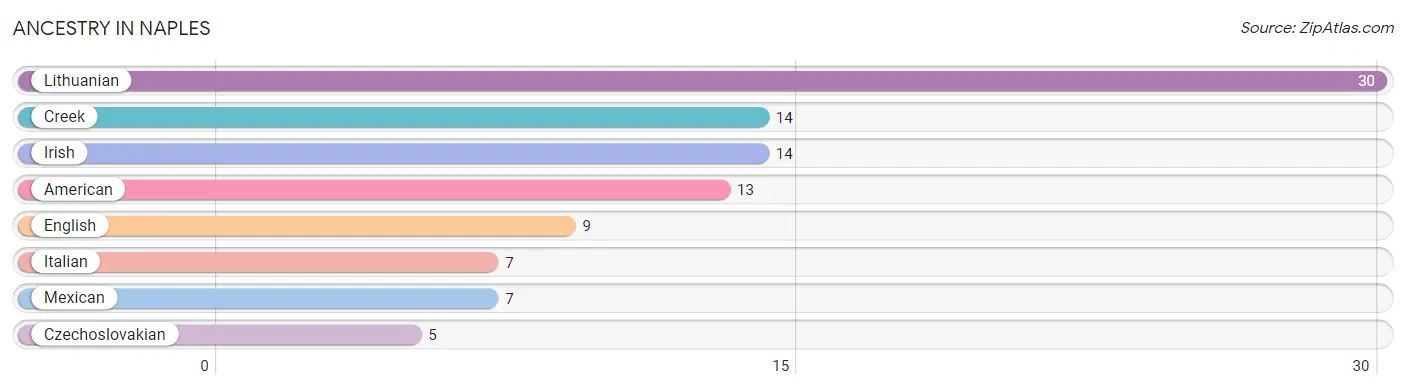
| Ancestry | # Population | % Population |
| American | 13 | 9.0% |
| Creek | 14 | 9.7% |
| Czechoslovakian | 5 | 3.5% |
| English | 9 | 6.2% |
| Irish | 14 | 9.7% |
| Italian | 7 | 4.8% |
| Lithuanian | 30 | 20.7% |
| Mexican | 7 | 4.8% | View All 8 Rows |
Immigrants in Naples
The most numerous immigrant groups reported in Naples came from Europe (5 | 3.5%), Germany (5 | 3.5%), and Western Europe (5 | 3.5%), together accounting for 10.4% of all Naples residents.
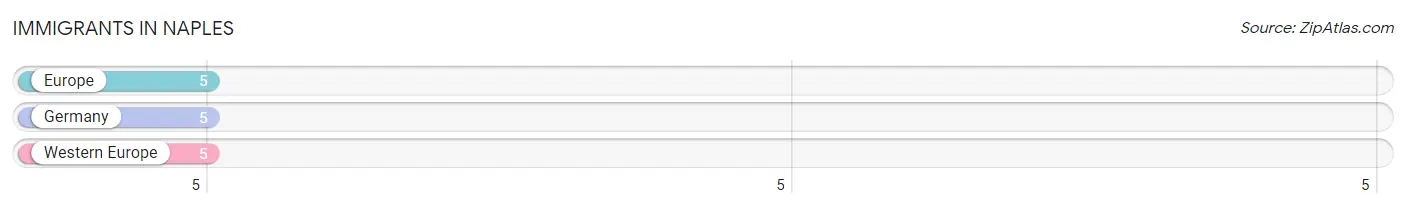
| Immigration Origin | # Population | % Population |
| Europe | 5 | 3.5% |
| Germany | 5 | 3.5% |
| Western Europe | 5 | 3.5% | View All 3 Rows |
Sex and Age in Naples
Sex and Age in Naples
The most populous age groups in Naples are 65 to 69 Years (18 | 27.3%) for men and 45 to 49 Years (30 | 38.0%) for women.
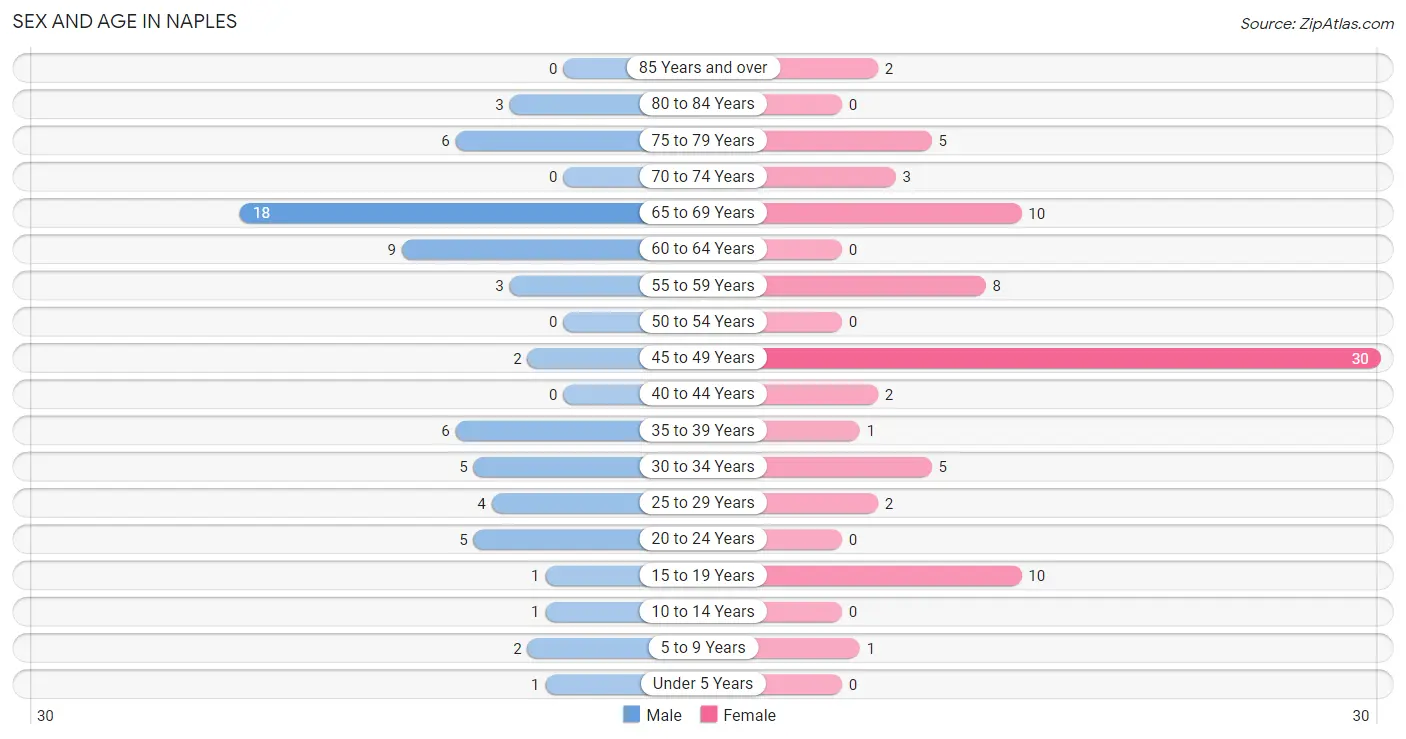
| Age Bracket | Male | Female |
| Under 5 Years | 1 (1.5%) | 0 (0.0%) |
| 5 to 9 Years | 2 (3.0%) | 1 (1.3%) |
| 10 to 14 Years | 1 (1.5%) | 0 (0.0%) |
| 15 to 19 Years | 1 (1.5%) | 10 (12.7%) |
| 20 to 24 Years | 5 (7.6%) | 0 (0.0%) |
| 25 to 29 Years | 4 (6.1%) | 2 (2.5%) |
| 30 to 34 Years | 5 (7.6%) | 5 (6.3%) |
| 35 to 39 Years | 6 (9.1%) | 1 (1.3%) |
| 40 to 44 Years | 0 (0.0%) | 2 (2.5%) |
| 45 to 49 Years | 2 (3.0%) | 30 (38.0%) |
| 50 to 54 Years | 0 (0.0%) | 0 (0.0%) |
| 55 to 59 Years | 3 (4.5%) | 8 (10.1%) |
| 60 to 64 Years | 9 (13.6%) | 0 (0.0%) |
| 65 to 69 Years | 18 (27.3%) | 10 (12.7%) |
| 70 to 74 Years | 0 (0.0%) | 3 (3.8%) |
| 75 to 79 Years | 6 (9.1%) | 5 (6.3%) |
| 80 to 84 Years | 3 (4.5%) | 0 (0.0%) |
| 85 Years and over | 0 (0.0%) | 2 (2.5%) |
| Total | 66 (100.0%) | 79 (100.0%) |
Families and Households in Naples
Median Family Size in Naples
The median family size in Naples is 2.23 persons per family, with single female/mother families (6 | 11.3%) accounting for the largest median family size of 5 persons per family. On the other hand, married-couple families (44 | 83.0%) represent the smallest median family size with 1.82 persons per family.
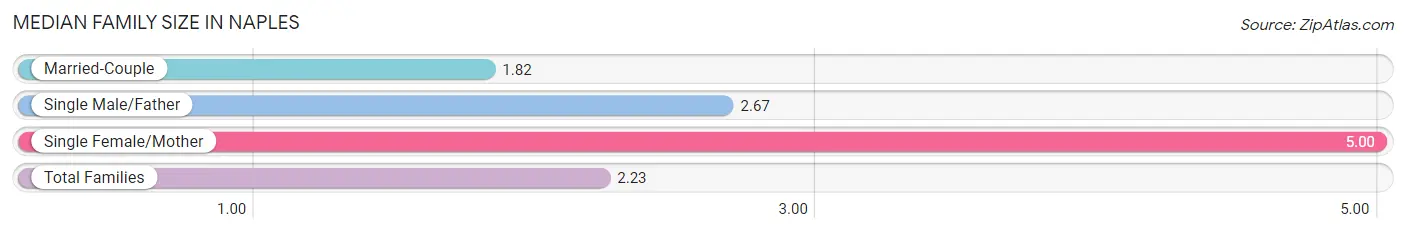
| Family Type | # Families | Family Size |
| Married-Couple | 44 (83.0%) | 1.82 |
| Single Male/Father | 3 (5.7%) | 2.67 |
| Single Female/Mother | 6 (11.3%) | 5.00 |
| Total Families | 53 (100.0%) | 2.23 |
Median Household Size in Naples
The median household size in Naples is 2.10 persons per household, with single female/mother households (6 | 8.7%) accounting for the largest median household size of 5.5 persons per household. non-family households (16 | 23.2%) represent the smallest median household size with 1.25 persons per household.
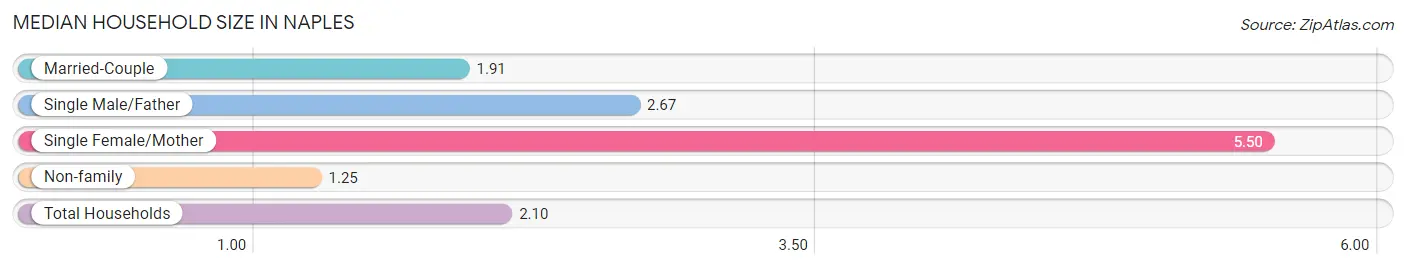
| Household Type | # Households | Household Size |
| Married-Couple | 44 (63.8%) | 1.91 |
| Single Male/Father | 3 (4.3%) | 2.67 |
| Single Female/Mother | 6 (8.7%) | 5.50 |
| Non-family | 16 (23.2%) | 1.25 |
| Total Households | 69 (100.0%) | 2.10 |
Household Size by Marriage Status in Naples
Out of a total of 69 households in Naples, 53 (76.8%) are family households, while 16 (23.2%) are nonfamily households. The most numerous type of family households are 2-person households, comprising 43, and the most common type of nonfamily households are 1-person households, comprising 14.
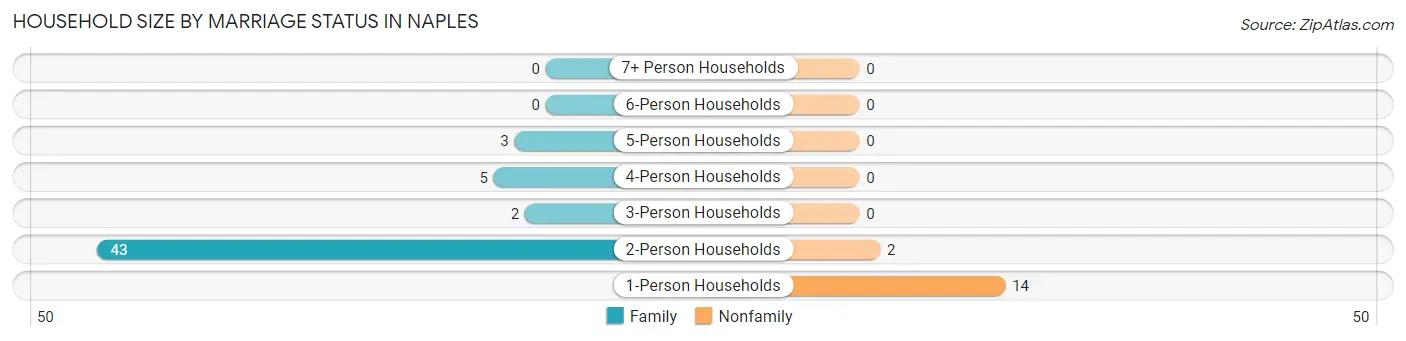
| Household Size | Family Households | Nonfamily Households |
| 1-Person Households | - | 14 (20.3%) |
| 2-Person Households | 43 (62.3%) | 2 (2.9%) |
| 3-Person Households | 2 (2.9%) | 0 (0.0%) |
| 4-Person Households | 5 (7.2%) | 0 (0.0%) |
| 5-Person Households | 3 (4.3%) | 0 (0.0%) |
| 6-Person Households | 0 (0.0%) | 0 (0.0%) |
| 7+ Person Households | 0 (0.0%) | 0 (0.0%) |
| Total | 53 (76.8%) | 16 (23.2%) |
Female Fertility in Naples
Fertility by Age in Naples
| Age Bracket | Women with Births | Births / 1,000 Women |
| 15 to 19 years | 0 (0.0%) | 0.0 |
| 20 to 34 years | 0 (0.0%) | 0.0 |
| 35 to 50 years | 0 (0.0%) | 0.0 |
| Total | 0 (0.0%) | 0.0 |
Fertility by Age by Marriage Status in Naples
| Age Bracket | Married | Unmarried |
| 15 to 19 years | 0 (0.0%) | 0 (0.0%) |
| 20 to 34 years | 0 (0.0%) | 0 (0.0%) |
| 35 to 50 years | 0 (0.0%) | 0 (0.0%) |
| Total | 0 (0.0%) | 0 (0.0%) |
Fertility by Education in Naples
| Educational Attainment | Women with Births | Births / 1,000 Women |
| Less than High School | 0 (0.0%) | 0.0 |
| High School Diploma | 0 (0.0%) | 0.0 |
| College or Associate's Degree | 0 (0.0%) | 0.0 |
| Bachelor's Degree | 0 (0.0%) | 0.0 |
| Graduate Degree | 0 (0.0%) | 0.0 |
| Total | 0 (0.0%) | 0.0 |
Fertility by Education by Marriage Status in Naples
| Educational Attainment | Married | Unmarried |
| Less than High School | 0 (0.0%) | 0 (0.0%) |
| High School Diploma | 0 (0.0%) | 0 (0.0%) |
| College or Associate's Degree | 0 (0.0%) | 0 (0.0%) |
| Bachelor's Degree | 0 (0.0%) | 0 (0.0%) |
| Graduate Degree | 0 (0.0%) | 0 (0.0%) |
| Total | 0 (0.0%) | 0 (0.0%) |
Employment Characteristics in Naples
Employment by Class of Employer in Naples
Among the 52 employed individuals in Naples, private company employees (46 | 88.5%), not-for-profit organizations (4 | 7.7%), and local government employees (2 | 3.8%) make up the most common classes of employment.
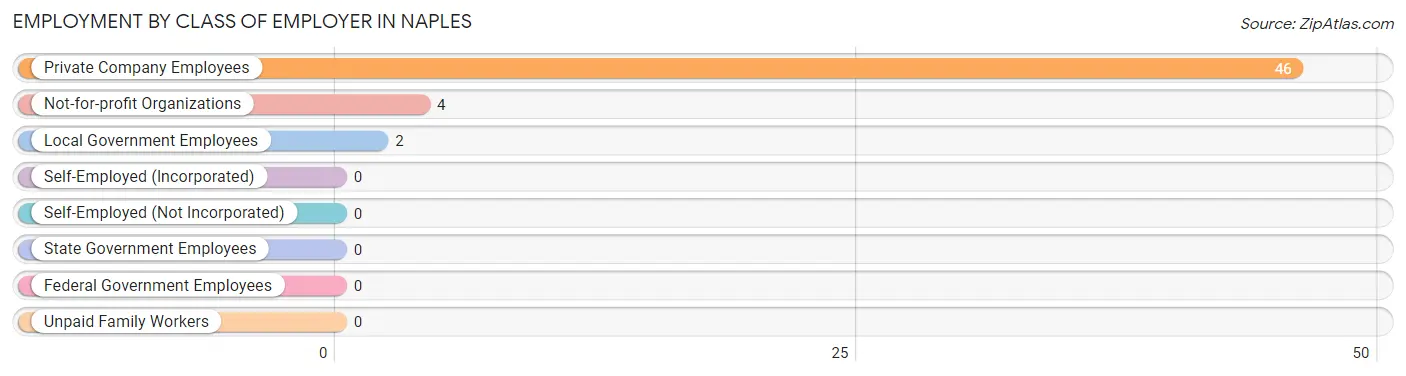
| Employer Class | # Employees | % Employees |
| Private Company Employees | 46 | 88.5% |
| Self-Employed (Incorporated) | 0 | 0.0% |
| Self-Employed (Not Incorporated) | 0 | 0.0% |
| Not-for-profit Organizations | 4 | 7.7% |
| Local Government Employees | 2 | 3.8% |
| State Government Employees | 0 | 0.0% |
| Federal Government Employees | 0 | 0.0% |
| Unpaid Family Workers | 0 | 0.0% |
| Total | 52 | 100.0% |
Employment Status by Age in Naples
According to the labor force statistics for Naples, out of the total population over 16 years of age (132), 43.2% or 57 individuals are in the labor force, with 8.8% or 5 of them unemployed. The age group with the highest labor force participation rate is 16 to 19 years, with 100.0% or 3 individuals in the labor force. Within the labor force, the 16 to 19 years age range has the highest percentage of unemployed individuals, with 66.7% or 2 of them being unemployed.
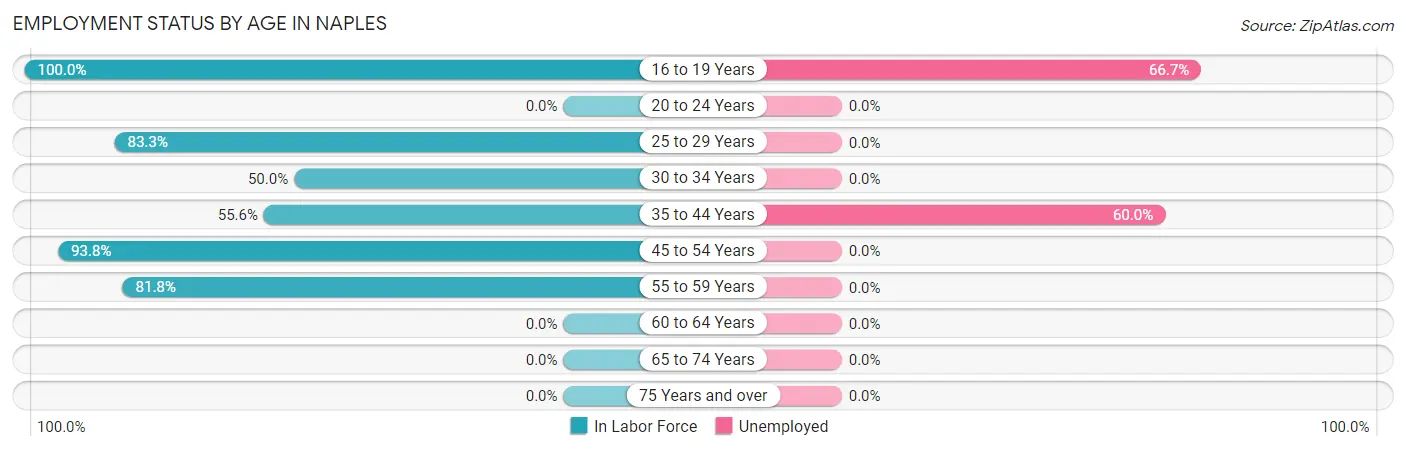
| Age Bracket | In Labor Force | Unemployed |
| 16 to 19 Years | 3 (100.0%) | 2 (66.7%) |
| 20 to 24 Years | 0 (0.0%) | 0 (0.0%) |
| 25 to 29 Years | 5 (83.3%) | 0 (0.0%) |
| 30 to 34 Years | 5 (50.0%) | 0 (0.0%) |
| 35 to 44 Years | 5 (55.6%) | 3 (60.0%) |
| 45 to 54 Years | 30 (93.8%) | 0 (0.0%) |
| 55 to 59 Years | 9 (81.8%) | 0 (0.0%) |
| 60 to 64 Years | 0 (0.0%) | 0 (0.0%) |
| 65 to 74 Years | 0 (0.0%) | 0 (0.0%) |
| 75 Years and over | 0 (0.0%) | 0 (0.0%) |
| Total | 57 (43.2%) | 5 (8.8%) |
Employment Status by Educational Attainment in Naples
According to labor force statistics for Naples, 70.1% of individuals (54) out of the total population between 25 and 64 years of age (77) are in the labor force, with 5.6% or 3 of them being unemployed. The group with the highest labor force participation rate are those with the educational attainment of college / associate degree, with 100.0% or 2 individuals in the labor force. Within the labor force, individuals with less than high school education have the highest percentage of unemployment, with 50.0% or 2 of them being unemployed.
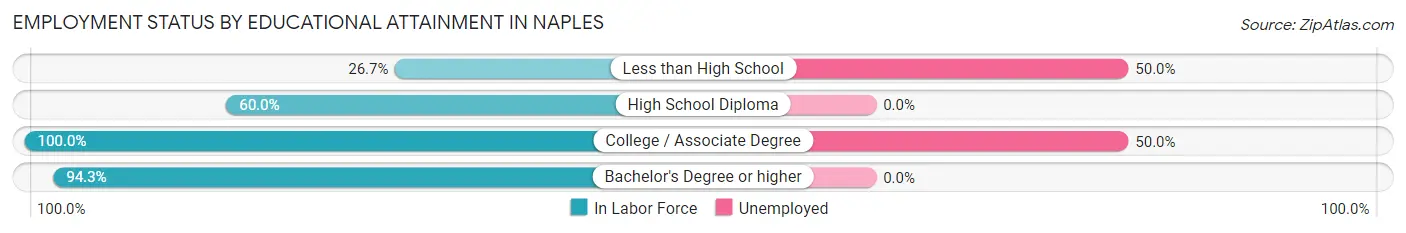
| Educational Attainment | In Labor Force | Unemployed |
| Less than High School | 4 (26.7%) | 8 (50.0%) |
| High School Diploma | 15 (60.0%) | 0 (0.0%) |
| College / Associate Degree | 2 (100.0%) | 1 (50.0%) |
| Bachelor's Degree or higher | 33 (94.3%) | 0 (0.0%) |
| Total | 54 (70.1%) | 4 (5.6%) |
Employment Occupations by Sex in Naples
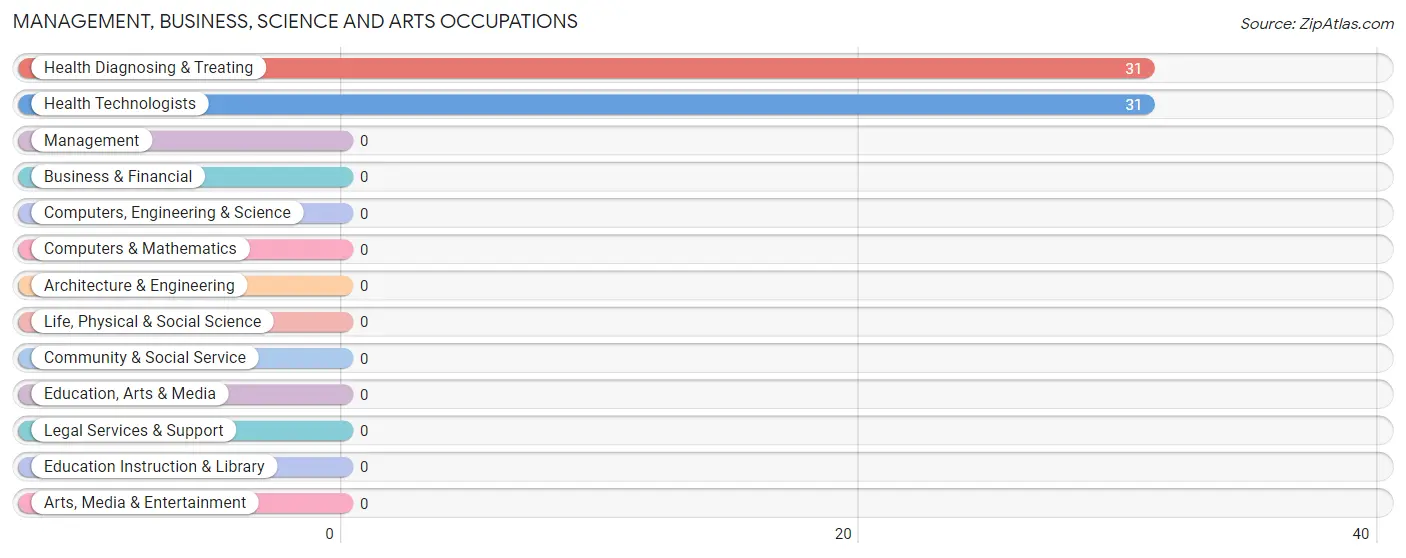
Management, Business, Science and Arts Occupations
The most common Management, Business, Science and Arts occupations in Naples are Health Diagnosing & Treating (31 | 59.6%), and Health Technologists (31 | 59.6%).
Management, Business, Science and Arts Occupations by Sex
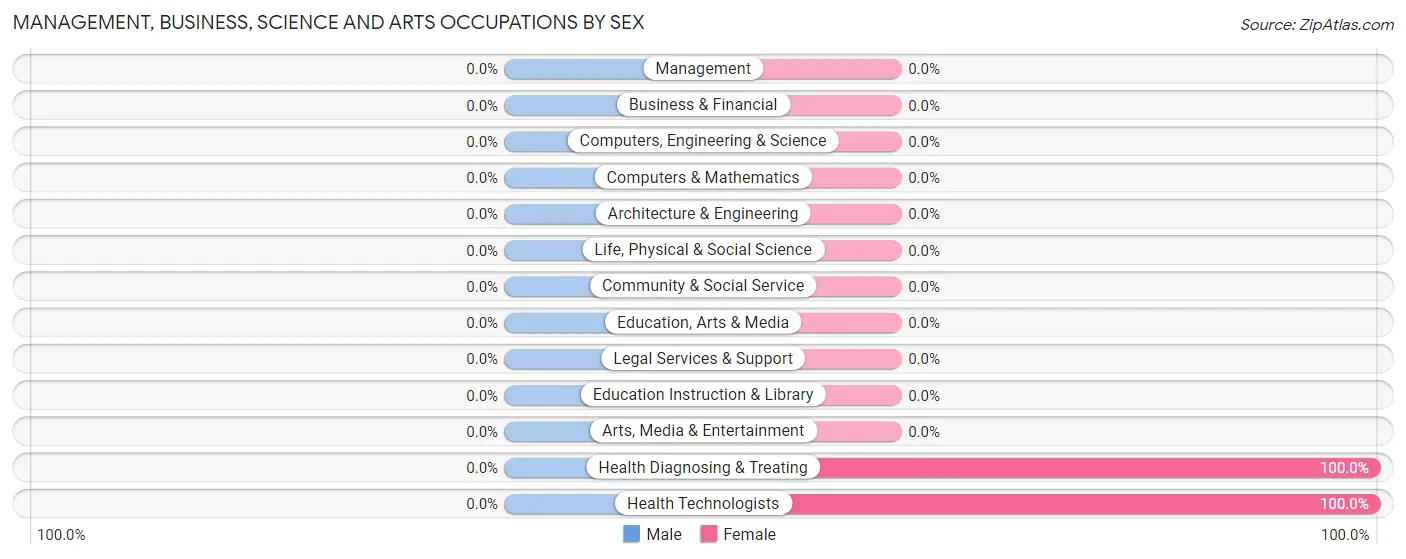
| Occupation | Male | Female |
| Management | 0 (0.0%) | 0 (0.0%) |
| Business & Financial | 0 (0.0%) | 0 (0.0%) |
| Computers, Engineering & Science | 0 (0.0%) | 0 (0.0%) |
| Computers & Mathematics | 0 (0.0%) | 0 (0.0%) |
| Architecture & Engineering | 0 (0.0%) | 0 (0.0%) |
| Life, Physical & Social Science | 0 (0.0%) | 0 (0.0%) |
| Community & Social Service | 0 (0.0%) | 0 (0.0%) |
| Education, Arts & Media | 0 (0.0%) | 0 (0.0%) |
| Legal Services & Support | 0 (0.0%) | 0 (0.0%) |
| Education Instruction & Library | 0 (0.0%) | 0 (0.0%) |
| Arts, Media & Entertainment | 0 (0.0%) | 0 (0.0%) |
| Health Diagnosing & Treating | 0 (0.0%) | 31 (100.0%) |
| Health Technologists | 0 (0.0%) | 31 (100.0%) |
| Total (Category) | 0 (0.0%) | 31 (100.0%) |
| Total (Overall) | 13 (25.0%) | 39 (75.0%) |
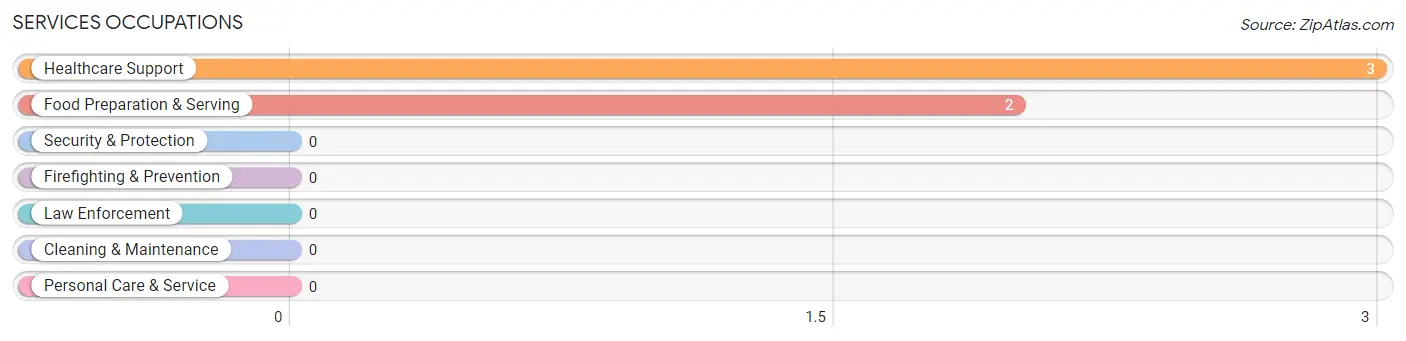
Services Occupations
The most common Services occupations in Naples are Healthcare Support (3 | 5.8%), and Food Preparation & Serving (2 | 3.8%).
Services Occupations by Sex
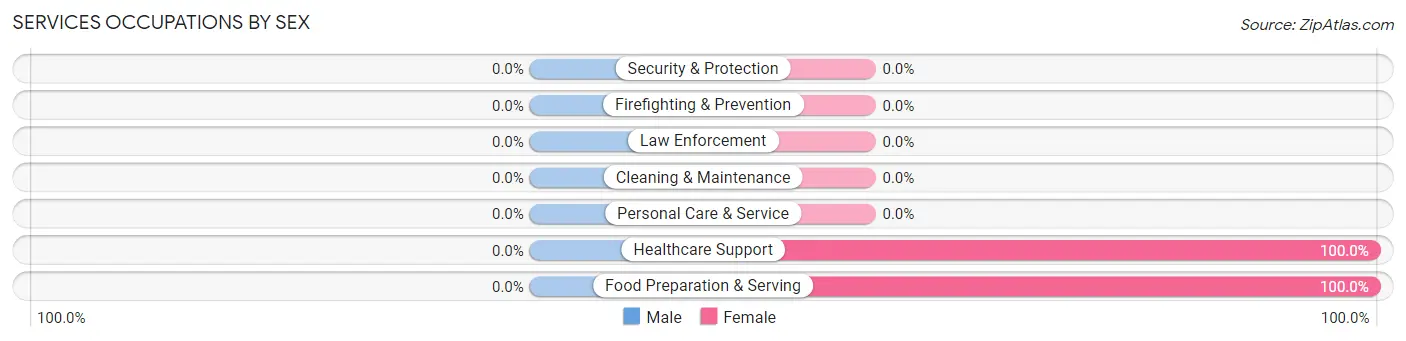
| Occupation | Male | Female |
| Healthcare Support | 0 (0.0%) | 3 (100.0%) |
| Security & Protection | 0 (0.0%) | 0 (0.0%) |
| Firefighting & Prevention | 0 (0.0%) | 0 (0.0%) |
| Law Enforcement | 0 (0.0%) | 0 (0.0%) |
| Food Preparation & Serving | 0 (0.0%) | 2 (100.0%) |
| Cleaning & Maintenance | 0 (0.0%) | 0 (0.0%) |
| Personal Care & Service | 0 (0.0%) | 0 (0.0%) |
| Total (Category) | 0 (0.0%) | 5 (100.0%) |
| Total (Overall) | 13 (25.0%) | 39 (75.0%) |
Sales and Office Occupations
The most common Sales and Office occupations in Naples are , and Sales & Related (8 | 15.4%).
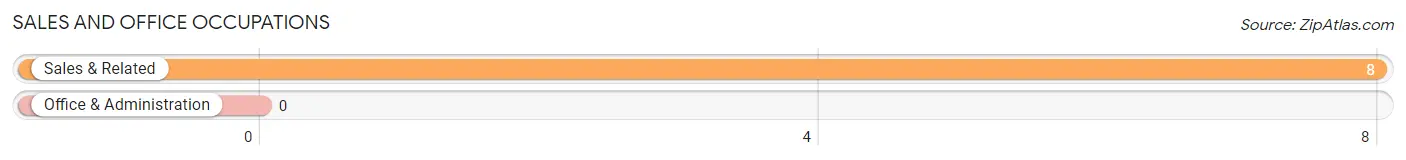
Sales and Office Occupations by Sex

| Occupation | Male | Female |
| Sales & Related | 8 (100.0%) | 0 (0.0%) |
| Office & Administration | 0 (0.0%) | 0 (0.0%) |
| Total (Category) | 8 (100.0%) | 0 (0.0%) |
| Total (Overall) | 13 (25.0%) | 39 (75.0%) |
Natural Resources, Construction and Maintenance Occupations
The most common Natural Resources, Construction and Maintenance occupations in Naples are , and Construction & Extraction (2 | 3.8%).
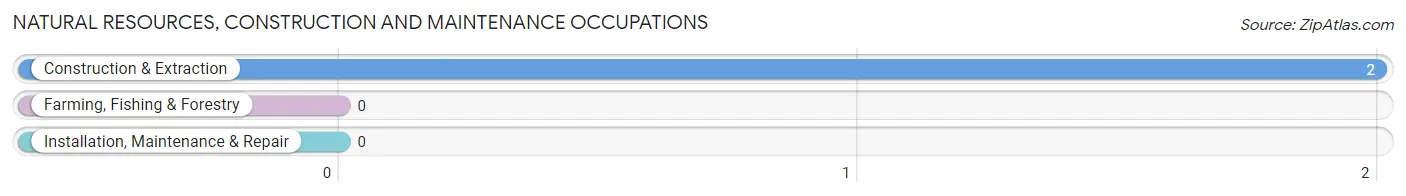
Natural Resources, Construction and Maintenance Occupations by Sex

| Occupation | Male | Female |
| Farming, Fishing & Forestry | 0 (0.0%) | 0 (0.0%) |
| Construction & Extraction | 2 (100.0%) | 0 (0.0%) |
| Installation, Maintenance & Repair | 0 (0.0%) | 0 (0.0%) |
| Total (Category) | 2 (100.0%) | 0 (0.0%) |
| Total (Overall) | 13 (25.0%) | 39 (75.0%) |
Production, Transportation and Moving Occupations
The most common Production, Transportation and Moving occupations in Naples are Production (3 | 5.8%), and Transportation (3 | 5.8%).
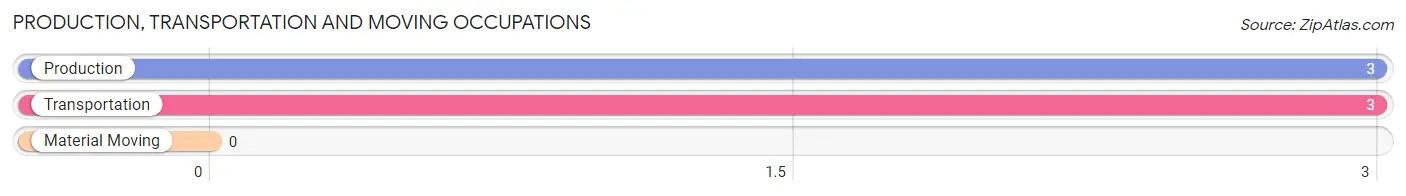
Production, Transportation and Moving Occupations by Sex
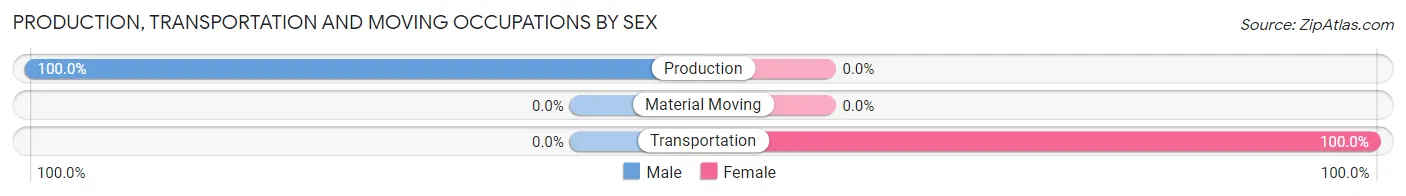
| Occupation | Male | Female |
| Production | 3 (100.0%) | 0 (0.0%) |
| Transportation | 0 (0.0%) | 3 (100.0%) |
| Material Moving | 0 (0.0%) | 0 (0.0%) |
| Total (Category) | 3 (50.0%) | 3 (50.0%) |
| Total (Overall) | 13 (25.0%) | 39 (75.0%) |
Employment Industries by Sex in Naples
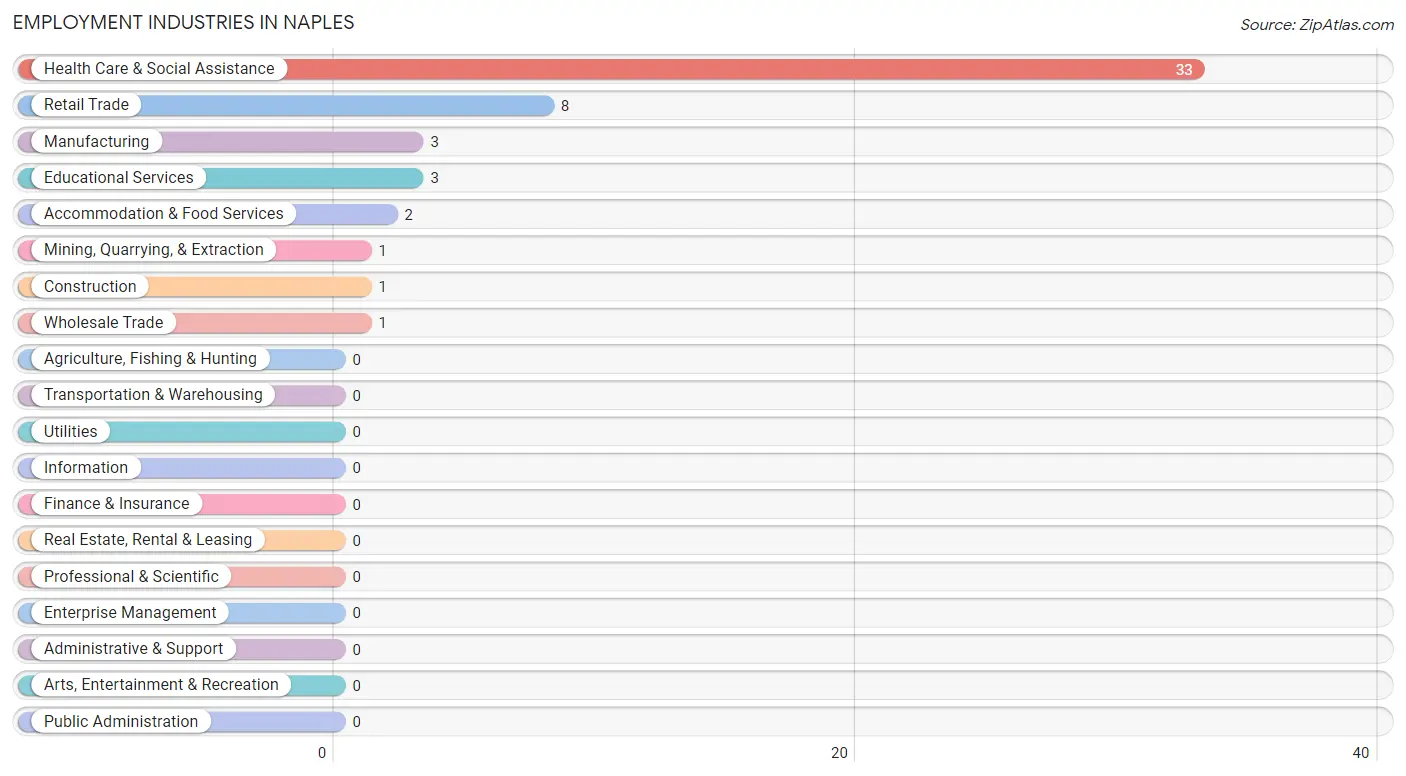
Employment Industries in Naples
The major employment industries in Naples include Health Care & Social Assistance (33 | 63.5%), Retail Trade (8 | 15.4%), Manufacturing (3 | 5.8%), Educational Services (3 | 5.8%), and Accommodation & Food Services (2 | 3.8%).
Employment Industries by Sex in Naples
The Naples industries that see more men than women are Mining, Quarrying, & Extraction (100.0%), Construction (100.0%), and Manufacturing (100.0%), whereas the industries that tend to have a higher number of women are Wholesale Trade (100.0%), Educational Services (100.0%), and Health Care & Social Assistance (100.0%).
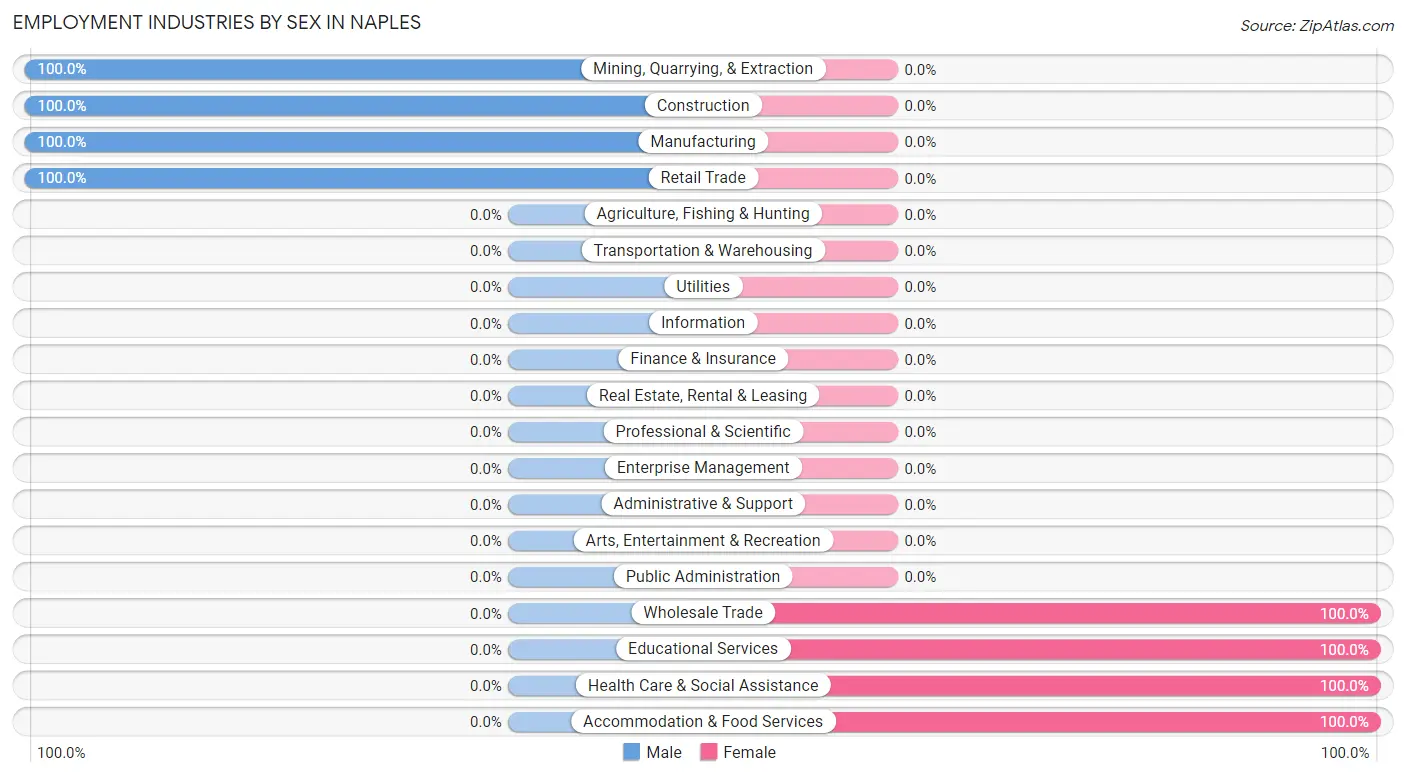
| Industry | Male | Female |
| Agriculture, Fishing & Hunting | 0 (0.0%) | 0 (0.0%) |
| Mining, Quarrying, & Extraction | 1 (100.0%) | 0 (0.0%) |
| Construction | 1 (100.0%) | 0 (0.0%) |
| Manufacturing | 3 (100.0%) | 0 (0.0%) |
| Wholesale Trade | 0 (0.0%) | 1 (100.0%) |
| Retail Trade | 8 (100.0%) | 0 (0.0%) |
| Transportation & Warehousing | 0 (0.0%) | 0 (0.0%) |
| Utilities | 0 (0.0%) | 0 (0.0%) |
| Information | 0 (0.0%) | 0 (0.0%) |
| Finance & Insurance | 0 (0.0%) | 0 (0.0%) |
| Real Estate, Rental & Leasing | 0 (0.0%) | 0 (0.0%) |
| Professional & Scientific | 0 (0.0%) | 0 (0.0%) |
| Enterprise Management | 0 (0.0%) | 0 (0.0%) |
| Administrative & Support | 0 (0.0%) | 0 (0.0%) |
| Educational Services | 0 (0.0%) | 3 (100.0%) |
| Health Care & Social Assistance | 0 (0.0%) | 33 (100.0%) |
| Arts, Entertainment & Recreation | 0 (0.0%) | 0 (0.0%) |
| Accommodation & Food Services | 0 (0.0%) | 2 (100.0%) |
| Public Administration | 0 (0.0%) | 0 (0.0%) |
| Total | 13 (25.0%) | 39 (75.0%) |
Education in Naples
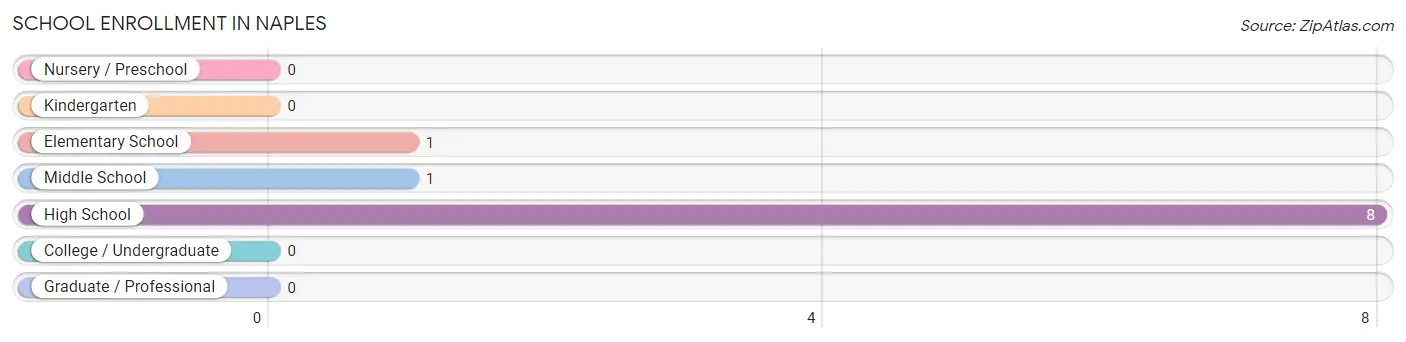
School Enrollment in Naples
The most common levels of schooling among the 10 students in Naples are high school (8 | 80.0%), elementary school (1 | 10.0%), and middle school (1 | 10.0%).
| School Level | # Students | % Students |
| Nursery / Preschool | 0 | 0.0% |
| Kindergarten | 0 | 0.0% |
| Elementary School | 1 | 10.0% |
| Middle School | 1 | 10.0% |
| High School | 8 | 80.0% |
| College / Undergraduate | 0 | 0.0% |
| Graduate / Professional | 0 | 0.0% |
| Total | 10 | 100.0% |
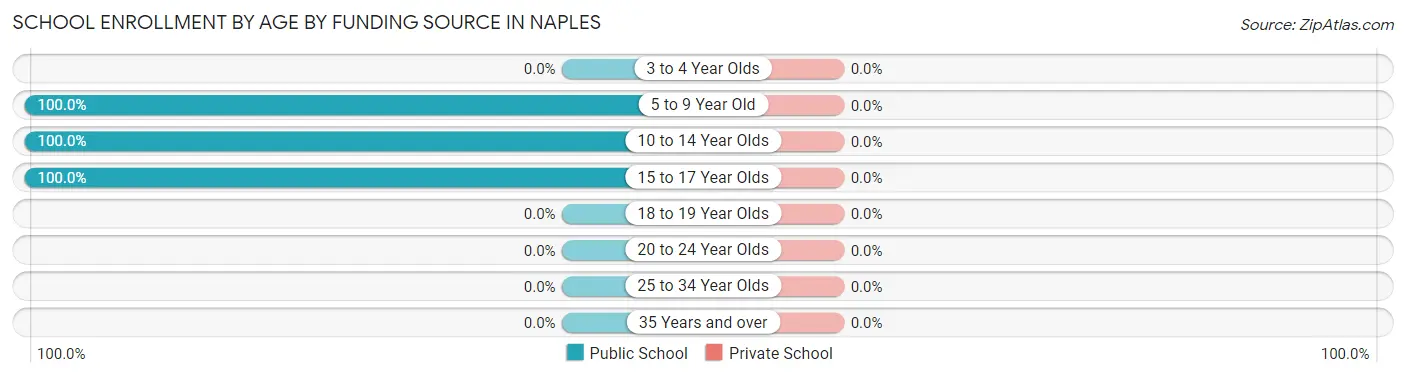
School Enrollment by Age by Funding Source in Naples
| Age Bracket | Public School | Private School |
| 3 to 4 Year Olds | 0 (0.0%) | 0 (0.0%) |
| 5 to 9 Year Old | 1 (100.0%) | 0 (0.0%) |
| 10 to 14 Year Olds | 1 (100.0%) | 0 (0.0%) |
| 15 to 17 Year Olds | 8 (100.0%) | 0 (0.0%) |
| 18 to 19 Year Olds | 0 (0.0%) | 0 (0.0%) |
| 20 to 24 Year Olds | 0 (0.0%) | 0 (0.0%) |
| 25 to 34 Year Olds | 0 (0.0%) | 0 (0.0%) |
| 35 Years and over | 0 (0.0%) | 0 (0.0%) |
| Total | 10 (100.0%) | 0 (0.0%) |
Educational Attainment by Field of Study in Naples
Science & technology (30 | 85.7%), education (3 | 8.6%), and liberal arts & history (2 | 5.7%) are the most common fields of study among 35 individuals in Naples who have obtained a bachelor's degree or higher.
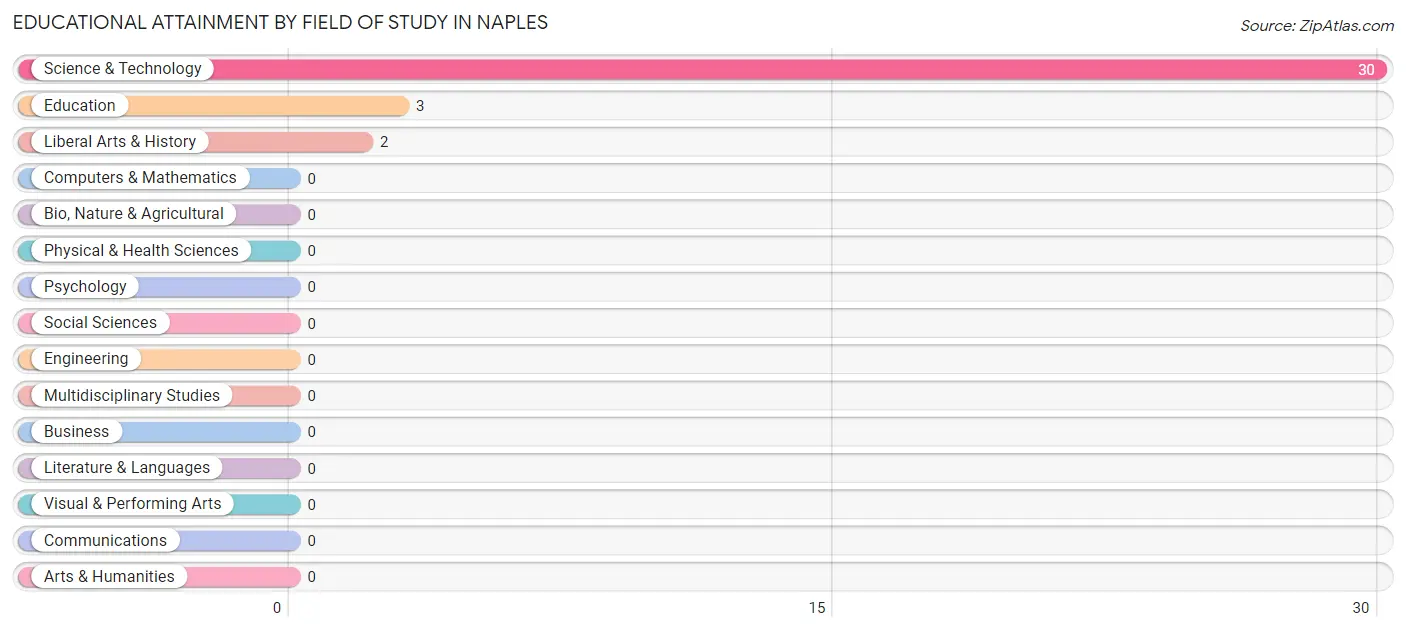
| Field of Study | # Graduates | % Graduates |
| Computers & Mathematics | 0 | 0.0% |
| Bio, Nature & Agricultural | 0 | 0.0% |
| Physical & Health Sciences | 0 | 0.0% |
| Psychology | 0 | 0.0% |
| Social Sciences | 0 | 0.0% |
| Engineering | 0 | 0.0% |
| Multidisciplinary Studies | 0 | 0.0% |
| Science & Technology | 30 | 85.7% |
| Business | 0 | 0.0% |
| Education | 3 | 8.6% |
| Literature & Languages | 0 | 0.0% |
| Liberal Arts & History | 2 | 5.7% |
| Visual & Performing Arts | 0 | 0.0% |
| Communications | 0 | 0.0% |
| Arts & Humanities | 0 | 0.0% |
| Total | 35 | 100.0% |
Transportation & Commute in Naples
Vehicle Availability by Sex in Naples
The most prevalent vehicle ownership categories in Naples are males with 2 vehicles (12, accounting for 92.3%) and females with 2 vehicles (30, making up 30.8%).
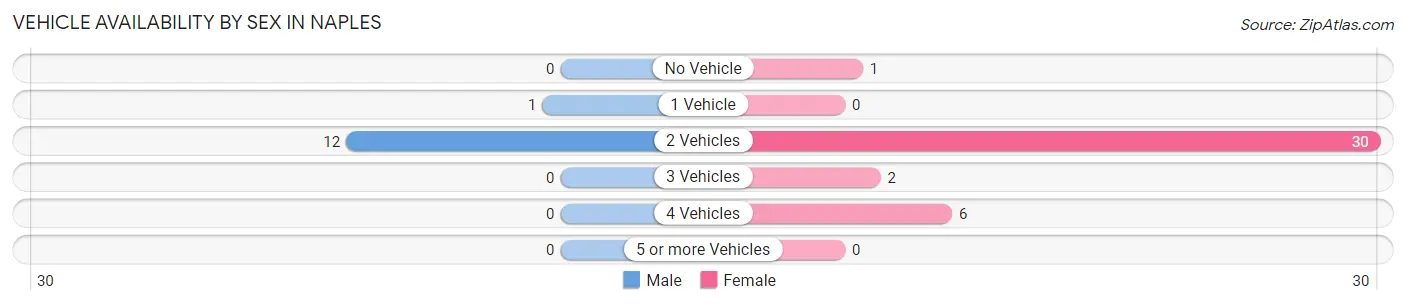
| Vehicles Available | Male | Female |
| No Vehicle | 0 (0.0%) | 1 (2.6%) |
| 1 Vehicle | 1 (7.7%) | 0 (0.0%) |
| 2 Vehicles | 12 (92.3%) | 30 (76.9%) |
| 3 Vehicles | 0 (0.0%) | 2 (5.1%) |
| 4 Vehicles | 0 (0.0%) | 6 (15.4%) |
| 5 or more Vehicles | 0 (0.0%) | 0 (0.0%) |
| Total | 13 (100.0%) | 39 (100.0%) |
Commute Time in Naples
The most frequently occuring commute durations in Naples are 30 to 34 minutes (33 commuters, 63.5%), 15 to 19 minutes (5 commuters, 9.6%), and 5 to 9 minutes (4 commuters, 7.7%).
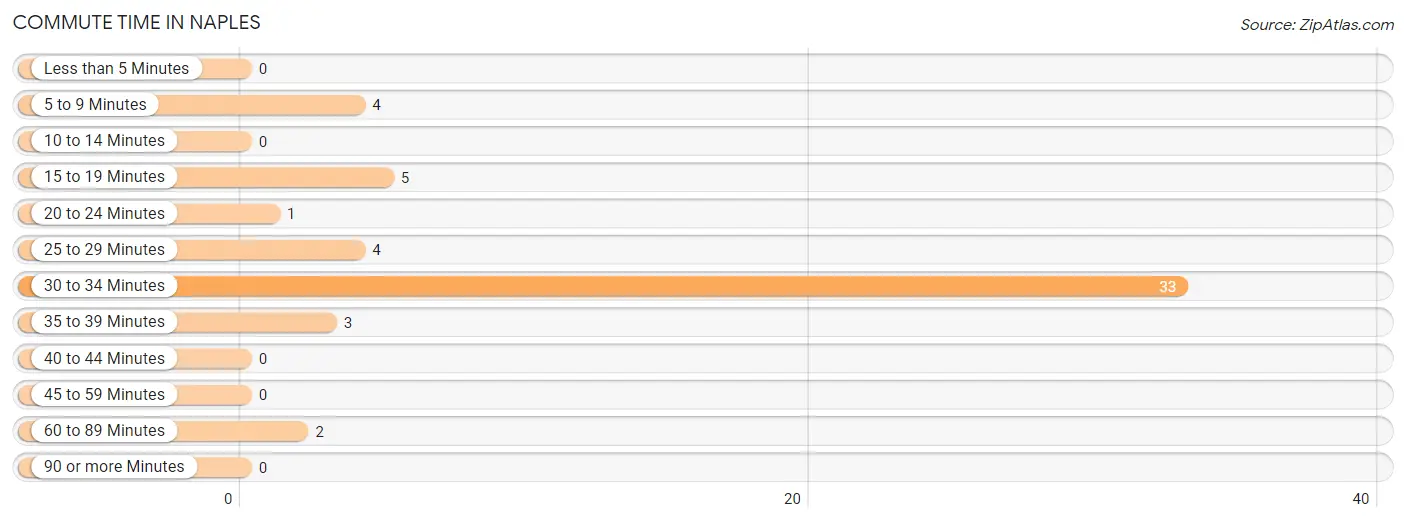
| Commute Time | # Commuters | % Commuters |
| Less than 5 Minutes | 0 | 0.0% |
| 5 to 9 Minutes | 4 | 7.7% |
| 10 to 14 Minutes | 0 | 0.0% |
| 15 to 19 Minutes | 5 | 9.6% |
| 20 to 24 Minutes | 1 | 1.9% |
| 25 to 29 Minutes | 4 | 7.7% |
| 30 to 34 Minutes | 33 | 63.5% |
| 35 to 39 Minutes | 3 | 5.8% |
| 40 to 44 Minutes | 0 | 0.0% |
| 45 to 59 Minutes | 0 | 0.0% |
| 60 to 89 Minutes | 2 | 3.8% |
| 90 or more Minutes | 0 | 0.0% |
Commute Time by Sex in Naples
The most common commute times in Naples are 15 to 19 minutes (5 commuters, 38.5%) for males and 30 to 34 minutes (33 commuters, 84.6%) for females.
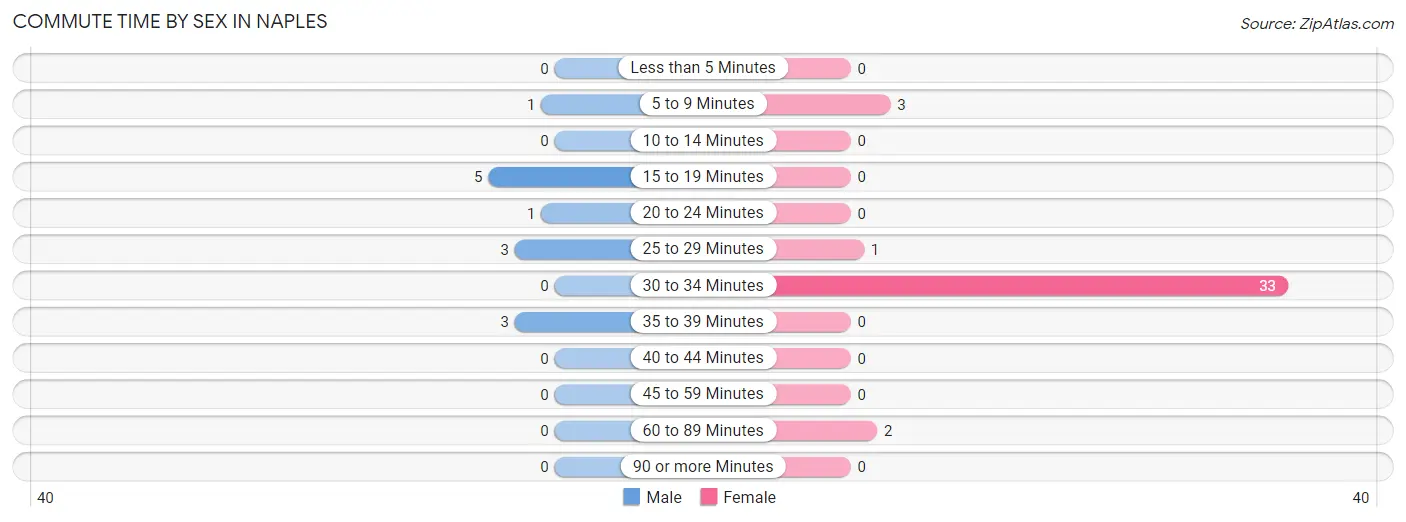
| Commute Time | Male | Female |
| Less than 5 Minutes | 0 (0.0%) | 0 (0.0%) |
| 5 to 9 Minutes | 1 (7.7%) | 3 (7.7%) |
| 10 to 14 Minutes | 0 (0.0%) | 0 (0.0%) |
| 15 to 19 Minutes | 5 (38.5%) | 0 (0.0%) |
| 20 to 24 Minutes | 1 (7.7%) | 0 (0.0%) |
| 25 to 29 Minutes | 3 (23.1%) | 1 (2.6%) |
| 30 to 34 Minutes | 0 (0.0%) | 33 (84.6%) |
| 35 to 39 Minutes | 3 (23.1%) | 0 (0.0%) |
| 40 to 44 Minutes | 0 (0.0%) | 0 (0.0%) |
| 45 to 59 Minutes | 0 (0.0%) | 0 (0.0%) |
| 60 to 89 Minutes | 0 (0.0%) | 2 (5.1%) |
| 90 or more Minutes | 0 (0.0%) | 0 (0.0%) |
Time of Departure to Work by Sex in Naples
The most frequent times of departure to work in Naples are 9:00 AM to 9:59 AM (5, 38.5%) for males and 7:30 AM to 7:59 AM (34, 87.2%) for females.
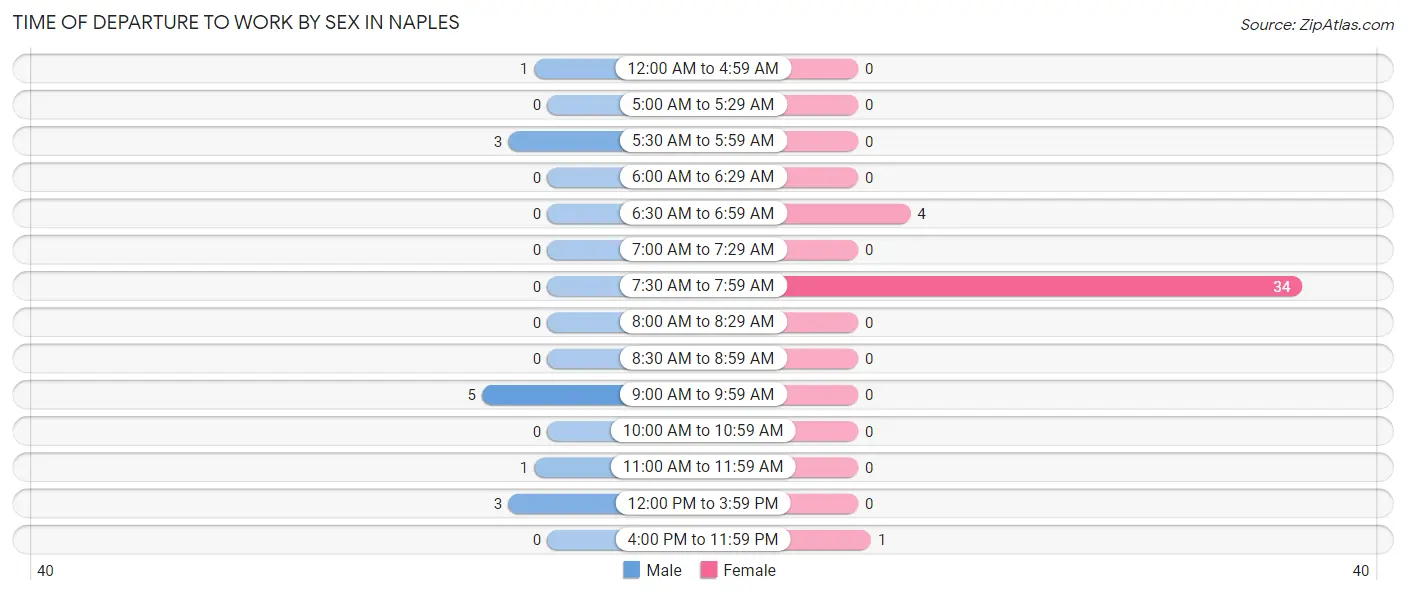
| Time of Departure | Male | Female |
| 12:00 AM to 4:59 AM | 1 (7.7%) | 0 (0.0%) |
| 5:00 AM to 5:29 AM | 0 (0.0%) | 0 (0.0%) |
| 5:30 AM to 5:59 AM | 3 (23.1%) | 0 (0.0%) |
| 6:00 AM to 6:29 AM | 0 (0.0%) | 0 (0.0%) |
| 6:30 AM to 6:59 AM | 0 (0.0%) | 4 (10.3%) |
| 7:00 AM to 7:29 AM | 0 (0.0%) | 0 (0.0%) |
| 7:30 AM to 7:59 AM | 0 (0.0%) | 34 (87.2%) |
| 8:00 AM to 8:29 AM | 0 (0.0%) | 0 (0.0%) |
| 8:30 AM to 8:59 AM | 0 (0.0%) | 0 (0.0%) |
| 9:00 AM to 9:59 AM | 5 (38.5%) | 0 (0.0%) |
| 10:00 AM to 10:59 AM | 0 (0.0%) | 0 (0.0%) |
| 11:00 AM to 11:59 AM | 1 (7.7%) | 0 (0.0%) |
| 12:00 PM to 3:59 PM | 3 (23.1%) | 0 (0.0%) |
| 4:00 PM to 11:59 PM | 0 (0.0%) | 1 (2.6%) |
| Total | 13 (100.0%) | 39 (100.0%) |
Housing Occupancy in Naples
Occupancy by Ownership in Naples
Of the total 69 dwellings in Naples, owner-occupied units account for 67 (97.1%), while renter-occupied units make up 2 (2.9%).
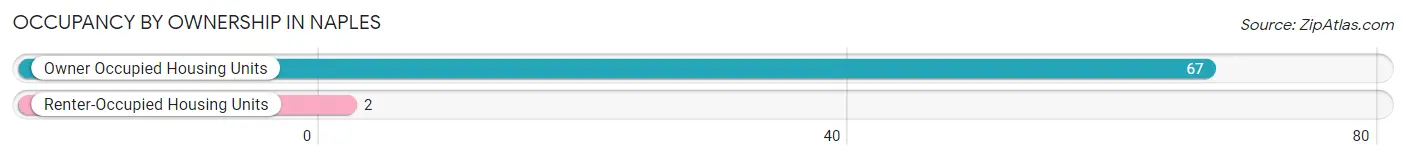
| Occupancy | # Housing Units | % Housing Units |
| Owner Occupied Housing Units | 67 | 97.1% |
| Renter-Occupied Housing Units | 2 | 2.9% |
| Total Occupied Housing Units | 69 | 100.0% |
Occupancy by Household Size in Naples
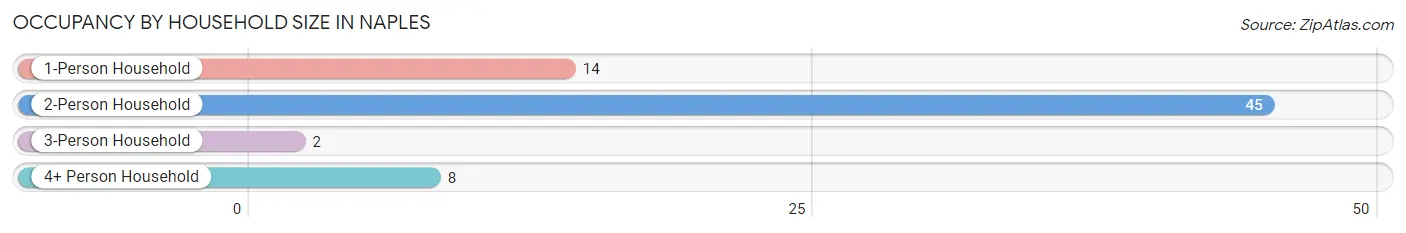
| Household Size | # Housing Units | % Housing Units |
| 1-Person Household | 14 | 20.3% |
| 2-Person Household | 45 | 65.2% |
| 3-Person Household | 2 | 2.9% |
| 4+ Person Household | 8 | 11.6% |
| Total Housing Units | 69 | 100.0% |
Occupancy by Ownership by Household Size in Naples
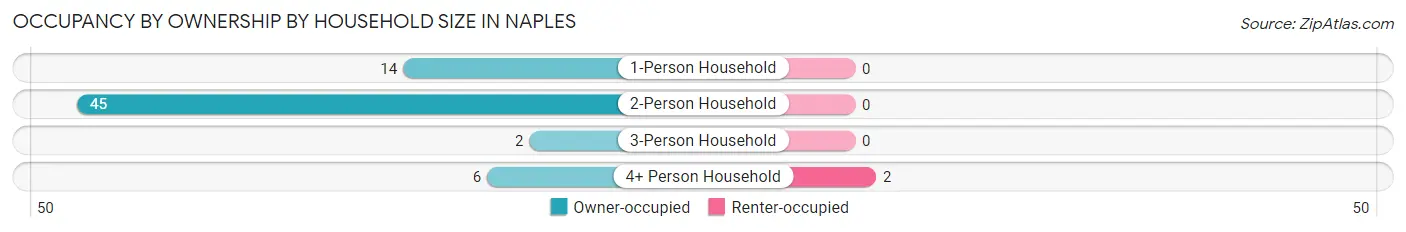
| Household Size | Owner-occupied | Renter-occupied |
| 1-Person Household | 14 (100.0%) | 0 (0.0%) |
| 2-Person Household | 45 (100.0%) | 0 (0.0%) |
| 3-Person Household | 2 (100.0%) | 0 (0.0%) |
| 4+ Person Household | 6 (75.0%) | 2 (25.0%) |
| Total Housing Units | 67 (97.1%) | 2 (2.9%) |
Occupancy by Educational Attainment in Naples
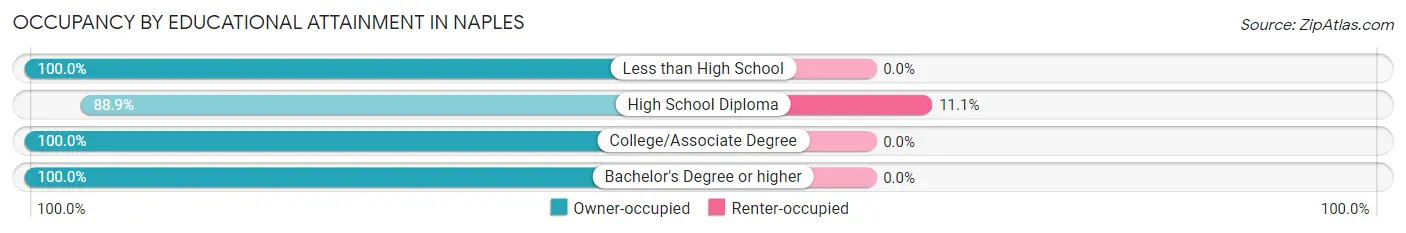
| Household Size | Owner-occupied | Renter-occupied |
| Less than High School | 7 (100.0%) | 0 (0.0%) |
| High School Diploma | 16 (88.9%) | 2 (11.1%) |
| College/Associate Degree | 11 (100.0%) | 0 (0.0%) |
| Bachelor's Degree or higher | 33 (100.0%) | 0 (0.0%) |
Occupancy by Age of Householder in Naples
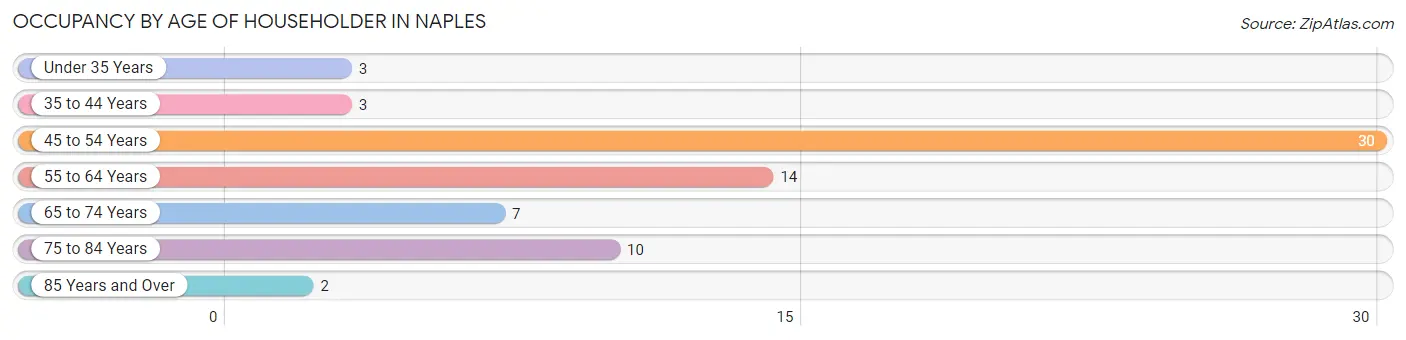
| Age Bracket | # Households | % Households |
| Under 35 Years | 3 | 4.3% |
| 35 to 44 Years | 3 | 4.3% |
| 45 to 54 Years | 30 | 43.5% |
| 55 to 64 Years | 14 | 20.3% |
| 65 to 74 Years | 7 | 10.1% |
| 75 to 84 Years | 10 | 14.5% |
| 85 Years and Over | 2 | 2.9% |
| Total | 69 | 100.0% |
Housing Finances in Naples
Median Income by Occupancy in Naples
| Occupancy Type | # Households | Median Income |
| Owner-Occupied | 67 (97.1%) | $0 |
| Renter-Occupied | 2 (2.9%) | $0 |
| Average | 69 (100.0%) | $0 |
Occupancy by Householder Income Bracket in Naples
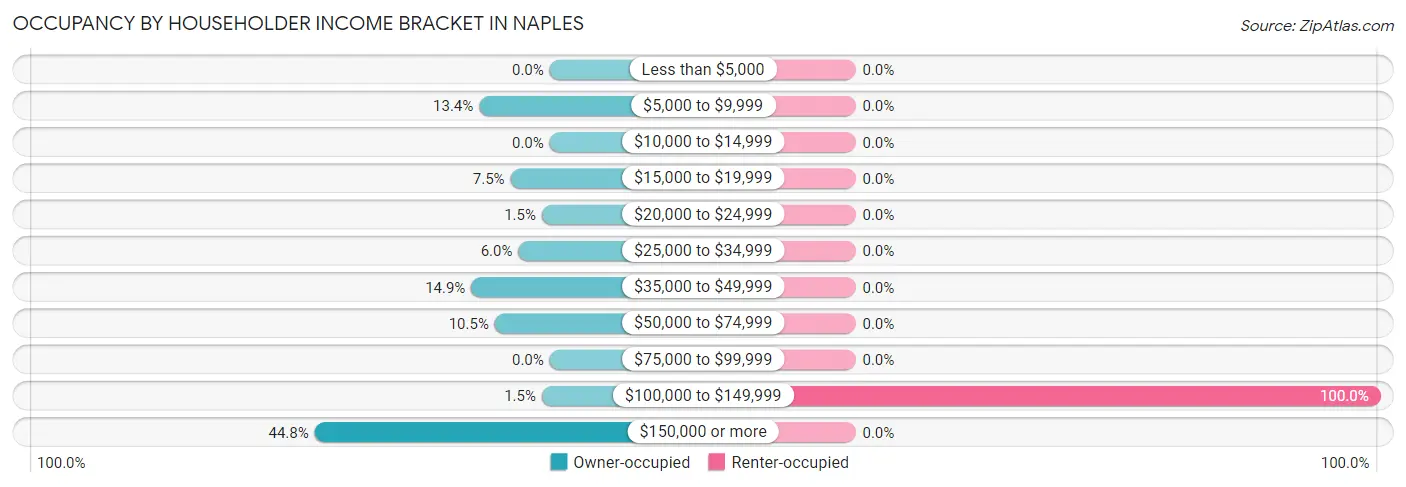
| Income Bracket | Owner-occupied | Renter-occupied |
| Less than $5,000 | 0 (0.0%) | 0 (0.0%) |
| $5,000 to $9,999 | 9 (13.4%) | 0 (0.0%) |
| $10,000 to $14,999 | 0 (0.0%) | 0 (0.0%) |
| $15,000 to $19,999 | 5 (7.5%) | 0 (0.0%) |
| $20,000 to $24,999 | 1 (1.5%) | 0 (0.0%) |
| $25,000 to $34,999 | 4 (6.0%) | 0 (0.0%) |
| $35,000 to $49,999 | 10 (14.9%) | 0 (0.0%) |
| $50,000 to $74,999 | 7 (10.4%) | 0 (0.0%) |
| $75,000 to $99,999 | 0 (0.0%) | 0 (0.0%) |
| $100,000 to $149,999 | 1 (1.5%) | 2 (100.0%) |
| $150,000 or more | 30 (44.8%) | 0 (0.0%) |
| Total | 67 (100.0%) | 2 (100.0%) |
Monthly Housing Cost Tiers in Naples
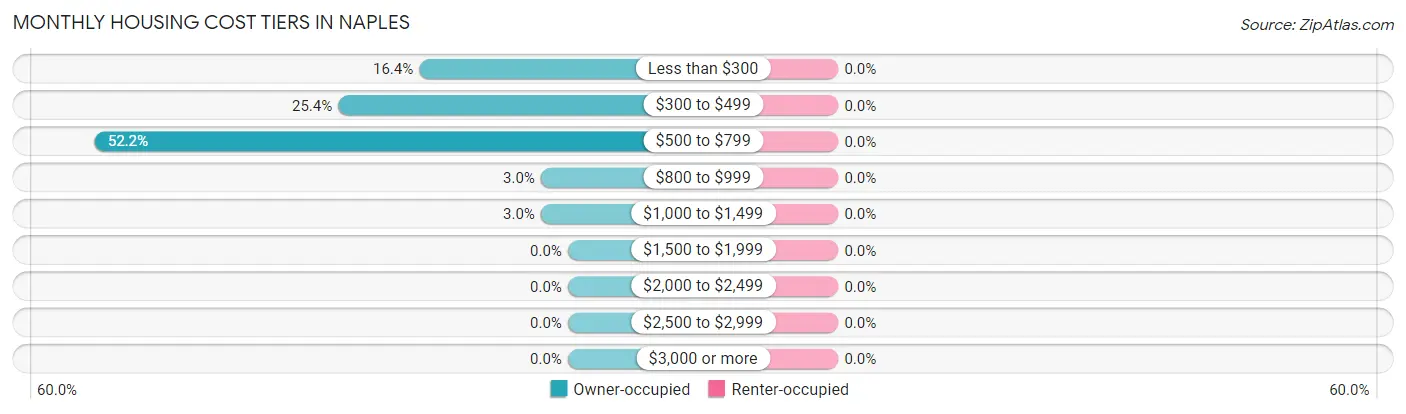
| Monthly Cost | Owner-occupied | Renter-occupied |
| Less than $300 | 11 (16.4%) | 0 (0.0%) |
| $300 to $499 | 17 (25.4%) | 0 (0.0%) |
| $500 to $799 | 35 (52.2%) | 0 (0.0%) |
| $800 to $999 | 2 (3.0%) | 0 (0.0%) |
| $1,000 to $1,499 | 2 (3.0%) | 0 (0.0%) |
| $1,500 to $1,999 | 0 (0.0%) | 0 (0.0%) |
| $2,000 to $2,499 | 0 (0.0%) | 0 (0.0%) |
| $2,500 to $2,999 | 0 (0.0%) | 0 (0.0%) |
| $3,000 or more | 0 (0.0%) | 0 (0.0%) |
| Total | 67 (100.0%) | 2 (100.0%) |
Physical Housing Characteristics in Naples
Housing Structures in Naples
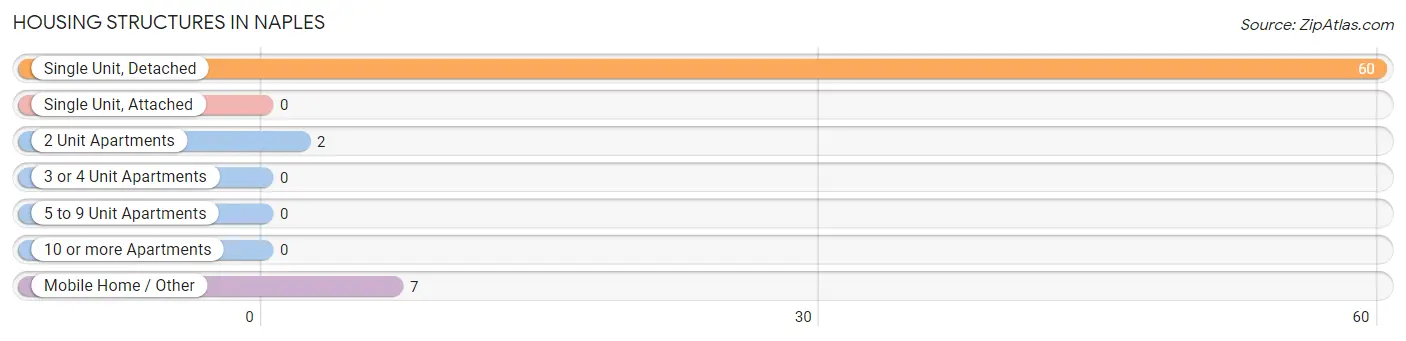
| Structure Type | # Housing Units | % Housing Units |
| Single Unit, Detached | 60 | 87.0% |
| Single Unit, Attached | 0 | 0.0% |
| 2 Unit Apartments | 2 | 2.9% |
| 3 or 4 Unit Apartments | 0 | 0.0% |
| 5 to 9 Unit Apartments | 0 | 0.0% |
| 10 or more Apartments | 0 | 0.0% |
| Mobile Home / Other | 7 | 10.1% |
| Total | 69 | 100.0% |
Housing Structures by Occupancy in Naples
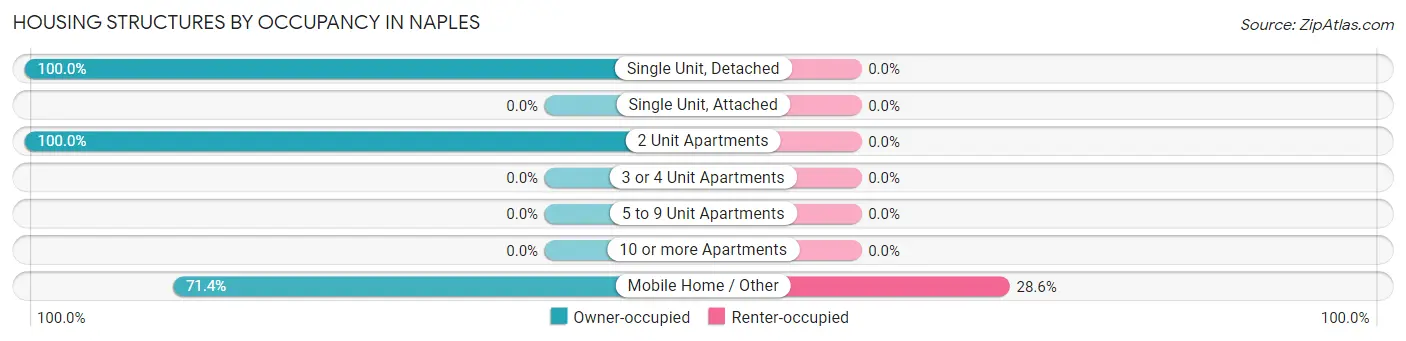
| Structure Type | Owner-occupied | Renter-occupied |
| Single Unit, Detached | 60 (100.0%) | 0 (0.0%) |
| Single Unit, Attached | 0 (0.0%) | 0 (0.0%) |
| 2 Unit Apartments | 2 (100.0%) | 0 (0.0%) |
| 3 or 4 Unit Apartments | 0 (0.0%) | 0 (0.0%) |
| 5 to 9 Unit Apartments | 0 (0.0%) | 0 (0.0%) |
| 10 or more Apartments | 0 (0.0%) | 0 (0.0%) |
| Mobile Home / Other | 5 (71.4%) | 2 (28.6%) |
| Total | 67 (97.1%) | 2 (2.9%) |
Housing Structures by Number of Rooms in Naples
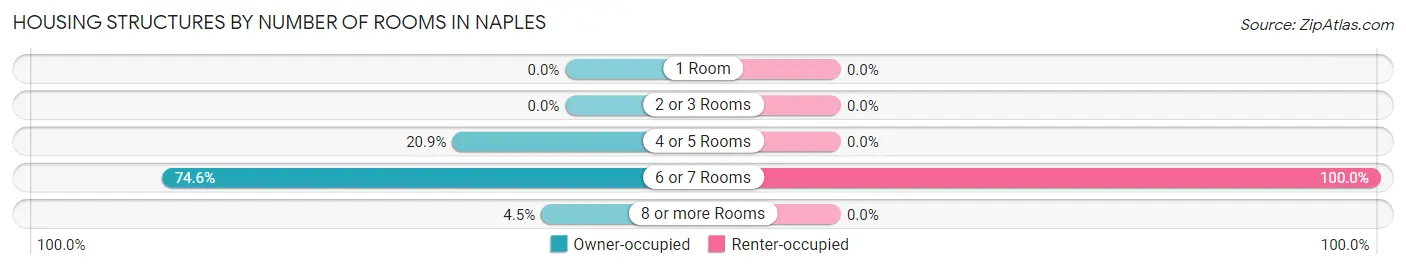
| Number of Rooms | Owner-occupied | Renter-occupied |
| 1 Room | 0 (0.0%) | 0 (0.0%) |
| 2 or 3 Rooms | 0 (0.0%) | 0 (0.0%) |
| 4 or 5 Rooms | 14 (20.9%) | 0 (0.0%) |
| 6 or 7 Rooms | 50 (74.6%) | 2 (100.0%) |
| 8 or more Rooms | 3 (4.5%) | 0 (0.0%) |
| Total | 67 (100.0%) | 2 (100.0%) |
Housing Structure by Heating Type in Naples
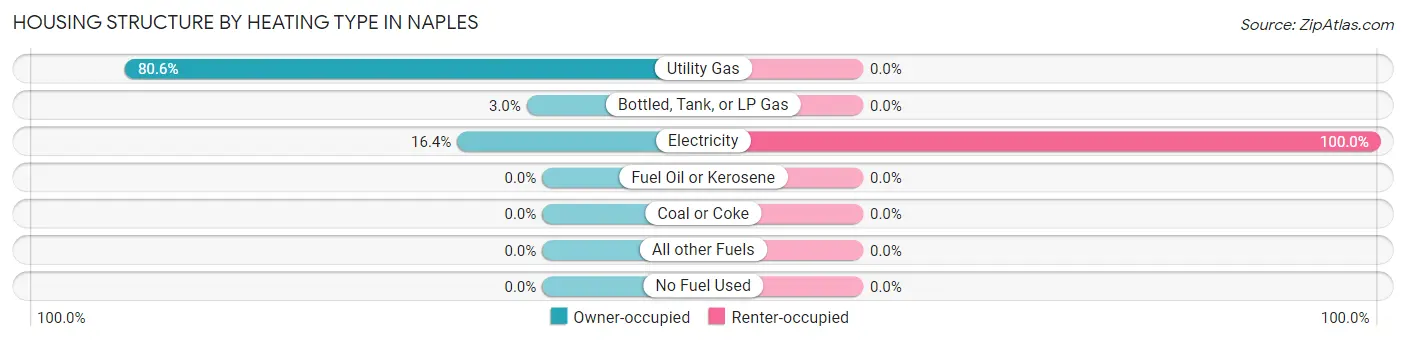
| Heating Type | Owner-occupied | Renter-occupied |
| Utility Gas | 54 (80.6%) | 0 (0.0%) |
| Bottled, Tank, or LP Gas | 2 (3.0%) | 0 (0.0%) |
| Electricity | 11 (16.4%) | 2 (100.0%) |
| Fuel Oil or Kerosene | 0 (0.0%) | 0 (0.0%) |
| Coal or Coke | 0 (0.0%) | 0 (0.0%) |
| All other Fuels | 0 (0.0%) | 0 (0.0%) |
| No Fuel Used | 0 (0.0%) | 0 (0.0%) |
| Total | 67 (100.0%) | 2 (100.0%) |
Household Vehicle Usage in Naples
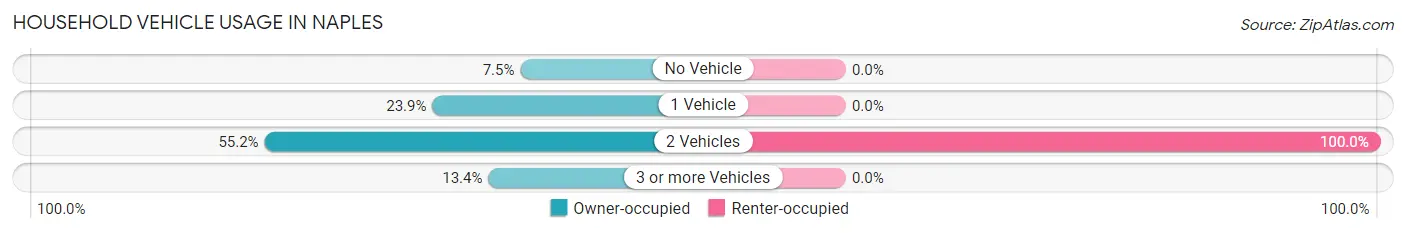
| Vehicles per Household | Owner-occupied | Renter-occupied |
| No Vehicle | 5 (7.5%) | 0 (0.0%) |
| 1 Vehicle | 16 (23.9%) | 0 (0.0%) |
| 2 Vehicles | 37 (55.2%) | 2 (100.0%) |
| 3 or more Vehicles | 9 (13.4%) | 0 (0.0%) |
| Total | 67 (100.0%) | 2 (100.0%) |
Real Estate & Mortgages in Naples
Real Estate and Mortgage Overview in Naples
| Characteristic | Without Mortgage | With Mortgage |
| Housing Units | 34 | 33 |
| Median Property Value | $29,400 | $55,200 |
| Median Household Income | $31,667 | $30 |
| Monthly Housing Costs | $371 | $0 |
| Real Estate Taxes | $467 | $0 |
Property Value by Mortgage Status in Naples
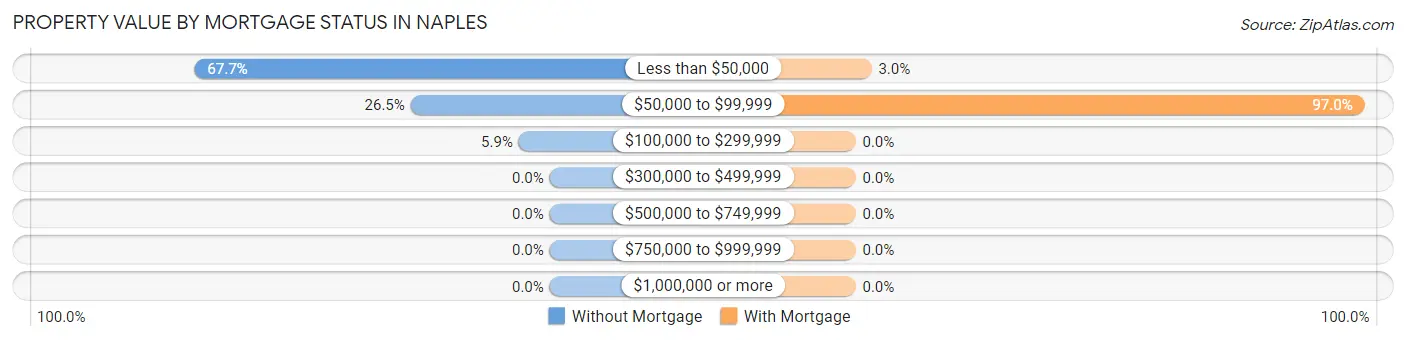
| Property Value | Without Mortgage | With Mortgage |
| Less than $50,000 | 23 (67.6%) | 1 (3.0%) |
| $50,000 to $99,999 | 9 (26.5%) | 32 (97.0%) |
| $100,000 to $299,999 | 2 (5.9%) | 0 (0.0%) |
| $300,000 to $499,999 | 0 (0.0%) | 0 (0.0%) |
| $500,000 to $749,999 | 0 (0.0%) | 0 (0.0%) |
| $750,000 to $999,999 | 0 (0.0%) | 0 (0.0%) |
| $1,000,000 or more | 0 (0.0%) | 0 (0.0%) |
| Total | 34 (100.0%) | 33 (100.0%) |
Household Income by Mortgage Status in Naples
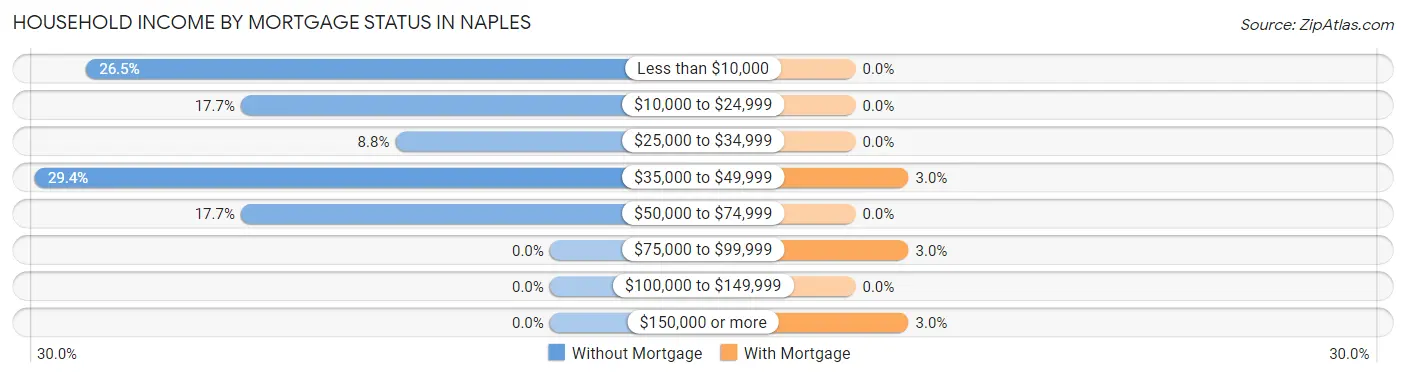
| Household Income | Without Mortgage | With Mortgage |
| Less than $10,000 | 9 (26.5%) | 0 (0.0%) |
| $10,000 to $24,999 | 6 (17.6%) | 0 (0.0%) |
| $25,000 to $34,999 | 3 (8.8%) | 0 (0.0%) |
| $35,000 to $49,999 | 10 (29.4%) | 1 (3.0%) |
| $50,000 to $74,999 | 6 (17.6%) | 0 (0.0%) |
| $75,000 to $99,999 | 0 (0.0%) | 1 (3.0%) |
| $100,000 to $149,999 | 0 (0.0%) | 0 (0.0%) |
| $150,000 or more | 0 (0.0%) | 1 (3.0%) |
| Total | 34 (100.0%) | 33 (100.0%) |
Property Value to Household Income Ratio in Naples
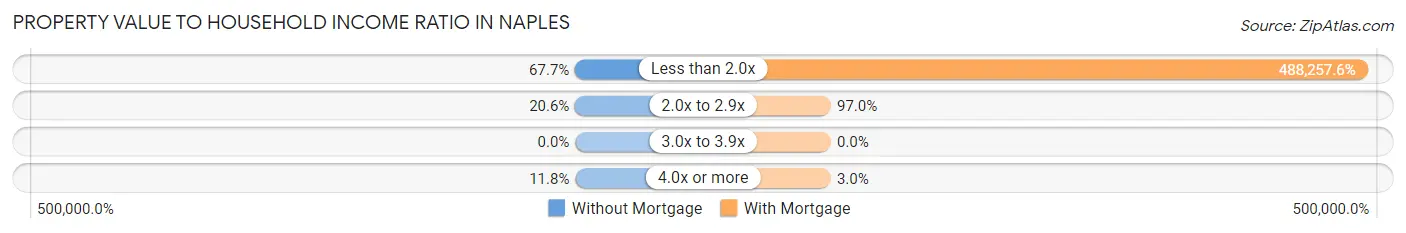
| Value-to-Income Ratio | Without Mortgage | With Mortgage |
| Less than 2.0x | 23 (67.6%) | 161,125 (488,257.6%) |
| 2.0x to 2.9x | 7 (20.6%) | 32 (97.0%) |
| 3.0x to 3.9x | 0 (0.0%) | 0 (0.0%) |
| 4.0x or more | 4 (11.8%) | 1 (3.0%) |
| Total | 34 (100.0%) | 33 (100.0%) |
Real Estate Taxes by Mortgage Status in Naples
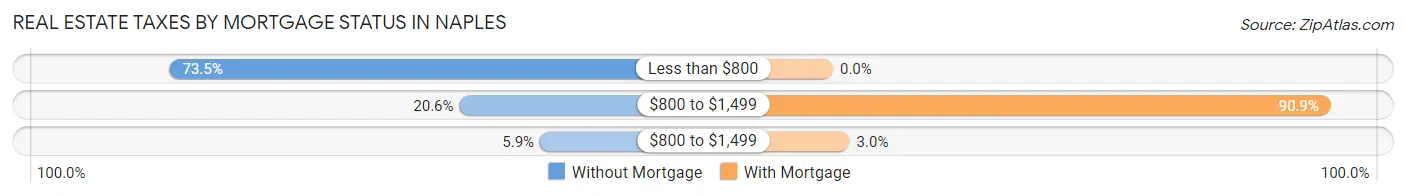
| Property Taxes | Without Mortgage | With Mortgage |
| Less than $800 | 25 (73.5%) | 0 (0.0%) |
| $800 to $1,499 | 7 (20.6%) | 30 (90.9%) |
| $800 to $1,499 | 2 (5.9%) | 1 (3.0%) |
| Total | 34 (100.0%) | 33 (100.0%) |
Health & Disability in Naples
Health Insurance Coverage by Age in Naples
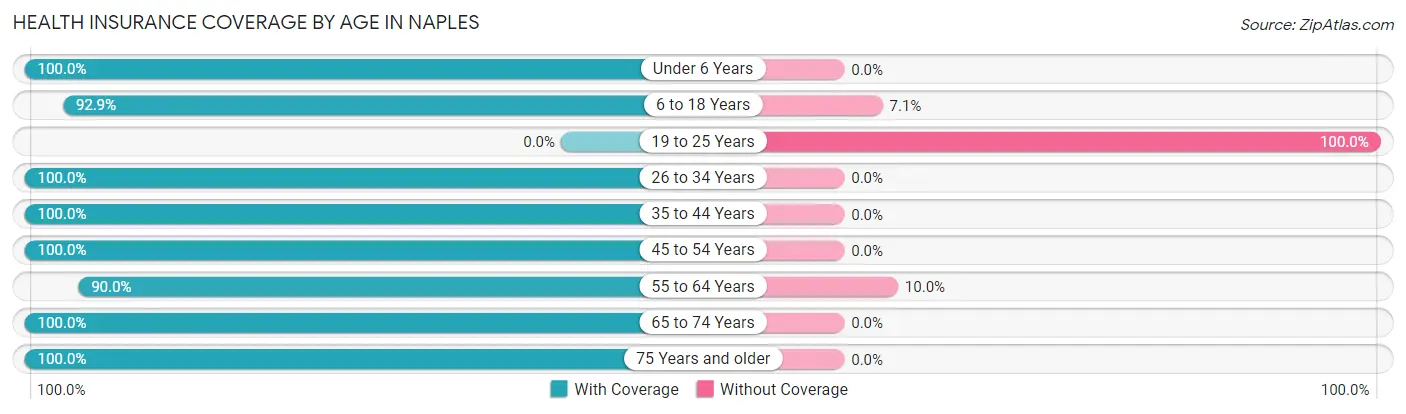
| Age Bracket | With Coverage | Without Coverage |
| Under 6 Years | 2 (100.0%) | 0 (0.0%) |
| 6 to 18 Years | 13 (92.9%) | 1 (7.1%) |
| 19 to 25 Years | 0 (0.0%) | 5 (100.0%) |
| 26 to 34 Years | 16 (100.0%) | 0 (0.0%) |
| 35 to 44 Years | 9 (100.0%) | 0 (0.0%) |
| 45 to 54 Years | 32 (100.0%) | 0 (0.0%) |
| 55 to 64 Years | 18 (90.0%) | 2 (10.0%) |
| 65 to 74 Years | 31 (100.0%) | 0 (0.0%) |
| 75 Years and older | 16 (100.0%) | 0 (0.0%) |
| Total | 137 (94.5%) | 8 (5.5%) |
Health Insurance Coverage by Citizenship Status in Naples
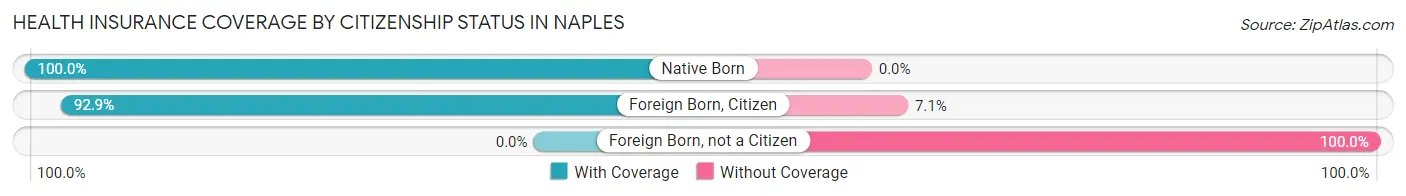
| Citizenship Status | With Coverage | Without Coverage |
| Native Born | 2 (100.0%) | 0 (0.0%) |
| Foreign Born, Citizen | 13 (92.9%) | 1 (7.1%) |
| Foreign Born, not a Citizen | 0 (0.0%) | 5 (100.0%) |
Health Insurance Coverage by Household Income in Naples
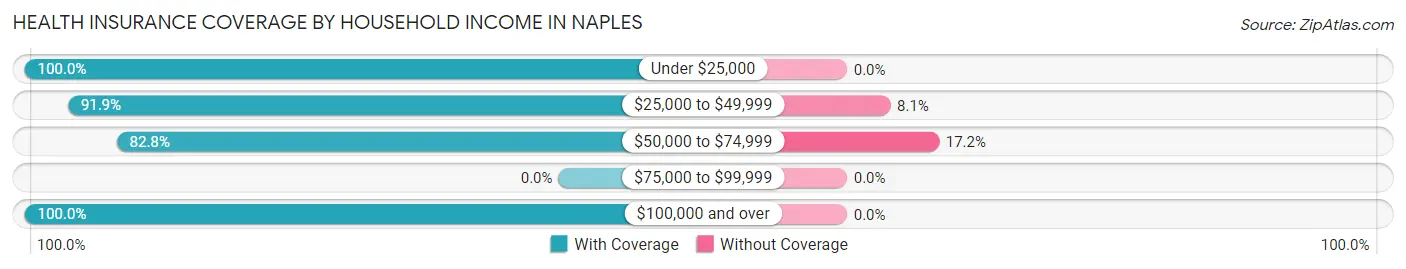
| Household Income | With Coverage | Without Coverage |
| Under $25,000 | 21 (100.0%) | 0 (0.0%) |
| $25,000 to $49,999 | 34 (91.9%) | 3 (8.1%) |
| $50,000 to $74,999 | 24 (82.8%) | 5 (17.2%) |
| $75,000 to $99,999 | 0 (0.0%) | 0 (0.0%) |
| $100,000 and over | 58 (100.0%) | 0 (0.0%) |
Public vs Private Health Insurance Coverage by Age in Naples
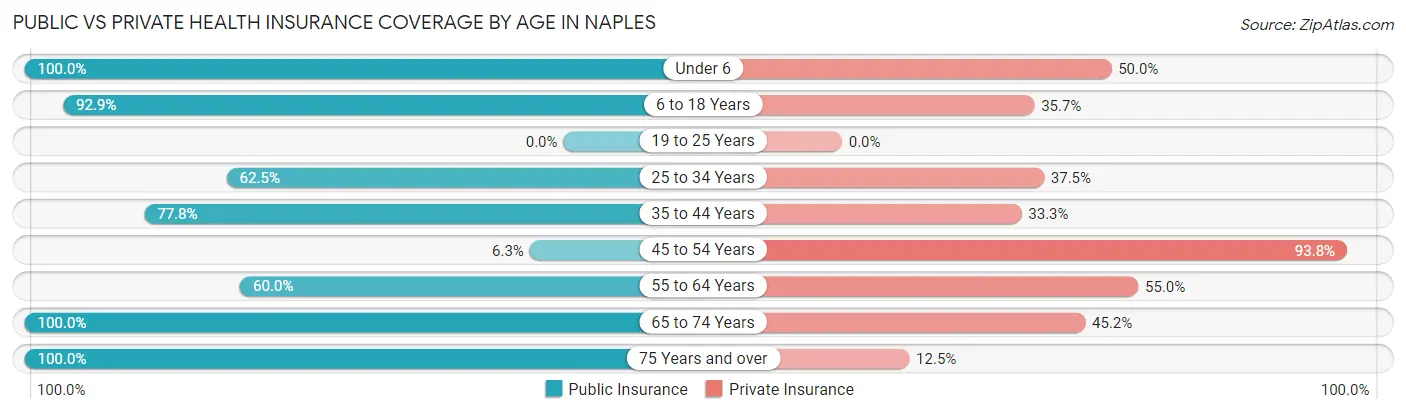
| Age Bracket | Public Insurance | Private Insurance |
| Under 6 | 2 (100.0%) | 1 (50.0%) |
| 6 to 18 Years | 13 (92.9%) | 5 (35.7%) |
| 19 to 25 Years | 0 (0.0%) | 0 (0.0%) |
| 25 to 34 Years | 10 (62.5%) | 6 (37.5%) |
| 35 to 44 Years | 7 (77.8%) | 3 (33.3%) |
| 45 to 54 Years | 2 (6.2%) | 30 (93.8%) |
| 55 to 64 Years | 12 (60.0%) | 11 (55.0%) |
| 65 to 74 Years | 31 (100.0%) | 14 (45.2%) |
| 75 Years and over | 16 (100.0%) | 2 (12.5%) |
| Total | 93 (64.1%) | 72 (49.7%) |
Disability Status by Sex by Age in Naples
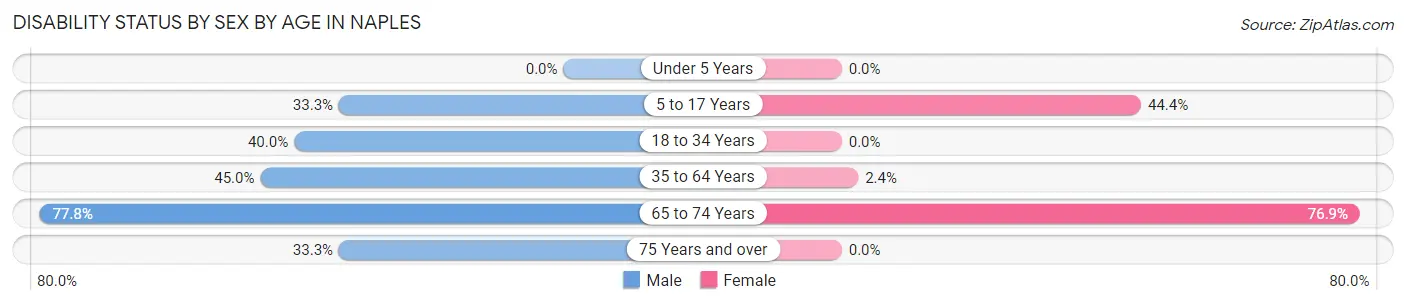
| Age Bracket | Male | Female |
| Under 5 Years | 0 (0.0%) | 0 (0.0%) |
| 5 to 17 Years | 1 (33.3%) | 4 (44.4%) |
| 18 to 34 Years | 6 (40.0%) | 0 (0.0%) |
| 35 to 64 Years | 9 (45.0%) | 1 (2.4%) |
| 65 to 74 Years | 14 (77.8%) | 10 (76.9%) |
| 75 Years and over | 3 (33.3%) | 0 (0.0%) |
Disability Class by Sex by Age in Naples
Disability Class: Hearing Difficulty
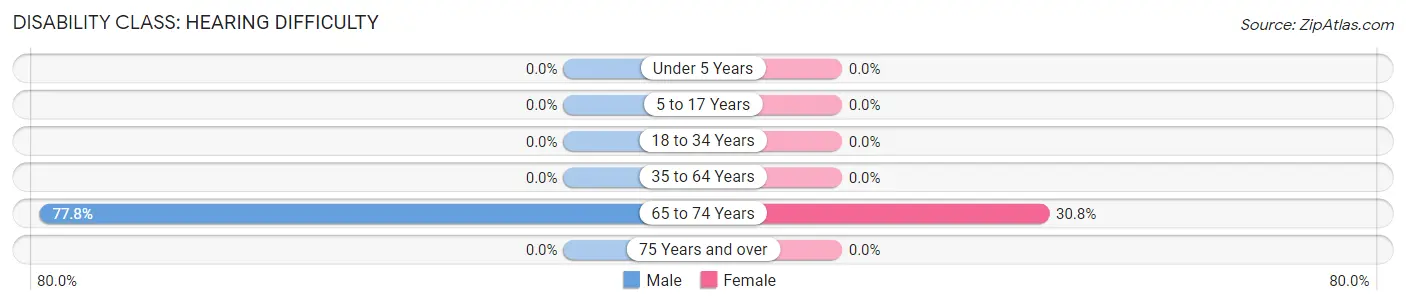
| Age Bracket | Male | Female |
| Under 5 Years | 0 (0.0%) | 0 (0.0%) |
| 5 to 17 Years | 0 (0.0%) | 0 (0.0%) |
| 18 to 34 Years | 0 (0.0%) | 0 (0.0%) |
| 35 to 64 Years | 0 (0.0%) | 0 (0.0%) |
| 65 to 74 Years | 14 (77.8%) | 4 (30.8%) |
| 75 Years and over | 0 (0.0%) | 0 (0.0%) |
Disability Class: Vision Difficulty
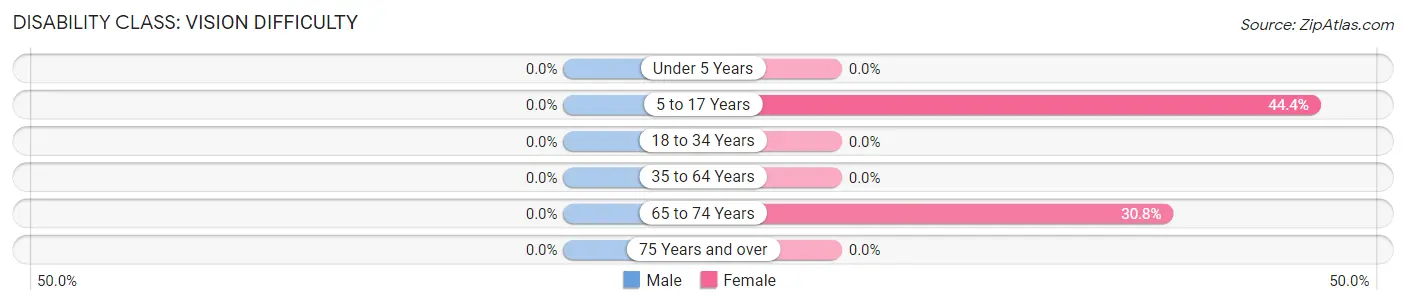
| Age Bracket | Male | Female |
| Under 5 Years | 0 (0.0%) | 0 (0.0%) |
| 5 to 17 Years | 0 (0.0%) | 4 (44.4%) |
| 18 to 34 Years | 0 (0.0%) | 0 (0.0%) |
| 35 to 64 Years | 0 (0.0%) | 0 (0.0%) |
| 65 to 74 Years | 0 (0.0%) | 4 (30.8%) |
| 75 Years and over | 0 (0.0%) | 0 (0.0%) |
Disability Class: Cognitive Difficulty
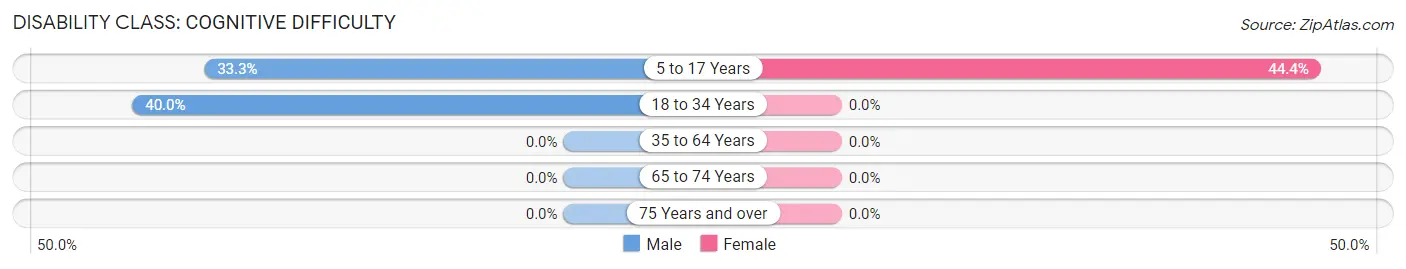
| Age Bracket | Male | Female |
| 5 to 17 Years | 1 (33.3%) | 4 (44.4%) |
| 18 to 34 Years | 6 (40.0%) | 0 (0.0%) |
| 35 to 64 Years | 0 (0.0%) | 0 (0.0%) |
| 65 to 74 Years | 0 (0.0%) | 0 (0.0%) |
| 75 Years and over | 0 (0.0%) | 0 (0.0%) |
Disability Class: Ambulatory Difficulty
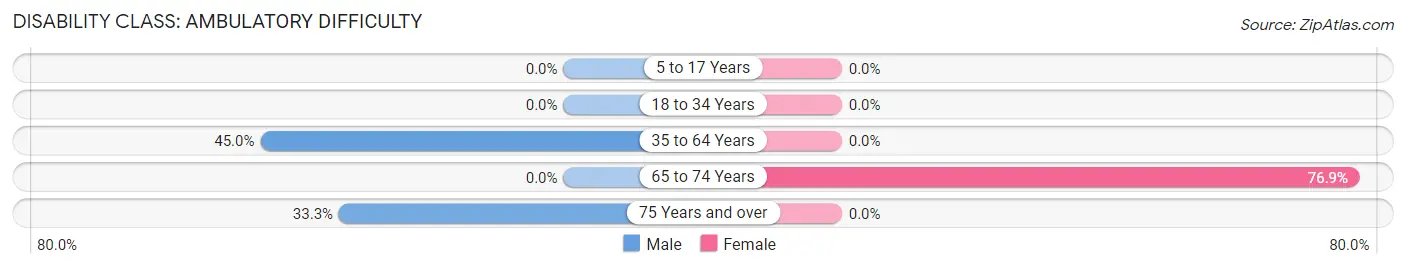
| Age Bracket | Male | Female |
| 5 to 17 Years | 0 (0.0%) | 0 (0.0%) |
| 18 to 34 Years | 0 (0.0%) | 0 (0.0%) |
| 35 to 64 Years | 9 (45.0%) | 0 (0.0%) |
| 65 to 74 Years | 0 (0.0%) | 10 (76.9%) |
| 75 Years and over | 3 (33.3%) | 0 (0.0%) |
Disability Class: Self-Care Difficulty
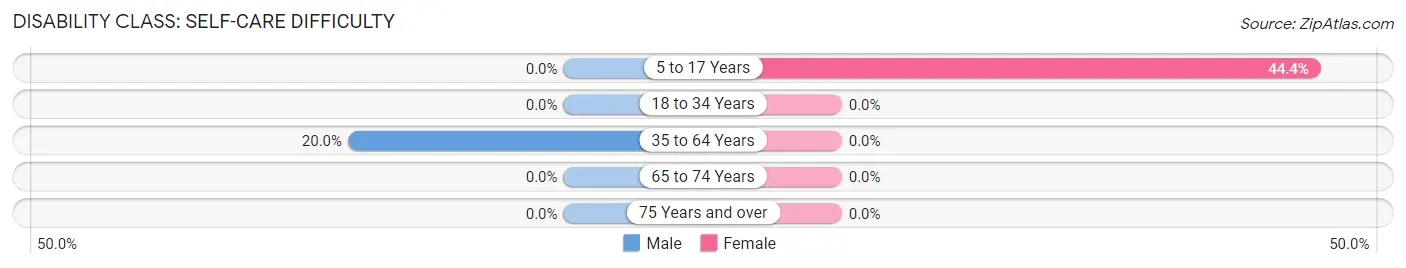
| Age Bracket | Male | Female |
| 5 to 17 Years | 0 (0.0%) | 4 (44.4%) |
| 18 to 34 Years | 0 (0.0%) | 0 (0.0%) |
| 35 to 64 Years | 4 (20.0%) | 0 (0.0%) |
| 65 to 74 Years | 0 (0.0%) | 0 (0.0%) |
| 75 Years and over | 0 (0.0%) | 0 (0.0%) |
Technology Access in Naples
Computing Device Access in Naples
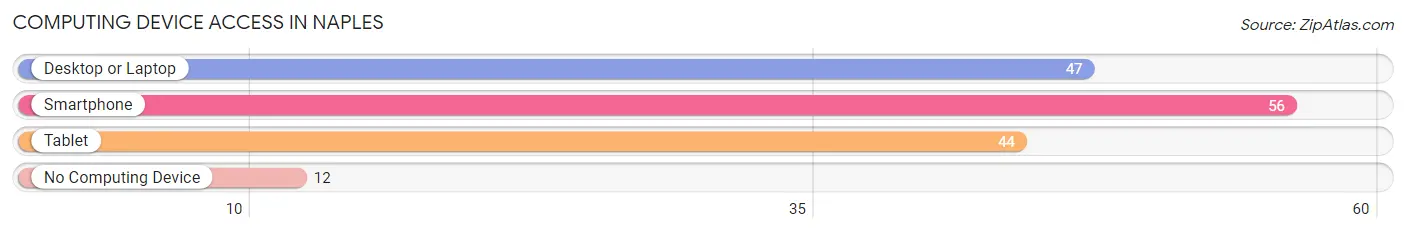
| Device Type | # Households | % Households |
| Desktop or Laptop | 47 | 68.1% |
| Smartphone | 56 | 81.2% |
| Tablet | 44 | 63.8% |
| No Computing Device | 12 | 17.4% |
| Total | 69 | 100.0% |
Internet Access in Naples
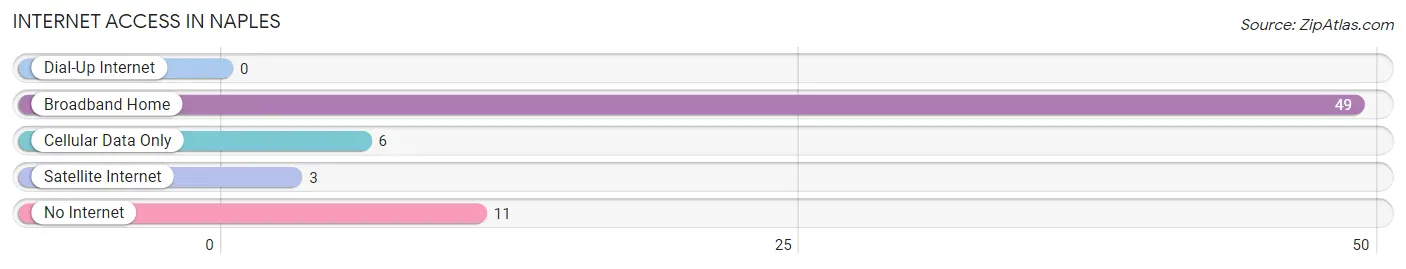
| Internet Type | # Households | % Households |
| Dial-Up Internet | 0 | 0.0% |
| Broadband Home | 49 | 71.0% |
| Cellular Data Only | 6 | 8.7% |
| Satellite Internet | 3 | 4.3% |
| No Internet | 11 | 15.9% |
| Total | 69 | 100.0% |
Naples Summary
Naples, Illinois is a small village located in Scott County, Illinois. It is situated on the banks of the Mississippi River, approximately 25 miles south of the Quad Cities. The village has a population of approximately 1,000 people and is part of the Quad Cities Metropolitan Statistical Area.
History
The area that is now known as Naples was first settled in 1835 by a group of settlers from New York. The village was originally known as “New York Settlement” and was later renamed “Naples” after the Italian city. The village was officially incorporated in 1854.
In the late 19th century, Naples was a thriving river port town. The village was home to several businesses, including a sawmill, a grist mill, a brickyard, and a boat building business. The village also had a ferry service that connected it to the nearby towns of Rock Island and Moline.
In the early 20th century, the village began to decline as the river trade shifted to larger cities. The village’s population decreased and many of the businesses closed. In the 1950s, the village was revitalized with the construction of a new bridge over the Mississippi River. This bridge connected Naples to the nearby town of Rock Island and allowed for increased trade and commerce.
Geography
Naples is located in the northwest corner of Scott County, Illinois. The village is situated on the banks of the Mississippi River, approximately 25 miles south of the Quad Cities. The village is surrounded by rolling hills and farmland. The nearest major cities are Rock Island (7 miles to the east) and Moline (15 miles to the north).
The climate in Naples is typical of the Midwest. Summers are hot and humid, with temperatures reaching into the 90s. Winters are cold and snowy, with temperatures often dropping below zero.
Economy
The economy of Naples is largely based on agriculture and tourism. The village is home to several farms that produce corn, soybeans, and other crops. The village also has several small businesses, including a grocery store, a hardware store, and a restaurant.
Tourism is an important part of the local economy. The village is home to several historic sites, including the Old Mill, the Old Schoolhouse, and the Old Church. The village also has several parks and recreational areas, including the Naples Riverfront Park.
Demographics
As of the 2010 census, the population of Naples was 1,000. The racial makeup of the village was 97.2% White, 0.7% African American, 0.3% Native American, 0.2% Asian, and 1.6% from other races. The median household income was $41,250 and the median family income was $50,000.
Naples is a small, rural village with a close-knit community. The village is home to several churches, including the First Baptist Church, the United Methodist Church, and the Church of the Nazarene. The village also has several civic organizations, including the Lions Club and the Rotary Club.
Common Questions
What is Per Capita Income in Naples?
Per Capita income in Naples is $36,379.
What is Income or Wage Gap in Naples?
Income or Wage Gap in Naples is 18.0%.
Women in Naples earn 82.0 cents for every dollar earned by a man.
What is Inequality or Gini Index in Naples?
Inequality or Gini Index in Naples is 0.38.
What is the Total Population of Naples?
Total Population of Naples is 145.
What is the Total Male Population of Naples?
Total Male Population of Naples is 66.
What is the Total Female Population of Naples?
Total Female Population of Naples is 79.
What is the Ratio of Males per 100 Females in Naples?
There are 83.54 Males per 100 Females in Naples.
What is the Ratio of Females per 100 Males in Naples?
There are 119.70 Females per 100 Males in Naples.
What is the Median Population Age in Naples?
Median Population Age in Naples is 47.9 Years.
What is the Average Family Size in Naples
Average Family Size in Naples is 2.2 People.
What is the Average Household Size in Naples
Average Household Size in Naples is 2.1 People.
How Large is the Labor Force in Naples?
There are 57 People in the Labor Forcein in Naples.
What is the Percentage of People in the Labor Force in Naples?
43.2% of People are in the Labor Force in Naples.
What is the Unemployment Rate in Naples?
Unemployment Rate in Naples is 8.8%.