Lake Ka Ho, IL Map & Demographics
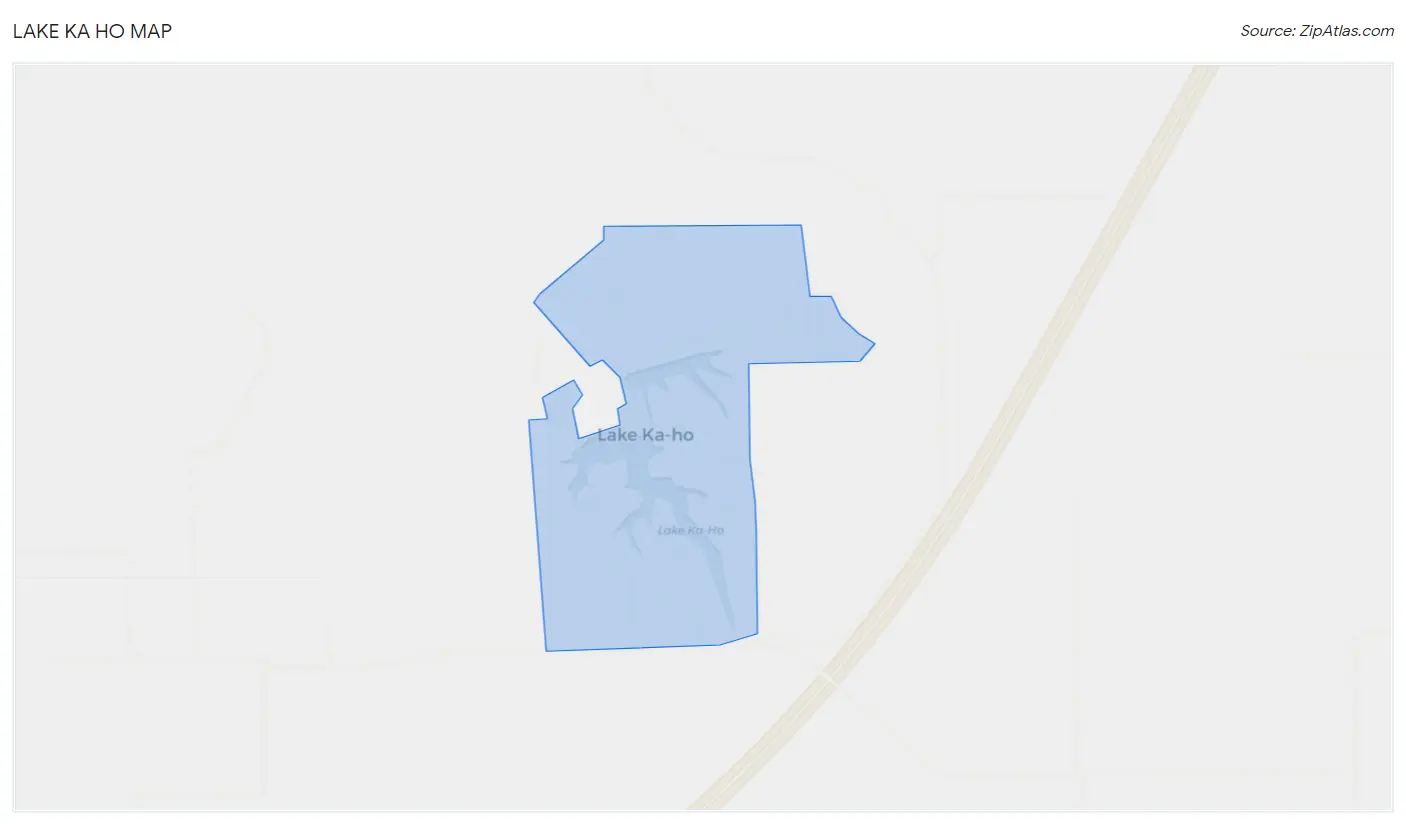
Lake Ka Ho Map
Lake Ka Ho Overview
$24,026
PER CAPITA INCOME
$54,063
AVG FAMILY INCOME
$44,444
AVG HOUSEHOLD INCOME
0.46
INEQUALITY / GINI INDEX
281
TOTAL POPULATION
137
MALE POPULATION
144
FEMALE POPULATION
95.14
MALES / 100 FEMALES
105.11
FEMALES / 100 MALES
46.8
MEDIAN AGE
3.4
AVG FAMILY SIZE
2.5
AVG HOUSEHOLD SIZE
96
LABOR FORCE [ PEOPLE ]
42.3%
PERCENT IN LABOR FORCE
7.3%
UNEMPLOYMENT RATE
Income in Lake Ka Ho
Income Overview in Lake Ka Ho
Per Capita Income in Lake Ka Ho is $24,026, while median incomes of families and households are $54,063 and $44,444 respectively.
| Characteristic | Number | Measure |
| Per Capita Income | 281 | $24,026 |
| Median Family Income | 65 | $54,063 |
| Mean Family Income | 65 | $78,283 |
| Median Household Income | 114 | $44,444 |
| Mean Household Income | 114 | $57,002 |
| Income Deficit | 65 | $0 |
| Wage / Income Gap (%) | 281 | 0.00% |
| Wage / Income Gap ($) | 281 | 100.00¢ per $1 |
| Gini / Inequality Index | 281 | 0.46 |
Earnings by Sex in Lake Ka Ho
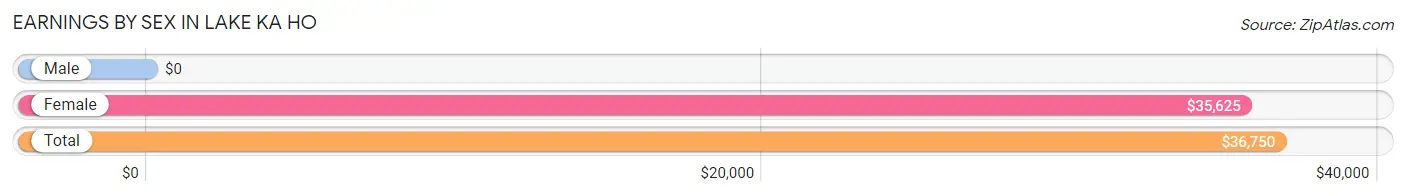
| Sex | Number | Average Earnings |
| Male | 48 (52.7%) | $0 |
| Female | 43 (47.2%) | $35,625 |
| Total | 91 (100.0%) | $36,750 |
Earnings by Sex by Income Bracket in Lake Ka Ho
The most common earnings brackets in Lake Ka Ho are $75,000 to $99,999 for men (10 | 20.8%) and $45,000 to $49,999 for women (11 | 25.6%).
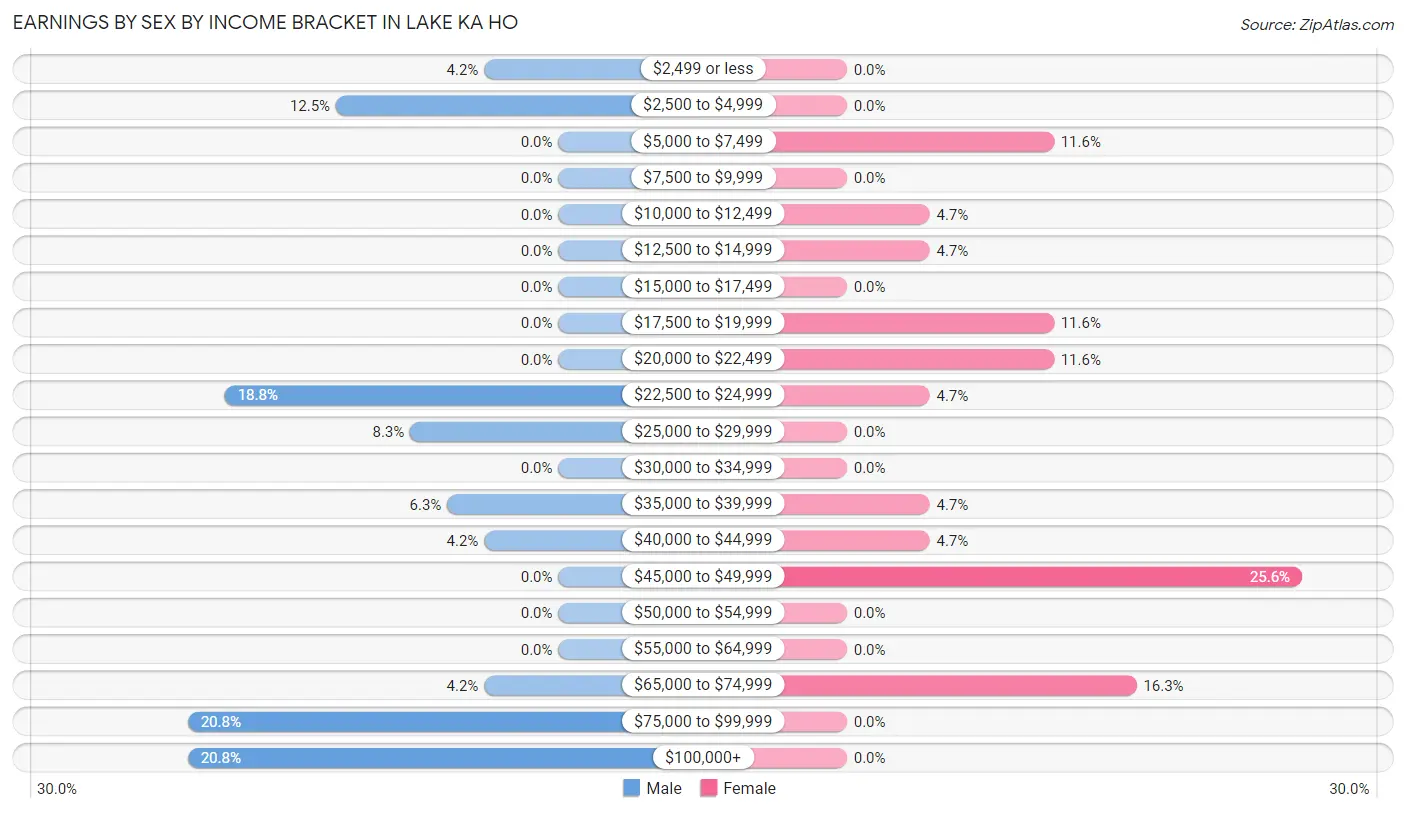
| Income | Male | Female |
| $2,499 or less | 2 (4.2%) | 0 (0.0%) |
| $2,500 to $4,999 | 6 (12.5%) | 0 (0.0%) |
| $5,000 to $7,499 | 0 (0.0%) | 5 (11.6%) |
| $7,500 to $9,999 | 0 (0.0%) | 0 (0.0%) |
| $10,000 to $12,499 | 0 (0.0%) | 2 (4.6%) |
| $12,500 to $14,999 | 0 (0.0%) | 2 (4.6%) |
| $15,000 to $17,499 | 0 (0.0%) | 0 (0.0%) |
| $17,500 to $19,999 | 0 (0.0%) | 5 (11.6%) |
| $20,000 to $22,499 | 0 (0.0%) | 5 (11.6%) |
| $22,500 to $24,999 | 9 (18.8%) | 2 (4.6%) |
| $25,000 to $29,999 | 4 (8.3%) | 0 (0.0%) |
| $30,000 to $34,999 | 0 (0.0%) | 0 (0.0%) |
| $35,000 to $39,999 | 3 (6.2%) | 2 (4.6%) |
| $40,000 to $44,999 | 2 (4.2%) | 2 (4.6%) |
| $45,000 to $49,999 | 0 (0.0%) | 11 (25.6%) |
| $50,000 to $54,999 | 0 (0.0%) | 0 (0.0%) |
| $55,000 to $64,999 | 0 (0.0%) | 0 (0.0%) |
| $65,000 to $74,999 | 2 (4.2%) | 7 (16.3%) |
| $75,000 to $99,999 | 10 (20.8%) | 0 (0.0%) |
| $100,000+ | 10 (20.8%) | 0 (0.0%) |
| Total | 48 (100.0%) | 43 (100.0%) |
Earnings by Sex by Educational Attainment in Lake Ka Ho
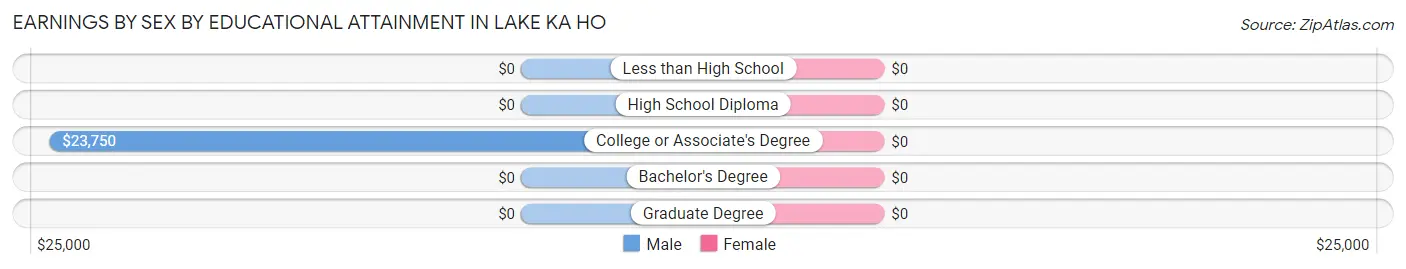
| Educational Attainment | Male Income | Female Income |
| Less than High School | - | - |
| High School Diploma | - | - |
| College or Associate's Degree | $23,750 | $0 |
| Bachelor's Degree | - | - |
| Graduate Degree | - | - |
| Total | - | - |
Family Income in Lake Ka Ho
Family Income Brackets in Lake Ka Ho
According to the Lake Ka Ho family income data, there are 15 families falling into the $35,000 to $49,999 income range, which is the most common income bracket and makes up 23.1% of all families.
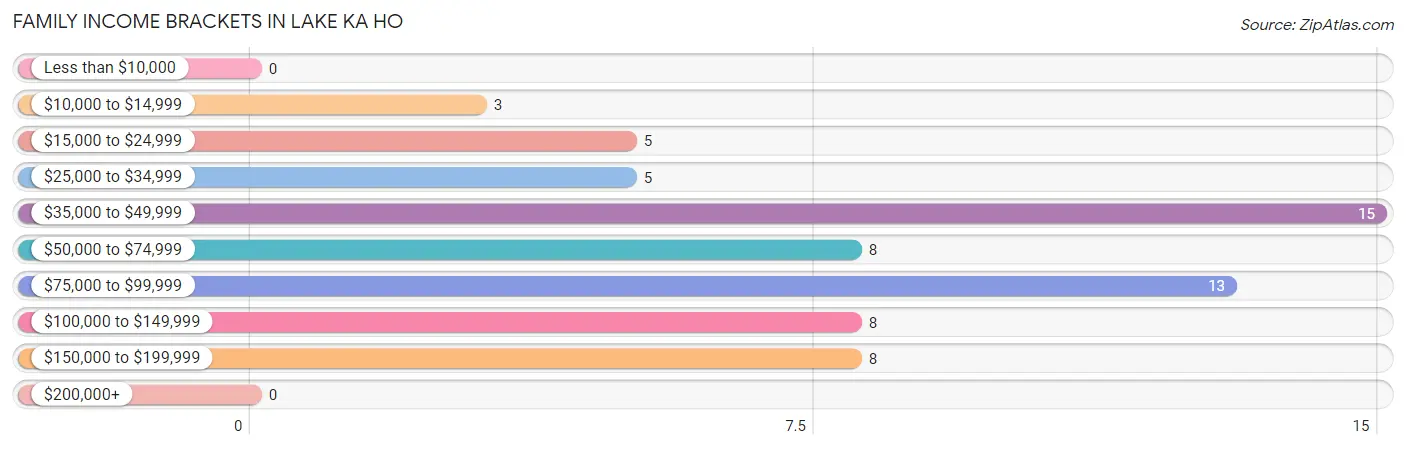
| Income Bracket | # Families | % Families |
| Less than $10,000 | 0 | 0.0% |
| $10,000 to $14,999 | 3 | 4.6% |
| $15,000 to $24,999 | 5 | 7.7% |
| $25,000 to $34,999 | 5 | 7.7% |
| $35,000 to $49,999 | 15 | 23.1% |
| $50,000 to $74,999 | 8 | 12.3% |
| $75,000 to $99,999 | 13 | 20.0% |
| $100,000 to $149,999 | 8 | 12.3% |
| $150,000 to $199,999 | 8 | 12.3% |
| $200,000+ | 0 | 0.0% |
Family Income by Famaliy Size in Lake Ka Ho
5-person families (16 | 24.6%) account for the highest median family income in Lake Ka Ho with $138,750 per family, while 5-person families (16 | 24.6%) have the highest median income of $27,750 per family member.
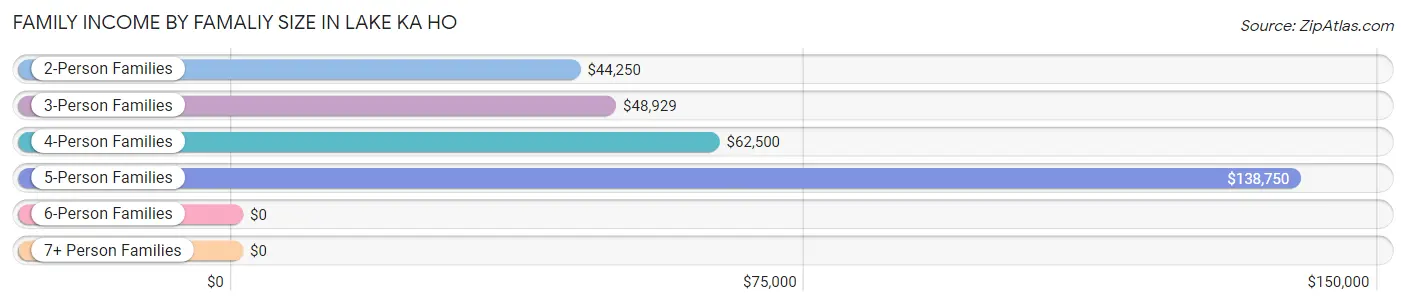
| Income Bracket | # Families | Median Income |
| 2-Person Families | 29 (44.6%) | $44,250 |
| 3-Person Families | 12 (18.5%) | $48,929 |
| 4-Person Families | 8 (12.3%) | $62,500 |
| 5-Person Families | 16 (24.6%) | $138,750 |
| 6-Person Families | 0 (0.0%) | $0 |
| 7+ Person Families | 0 (0.0%) | $0 |
| Total | 65 (100.0%) | $54,063 |
Family Income by Number of Earners in Lake Ka Ho
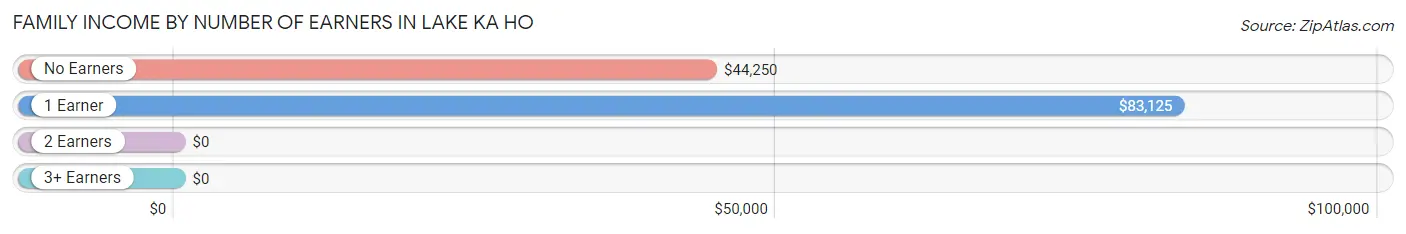
| Number of Earners | # Families | Median Income |
| No Earners | 17 (26.2%) | $44,250 |
| 1 Earner | 29 (44.6%) | $83,125 |
| 2 Earners | 17 (26.2%) | $0 |
| 3+ Earners | 2 (3.1%) | $0 |
| Total | 65 (100.0%) | $54,063 |
Household Income in Lake Ka Ho
Household Income Brackets in Lake Ka Ho
With 24 households falling in the category, the $35,000 to $49,999 income range is the most frequent in Lake Ka Ho, accounting for 21.0% of all households.
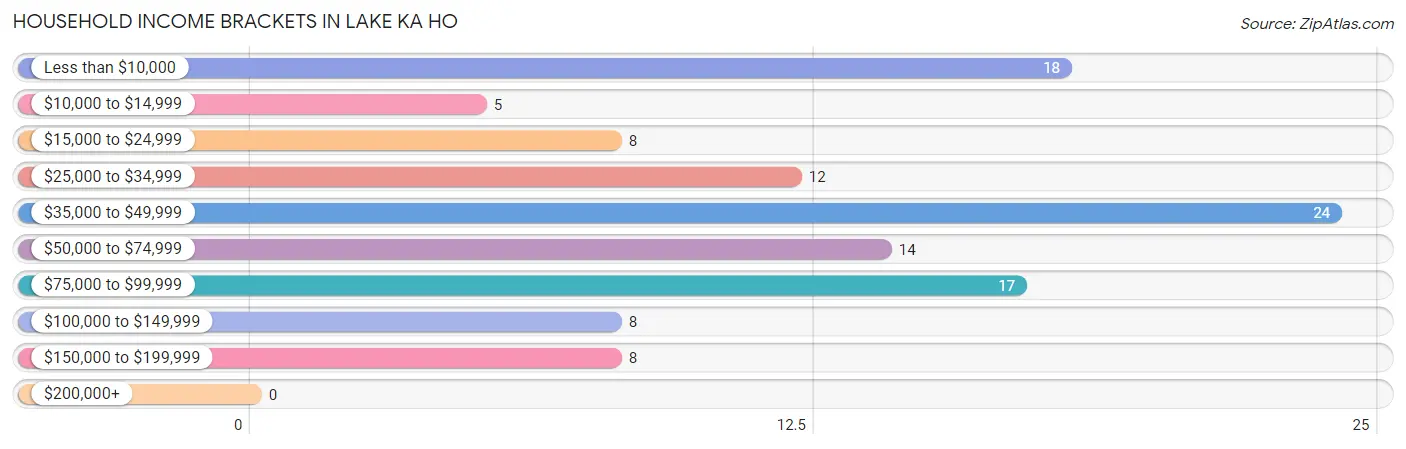
| Income Bracket | # Households | % Households |
| Less than $10,000 | 18 | 15.8% |
| $10,000 to $14,999 | 5 | 4.4% |
| $15,000 to $24,999 | 8 | 7.0% |
| $25,000 to $34,999 | 12 | 10.5% |
| $35,000 to $49,999 | 24 | 21.1% |
| $50,000 to $74,999 | 14 | 12.3% |
| $75,000 to $99,999 | 17 | 14.9% |
| $100,000 to $149,999 | 8 | 7.0% |
| $150,000 to $199,999 | 8 | 7.0% |
| $200,000+ | 0 | 0.0% |
Household Income by Householder Age in Lake Ka Ho
The median household income in Lake Ka Ho is $44,444, with the highest median household income of $51,250 found in the 65+ years age bracket for the primary householder. A total of 30 households (26.3%) fall into this category. Meanwhile, the 15 to 24 years age bracket for the primary householder has the lowest median household income of $0, with 7 households (6.1%) in this group.
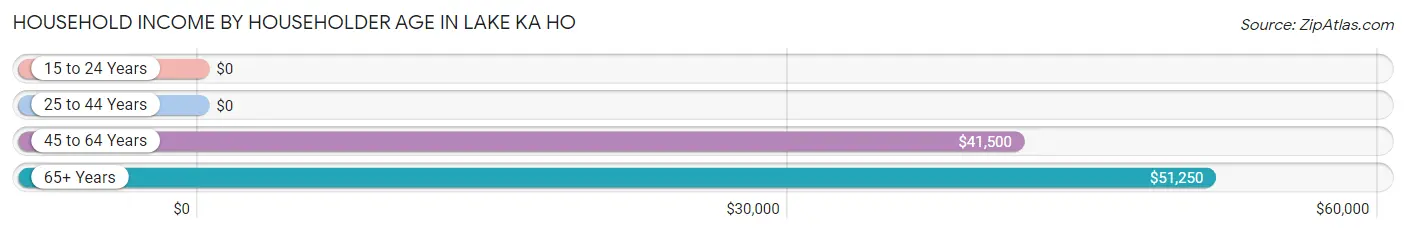
| Income Bracket | # Households | Median Income |
| 15 to 24 Years | 7 (6.1%) | $0 |
| 25 to 44 Years | 19 (16.7%) | $0 |
| 45 to 64 Years | 58 (50.9%) | $41,500 |
| 65+ Years | 30 (26.3%) | $51,250 |
| Total | 114 (100.0%) | $44,444 |
Poverty in Lake Ka Ho
Income Below Poverty by Sex and Age in Lake Ka Ho
With 14.6% poverty level for males and 16.7% for females among the residents of Lake Ka Ho, 35 to 44 year old males and 75 year old and over females are the most vulnerable to poverty, with 7 males (31.8%) and 2 females (100.0%) in their respective age groups living below the poverty level.
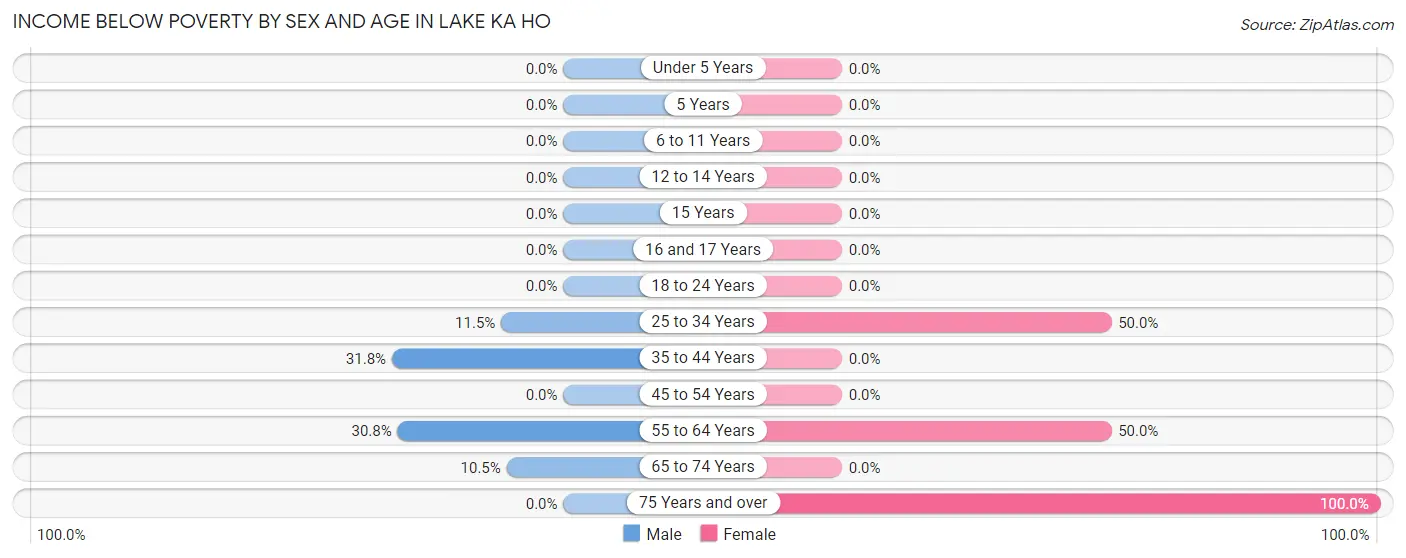
| Age Bracket | Male | Female |
| Under 5 Years | 0 (0.0%) | 0 (0.0%) |
| 5 Years | 0 (0.0%) | 0 (0.0%) |
| 6 to 11 Years | 0 (0.0%) | 0 (0.0%) |
| 12 to 14 Years | 0 (0.0%) | 0 (0.0%) |
| 15 Years | 0 (0.0%) | 0 (0.0%) |
| 16 and 17 Years | 0 (0.0%) | 0 (0.0%) |
| 18 to 24 Years | 0 (0.0%) | 0 (0.0%) |
| 25 to 34 Years | 3 (11.5%) | 2 (50.0%) |
| 35 to 44 Years | 7 (31.8%) | 0 (0.0%) |
| 45 to 54 Years | 0 (0.0%) | 0 (0.0%) |
| 55 to 64 Years | 8 (30.8%) | 20 (50.0%) |
| 65 to 74 Years | 2 (10.5%) | 0 (0.0%) |
| 75 Years and over | 0 (0.0%) | 2 (100.0%) |
| Total | 20 (14.6%) | 24 (16.7%) |
Income Above Poverty by Sex and Age in Lake Ka Ho
According to the poverty statistics in Lake Ka Ho, males aged 6 to 11 years and females aged under 5 years are the age groups that are most secure financially, with 100.0% of males and 100.0% of females in these age groups living above the poverty line.
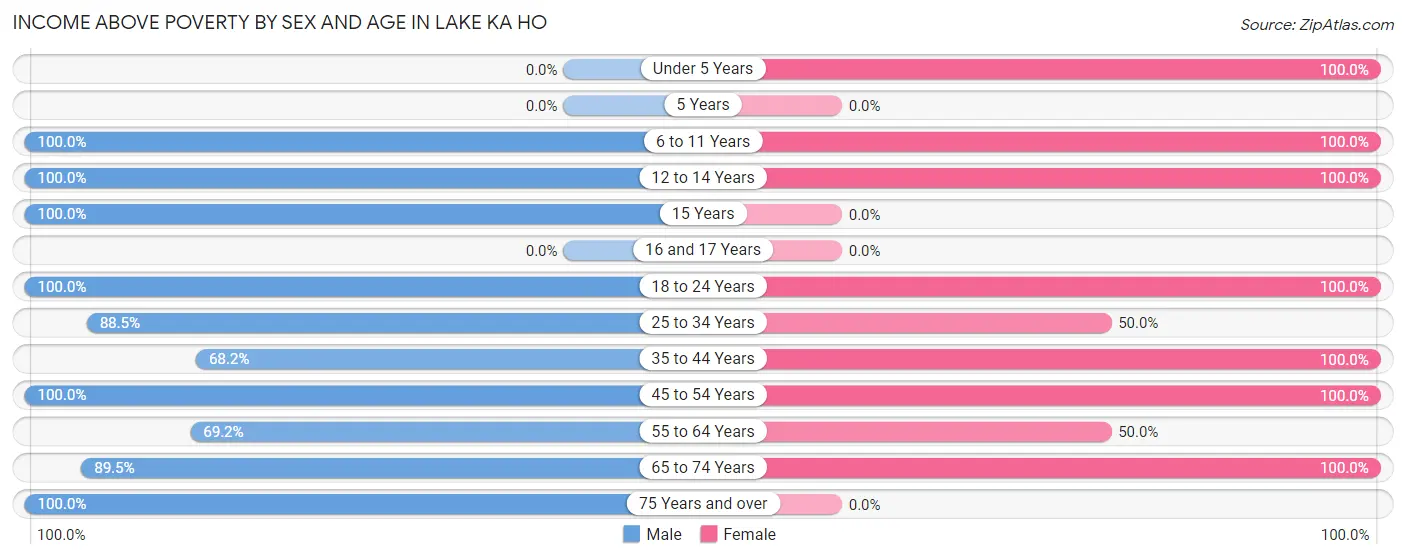
| Age Bracket | Male | Female |
| Under 5 Years | 0 (0.0%) | 2 (100.0%) |
| 5 Years | 0 (0.0%) | 0 (0.0%) |
| 6 to 11 Years | 6 (100.0%) | 14 (100.0%) |
| 12 to 14 Years | 8 (100.0%) | 19 (100.0%) |
| 15 Years | 5 (100.0%) | 0 (0.0%) |
| 16 and 17 Years | 0 (0.0%) | 0 (0.0%) |
| 18 to 24 Years | 8 (100.0%) | 7 (100.0%) |
| 25 to 34 Years | 23 (88.5%) | 2 (50.0%) |
| 35 to 44 Years | 15 (68.2%) | 14 (100.0%) |
| 45 to 54 Years | 11 (100.0%) | 24 (100.0%) |
| 55 to 64 Years | 18 (69.2%) | 20 (50.0%) |
| 65 to 74 Years | 17 (89.5%) | 18 (100.0%) |
| 75 Years and over | 6 (100.0%) | 0 (0.0%) |
| Total | 117 (85.4%) | 120 (83.3%) |
Income Below Poverty Among Married-Couple Families in Lake Ka Ho
The poverty statistics for married-couple families in Lake Ka Ho show that 6.7% or 3 of the total 45 families live below the poverty line. Families with no children have the highest poverty rate of 16.7%, comprising of 3 families. On the other hand, families with 1 or 2 children have the lowest poverty rate of 0.0%, which includes 0 families.
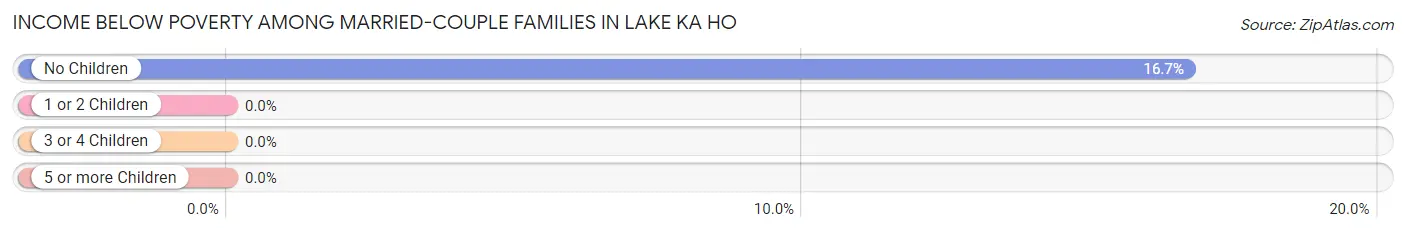
| Children | Above Poverty | Below Poverty |
| No Children | 15 (83.3%) | 3 (16.7%) |
| 1 or 2 Children | 13 (100.0%) | 0 (0.0%) |
| 3 or 4 Children | 14 (100.0%) | 0 (0.0%) |
| 5 or more Children | 0 (0.0%) | 0 (0.0%) |
| Total | 42 (93.3%) | 3 (6.7%) |
Income Below Poverty Among Single-Parent Households in Lake Ka Ho
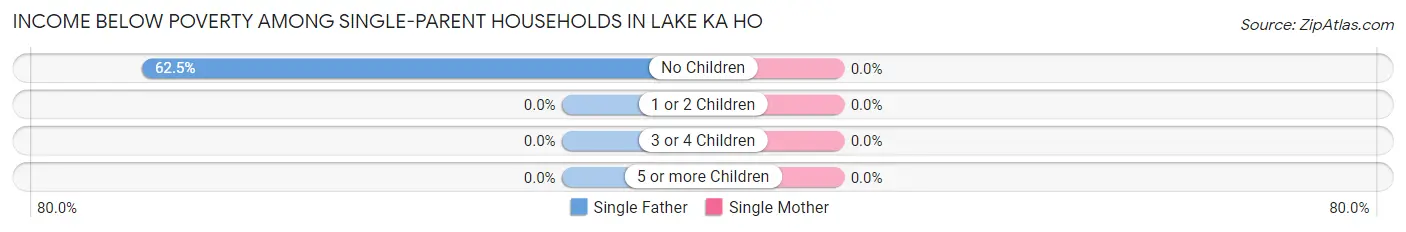
| Children | Single Father | Single Mother |
| No Children | 5 (62.5%) | 0 (0.0%) |
| 1 or 2 Children | 0 (0.0%) | 0 (0.0%) |
| 3 or 4 Children | 0 (0.0%) | 0 (0.0%) |
| 5 or more Children | 0 (0.0%) | 0 (0.0%) |
| Total | 5 (62.5%) | 0 (0.0%) |
Income Below Poverty Among Married-Couple vs Single-Parent Households in Lake Ka Ho
The poverty data for Lake Ka Ho shows that 3 of the married-couple family households (6.7%) and 5 of the single-parent households (25.0%) are living below the poverty level. Within the married-couple family households, those with no children have the highest poverty rate, with 3 households (16.7%) falling below the poverty line. Among the single-parent households, those with no children have the highest poverty rate, with 5 household (25.0%) living below poverty.
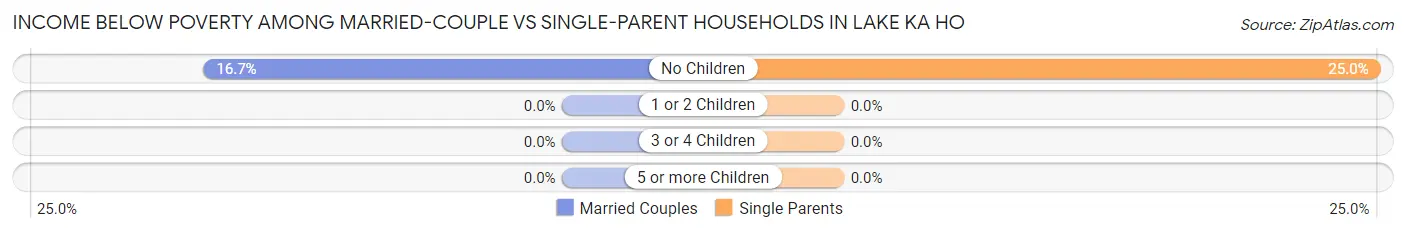
| Children | Married-Couple Families | Single-Parent Households |
| No Children | 3 (16.7%) | 5 (25.0%) |
| 1 or 2 Children | 0 (0.0%) | 0 (0.0%) |
| 3 or 4 Children | 0 (0.0%) | 0 (0.0%) |
| 5 or more Children | 0 (0.0%) | 0 (0.0%) |
| Total | 3 (6.7%) | 5 (25.0%) |
Race in Lake Ka Ho
The most populous races in Lake Ka Ho are White / Caucasian (276 | 98.2%), and Two or more Races (5 | 1.8%).
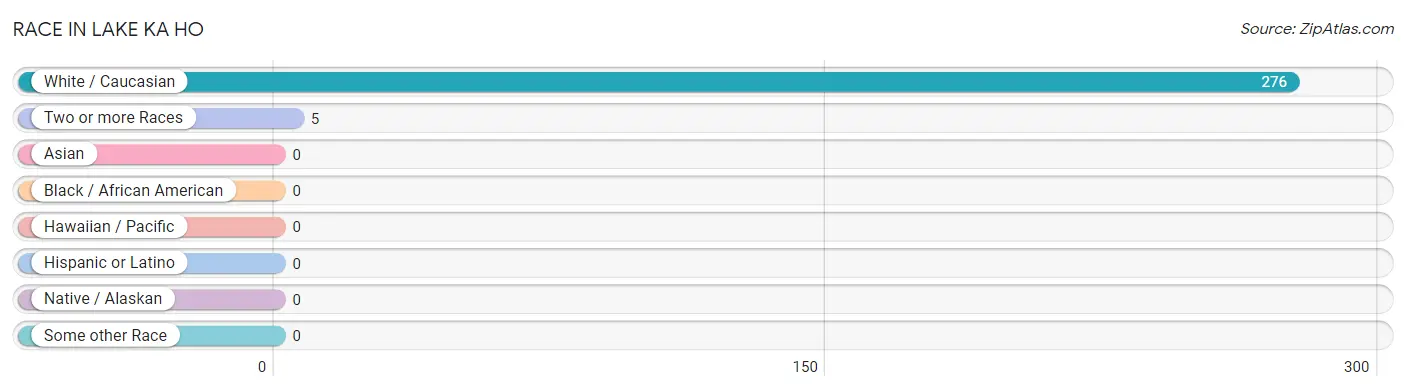
| Race | # Population | % Population |
| Asian | 0 | 0.0% |
| Black / African American | 0 | 0.0% |
| Hawaiian / Pacific | 0 | 0.0% |
| Hispanic or Latino | 0 | 0.0% |
| Native / Alaskan | 0 | 0.0% |
| White / Caucasian | 276 | 98.2% |
| Two or more Races | 5 | 1.8% |
| Some other Race | 0 | 0.0% |
| Total | 281 | 100.0% |
Ancestry in Lake Ka Ho
The most populous ancestries reported in Lake Ka Ho are German (42 | 14.9%), English (33 | 11.7%), American (21 | 7.5%), Irish (20 | 7.1%), and Scottish (18 | 6.4%), together accounting for 47.7% of all Lake Ka Ho residents.
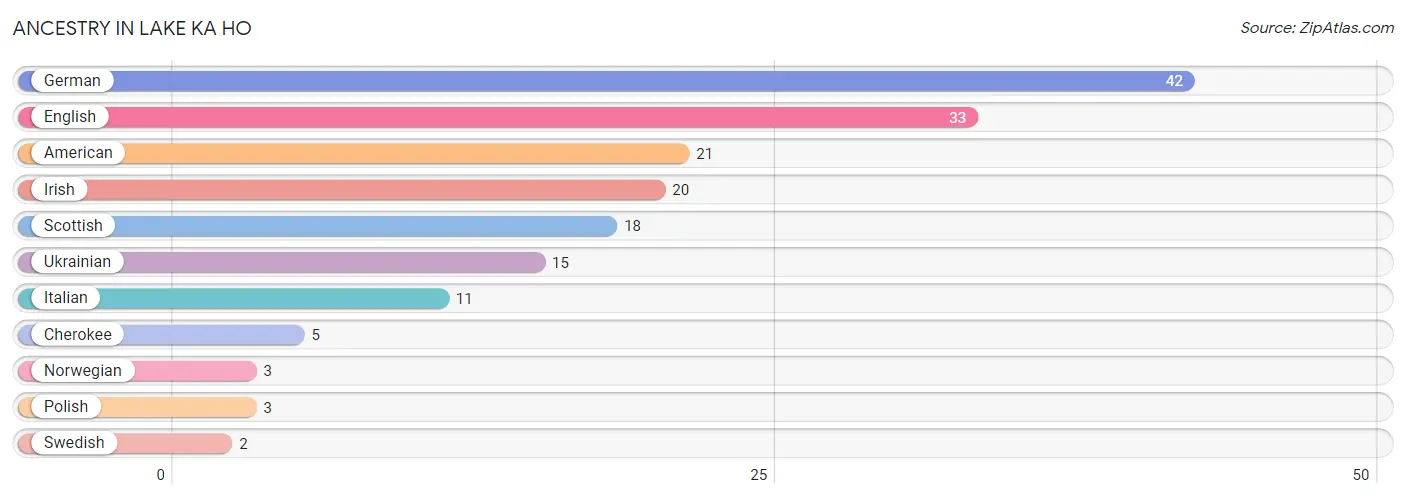
| Ancestry | # Population | % Population |
| American | 21 | 7.5% |
| Cherokee | 5 | 1.8% |
| English | 33 | 11.7% |
| German | 42 | 14.9% |
| Irish | 20 | 7.1% |
| Italian | 11 | 3.9% |
| Norwegian | 3 | 1.1% |
| Polish | 3 | 1.1% |
| Scottish | 18 | 6.4% |
| Swedish | 2 | 0.7% |
| Ukrainian | 15 | 5.3% | View All 11 Rows |
Immigrants in Lake Ka Ho

| Immigration Origin | # Population | % Population | View All 0 Rows |
Sex and Age in Lake Ka Ho
Sex and Age in Lake Ka Ho
The most populous age groups in Lake Ka Ho are 30 to 34 Years (26 | 19.0%) for men and 55 to 59 Years (29 | 20.1%) for women.
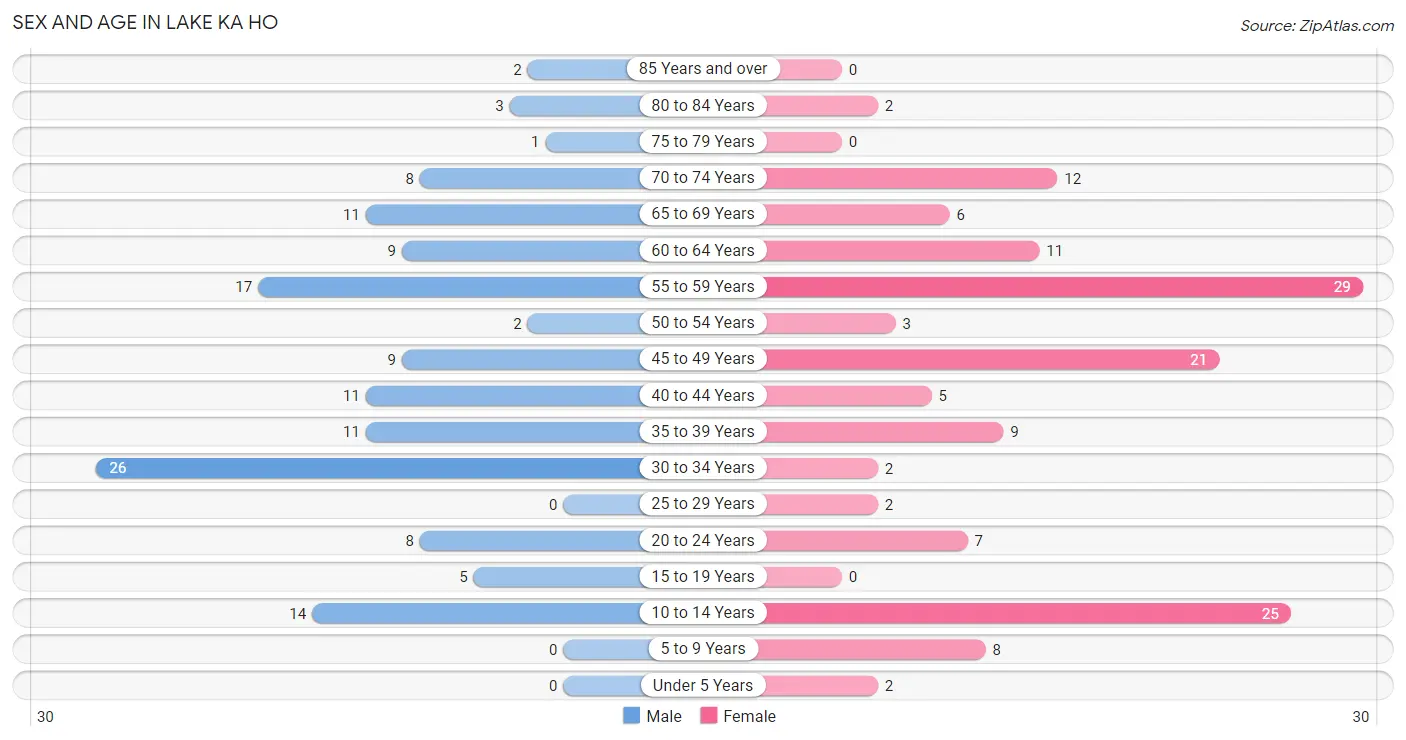
| Age Bracket | Male | Female |
| Under 5 Years | 0 (0.0%) | 2 (1.4%) |
| 5 to 9 Years | 0 (0.0%) | 8 (5.6%) |
| 10 to 14 Years | 14 (10.2%) | 25 (17.4%) |
| 15 to 19 Years | 5 (3.6%) | 0 (0.0%) |
| 20 to 24 Years | 8 (5.8%) | 7 (4.9%) |
| 25 to 29 Years | 0 (0.0%) | 2 (1.4%) |
| 30 to 34 Years | 26 (19.0%) | 2 (1.4%) |
| 35 to 39 Years | 11 (8.0%) | 9 (6.2%) |
| 40 to 44 Years | 11 (8.0%) | 5 (3.5%) |
| 45 to 49 Years | 9 (6.6%) | 21 (14.6%) |
| 50 to 54 Years | 2 (1.5%) | 3 (2.1%) |
| 55 to 59 Years | 17 (12.4%) | 29 (20.1%) |
| 60 to 64 Years | 9 (6.6%) | 11 (7.6%) |
| 65 to 69 Years | 11 (8.0%) | 6 (4.2%) |
| 70 to 74 Years | 8 (5.8%) | 12 (8.3%) |
| 75 to 79 Years | 1 (0.7%) | 0 (0.0%) |
| 80 to 84 Years | 3 (2.2%) | 2 (1.4%) |
| 85 Years and over | 2 (1.5%) | 0 (0.0%) |
| Total | 137 (100.0%) | 144 (100.0%) |
Families and Households in Lake Ka Ho
Median Family Size in Lake Ka Ho
The median family size in Lake Ka Ho is 3.42 persons per family, with single female/mother families (12 | 18.5%) accounting for the largest median family size of 3.67 persons per family. On the other hand, single male/father families (8 | 12.3%) represent the smallest median family size with 2.25 persons per family.
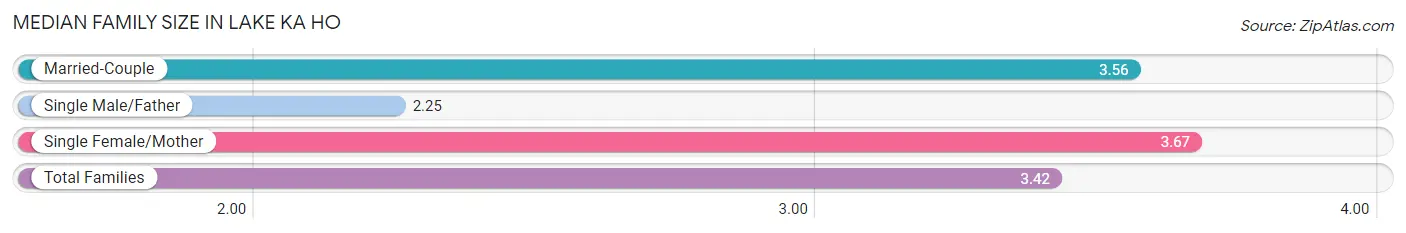
| Family Type | # Families | Family Size |
| Married-Couple | 45 (69.2%) | 3.56 |
| Single Male/Father | 8 (12.3%) | 2.25 |
| Single Female/Mother | 12 (18.5%) | 3.67 |
| Total Families | 65 (100.0%) | 3.42 |
Median Household Size in Lake Ka Ho
The median household size in Lake Ka Ho is 2.46 persons per household, with single female/mother households (12 | 10.5%) accounting for the largest median household size of 3.67 persons per household. non-family households (49 | 43.0%) represent the smallest median household size with 1.10 persons per household.
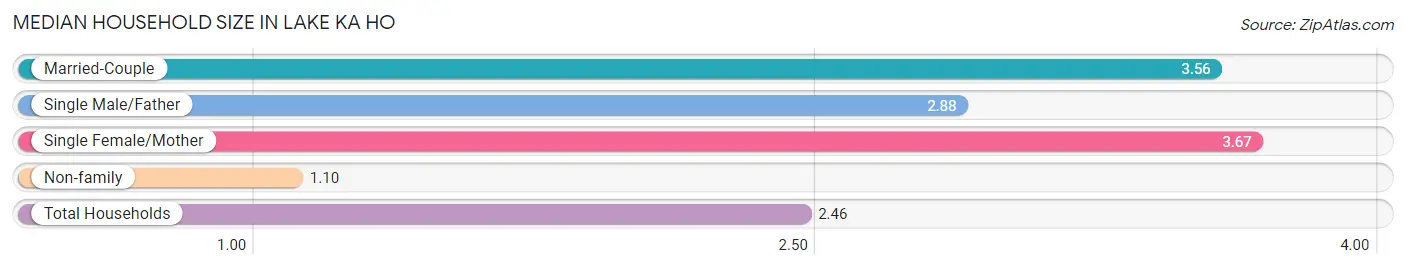
| Household Type | # Households | Household Size |
| Married-Couple | 45 (39.5%) | 3.56 |
| Single Male/Father | 8 (7.0%) | 2.88 |
| Single Female/Mother | 12 (10.5%) | 3.67 |
| Non-family | 49 (43.0%) | 1.10 |
| Total Households | 114 (100.0%) | 2.46 |
Household Size by Marriage Status in Lake Ka Ho
Out of a total of 114 households in Lake Ka Ho, 65 (57.0%) are family households, while 49 (43.0%) are nonfamily households. The most numerous type of family households are 2-person households, comprising 24, and the most common type of nonfamily households are 1-person households, comprising 45.
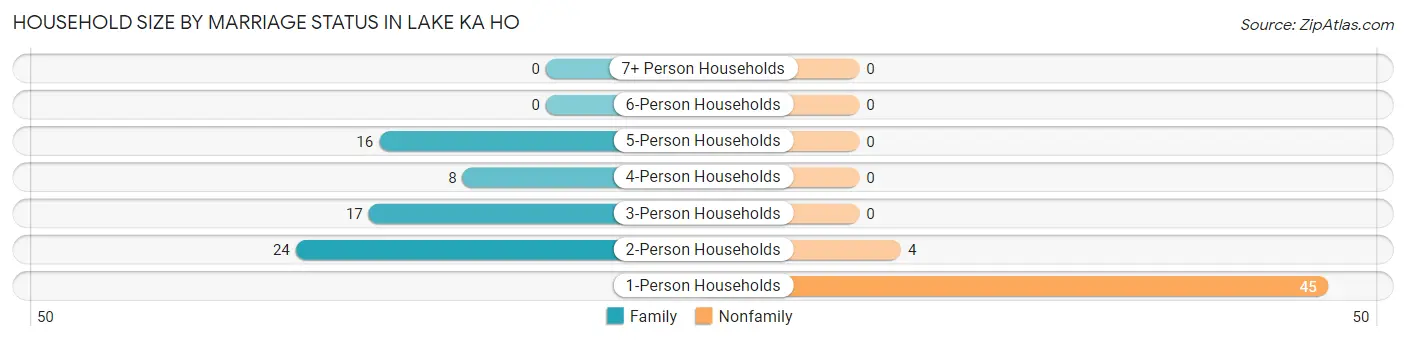
| Household Size | Family Households | Nonfamily Households |
| 1-Person Households | - | 45 (39.5%) |
| 2-Person Households | 24 (21.0%) | 4 (3.5%) |
| 3-Person Households | 17 (14.9%) | 0 (0.0%) |
| 4-Person Households | 8 (7.0%) | 0 (0.0%) |
| 5-Person Households | 16 (14.0%) | 0 (0.0%) |
| 6-Person Households | 0 (0.0%) | 0 (0.0%) |
| 7+ Person Households | 0 (0.0%) | 0 (0.0%) |
| Total | 65 (57.0%) | 49 (43.0%) |
Female Fertility in Lake Ka Ho
Fertility by Age in Lake Ka Ho
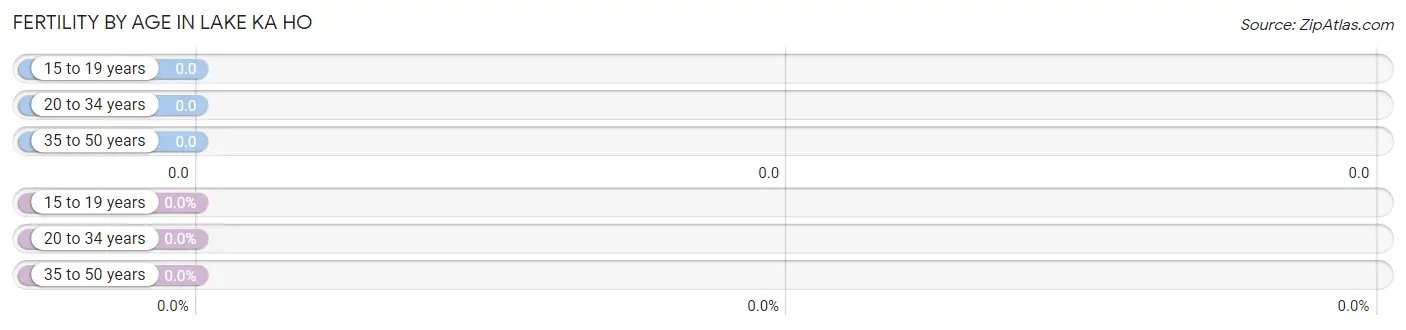
| Age Bracket | Women with Births | Births / 1,000 Women |
| 15 to 19 years | 0 (0.0%) | 0.0 |
| 20 to 34 years | 0 (0.0%) | 0.0 |
| 35 to 50 years | 0 (0.0%) | 0.0 |
| Total | 0 (0.0%) | 0.0 |
Fertility by Age by Marriage Status in Lake Ka Ho
| Age Bracket | Married | Unmarried |
| 15 to 19 years | 0 (0.0%) | 0 (0.0%) |
| 20 to 34 years | 0 (0.0%) | 0 (0.0%) |
| 35 to 50 years | 0 (0.0%) | 0 (0.0%) |
| Total | 0 (0.0%) | 0 (0.0%) |
Fertility by Education in Lake Ka Ho
| Educational Attainment | Women with Births | Births / 1,000 Women |
| Less than High School | 0 (0.0%) | 0.0 |
| High School Diploma | 0 (0.0%) | 0.0 |
| College or Associate's Degree | 0 (0.0%) | 0.0 |
| Bachelor's Degree | 0 (0.0%) | 0.0 |
| Graduate Degree | 0 (0.0%) | 0.0 |
| Total | 0 (0.0%) | 0.0 |
Fertility by Education by Marriage Status in Lake Ka Ho
| Educational Attainment | Married | Unmarried |
| Less than High School | 0 (0.0%) | 0 (0.0%) |
| High School Diploma | 0 (0.0%) | 0 (0.0%) |
| College or Associate's Degree | 0 (0.0%) | 0 (0.0%) |
| Bachelor's Degree | 0 (0.0%) | 0 (0.0%) |
| Graduate Degree | 0 (0.0%) | 0 (0.0%) |
| Total | 0 (0.0%) | 0 (0.0%) |
Employment Characteristics in Lake Ka Ho
Employment by Class of Employer in Lake Ka Ho
Among the 89 employed individuals in Lake Ka Ho, private company employees (76 | 85.4%), self-employed (not incorporated) (5 | 5.6%), and not-for-profit organizations (4 | 4.5%) make up the most common classes of employment.
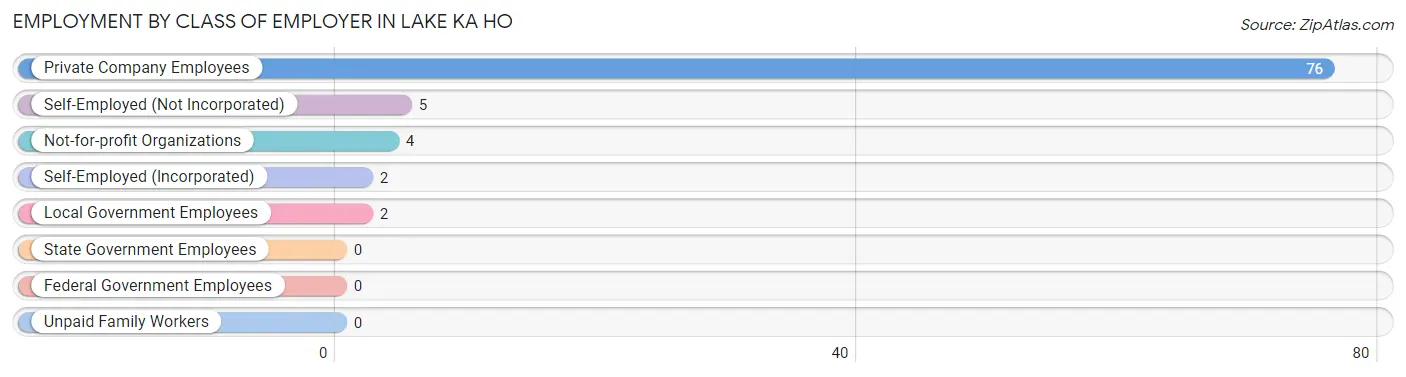
| Employer Class | # Employees | % Employees |
| Private Company Employees | 76 | 85.4% |
| Self-Employed (Incorporated) | 2 | 2.2% |
| Self-Employed (Not Incorporated) | 5 | 5.6% |
| Not-for-profit Organizations | 4 | 4.5% |
| Local Government Employees | 2 | 2.2% |
| State Government Employees | 0 | 0.0% |
| Federal Government Employees | 0 | 0.0% |
| Unpaid Family Workers | 0 | 0.0% |
| Total | 89 | 100.0% |
Employment Status by Age in Lake Ka Ho
According to the labor force statistics for Lake Ka Ho, out of the total population over 16 years of age (227), 42.3% or 96 individuals are in the labor force, with 7.3% or 7 of them unemployed. The age group with the highest labor force participation rate is 25 to 29 years, with 100.0% or 2 individuals in the labor force. Within the labor force, the 20 to 24 years age range has the highest percentage of unemployed individuals, with 100.0% or 7 of them being unemployed.
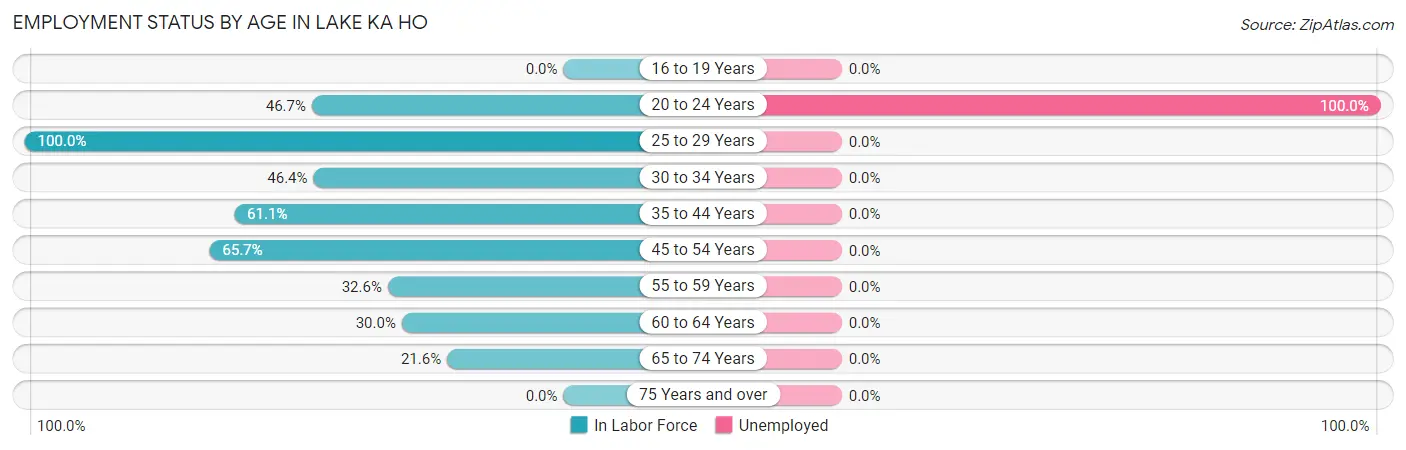
| Age Bracket | In Labor Force | Unemployed |
| 16 to 19 Years | 0 (0.0%) | 0 (0.0%) |
| 20 to 24 Years | 7 (46.7%) | 7 (100.0%) |
| 25 to 29 Years | 2 (100.0%) | 0 (0.0%) |
| 30 to 34 Years | 13 (46.4%) | 0 (0.0%) |
| 35 to 44 Years | 22 (61.1%) | 0 (0.0%) |
| 45 to 54 Years | 23 (65.7%) | 0 (0.0%) |
| 55 to 59 Years | 15 (32.6%) | 0 (0.0%) |
| 60 to 64 Years | 6 (30.0%) | 0 (0.0%) |
| 65 to 74 Years | 8 (21.6%) | 0 (0.0%) |
| 75 Years and over | 0 (0.0%) | 0 (0.0%) |
| Total | 96 (42.3%) | 7 (7.3%) |
Employment Status by Educational Attainment in Lake Ka Ho
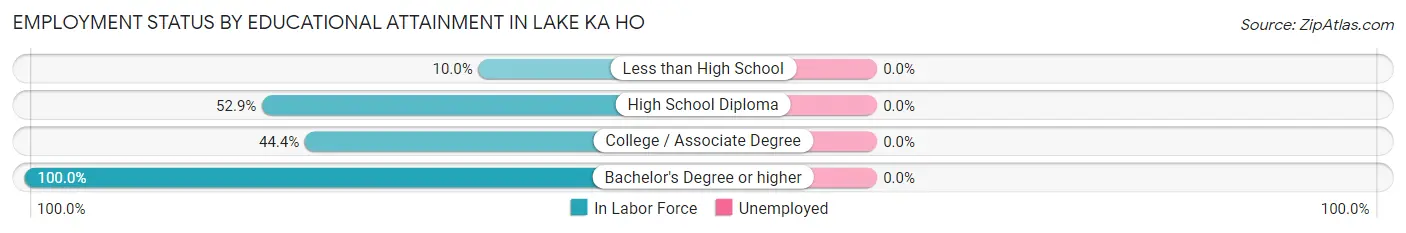
| Educational Attainment | In Labor Force | Unemployed |
| Less than High School | 2 (10.0%) | 0 (0.0%) |
| High School Diploma | 37 (52.9%) | 0 (0.0%) |
| College / Associate Degree | 28 (44.4%) | 0 (0.0%) |
| Bachelor's Degree or higher | 14 (100.0%) | 0 (0.0%) |
| Total | 81 (48.5%) | 0 (0.0%) |
Employment Occupations by Sex in Lake Ka Ho
Management, Business, Science and Arts Occupations
The most common Management, Business, Science and Arts occupations in Lake Ka Ho are Management (13 | 14.6%), Community & Social Service (10 | 11.2%), Health Diagnosing & Treating (9 | 10.1%), Arts, Media & Entertainment (8 | 9.0%), and Computers, Engineering & Science (2 | 2.2%).
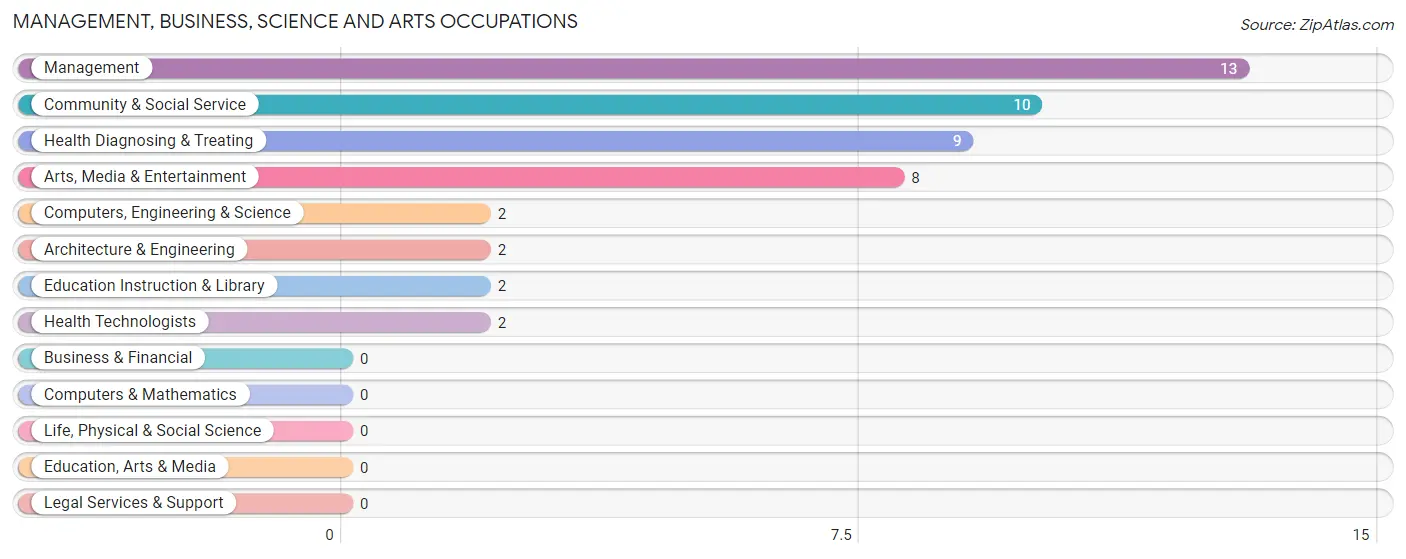
Management, Business, Science and Arts Occupations by Sex
Within the Management, Business, Science and Arts occupations in Lake Ka Ho, the most male-oriented occupations are Arts, Media & Entertainment (100.0%), Community & Social Service (80.0%), and Management (15.4%), while the most female-oriented occupations are Computers, Engineering & Science (100.0%), Architecture & Engineering (100.0%), and Education Instruction & Library (100.0%).
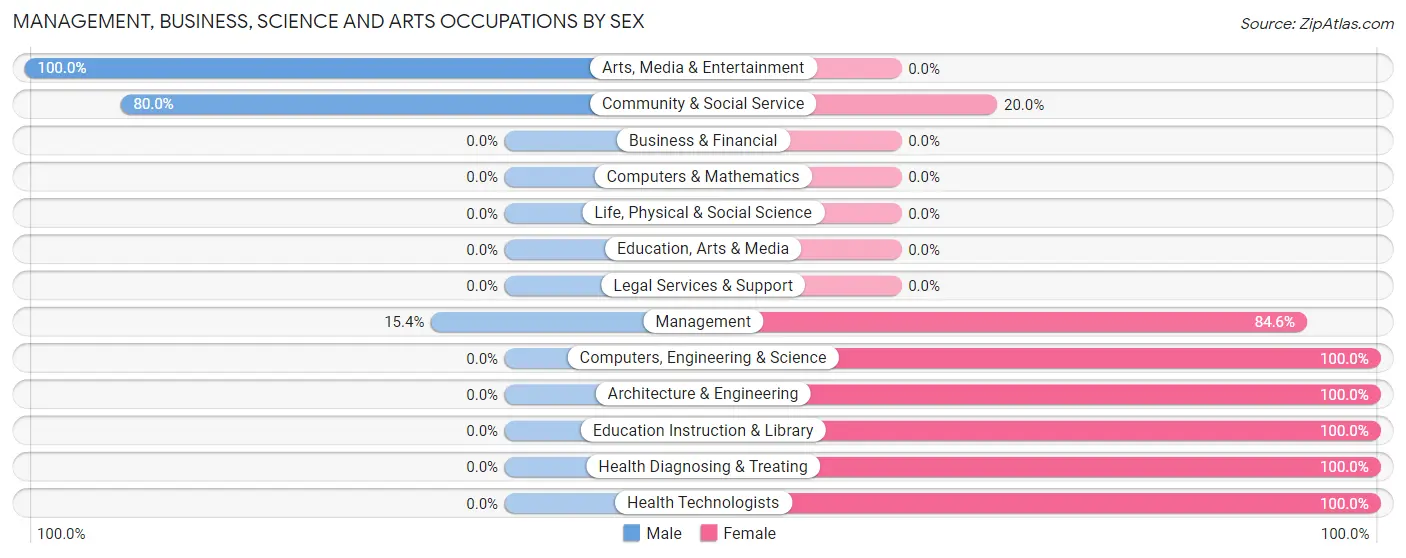
| Occupation | Male | Female |
| Management | 2 (15.4%) | 11 (84.6%) |
| Business & Financial | 0 (0.0%) | 0 (0.0%) |
| Computers, Engineering & Science | 0 (0.0%) | 2 (100.0%) |
| Computers & Mathematics | 0 (0.0%) | 0 (0.0%) |
| Architecture & Engineering | 0 (0.0%) | 2 (100.0%) |
| Life, Physical & Social Science | 0 (0.0%) | 0 (0.0%) |
| Community & Social Service | 8 (80.0%) | 2 (20.0%) |
| Education, Arts & Media | 0 (0.0%) | 0 (0.0%) |
| Legal Services & Support | 0 (0.0%) | 0 (0.0%) |
| Education Instruction & Library | 0 (0.0%) | 2 (100.0%) |
| Arts, Media & Entertainment | 8 (100.0%) | 0 (0.0%) |
| Health Diagnosing & Treating | 0 (0.0%) | 9 (100.0%) |
| Health Technologists | 0 (0.0%) | 2 (100.0%) |
| Total (Category) | 10 (29.4%) | 24 (70.6%) |
| Total (Overall) | 46 (51.7%) | 43 (48.3%) |
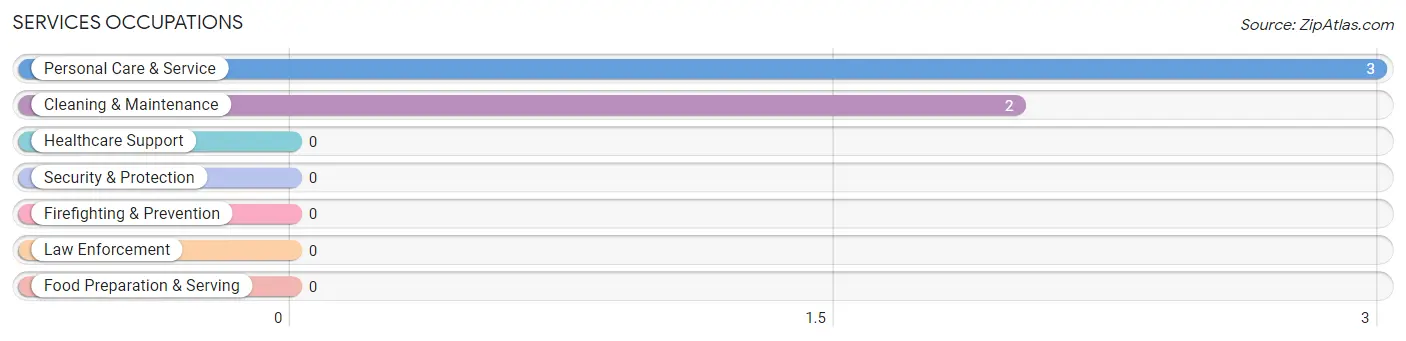
Services Occupations
The most common Services occupations in Lake Ka Ho are Personal Care & Service (3 | 3.4%), and Cleaning & Maintenance (2 | 2.2%).
Services Occupations by Sex
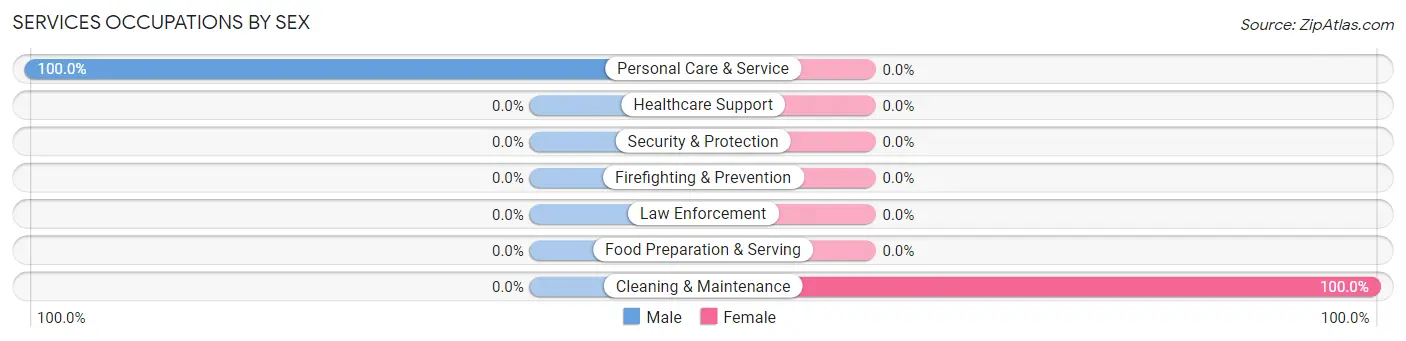
| Occupation | Male | Female |
| Healthcare Support | 0 (0.0%) | 0 (0.0%) |
| Security & Protection | 0 (0.0%) | 0 (0.0%) |
| Firefighting & Prevention | 0 (0.0%) | 0 (0.0%) |
| Law Enforcement | 0 (0.0%) | 0 (0.0%) |
| Food Preparation & Serving | 0 (0.0%) | 0 (0.0%) |
| Cleaning & Maintenance | 0 (0.0%) | 2 (100.0%) |
| Personal Care & Service | 3 (100.0%) | 0 (0.0%) |
| Total (Category) | 3 (60.0%) | 2 (40.0%) |
| Total (Overall) | 46 (51.7%) | 43 (48.3%) |
Sales and Office Occupations
The most common Sales and Office occupations in Lake Ka Ho are Sales & Related (8 | 9.0%), and Office & Administration (6 | 6.7%).
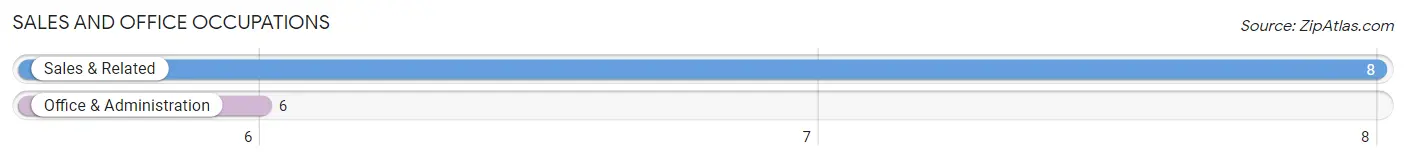
Sales and Office Occupations by Sex
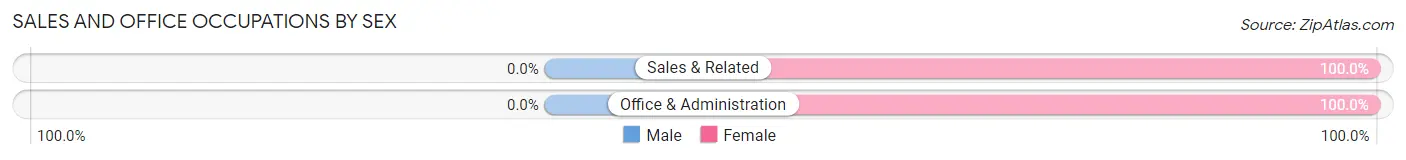
| Occupation | Male | Female |
| Sales & Related | 0 (0.0%) | 8 (100.0%) |
| Office & Administration | 0 (0.0%) | 6 (100.0%) |
| Total (Category) | 0 (0.0%) | 14 (100.0%) |
| Total (Overall) | 46 (51.7%) | 43 (48.3%) |
Natural Resources, Construction and Maintenance Occupations
The most common Natural Resources, Construction and Maintenance occupations in Lake Ka Ho are Construction & Extraction (4 | 4.5%), and Installation, Maintenance & Repair (2 | 2.2%).
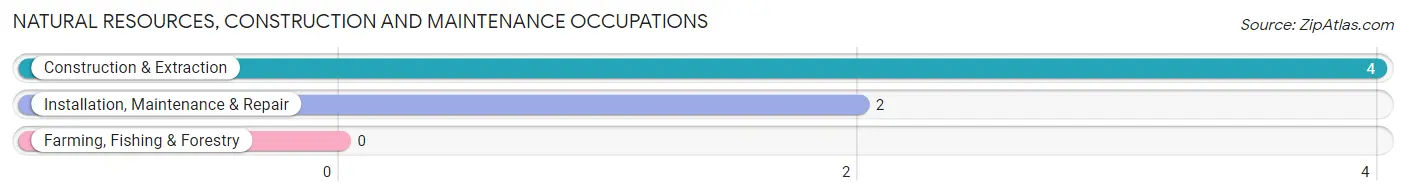
Natural Resources, Construction and Maintenance Occupations by Sex
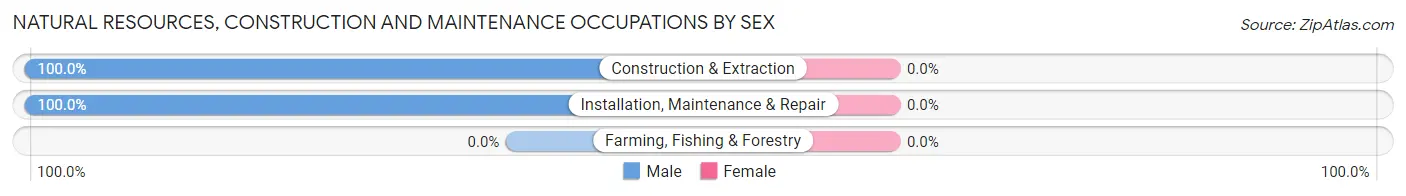
| Occupation | Male | Female |
| Farming, Fishing & Forestry | 0 (0.0%) | 0 (0.0%) |
| Construction & Extraction | 4 (100.0%) | 0 (0.0%) |
| Installation, Maintenance & Repair | 2 (100.0%) | 0 (0.0%) |
| Total (Category) | 6 (100.0%) | 0 (0.0%) |
| Total (Overall) | 46 (51.7%) | 43 (48.3%) |
Production, Transportation and Moving Occupations
The most common Production, Transportation and Moving occupations in Lake Ka Ho are Production (12 | 13.5%), Material Moving (10 | 11.2%), and Transportation (8 | 9.0%).
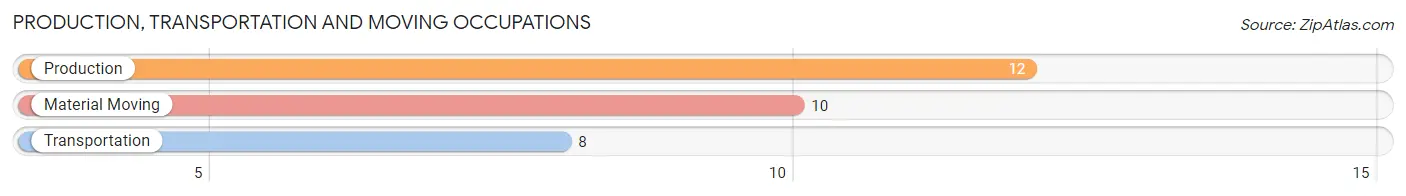
Production, Transportation and Moving Occupations by Sex
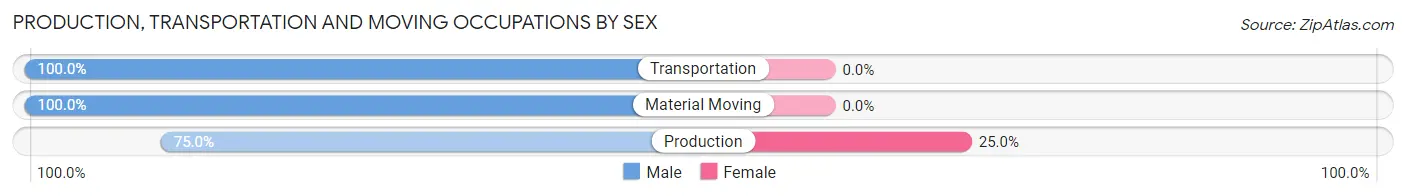
| Occupation | Male | Female |
| Production | 9 (75.0%) | 3 (25.0%) |
| Transportation | 8 (100.0%) | 0 (0.0%) |
| Material Moving | 10 (100.0%) | 0 (0.0%) |
| Total (Category) | 27 (90.0%) | 3 (10.0%) |
| Total (Overall) | 46 (51.7%) | 43 (48.3%) |
Employment Industries by Sex in Lake Ka Ho
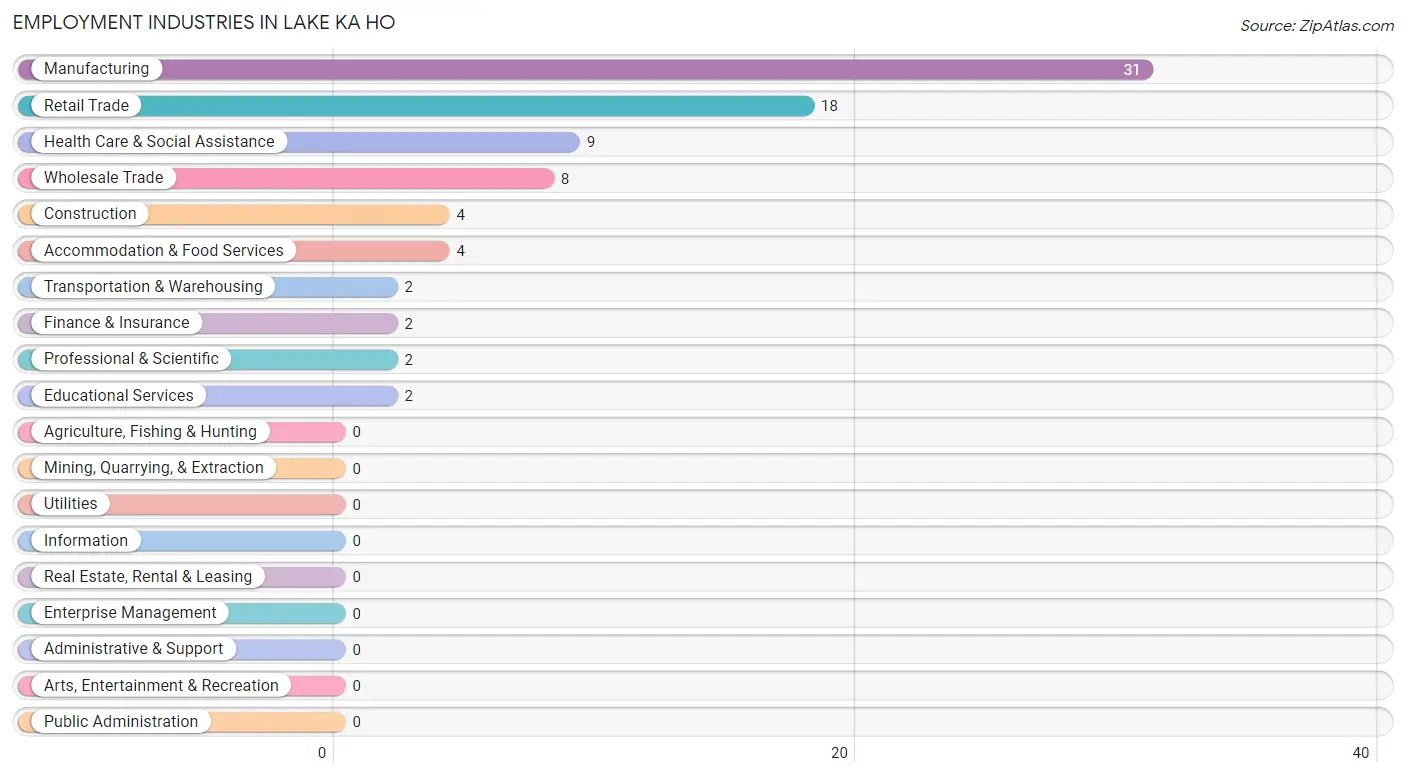
Employment Industries in Lake Ka Ho
The major employment industries in Lake Ka Ho include Manufacturing (31 | 34.8%), Retail Trade (18 | 20.2%), Health Care & Social Assistance (9 | 10.1%), Wholesale Trade (8 | 9.0%), and Construction (4 | 4.5%).
Employment Industries by Sex in Lake Ka Ho
The Lake Ka Ho industries that see more men than women are Construction (100.0%), Wholesale Trade (100.0%), and Transportation & Warehousing (100.0%), whereas the industries that tend to have a higher number of women are Finance & Insurance (100.0%), Professional & Scientific (100.0%), and Educational Services (100.0%).
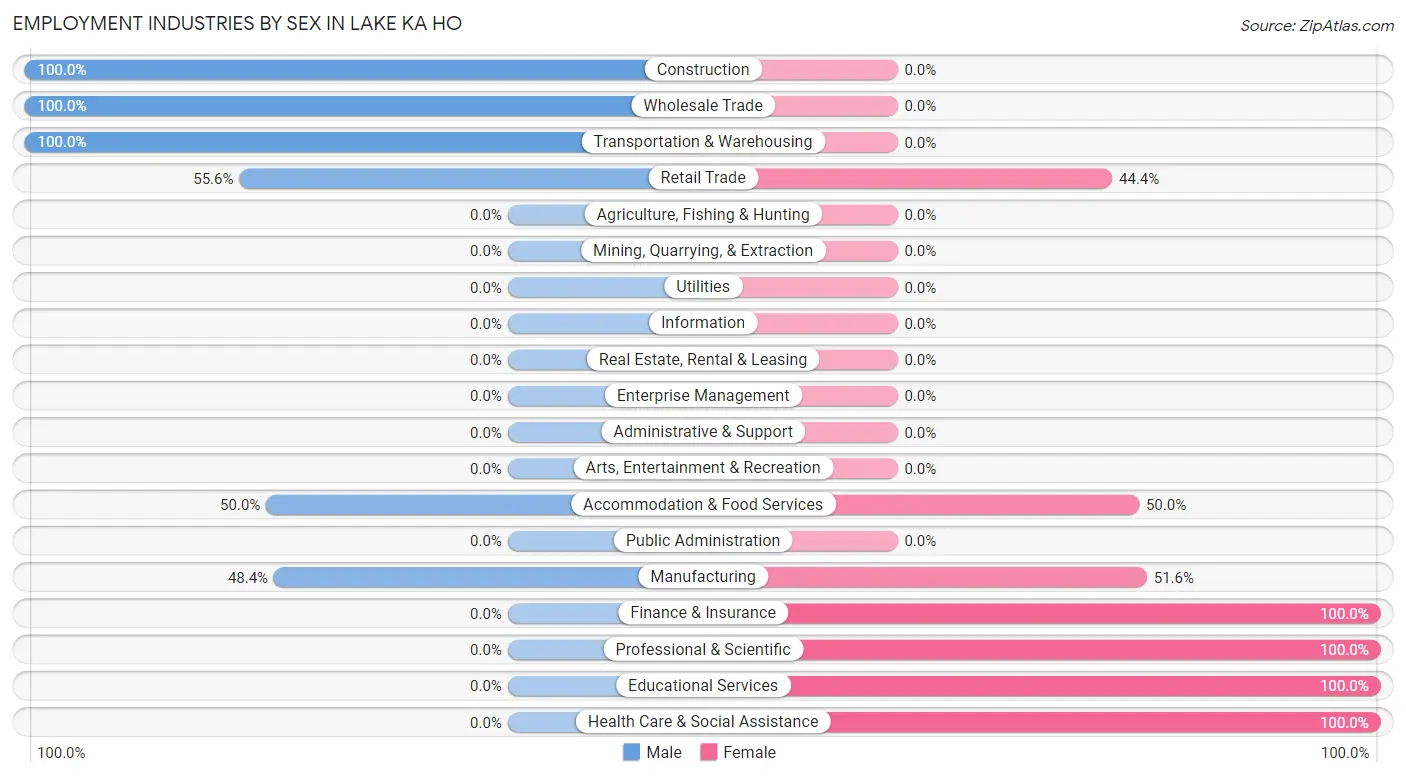
| Industry | Male | Female |
| Agriculture, Fishing & Hunting | 0 (0.0%) | 0 (0.0%) |
| Mining, Quarrying, & Extraction | 0 (0.0%) | 0 (0.0%) |
| Construction | 4 (100.0%) | 0 (0.0%) |
| Manufacturing | 15 (48.4%) | 16 (51.6%) |
| Wholesale Trade | 8 (100.0%) | 0 (0.0%) |
| Retail Trade | 10 (55.6%) | 8 (44.4%) |
| Transportation & Warehousing | 2 (100.0%) | 0 (0.0%) |
| Utilities | 0 (0.0%) | 0 (0.0%) |
| Information | 0 (0.0%) | 0 (0.0%) |
| Finance & Insurance | 0 (0.0%) | 2 (100.0%) |
| Real Estate, Rental & Leasing | 0 (0.0%) | 0 (0.0%) |
| Professional & Scientific | 0 (0.0%) | 2 (100.0%) |
| Enterprise Management | 0 (0.0%) | 0 (0.0%) |
| Administrative & Support | 0 (0.0%) | 0 (0.0%) |
| Educational Services | 0 (0.0%) | 2 (100.0%) |
| Health Care & Social Assistance | 0 (0.0%) | 9 (100.0%) |
| Arts, Entertainment & Recreation | 0 (0.0%) | 0 (0.0%) |
| Accommodation & Food Services | 2 (50.0%) | 2 (50.0%) |
| Public Administration | 0 (0.0%) | 0 (0.0%) |
| Total | 46 (51.7%) | 43 (48.3%) |
Education in Lake Ka Ho
School Enrollment in Lake Ka Ho
The most common levels of schooling among the 59 students in Lake Ka Ho are middle school (36 | 61.0%), elementary school (11 | 18.6%), and college / undergraduate (7 | 11.9%).
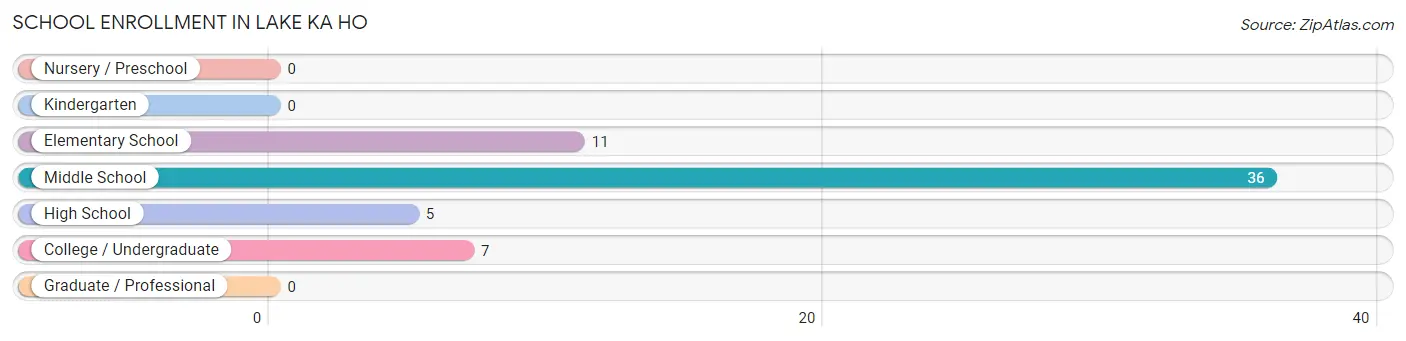
| School Level | # Students | % Students |
| Nursery / Preschool | 0 | 0.0% |
| Kindergarten | 0 | 0.0% |
| Elementary School | 11 | 18.6% |
| Middle School | 36 | 61.0% |
| High School | 5 | 8.5% |
| College / Undergraduate | 7 | 11.9% |
| Graduate / Professional | 0 | 0.0% |
| Total | 59 | 100.0% |
School Enrollment by Age by Funding Source in Lake Ka Ho
Out of a total of 59 students who are enrolled in schools in Lake Ka Ho, 2 (3.4%) attend a private institution, while the remaining 57 (96.6%) are enrolled in public schools. The age group of 25 to 34 year olds has the highest likelihood of being enrolled in private schools, with 2 (100.0% in the age bracket) enrolled. Conversely, the age group of 5 to 9 year old has the lowest likelihood of being enrolled in a private school, with 8 (100.0% in the age bracket) attending a public institution.
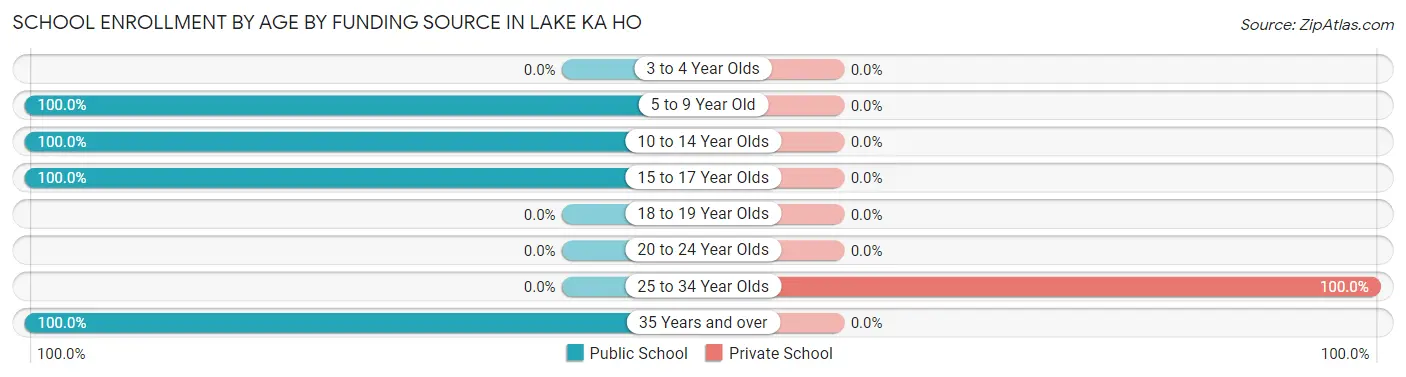
| Age Bracket | Public School | Private School |
| 3 to 4 Year Olds | 0 (0.0%) | 0 (0.0%) |
| 5 to 9 Year Old | 8 (100.0%) | 0 (0.0%) |
| 10 to 14 Year Olds | 39 (100.0%) | 0 (0.0%) |
| 15 to 17 Year Olds | 5 (100.0%) | 0 (0.0%) |
| 18 to 19 Year Olds | 0 (0.0%) | 0 (0.0%) |
| 20 to 24 Year Olds | 0 (0.0%) | 0 (0.0%) |
| 25 to 34 Year Olds | 0 (0.0%) | 2 (100.0%) |
| 35 Years and over | 5 (100.0%) | 0 (0.0%) |
| Total | 57 (96.6%) | 2 (3.4%) |
Educational Attainment by Field of Study in Lake Ka Ho
Visual & performing arts (8 | 57.1%), bio, nature & agricultural (2 | 14.3%), engineering (2 | 14.3%), and business (2 | 14.3%) are the most common fields of study among 14 individuals in Lake Ka Ho who have obtained a bachelor's degree or higher.
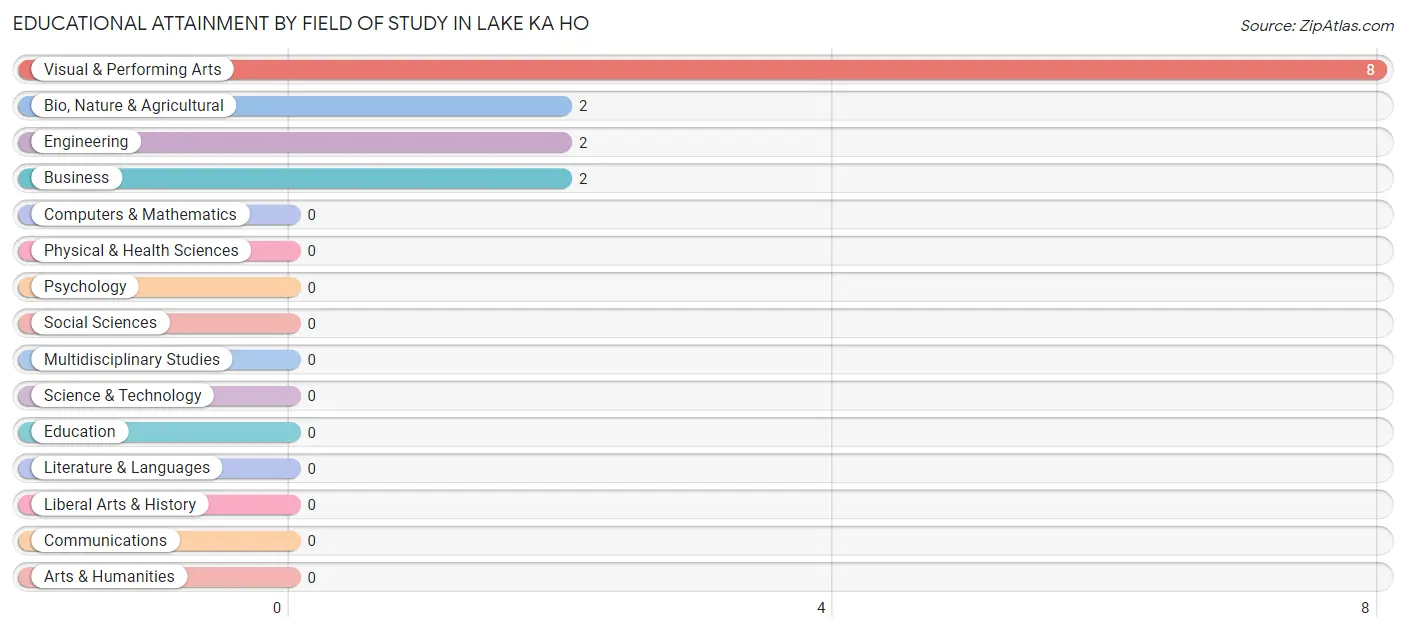
| Field of Study | # Graduates | % Graduates |
| Computers & Mathematics | 0 | 0.0% |
| Bio, Nature & Agricultural | 2 | 14.3% |
| Physical & Health Sciences | 0 | 0.0% |
| Psychology | 0 | 0.0% |
| Social Sciences | 0 | 0.0% |
| Engineering | 2 | 14.3% |
| Multidisciplinary Studies | 0 | 0.0% |
| Science & Technology | 0 | 0.0% |
| Business | 2 | 14.3% |
| Education | 0 | 0.0% |
| Literature & Languages | 0 | 0.0% |
| Liberal Arts & History | 0 | 0.0% |
| Visual & Performing Arts | 8 | 57.1% |
| Communications | 0 | 0.0% |
| Arts & Humanities | 0 | 0.0% |
| Total | 14 | 100.0% |
Transportation & Commute in Lake Ka Ho
Vehicle Availability by Sex in Lake Ka Ho
The most prevalent vehicle ownership categories in Lake Ka Ho are males with 3 vehicles (21, accounting for 45.7%) and females with 3 vehicles (12, making up 48.8%).
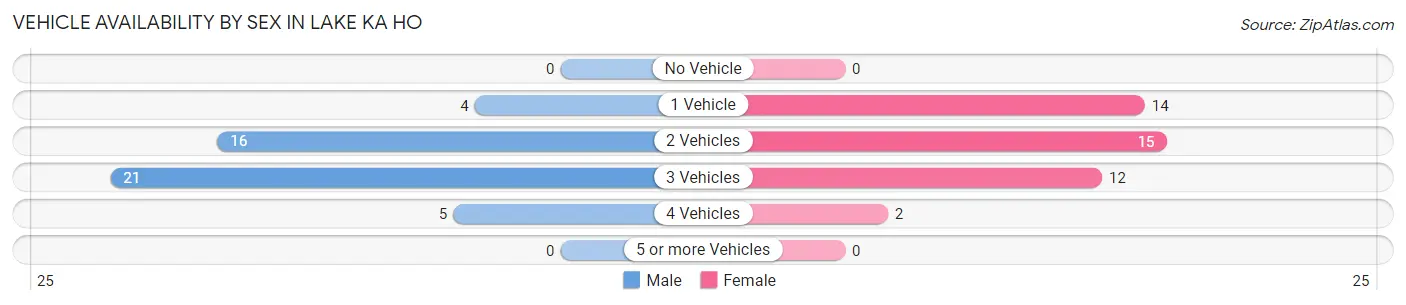
| Vehicles Available | Male | Female |
| No Vehicle | 0 (0.0%) | 0 (0.0%) |
| 1 Vehicle | 4 (8.7%) | 14 (32.6%) |
| 2 Vehicles | 16 (34.8%) | 15 (34.9%) |
| 3 Vehicles | 21 (45.7%) | 12 (27.9%) |
| 4 Vehicles | 5 (10.9%) | 2 (4.6%) |
| 5 or more Vehicles | 0 (0.0%) | 0 (0.0%) |
| Total | 46 (100.0%) | 43 (100.0%) |
Commute Time in Lake Ka Ho
The most frequently occuring commute durations in Lake Ka Ho are 15 to 19 minutes (21 commuters, 23.6%), 20 to 24 minutes (21 commuters, 23.6%), and 30 to 34 minutes (16 commuters, 18.0%).
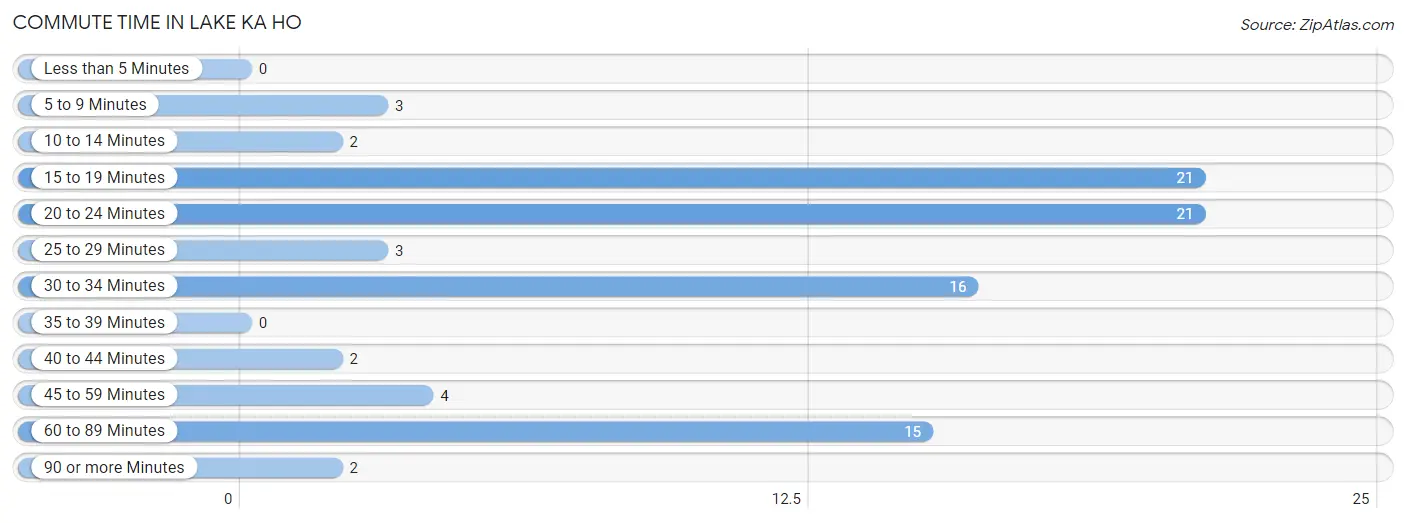
| Commute Time | # Commuters | % Commuters |
| Less than 5 Minutes | 0 | 0.0% |
| 5 to 9 Minutes | 3 | 3.4% |
| 10 to 14 Minutes | 2 | 2.2% |
| 15 to 19 Minutes | 21 | 23.6% |
| 20 to 24 Minutes | 21 | 23.6% |
| 25 to 29 Minutes | 3 | 3.4% |
| 30 to 34 Minutes | 16 | 18.0% |
| 35 to 39 Minutes | 0 | 0.0% |
| 40 to 44 Minutes | 2 | 2.2% |
| 45 to 59 Minutes | 4 | 4.5% |
| 60 to 89 Minutes | 15 | 16.9% |
| 90 or more Minutes | 2 | 2.2% |
Commute Time by Sex in Lake Ka Ho
The most common commute times in Lake Ka Ho are 30 to 34 minutes (12 commuters, 26.1%) for males and 20 to 24 minutes (16 commuters, 37.2%) for females.
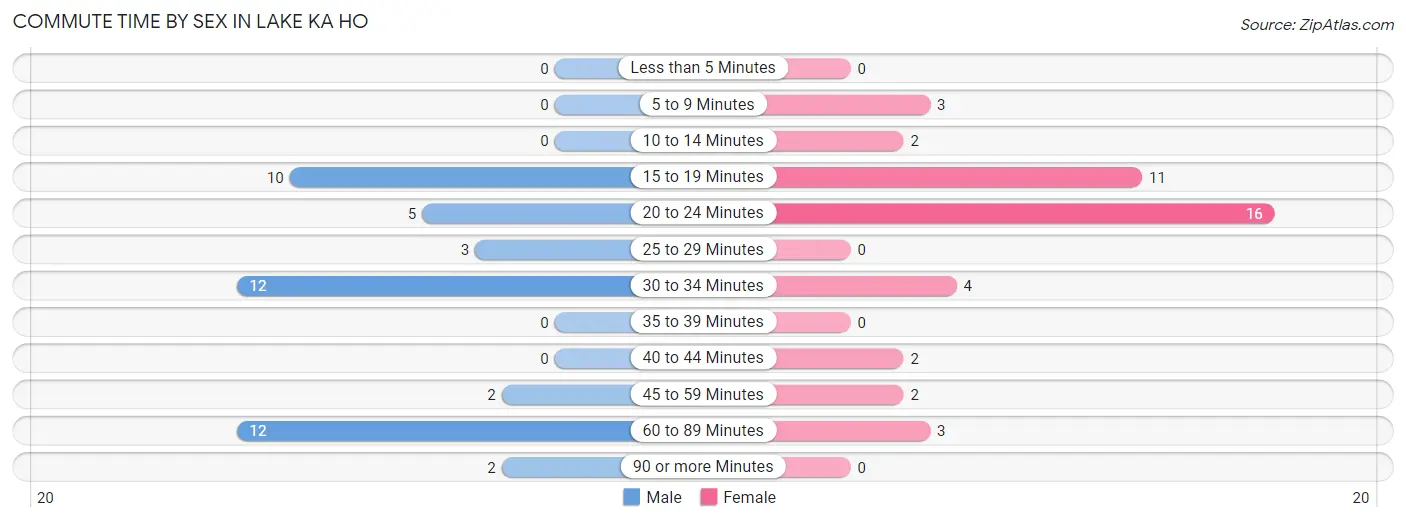
| Commute Time | Male | Female |
| Less than 5 Minutes | 0 (0.0%) | 0 (0.0%) |
| 5 to 9 Minutes | 0 (0.0%) | 3 (7.0%) |
| 10 to 14 Minutes | 0 (0.0%) | 2 (4.6%) |
| 15 to 19 Minutes | 10 (21.7%) | 11 (25.6%) |
| 20 to 24 Minutes | 5 (10.9%) | 16 (37.2%) |
| 25 to 29 Minutes | 3 (6.5%) | 0 (0.0%) |
| 30 to 34 Minutes | 12 (26.1%) | 4 (9.3%) |
| 35 to 39 Minutes | 0 (0.0%) | 0 (0.0%) |
| 40 to 44 Minutes | 0 (0.0%) | 2 (4.6%) |
| 45 to 59 Minutes | 2 (4.3%) | 2 (4.6%) |
| 60 to 89 Minutes | 12 (26.1%) | 3 (7.0%) |
| 90 or more Minutes | 2 (4.3%) | 0 (0.0%) |
Time of Departure to Work by Sex in Lake Ka Ho
The most frequent times of departure to work in Lake Ka Ho are 6:00 AM to 6:29 AM (12, 26.1%) for males and 5:30 AM to 5:59 AM (20, 46.5%) for females.
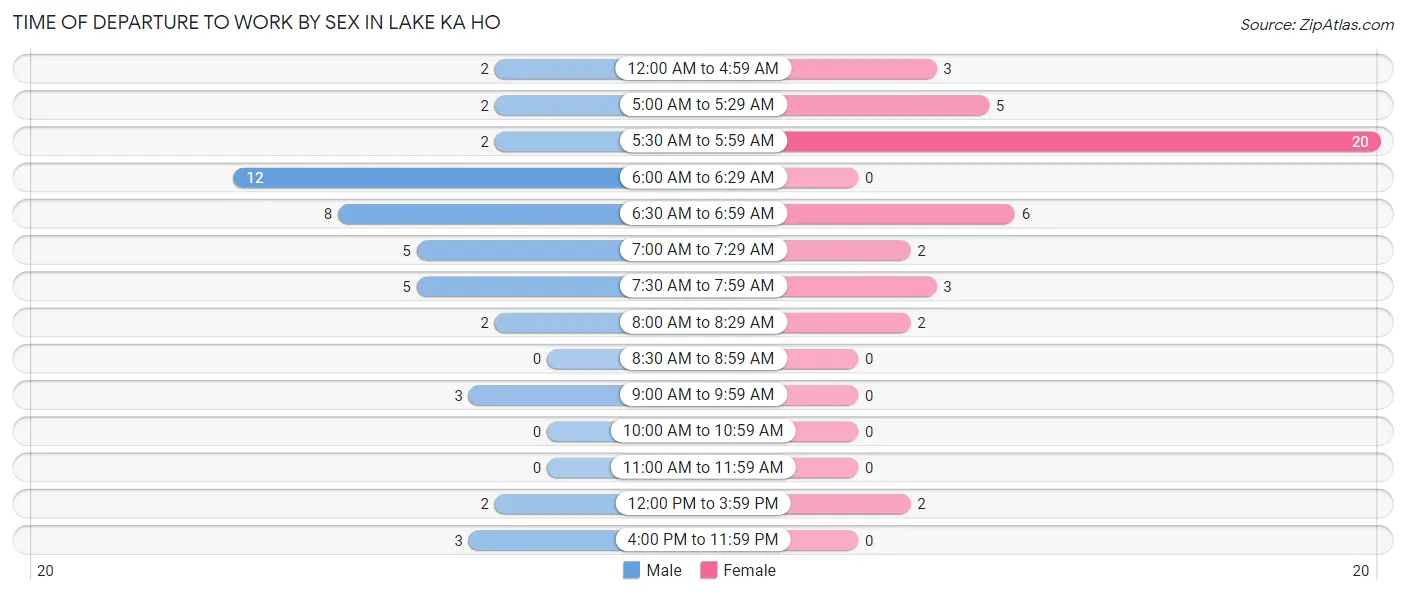
| Time of Departure | Male | Female |
| 12:00 AM to 4:59 AM | 2 (4.3%) | 3 (7.0%) |
| 5:00 AM to 5:29 AM | 2 (4.3%) | 5 (11.6%) |
| 5:30 AM to 5:59 AM | 2 (4.3%) | 20 (46.5%) |
| 6:00 AM to 6:29 AM | 12 (26.1%) | 0 (0.0%) |
| 6:30 AM to 6:59 AM | 8 (17.4%) | 6 (14.0%) |
| 7:00 AM to 7:29 AM | 5 (10.9%) | 2 (4.6%) |
| 7:30 AM to 7:59 AM | 5 (10.9%) | 3 (7.0%) |
| 8:00 AM to 8:29 AM | 2 (4.3%) | 2 (4.6%) |
| 8:30 AM to 8:59 AM | 0 (0.0%) | 0 (0.0%) |
| 9:00 AM to 9:59 AM | 3 (6.5%) | 0 (0.0%) |
| 10:00 AM to 10:59 AM | 0 (0.0%) | 0 (0.0%) |
| 11:00 AM to 11:59 AM | 0 (0.0%) | 0 (0.0%) |
| 12:00 PM to 3:59 PM | 2 (4.3%) | 2 (4.6%) |
| 4:00 PM to 11:59 PM | 3 (6.5%) | 0 (0.0%) |
| Total | 46 (100.0%) | 43 (100.0%) |
Housing Occupancy in Lake Ka Ho
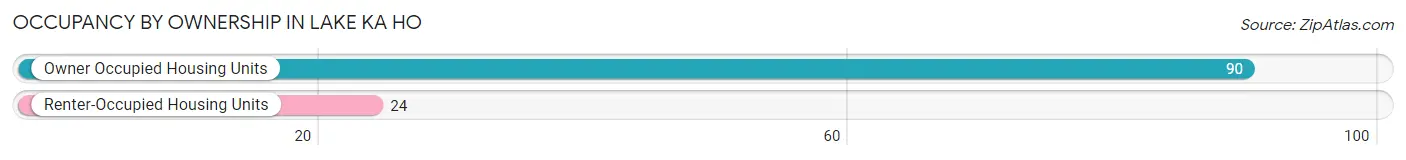
Occupancy by Ownership in Lake Ka Ho
Of the total 114 dwellings in Lake Ka Ho, owner-occupied units account for 90 (78.9%), while renter-occupied units make up 24 (21.0%).
| Occupancy | # Housing Units | % Housing Units |
| Owner Occupied Housing Units | 90 | 78.9% |
| Renter-Occupied Housing Units | 24 | 21.0% |
| Total Occupied Housing Units | 114 | 100.0% |
Occupancy by Household Size in Lake Ka Ho
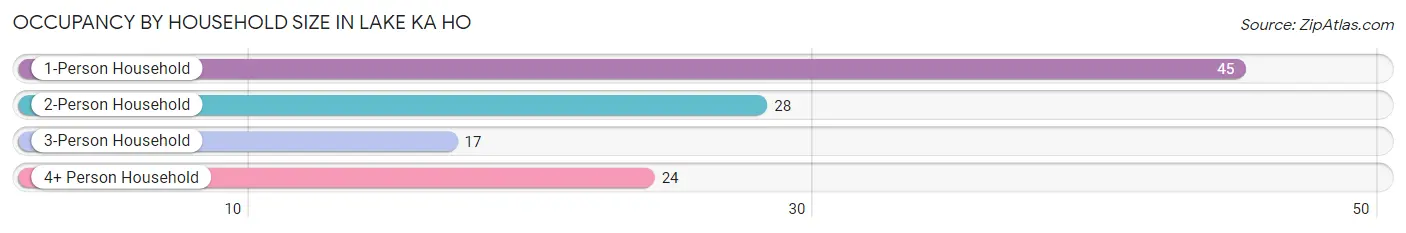
| Household Size | # Housing Units | % Housing Units |
| 1-Person Household | 45 | 39.5% |
| 2-Person Household | 28 | 24.6% |
| 3-Person Household | 17 | 14.9% |
| 4+ Person Household | 24 | 21.0% |
| Total Housing Units | 114 | 100.0% |
Occupancy by Ownership by Household Size in Lake Ka Ho
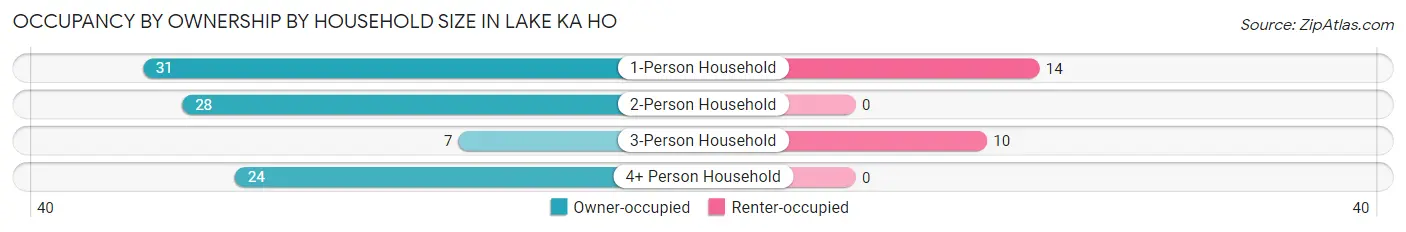
| Household Size | Owner-occupied | Renter-occupied |
| 1-Person Household | 31 (68.9%) | 14 (31.1%) |
| 2-Person Household | 28 (100.0%) | 0 (0.0%) |
| 3-Person Household | 7 (41.2%) | 10 (58.8%) |
| 4+ Person Household | 24 (100.0%) | 0 (0.0%) |
| Total Housing Units | 90 (78.9%) | 24 (21.0%) |
Occupancy by Educational Attainment in Lake Ka Ho
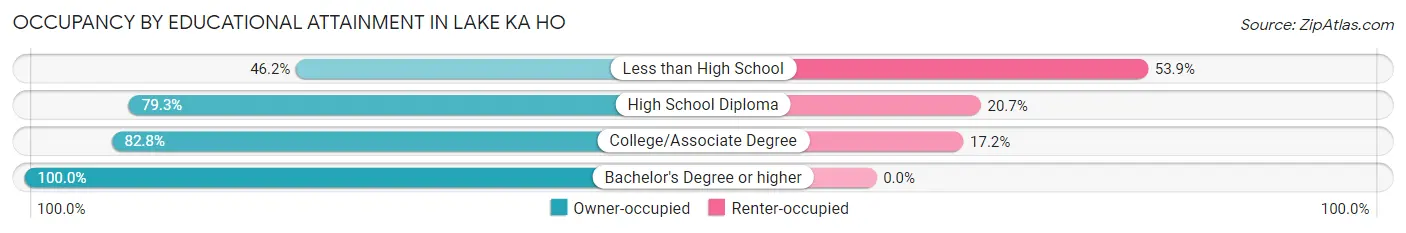
| Household Size | Owner-occupied | Renter-occupied |
| Less than High School | 6 (46.2%) | 7 (53.8%) |
| High School Diploma | 46 (79.3%) | 12 (20.7%) |
| College/Associate Degree | 24 (82.8%) | 5 (17.2%) |
| Bachelor's Degree or higher | 14 (100.0%) | 0 (0.0%) |
Occupancy by Age of Householder in Lake Ka Ho
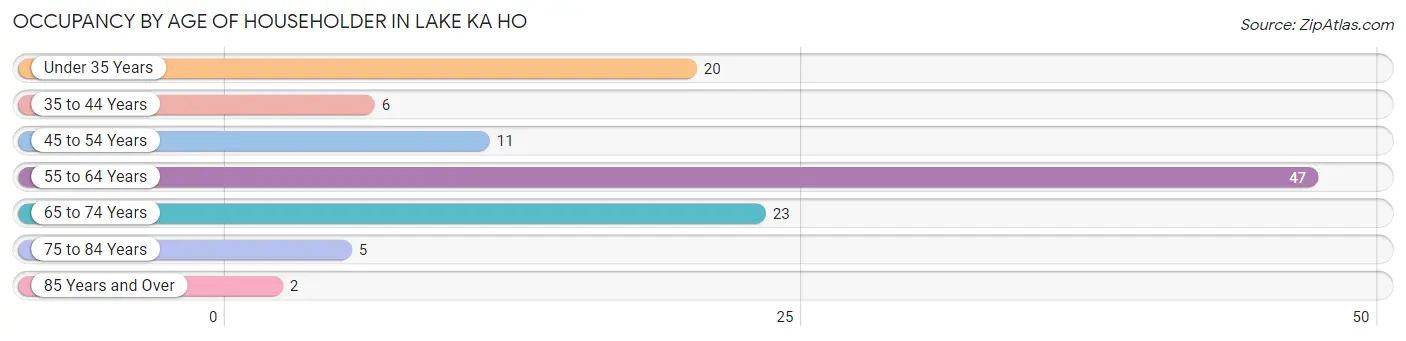
| Age Bracket | # Households | % Households |
| Under 35 Years | 20 | 17.5% |
| 35 to 44 Years | 6 | 5.3% |
| 45 to 54 Years | 11 | 9.7% |
| 55 to 64 Years | 47 | 41.2% |
| 65 to 74 Years | 23 | 20.2% |
| 75 to 84 Years | 5 | 4.4% |
| 85 Years and Over | 2 | 1.8% |
| Total | 114 | 100.0% |
Housing Finances in Lake Ka Ho
Median Income by Occupancy in Lake Ka Ho
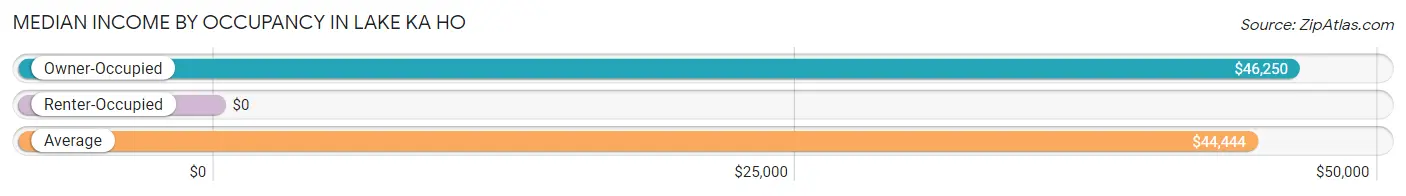
| Occupancy Type | # Households | Median Income |
| Owner-Occupied | 90 (78.9%) | $46,250 |
| Renter-Occupied | 24 (21.0%) | $0 |
| Average | 114 (100.0%) | $44,444 |
Occupancy by Householder Income Bracket in Lake Ka Ho
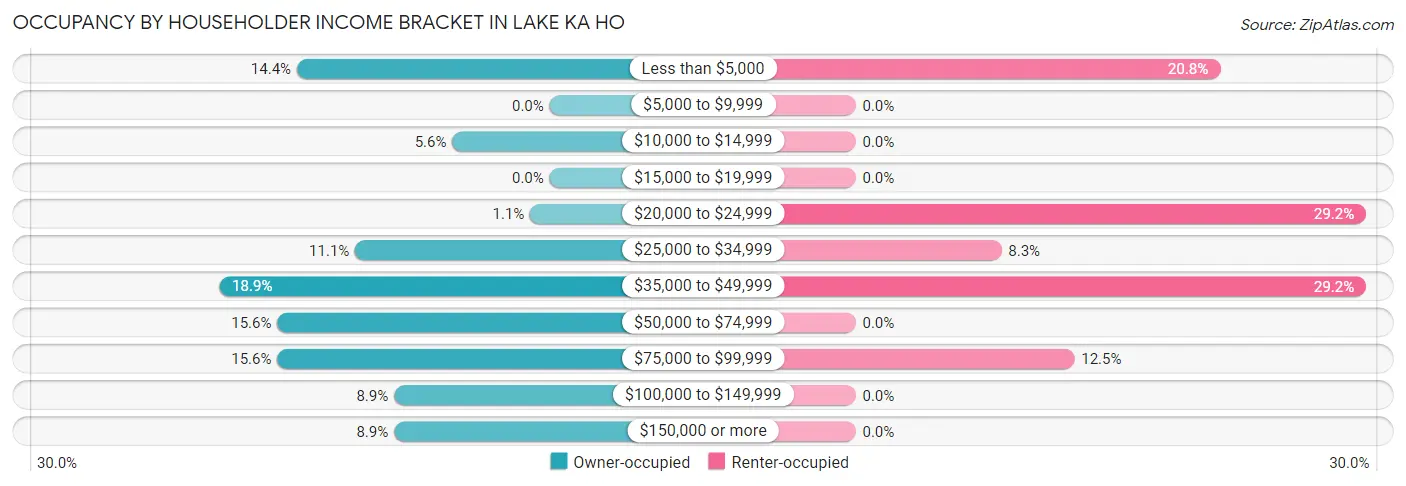
| Income Bracket | Owner-occupied | Renter-occupied |
| Less than $5,000 | 13 (14.4%) | 5 (20.8%) |
| $5,000 to $9,999 | 0 (0.0%) | 0 (0.0%) |
| $10,000 to $14,999 | 5 (5.6%) | 0 (0.0%) |
| $15,000 to $19,999 | 0 (0.0%) | 0 (0.0%) |
| $20,000 to $24,999 | 1 (1.1%) | 7 (29.2%) |
| $25,000 to $34,999 | 10 (11.1%) | 2 (8.3%) |
| $35,000 to $49,999 | 17 (18.9%) | 7 (29.2%) |
| $50,000 to $74,999 | 14 (15.6%) | 0 (0.0%) |
| $75,000 to $99,999 | 14 (15.6%) | 3 (12.5%) |
| $100,000 to $149,999 | 8 (8.9%) | 0 (0.0%) |
| $150,000 or more | 8 (8.9%) | 0 (0.0%) |
| Total | 90 (100.0%) | 24 (100.0%) |
Monthly Housing Cost Tiers in Lake Ka Ho
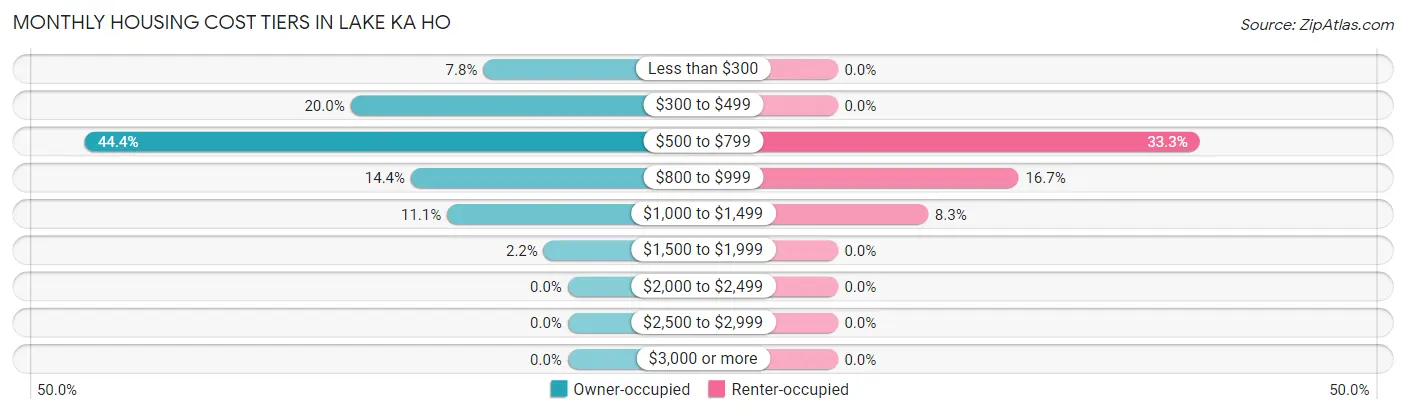
| Monthly Cost | Owner-occupied | Renter-occupied |
| Less than $300 | 7 (7.8%) | 0 (0.0%) |
| $300 to $499 | 18 (20.0%) | 0 (0.0%) |
| $500 to $799 | 40 (44.4%) | 8 (33.3%) |
| $800 to $999 | 13 (14.4%) | 4 (16.7%) |
| $1,000 to $1,499 | 10 (11.1%) | 2 (8.3%) |
| $1,500 to $1,999 | 2 (2.2%) | 0 (0.0%) |
| $2,000 to $2,499 | 0 (0.0%) | 0 (0.0%) |
| $2,500 to $2,999 | 0 (0.0%) | 0 (0.0%) |
| $3,000 or more | 0 (0.0%) | 0 (0.0%) |
| Total | 90 (100.0%) | 24 (100.0%) |
Physical Housing Characteristics in Lake Ka Ho
Housing Structures in Lake Ka Ho
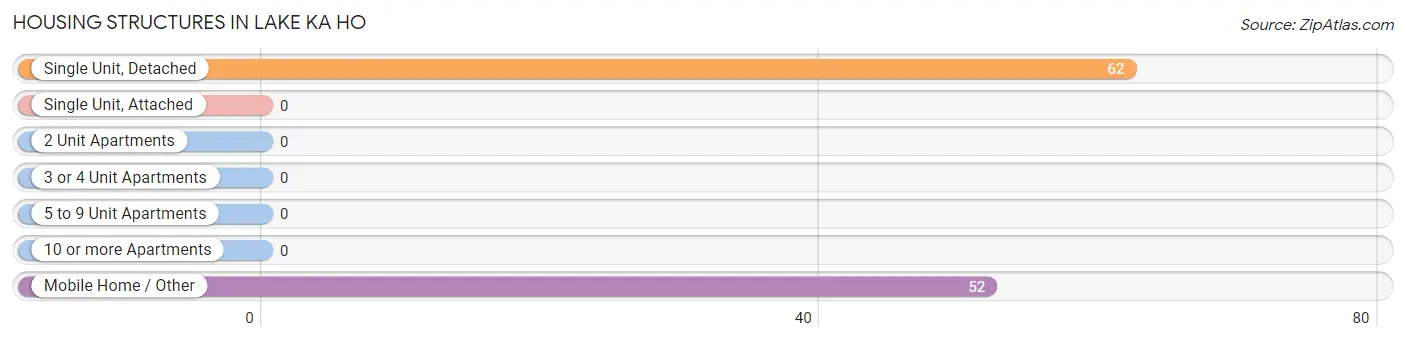
| Structure Type | # Housing Units | % Housing Units |
| Single Unit, Detached | 62 | 54.4% |
| Single Unit, Attached | 0 | 0.0% |
| 2 Unit Apartments | 0 | 0.0% |
| 3 or 4 Unit Apartments | 0 | 0.0% |
| 5 to 9 Unit Apartments | 0 | 0.0% |
| 10 or more Apartments | 0 | 0.0% |
| Mobile Home / Other | 52 | 45.6% |
| Total | 114 | 100.0% |
Housing Structures by Occupancy in Lake Ka Ho
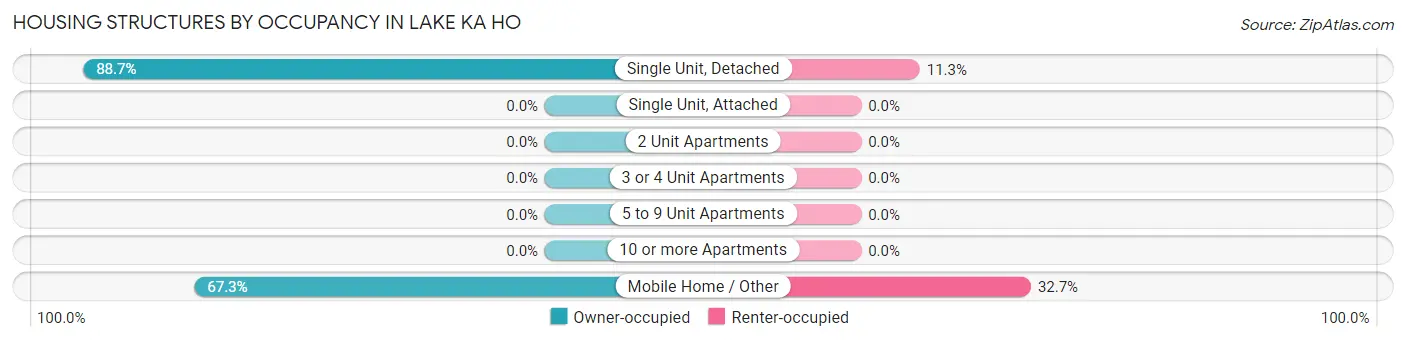
| Structure Type | Owner-occupied | Renter-occupied |
| Single Unit, Detached | 55 (88.7%) | 7 (11.3%) |
| Single Unit, Attached | 0 (0.0%) | 0 (0.0%) |
| 2 Unit Apartments | 0 (0.0%) | 0 (0.0%) |
| 3 or 4 Unit Apartments | 0 (0.0%) | 0 (0.0%) |
| 5 to 9 Unit Apartments | 0 (0.0%) | 0 (0.0%) |
| 10 or more Apartments | 0 (0.0%) | 0 (0.0%) |
| Mobile Home / Other | 35 (67.3%) | 17 (32.7%) |
| Total | 90 (78.9%) | 24 (21.0%) |
Housing Structures by Number of Rooms in Lake Ka Ho
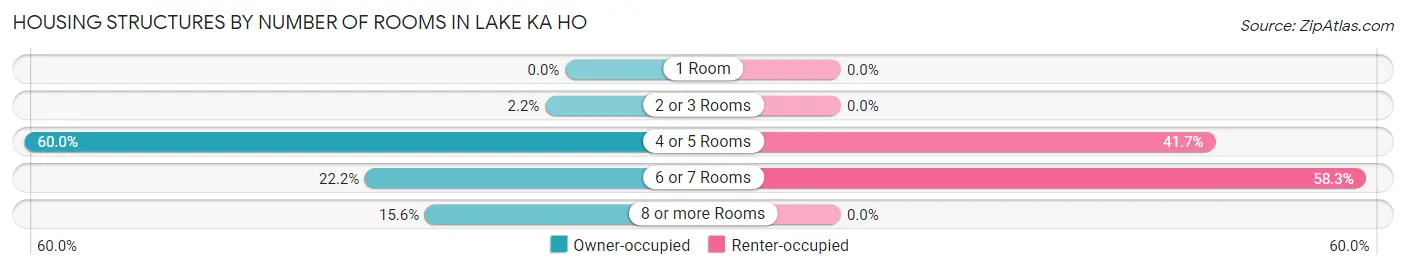
| Number of Rooms | Owner-occupied | Renter-occupied |
| 1 Room | 0 (0.0%) | 0 (0.0%) |
| 2 or 3 Rooms | 2 (2.2%) | 0 (0.0%) |
| 4 or 5 Rooms | 54 (60.0%) | 10 (41.7%) |
| 6 or 7 Rooms | 20 (22.2%) | 14 (58.3%) |
| 8 or more Rooms | 14 (15.6%) | 0 (0.0%) |
| Total | 90 (100.0%) | 24 (100.0%) |
Housing Structure by Heating Type in Lake Ka Ho
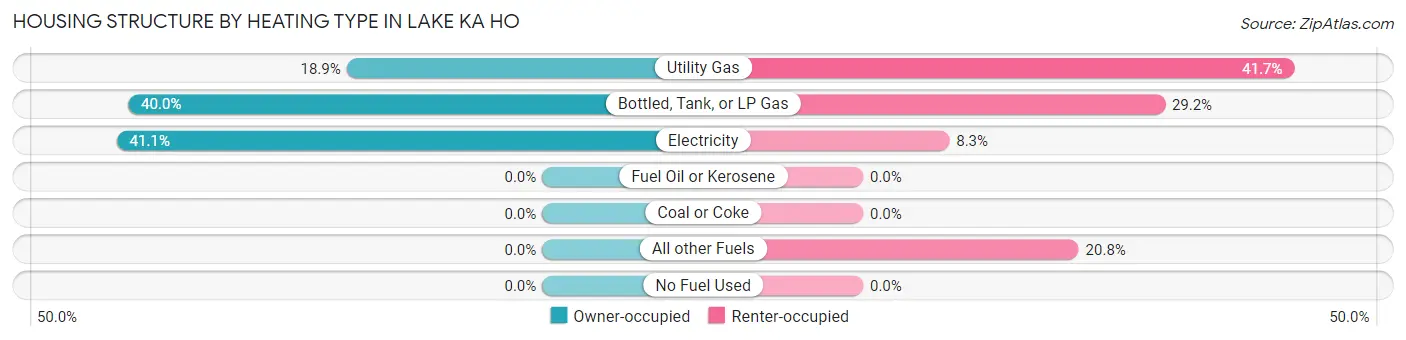
| Heating Type | Owner-occupied | Renter-occupied |
| Utility Gas | 17 (18.9%) | 10 (41.7%) |
| Bottled, Tank, or LP Gas | 36 (40.0%) | 7 (29.2%) |
| Electricity | 37 (41.1%) | 2 (8.3%) |
| Fuel Oil or Kerosene | 0 (0.0%) | 0 (0.0%) |
| Coal or Coke | 0 (0.0%) | 0 (0.0%) |
| All other Fuels | 0 (0.0%) | 5 (20.8%) |
| No Fuel Used | 0 (0.0%) | 0 (0.0%) |
| Total | 90 (100.0%) | 24 (100.0%) |
Household Vehicle Usage in Lake Ka Ho
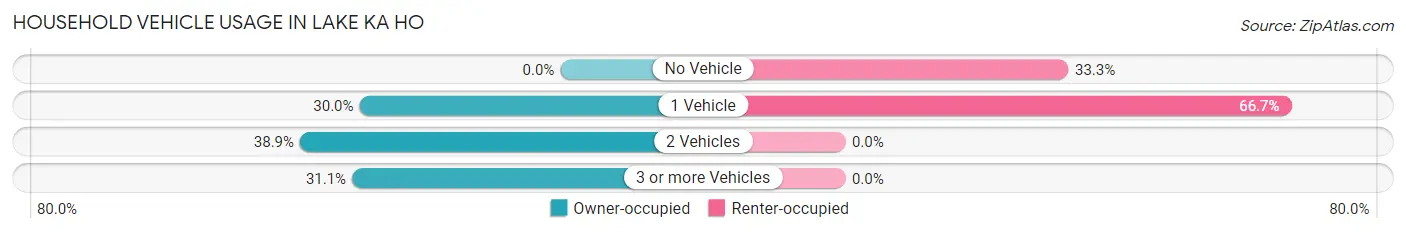
| Vehicles per Household | Owner-occupied | Renter-occupied |
| No Vehicle | 0 (0.0%) | 8 (33.3%) |
| 1 Vehicle | 27 (30.0%) | 16 (66.7%) |
| 2 Vehicles | 35 (38.9%) | 0 (0.0%) |
| 3 or more Vehicles | 28 (31.1%) | 0 (0.0%) |
| Total | 90 (100.0%) | 24 (100.0%) |
Real Estate & Mortgages in Lake Ka Ho
Real Estate and Mortgage Overview in Lake Ka Ho
| Characteristic | Without Mortgage | With Mortgage |
| Housing Units | 61 | 29 |
| Median Property Value | $58,300 | $77,500 |
| Median Household Income | $43,250 | $0 |
| Monthly Housing Costs | $546 | $0 |
| Real Estate Taxes | $538 | $0 |
Property Value by Mortgage Status in Lake Ka Ho
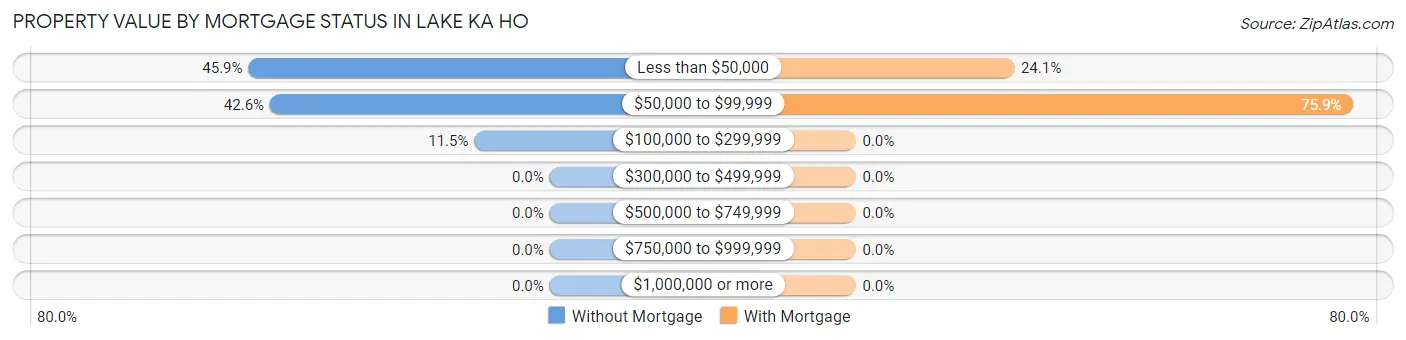
| Property Value | Without Mortgage | With Mortgage |
| Less than $50,000 | 28 (45.9%) | 7 (24.1%) |
| $50,000 to $99,999 | 26 (42.6%) | 22 (75.9%) |
| $100,000 to $299,999 | 7 (11.5%) | 0 (0.0%) |
| $300,000 to $499,999 | 0 (0.0%) | 0 (0.0%) |
| $500,000 to $749,999 | 0 (0.0%) | 0 (0.0%) |
| $750,000 to $999,999 | 0 (0.0%) | 0 (0.0%) |
| $1,000,000 or more | 0 (0.0%) | 0 (0.0%) |
| Total | 61 (100.0%) | 29 (100.0%) |
Household Income by Mortgage Status in Lake Ka Ho
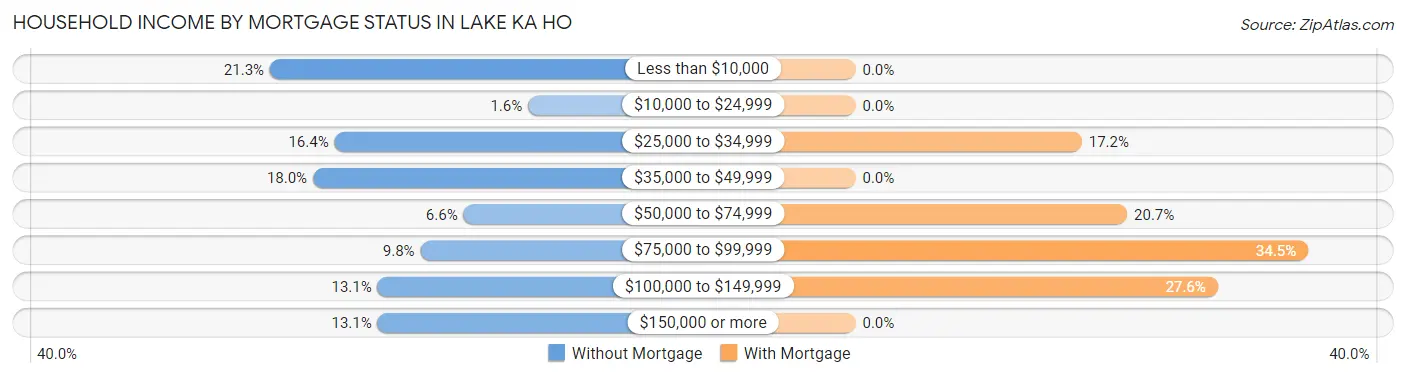
| Household Income | Without Mortgage | With Mortgage |
| Less than $10,000 | 13 (21.3%) | 0 (0.0%) |
| $10,000 to $24,999 | 1 (1.6%) | 0 (0.0%) |
| $25,000 to $34,999 | 10 (16.4%) | 5 (17.2%) |
| $35,000 to $49,999 | 11 (18.0%) | 0 (0.0%) |
| $50,000 to $74,999 | 4 (6.6%) | 6 (20.7%) |
| $75,000 to $99,999 | 6 (9.8%) | 10 (34.5%) |
| $100,000 to $149,999 | 8 (13.1%) | 8 (27.6%) |
| $150,000 or more | 8 (13.1%) | 0 (0.0%) |
| Total | 61 (100.0%) | 29 (100.0%) |
Property Value to Household Income Ratio in Lake Ka Ho
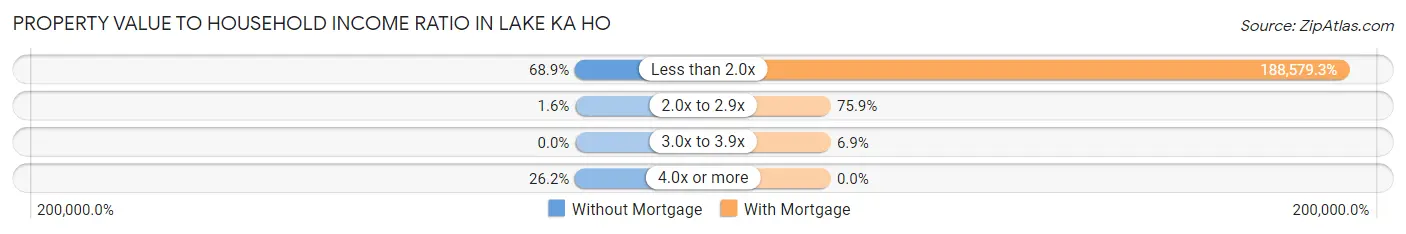
| Value-to-Income Ratio | Without Mortgage | With Mortgage |
| Less than 2.0x | 42 (68.9%) | 54,688 (188,579.3%) |
| 2.0x to 2.9x | 1 (1.6%) | 22 (75.9%) |
| 3.0x to 3.9x | 0 (0.0%) | 2 (6.9%) |
| 4.0x or more | 16 (26.2%) | 0 (0.0%) |
| Total | 61 (100.0%) | 29 (100.0%) |
Real Estate Taxes by Mortgage Status in Lake Ka Ho
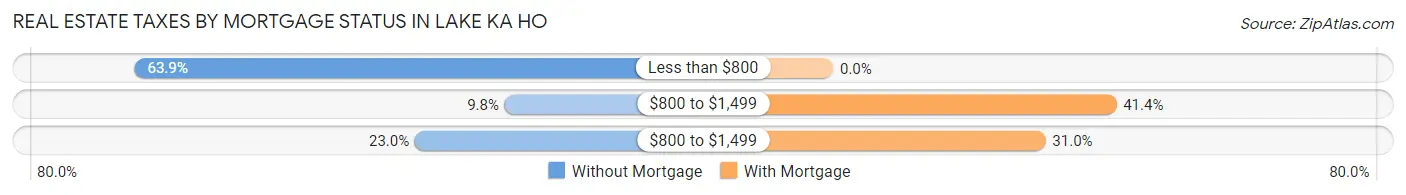
| Property Taxes | Without Mortgage | With Mortgage |
| Less than $800 | 39 (63.9%) | 0 (0.0%) |
| $800 to $1,499 | 6 (9.8%) | 12 (41.4%) |
| $800 to $1,499 | 14 (23.0%) | 9 (31.0%) |
| Total | 61 (100.0%) | 29 (100.0%) |
Health & Disability in Lake Ka Ho
Health Insurance Coverage by Age in Lake Ka Ho
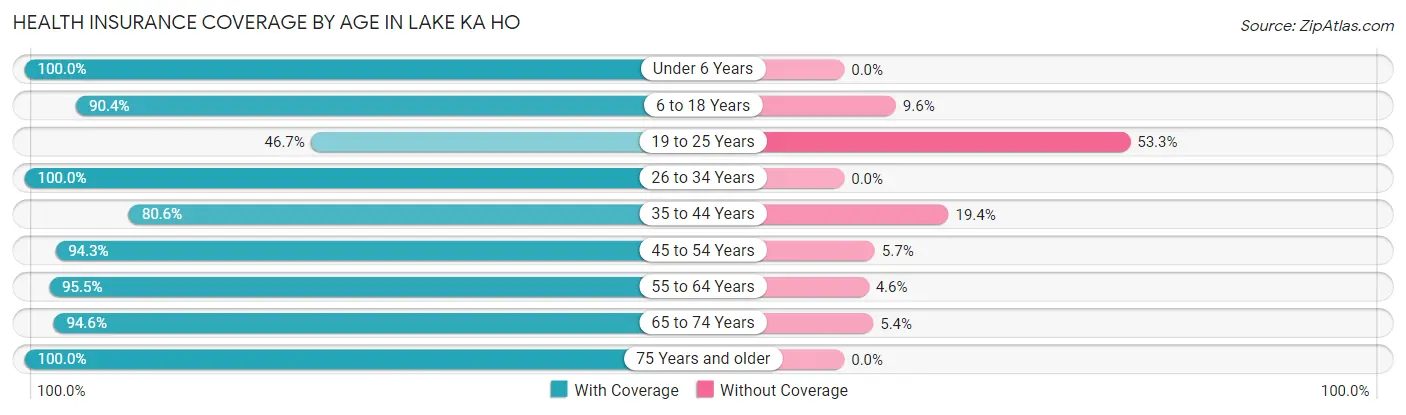
| Age Bracket | With Coverage | Without Coverage |
| Under 6 Years | 2 (100.0%) | 0 (0.0%) |
| 6 to 18 Years | 47 (90.4%) | 5 (9.6%) |
| 19 to 25 Years | 7 (46.7%) | 8 (53.3%) |
| 26 to 34 Years | 30 (100.0%) | 0 (0.0%) |
| 35 to 44 Years | 29 (80.6%) | 7 (19.4%) |
| 45 to 54 Years | 33 (94.3%) | 2 (5.7%) |
| 55 to 64 Years | 63 (95.5%) | 3 (4.5%) |
| 65 to 74 Years | 35 (94.6%) | 2 (5.4%) |
| 75 Years and older | 8 (100.0%) | 0 (0.0%) |
| Total | 254 (90.4%) | 27 (9.6%) |
Health Insurance Coverage by Citizenship Status in Lake Ka Ho
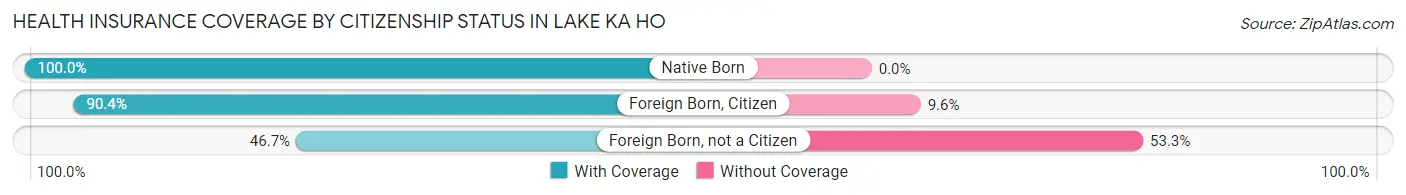
| Citizenship Status | With Coverage | Without Coverage |
| Native Born | 2 (100.0%) | 0 (0.0%) |
| Foreign Born, Citizen | 47 (90.4%) | 5 (9.6%) |
| Foreign Born, not a Citizen | 7 (46.7%) | 8 (53.3%) |
Health Insurance Coverage by Household Income in Lake Ka Ho
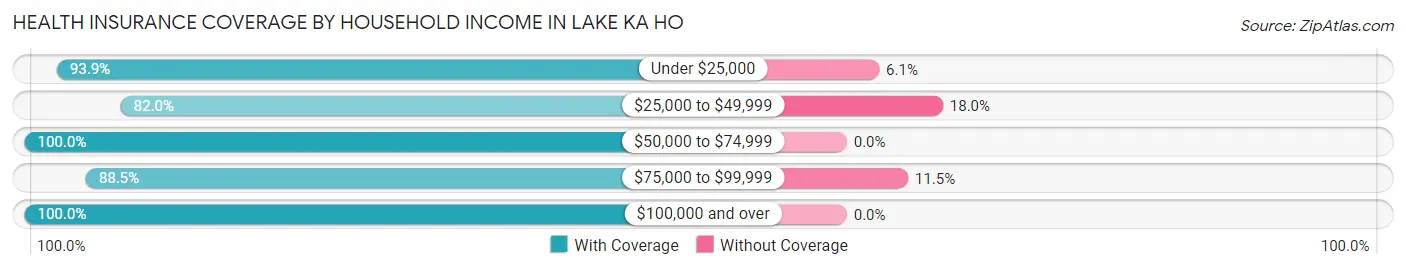
| Household Income | With Coverage | Without Coverage |
| Under $25,000 | 31 (93.9%) | 2 (6.1%) |
| $25,000 to $49,999 | 82 (82.0%) | 18 (18.0%) |
| $50,000 to $74,999 | 31 (100.0%) | 0 (0.0%) |
| $75,000 to $99,999 | 54 (88.5%) | 7 (11.5%) |
| $100,000 and over | 56 (100.0%) | 0 (0.0%) |
Public vs Private Health Insurance Coverage by Age in Lake Ka Ho
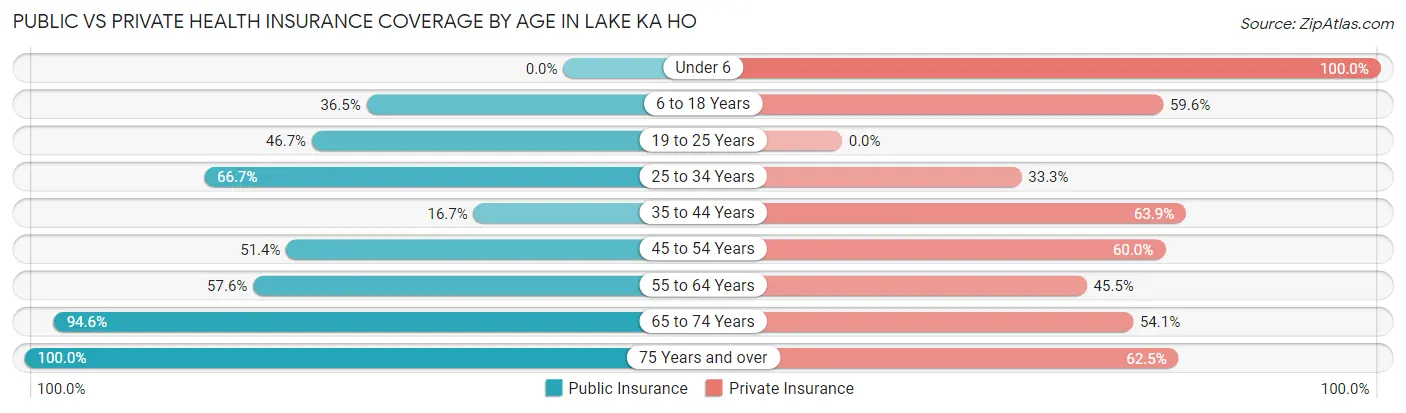
| Age Bracket | Public Insurance | Private Insurance |
| Under 6 | 0 (0.0%) | 2 (100.0%) |
| 6 to 18 Years | 19 (36.5%) | 31 (59.6%) |
| 19 to 25 Years | 7 (46.7%) | 0 (0.0%) |
| 25 to 34 Years | 20 (66.7%) | 10 (33.3%) |
| 35 to 44 Years | 6 (16.7%) | 23 (63.9%) |
| 45 to 54 Years | 18 (51.4%) | 21 (60.0%) |
| 55 to 64 Years | 38 (57.6%) | 30 (45.5%) |
| 65 to 74 Years | 35 (94.6%) | 20 (54.0%) |
| 75 Years and over | 8 (100.0%) | 5 (62.5%) |
| Total | 151 (53.7%) | 142 (50.5%) |
Disability Status by Sex by Age in Lake Ka Ho
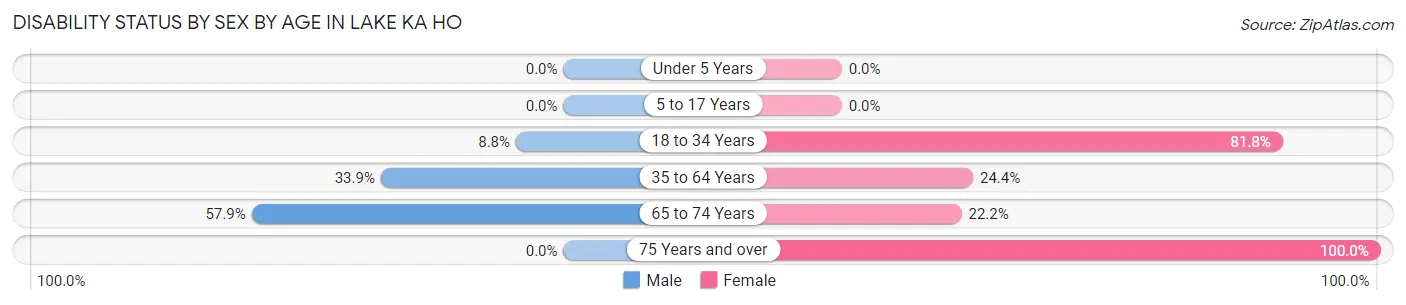
| Age Bracket | Male | Female |
| Under 5 Years | 0 (0.0%) | 0 (0.0%) |
| 5 to 17 Years | 0 (0.0%) | 0 (0.0%) |
| 18 to 34 Years | 3 (8.8%) | 9 (81.8%) |
| 35 to 64 Years | 20 (33.9%) | 19 (24.4%) |
| 65 to 74 Years | 11 (57.9%) | 4 (22.2%) |
| 75 Years and over | 0 (0.0%) | 2 (100.0%) |
Disability Class by Sex by Age in Lake Ka Ho
Disability Class: Hearing Difficulty
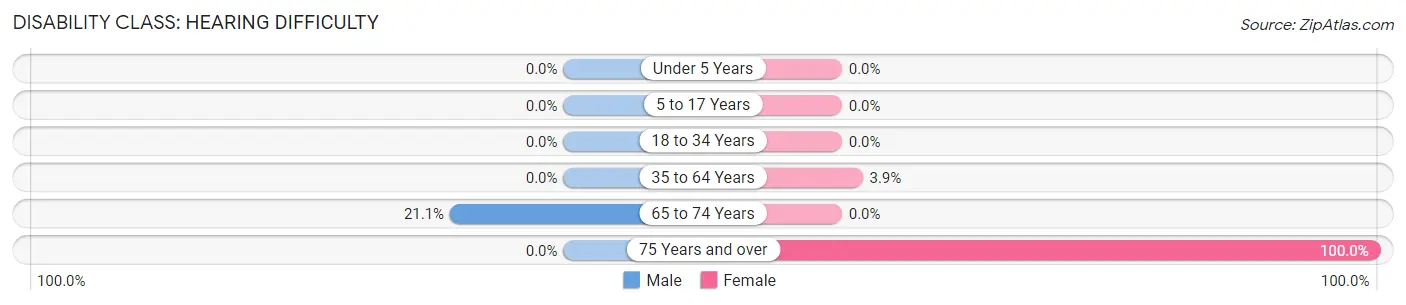
| Age Bracket | Male | Female |
| Under 5 Years | 0 (0.0%) | 0 (0.0%) |
| 5 to 17 Years | 0 (0.0%) | 0 (0.0%) |
| 18 to 34 Years | 0 (0.0%) | 0 (0.0%) |
| 35 to 64 Years | 0 (0.0%) | 3 (3.8%) |
| 65 to 74 Years | 4 (21.0%) | 0 (0.0%) |
| 75 Years and over | 0 (0.0%) | 2 (100.0%) |
Disability Class: Vision Difficulty
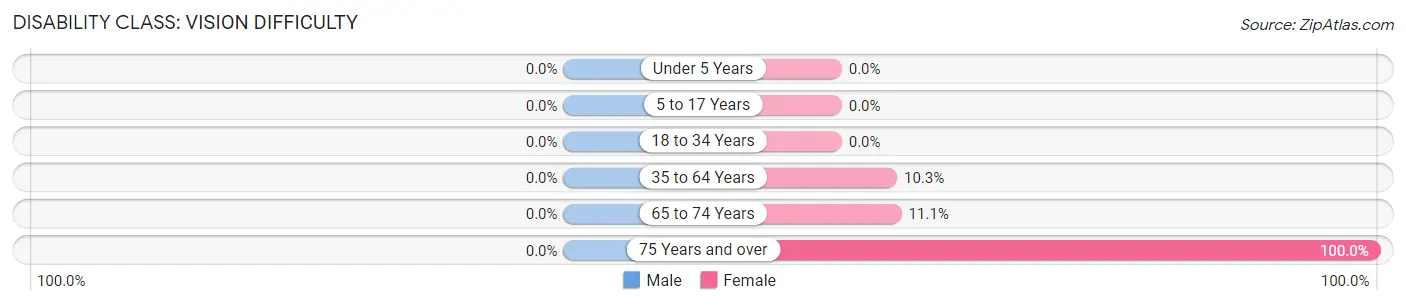
| Age Bracket | Male | Female |
| Under 5 Years | 0 (0.0%) | 0 (0.0%) |
| 5 to 17 Years | 0 (0.0%) | 0 (0.0%) |
| 18 to 34 Years | 0 (0.0%) | 0 (0.0%) |
| 35 to 64 Years | 0 (0.0%) | 8 (10.3%) |
| 65 to 74 Years | 0 (0.0%) | 2 (11.1%) |
| 75 Years and over | 0 (0.0%) | 2 (100.0%) |
Disability Class: Cognitive Difficulty
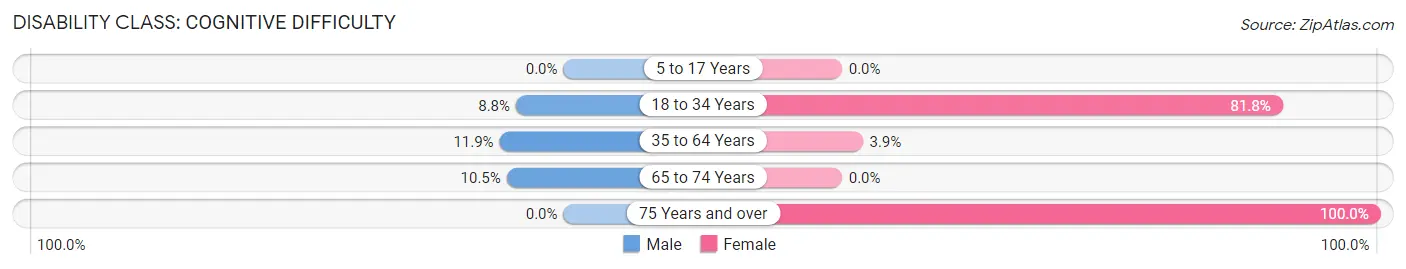
| Age Bracket | Male | Female |
| 5 to 17 Years | 0 (0.0%) | 0 (0.0%) |
| 18 to 34 Years | 3 (8.8%) | 9 (81.8%) |
| 35 to 64 Years | 7 (11.9%) | 3 (3.8%) |
| 65 to 74 Years | 2 (10.5%) | 0 (0.0%) |
| 75 Years and over | 0 (0.0%) | 2 (100.0%) |
Disability Class: Ambulatory Difficulty
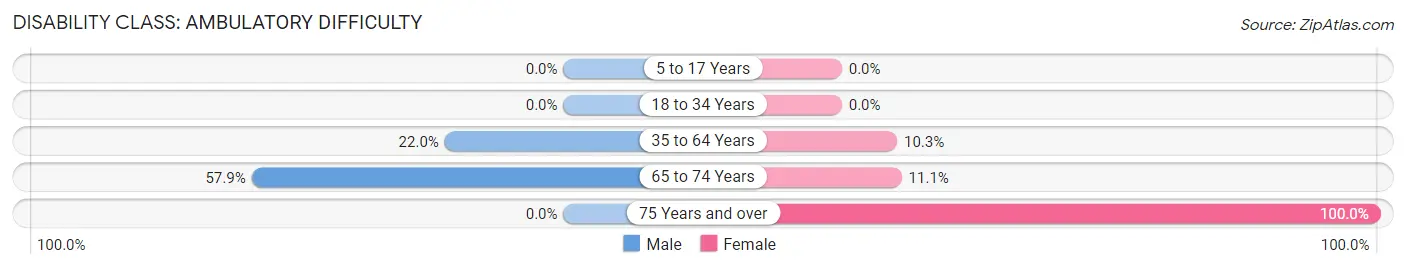
| Age Bracket | Male | Female |
| 5 to 17 Years | 0 (0.0%) | 0 (0.0%) |
| 18 to 34 Years | 0 (0.0%) | 0 (0.0%) |
| 35 to 64 Years | 13 (22.0%) | 8 (10.3%) |
| 65 to 74 Years | 11 (57.9%) | 2 (11.1%) |
| 75 Years and over | 0 (0.0%) | 2 (100.0%) |
Disability Class: Self-Care Difficulty
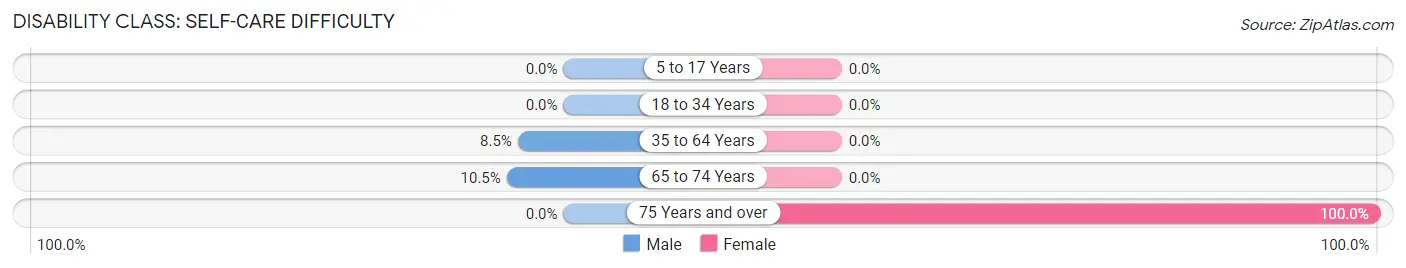
| Age Bracket | Male | Female |
| 5 to 17 Years | 0 (0.0%) | 0 (0.0%) |
| 18 to 34 Years | 0 (0.0%) | 0 (0.0%) |
| 35 to 64 Years | 5 (8.5%) | 0 (0.0%) |
| 65 to 74 Years | 2 (10.5%) | 0 (0.0%) |
| 75 Years and over | 0 (0.0%) | 2 (100.0%) |
Technology Access in Lake Ka Ho
Computing Device Access in Lake Ka Ho
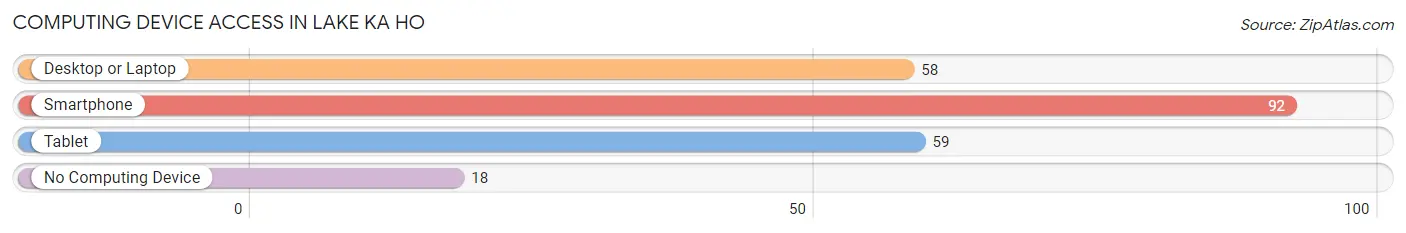
| Device Type | # Households | % Households |
| Desktop or Laptop | 58 | 50.9% |
| Smartphone | 92 | 80.7% |
| Tablet | 59 | 51.7% |
| No Computing Device | 18 | 15.8% |
| Total | 114 | 100.0% |
Internet Access in Lake Ka Ho
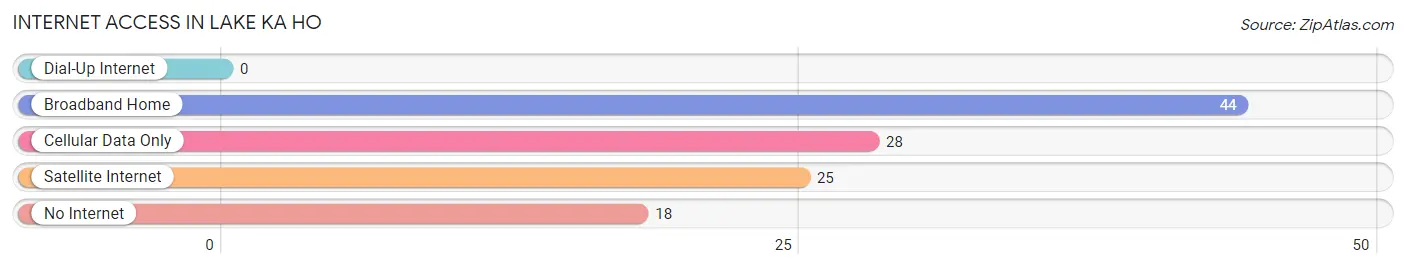
| Internet Type | # Households | % Households |
| Dial-Up Internet | 0 | 0.0% |
| Broadband Home | 44 | 38.6% |
| Cellular Data Only | 28 | 24.6% |
| Satellite Internet | 25 | 21.9% |
| No Internet | 18 | 15.8% |
| Total | 114 | 100.0% |
Lake Ka Ho Summary
History
Lake Ka Ho is a small village located in the state of Illinois, United States. It is situated in the northern part of the state, near the Wisconsin border. The village was founded in 1835 by a group of settlers from New York. The settlers were looking for a place to settle and start a new life. They chose the area around Lake Ka Ho because of its natural beauty and abundance of resources.
The village was originally called “Ka Ho”, which means “beautiful lake” in the language of the local Native American tribes. The name was later changed to Lake Ka Ho when the village was incorporated in 1837.
The village was a small farming community for many years, but it began to grow in the late 19th century when the railroad was built through the area. This allowed for the transportation of goods and people to and from the village.
The village continued to grow and develop throughout the 20th century. In the 1950s, the village was home to a large number of Italian immigrants who had come to the area to work in the local factories. The village also became a popular tourist destination, as it was close to the Wisconsin Dells and other attractions.
Geography
Lake Ka Ho is located in the northern part of Illinois, near the Wisconsin border. The village is situated on the banks of the Fox River, which flows through the area. The village is surrounded by rolling hills and wooded areas, making it a picturesque location.
The village is located in the Kankakee County, which is part of the Chicago metropolitan area. The village is about 50 miles from the city of Chicago. The village is also close to the Wisconsin Dells, which is a popular tourist destination.
The climate in the area is humid continental, with hot summers and cold winters. The average temperature in the summer is around 75 degrees Fahrenheit, while the average temperature in the winter is around 25 degrees Fahrenheit.
Economy
The economy of Lake Ka Ho is largely based on tourism and agriculture. The village is home to several tourist attractions, such as the Wisconsin Dells and the Fox River. The village also has several farms that produce a variety of crops, such as corn, soybeans, and wheat.
The village also has several small businesses, such as restaurants, shops, and other services. The village is also home to a few manufacturing companies, which produce a variety of products, such as furniture and clothing.
Demographics
As of the 2010 census, the population of Lake Ka Ho was 1,845. The population is mostly white, with a small percentage of African Americans and Hispanics. The median age of the population is 44.7 years old.
The median household income in the village is $50,945, which is slightly higher than the national average. The unemployment rate in the village is 4.2%, which is lower than the national average.
Conclusion
Lake Ka Ho is a small village located in the northern part of Illinois. The village was founded in 1835 by a group of settlers from New York. The village has a largely agricultural and tourist-based economy, and the population is mostly white. The median household income in the village is slightly higher than the national average, and the unemployment rate is lower than the national average.
Common Questions
What is Per Capita Income in Lake Ka Ho?
Per Capita income in Lake Ka Ho is $24,026.
What is the Median Family Income in Lake Ka Ho?
Median Family Income in Lake Ka Ho is $54,063.
What is the Median Household income in Lake Ka Ho?
Median Household Income in Lake Ka Ho is $44,444.
What is Inequality or Gini Index in Lake Ka Ho?
Inequality or Gini Index in Lake Ka Ho is 0.46.
What is the Total Population of Lake Ka Ho?
Total Population of Lake Ka Ho is 281.
What is the Total Male Population of Lake Ka Ho?
Total Male Population of Lake Ka Ho is 137.
What is the Total Female Population of Lake Ka Ho?
Total Female Population of Lake Ka Ho is 144.
What is the Ratio of Males per 100 Females in Lake Ka Ho?
There are 95.14 Males per 100 Females in Lake Ka Ho.
What is the Ratio of Females per 100 Males in Lake Ka Ho?
There are 105.11 Females per 100 Males in Lake Ka Ho.
What is the Median Population Age in Lake Ka Ho?
Median Population Age in Lake Ka Ho is 46.8 Years.
What is the Average Family Size in Lake Ka Ho
Average Family Size in Lake Ka Ho is 3.4 People.
What is the Average Household Size in Lake Ka Ho
Average Household Size in Lake Ka Ho is 2.5 People.
How Large is the Labor Force in Lake Ka Ho?
There are 96 People in the Labor Forcein in Lake Ka Ho.
What is the Percentage of People in the Labor Force in Lake Ka Ho?
42.3% of People are in the Labor Force in Lake Ka Ho.
What is the Unemployment Rate in Lake Ka Ho?
Unemployment Rate in Lake Ka Ho is 7.3%.