Joppa, IL Map & Demographics
Joppa Map
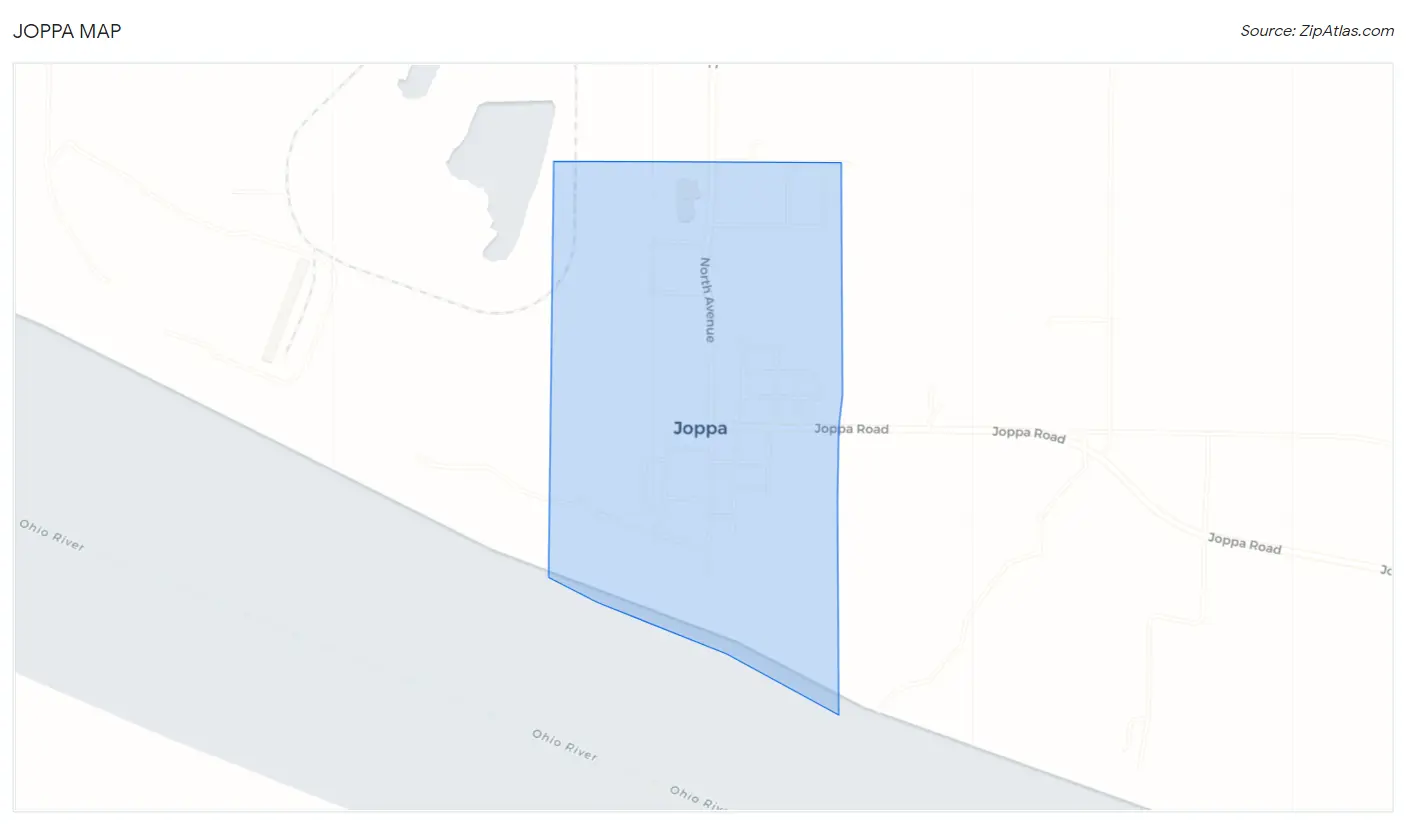
Joppa Overview
$18,688
PER CAPITA INCOME
$39,464
AVG HOUSEHOLD INCOME
17.1%
WAGE / INCOME GAP [ % ]
82.9¢/ $1
WAGE / INCOME GAP [ $ ]
0.45
INEQUALITY / GINI INDEX
333
TOTAL POPULATION
197
MALE POPULATION
136
FEMALE POPULATION
144.85
MALES / 100 FEMALES
69.04
FEMALES / 100 MALES
26.7
MEDIAN AGE
4.1
AVG FAMILY SIZE
3.4
AVG HOUSEHOLD SIZE
140
LABOR FORCE [ PEOPLE ]
54.3%
PERCENT IN LABOR FORCE
37.1%
UNEMPLOYMENT RATE
Joppa Zip Codes
Joppa Area Codes
Income in Joppa
Income Overview in Joppa
| Characteristic | Number | Measure |
| Per Capita Income | 333 | $18,688 |
| Median Family Income | 66 | $0 |
| Mean Family Income | 66 | $70,889 |
| Median Household Income | 99 | $39,464 |
| Mean Household Income | 99 | $56,096 |
| Income Deficit | 66 | $0 |
| Wage / Income Gap (%) | 333 | 17.07% |
| Wage / Income Gap ($) | 333 | 82.93¢ per $1 |
| Gini / Inequality Index | 333 | 0.45 |
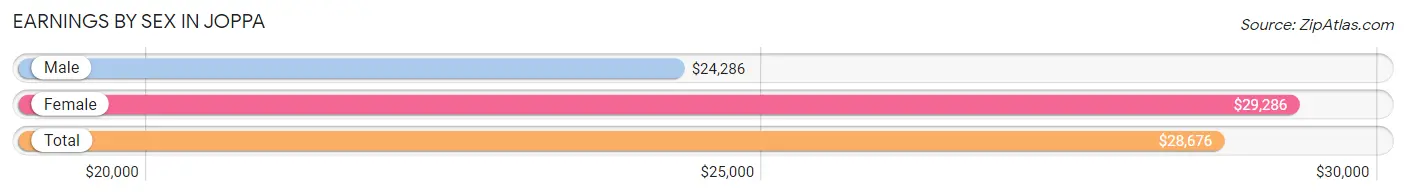
Earnings by Sex in Joppa
Average Earnings in Joppa are $28,676, $24,286 for men and $29,286 for women, a difference of 17.1%.
| Sex | Number | Average Earnings |
| Male | 100 (74.6%) | $24,286 |
| Female | 34 (25.4%) | $29,286 |
| Total | 134 (100.0%) | $28,676 |
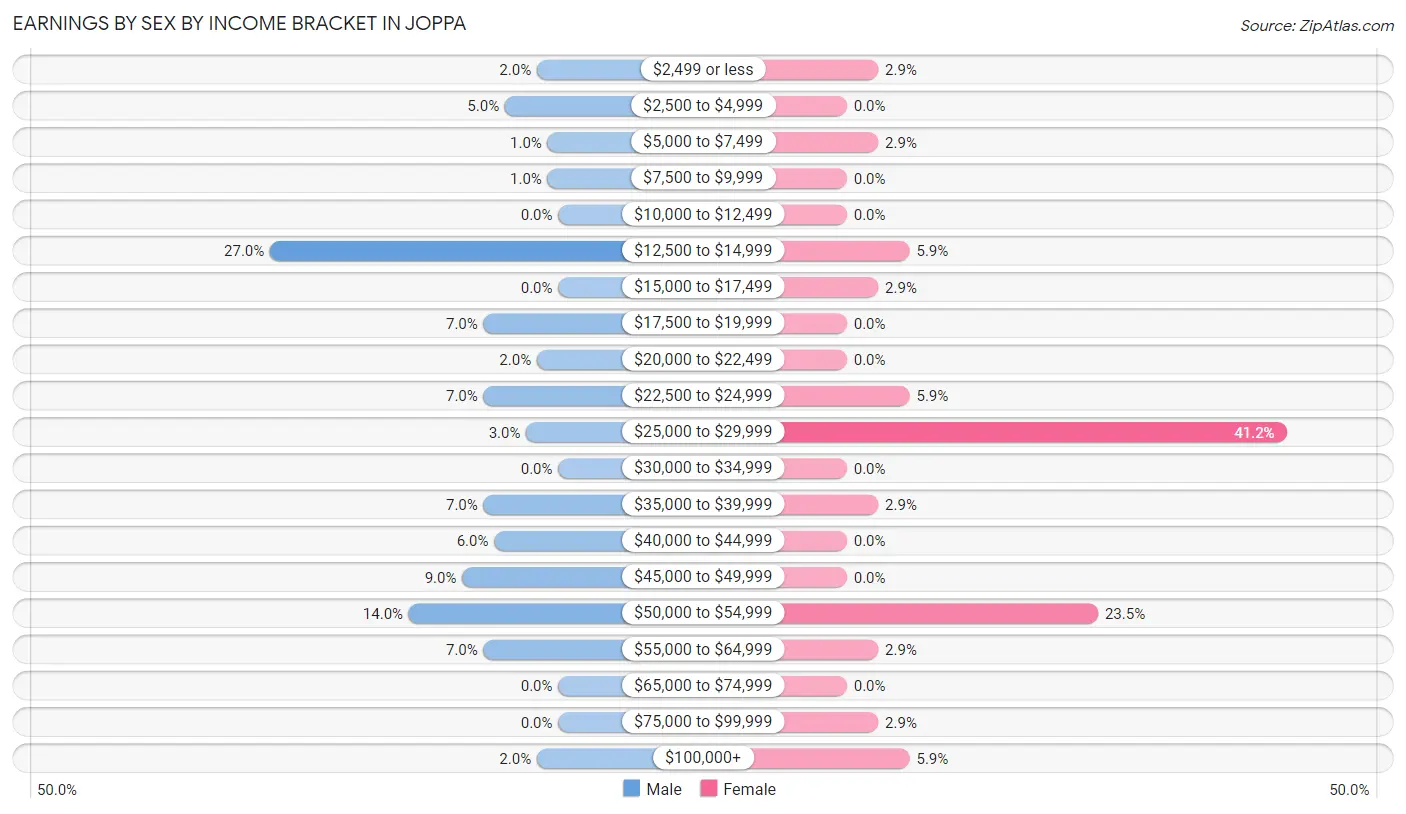
Earnings by Sex by Income Bracket in Joppa
The most common earnings brackets in Joppa are $12,500 to $14,999 for men (27 | 27.0%) and $25,000 to $29,999 for women (14 | 41.2%).
| Income | Male | Female |
| $2,499 or less | 2 (2.0%) | 1 (2.9%) |
| $2,500 to $4,999 | 5 (5.0%) | 0 (0.0%) |
| $5,000 to $7,499 | 1 (1.0%) | 1 (2.9%) |
| $7,500 to $9,999 | 1 (1.0%) | 0 (0.0%) |
| $10,000 to $12,499 | 0 (0.0%) | 0 (0.0%) |
| $12,500 to $14,999 | 27 (27.0%) | 2 (5.9%) |
| $15,000 to $17,499 | 0 (0.0%) | 1 (2.9%) |
| $17,500 to $19,999 | 7 (7.0%) | 0 (0.0%) |
| $20,000 to $22,499 | 2 (2.0%) | 0 (0.0%) |
| $22,500 to $24,999 | 7 (7.0%) | 2 (5.9%) |
| $25,000 to $29,999 | 3 (3.0%) | 14 (41.2%) |
| $30,000 to $34,999 | 0 (0.0%) | 0 (0.0%) |
| $35,000 to $39,999 | 7 (7.0%) | 1 (2.9%) |
| $40,000 to $44,999 | 6 (6.0%) | 0 (0.0%) |
| $45,000 to $49,999 | 9 (9.0%) | 0 (0.0%) |
| $50,000 to $54,999 | 14 (14.0%) | 8 (23.5%) |
| $55,000 to $64,999 | 7 (7.0%) | 1 (2.9%) |
| $65,000 to $74,999 | 0 (0.0%) | 0 (0.0%) |
| $75,000 to $99,999 | 0 (0.0%) | 1 (2.9%) |
| $100,000+ | 2 (2.0%) | 2 (5.9%) |
| Total | 100 (100.0%) | 34 (100.0%) |
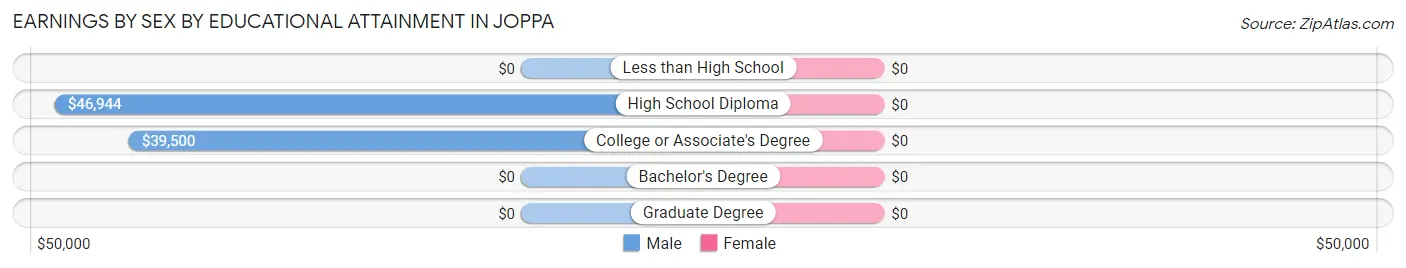
Earnings by Sex by Educational Attainment in Joppa
| Educational Attainment | Male Income | Female Income |
| Less than High School | - | - |
| High School Diploma | $46,944 | $0 |
| College or Associate's Degree | $39,500 | $0 |
| Bachelor's Degree | - | - |
| Graduate Degree | - | - |
| Total | $42,500 | $0 |
Family Income in Joppa
Family Income Brackets in Joppa
According to the Joppa family income data, there are 22 families falling into the $100,000 to $149,999 income range, which is the most common income bracket and makes up 33.3% of all families.
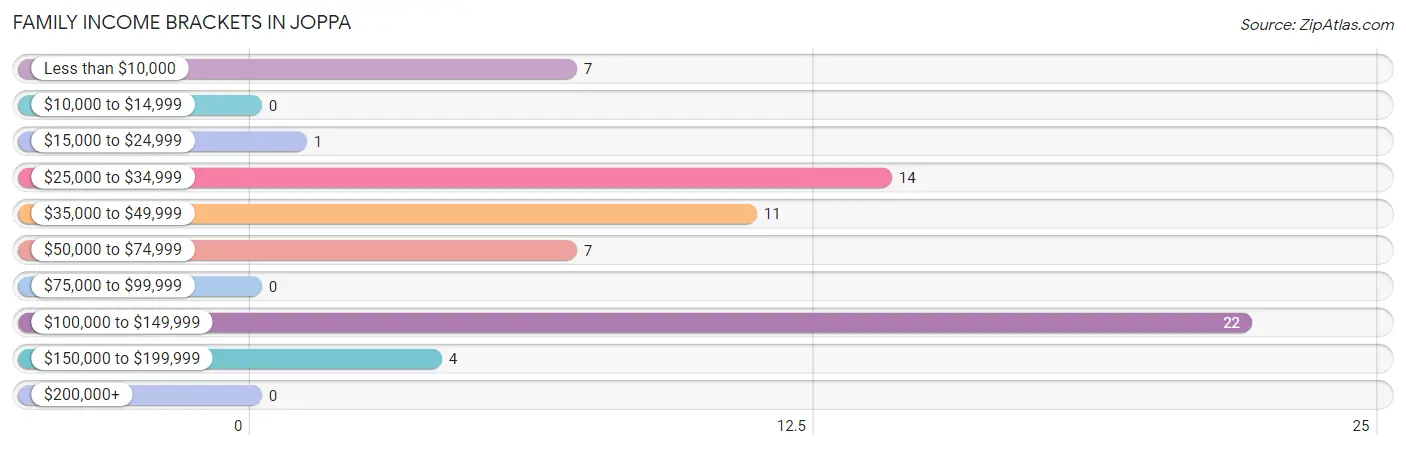
| Income Bracket | # Families | % Families |
| Less than $10,000 | 7 | 10.6% |
| $10,000 to $14,999 | 0 | 0.0% |
| $15,000 to $24,999 | 1 | 1.5% |
| $25,000 to $34,999 | 14 | 21.2% |
| $35,000 to $49,999 | 11 | 16.7% |
| $50,000 to $74,999 | 7 | 10.6% |
| $75,000 to $99,999 | 0 | 0.0% |
| $100,000 to $149,999 | 22 | 33.3% |
| $150,000 to $199,999 | 4 | 6.1% |
| $200,000+ | 0 | 0.0% |
Family Income by Famaliy Size in Joppa
3-person families (23 | 34.8%) account for the highest median family income in Joppa with $105,893 per family, while 3-person families (23 | 34.8%) have the highest median income of $35,298 per family member.
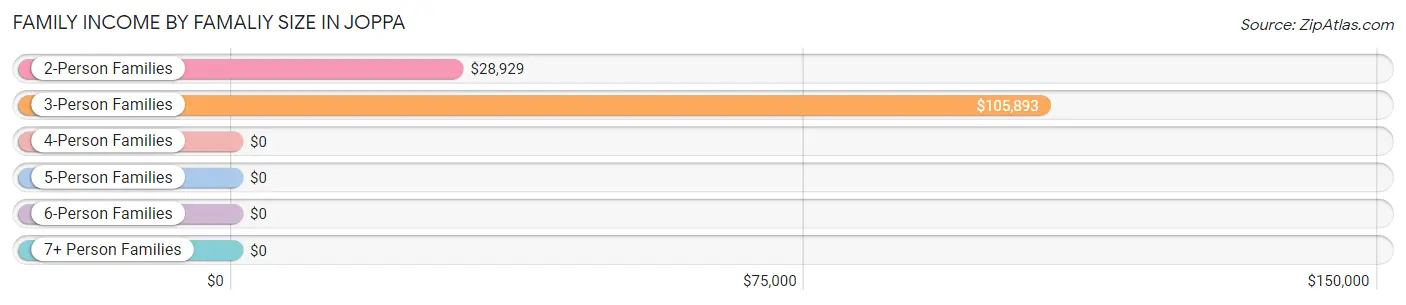
| Income Bracket | # Families | Median Income |
| 2-Person Families | 16 (24.2%) | $28,929 |
| 3-Person Families | 23 (34.8%) | $105,893 |
| 4-Person Families | 10 (15.1%) | $0 |
| 5-Person Families | 17 (25.8%) | $0 |
| 6-Person Families | 0 (0.0%) | $0 |
| 7+ Person Families | 0 (0.0%) | $0 |
| Total | 66 (100.0%) | $0 |
Family Income by Number of Earners in Joppa
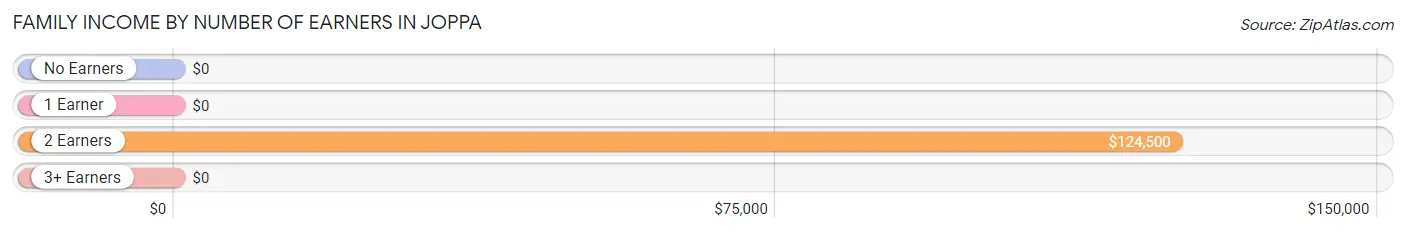
| Number of Earners | # Families | Median Income |
| No Earners | 10 (15.1%) | $0 |
| 1 Earner | 30 (45.5%) | $0 |
| 2 Earners | 26 (39.4%) | $124,500 |
| 3+ Earners | 0 (0.0%) | $0 |
| Total | 66 (100.0%) | $0 |
Household Income in Joppa
Household Income Brackets in Joppa
With 22 households falling in the category, the $100,000 to $149,999 income range is the most frequent in Joppa, accounting for 22.2% of all households.
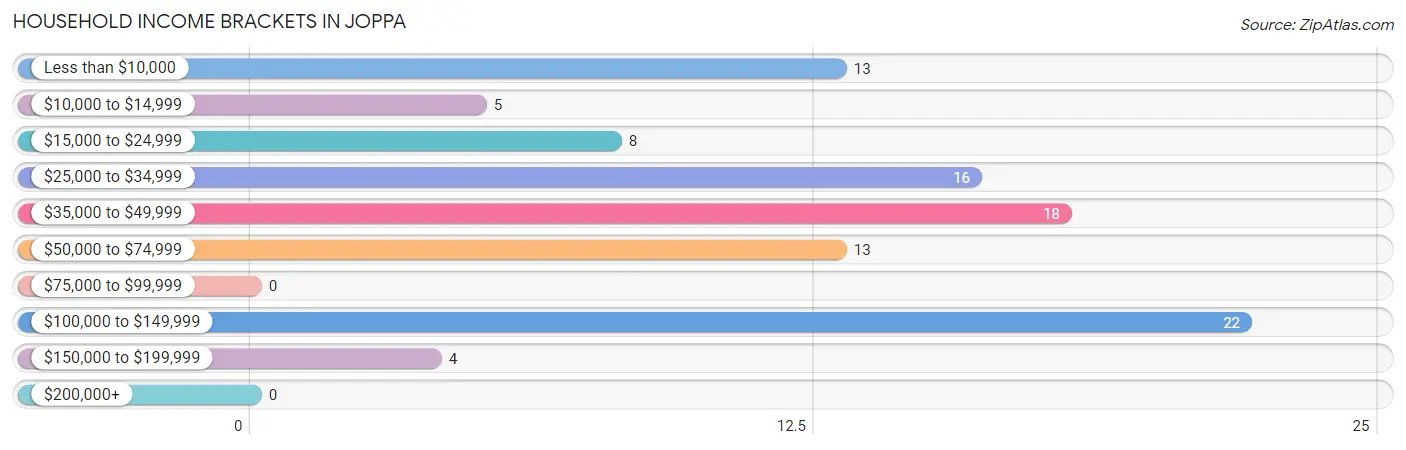
| Income Bracket | # Households | % Households |
| Less than $10,000 | 13 | 13.1% |
| $10,000 to $14,999 | 5 | 5.1% |
| $15,000 to $24,999 | 8 | 8.1% |
| $25,000 to $34,999 | 16 | 16.2% |
| $35,000 to $49,999 | 18 | 18.2% |
| $50,000 to $74,999 | 13 | 13.1% |
| $75,000 to $99,999 | 0 | 0.0% |
| $100,000 to $149,999 | 22 | 22.2% |
| $150,000 to $199,999 | 4 | 4.0% |
| $200,000+ | 0 | 0.0% |
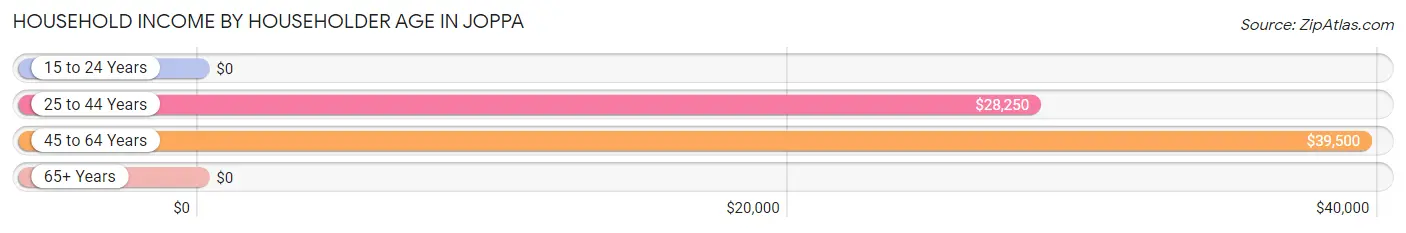
Household Income by Householder Age in Joppa
The median household income in Joppa is $39,464, with the highest median household income of $39,500 found in the 45 to 64 years age bracket for the primary householder. A total of 54 households (54.5%) fall into this category. Meanwhile, the 15 to 24 years age bracket for the primary householder has the lowest median household income of $0, with 7 households (7.1%) in this group.
| Income Bracket | # Households | Median Income |
| 15 to 24 Years | 7 (7.1%) | $0 |
| 25 to 44 Years | 17 (17.2%) | $28,250 |
| 45 to 64 Years | 54 (54.5%) | $39,500 |
| 65+ Years | 21 (21.2%) | $0 |
| Total | 99 (100.0%) | $39,464 |
Poverty in Joppa
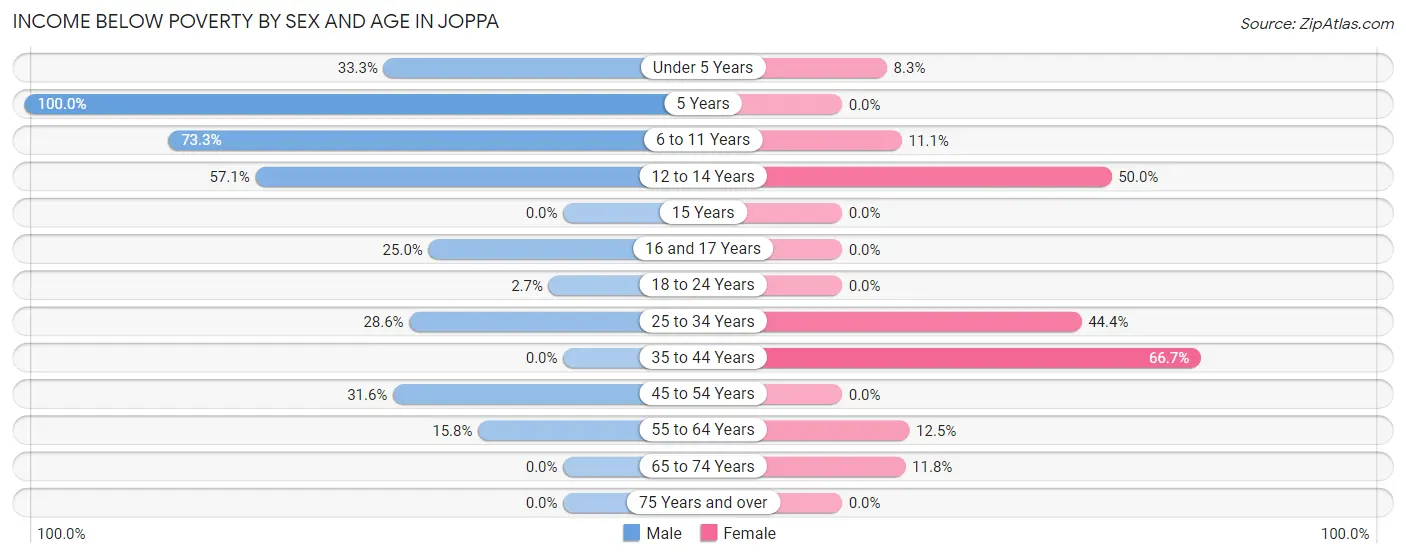
Income Below Poverty by Sex and Age in Joppa
With 24.0% poverty level for males and 15.0% for females among the residents of Joppa, 5 year old males and 35 to 44 year old females are the most vulnerable to poverty, with 4 males (100.0%) and 2 females (66.7%) in their respective age groups living below the poverty level.
| Age Bracket | Male | Female |
| Under 5 Years | 2 (33.3%) | 1 (8.3%) |
| 5 Years | 4 (100.0%) | 0 (0.0%) |
| 6 to 11 Years | 11 (73.3%) | 1 (11.1%) |
| 12 to 14 Years | 4 (57.1%) | 4 (50.0%) |
| 15 Years | 0 (0.0%) | 0 (0.0%) |
| 16 and 17 Years | 2 (25.0%) | 0 (0.0%) |
| 18 to 24 Years | 1 (2.7%) | 0 (0.0%) |
| 25 to 34 Years | 10 (28.6%) | 8 (44.4%) |
| 35 to 44 Years | 0 (0.0%) | 2 (66.7%) |
| 45 to 54 Years | 6 (31.6%) | 0 (0.0%) |
| 55 to 64 Years | 6 (15.8%) | 1 (12.5%) |
| 65 to 74 Years | 0 (0.0%) | 2 (11.8%) |
| 75 Years and over | 0 (0.0%) | 0 (0.0%) |
| Total | 46 (24.0%) | 19 (15.0%) |
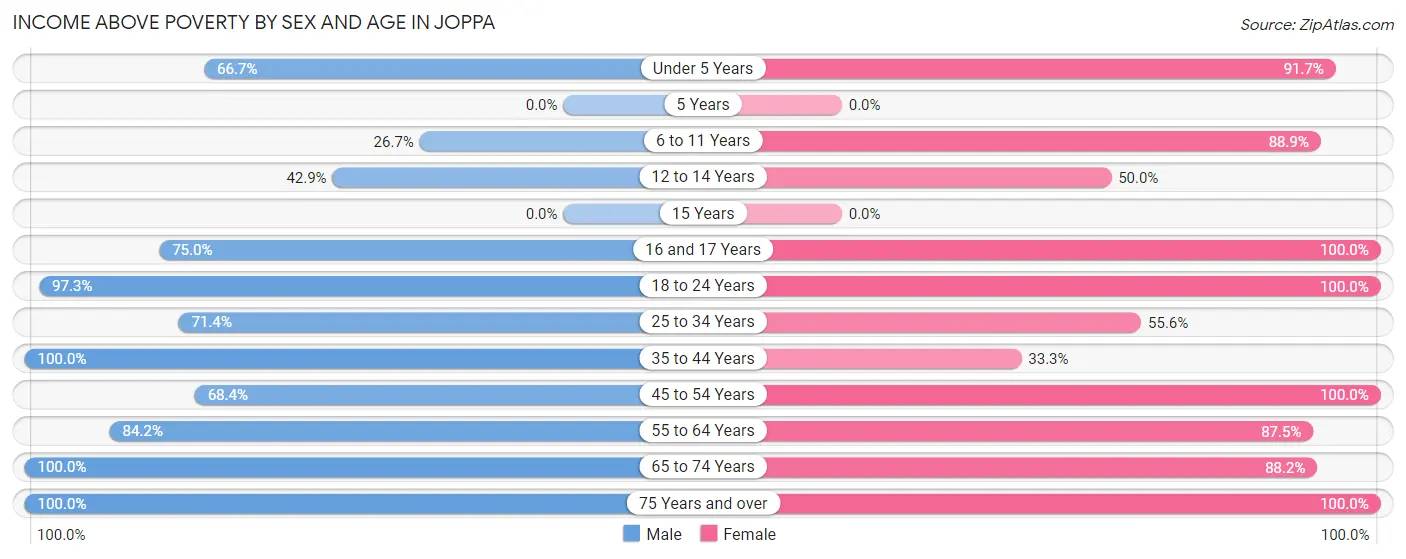
Income Above Poverty by Sex and Age in Joppa
According to the poverty statistics in Joppa, males aged 35 to 44 years and females aged 16 and 17 years are the age groups that are most secure financially, with 100.0% of males and 100.0% of females in these age groups living above the poverty line.
| Age Bracket | Male | Female |
| Under 5 Years | 4 (66.7%) | 11 (91.7%) |
| 5 Years | 0 (0.0%) | 0 (0.0%) |
| 6 to 11 Years | 4 (26.7%) | 8 (88.9%) |
| 12 to 14 Years | 3 (42.9%) | 4 (50.0%) |
| 15 Years | 0 (0.0%) | 0 (0.0%) |
| 16 and 17 Years | 6 (75.0%) | 17 (100.0%) |
| 18 to 24 Years | 36 (97.3%) | 15 (100.0%) |
| 25 to 34 Years | 25 (71.4%) | 10 (55.6%) |
| 35 to 44 Years | 2 (100.0%) | 1 (33.3%) |
| 45 to 54 Years | 13 (68.4%) | 12 (100.0%) |
| 55 to 64 Years | 32 (84.2%) | 7 (87.5%) |
| 65 to 74 Years | 16 (100.0%) | 15 (88.2%) |
| 75 Years and over | 5 (100.0%) | 8 (100.0%) |
| Total | 146 (76.0%) | 108 (85.0%) |
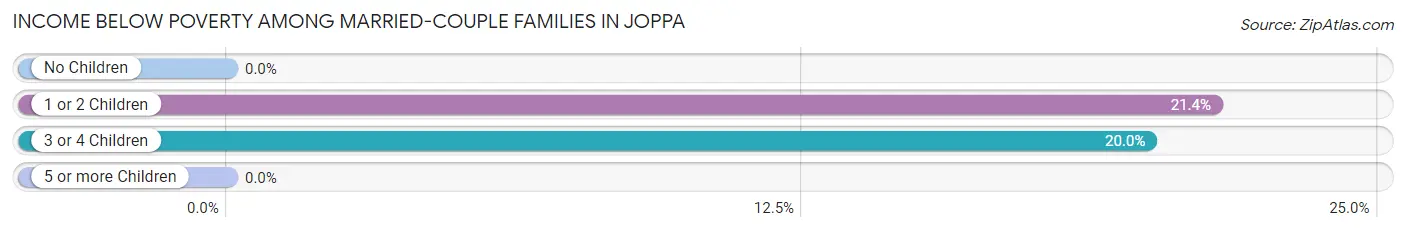
Income Below Poverty Among Married-Couple Families in Joppa
The poverty statistics for married-couple families in Joppa show that 9.5% or 4 of the total 42 families live below the poverty line. Families with 1 or 2 children have the highest poverty rate of 21.4%, comprising of 3 families. On the other hand, families with no children have the lowest poverty rate of 0.0%, which includes 0 families.
| Children | Above Poverty | Below Poverty |
| No Children | 23 (100.0%) | 0 (0.0%) |
| 1 or 2 Children | 11 (78.6%) | 3 (21.4%) |
| 3 or 4 Children | 4 (80.0%) | 1 (20.0%) |
| 5 or more Children | 0 (0.0%) | 0 (0.0%) |
| Total | 38 (90.5%) | 4 (9.5%) |
Income Below Poverty Among Single-Parent Households in Joppa
According to the poverty data in Joppa, 41.7% or 5 single-father households and 16.7% or 2 single-mother households are living below the poverty line. Among single-father households, those with 3 or 4 children have the highest poverty rate, with 5 households (100.0%) experiencing poverty. Likewise, among single-mother households, those with 1 or 2 children have the highest poverty rate, with 2 households (66.7%) falling below the poverty line.
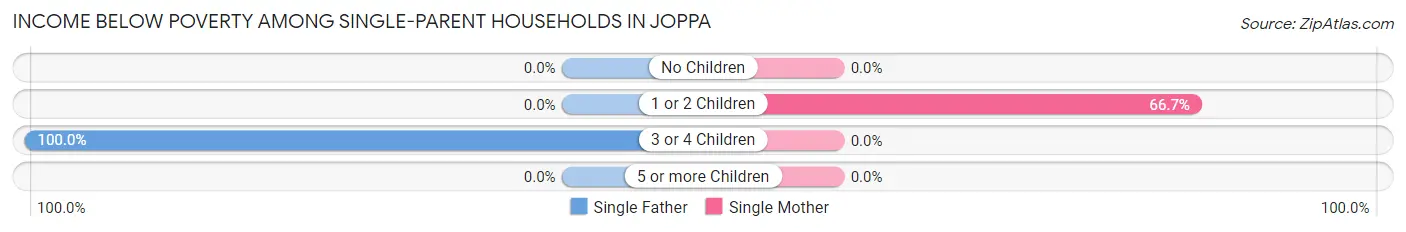
| Children | Single Father | Single Mother |
| No Children | 0 (0.0%) | 0 (0.0%) |
| 1 or 2 Children | 0 (0.0%) | 2 (66.7%) |
| 3 or 4 Children | 5 (100.0%) | 0 (0.0%) |
| 5 or more Children | 0 (0.0%) | 0 (0.0%) |
| Total | 5 (41.7%) | 2 (16.7%) |
Income Below Poverty Among Married-Couple vs Single-Parent Households in Joppa
The poverty data for Joppa shows that 4 of the married-couple family households (9.5%) and 7 of the single-parent households (29.2%) are living below the poverty level. Within the married-couple family households, those with 1 or 2 children have the highest poverty rate, with 3 households (21.4%) falling below the poverty line. Among the single-parent households, those with 3 or 4 children have the highest poverty rate, with 5 household (62.5%) living below poverty.
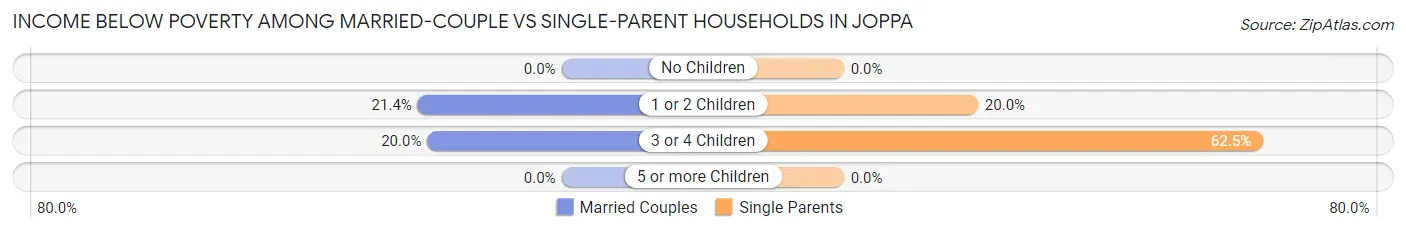
| Children | Married-Couple Families | Single-Parent Households |
| No Children | 0 (0.0%) | 0 (0.0%) |
| 1 or 2 Children | 3 (21.4%) | 2 (20.0%) |
| 3 or 4 Children | 1 (20.0%) | 5 (62.5%) |
| 5 or more Children | 0 (0.0%) | 0 (0.0%) |
| Total | 4 (9.5%) | 7 (29.2%) |
Race in Joppa
The most populous races in Joppa are White / Caucasian (314 | 94.3%), Black / African American (12 | 3.6%), and Two or more Races (7 | 2.1%).
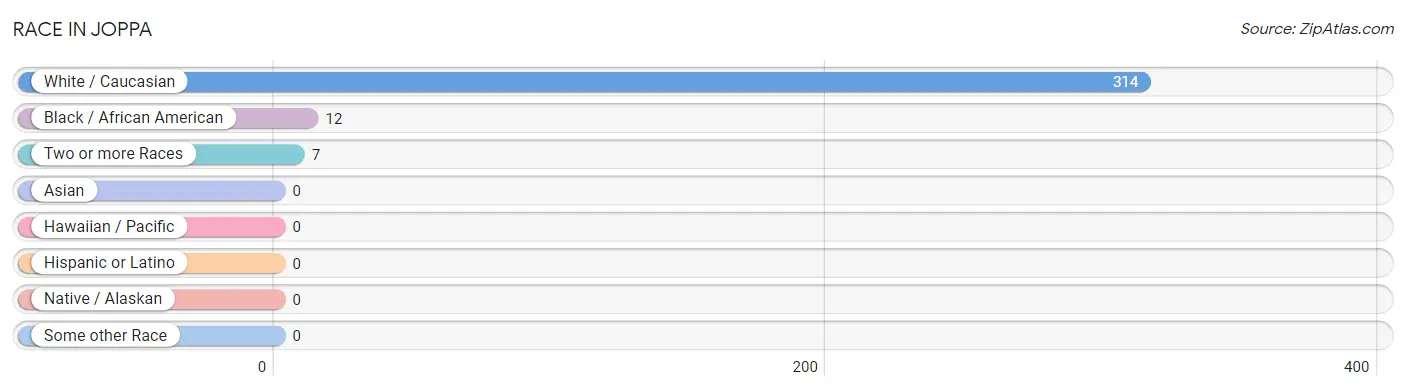
| Race | # Population | % Population |
| Asian | 0 | 0.0% |
| Black / African American | 12 | 3.6% |
| Hawaiian / Pacific | 0 | 0.0% |
| Hispanic or Latino | 0 | 0.0% |
| Native / Alaskan | 0 | 0.0% |
| White / Caucasian | 314 | 94.3% |
| Two or more Races | 7 | 2.1% |
| Some other Race | 0 | 0.0% |
| Total | 333 | 100.0% |
Ancestry in Joppa
The most populous ancestries reported in Joppa are Irish (47 | 14.1%), German (17 | 5.1%), American (6 | 1.8%), English (5 | 1.5%), and Scotch-Irish (5 | 1.5%), together accounting for 24.0% of all Joppa residents.
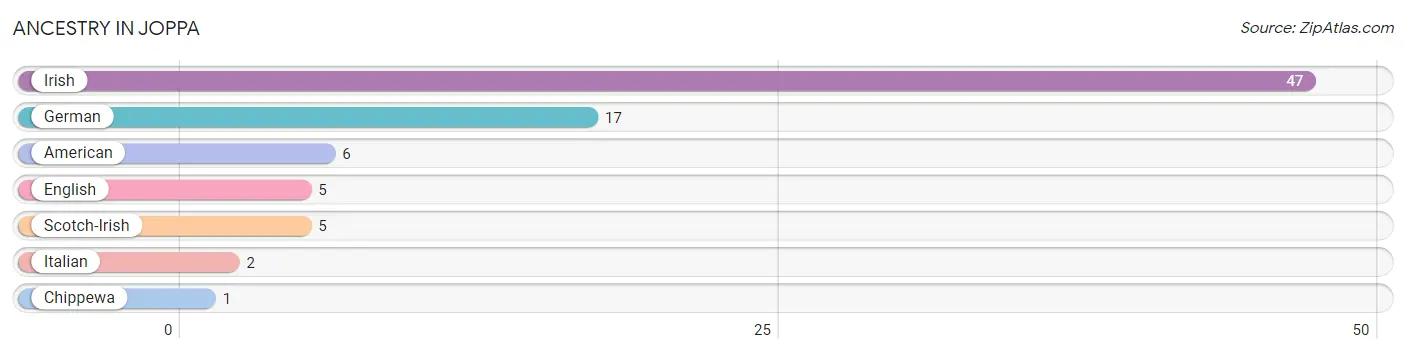
| Ancestry | # Population | % Population |
| American | 6 | 1.8% |
| Chippewa | 1 | 0.3% |
| English | 5 | 1.5% |
| German | 17 | 5.1% |
| Irish | 47 | 14.1% |
| Italian | 2 | 0.6% |
| Scotch-Irish | 5 | 1.5% | View All 7 Rows |
Immigrants in Joppa
The most numerous immigrant groups reported in Joppa came from England (1 | 0.3%), Europe (1 | 0.3%), and Northern Europe (1 | 0.3%), together accounting for 0.9% of all Joppa residents.
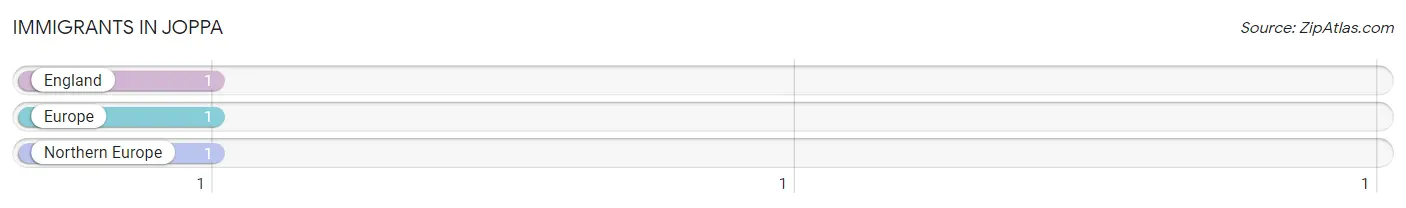
| Immigration Origin | # Population | % Population |
| England | 1 | 0.3% |
| Europe | 1 | 0.3% |
| Northern Europe | 1 | 0.3% | View All 3 Rows |
Sex and Age in Joppa
Sex and Age in Joppa
The most populous age groups in Joppa are 20 to 24 Years (34 | 17.3%) for men and 15 to 19 Years (25 | 18.4%) for women.
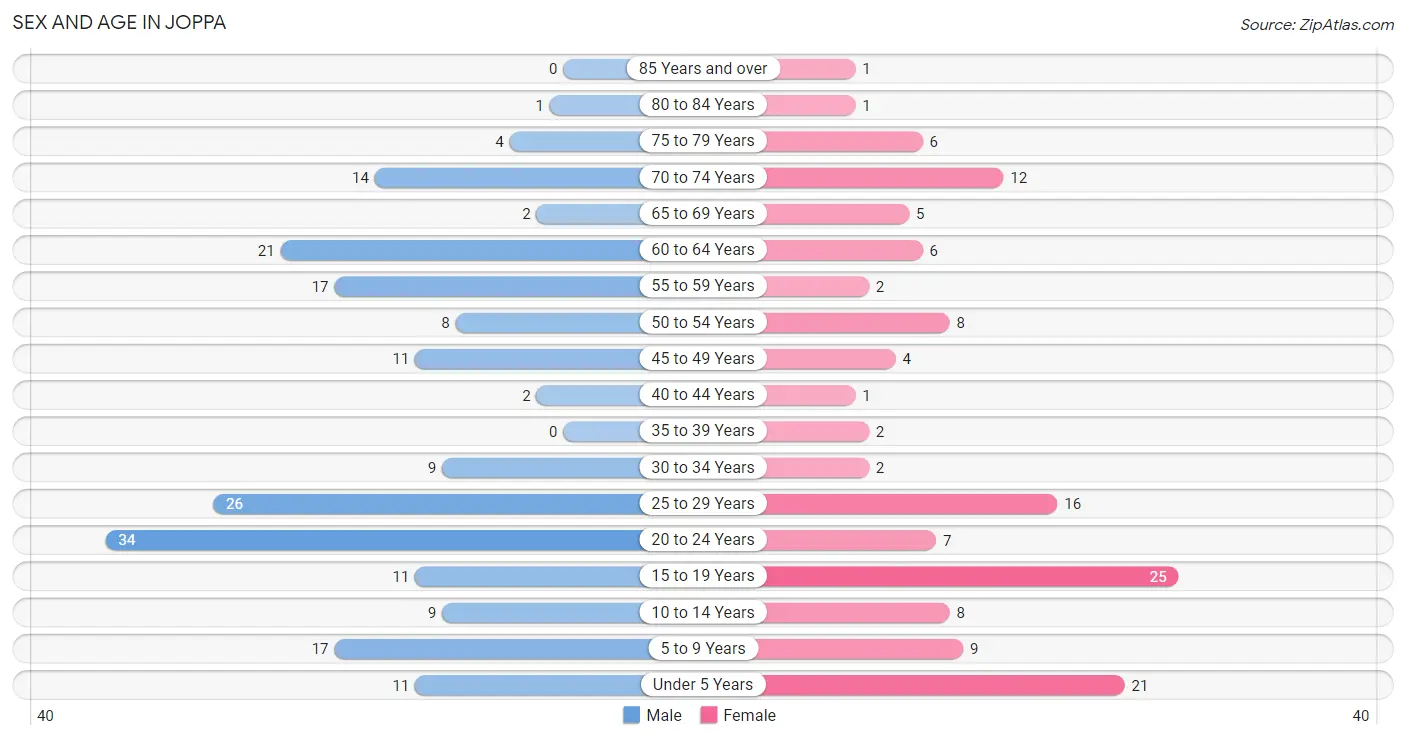
| Age Bracket | Male | Female |
| Under 5 Years | 11 (5.6%) | 21 (15.4%) |
| 5 to 9 Years | 17 (8.6%) | 9 (6.6%) |
| 10 to 14 Years | 9 (4.6%) | 8 (5.9%) |
| 15 to 19 Years | 11 (5.6%) | 25 (18.4%) |
| 20 to 24 Years | 34 (17.3%) | 7 (5.1%) |
| 25 to 29 Years | 26 (13.2%) | 16 (11.8%) |
| 30 to 34 Years | 9 (4.6%) | 2 (1.5%) |
| 35 to 39 Years | 0 (0.0%) | 2 (1.5%) |
| 40 to 44 Years | 2 (1.0%) | 1 (0.7%) |
| 45 to 49 Years | 11 (5.6%) | 4 (2.9%) |
| 50 to 54 Years | 8 (4.1%) | 8 (5.9%) |
| 55 to 59 Years | 17 (8.6%) | 2 (1.5%) |
| 60 to 64 Years | 21 (10.7%) | 6 (4.4%) |
| 65 to 69 Years | 2 (1.0%) | 5 (3.7%) |
| 70 to 74 Years | 14 (7.1%) | 12 (8.8%) |
| 75 to 79 Years | 4 (2.0%) | 6 (4.4%) |
| 80 to 84 Years | 1 (0.5%) | 1 (0.7%) |
| 85 Years and over | 0 (0.0%) | 1 (0.7%) |
| Total | 197 (100.0%) | 136 (100.0%) |
Families and Households in Joppa
Median Family Size in Joppa
The median family size in Joppa is 4.14 persons per family, with married-couple families (42 | 63.6%) accounting for the largest median family size of 4.48 persons per family. On the other hand, single male/father families (12 | 18.2%) represent the smallest median family size with 3.00 persons per family.
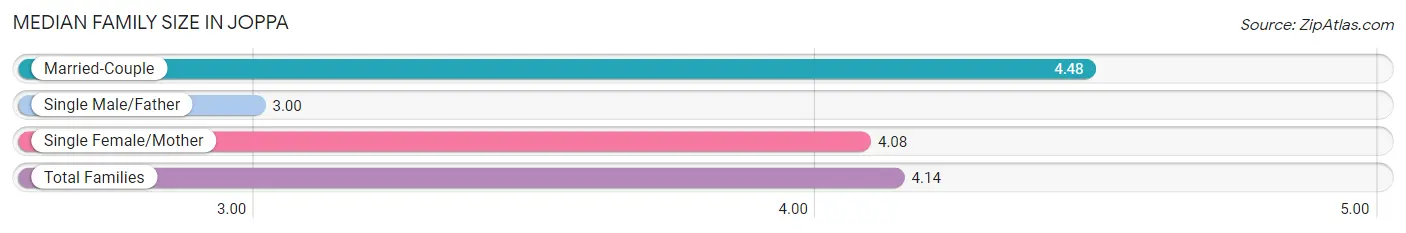
| Family Type | # Families | Family Size |
| Married-Couple | 42 (63.6%) | 4.48 |
| Single Male/Father | 12 (18.2%) | 3.00 |
| Single Female/Mother | 12 (18.2%) | 4.08 |
| Total Families | 66 (100.0%) | 4.14 |
Median Household Size in Joppa
The median household size in Joppa is 3.36 persons per household, with single female/mother households (12 | 12.1%) accounting for the largest median household size of 5.75 persons per household. non-family households (33 | 33.3%) represent the smallest median household size with 1.09 persons per household.
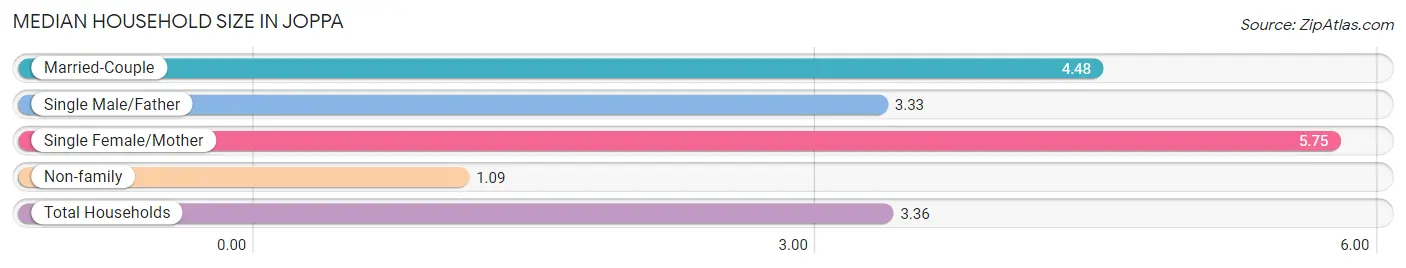
| Household Type | # Households | Household Size |
| Married-Couple | 42 (42.4%) | 4.48 |
| Single Male/Father | 12 (12.1%) | 3.33 |
| Single Female/Mother | 12 (12.1%) | 5.75 |
| Non-family | 33 (33.3%) | 1.09 |
| Total Households | 99 (100.0%) | 3.36 |
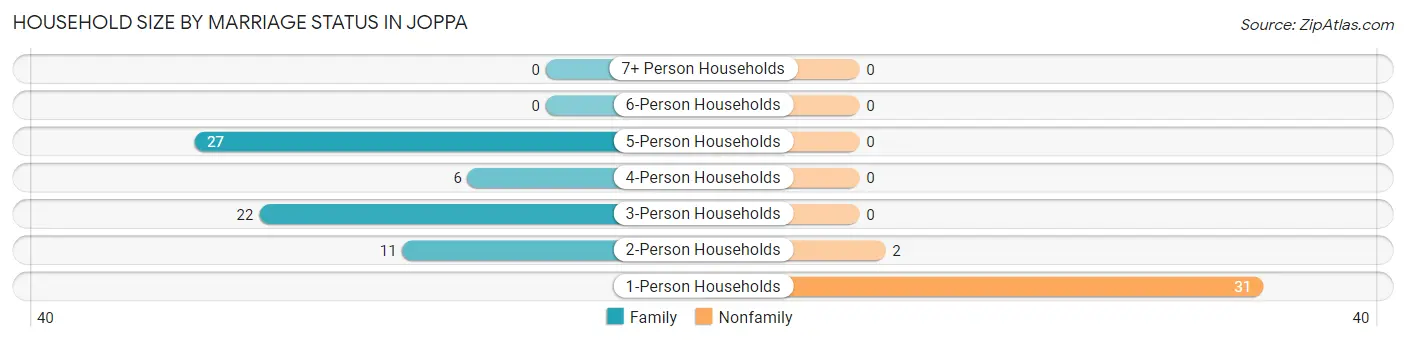
Household Size by Marriage Status in Joppa
Out of a total of 99 households in Joppa, 66 (66.7%) are family households, while 33 (33.3%) are nonfamily households. The most numerous type of family households are 5-person households, comprising 27, and the most common type of nonfamily households are 1-person households, comprising 31.
| Household Size | Family Households | Nonfamily Households |
| 1-Person Households | - | 31 (31.3%) |
| 2-Person Households | 11 (11.1%) | 2 (2.0%) |
| 3-Person Households | 22 (22.2%) | 0 (0.0%) |
| 4-Person Households | 6 (6.1%) | 0 (0.0%) |
| 5-Person Households | 27 (27.3%) | 0 (0.0%) |
| 6-Person Households | 0 (0.0%) | 0 (0.0%) |
| 7+ Person Households | 0 (0.0%) | 0 (0.0%) |
| Total | 66 (66.7%) | 33 (33.3%) |
Female Fertility in Joppa
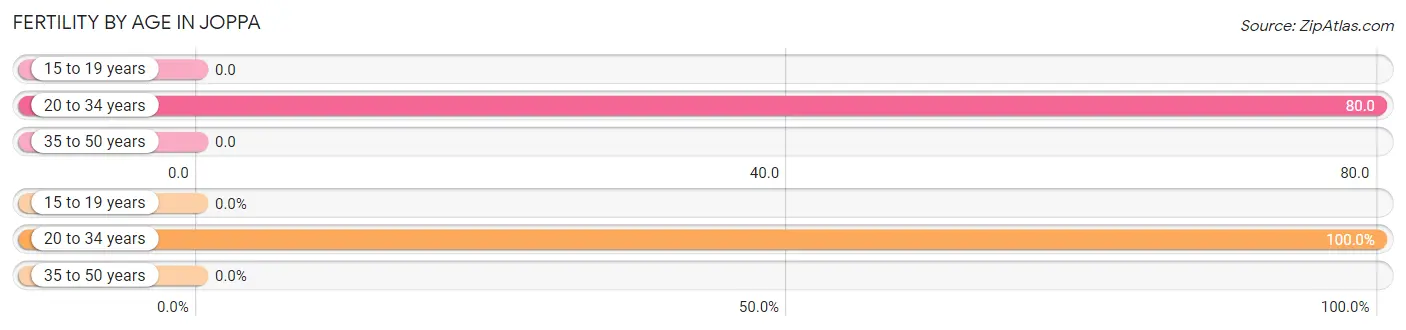
Fertility by Age in Joppa
Average fertility rate in Joppa is 35.0 births per 1,000 women. Women in the age bracket of 20 to 34 years have the highest fertility rate with 80.0 births per 1,000 women. Women in the age bracket of 20 to 34 years acount for 100.0% of all women with births.
| Age Bracket | Women with Births | Births / 1,000 Women |
| 15 to 19 years | 0 (0.0%) | 0.0 |
| 20 to 34 years | 2 (100.0%) | 80.0 |
| 35 to 50 years | 0 (0.0%) | 0.0 |
| Total | 2 (100.0%) | 35.0 |
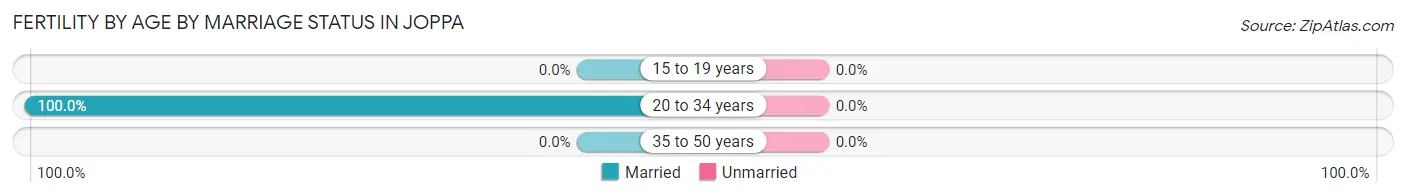
Fertility by Age by Marriage Status in Joppa
| Age Bracket | Married | Unmarried |
| 15 to 19 years | 0 (0.0%) | 0 (0.0%) |
| 20 to 34 years | 2 (100.0%) | 0 (0.0%) |
| 35 to 50 years | 0 (0.0%) | 0 (0.0%) |
| Total | 2 (100.0%) | 0 (0.0%) |
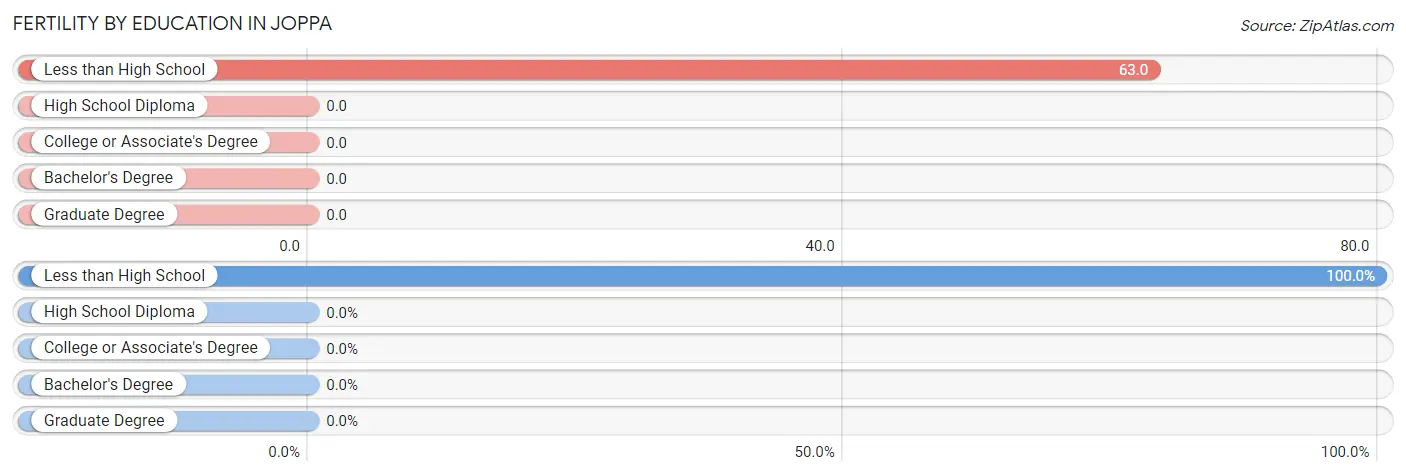
Fertility by Education in Joppa
| Educational Attainment | Women with Births | Births / 1,000 Women |
| Less than High School | 2 (100.0%) | 63.0 |
| High School Diploma | 0 (0.0%) | 0.0 |
| College or Associate's Degree | 0 (0.0%) | 0.0 |
| Bachelor's Degree | 0 (0.0%) | 0.0 |
| Graduate Degree | 0 (0.0%) | 0.0 |
| Total | 2 (100.0%) | 35.0 |
Fertility by Education by Marriage Status in Joppa
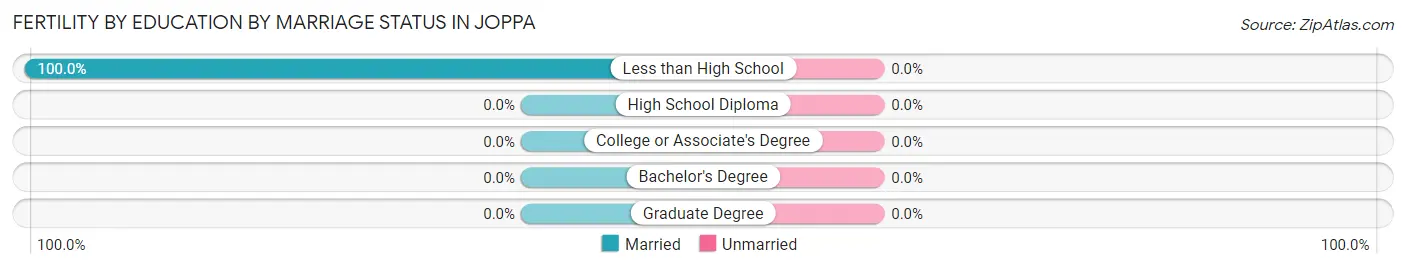
| Educational Attainment | Married | Unmarried |
| Less than High School | 2 (100.0%) | 0 (0.0%) |
| High School Diploma | 0 (0.0%) | 0 (0.0%) |
| College or Associate's Degree | 0 (0.0%) | 0 (0.0%) |
| Bachelor's Degree | 0 (0.0%) | 0 (0.0%) |
| Graduate Degree | 0 (0.0%) | 0 (0.0%) |
| Total | 2 (100.0%) | 0 (0.0%) |
Employment Characteristics in Joppa
Employment by Class of Employer in Joppa
Among the 88 employed individuals in Joppa, private company employees (64 | 72.7%), state government employees (13 | 14.8%), and self-employed (not incorporated) (5 | 5.7%) make up the most common classes of employment.
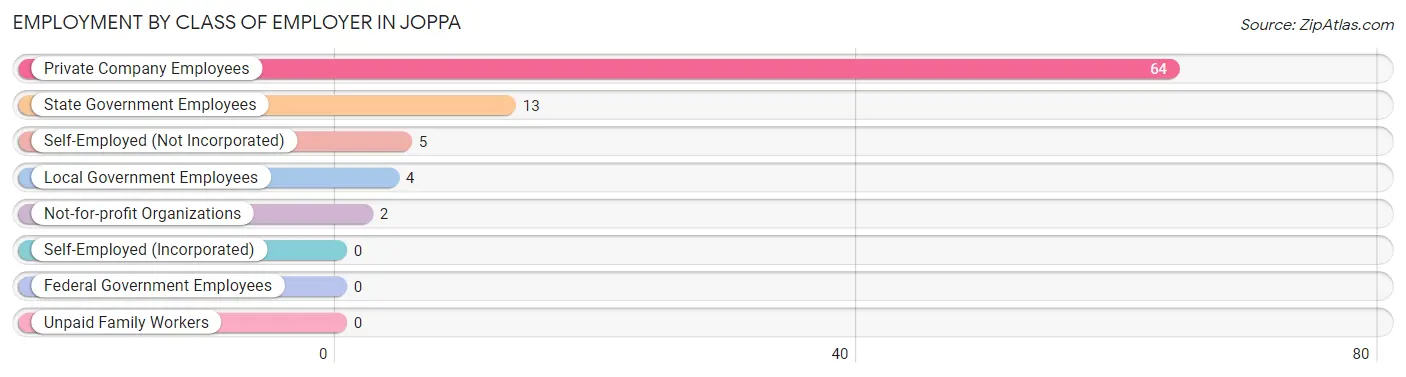
| Employer Class | # Employees | % Employees |
| Private Company Employees | 64 | 72.7% |
| Self-Employed (Incorporated) | 0 | 0.0% |
| Self-Employed (Not Incorporated) | 5 | 5.7% |
| Not-for-profit Organizations | 2 | 2.3% |
| Local Government Employees | 4 | 4.5% |
| State Government Employees | 13 | 14.8% |
| Federal Government Employees | 0 | 0.0% |
| Unpaid Family Workers | 0 | 0.0% |
| Total | 88 | 100.0% |
Employment Status by Age in Joppa
According to the labor force statistics for Joppa, out of the total population over 16 years of age (258), 54.3% or 140 individuals are in the labor force, with 37.1% or 52 of them unemployed. The age group with the highest labor force participation rate is 45 to 54 years, with 100.0% or 31 individuals in the labor force. Within the labor force, the 16 to 19 years age range has the highest percentage of unemployed individuals, with 100.0% or 1 of them being unemployed.
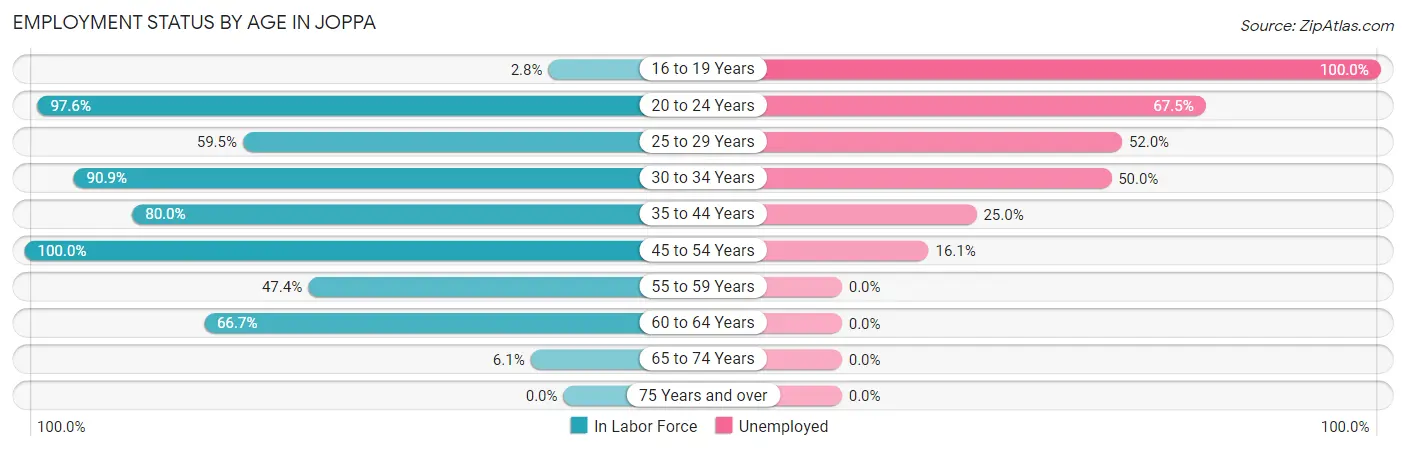
| Age Bracket | In Labor Force | Unemployed |
| 16 to 19 Years | 1 (2.8%) | 1 (100.0%) |
| 20 to 24 Years | 40 (97.6%) | 27 (67.5%) |
| 25 to 29 Years | 25 (59.5%) | 13 (52.0%) |
| 30 to 34 Years | 10 (90.9%) | 5 (50.0%) |
| 35 to 44 Years | 4 (80.0%) | 1 (25.0%) |
| 45 to 54 Years | 31 (100.0%) | 5 (16.1%) |
| 55 to 59 Years | 9 (47.4%) | 0 (0.0%) |
| 60 to 64 Years | 18 (66.7%) | 0 (0.0%) |
| 65 to 74 Years | 2 (6.1%) | 0 (0.0%) |
| 75 Years and over | 0 (0.0%) | 0 (0.0%) |
| Total | 140 (54.3%) | 52 (37.1%) |
Employment Status by Educational Attainment in Joppa
According to labor force statistics for Joppa, 71.9% of individuals (97) out of the total population between 25 and 64 years of age (135) are in the labor force, with 24.7% or 24 of them being unemployed. The group with the highest labor force participation rate are those with the educational attainment of bachelor's degree or higher, with 100.0% or 5 individuals in the labor force. Within the labor force, individuals with high school diploma education have the highest percentage of unemployment, with 48.6% or 17 of them being unemployed.
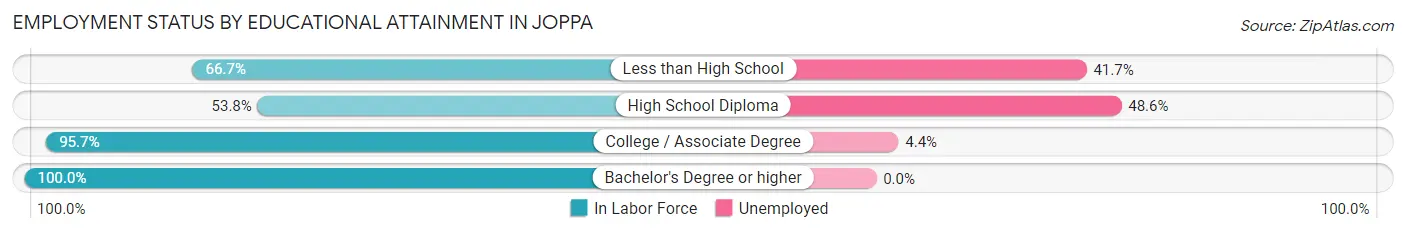
| Educational Attainment | In Labor Force | Unemployed |
| Less than High School | 12 (66.7%) | 8 (41.7%) |
| High School Diploma | 35 (53.8%) | 32 (48.6%) |
| College / Associate Degree | 45 (95.7%) | 2 (4.4%) |
| Bachelor's Degree or higher | 5 (100.0%) | 0 (0.0%) |
| Total | 97 (71.9%) | 33 (24.7%) |
Employment Occupations by Sex in Joppa
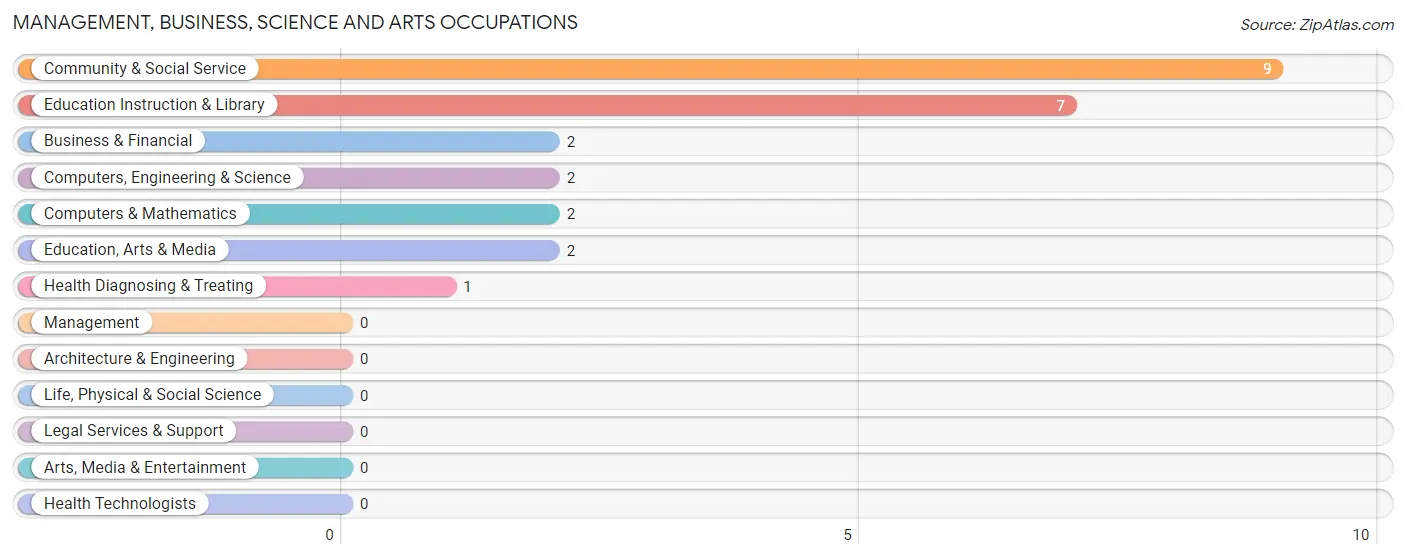
Management, Business, Science and Arts Occupations
The most common Management, Business, Science and Arts occupations in Joppa are Community & Social Service (9 | 10.2%), Education Instruction & Library (7 | 8.0%), Business & Financial (2 | 2.3%), Computers, Engineering & Science (2 | 2.3%), and Computers & Mathematics (2 | 2.3%).
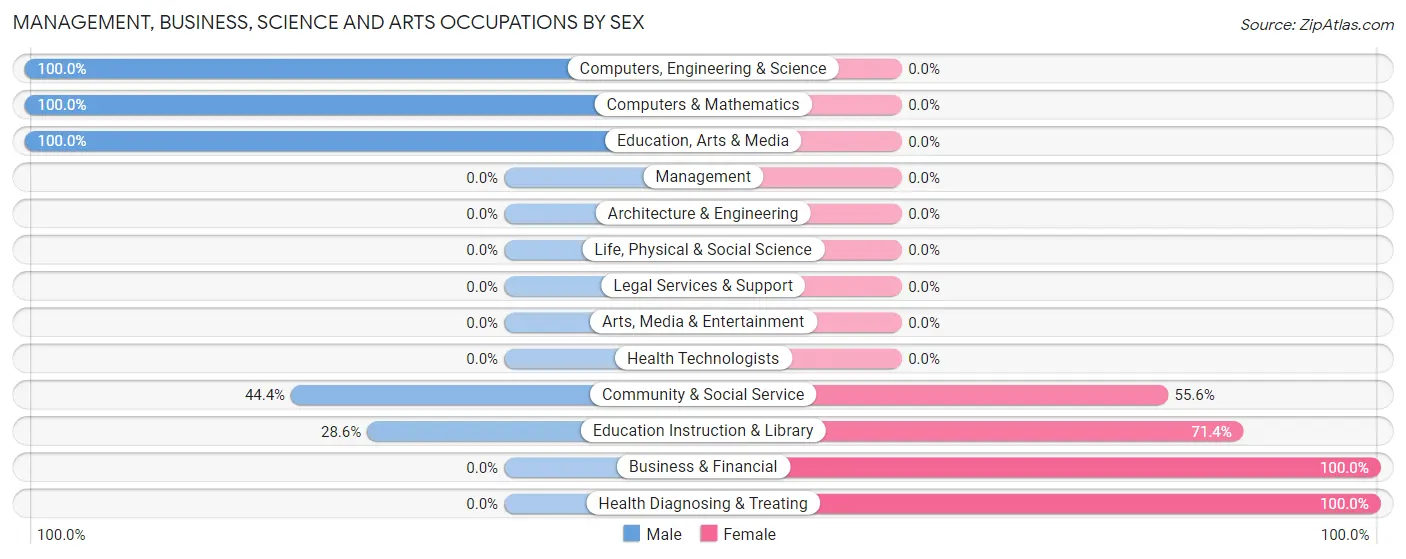
Management, Business, Science and Arts Occupations by Sex
Within the Management, Business, Science and Arts occupations in Joppa, the most male-oriented occupations are Computers, Engineering & Science (100.0%), Computers & Mathematics (100.0%), and Education, Arts & Media (100.0%), while the most female-oriented occupations are Business & Financial (100.0%), Health Diagnosing & Treating (100.0%), and Education Instruction & Library (71.4%).
| Occupation | Male | Female |
| Management | 0 (0.0%) | 0 (0.0%) |
| Business & Financial | 0 (0.0%) | 2 (100.0%) |
| Computers, Engineering & Science | 2 (100.0%) | 0 (0.0%) |
| Computers & Mathematics | 2 (100.0%) | 0 (0.0%) |
| Architecture & Engineering | 0 (0.0%) | 0 (0.0%) |
| Life, Physical & Social Science | 0 (0.0%) | 0 (0.0%) |
| Community & Social Service | 4 (44.4%) | 5 (55.6%) |
| Education, Arts & Media | 2 (100.0%) | 0 (0.0%) |
| Legal Services & Support | 0 (0.0%) | 0 (0.0%) |
| Education Instruction & Library | 2 (28.6%) | 5 (71.4%) |
| Arts, Media & Entertainment | 0 (0.0%) | 0 (0.0%) |
| Health Diagnosing & Treating | 0 (0.0%) | 1 (100.0%) |
| Health Technologists | 0 (0.0%) | 0 (0.0%) |
| Total (Category) | 6 (42.9%) | 8 (57.1%) |
| Total (Overall) | 55 (62.5%) | 33 (37.5%) |
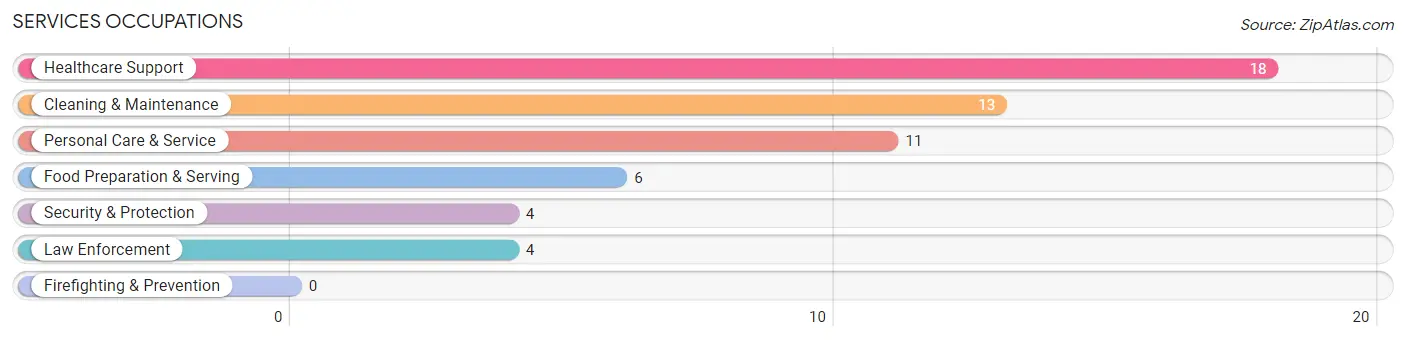
Services Occupations
The most common Services occupations in Joppa are Healthcare Support (18 | 20.4%), Cleaning & Maintenance (13 | 14.8%), Personal Care & Service (11 | 12.5%), Food Preparation & Serving (6 | 6.8%), and Security & Protection (4 | 4.5%).
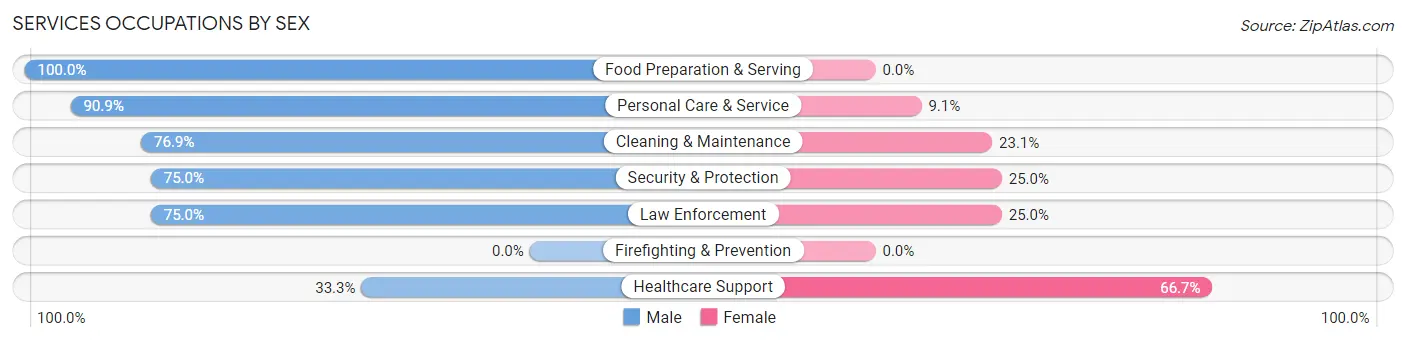
Services Occupations by Sex
Within the Services occupations in Joppa, the most male-oriented occupations are Food Preparation & Serving (100.0%), Personal Care & Service (90.9%), and Cleaning & Maintenance (76.9%), while the most female-oriented occupations are Healthcare Support (66.7%), Security & Protection (25.0%), and Law Enforcement (25.0%).
| Occupation | Male | Female |
| Healthcare Support | 6 (33.3%) | 12 (66.7%) |
| Security & Protection | 3 (75.0%) | 1 (25.0%) |
| Firefighting & Prevention | 0 (0.0%) | 0 (0.0%) |
| Law Enforcement | 3 (75.0%) | 1 (25.0%) |
| Food Preparation & Serving | 6 (100.0%) | 0 (0.0%) |
| Cleaning & Maintenance | 10 (76.9%) | 3 (23.1%) |
| Personal Care & Service | 10 (90.9%) | 1 (9.1%) |
| Total (Category) | 35 (67.3%) | 17 (32.7%) |
| Total (Overall) | 55 (62.5%) | 33 (37.5%) |
Sales and Office Occupations
The most common Sales and Office occupations in Joppa are Office & Administration (6 | 6.8%), and Sales & Related (2 | 2.3%).
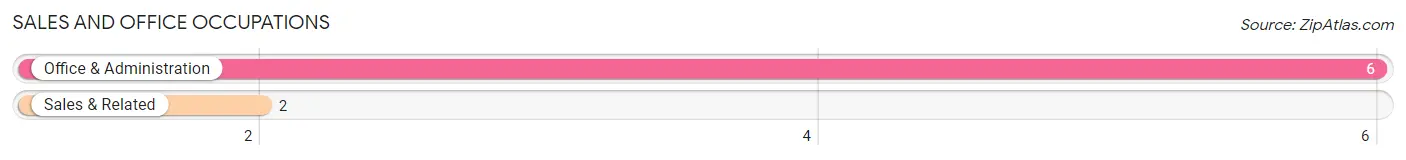
Sales and Office Occupations by Sex
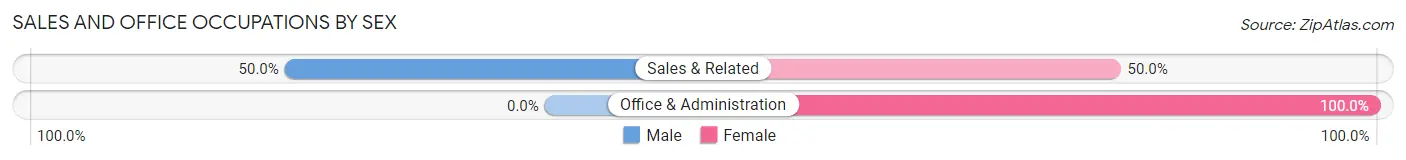
| Occupation | Male | Female |
| Sales & Related | 1 (50.0%) | 1 (50.0%) |
| Office & Administration | 0 (0.0%) | 6 (100.0%) |
| Total (Category) | 1 (12.5%) | 7 (87.5%) |
| Total (Overall) | 55 (62.5%) | 33 (37.5%) |
Natural Resources, Construction and Maintenance Occupations
The most common Natural Resources, Construction and Maintenance occupations in Joppa are Installation, Maintenance & Repair (9 | 10.2%), and Construction & Extraction (2 | 2.3%).
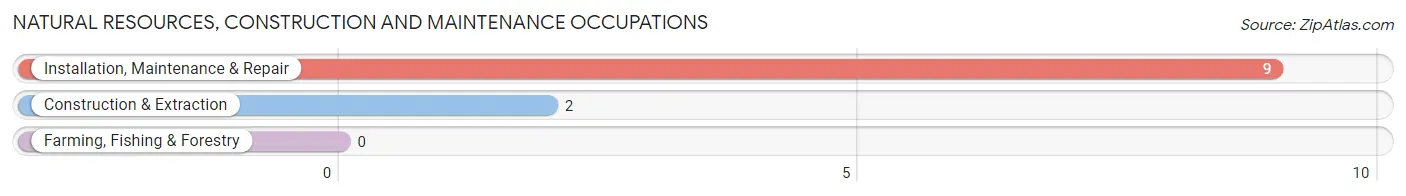
Natural Resources, Construction and Maintenance Occupations by Sex
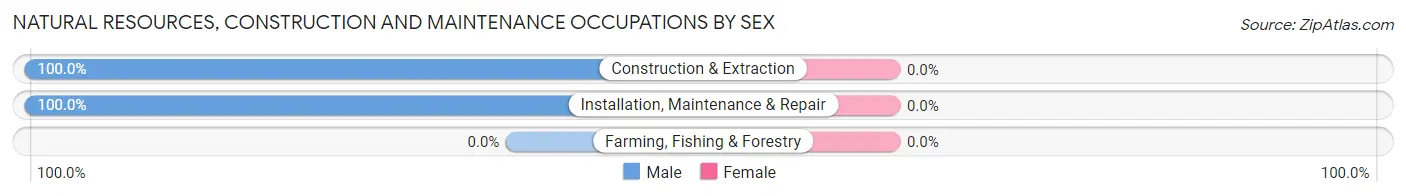
| Occupation | Male | Female |
| Farming, Fishing & Forestry | 0 (0.0%) | 0 (0.0%) |
| Construction & Extraction | 2 (100.0%) | 0 (0.0%) |
| Installation, Maintenance & Repair | 9 (100.0%) | 0 (0.0%) |
| Total (Category) | 11 (100.0%) | 0 (0.0%) |
| Total (Overall) | 55 (62.5%) | 33 (37.5%) |
Production, Transportation and Moving Occupations
The most common Production, Transportation and Moving occupations in Joppa are Material Moving (2 | 2.3%), and Production (1 | 1.1%).
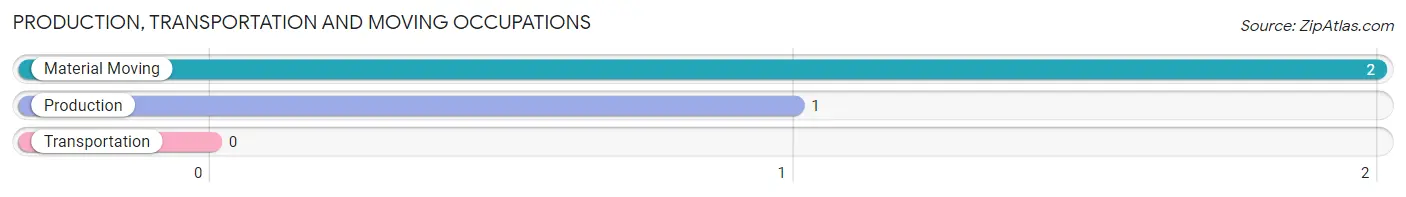
Production, Transportation and Moving Occupations by Sex
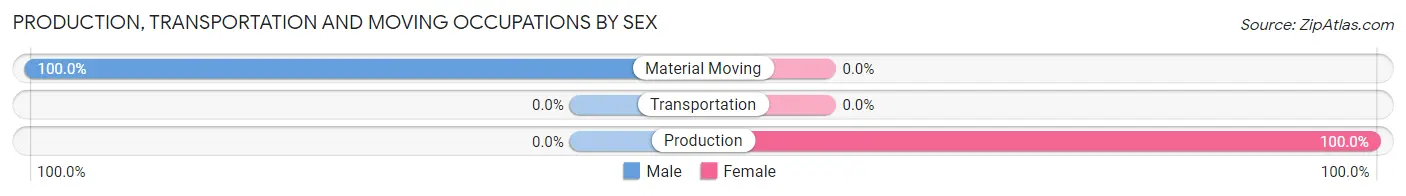
| Occupation | Male | Female |
| Production | 0 (0.0%) | 1 (100.0%) |
| Transportation | 0 (0.0%) | 0 (0.0%) |
| Material Moving | 2 (100.0%) | 0 (0.0%) |
| Total (Category) | 2 (66.7%) | 1 (33.3%) |
| Total (Overall) | 55 (62.5%) | 33 (37.5%) |
Employment Industries by Sex in Joppa
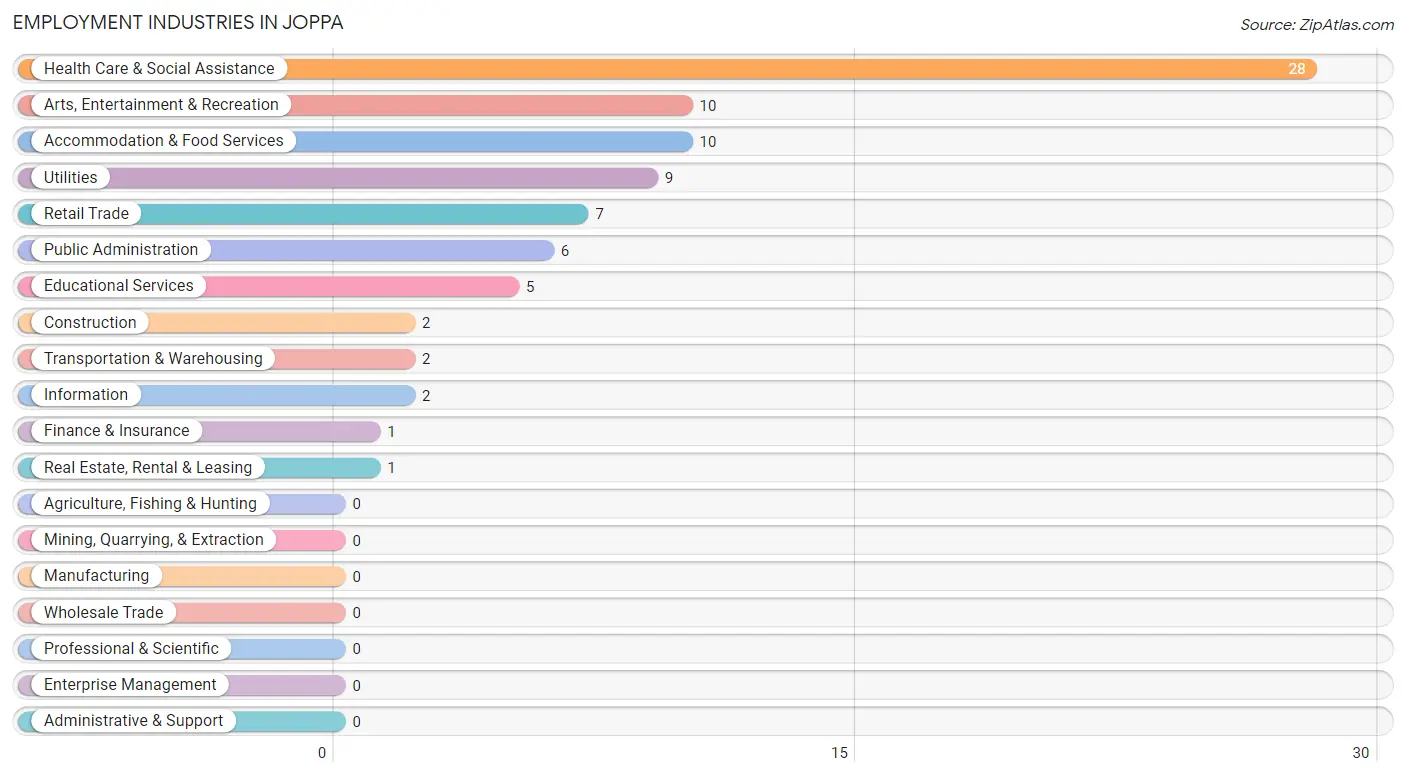
Employment Industries in Joppa
The major employment industries in Joppa include Health Care & Social Assistance (28 | 31.8%), Arts, Entertainment & Recreation (10 | 11.4%), Accommodation & Food Services (10 | 11.4%), Utilities (9 | 10.2%), and Retail Trade (7 | 8.0%).
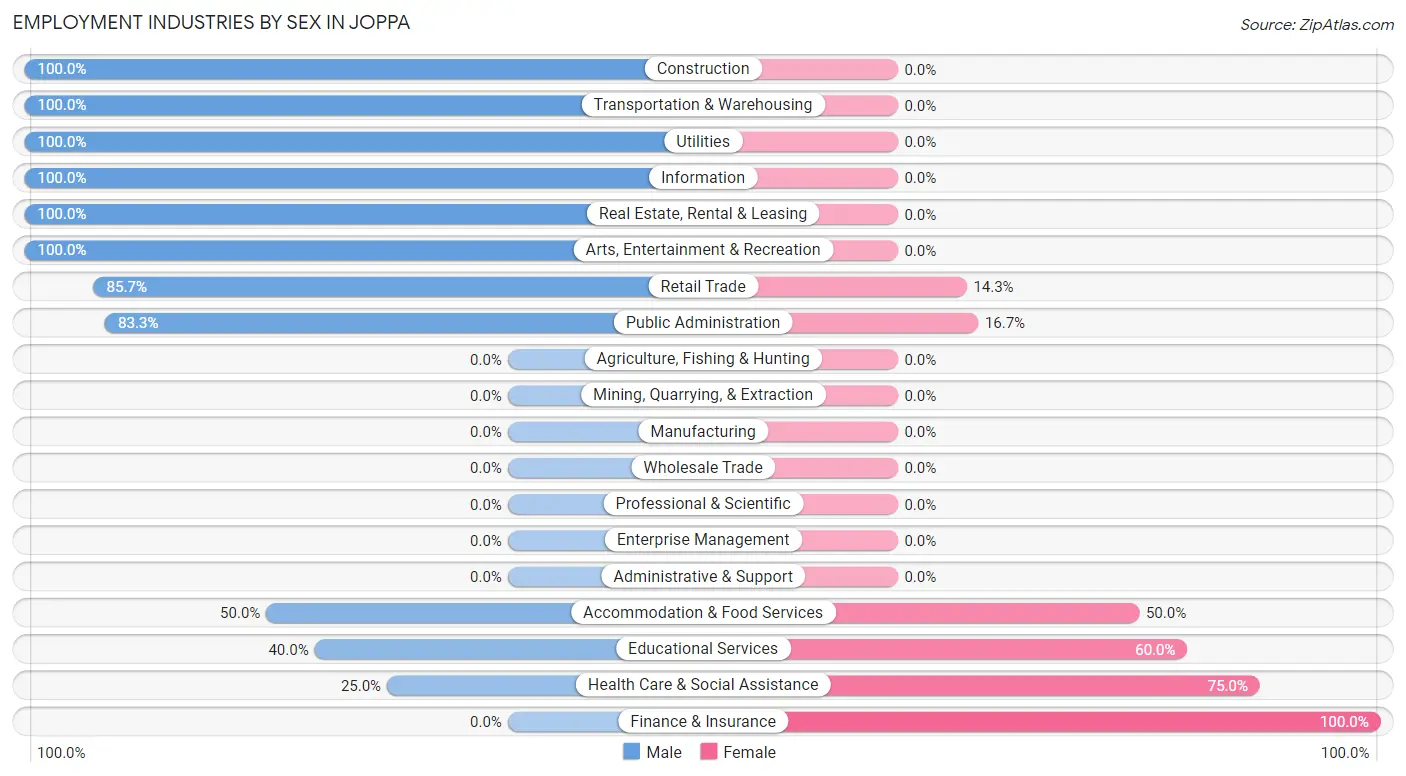
Employment Industries by Sex in Joppa
The Joppa industries that see more men than women are Construction (100.0%), Transportation & Warehousing (100.0%), and Utilities (100.0%), whereas the industries that tend to have a higher number of women are Finance & Insurance (100.0%), Health Care & Social Assistance (75.0%), and Educational Services (60.0%).
| Industry | Male | Female |
| Agriculture, Fishing & Hunting | 0 (0.0%) | 0 (0.0%) |
| Mining, Quarrying, & Extraction | 0 (0.0%) | 0 (0.0%) |
| Construction | 2 (100.0%) | 0 (0.0%) |
| Manufacturing | 0 (0.0%) | 0 (0.0%) |
| Wholesale Trade | 0 (0.0%) | 0 (0.0%) |
| Retail Trade | 6 (85.7%) | 1 (14.3%) |
| Transportation & Warehousing | 2 (100.0%) | 0 (0.0%) |
| Utilities | 9 (100.0%) | 0 (0.0%) |
| Information | 2 (100.0%) | 0 (0.0%) |
| Finance & Insurance | 0 (0.0%) | 1 (100.0%) |
| Real Estate, Rental & Leasing | 1 (100.0%) | 0 (0.0%) |
| Professional & Scientific | 0 (0.0%) | 0 (0.0%) |
| Enterprise Management | 0 (0.0%) | 0 (0.0%) |
| Administrative & Support | 0 (0.0%) | 0 (0.0%) |
| Educational Services | 2 (40.0%) | 3 (60.0%) |
| Health Care & Social Assistance | 7 (25.0%) | 21 (75.0%) |
| Arts, Entertainment & Recreation | 10 (100.0%) | 0 (0.0%) |
| Accommodation & Food Services | 5 (50.0%) | 5 (50.0%) |
| Public Administration | 5 (83.3%) | 1 (16.7%) |
| Total | 55 (62.5%) | 33 (37.5%) |
Education in Joppa
School Enrollment in Joppa
The most common levels of schooling among the 74 students in Joppa are high school (28 | 37.8%), elementary school (18 | 24.3%), and middle school (14 | 18.9%).
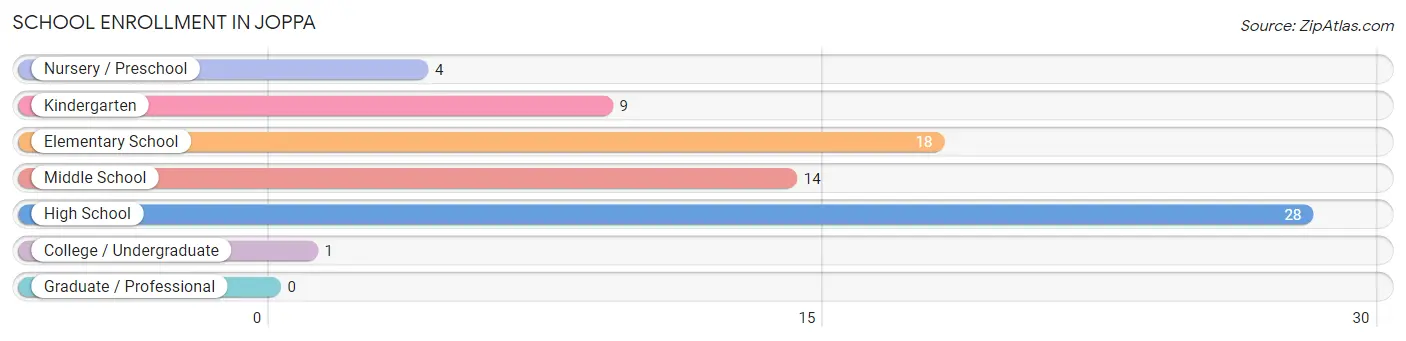
| School Level | # Students | % Students |
| Nursery / Preschool | 4 | 5.4% |
| Kindergarten | 9 | 12.2% |
| Elementary School | 18 | 24.3% |
| Middle School | 14 | 18.9% |
| High School | 28 | 37.8% |
| College / Undergraduate | 1 | 1.3% |
| Graduate / Professional | 0 | 0.0% |
| Total | 74 | 100.0% |
School Enrollment by Age by Funding Source in Joppa
Out of a total of 74 students who are enrolled in schools in Joppa, 6 (8.1%) attend a private institution, while the remaining 68 (91.9%) are enrolled in public schools. The age group of 5 to 9 year old has the highest likelihood of being enrolled in private schools, with 6 (23.1% in the age bracket) enrolled. Conversely, the age group of 3 to 4 year olds has the lowest likelihood of being enrolled in a private school, with 4 (100.0% in the age bracket) attending a public institution.
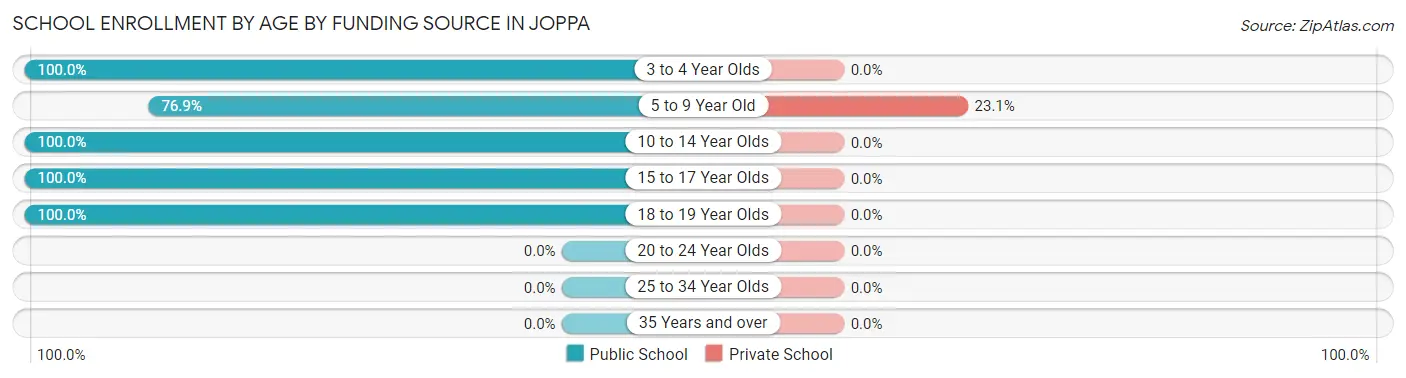
| Age Bracket | Public School | Private School |
| 3 to 4 Year Olds | 4 (100.0%) | 0 (0.0%) |
| 5 to 9 Year Old | 20 (76.9%) | 6 (23.1%) |
| 10 to 14 Year Olds | 17 (100.0%) | 0 (0.0%) |
| 15 to 17 Year Olds | 25 (100.0%) | 0 (0.0%) |
| 18 to 19 Year Olds | 2 (100.0%) | 0 (0.0%) |
| 20 to 24 Year Olds | 0 (0.0%) | 0 (0.0%) |
| 25 to 34 Year Olds | 0 (0.0%) | 0 (0.0%) |
| 35 Years and over | 0 (0.0%) | 0 (0.0%) |
| Total | 68 (91.9%) | 6 (8.1%) |
Educational Attainment by Field of Study in Joppa
Social sciences (7 | 58.3%), engineering (2 | 16.7%), science & technology (2 | 16.7%), and arts & humanities (1 | 8.3%) are the most common fields of study among 12 individuals in Joppa who have obtained a bachelor's degree or higher.
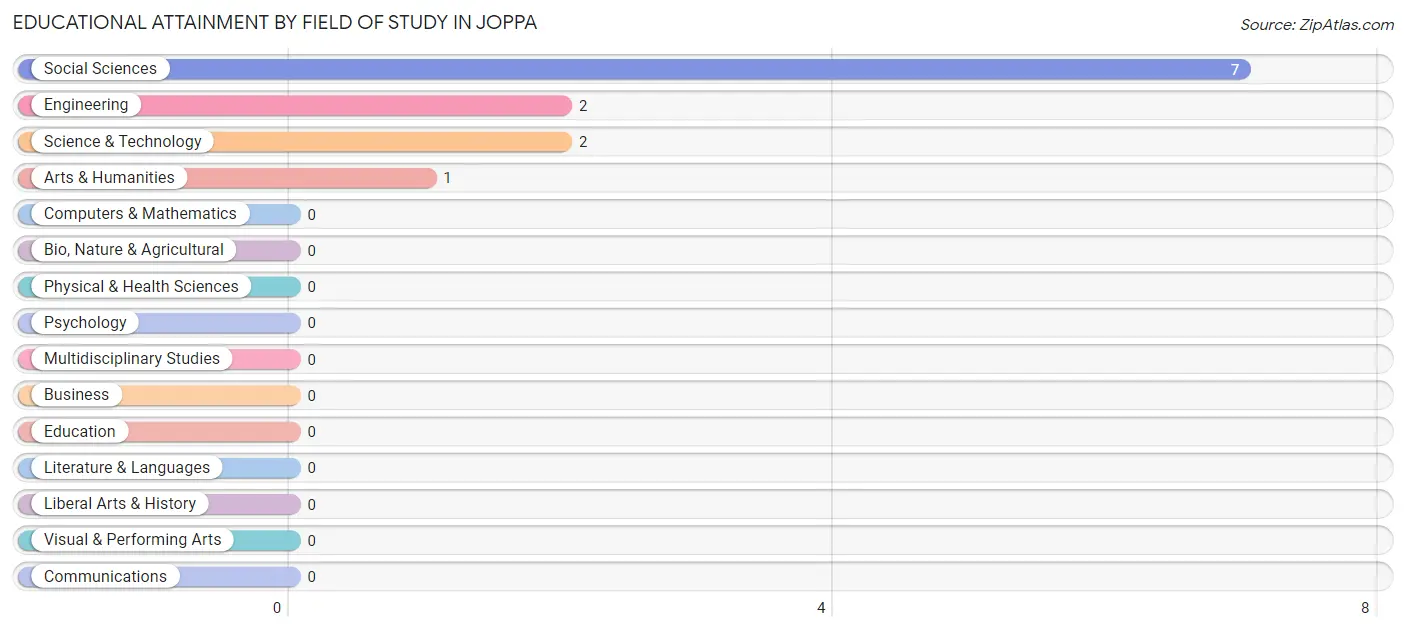
| Field of Study | # Graduates | % Graduates |
| Computers & Mathematics | 0 | 0.0% |
| Bio, Nature & Agricultural | 0 | 0.0% |
| Physical & Health Sciences | 0 | 0.0% |
| Psychology | 0 | 0.0% |
| Social Sciences | 7 | 58.3% |
| Engineering | 2 | 16.7% |
| Multidisciplinary Studies | 0 | 0.0% |
| Science & Technology | 2 | 16.7% |
| Business | 0 | 0.0% |
| Education | 0 | 0.0% |
| Literature & Languages | 0 | 0.0% |
| Liberal Arts & History | 0 | 0.0% |
| Visual & Performing Arts | 0 | 0.0% |
| Communications | 0 | 0.0% |
| Arts & Humanities | 1 | 8.3% |
| Total | 12 | 100.0% |
Transportation & Commute in Joppa
Vehicle Availability by Sex in Joppa
The most prevalent vehicle ownership categories in Joppa are males with 3 vehicles (27, accounting for 49.1%) and females with 3 vehicles (9, making up 81.8%).
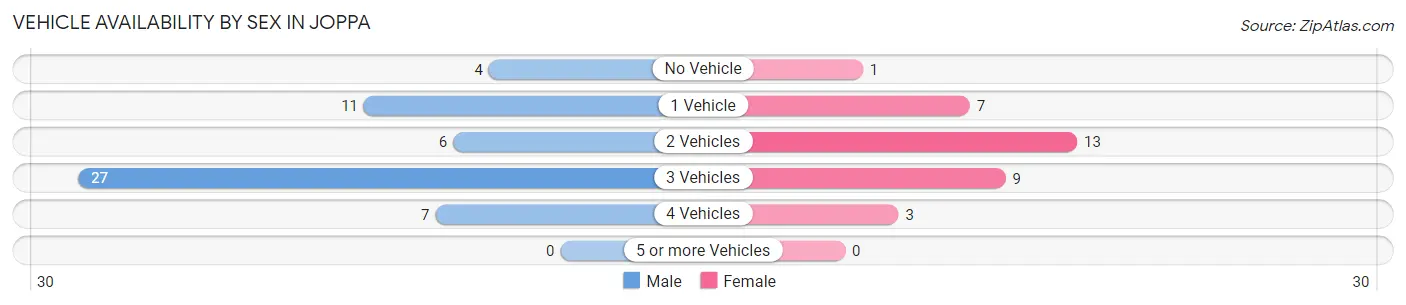
| Vehicles Available | Male | Female |
| No Vehicle | 4 (7.3%) | 1 (3.0%) |
| 1 Vehicle | 11 (20.0%) | 7 (21.2%) |
| 2 Vehicles | 6 (10.9%) | 13 (39.4%) |
| 3 Vehicles | 27 (49.1%) | 9 (27.3%) |
| 4 Vehicles | 7 (12.7%) | 3 (9.1%) |
| 5 or more Vehicles | 0 (0.0%) | 0 (0.0%) |
| Total | 55 (100.0%) | 33 (100.0%) |
Commute Time in Joppa
The most frequently occuring commute durations in Joppa are 30 to 34 minutes (28 commuters, 31.8%), 15 to 19 minutes (16 commuters, 18.2%), and 5 to 9 minutes (14 commuters, 15.9%).
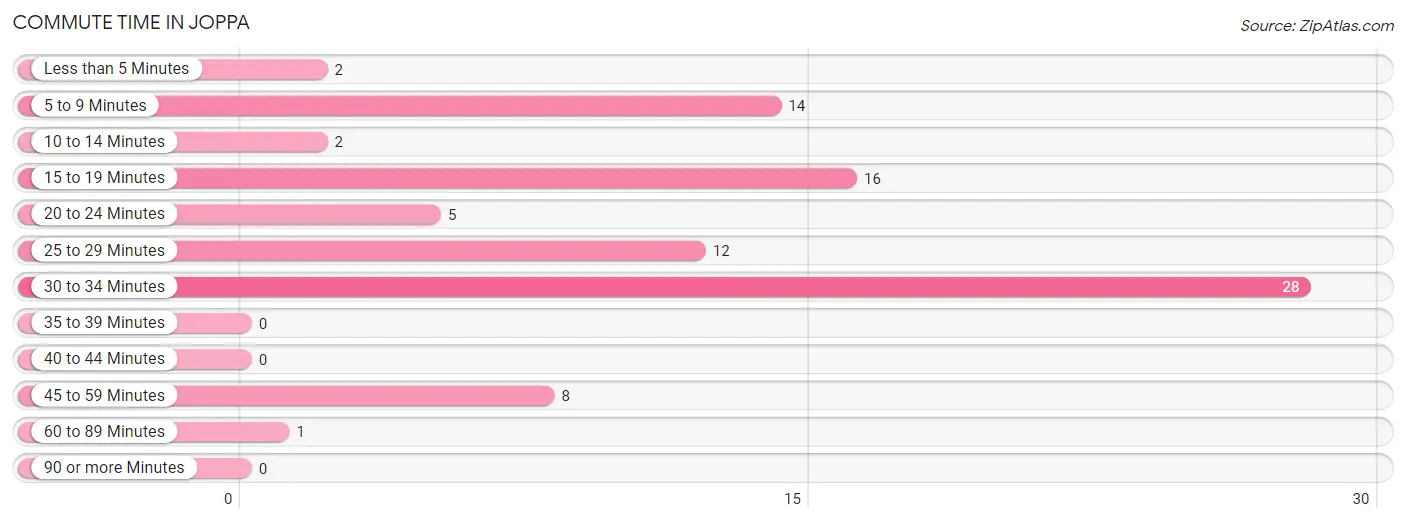
| Commute Time | # Commuters | % Commuters |
| Less than 5 Minutes | 2 | 2.3% |
| 5 to 9 Minutes | 14 | 15.9% |
| 10 to 14 Minutes | 2 | 2.3% |
| 15 to 19 Minutes | 16 | 18.2% |
| 20 to 24 Minutes | 5 | 5.7% |
| 25 to 29 Minutes | 12 | 13.6% |
| 30 to 34 Minutes | 28 | 31.8% |
| 35 to 39 Minutes | 0 | 0.0% |
| 40 to 44 Minutes | 0 | 0.0% |
| 45 to 59 Minutes | 8 | 9.1% |
| 60 to 89 Minutes | 1 | 1.1% |
| 90 or more Minutes | 0 | 0.0% |
Commute Time by Sex in Joppa
The most common commute times in Joppa are 30 to 34 minutes (19 commuters, 34.5%) for males and 30 to 34 minutes (9 commuters, 27.3%) for females.
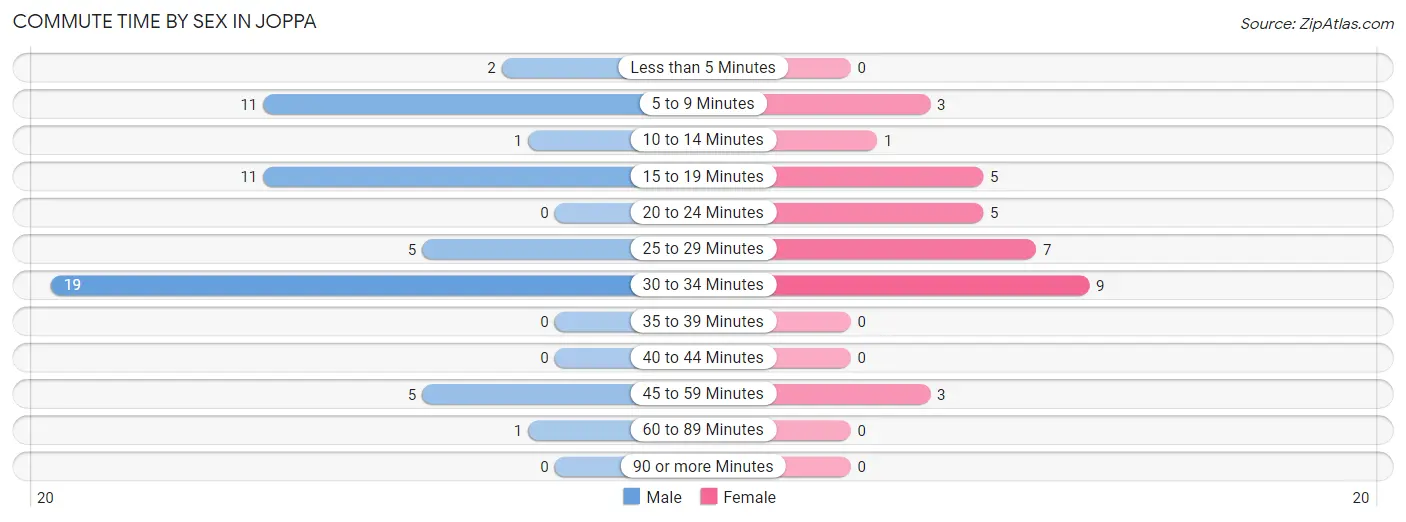
| Commute Time | Male | Female |
| Less than 5 Minutes | 2 (3.6%) | 0 (0.0%) |
| 5 to 9 Minutes | 11 (20.0%) | 3 (9.1%) |
| 10 to 14 Minutes | 1 (1.8%) | 1 (3.0%) |
| 15 to 19 Minutes | 11 (20.0%) | 5 (15.1%) |
| 20 to 24 Minutes | 0 (0.0%) | 5 (15.1%) |
| 25 to 29 Minutes | 5 (9.1%) | 7 (21.2%) |
| 30 to 34 Minutes | 19 (34.5%) | 9 (27.3%) |
| 35 to 39 Minutes | 0 (0.0%) | 0 (0.0%) |
| 40 to 44 Minutes | 0 (0.0%) | 0 (0.0%) |
| 45 to 59 Minutes | 5 (9.1%) | 3 (9.1%) |
| 60 to 89 Minutes | 1 (1.8%) | 0 (0.0%) |
| 90 or more Minutes | 0 (0.0%) | 0 (0.0%) |
Time of Departure to Work by Sex in Joppa
The most frequent times of departure to work in Joppa are 4:00 PM to 11:59 PM (19, 34.5%) for males and 4:00 PM to 11:59 PM (14, 42.4%) for females.
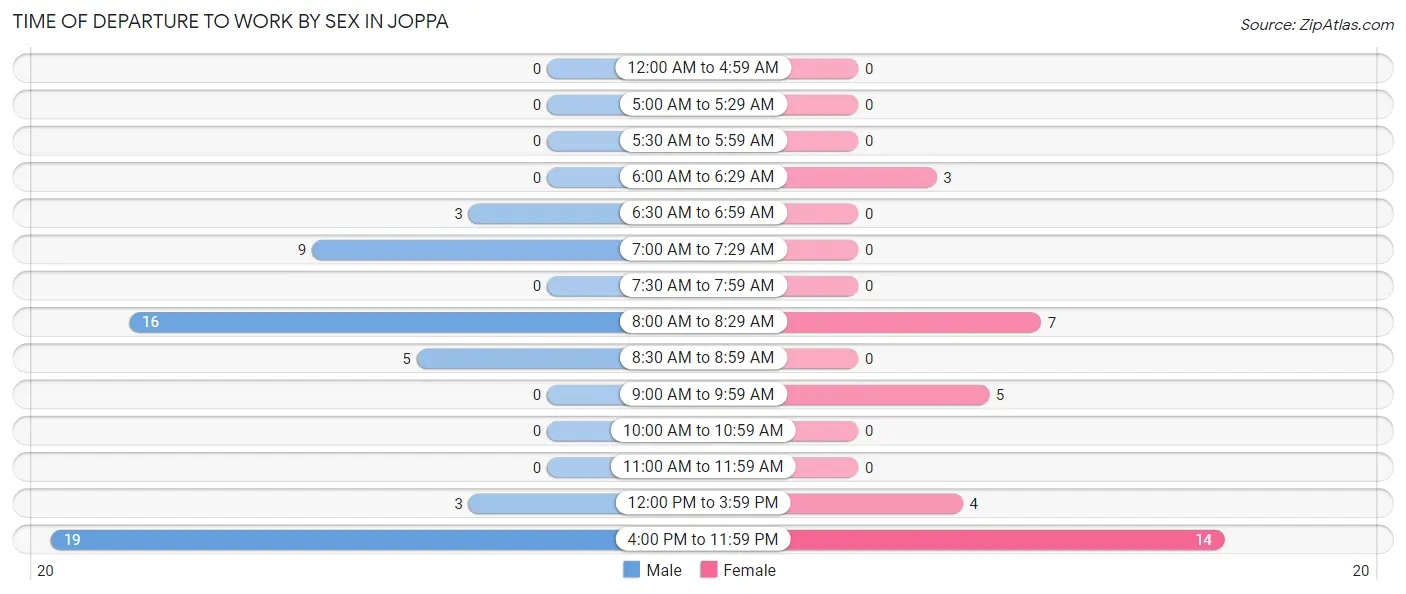
| Time of Departure | Male | Female |
| 12:00 AM to 4:59 AM | 0 (0.0%) | 0 (0.0%) |
| 5:00 AM to 5:29 AM | 0 (0.0%) | 0 (0.0%) |
| 5:30 AM to 5:59 AM | 0 (0.0%) | 0 (0.0%) |
| 6:00 AM to 6:29 AM | 0 (0.0%) | 3 (9.1%) |
| 6:30 AM to 6:59 AM | 3 (5.4%) | 0 (0.0%) |
| 7:00 AM to 7:29 AM | 9 (16.4%) | 0 (0.0%) |
| 7:30 AM to 7:59 AM | 0 (0.0%) | 0 (0.0%) |
| 8:00 AM to 8:29 AM | 16 (29.1%) | 7 (21.2%) |
| 8:30 AM to 8:59 AM | 5 (9.1%) | 0 (0.0%) |
| 9:00 AM to 9:59 AM | 0 (0.0%) | 5 (15.1%) |
| 10:00 AM to 10:59 AM | 0 (0.0%) | 0 (0.0%) |
| 11:00 AM to 11:59 AM | 0 (0.0%) | 0 (0.0%) |
| 12:00 PM to 3:59 PM | 3 (5.4%) | 4 (12.1%) |
| 4:00 PM to 11:59 PM | 19 (34.5%) | 14 (42.4%) |
| Total | 55 (100.0%) | 33 (100.0%) |
Housing Occupancy in Joppa
Occupancy by Ownership in Joppa
Of the total 99 dwellings in Joppa, owner-occupied units account for 54 (54.5%), while renter-occupied units make up 45 (45.5%).
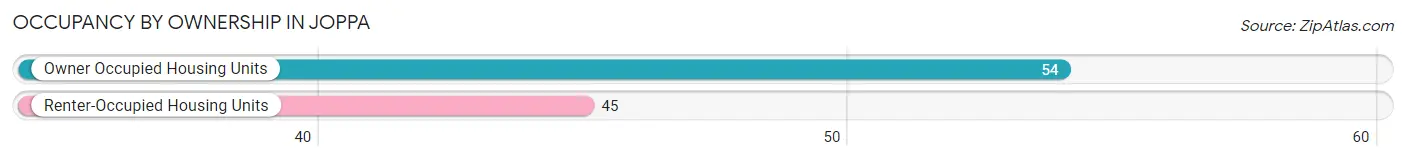
| Occupancy | # Housing Units | % Housing Units |
| Owner Occupied Housing Units | 54 | 54.5% |
| Renter-Occupied Housing Units | 45 | 45.5% |
| Total Occupied Housing Units | 99 | 100.0% |
Occupancy by Household Size in Joppa
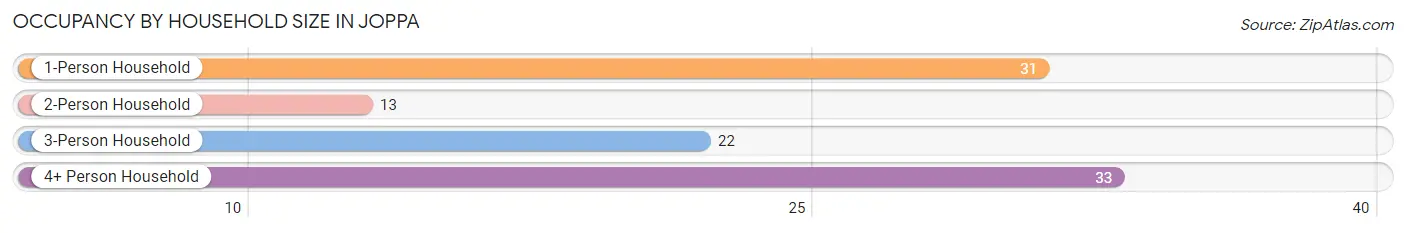
| Household Size | # Housing Units | % Housing Units |
| 1-Person Household | 31 | 31.3% |
| 2-Person Household | 13 | 13.1% |
| 3-Person Household | 22 | 22.2% |
| 4+ Person Household | 33 | 33.3% |
| Total Housing Units | 99 | 100.0% |
Occupancy by Ownership by Household Size in Joppa
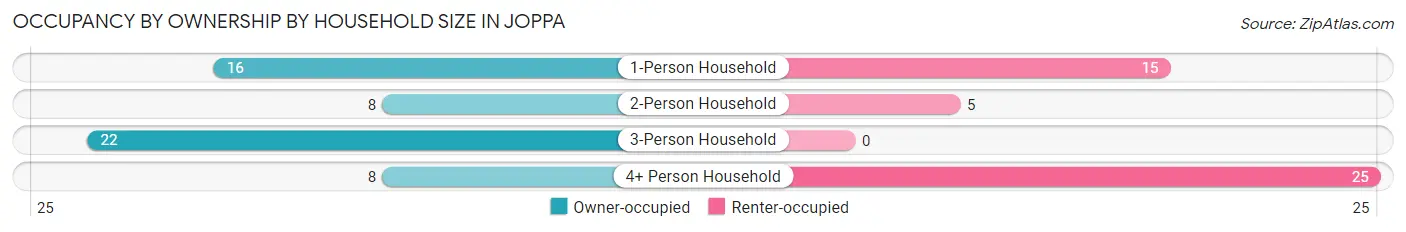
| Household Size | Owner-occupied | Renter-occupied |
| 1-Person Household | 16 (51.6%) | 15 (48.4%) |
| 2-Person Household | 8 (61.5%) | 5 (38.5%) |
| 3-Person Household | 22 (100.0%) | 0 (0.0%) |
| 4+ Person Household | 8 (24.2%) | 25 (75.8%) |
| Total Housing Units | 54 (54.5%) | 45 (45.5%) |
Occupancy by Educational Attainment in Joppa
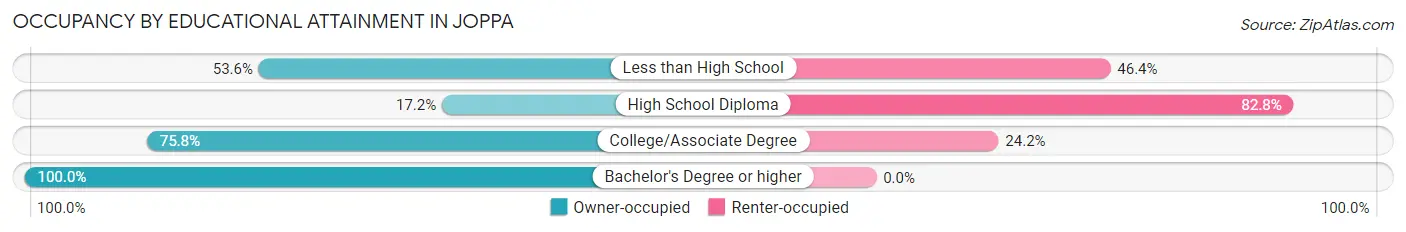
| Household Size | Owner-occupied | Renter-occupied |
| Less than High School | 15 (53.6%) | 13 (46.4%) |
| High School Diploma | 5 (17.2%) | 24 (82.8%) |
| College/Associate Degree | 25 (75.8%) | 8 (24.2%) |
| Bachelor's Degree or higher | 9 (100.0%) | 0 (0.0%) |
Occupancy by Age of Householder in Joppa
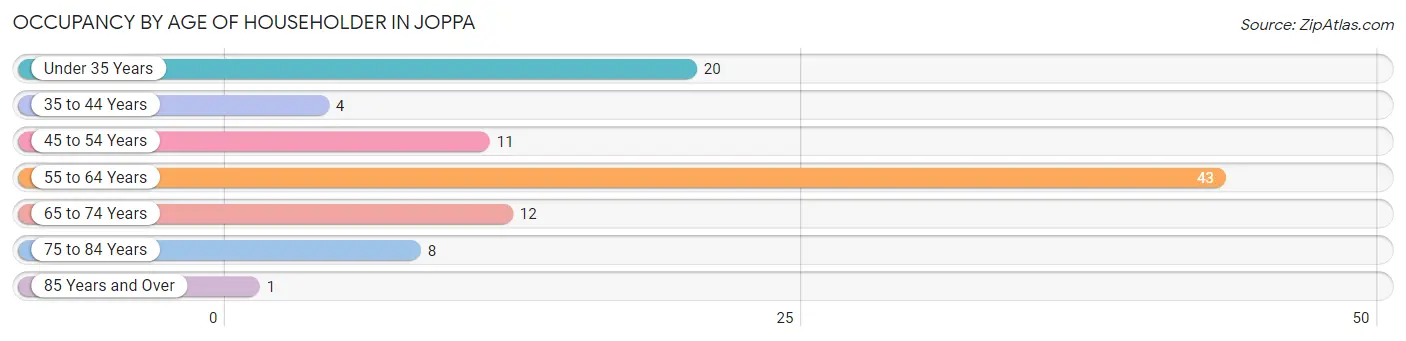
| Age Bracket | # Households | % Households |
| Under 35 Years | 20 | 20.2% |
| 35 to 44 Years | 4 | 4.0% |
| 45 to 54 Years | 11 | 11.1% |
| 55 to 64 Years | 43 | 43.4% |
| 65 to 74 Years | 12 | 12.1% |
| 75 to 84 Years | 8 | 8.1% |
| 85 Years and Over | 1 | 1.0% |
| Total | 99 | 100.0% |
Housing Finances in Joppa
Median Income by Occupancy in Joppa
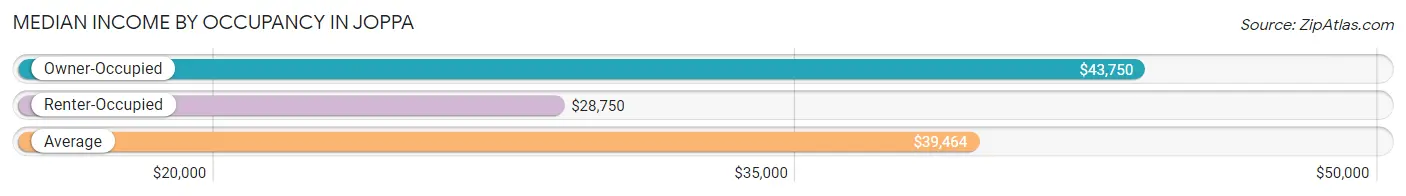
| Occupancy Type | # Households | Median Income |
| Owner-Occupied | 54 (54.5%) | $43,750 |
| Renter-Occupied | 45 (45.5%) | $28,750 |
| Average | 99 (100.0%) | $39,464 |
Occupancy by Householder Income Bracket in Joppa
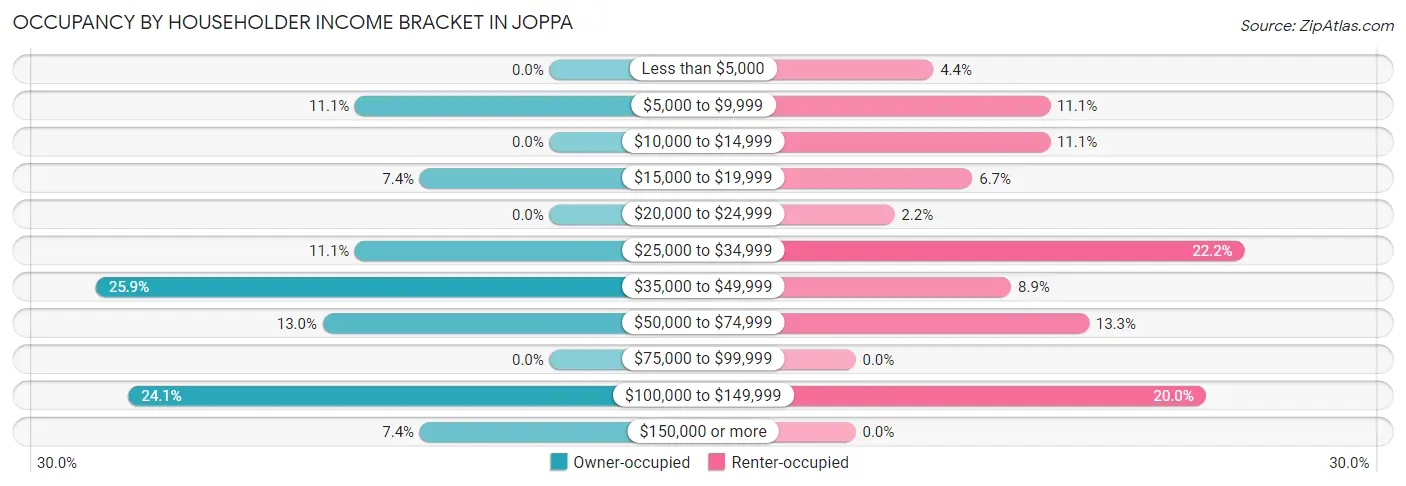
| Income Bracket | Owner-occupied | Renter-occupied |
| Less than $5,000 | 0 (0.0%) | 2 (4.4%) |
| $5,000 to $9,999 | 6 (11.1%) | 5 (11.1%) |
| $10,000 to $14,999 | 0 (0.0%) | 5 (11.1%) |
| $15,000 to $19,999 | 4 (7.4%) | 3 (6.7%) |
| $20,000 to $24,999 | 0 (0.0%) | 1 (2.2%) |
| $25,000 to $34,999 | 6 (11.1%) | 10 (22.2%) |
| $35,000 to $49,999 | 14 (25.9%) | 4 (8.9%) |
| $50,000 to $74,999 | 7 (13.0%) | 6 (13.3%) |
| $75,000 to $99,999 | 0 (0.0%) | 0 (0.0%) |
| $100,000 to $149,999 | 13 (24.1%) | 9 (20.0%) |
| $150,000 or more | 4 (7.4%) | 0 (0.0%) |
| Total | 54 (100.0%) | 45 (100.0%) |
Monthly Housing Cost Tiers in Joppa
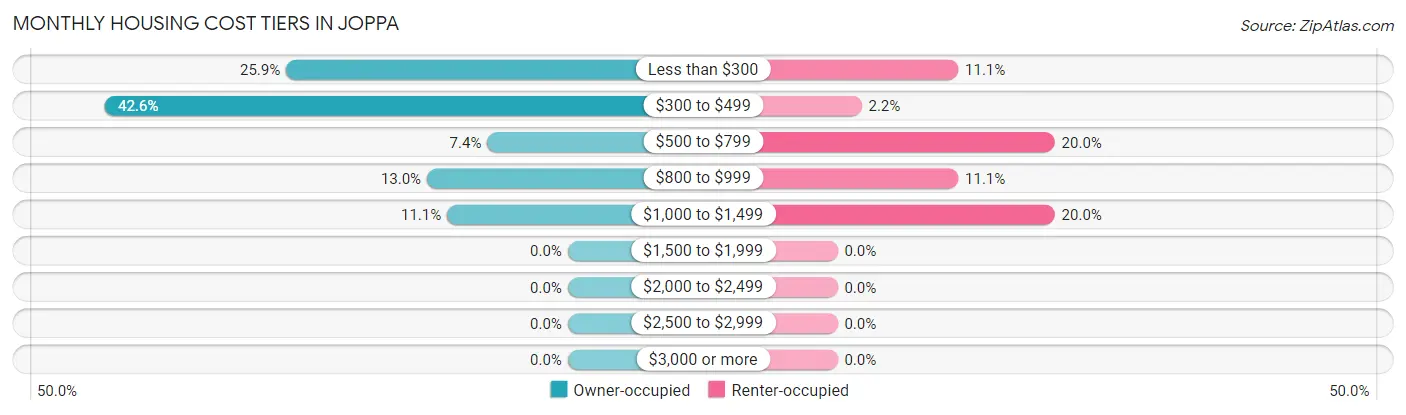
| Monthly Cost | Owner-occupied | Renter-occupied |
| Less than $300 | 14 (25.9%) | 5 (11.1%) |
| $300 to $499 | 23 (42.6%) | 1 (2.2%) |
| $500 to $799 | 4 (7.4%) | 9 (20.0%) |
| $800 to $999 | 7 (13.0%) | 5 (11.1%) |
| $1,000 to $1,499 | 6 (11.1%) | 9 (20.0%) |
| $1,500 to $1,999 | 0 (0.0%) | 0 (0.0%) |
| $2,000 to $2,499 | 0 (0.0%) | 0 (0.0%) |
| $2,500 to $2,999 | 0 (0.0%) | 0 (0.0%) |
| $3,000 or more | 0 (0.0%) | 0 (0.0%) |
| Total | 54 (100.0%) | 45 (100.0%) |
Physical Housing Characteristics in Joppa
Housing Structures in Joppa
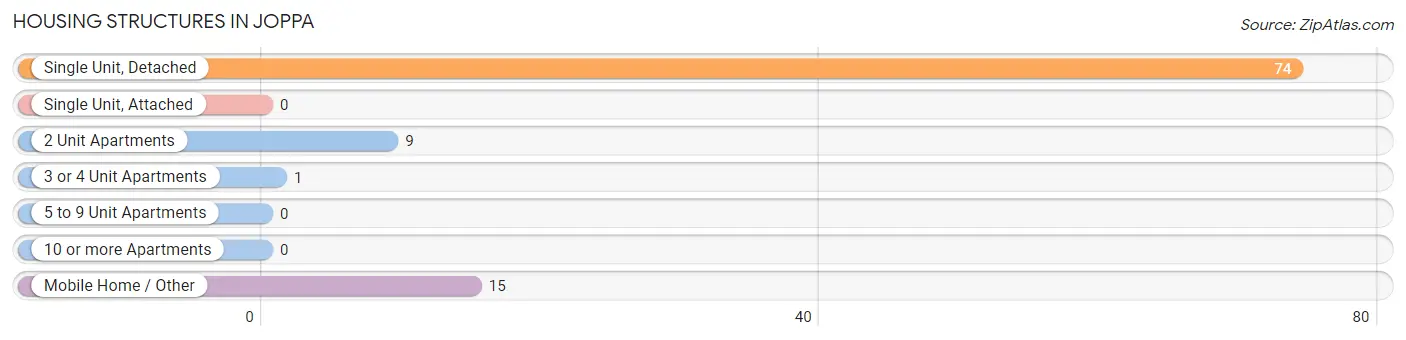
| Structure Type | # Housing Units | % Housing Units |
| Single Unit, Detached | 74 | 74.8% |
| Single Unit, Attached | 0 | 0.0% |
| 2 Unit Apartments | 9 | 9.1% |
| 3 or 4 Unit Apartments | 1 | 1.0% |
| 5 to 9 Unit Apartments | 0 | 0.0% |
| 10 or more Apartments | 0 | 0.0% |
| Mobile Home / Other | 15 | 15.1% |
| Total | 99 | 100.0% |
Housing Structures by Occupancy in Joppa
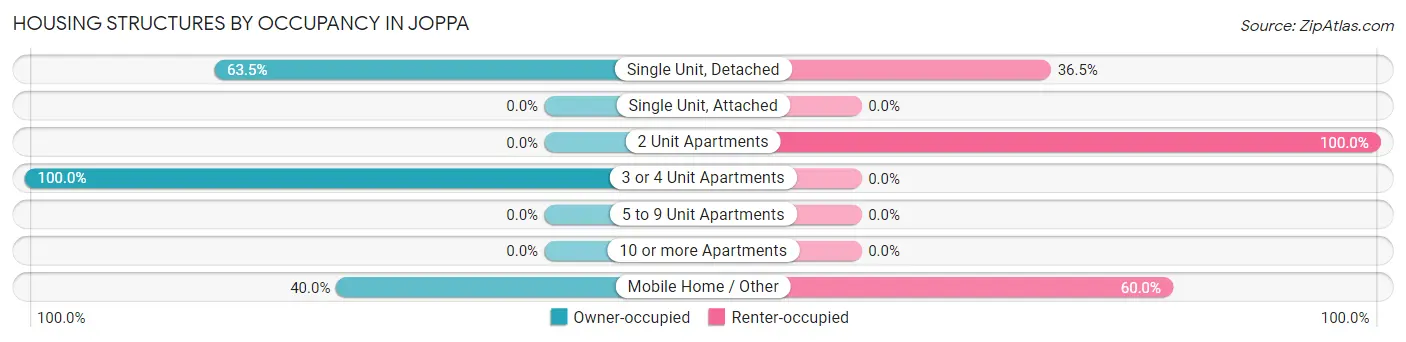
| Structure Type | Owner-occupied | Renter-occupied |
| Single Unit, Detached | 47 (63.5%) | 27 (36.5%) |
| Single Unit, Attached | 0 (0.0%) | 0 (0.0%) |
| 2 Unit Apartments | 0 (0.0%) | 9 (100.0%) |
| 3 or 4 Unit Apartments | 1 (100.0%) | 0 (0.0%) |
| 5 to 9 Unit Apartments | 0 (0.0%) | 0 (0.0%) |
| 10 or more Apartments | 0 (0.0%) | 0 (0.0%) |
| Mobile Home / Other | 6 (40.0%) | 9 (60.0%) |
| Total | 54 (54.5%) | 45 (45.5%) |
Housing Structures by Number of Rooms in Joppa
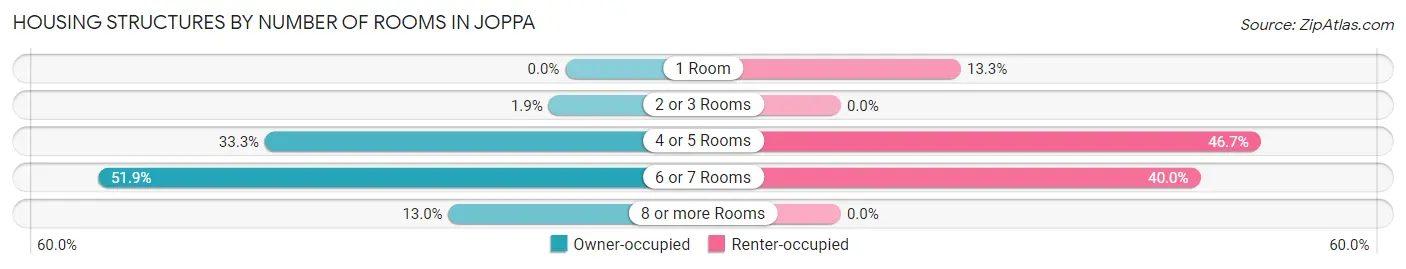
| Number of Rooms | Owner-occupied | Renter-occupied |
| 1 Room | 0 (0.0%) | 6 (13.3%) |
| 2 or 3 Rooms | 1 (1.8%) | 0 (0.0%) |
| 4 or 5 Rooms | 18 (33.3%) | 21 (46.7%) |
| 6 or 7 Rooms | 28 (51.8%) | 18 (40.0%) |
| 8 or more Rooms | 7 (13.0%) | 0 (0.0%) |
| Total | 54 (100.0%) | 45 (100.0%) |
Housing Structure by Heating Type in Joppa
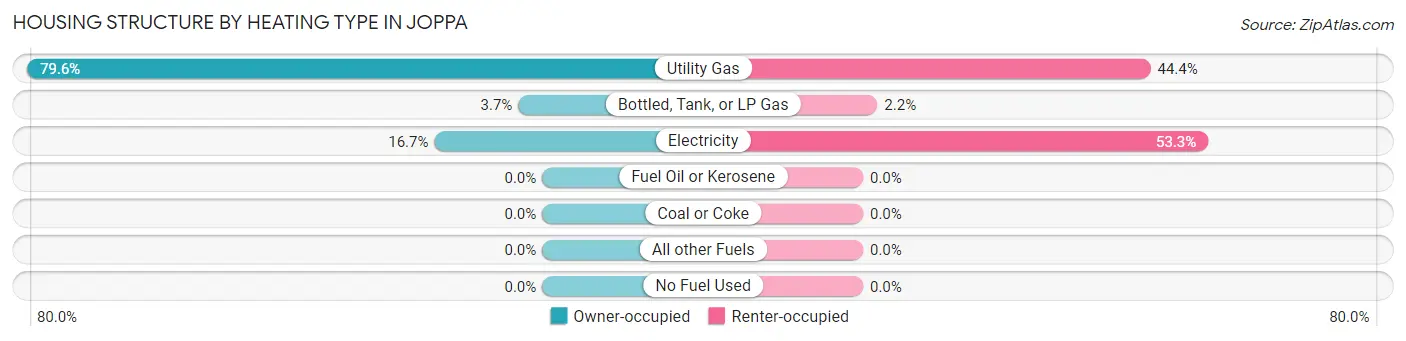
| Heating Type | Owner-occupied | Renter-occupied |
| Utility Gas | 43 (79.6%) | 20 (44.4%) |
| Bottled, Tank, or LP Gas | 2 (3.7%) | 1 (2.2%) |
| Electricity | 9 (16.7%) | 24 (53.3%) |
| Fuel Oil or Kerosene | 0 (0.0%) | 0 (0.0%) |
| Coal or Coke | 0 (0.0%) | 0 (0.0%) |
| All other Fuels | 0 (0.0%) | 0 (0.0%) |
| No Fuel Used | 0 (0.0%) | 0 (0.0%) |
| Total | 54 (100.0%) | 45 (100.0%) |
Household Vehicle Usage in Joppa
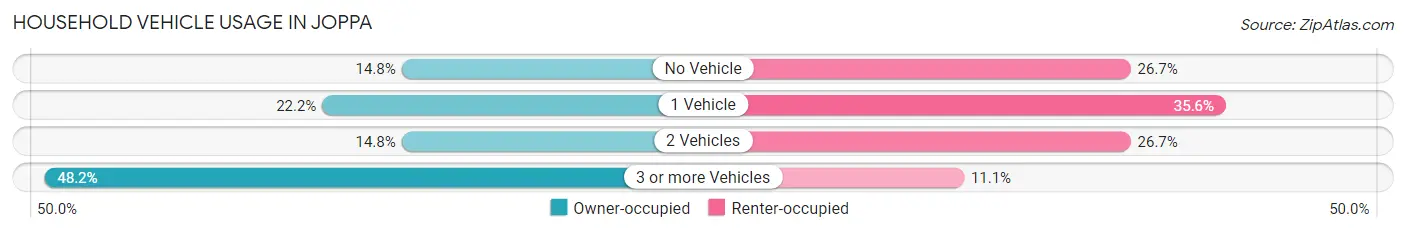
| Vehicles per Household | Owner-occupied | Renter-occupied |
| No Vehicle | 8 (14.8%) | 12 (26.7%) |
| 1 Vehicle | 12 (22.2%) | 16 (35.6%) |
| 2 Vehicles | 8 (14.8%) | 12 (26.7%) |
| 3 or more Vehicles | 26 (48.1%) | 5 (11.1%) |
| Total | 54 (100.0%) | 45 (100.0%) |
Real Estate & Mortgages in Joppa
Real Estate and Mortgage Overview in Joppa
| Characteristic | Without Mortgage | With Mortgage |
| Housing Units | 40 | 14 |
| Median Property Value | $28,300 | $96,000 |
| Median Household Income | - | - |
| Monthly Housing Costs | $367 | $0 |
| Real Estate Taxes | $428 | $1 |
Property Value by Mortgage Status in Joppa
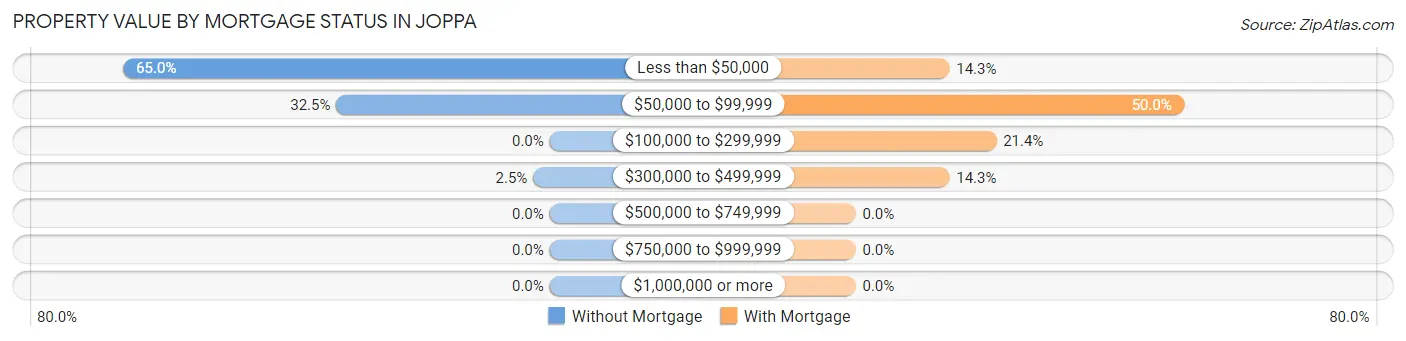
| Property Value | Without Mortgage | With Mortgage |
| Less than $50,000 | 26 (65.0%) | 2 (14.3%) |
| $50,000 to $99,999 | 13 (32.5%) | 7 (50.0%) |
| $100,000 to $299,999 | 0 (0.0%) | 3 (21.4%) |
| $300,000 to $499,999 | 1 (2.5%) | 2 (14.3%) |
| $500,000 to $749,999 | 0 (0.0%) | 0 (0.0%) |
| $750,000 to $999,999 | 0 (0.0%) | 0 (0.0%) |
| $1,000,000 or more | 0 (0.0%) | 0 (0.0%) |
| Total | 40 (100.0%) | 14 (100.0%) |
Household Income by Mortgage Status in Joppa
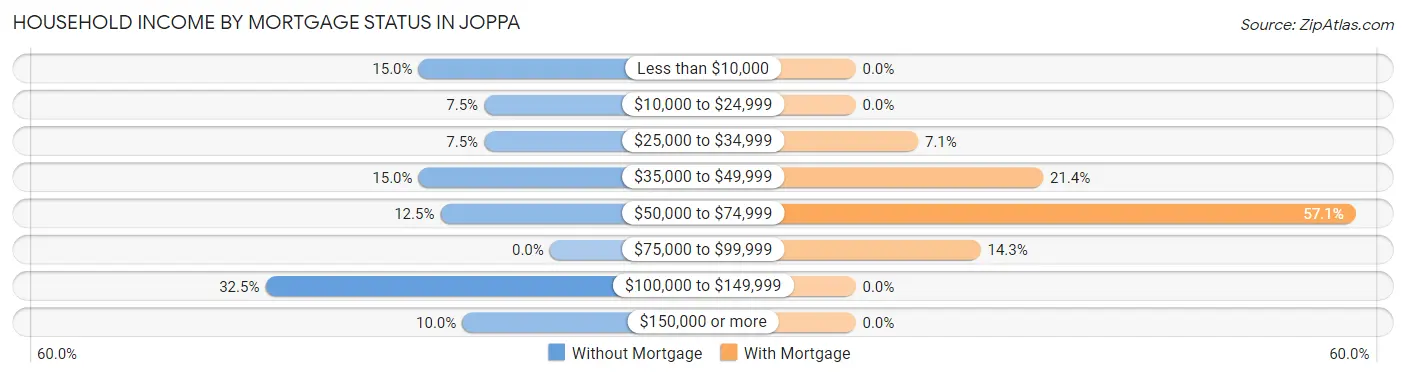
| Household Income | Without Mortgage | With Mortgage |
| Less than $10,000 | 6 (15.0%) | 0 (0.0%) |
| $10,000 to $24,999 | 3 (7.5%) | 0 (0.0%) |
| $25,000 to $34,999 | 3 (7.5%) | 1 (7.1%) |
| $35,000 to $49,999 | 6 (15.0%) | 3 (21.4%) |
| $50,000 to $74,999 | 5 (12.5%) | 8 (57.1%) |
| $75,000 to $99,999 | 0 (0.0%) | 2 (14.3%) |
| $100,000 to $149,999 | 13 (32.5%) | 0 (0.0%) |
| $150,000 or more | 4 (10.0%) | 0 (0.0%) |
| Total | 40 (100.0%) | 14 (100.0%) |
Property Value to Household Income Ratio in Joppa
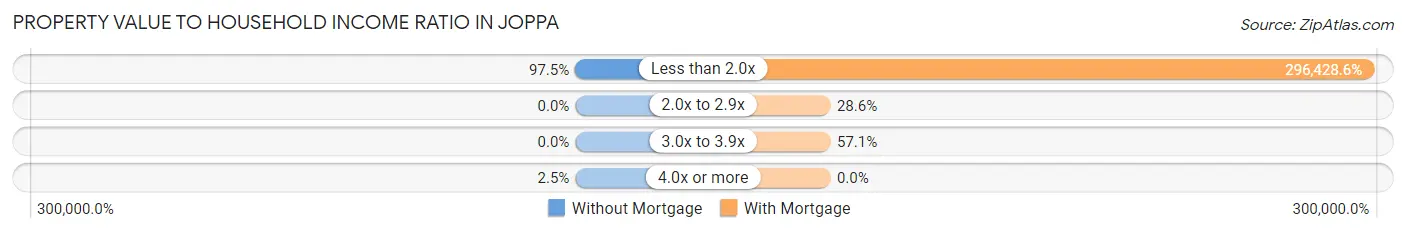
| Value-to-Income Ratio | Without Mortgage | With Mortgage |
| Less than 2.0x | 39 (97.5%) | 41,500 (296,428.6%) |
| 2.0x to 2.9x | 0 (0.0%) | 4 (28.6%) |
| 3.0x to 3.9x | 0 (0.0%) | 8 (57.1%) |
| 4.0x or more | 1 (2.5%) | 0 (0.0%) |
| Total | 40 (100.0%) | 14 (100.0%) |
Real Estate Taxes by Mortgage Status in Joppa
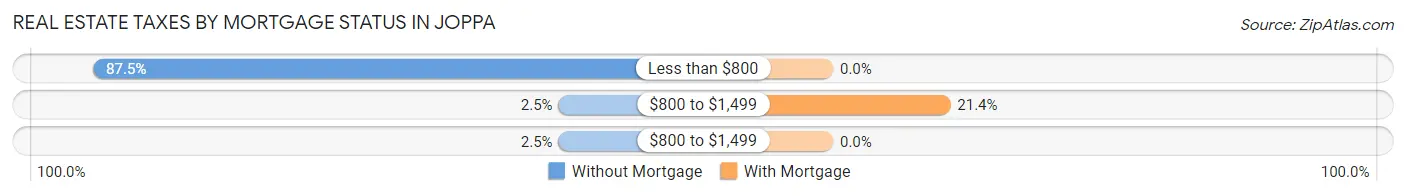
| Property Taxes | Without Mortgage | With Mortgage |
| Less than $800 | 35 (87.5%) | 0 (0.0%) |
| $800 to $1,499 | 1 (2.5%) | 3 (21.4%) |
| $800 to $1,499 | 1 (2.5%) | 0 (0.0%) |
| Total | 40 (100.0%) | 14 (100.0%) |
Health & Disability in Joppa
Health Insurance Coverage by Age in Joppa
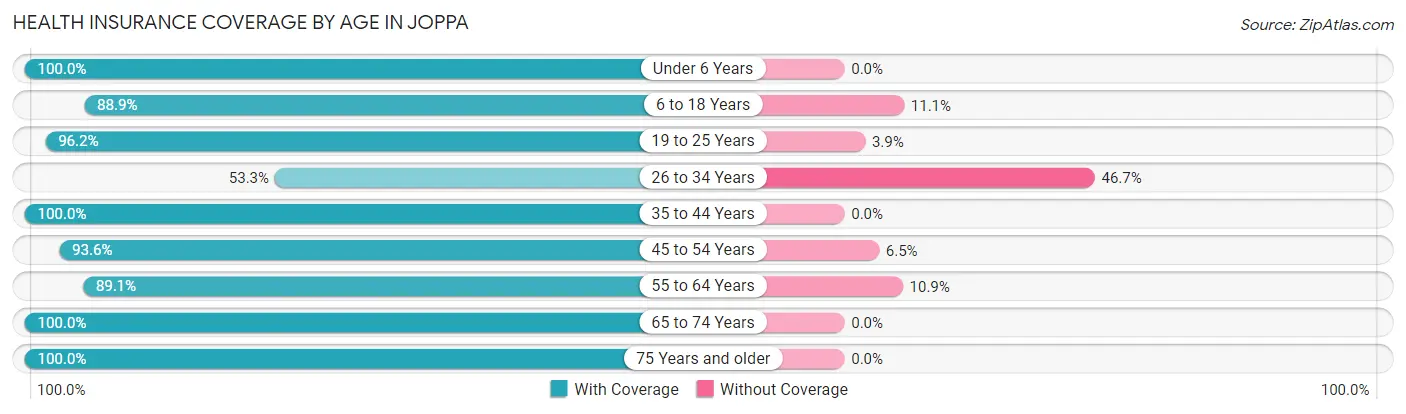
| Age Bracket | With Coverage | Without Coverage |
| Under 6 Years | 36 (100.0%) | 0 (0.0%) |
| 6 to 18 Years | 64 (88.9%) | 8 (11.1%) |
| 19 to 25 Years | 50 (96.2%) | 2 (3.8%) |
| 26 to 34 Years | 24 (53.3%) | 21 (46.7%) |
| 35 to 44 Years | 5 (100.0%) | 0 (0.0%) |
| 45 to 54 Years | 29 (93.5%) | 2 (6.5%) |
| 55 to 64 Years | 41 (89.1%) | 5 (10.9%) |
| 65 to 74 Years | 33 (100.0%) | 0 (0.0%) |
| 75 Years and older | 13 (100.0%) | 0 (0.0%) |
| Total | 295 (88.6%) | 38 (11.4%) |
Health Insurance Coverage by Citizenship Status in Joppa
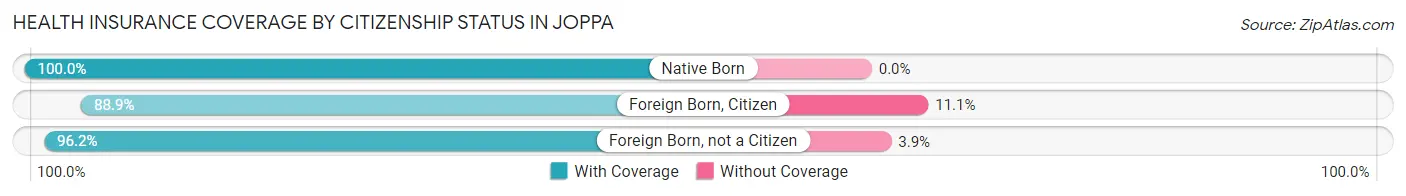
| Citizenship Status | With Coverage | Without Coverage |
| Native Born | 36 (100.0%) | 0 (0.0%) |
| Foreign Born, Citizen | 64 (88.9%) | 8 (11.1%) |
| Foreign Born, not a Citizen | 50 (96.2%) | 2 (3.8%) |
Health Insurance Coverage by Household Income in Joppa
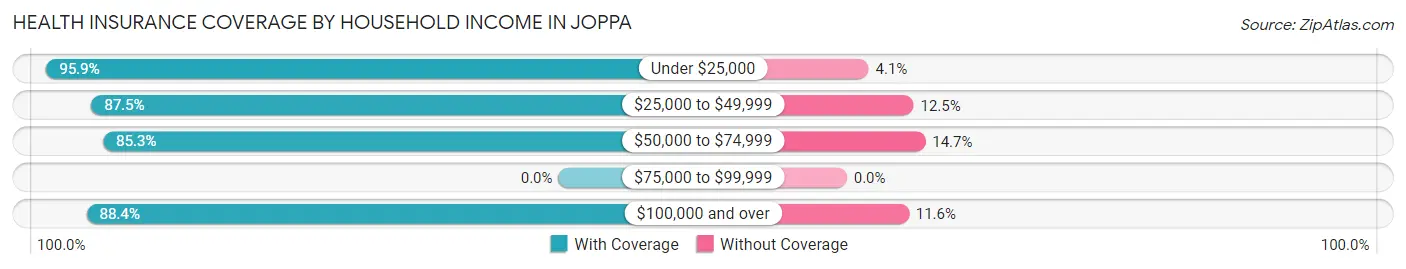
| Household Income | With Coverage | Without Coverage |
| Under $25,000 | 47 (95.9%) | 2 (4.1%) |
| $25,000 to $49,999 | 91 (87.5%) | 13 (12.5%) |
| $50,000 to $74,999 | 58 (85.3%) | 10 (14.7%) |
| $75,000 to $99,999 | 0 (0.0%) | 0 (0.0%) |
| $100,000 and over | 99 (88.4%) | 13 (11.6%) |
Public vs Private Health Insurance Coverage by Age in Joppa
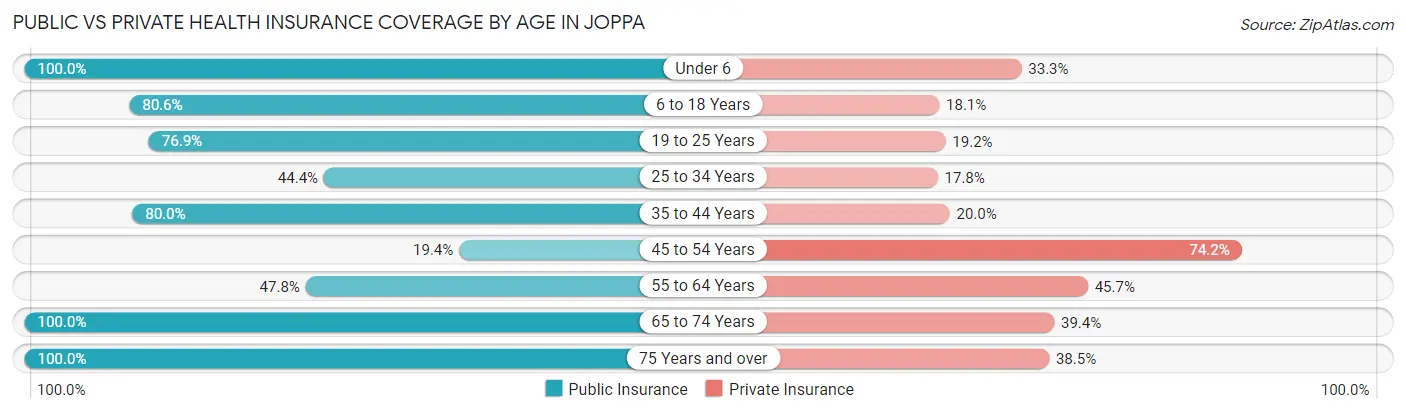
| Age Bracket | Public Insurance | Private Insurance |
| Under 6 | 36 (100.0%) | 12 (33.3%) |
| 6 to 18 Years | 58 (80.6%) | 13 (18.1%) |
| 19 to 25 Years | 40 (76.9%) | 10 (19.2%) |
| 25 to 34 Years | 20 (44.4%) | 8 (17.8%) |
| 35 to 44 Years | 4 (80.0%) | 1 (20.0%) |
| 45 to 54 Years | 6 (19.4%) | 23 (74.2%) |
| 55 to 64 Years | 22 (47.8%) | 21 (45.7%) |
| 65 to 74 Years | 33 (100.0%) | 13 (39.4%) |
| 75 Years and over | 13 (100.0%) | 5 (38.5%) |
| Total | 232 (69.7%) | 106 (31.8%) |
Disability Status by Sex by Age in Joppa
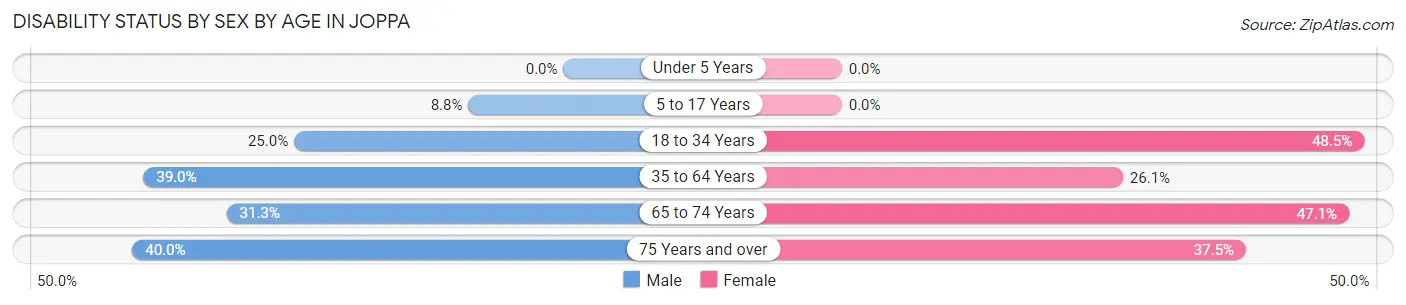
| Age Bracket | Male | Female |
| Under 5 Years | 0 (0.0%) | 0 (0.0%) |
| 5 to 17 Years | 3 (8.8%) | 0 (0.0%) |
| 18 to 34 Years | 18 (25.0%) | 16 (48.5%) |
| 35 to 64 Years | 23 (39.0%) | 6 (26.1%) |
| 65 to 74 Years | 5 (31.2%) | 8 (47.1%) |
| 75 Years and over | 2 (40.0%) | 3 (37.5%) |
Disability Class by Sex by Age in Joppa
Disability Class: Hearing Difficulty
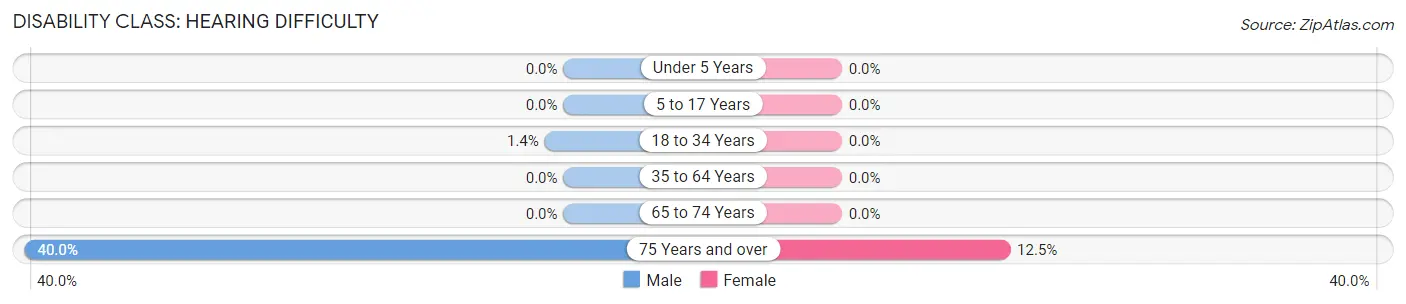
| Age Bracket | Male | Female |
| Under 5 Years | 0 (0.0%) | 0 (0.0%) |
| 5 to 17 Years | 0 (0.0%) | 0 (0.0%) |
| 18 to 34 Years | 1 (1.4%) | 0 (0.0%) |
| 35 to 64 Years | 0 (0.0%) | 0 (0.0%) |
| 65 to 74 Years | 0 (0.0%) | 0 (0.0%) |
| 75 Years and over | 2 (40.0%) | 1 (12.5%) |
Disability Class: Vision Difficulty
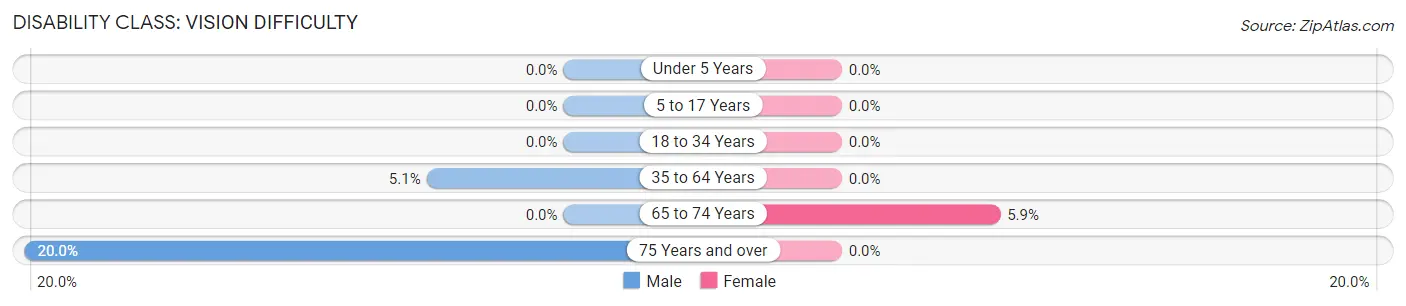
| Age Bracket | Male | Female |
| Under 5 Years | 0 (0.0%) | 0 (0.0%) |
| 5 to 17 Years | 0 (0.0%) | 0 (0.0%) |
| 18 to 34 Years | 0 (0.0%) | 0 (0.0%) |
| 35 to 64 Years | 3 (5.1%) | 0 (0.0%) |
| 65 to 74 Years | 0 (0.0%) | 1 (5.9%) |
| 75 Years and over | 1 (20.0%) | 0 (0.0%) |
Disability Class: Cognitive Difficulty
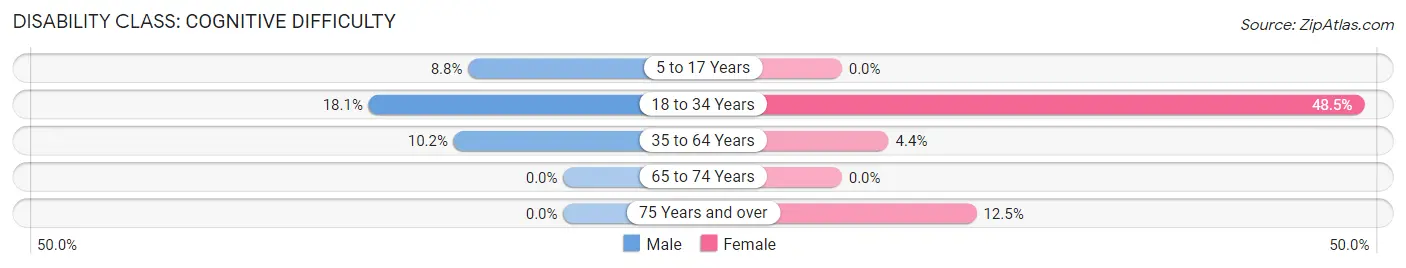
| Age Bracket | Male | Female |
| 5 to 17 Years | 3 (8.8%) | 0 (0.0%) |
| 18 to 34 Years | 13 (18.1%) | 16 (48.5%) |
| 35 to 64 Years | 6 (10.2%) | 1 (4.3%) |
| 65 to 74 Years | 0 (0.0%) | 0 (0.0%) |
| 75 Years and over | 0 (0.0%) | 1 (12.5%) |
Disability Class: Ambulatory Difficulty
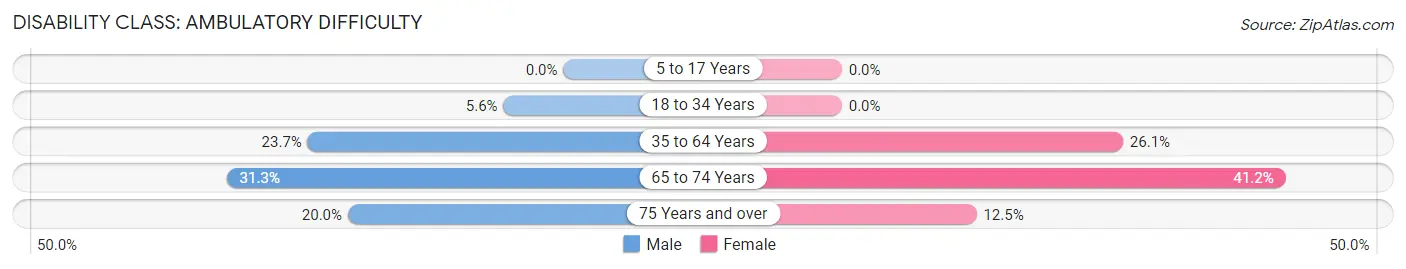
| Age Bracket | Male | Female |
| 5 to 17 Years | 0 (0.0%) | 0 (0.0%) |
| 18 to 34 Years | 4 (5.6%) | 0 (0.0%) |
| 35 to 64 Years | 14 (23.7%) | 6 (26.1%) |
| 65 to 74 Years | 5 (31.2%) | 7 (41.2%) |
| 75 Years and over | 1 (20.0%) | 1 (12.5%) |
Disability Class: Self-Care Difficulty
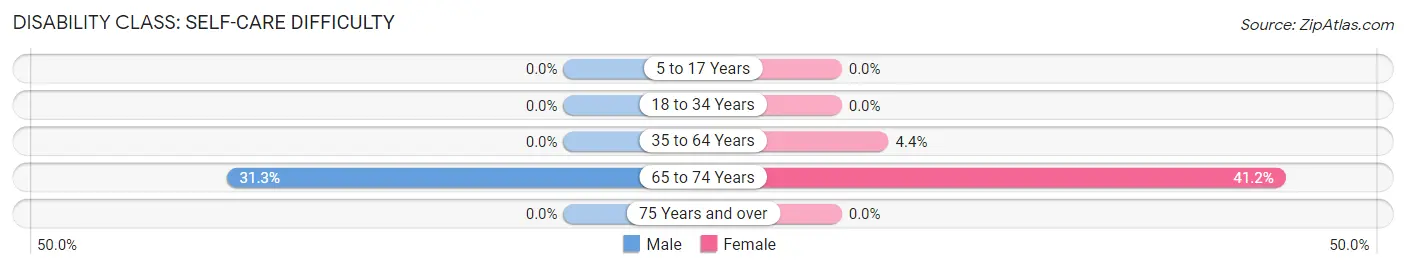
| Age Bracket | Male | Female |
| 5 to 17 Years | 0 (0.0%) | 0 (0.0%) |
| 18 to 34 Years | 0 (0.0%) | 0 (0.0%) |
| 35 to 64 Years | 0 (0.0%) | 1 (4.3%) |
| 65 to 74 Years | 5 (31.2%) | 7 (41.2%) |
| 75 Years and over | 0 (0.0%) | 0 (0.0%) |
Technology Access in Joppa
Computing Device Access in Joppa
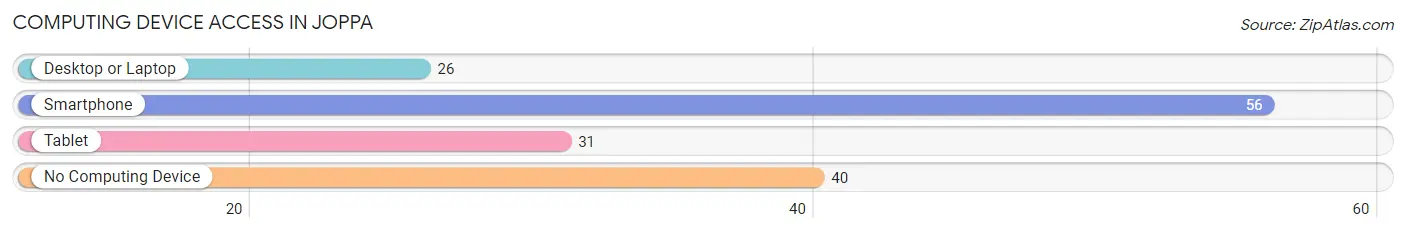
| Device Type | # Households | % Households |
| Desktop or Laptop | 26 | 26.3% |
| Smartphone | 56 | 56.6% |
| Tablet | 31 | 31.3% |
| No Computing Device | 40 | 40.4% |
| Total | 99 | 100.0% |
Internet Access in Joppa
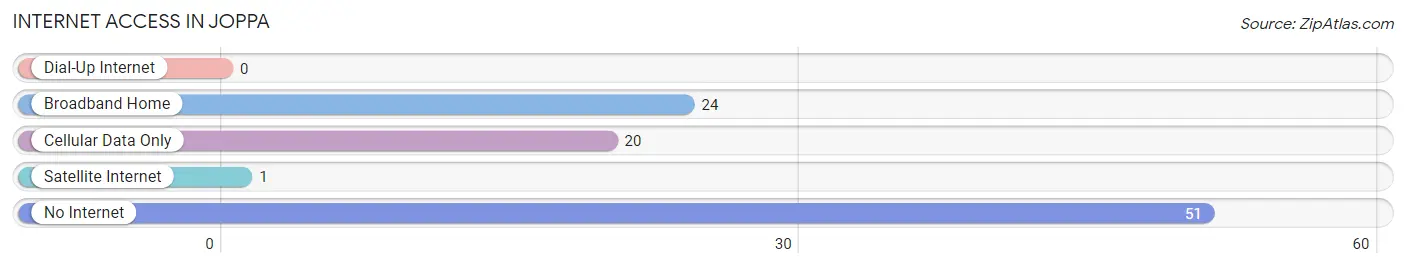
| Internet Type | # Households | % Households |
| Dial-Up Internet | 0 | 0.0% |
| Broadband Home | 24 | 24.2% |
| Cellular Data Only | 20 | 20.2% |
| Satellite Internet | 1 | 1.0% |
| No Internet | 51 | 51.5% |
| Total | 99 | 100.0% |
Joppa Summary
Joppa, Illinois is a small village located in the southern part of the state, in the county of Massac. It is situated on the banks of the Ohio River, and is part of the Paducah, Kentucky metropolitan area. The village has a population of just over 500 people, and is home to a variety of businesses, including a grocery store, a gas station, a post office, and a few restaurants.
History
Joppa was founded in 1818 by a group of settlers from Kentucky. The village was named after the biblical city of Joppa, which was located in modern-day Israel. The settlers were attracted to the area due to its proximity to the Ohio River, which provided them with access to the markets of the Midwest.
The village grew slowly over the years, and by the mid-19th century, it had become a thriving community. The village was home to a variety of businesses, including a sawmill, a gristmill, a blacksmith shop, and a general store. The village also had a post office, which was established in 1851.
In the late 19th century, the village began to decline, as the railroad bypassed it and the population began to move away. By the early 20th century, the village had become a virtual ghost town. However, in the 1950s, the village began to experience a resurgence, as new businesses began to move in and the population began to grow.
Geography
Joppa is located in the southern part of the state, in the county of Massac. It is situated on the banks of the Ohio River, and is part of the Paducah, Kentucky metropolitan area. The village is located at an elevation of 463 feet above sea level.
The village is located in a rural area, and is surrounded by farmland. The nearest major city is Paducah, which is located about 20 miles to the east. The nearest airport is the Barkley Regional Airport, which is located about 25 miles to the east.
Economy
The economy of Joppa is largely based on agriculture and tourism. The village is home to a variety of businesses, including a grocery store, a gas station, a post office, and a few restaurants. The village also has a few small manufacturing businesses, such as a furniture factory and a woodworking shop.
The village is also home to a number of tourist attractions, including the Joppa Historic District, which is listed on the National Register of Historic Places. The district includes a variety of historic buildings, including the Joppa Presbyterian Church, which was built in 1845.
Demographics
As of the 2010 census, the population of Joppa was 514. The racial makeup of the village was 97.3% White, 0.6% African American, 0.2% Native American, 0.2% Asian, 0.2% from other races, and 1.7% from two or more races. Hispanic or Latino of any race were 0.8% of the population.
The median household income in Joppa was $37,500, and the median family income was $41,250. The per capita income for the village was $17,845. About 11.3% of families and 13.2% of the population were below the poverty line, including 17.2% of those under age 18 and 8.3% of those age 65 or over.
Common Questions
What is Per Capita Income in Joppa?
Per Capita income in Joppa is $18,688.
What is the Median Household income in Joppa?
Median Household Income in Joppa is $39,464.
What is Income or Wage Gap in Joppa?
Income or Wage Gap in Joppa is 17.1%.
Women in Joppa earn 82.9 cents for every dollar earned by a man.
What is Inequality or Gini Index in Joppa?
Inequality or Gini Index in Joppa is 0.45.
What is the Total Population of Joppa?
Total Population of Joppa is 333.
What is the Total Male Population of Joppa?
Total Male Population of Joppa is 197.
What is the Total Female Population of Joppa?
Total Female Population of Joppa is 136.
What is the Ratio of Males per 100 Females in Joppa?
There are 144.85 Males per 100 Females in Joppa.
What is the Ratio of Females per 100 Males in Joppa?
There are 69.04 Females per 100 Males in Joppa.
What is the Median Population Age in Joppa?
Median Population Age in Joppa is 26.7 Years.
What is the Average Family Size in Joppa
Average Family Size in Joppa is 4.1 People.
What is the Average Household Size in Joppa
Average Household Size in Joppa is 3.4 People.
How Large is the Labor Force in Joppa?
There are 140 People in the Labor Forcein in Joppa.
What is the Percentage of People in the Labor Force in Joppa?
54.3% of People are in the Labor Force in Joppa.
What is the Unemployment Rate in Joppa?
Unemployment Rate in Joppa is 37.1%.