Oakdale, IL Map & Demographics
Oakdale Map
Oakdale Overview
$31,052
PER CAPITA INCOME
$120,119
AVG FAMILY INCOME
$84,286
AVG HOUSEHOLD INCOME
0.27
INEQUALITY / GINI INDEX
295
TOTAL POPULATION
132
MALE POPULATION
163
FEMALE POPULATION
80.98
MALES / 100 FEMALES
123.48
FEMALES / 100 MALES
35.8
MEDIAN AGE
3.8
AVG FAMILY SIZE
2.8
AVG HOUSEHOLD SIZE
164
LABOR FORCE [ PEOPLE ]
65.3%
PERCENT IN LABOR FORCE
20.7%
UNEMPLOYMENT RATE
Oakdale Zip Codes
Oakdale Area Codes
Income in Oakdale
Income Overview in Oakdale
Per Capita Income in Oakdale is $31,052, while median incomes of families and households are $120,119 and $84,286 respectively.
| Characteristic | Number | Measure |
| Per Capita Income | 295 | $31,052 |
| Median Family Income | 64 | $120,119 |
| Mean Family Income | 64 | $94,623 |
| Median Household Income | 104 | $84,286 |
| Mean Household Income | 104 | $81,375 |
| Income Deficit | 64 | $0 |
| Wage / Income Gap (%) | 295 | 0.00% |
| Wage / Income Gap ($) | 295 | 100.00¢ per $1 |
| Gini / Inequality Index | 295 | 0.27 |
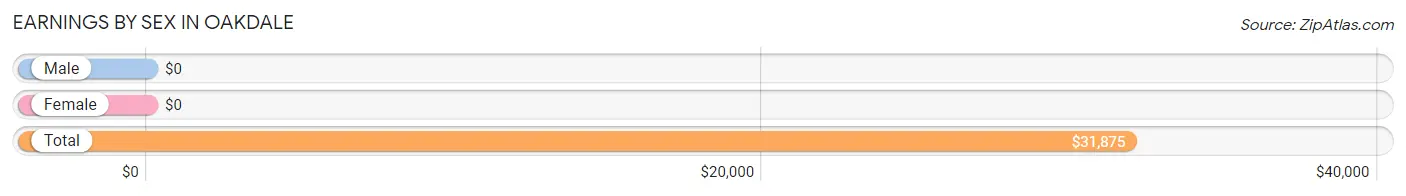
Earnings by Sex in Oakdale
| Sex | Number | Average Earnings |
| Male | 87 (51.5%) | $0 |
| Female | 82 (48.5%) | $0 |
| Total | 169 (100.0%) | $31,875 |
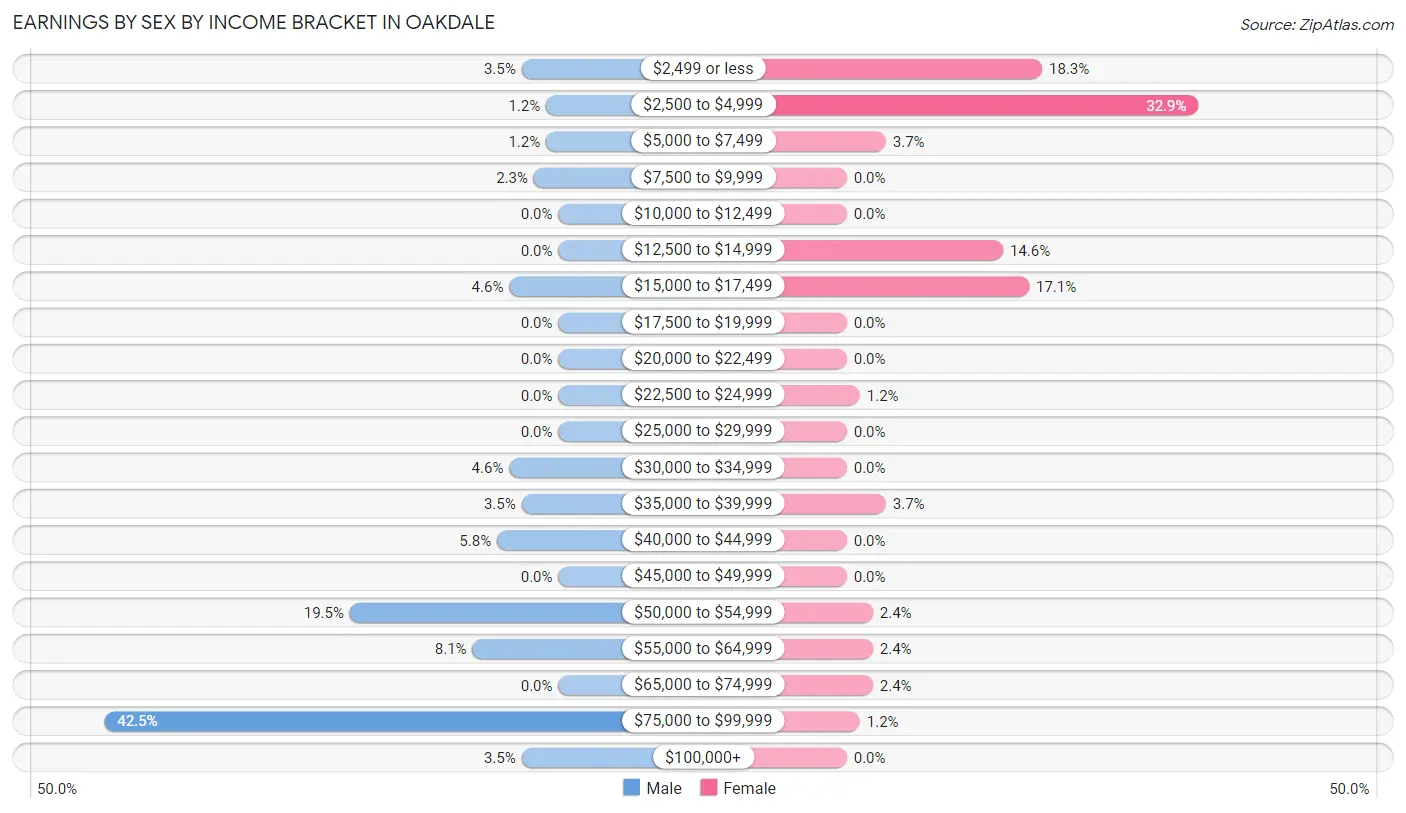
Earnings by Sex by Income Bracket in Oakdale
The most common earnings brackets in Oakdale are $75,000 to $99,999 for men (37 | 42.5%) and $2,500 to $4,999 for women (27 | 32.9%).
| Income | Male | Female |
| $2,499 or less | 3 (3.5%) | 15 (18.3%) |
| $2,500 to $4,999 | 1 (1.1%) | 27 (32.9%) |
| $5,000 to $7,499 | 1 (1.1%) | 3 (3.7%) |
| $7,500 to $9,999 | 2 (2.3%) | 0 (0.0%) |
| $10,000 to $12,499 | 0 (0.0%) | 0 (0.0%) |
| $12,500 to $14,999 | 0 (0.0%) | 12 (14.6%) |
| $15,000 to $17,499 | 4 (4.6%) | 14 (17.1%) |
| $17,500 to $19,999 | 0 (0.0%) | 0 (0.0%) |
| $20,000 to $22,499 | 0 (0.0%) | 0 (0.0%) |
| $22,500 to $24,999 | 0 (0.0%) | 1 (1.2%) |
| $25,000 to $29,999 | 0 (0.0%) | 0 (0.0%) |
| $30,000 to $34,999 | 4 (4.6%) | 0 (0.0%) |
| $35,000 to $39,999 | 3 (3.5%) | 3 (3.7%) |
| $40,000 to $44,999 | 5 (5.8%) | 0 (0.0%) |
| $45,000 to $49,999 | 0 (0.0%) | 0 (0.0%) |
| $50,000 to $54,999 | 17 (19.5%) | 2 (2.4%) |
| $55,000 to $64,999 | 7 (8.1%) | 2 (2.4%) |
| $65,000 to $74,999 | 0 (0.0%) | 2 (2.4%) |
| $75,000 to $99,999 | 37 (42.5%) | 1 (1.2%) |
| $100,000+ | 3 (3.5%) | 0 (0.0%) |
| Total | 87 (100.0%) | 82 (100.0%) |
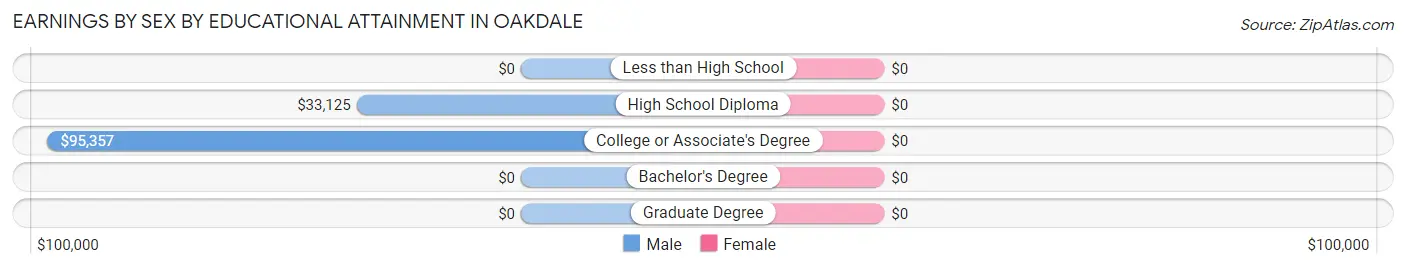
Earnings by Sex by Educational Attainment in Oakdale
| Educational Attainment | Male Income | Female Income |
| Less than High School | - | - |
| High School Diploma | $33,125 | $0 |
| College or Associate's Degree | $95,357 | $0 |
| Bachelor's Degree | - | - |
| Graduate Degree | - | - |
| Total | $92,500 | $0 |
Family Income in Oakdale
Family Income Brackets in Oakdale
According to the Oakdale family income data, there are 35 families falling into the $100,000 to $149,999 income range, which is the most common income bracket and makes up 54.7% of all families.
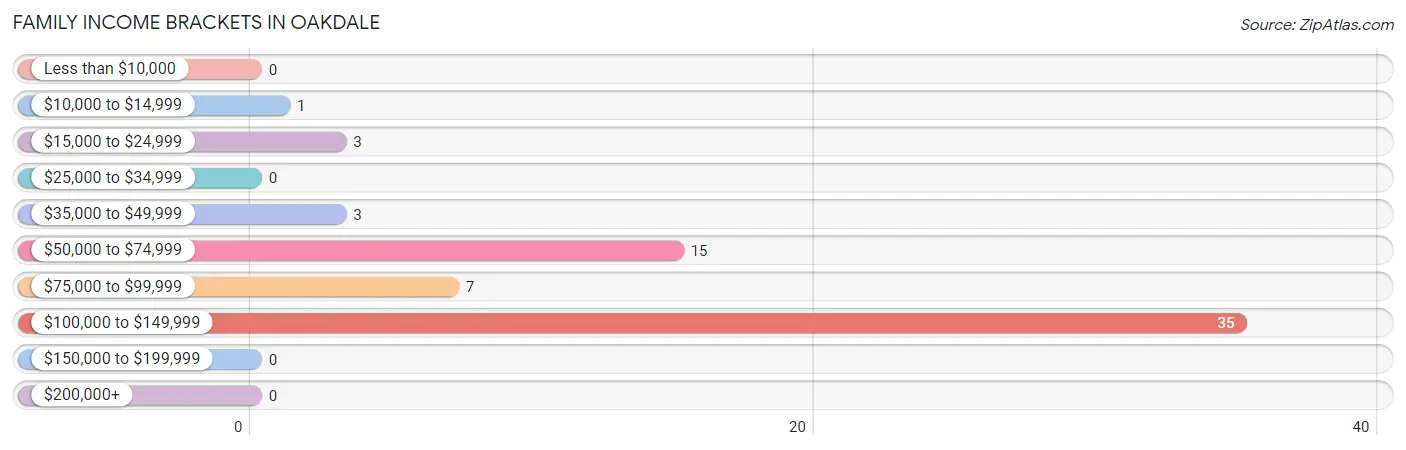
| Income Bracket | # Families | % Families |
| Less than $10,000 | 0 | 0.0% |
| $10,000 to $14,999 | 1 | 1.6% |
| $15,000 to $24,999 | 3 | 4.7% |
| $25,000 to $34,999 | 0 | 0.0% |
| $35,000 to $49,999 | 3 | 4.7% |
| $50,000 to $74,999 | 15 | 23.4% |
| $75,000 to $99,999 | 7 | 10.9% |
| $100,000 to $149,999 | 35 | 54.7% |
| $150,000 to $199,999 | 0 | 0.0% |
| $200,000+ | 0 | 0.0% |
Family Income by Famaliy Size in Oakdale
4-person families (11 | 17.2%) account for the highest median family income in Oakdale with $126,094 per family, while 2-person families (18 | 28.1%) have the highest median income of $32,500 per family member.
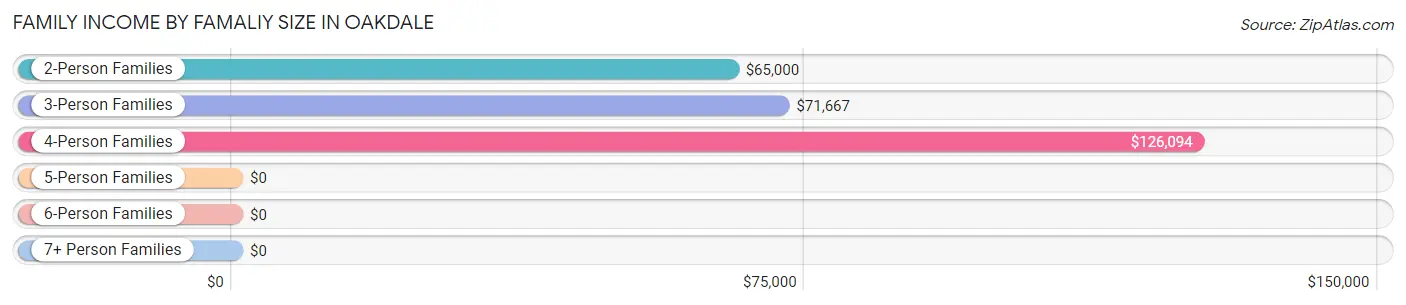
| Income Bracket | # Families | Median Income |
| 2-Person Families | 18 (28.1%) | $65,000 |
| 3-Person Families | 12 (18.8%) | $71,667 |
| 4-Person Families | 11 (17.2%) | $126,094 |
| 5-Person Families | 23 (35.9%) | $0 |
| 6-Person Families | 0 (0.0%) | $0 |
| 7+ Person Families | 0 (0.0%) | $0 |
| Total | 64 (100.0%) | $120,119 |
Family Income by Number of Earners in Oakdale
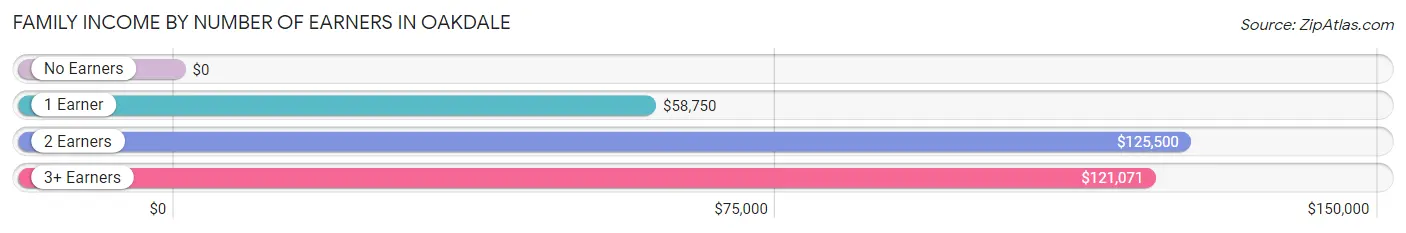
| Number of Earners | # Families | Median Income |
| No Earners | 12 (18.8%) | $0 |
| 1 Earner | 10 (15.6%) | $58,750 |
| 2 Earners | 16 (25.0%) | $125,500 |
| 3+ Earners | 26 (40.6%) | $121,071 |
| Total | 64 (100.0%) | $120,119 |
Household Income in Oakdale
Household Income Brackets in Oakdale
With 37 households falling in the category, the $100,000 to $149,999 income range is the most frequent in Oakdale, accounting for 35.6% of all households.

| Income Bracket | # Households | % Households |
| Less than $10,000 | 3 | 2.9% |
| $10,000 to $14,999 | 3 | 2.9% |
| $15,000 to $24,999 | 8 | 7.7% |
| $25,000 to $34,999 | 4 | 3.8% |
| $35,000 to $49,999 | 4 | 3.8% |
| $50,000 to $74,999 | 20 | 19.2% |
| $75,000 to $99,999 | 25 | 24.0% |
| $100,000 to $149,999 | 37 | 35.6% |
| $150,000 to $199,999 | 0 | 0.0% |
| $200,000+ | 0 | 0.0% |
Household Income by Householder Age in Oakdale
The median household income in Oakdale is $84,286, with the highest median household income of $120,298 found in the 25 to 44 years age bracket for the primary householder. A total of 37 households (35.6%) fall into this category. Meanwhile, the 15 to 24 years age bracket for the primary householder has the lowest median household income of $0, with 2 households (1.9%) in this group.
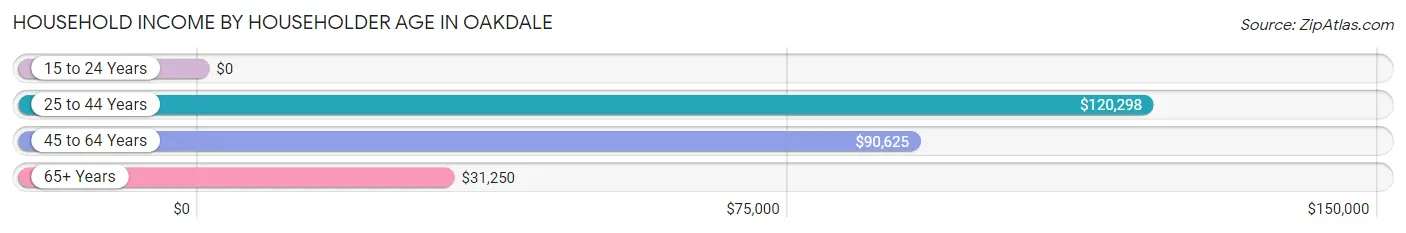
| Income Bracket | # Households | Median Income |
| 15 to 24 Years | 2 (1.9%) | $0 |
| 25 to 44 Years | 37 (35.6%) | $120,298 |
| 45 to 64 Years | 40 (38.5%) | $90,625 |
| 65+ Years | 25 (24.0%) | $31,250 |
| Total | 104 (100.0%) | $84,286 |
Poverty in Oakdale
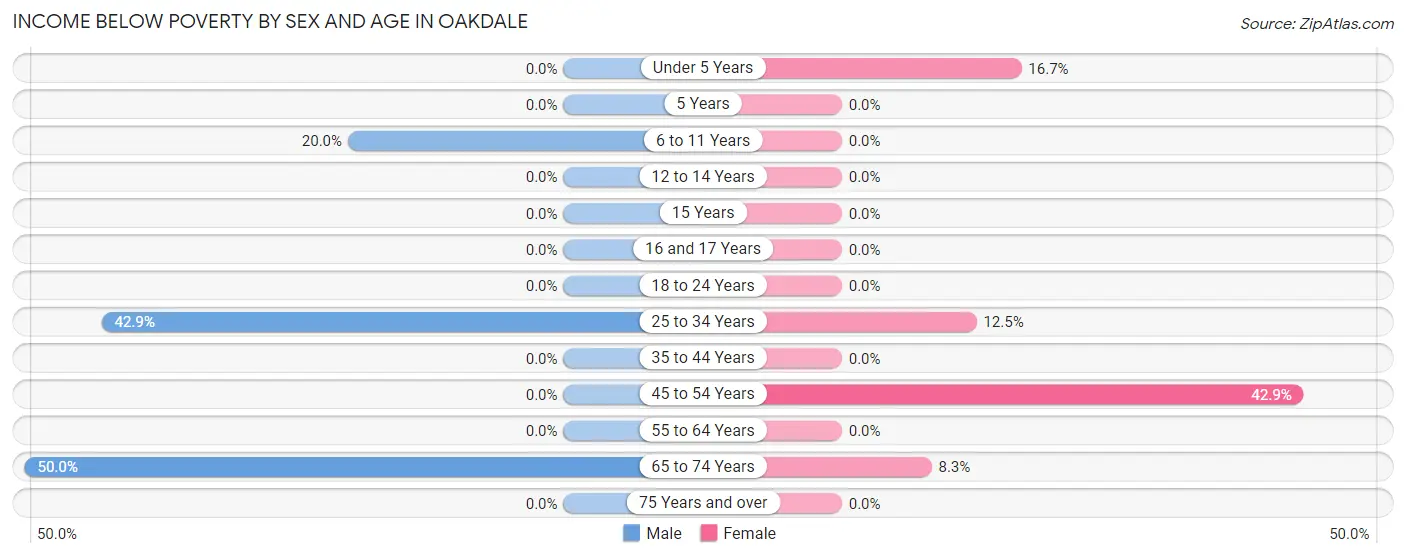
Income Below Poverty by Sex and Age in Oakdale
With 4.5% poverty level for males and 3.7% for females among the residents of Oakdale, 65 to 74 year old males and 45 to 54 year old females are the most vulnerable to poverty, with 2 males (50.0%) and 3 females (42.9%) in their respective age groups living below the poverty level.
| Age Bracket | Male | Female |
| Under 5 Years | 0 (0.0%) | 1 (16.7%) |
| 5 Years | 0 (0.0%) | 0 (0.0%) |
| 6 to 11 Years | 1 (20.0%) | 0 (0.0%) |
| 12 to 14 Years | 0 (0.0%) | 0 (0.0%) |
| 15 Years | 0 (0.0%) | 0 (0.0%) |
| 16 and 17 Years | 0 (0.0%) | 0 (0.0%) |
| 18 to 24 Years | 0 (0.0%) | 0 (0.0%) |
| 25 to 34 Years | 3 (42.9%) | 1 (12.5%) |
| 35 to 44 Years | 0 (0.0%) | 0 (0.0%) |
| 45 to 54 Years | 0 (0.0%) | 3 (42.9%) |
| 55 to 64 Years | 0 (0.0%) | 0 (0.0%) |
| 65 to 74 Years | 2 (50.0%) | 1 (8.3%) |
| 75 Years and over | 0 (0.0%) | 0 (0.0%) |
| Total | 6 (4.5%) | 6 (3.7%) |
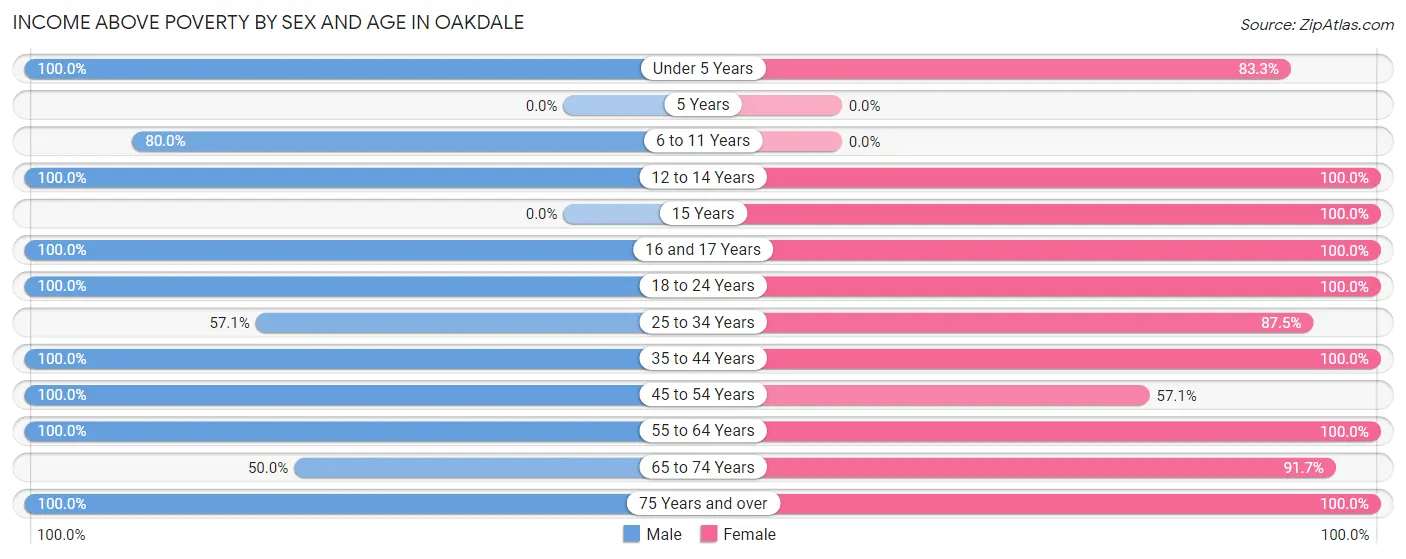
Income Above Poverty by Sex and Age in Oakdale
According to the poverty statistics in Oakdale, males aged under 5 years and females aged 12 to 14 years are the age groups that are most secure financially, with 100.0% of males and 100.0% of females in these age groups living above the poverty line.
| Age Bracket | Male | Female |
| Under 5 Years | 2 (100.0%) | 5 (83.3%) |
| 5 Years | 0 (0.0%) | 0 (0.0%) |
| 6 to 11 Years | 4 (80.0%) | 0 (0.0%) |
| 12 to 14 Years | 1 (100.0%) | 1 (100.0%) |
| 15 Years | 0 (0.0%) | 29 (100.0%) |
| 16 and 17 Years | 5 (100.0%) | 27 (100.0%) |
| 18 to 24 Years | 25 (100.0%) | 29 (100.0%) |
| 25 to 34 Years | 4 (57.1%) | 7 (87.5%) |
| 35 to 44 Years | 34 (100.0%) | 12 (100.0%) |
| 45 to 54 Years | 18 (100.0%) | 4 (57.1%) |
| 55 to 64 Years | 19 (100.0%) | 29 (100.0%) |
| 65 to 74 Years | 2 (50.0%) | 11 (91.7%) |
| 75 Years and over | 12 (100.0%) | 3 (100.0%) |
| Total | 126 (95.5%) | 157 (96.3%) |
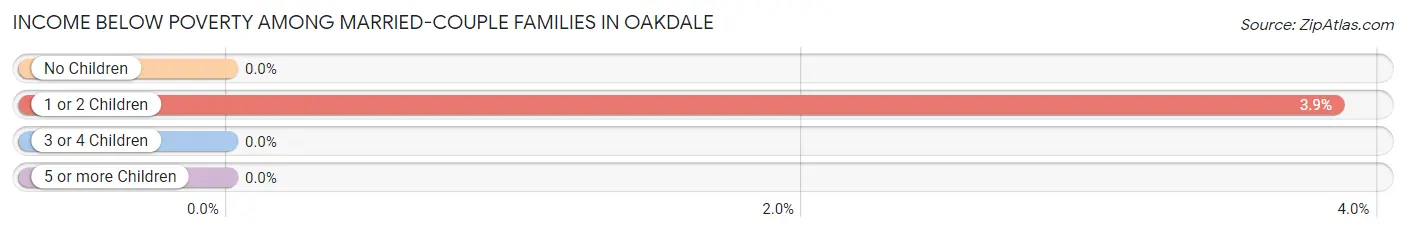
Income Below Poverty Among Married-Couple Families in Oakdale
The poverty statistics for married-couple families in Oakdale show that 2.1% or 1 of the total 47 families live below the poverty line. Families with 1 or 2 children have the highest poverty rate of 3.8%, comprising of 1 families. On the other hand, families with no children have the lowest poverty rate of 0.0%, which includes 0 families.
| Children | Above Poverty | Below Poverty |
| No Children | 21 (100.0%) | 0 (0.0%) |
| 1 or 2 Children | 25 (96.2%) | 1 (3.8%) |
| 3 or 4 Children | 0 (0.0%) | 0 (0.0%) |
| 5 or more Children | 0 (0.0%) | 0 (0.0%) |
| Total | 46 (97.9%) | 1 (2.1%) |
Income Below Poverty Among Single-Parent Households in Oakdale
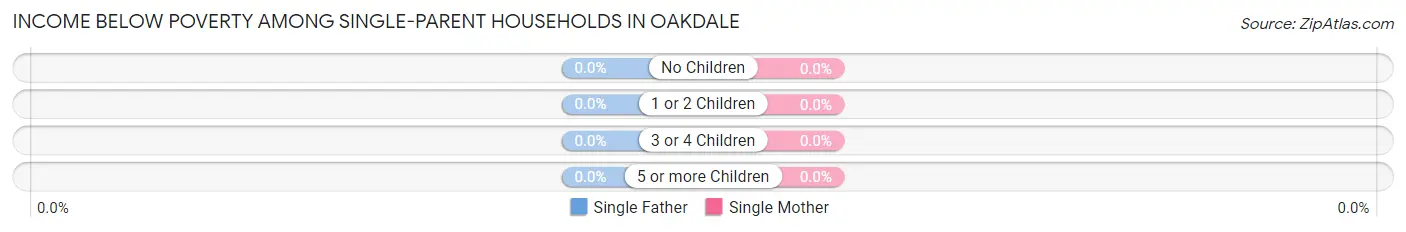
| Children | Single Father | Single Mother |
| No Children | 0 (0.0%) | 0 (0.0%) |
| 1 or 2 Children | 0 (0.0%) | 0 (0.0%) |
| 3 or 4 Children | 0 (0.0%) | 0 (0.0%) |
| 5 or more Children | 0 (0.0%) | 0 (0.0%) |
| Total | 0 (0.0%) | 0 (0.0%) |
Income Below Poverty Among Married-Couple vs Single-Parent Households in Oakdale
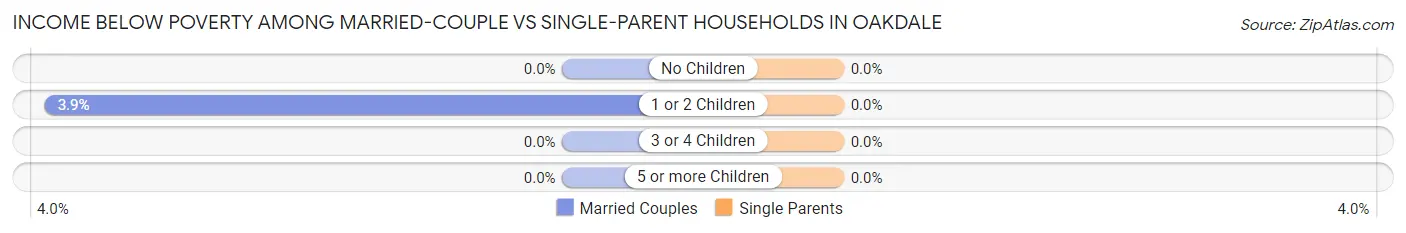
| Children | Married-Couple Families | Single-Parent Households |
| No Children | 0 (0.0%) | 0 (0.0%) |
| 1 or 2 Children | 1 (3.8%) | 0 (0.0%) |
| 3 or 4 Children | 0 (0.0%) | 0 (0.0%) |
| 5 or more Children | 0 (0.0%) | 0 (0.0%) |
| Total | 1 (2.1%) | 0 (0.0%) |
Race in Oakdale
The most populous races in Oakdale are White / Caucasian (285 | 96.6%), Hispanic or Latino (15 | 5.1%), and Two or more Races (5 | 1.7%).
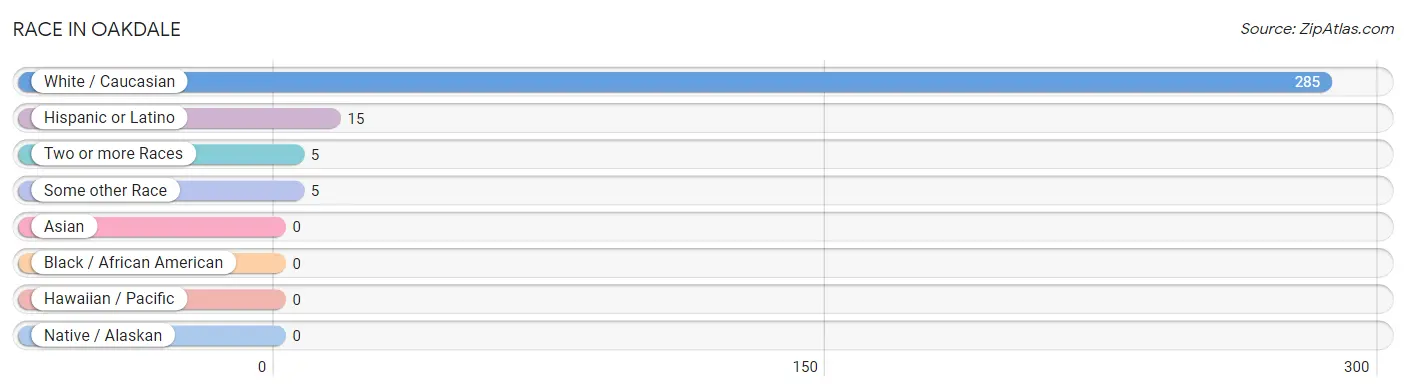
| Race | # Population | % Population |
| Asian | 0 | 0.0% |
| Black / African American | 0 | 0.0% |
| Hawaiian / Pacific | 0 | 0.0% |
| Hispanic or Latino | 15 | 5.1% |
| Native / Alaskan | 0 | 0.0% |
| White / Caucasian | 285 | 96.6% |
| Two or more Races | 5 | 1.7% |
| Some other Race | 5 | 1.7% |
| Total | 295 | 100.0% |
Ancestry in Oakdale
The most populous ancestries reported in Oakdale are German (192 | 65.1%), Polish (42 | 14.2%), American (31 | 10.5%), Irish (25 | 8.5%), and English (13 | 4.4%), together accounting for 102.7% of all Oakdale residents.
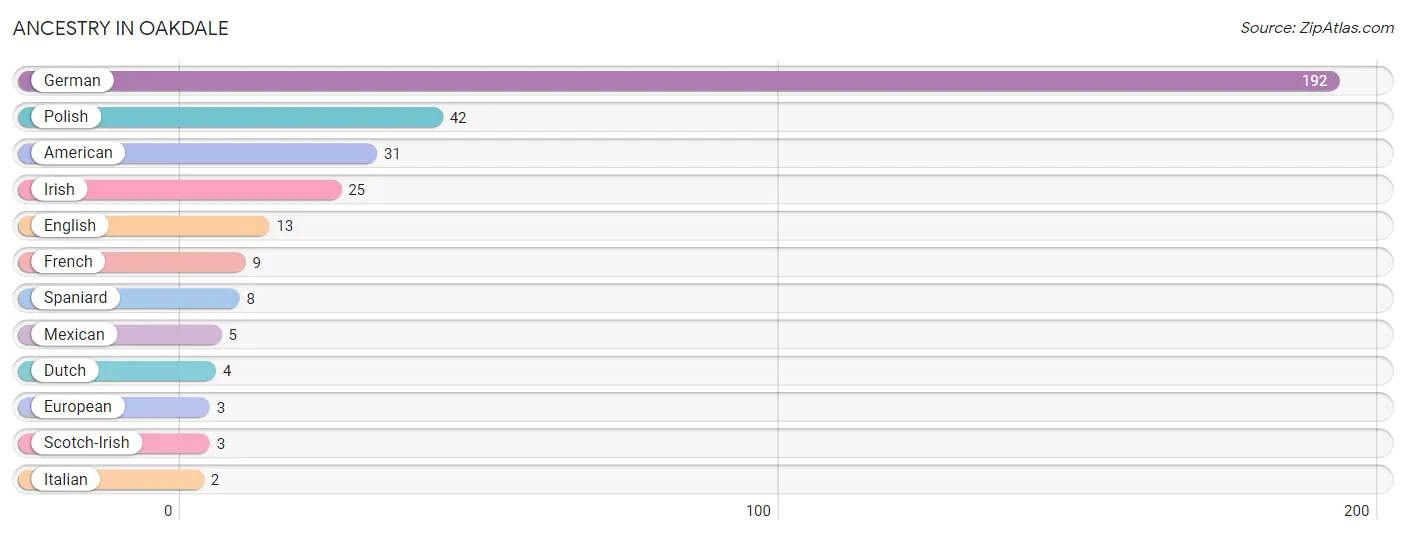
| Ancestry | # Population | % Population |
| American | 31 | 10.5% |
| Dutch | 4 | 1.4% |
| English | 13 | 4.4% |
| European | 3 | 1.0% |
| French | 9 | 3.0% |
| German | 192 | 65.1% |
| Irish | 25 | 8.5% |
| Italian | 2 | 0.7% |
| Mexican | 5 | 1.7% |
| Polish | 42 | 14.2% |
| Scotch-Irish | 3 | 1.0% |
| Spaniard | 8 | 2.7% | View All 12 Rows |
Immigrants in Oakdale
The most numerous immigrant groups reported in Oakdale came from Europe (2 | 0.7%), Southern Europe (2 | 0.7%), and Spain (2 | 0.7%), together accounting for 2.0% of all Oakdale residents.
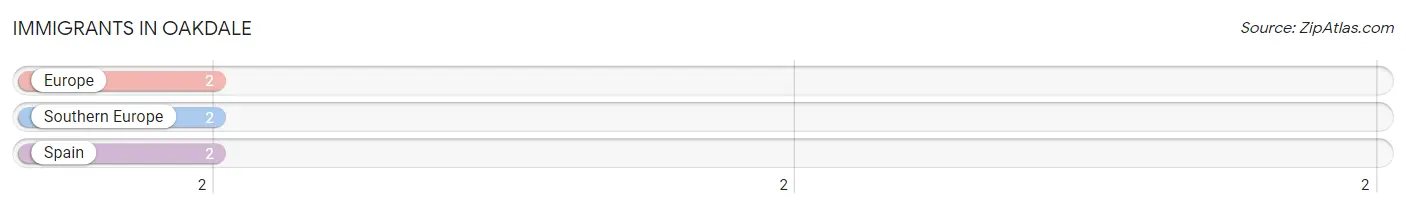
| Immigration Origin | # Population | % Population |
| Europe | 2 | 0.7% |
| Southern Europe | 2 | 0.7% |
| Spain | 2 | 0.7% | View All 3 Rows |
Sex and Age in Oakdale
Sex and Age in Oakdale
The most populous age groups in Oakdale are 40 to 44 Years (25 | 18.9%) for men and 15 to 19 Years (64 | 39.3%) for women.
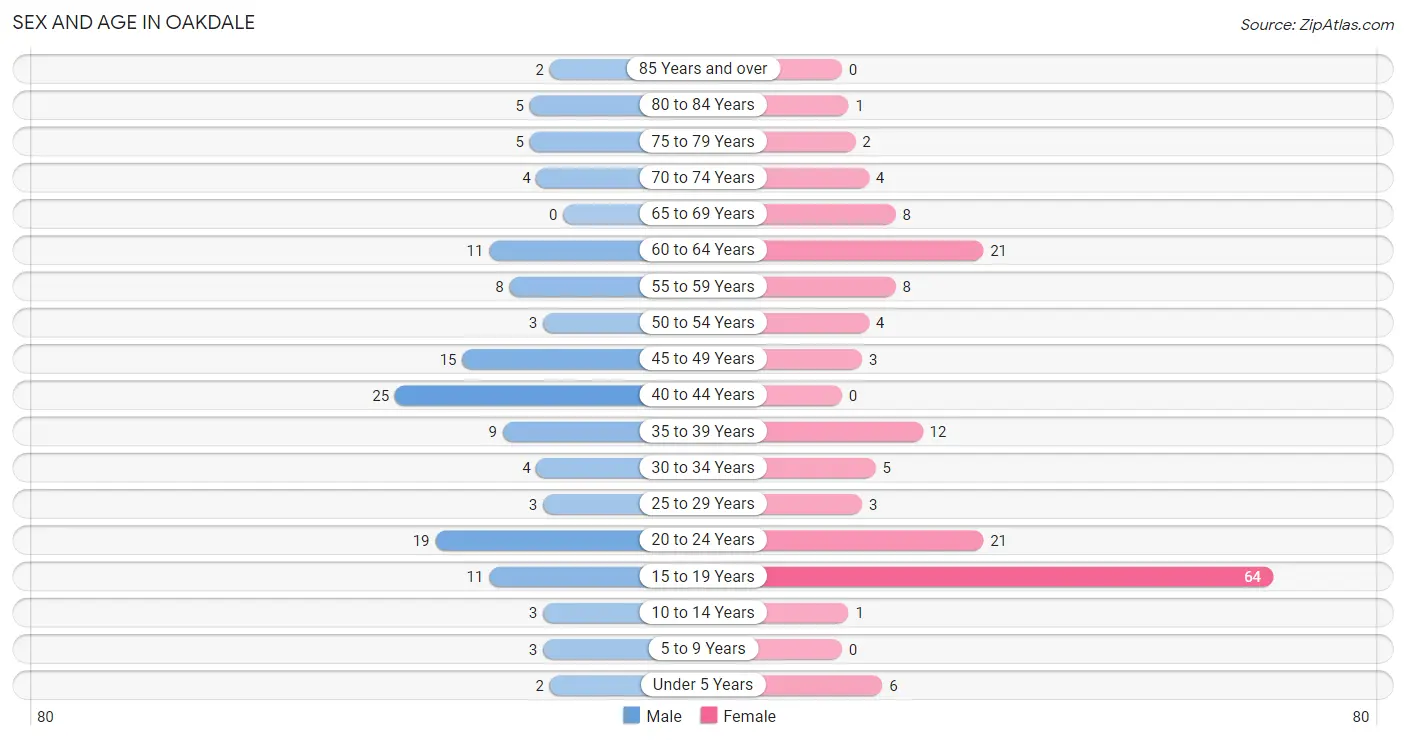
| Age Bracket | Male | Female |
| Under 5 Years | 2 (1.5%) | 6 (3.7%) |
| 5 to 9 Years | 3 (2.3%) | 0 (0.0%) |
| 10 to 14 Years | 3 (2.3%) | 1 (0.6%) |
| 15 to 19 Years | 11 (8.3%) | 64 (39.3%) |
| 20 to 24 Years | 19 (14.4%) | 21 (12.9%) |
| 25 to 29 Years | 3 (2.3%) | 3 (1.8%) |
| 30 to 34 Years | 4 (3.0%) | 5 (3.1%) |
| 35 to 39 Years | 9 (6.8%) | 12 (7.4%) |
| 40 to 44 Years | 25 (18.9%) | 0 (0.0%) |
| 45 to 49 Years | 15 (11.4%) | 3 (1.8%) |
| 50 to 54 Years | 3 (2.3%) | 4 (2.5%) |
| 55 to 59 Years | 8 (6.1%) | 8 (4.9%) |
| 60 to 64 Years | 11 (8.3%) | 21 (12.9%) |
| 65 to 69 Years | 0 (0.0%) | 8 (4.9%) |
| 70 to 74 Years | 4 (3.0%) | 4 (2.5%) |
| 75 to 79 Years | 5 (3.8%) | 2 (1.2%) |
| 80 to 84 Years | 5 (3.8%) | 1 (0.6%) |
| 85 Years and over | 2 (1.5%) | 0 (0.0%) |
| Total | 132 (100.0%) | 163 (100.0%) |
Families and Households in Oakdale
Median Family Size in Oakdale
The median family size in Oakdale is 3.84 persons per family, with married-couple families (47 | 73.4%) accounting for the largest median family size of 4.09 persons per family. On the other hand, single female/mother families (5 | 7.8%) represent the smallest median family size with 2.00 persons per family.
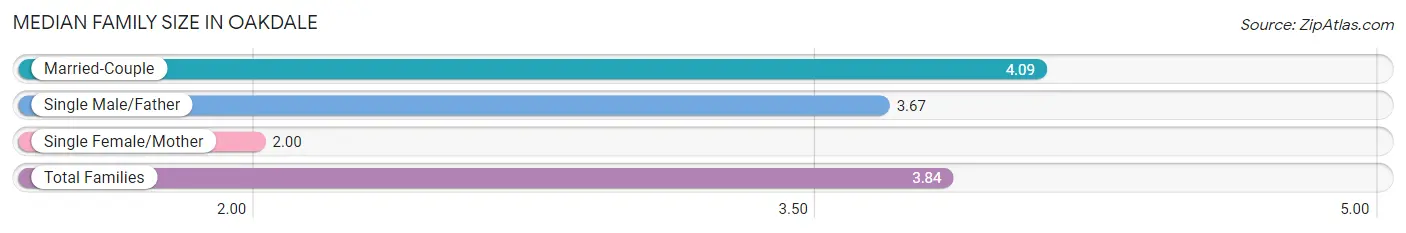
| Family Type | # Families | Family Size |
| Married-Couple | 47 (73.4%) | 4.09 |
| Single Male/Father | 12 (18.8%) | 3.67 |
| Single Female/Mother | 5 (7.8%) | 2.00 |
| Total Families | 64 (100.0%) | 3.84 |
Median Household Size in Oakdale
The median household size in Oakdale is 2.84 persons per household, with married-couple households (47 | 45.2%) accounting for the largest median household size of 4.09 persons per household. non-family households (40 | 38.5%) represent the smallest median household size with 1.05 persons per household.
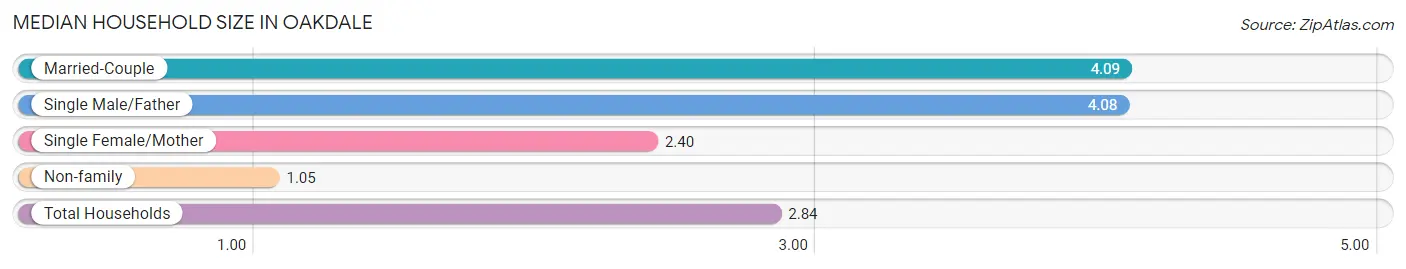
| Household Type | # Households | Household Size |
| Married-Couple | 47 (45.2%) | 4.09 |
| Single Male/Father | 12 (11.5%) | 4.08 |
| Single Female/Mother | 5 (4.8%) | 2.40 |
| Non-family | 40 (38.5%) | 1.05 |
| Total Households | 104 (100.0%) | 2.84 |
Household Size by Marriage Status in Oakdale
Out of a total of 104 households in Oakdale, 64 (61.5%) are family households, while 40 (38.5%) are nonfamily households. The most numerous type of family households are 5-person households, comprising 23, and the most common type of nonfamily households are 1-person households, comprising 38.
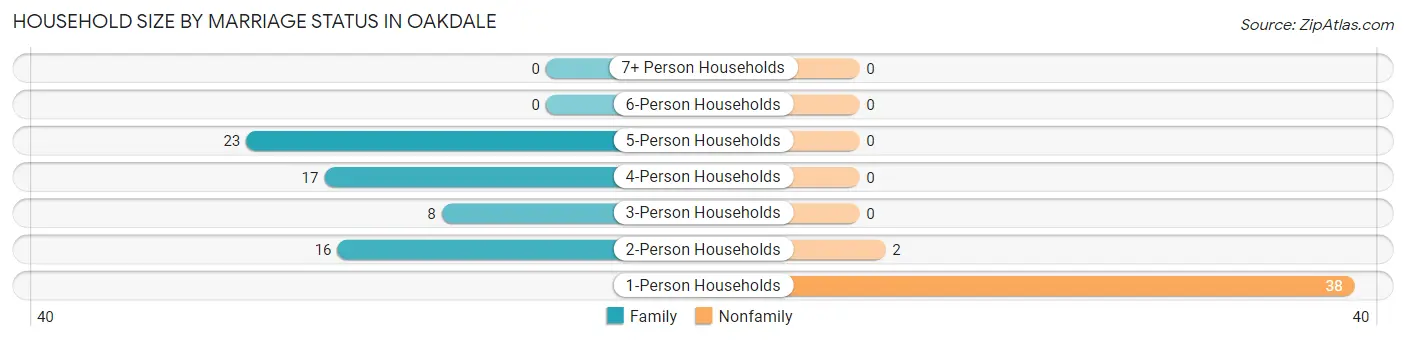
| Household Size | Family Households | Nonfamily Households |
| 1-Person Households | - | 38 (36.5%) |
| 2-Person Households | 16 (15.4%) | 2 (1.9%) |
| 3-Person Households | 8 (7.7%) | 0 (0.0%) |
| 4-Person Households | 17 (16.4%) | 0 (0.0%) |
| 5-Person Households | 23 (22.1%) | 0 (0.0%) |
| 6-Person Households | 0 (0.0%) | 0 (0.0%) |
| 7+ Person Households | 0 (0.0%) | 0 (0.0%) |
| Total | 64 (61.5%) | 40 (38.5%) |
Female Fertility in Oakdale
Fertility by Age in Oakdale
| Age Bracket | Women with Births | Births / 1,000 Women |
| 15 to 19 years | 0 (0.0%) | 0.0 |
| 20 to 34 years | 0 (0.0%) | 0.0 |
| 35 to 50 years | 0 (0.0%) | 0.0 |
| Total | 0 (0.0%) | 0.0 |
Fertility by Age by Marriage Status in Oakdale
| Age Bracket | Married | Unmarried |
| 15 to 19 years | 0 (0.0%) | 0 (0.0%) |
| 20 to 34 years | 0 (0.0%) | 0 (0.0%) |
| 35 to 50 years | 0 (0.0%) | 0 (0.0%) |
| Total | 0 (0.0%) | 0 (0.0%) |
Fertility by Education in Oakdale
| Educational Attainment | Women with Births | Births / 1,000 Women |
| Less than High School | 0 (0.0%) | 0.0 |
| High School Diploma | 0 (0.0%) | 0.0 |
| College or Associate's Degree | 0 (0.0%) | 0.0 |
| Bachelor's Degree | 0 (0.0%) | 0.0 |
| Graduate Degree | 0 (0.0%) | 0.0 |
| Total | 0 (0.0%) | 0.0 |
Fertility by Education by Marriage Status in Oakdale
| Educational Attainment | Married | Unmarried |
| Less than High School | 0 (0.0%) | 0 (0.0%) |
| High School Diploma | 0 (0.0%) | 0 (0.0%) |
| College or Associate's Degree | 0 (0.0%) | 0 (0.0%) |
| Bachelor's Degree | 0 (0.0%) | 0 (0.0%) |
| Graduate Degree | 0 (0.0%) | 0 (0.0%) |
| Total | 0 (0.0%) | 0 (0.0%) |
Employment Characteristics in Oakdale
Employment by Class of Employer in Oakdale
Among the 130 employed individuals in Oakdale, private company employees (103 | 79.2%), local government employees (13 | 10.0%), and self-employed (not incorporated) (5 | 3.8%) make up the most common classes of employment.
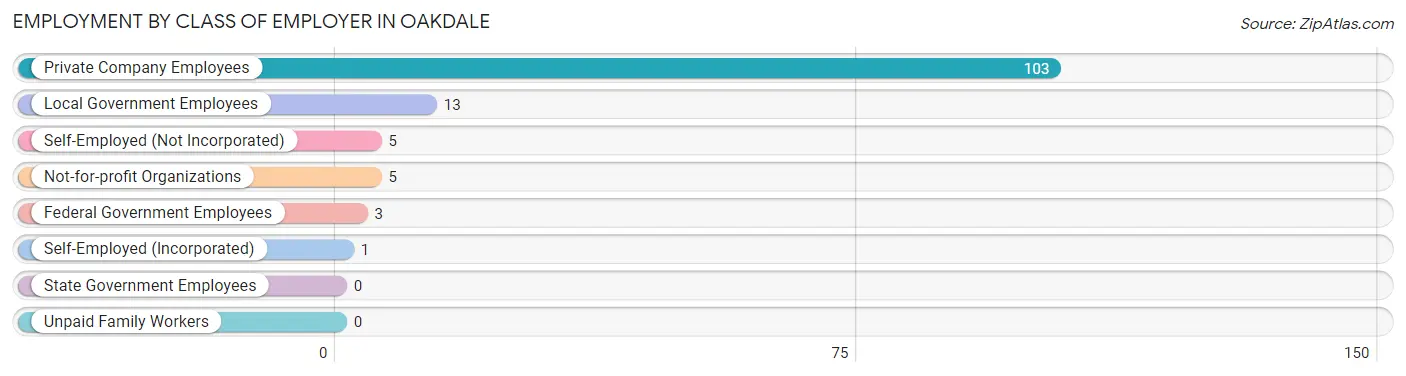
| Employer Class | # Employees | % Employees |
| Private Company Employees | 103 | 79.2% |
| Self-Employed (Incorporated) | 1 | 0.8% |
| Self-Employed (Not Incorporated) | 5 | 3.8% |
| Not-for-profit Organizations | 5 | 3.8% |
| Local Government Employees | 13 | 10.0% |
| State Government Employees | 0 | 0.0% |
| Federal Government Employees | 3 | 2.3% |
| Unpaid Family Workers | 0 | 0.0% |
| Total | 130 | 100.0% |
Employment Status by Age in Oakdale
According to the labor force statistics for Oakdale, out of the total population over 16 years of age (251), 65.3% or 164 individuals are in the labor force, with 20.7% or 34 of them unemployed. The age group with the highest labor force participation rate is 25 to 29 years, with 100.0% or 6 individuals in the labor force. Within the labor force, the 16 to 19 years age range has the highest percentage of unemployed individuals, with 77.1% or 27 of them being unemployed.
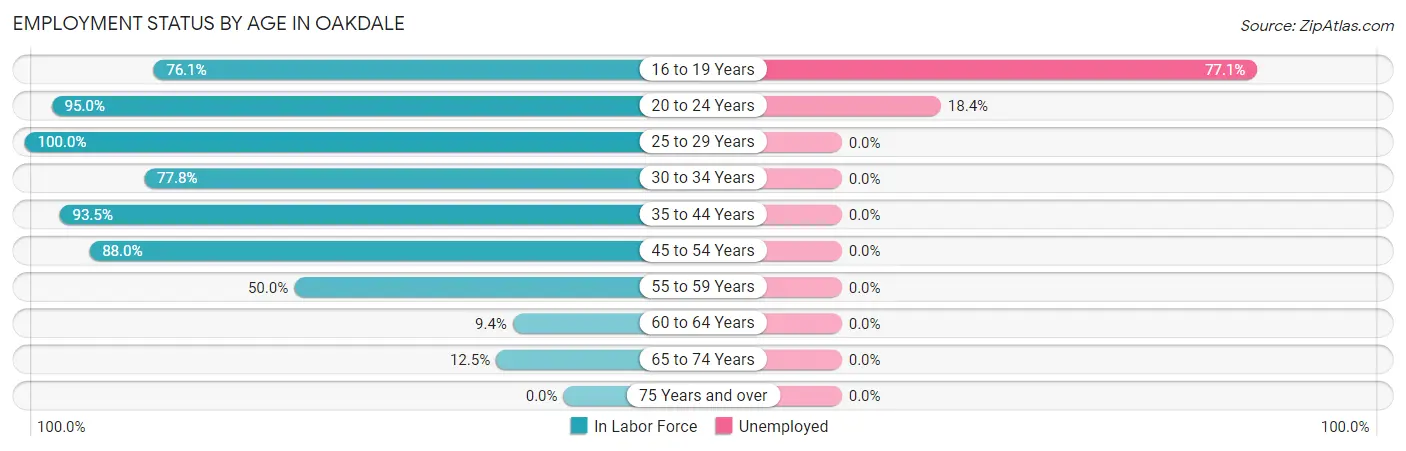
| Age Bracket | In Labor Force | Unemployed |
| 16 to 19 Years | 35 (76.1%) | 27 (77.1%) |
| 20 to 24 Years | 38 (95.0%) | 7 (18.4%) |
| 25 to 29 Years | 6 (100.0%) | 0 (0.0%) |
| 30 to 34 Years | 7 (77.8%) | 0 (0.0%) |
| 35 to 44 Years | 43 (93.5%) | 0 (0.0%) |
| 45 to 54 Years | 22 (88.0%) | 0 (0.0%) |
| 55 to 59 Years | 8 (50.0%) | 0 (0.0%) |
| 60 to 64 Years | 3 (9.4%) | 0 (0.0%) |
| 65 to 74 Years | 2 (12.5%) | 0 (0.0%) |
| 75 Years and over | 0 (0.0%) | 0 (0.0%) |
| Total | 164 (65.3%) | 34 (20.7%) |
Employment Status by Educational Attainment in Oakdale
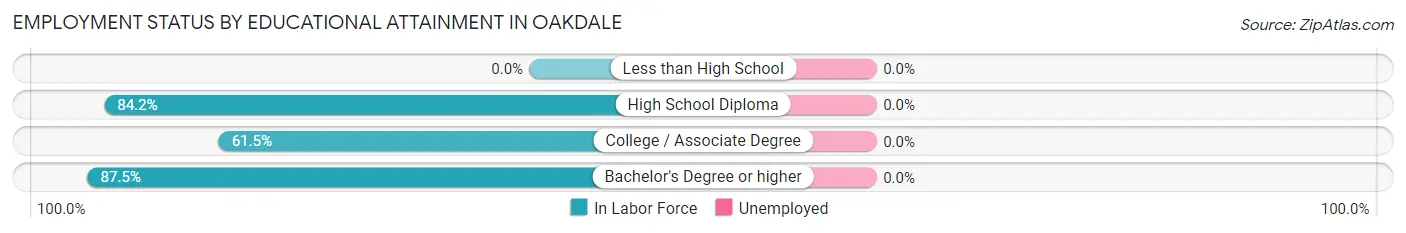
| Educational Attainment | In Labor Force | Unemployed |
| Less than High School | 0 (0.0%) | 0 (0.0%) |
| High School Diploma | 16 (84.2%) | 0 (0.0%) |
| College / Associate Degree | 59 (61.5%) | 0 (0.0%) |
| Bachelor's Degree or higher | 14 (87.5%) | 0 (0.0%) |
| Total | 89 (66.4%) | 0 (0.0%) |
Employment Occupations by Sex in Oakdale
Management, Business, Science and Arts Occupations
The most common Management, Business, Science and Arts occupations in Oakdale are Community & Social Service (14 | 10.8%), Education Instruction & Library (12 | 9.2%), Health Diagnosing & Treating (3 | 2.3%), Health Technologists (3 | 2.3%), and Management (2 | 1.5%).
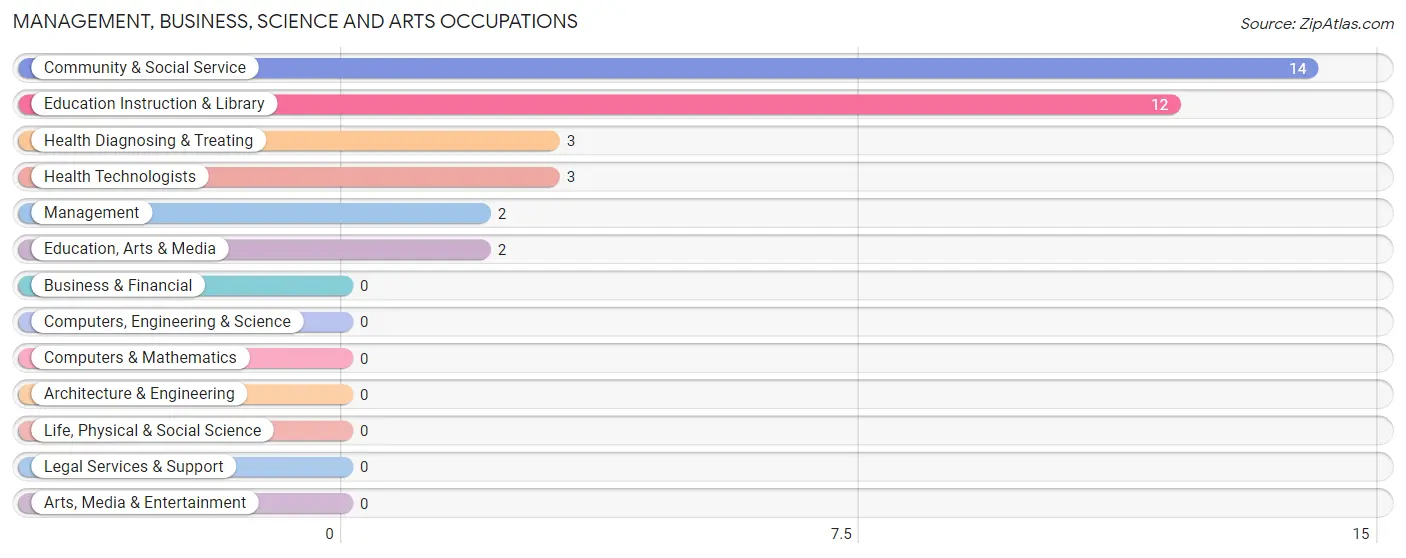
Management, Business, Science and Arts Occupations by Sex
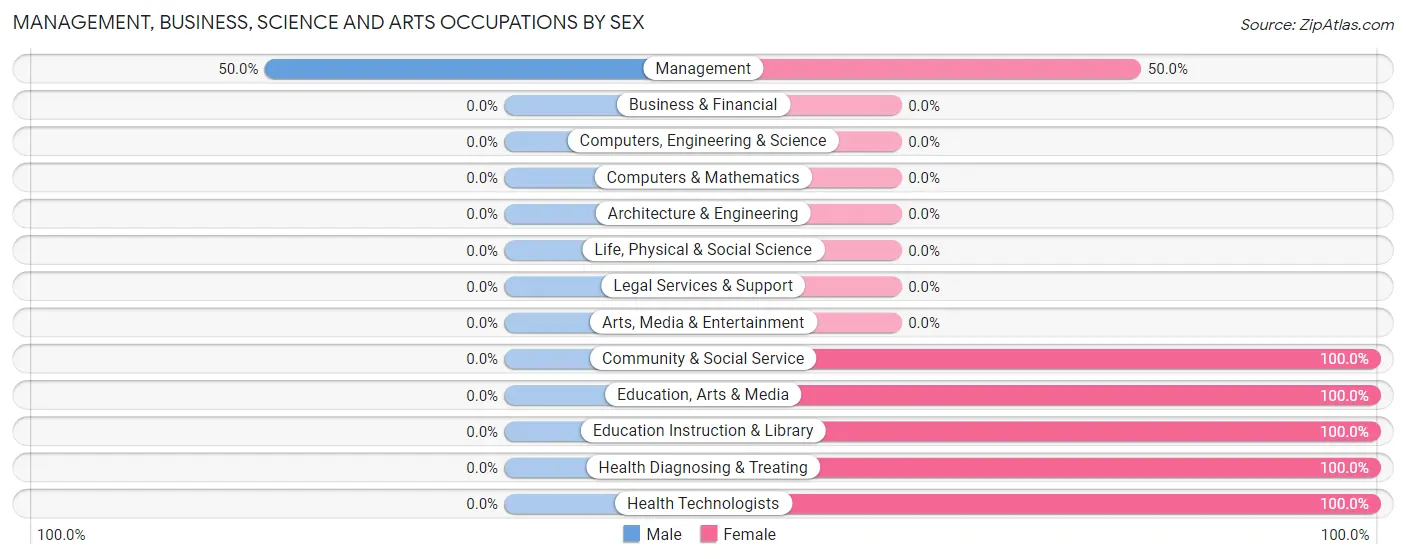
| Occupation | Male | Female |
| Management | 1 (50.0%) | 1 (50.0%) |
| Business & Financial | 0 (0.0%) | 0 (0.0%) |
| Computers, Engineering & Science | 0 (0.0%) | 0 (0.0%) |
| Computers & Mathematics | 0 (0.0%) | 0 (0.0%) |
| Architecture & Engineering | 0 (0.0%) | 0 (0.0%) |
| Life, Physical & Social Science | 0 (0.0%) | 0 (0.0%) |
| Community & Social Service | 0 (0.0%) | 14 (100.0%) |
| Education, Arts & Media | 0 (0.0%) | 2 (100.0%) |
| Legal Services & Support | 0 (0.0%) | 0 (0.0%) |
| Education Instruction & Library | 0 (0.0%) | 12 (100.0%) |
| Arts, Media & Entertainment | 0 (0.0%) | 0 (0.0%) |
| Health Diagnosing & Treating | 0 (0.0%) | 3 (100.0%) |
| Health Technologists | 0 (0.0%) | 3 (100.0%) |
| Total (Category) | 1 (5.3%) | 18 (94.7%) |
| Total (Overall) | 83 (63.8%) | 47 (36.1%) |
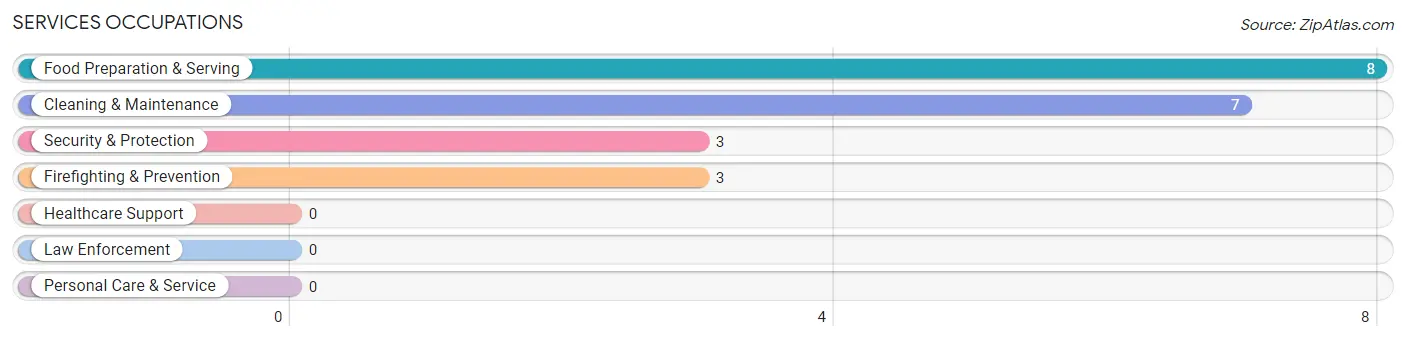
Services Occupations
The most common Services occupations in Oakdale are Food Preparation & Serving (8 | 6.1%), Cleaning & Maintenance (7 | 5.4%), Security & Protection (3 | 2.3%), and Firefighting & Prevention (3 | 2.3%).
Services Occupations by Sex
Within the Services occupations in Oakdale, the most male-oriented occupations are Security & Protection (100.0%), Firefighting & Prevention (100.0%), and Cleaning & Maintenance (42.9%), while the most female-oriented occupations are Food Preparation & Serving (100.0%), and Cleaning & Maintenance (57.1%).
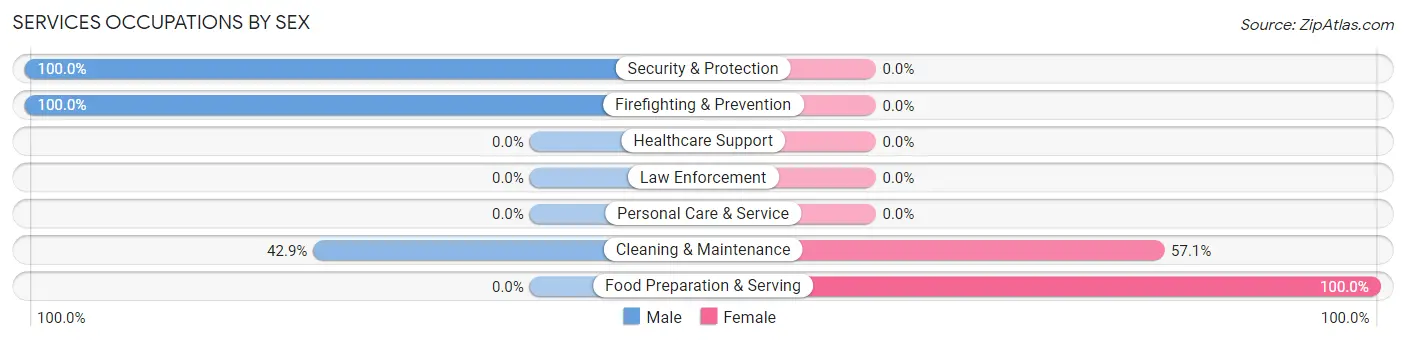
| Occupation | Male | Female |
| Healthcare Support | 0 (0.0%) | 0 (0.0%) |
| Security & Protection | 3 (100.0%) | 0 (0.0%) |
| Firefighting & Prevention | 3 (100.0%) | 0 (0.0%) |
| Law Enforcement | 0 (0.0%) | 0 (0.0%) |
| Food Preparation & Serving | 0 (0.0%) | 8 (100.0%) |
| Cleaning & Maintenance | 3 (42.9%) | 4 (57.1%) |
| Personal Care & Service | 0 (0.0%) | 0 (0.0%) |
| Total (Category) | 6 (33.3%) | 12 (66.7%) |
| Total (Overall) | 83 (63.8%) | 47 (36.1%) |
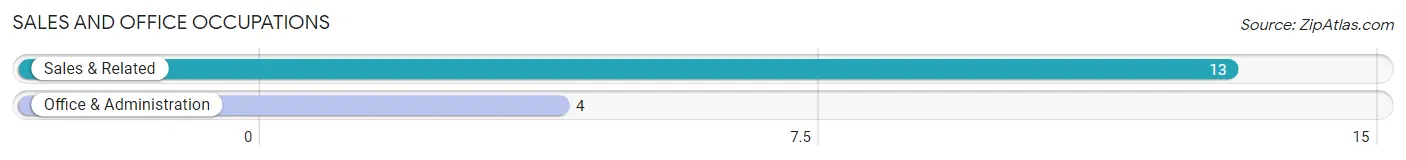
Sales and Office Occupations
The most common Sales and Office occupations in Oakdale are Sales & Related (13 | 10.0%), and Office & Administration (4 | 3.1%).
Sales and Office Occupations by Sex
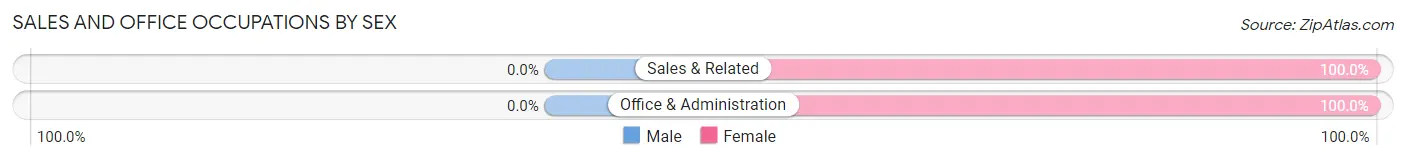
| Occupation | Male | Female |
| Sales & Related | 0 (0.0%) | 13 (100.0%) |
| Office & Administration | 0 (0.0%) | 4 (100.0%) |
| Total (Category) | 0 (0.0%) | 17 (100.0%) |
| Total (Overall) | 83 (63.8%) | 47 (36.1%) |
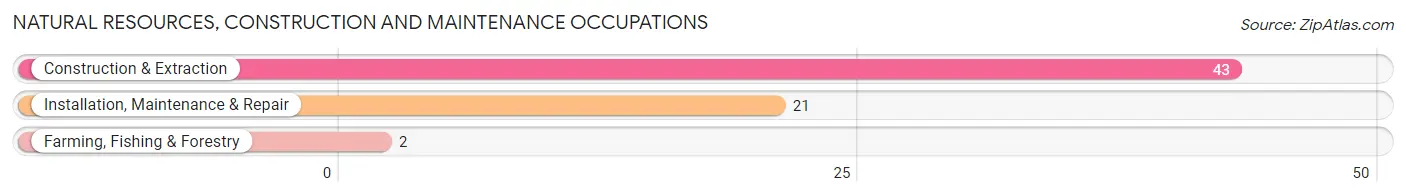
Natural Resources, Construction and Maintenance Occupations
The most common Natural Resources, Construction and Maintenance occupations in Oakdale are Construction & Extraction (43 | 33.1%), Installation, Maintenance & Repair (21 | 16.2%), and Farming, Fishing & Forestry (2 | 1.5%).
Natural Resources, Construction and Maintenance Occupations by Sex
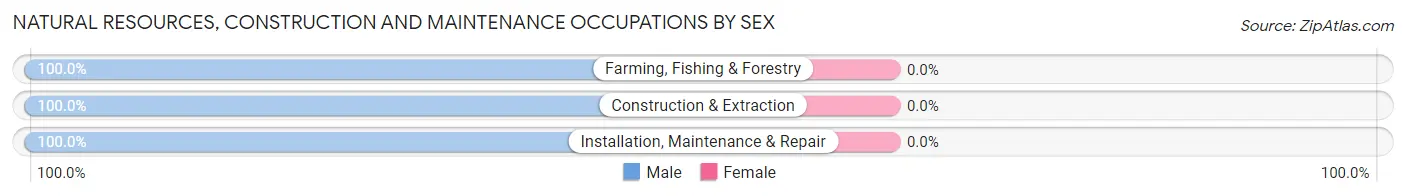
| Occupation | Male | Female |
| Farming, Fishing & Forestry | 2 (100.0%) | 0 (0.0%) |
| Construction & Extraction | 43 (100.0%) | 0 (0.0%) |
| Installation, Maintenance & Repair | 21 (100.0%) | 0 (0.0%) |
| Total (Category) | 66 (100.0%) | 0 (0.0%) |
| Total (Overall) | 83 (63.8%) | 47 (36.1%) |
Production, Transportation and Moving Occupations
The most common Production, Transportation and Moving occupations in Oakdale are Production (5 | 3.8%), and Material Moving (5 | 3.8%).
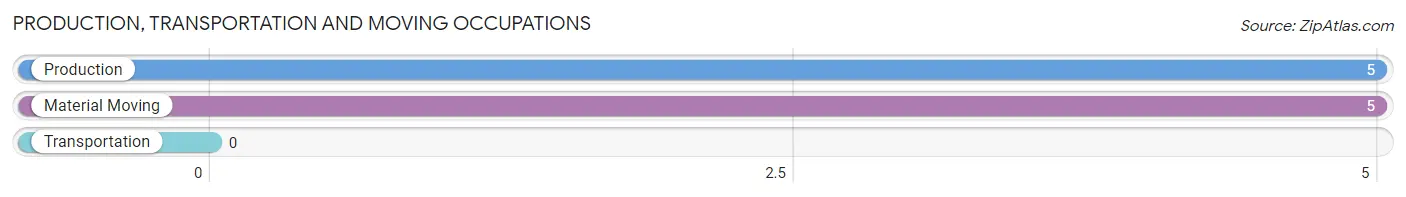
Production, Transportation and Moving Occupations by Sex
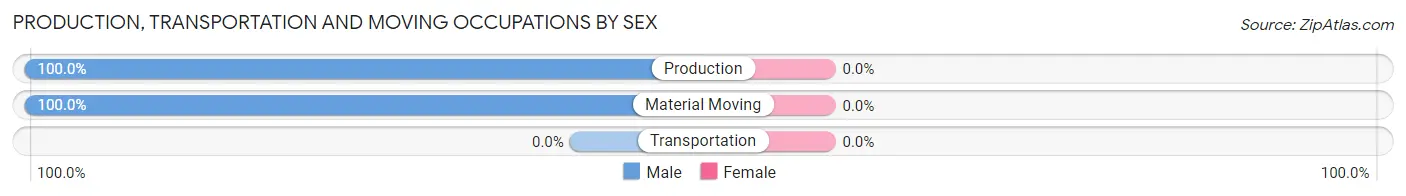
| Occupation | Male | Female |
| Production | 5 (100.0%) | 0 (0.0%) |
| Transportation | 0 (0.0%) | 0 (0.0%) |
| Material Moving | 5 (100.0%) | 0 (0.0%) |
| Total (Category) | 10 (100.0%) | 0 (0.0%) |
| Total (Overall) | 83 (63.8%) | 47 (36.1%) |
Employment Industries by Sex in Oakdale
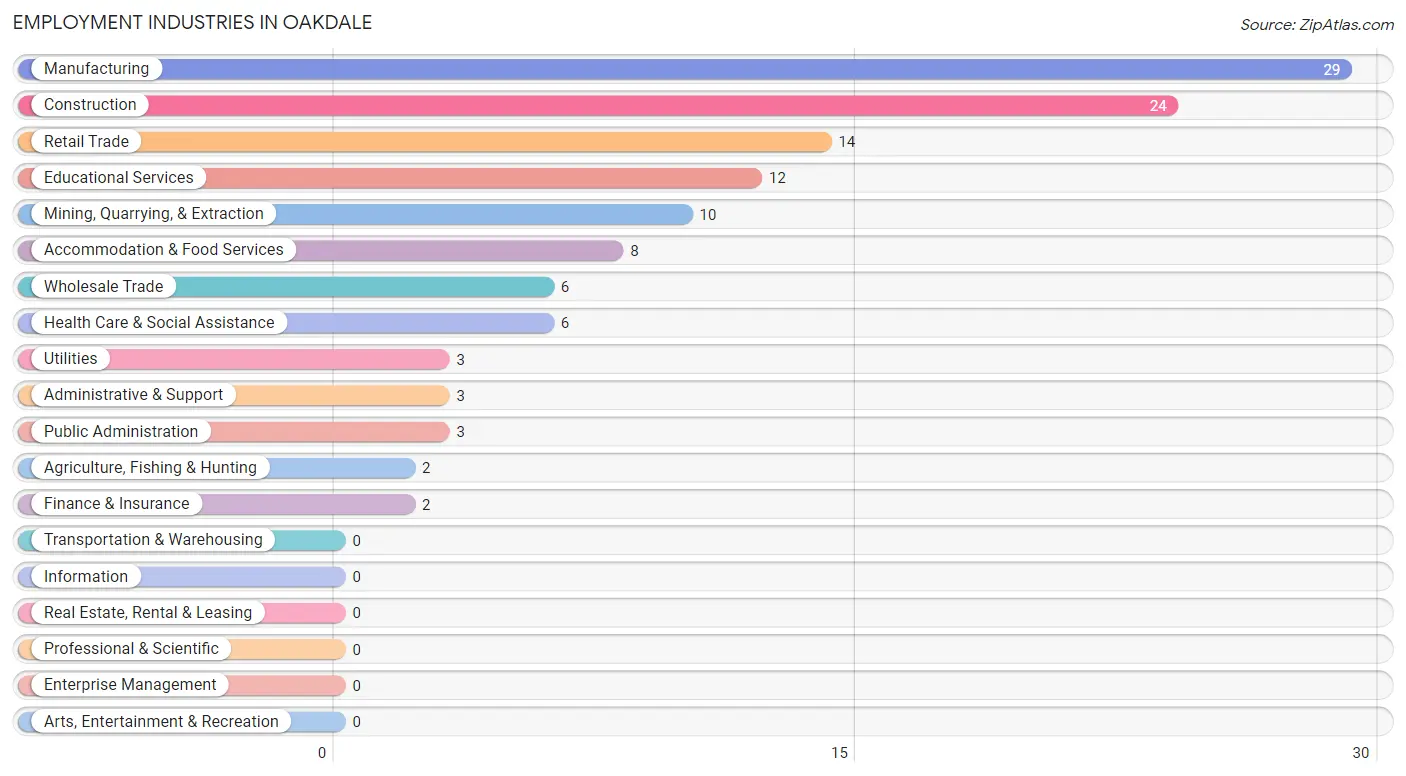
Employment Industries in Oakdale
The major employment industries in Oakdale include Manufacturing (29 | 22.3%), Construction (24 | 18.5%), Retail Trade (14 | 10.8%), Educational Services (12 | 9.2%), and Mining, Quarrying, & Extraction (10 | 7.7%).
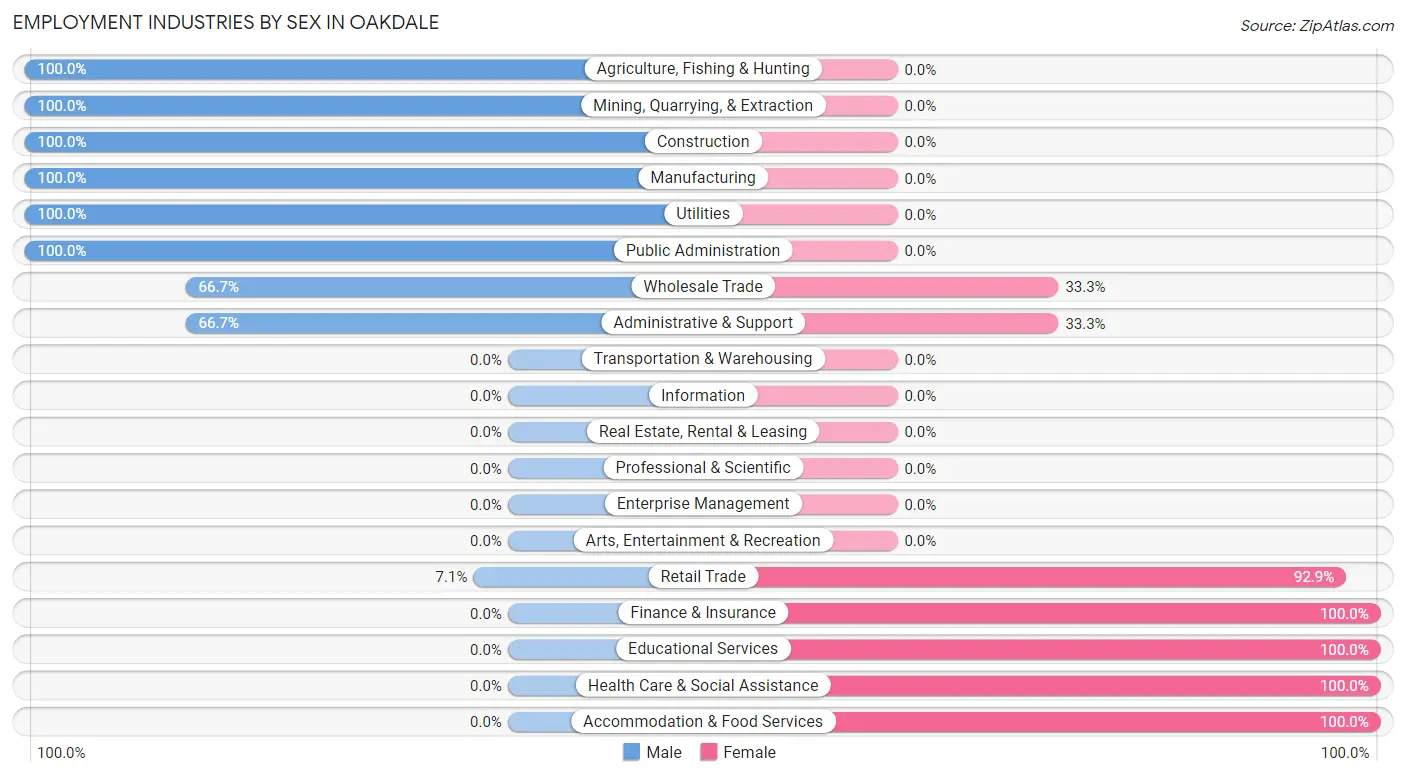
Employment Industries by Sex in Oakdale
The Oakdale industries that see more men than women are Agriculture, Fishing & Hunting (100.0%), Mining, Quarrying, & Extraction (100.0%), and Construction (100.0%), whereas the industries that tend to have a higher number of women are Finance & Insurance (100.0%), Educational Services (100.0%), and Health Care & Social Assistance (100.0%).
| Industry | Male | Female |
| Agriculture, Fishing & Hunting | 2 (100.0%) | 0 (0.0%) |
| Mining, Quarrying, & Extraction | 10 (100.0%) | 0 (0.0%) |
| Construction | 24 (100.0%) | 0 (0.0%) |
| Manufacturing | 29 (100.0%) | 0 (0.0%) |
| Wholesale Trade | 4 (66.7%) | 2 (33.3%) |
| Retail Trade | 1 (7.1%) | 13 (92.9%) |
| Transportation & Warehousing | 0 (0.0%) | 0 (0.0%) |
| Utilities | 3 (100.0%) | 0 (0.0%) |
| Information | 0 (0.0%) | 0 (0.0%) |
| Finance & Insurance | 0 (0.0%) | 2 (100.0%) |
| Real Estate, Rental & Leasing | 0 (0.0%) | 0 (0.0%) |
| Professional & Scientific | 0 (0.0%) | 0 (0.0%) |
| Enterprise Management | 0 (0.0%) | 0 (0.0%) |
| Administrative & Support | 2 (66.7%) | 1 (33.3%) |
| Educational Services | 0 (0.0%) | 12 (100.0%) |
| Health Care & Social Assistance | 0 (0.0%) | 6 (100.0%) |
| Arts, Entertainment & Recreation | 0 (0.0%) | 0 (0.0%) |
| Accommodation & Food Services | 0 (0.0%) | 8 (100.0%) |
| Public Administration | 3 (100.0%) | 0 (0.0%) |
| Total | 83 (63.8%) | 47 (36.1%) |
Education in Oakdale
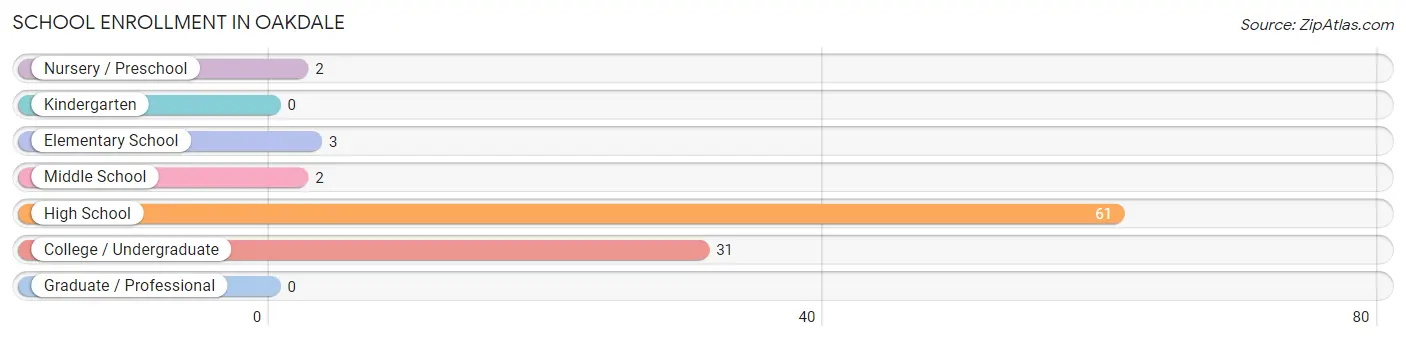
School Enrollment in Oakdale
The most common levels of schooling among the 99 students in Oakdale are high school (61 | 61.6%), college / undergraduate (31 | 31.3%), and elementary school (3 | 3.0%).
| School Level | # Students | % Students |
| Nursery / Preschool | 2 | 2.0% |
| Kindergarten | 0 | 0.0% |
| Elementary School | 3 | 3.0% |
| Middle School | 2 | 2.0% |
| High School | 61 | 61.6% |
| College / Undergraduate | 31 | 31.3% |
| Graduate / Professional | 0 | 0.0% |
| Total | 99 | 100.0% |
School Enrollment by Age by Funding Source in Oakdale
Out of a total of 99 students who are enrolled in schools in Oakdale, 2 (2.0%) attend a private institution, while the remaining 97 (98.0%) are enrolled in public schools. The age group of 3 to 4 year olds has the highest likelihood of being enrolled in private schools, with 2 (100.0% in the age bracket) enrolled. Conversely, the age group of 5 to 9 year old has the lowest likelihood of being enrolled in a private school, with 3 (100.0% in the age bracket) attending a public institution.
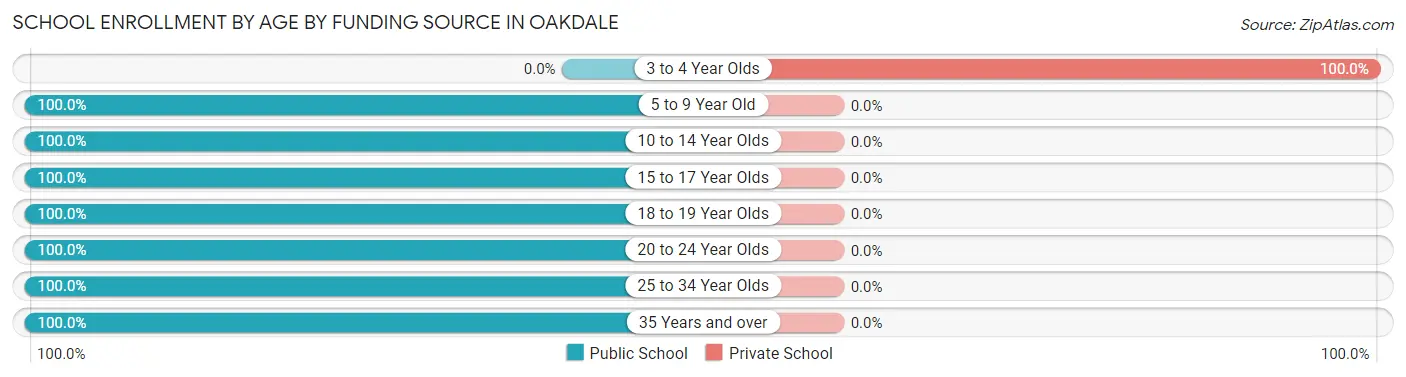
| Age Bracket | Public School | Private School |
| 3 to 4 Year Olds | 0 (0.0%) | 2 (100.0%) |
| 5 to 9 Year Old | 3 (100.0%) | 0 (0.0%) |
| 10 to 14 Year Olds | 2 (100.0%) | 0 (0.0%) |
| 15 to 17 Year Olds | 61 (100.0%) | 0 (0.0%) |
| 18 to 19 Year Olds | 14 (100.0%) | 0 (0.0%) |
| 20 to 24 Year Olds | 4 (100.0%) | 0 (0.0%) |
| 25 to 34 Year Olds | 1 (100.0%) | 0 (0.0%) |
| 35 Years and over | 12 (100.0%) | 0 (0.0%) |
| Total | 97 (98.0%) | 2 (2.0%) |
Educational Attainment by Field of Study in Oakdale
Engineering (8 | 28.6%), science & technology (7 | 25.0%), education (5 | 17.9%), computers & mathematics (3 | 10.7%), and business (2 | 7.1%) are the most common fields of study among 28 individuals in Oakdale who have obtained a bachelor's degree or higher.
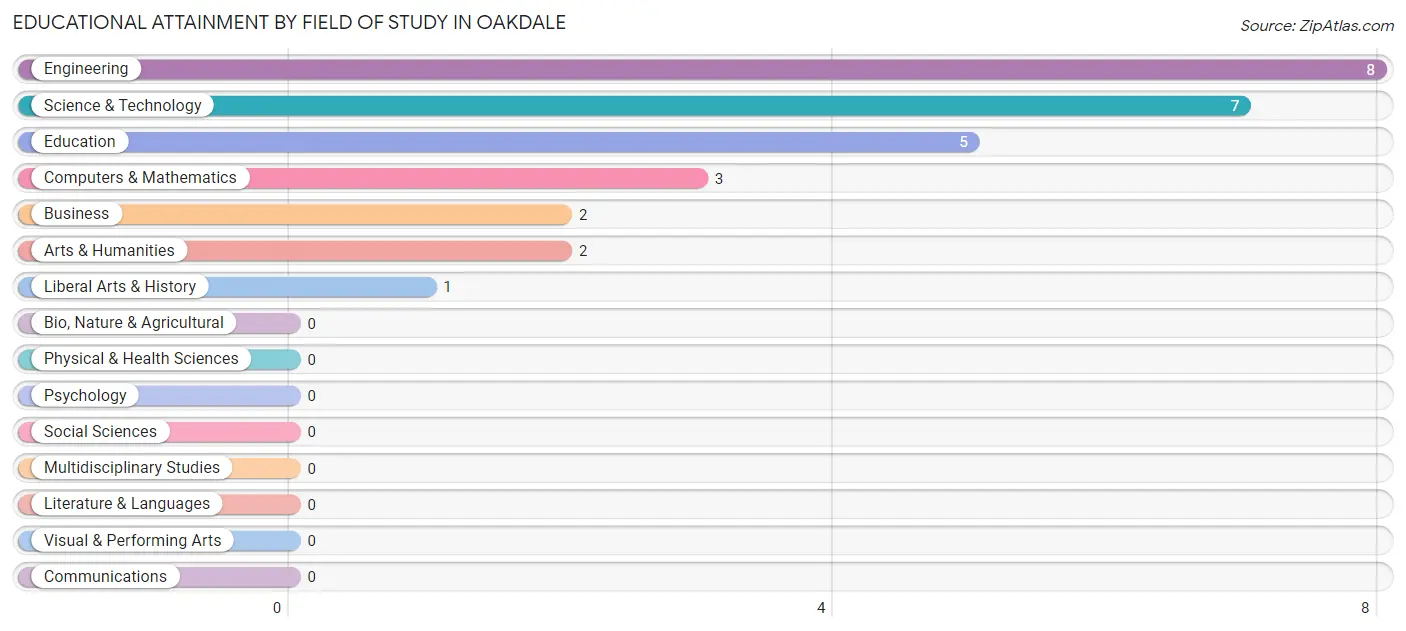
| Field of Study | # Graduates | % Graduates |
| Computers & Mathematics | 3 | 10.7% |
| Bio, Nature & Agricultural | 0 | 0.0% |
| Physical & Health Sciences | 0 | 0.0% |
| Psychology | 0 | 0.0% |
| Social Sciences | 0 | 0.0% |
| Engineering | 8 | 28.6% |
| Multidisciplinary Studies | 0 | 0.0% |
| Science & Technology | 7 | 25.0% |
| Business | 2 | 7.1% |
| Education | 5 | 17.9% |
| Literature & Languages | 0 | 0.0% |
| Liberal Arts & History | 1 | 3.6% |
| Visual & Performing Arts | 0 | 0.0% |
| Communications | 0 | 0.0% |
| Arts & Humanities | 2 | 7.1% |
| Total | 28 | 100.0% |
Transportation & Commute in Oakdale
Vehicle Availability by Sex in Oakdale
The most prevalent vehicle ownership categories in Oakdale are males with 3 vehicles (43, accounting for 51.8%) and females with 3 vehicles (37, making up 91.5%).
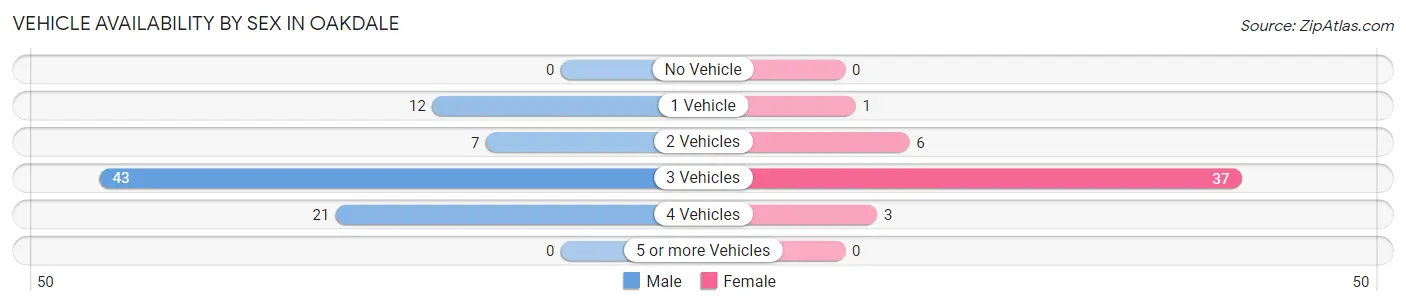
| Vehicles Available | Male | Female |
| No Vehicle | 0 (0.0%) | 0 (0.0%) |
| 1 Vehicle | 12 (14.5%) | 1 (2.1%) |
| 2 Vehicles | 7 (8.4%) | 6 (12.8%) |
| 3 Vehicles | 43 (51.8%) | 37 (78.7%) |
| 4 Vehicles | 21 (25.3%) | 3 (6.4%) |
| 5 or more Vehicles | 0 (0.0%) | 0 (0.0%) |
| Total | 83 (100.0%) | 47 (100.0%) |
Commute Time in Oakdale
The most frequently occuring commute durations in Oakdale are 90 or more minutes (32 commuters, 24.6%), 45 to 59 minutes (23 commuters, 17.7%), and 15 to 19 minutes (15 commuters, 11.5%).
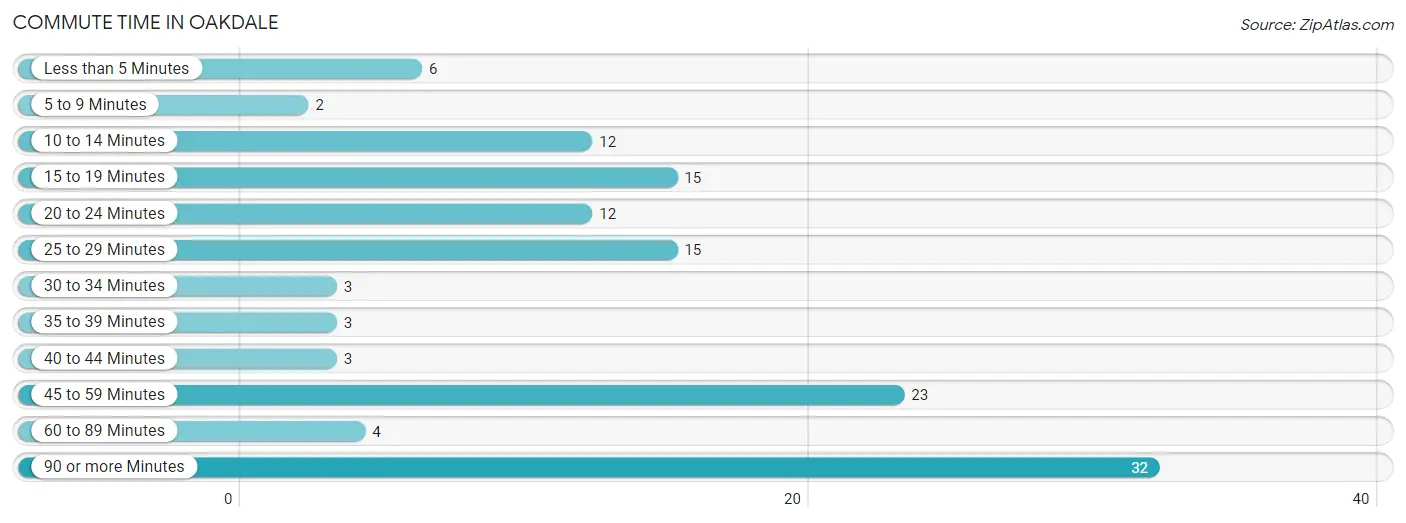
| Commute Time | # Commuters | % Commuters |
| Less than 5 Minutes | 6 | 4.6% |
| 5 to 9 Minutes | 2 | 1.5% |
| 10 to 14 Minutes | 12 | 9.2% |
| 15 to 19 Minutes | 15 | 11.5% |
| 20 to 24 Minutes | 12 | 9.2% |
| 25 to 29 Minutes | 15 | 11.5% |
| 30 to 34 Minutes | 3 | 2.3% |
| 35 to 39 Minutes | 3 | 2.3% |
| 40 to 44 Minutes | 3 | 2.3% |
| 45 to 59 Minutes | 23 | 17.7% |
| 60 to 89 Minutes | 4 | 3.1% |
| 90 or more Minutes | 32 | 24.6% |
Commute Time by Sex in Oakdale
The most common commute times in Oakdale are 90 or more minutes (24 commuters, 28.9%) for males and 25 to 29 minutes (13 commuters, 27.7%) for females.
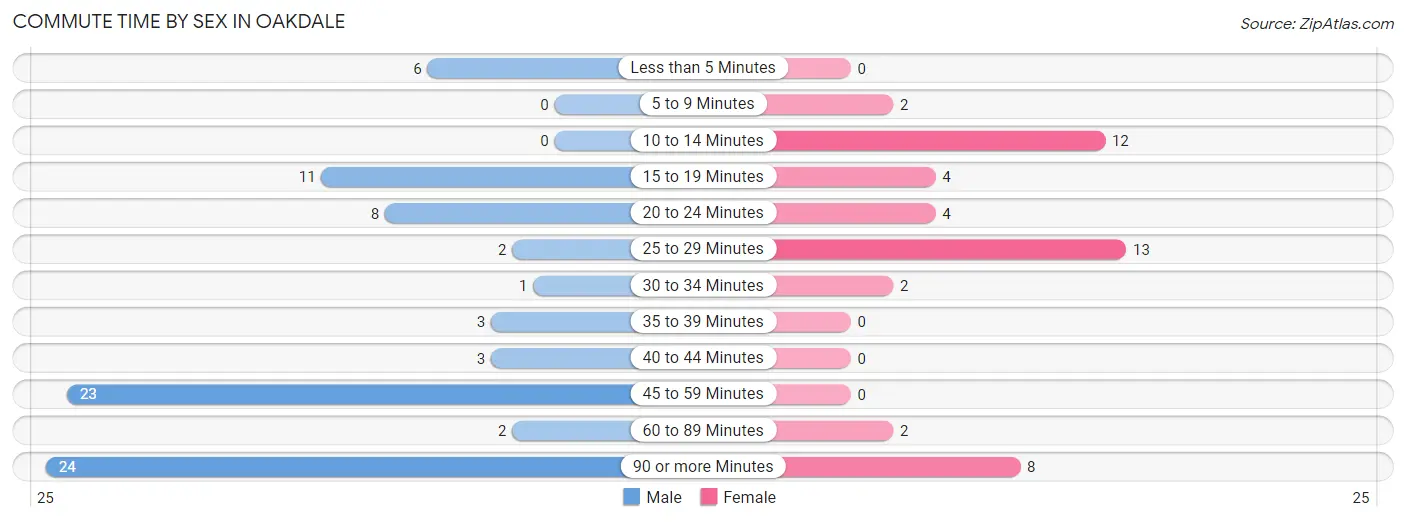
| Commute Time | Male | Female |
| Less than 5 Minutes | 6 (7.2%) | 0 (0.0%) |
| 5 to 9 Minutes | 0 (0.0%) | 2 (4.3%) |
| 10 to 14 Minutes | 0 (0.0%) | 12 (25.5%) |
| 15 to 19 Minutes | 11 (13.3%) | 4 (8.5%) |
| 20 to 24 Minutes | 8 (9.6%) | 4 (8.5%) |
| 25 to 29 Minutes | 2 (2.4%) | 13 (27.7%) |
| 30 to 34 Minutes | 1 (1.2%) | 2 (4.3%) |
| 35 to 39 Minutes | 3 (3.6%) | 0 (0.0%) |
| 40 to 44 Minutes | 3 (3.6%) | 0 (0.0%) |
| 45 to 59 Minutes | 23 (27.7%) | 0 (0.0%) |
| 60 to 89 Minutes | 2 (2.4%) | 2 (4.3%) |
| 90 or more Minutes | 24 (28.9%) | 8 (17.0%) |
Time of Departure to Work by Sex in Oakdale
The most frequent times of departure to work in Oakdale are 5:00 AM to 5:29 AM (28, 33.7%) for males and 9:00 AM to 9:59 AM (12, 25.5%) for females.
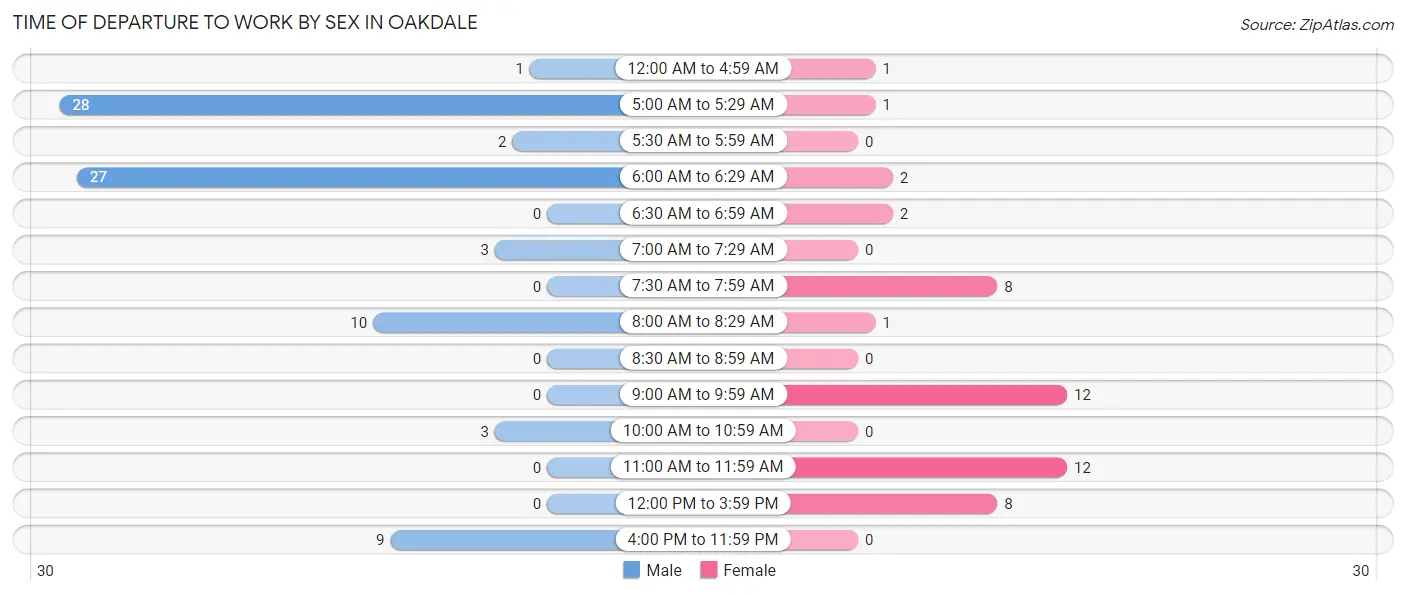
| Time of Departure | Male | Female |
| 12:00 AM to 4:59 AM | 1 (1.2%) | 1 (2.1%) |
| 5:00 AM to 5:29 AM | 28 (33.7%) | 1 (2.1%) |
| 5:30 AM to 5:59 AM | 2 (2.4%) | 0 (0.0%) |
| 6:00 AM to 6:29 AM | 27 (32.5%) | 2 (4.3%) |
| 6:30 AM to 6:59 AM | 0 (0.0%) | 2 (4.3%) |
| 7:00 AM to 7:29 AM | 3 (3.6%) | 0 (0.0%) |
| 7:30 AM to 7:59 AM | 0 (0.0%) | 8 (17.0%) |
| 8:00 AM to 8:29 AM | 10 (12.0%) | 1 (2.1%) |
| 8:30 AM to 8:59 AM | 0 (0.0%) | 0 (0.0%) |
| 9:00 AM to 9:59 AM | 0 (0.0%) | 12 (25.5%) |
| 10:00 AM to 10:59 AM | 3 (3.6%) | 0 (0.0%) |
| 11:00 AM to 11:59 AM | 0 (0.0%) | 12 (25.5%) |
| 12:00 PM to 3:59 PM | 0 (0.0%) | 8 (17.0%) |
| 4:00 PM to 11:59 PM | 9 (10.8%) | 0 (0.0%) |
| Total | 83 (100.0%) | 47 (100.0%) |
Housing Occupancy in Oakdale
Occupancy by Ownership in Oakdale
Of the total 104 dwellings in Oakdale, owner-occupied units account for 96 (92.3%), while renter-occupied units make up 8 (7.7%).
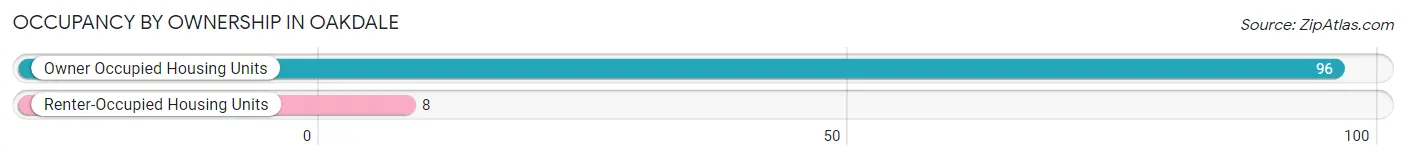
| Occupancy | # Housing Units | % Housing Units |
| Owner Occupied Housing Units | 96 | 92.3% |
| Renter-Occupied Housing Units | 8 | 7.7% |
| Total Occupied Housing Units | 104 | 100.0% |
Occupancy by Household Size in Oakdale
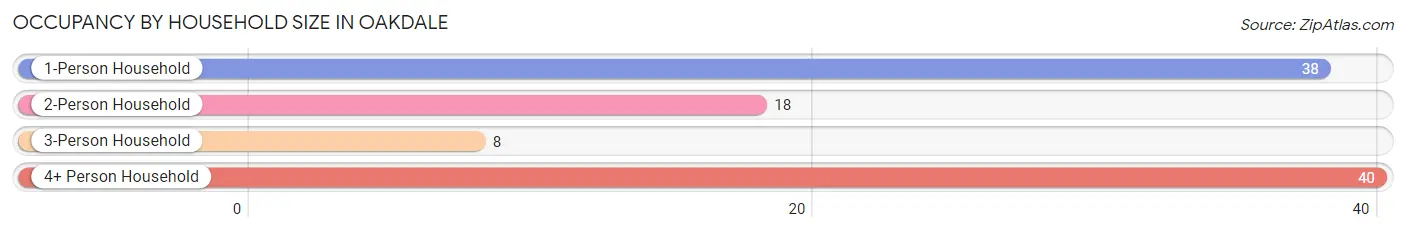
| Household Size | # Housing Units | % Housing Units |
| 1-Person Household | 38 | 36.5% |
| 2-Person Household | 18 | 17.3% |
| 3-Person Household | 8 | 7.7% |
| 4+ Person Household | 40 | 38.5% |
| Total Housing Units | 104 | 100.0% |
Occupancy by Ownership by Household Size in Oakdale
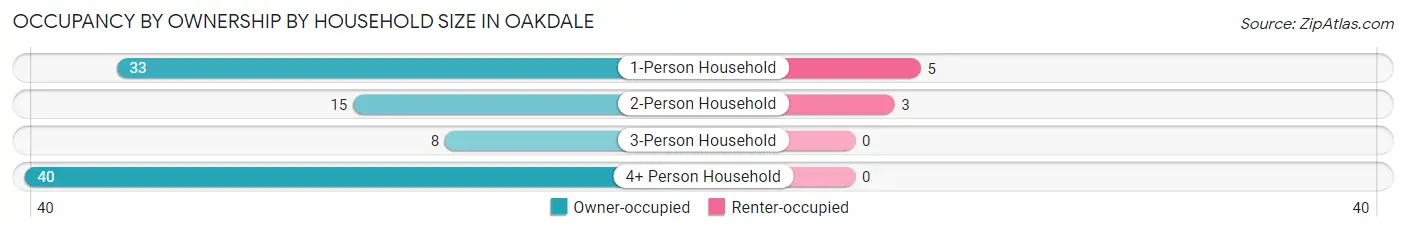
| Household Size | Owner-occupied | Renter-occupied |
| 1-Person Household | 33 (86.8%) | 5 (13.2%) |
| 2-Person Household | 15 (83.3%) | 3 (16.7%) |
| 3-Person Household | 8 (100.0%) | 0 (0.0%) |
| 4+ Person Household | 40 (100.0%) | 0 (0.0%) |
| Total Housing Units | 96 (92.3%) | 8 (7.7%) |
Occupancy by Educational Attainment in Oakdale
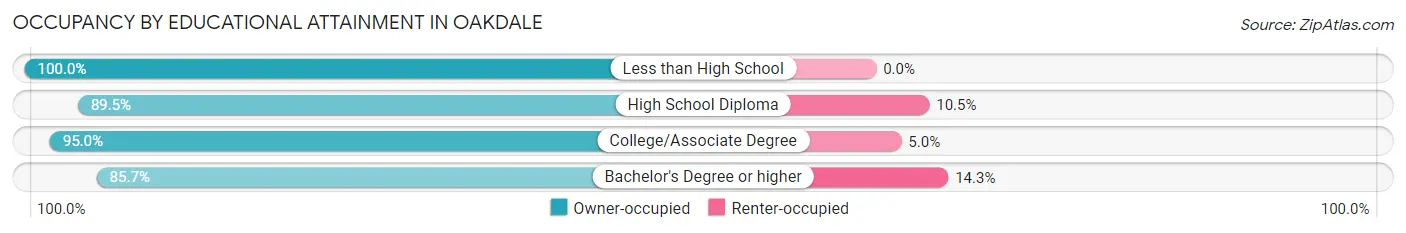
| Household Size | Owner-occupied | Renter-occupied |
| Less than High School | 4 (100.0%) | 0 (0.0%) |
| High School Diploma | 17 (89.5%) | 2 (10.5%) |
| College/Associate Degree | 57 (95.0%) | 3 (5.0%) |
| Bachelor's Degree or higher | 18 (85.7%) | 3 (14.3%) |
Occupancy by Age of Householder in Oakdale
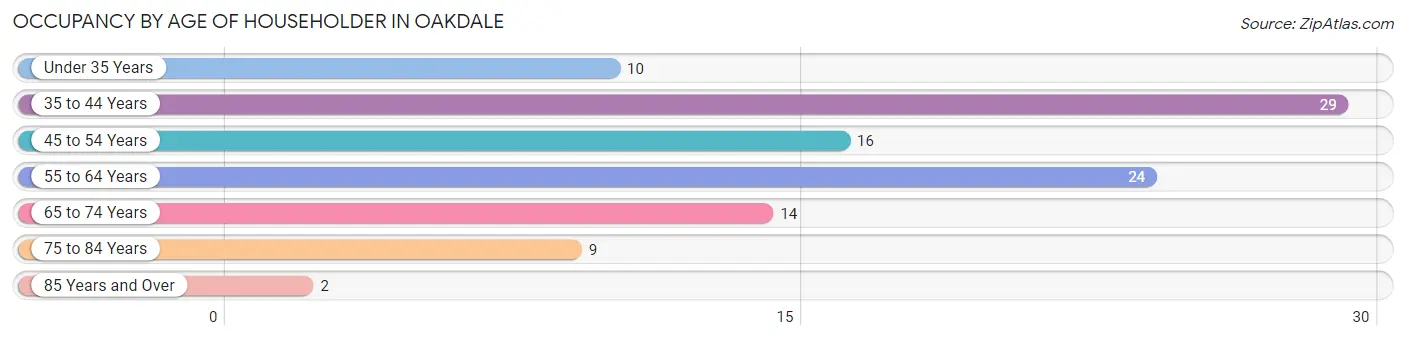
| Age Bracket | # Households | % Households |
| Under 35 Years | 10 | 9.6% |
| 35 to 44 Years | 29 | 27.9% |
| 45 to 54 Years | 16 | 15.4% |
| 55 to 64 Years | 24 | 23.1% |
| 65 to 74 Years | 14 | 13.5% |
| 75 to 84 Years | 9 | 8.6% |
| 85 Years and Over | 2 | 1.9% |
| Total | 104 | 100.0% |
Housing Finances in Oakdale
Median Income by Occupancy in Oakdale
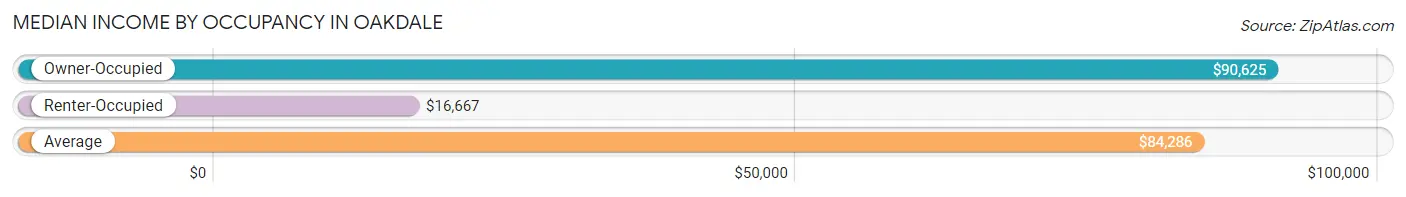
| Occupancy Type | # Households | Median Income |
| Owner-Occupied | 96 (92.3%) | $90,625 |
| Renter-Occupied | 8 (7.7%) | $16,667 |
| Average | 104 (100.0%) | $84,286 |
Occupancy by Householder Income Bracket in Oakdale
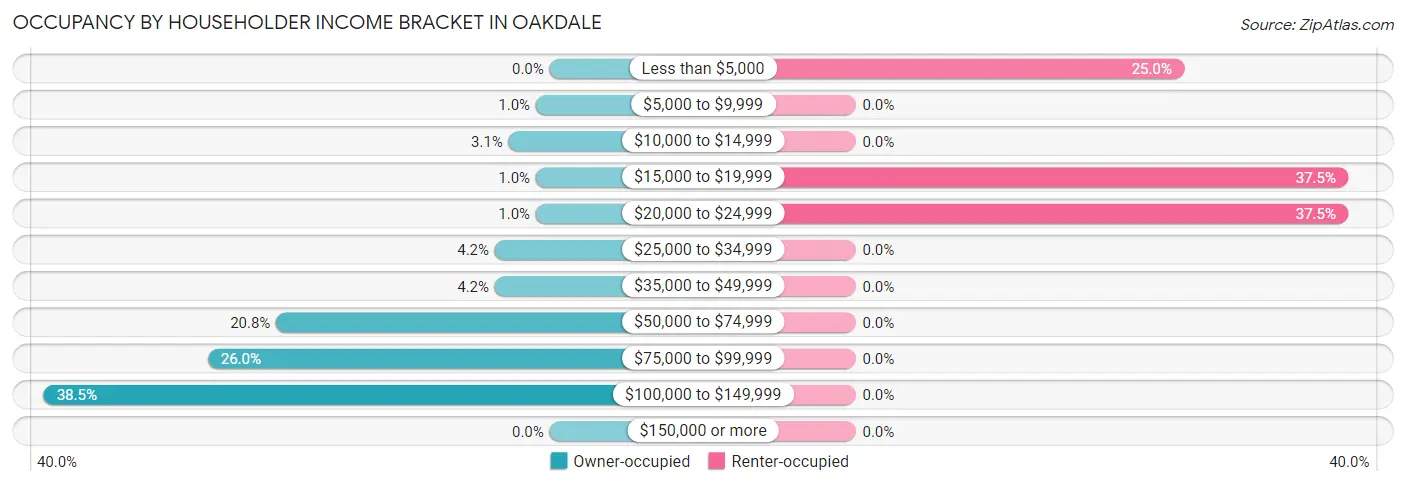
| Income Bracket | Owner-occupied | Renter-occupied |
| Less than $5,000 | 0 (0.0%) | 2 (25.0%) |
| $5,000 to $9,999 | 1 (1.0%) | 0 (0.0%) |
| $10,000 to $14,999 | 3 (3.1%) | 0 (0.0%) |
| $15,000 to $19,999 | 1 (1.0%) | 3 (37.5%) |
| $20,000 to $24,999 | 1 (1.0%) | 3 (37.5%) |
| $25,000 to $34,999 | 4 (4.2%) | 0 (0.0%) |
| $35,000 to $49,999 | 4 (4.2%) | 0 (0.0%) |
| $50,000 to $74,999 | 20 (20.8%) | 0 (0.0%) |
| $75,000 to $99,999 | 25 (26.0%) | 0 (0.0%) |
| $100,000 to $149,999 | 37 (38.5%) | 0 (0.0%) |
| $150,000 or more | 0 (0.0%) | 0 (0.0%) |
| Total | 96 (100.0%) | 8 (100.0%) |
Monthly Housing Cost Tiers in Oakdale
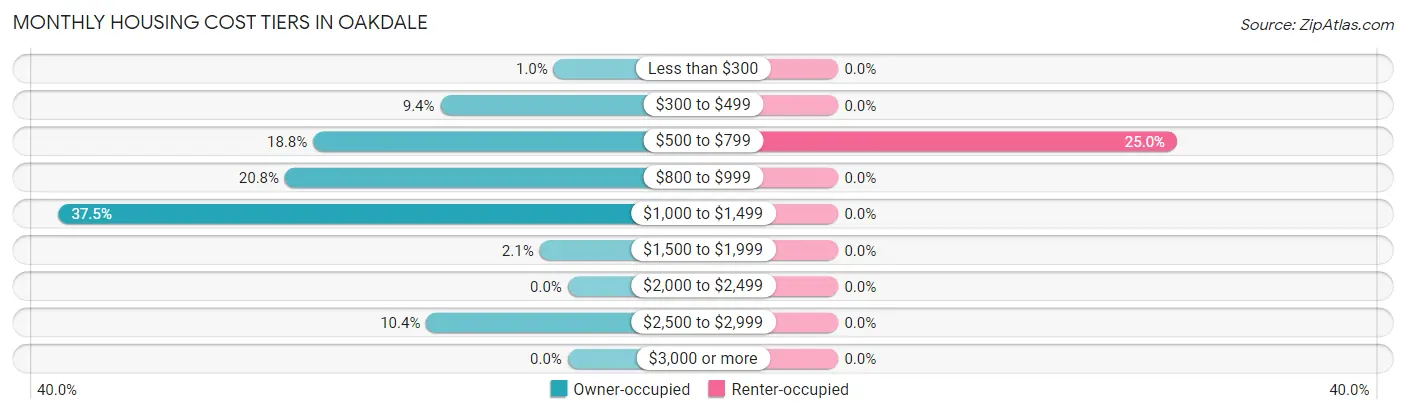
| Monthly Cost | Owner-occupied | Renter-occupied |
| Less than $300 | 1 (1.0%) | 0 (0.0%) |
| $300 to $499 | 9 (9.4%) | 0 (0.0%) |
| $500 to $799 | 18 (18.8%) | 2 (25.0%) |
| $800 to $999 | 20 (20.8%) | 0 (0.0%) |
| $1,000 to $1,499 | 36 (37.5%) | 0 (0.0%) |
| $1,500 to $1,999 | 2 (2.1%) | 0 (0.0%) |
| $2,000 to $2,499 | 0 (0.0%) | 0 (0.0%) |
| $2,500 to $2,999 | 10 (10.4%) | 0 (0.0%) |
| $3,000 or more | 0 (0.0%) | 0 (0.0%) |
| Total | 96 (100.0%) | 8 (100.0%) |
Physical Housing Characteristics in Oakdale
Housing Structures in Oakdale
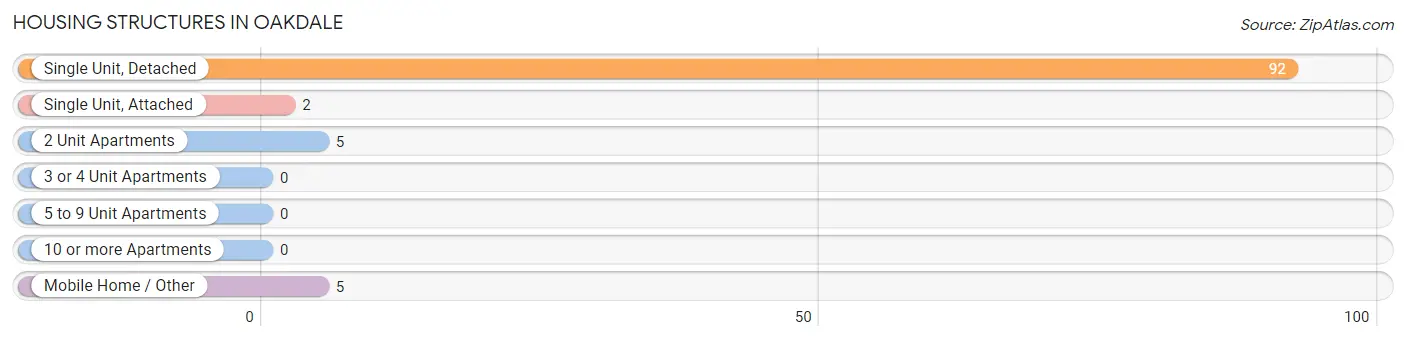
| Structure Type | # Housing Units | % Housing Units |
| Single Unit, Detached | 92 | 88.5% |
| Single Unit, Attached | 2 | 1.9% |
| 2 Unit Apartments | 5 | 4.8% |
| 3 or 4 Unit Apartments | 0 | 0.0% |
| 5 to 9 Unit Apartments | 0 | 0.0% |
| 10 or more Apartments | 0 | 0.0% |
| Mobile Home / Other | 5 | 4.8% |
| Total | 104 | 100.0% |
Housing Structures by Occupancy in Oakdale
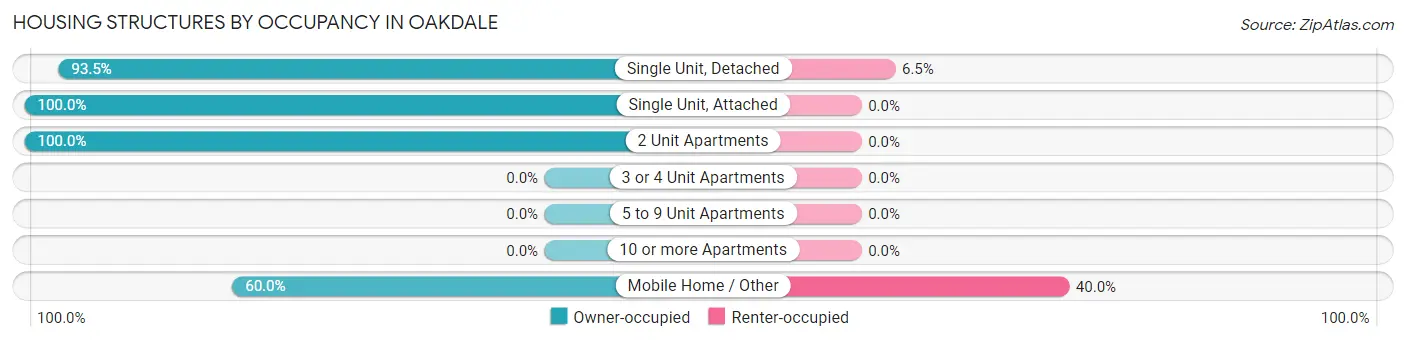
| Structure Type | Owner-occupied | Renter-occupied |
| Single Unit, Detached | 86 (93.5%) | 6 (6.5%) |
| Single Unit, Attached | 2 (100.0%) | 0 (0.0%) |
| 2 Unit Apartments | 5 (100.0%) | 0 (0.0%) |
| 3 or 4 Unit Apartments | 0 (0.0%) | 0 (0.0%) |
| 5 to 9 Unit Apartments | 0 (0.0%) | 0 (0.0%) |
| 10 or more Apartments | 0 (0.0%) | 0 (0.0%) |
| Mobile Home / Other | 3 (60.0%) | 2 (40.0%) |
| Total | 96 (92.3%) | 8 (7.7%) |
Housing Structures by Number of Rooms in Oakdale
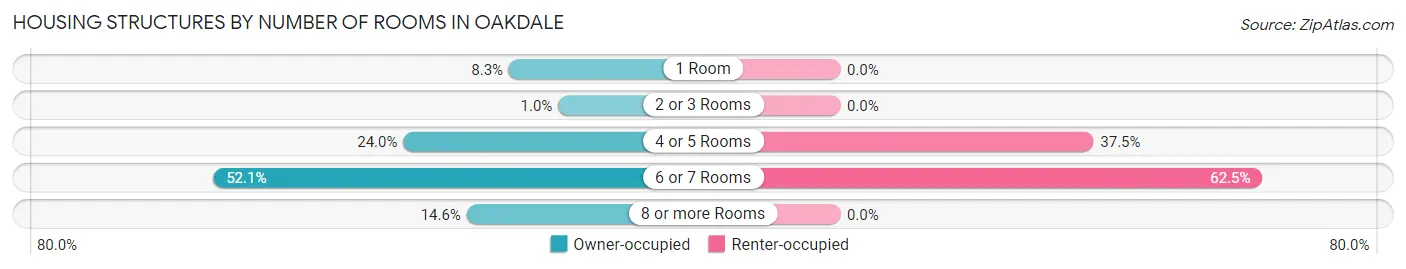
| Number of Rooms | Owner-occupied | Renter-occupied |
| 1 Room | 8 (8.3%) | 0 (0.0%) |
| 2 or 3 Rooms | 1 (1.0%) | 0 (0.0%) |
| 4 or 5 Rooms | 23 (24.0%) | 3 (37.5%) |
| 6 or 7 Rooms | 50 (52.1%) | 5 (62.5%) |
| 8 or more Rooms | 14 (14.6%) | 0 (0.0%) |
| Total | 96 (100.0%) | 8 (100.0%) |
Housing Structure by Heating Type in Oakdale
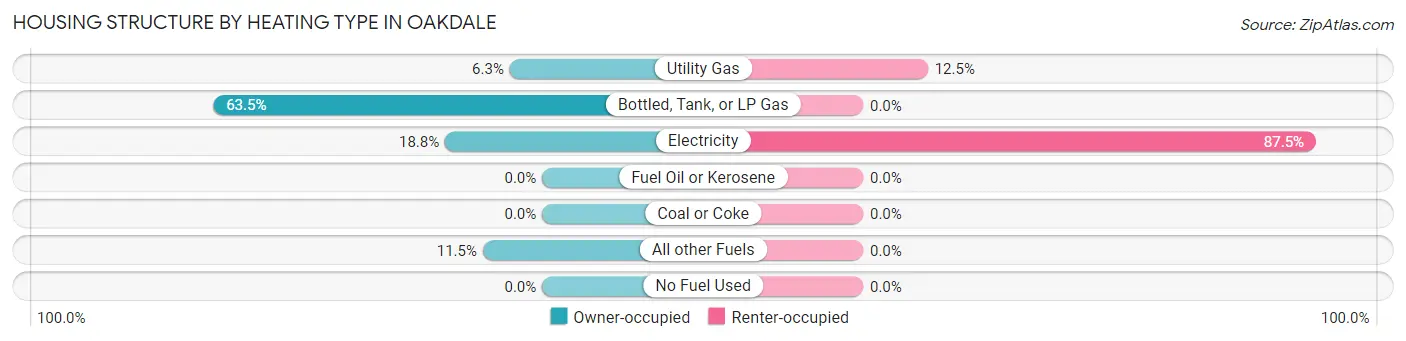
| Heating Type | Owner-occupied | Renter-occupied |
| Utility Gas | 6 (6.2%) | 1 (12.5%) |
| Bottled, Tank, or LP Gas | 61 (63.5%) | 0 (0.0%) |
| Electricity | 18 (18.8%) | 7 (87.5%) |
| Fuel Oil or Kerosene | 0 (0.0%) | 0 (0.0%) |
| Coal or Coke | 0 (0.0%) | 0 (0.0%) |
| All other Fuels | 11 (11.5%) | 0 (0.0%) |
| No Fuel Used | 0 (0.0%) | 0 (0.0%) |
| Total | 96 (100.0%) | 8 (100.0%) |
Household Vehicle Usage in Oakdale
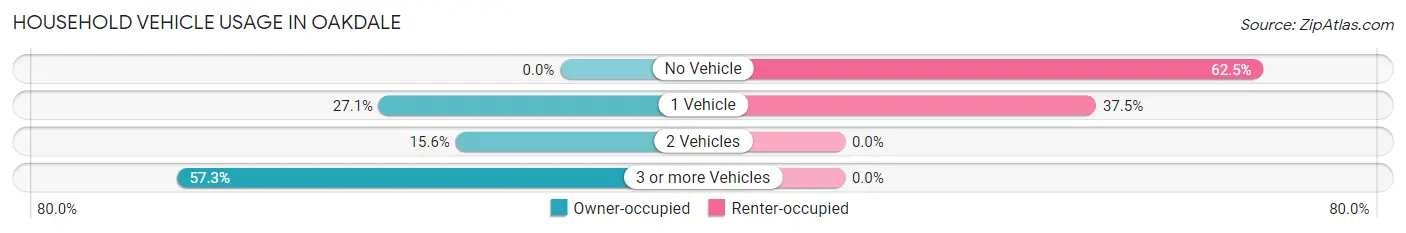
| Vehicles per Household | Owner-occupied | Renter-occupied |
| No Vehicle | 0 (0.0%) | 5 (62.5%) |
| 1 Vehicle | 26 (27.1%) | 3 (37.5%) |
| 2 Vehicles | 15 (15.6%) | 0 (0.0%) |
| 3 or more Vehicles | 55 (57.3%) | 0 (0.0%) |
| Total | 96 (100.0%) | 8 (100.0%) |
Real Estate & Mortgages in Oakdale
Real Estate and Mortgage Overview in Oakdale
| Characteristic | Without Mortgage | With Mortgage |
| Housing Units | 38 | 58 |
| Median Property Value | $116,700 | $89,300 |
| Median Household Income | $79,375 | $0 |
| Monthly Housing Costs | $717 | $0 |
| Real Estate Taxes | $4,000 | $0 |
Property Value by Mortgage Status in Oakdale
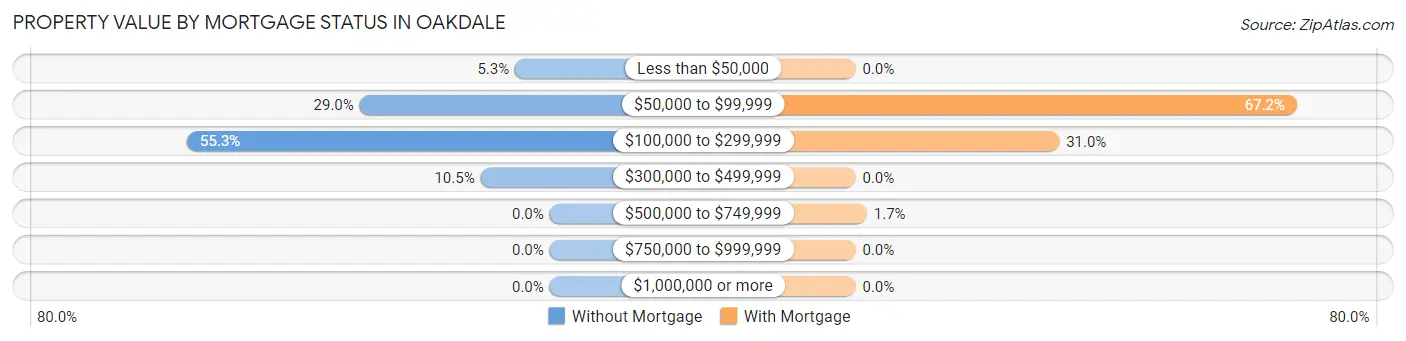
| Property Value | Without Mortgage | With Mortgage |
| Less than $50,000 | 2 (5.3%) | 0 (0.0%) |
| $50,000 to $99,999 | 11 (28.9%) | 39 (67.2%) |
| $100,000 to $299,999 | 21 (55.3%) | 18 (31.0%) |
| $300,000 to $499,999 | 4 (10.5%) | 0 (0.0%) |
| $500,000 to $749,999 | 0 (0.0%) | 1 (1.7%) |
| $750,000 to $999,999 | 0 (0.0%) | 0 (0.0%) |
| $1,000,000 or more | 0 (0.0%) | 0 (0.0%) |
| Total | 38 (100.0%) | 58 (100.0%) |
Household Income by Mortgage Status in Oakdale
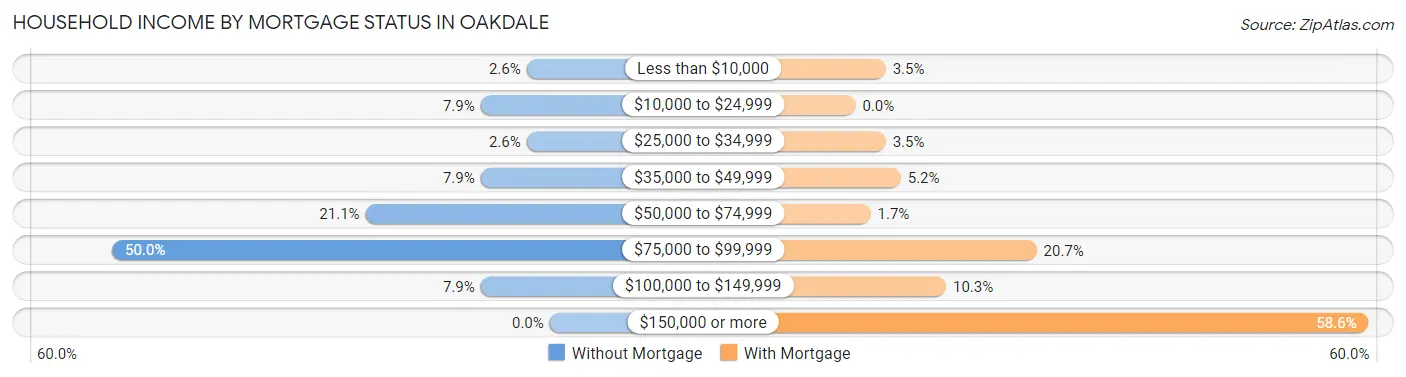
| Household Income | Without Mortgage | With Mortgage |
| Less than $10,000 | 1 (2.6%) | 2 (3.5%) |
| $10,000 to $24,999 | 3 (7.9%) | 0 (0.0%) |
| $25,000 to $34,999 | 1 (2.6%) | 2 (3.5%) |
| $35,000 to $49,999 | 3 (7.9%) | 3 (5.2%) |
| $50,000 to $74,999 | 8 (21.0%) | 1 (1.7%) |
| $75,000 to $99,999 | 19 (50.0%) | 12 (20.7%) |
| $100,000 to $149,999 | 3 (7.9%) | 6 (10.3%) |
| $150,000 or more | 0 (0.0%) | 34 (58.6%) |
| Total | 38 (100.0%) | 58 (100.0%) |
Property Value to Household Income Ratio in Oakdale
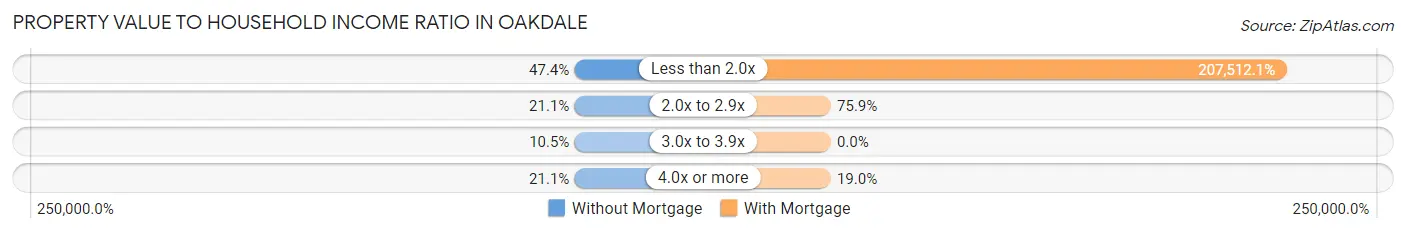
| Value-to-Income Ratio | Without Mortgage | With Mortgage |
| Less than 2.0x | 18 (47.4%) | 120,357 (207,512.1%) |
| 2.0x to 2.9x | 8 (21.0%) | 44 (75.9%) |
| 3.0x to 3.9x | 4 (10.5%) | 0 (0.0%) |
| 4.0x or more | 8 (21.0%) | 11 (19.0%) |
| Total | 38 (100.0%) | 58 (100.0%) |
Real Estate Taxes by Mortgage Status in Oakdale
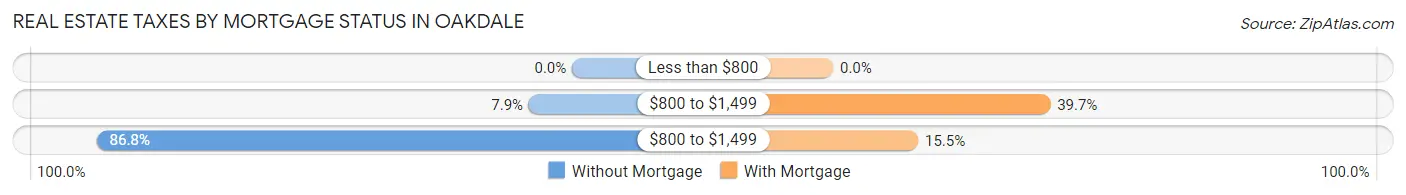
| Property Taxes | Without Mortgage | With Mortgage |
| Less than $800 | 0 (0.0%) | 0 (0.0%) |
| $800 to $1,499 | 3 (7.9%) | 23 (39.7%) |
| $800 to $1,499 | 33 (86.8%) | 9 (15.5%) |
| Total | 38 (100.0%) | 58 (100.0%) |
Health & Disability in Oakdale
Health Insurance Coverage by Age in Oakdale
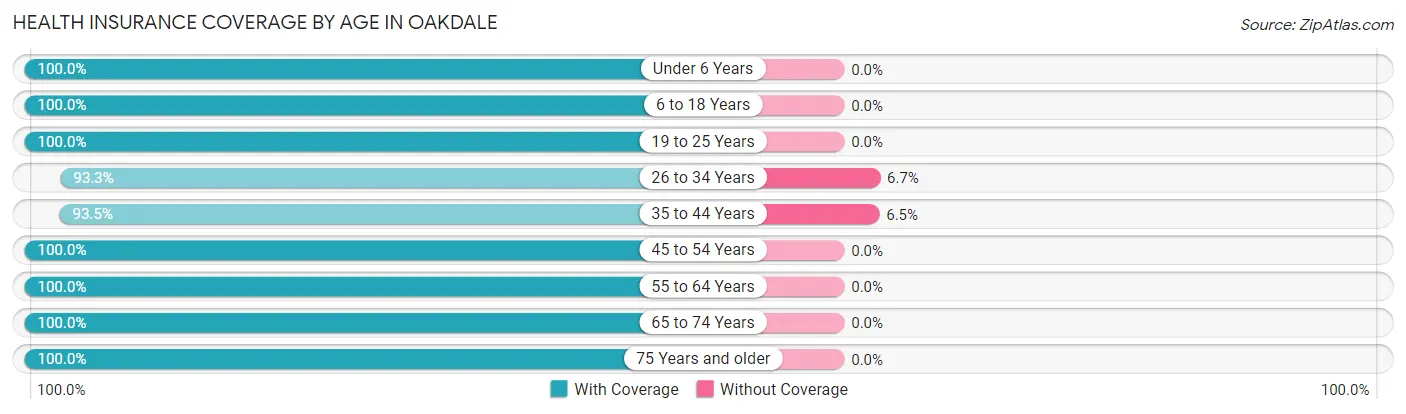
| Age Bracket | With Coverage | Without Coverage |
| Under 6 Years | 8 (100.0%) | 0 (0.0%) |
| 6 to 18 Years | 68 (100.0%) | 0 (0.0%) |
| 19 to 25 Years | 54 (100.0%) | 0 (0.0%) |
| 26 to 34 Years | 14 (93.3%) | 1 (6.7%) |
| 35 to 44 Years | 43 (93.5%) | 3 (6.5%) |
| 45 to 54 Years | 25 (100.0%) | 0 (0.0%) |
| 55 to 64 Years | 48 (100.0%) | 0 (0.0%) |
| 65 to 74 Years | 16 (100.0%) | 0 (0.0%) |
| 75 Years and older | 15 (100.0%) | 0 (0.0%) |
| Total | 291 (98.6%) | 4 (1.4%) |
Health Insurance Coverage by Citizenship Status in Oakdale
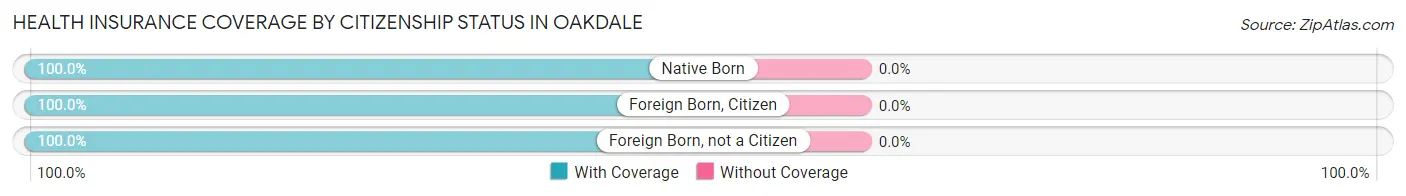
| Citizenship Status | With Coverage | Without Coverage |
| Native Born | 8 (100.0%) | 0 (0.0%) |
| Foreign Born, Citizen | 68 (100.0%) | 0 (0.0%) |
| Foreign Born, not a Citizen | 54 (100.0%) | 0 (0.0%) |
Health Insurance Coverage by Household Income in Oakdale
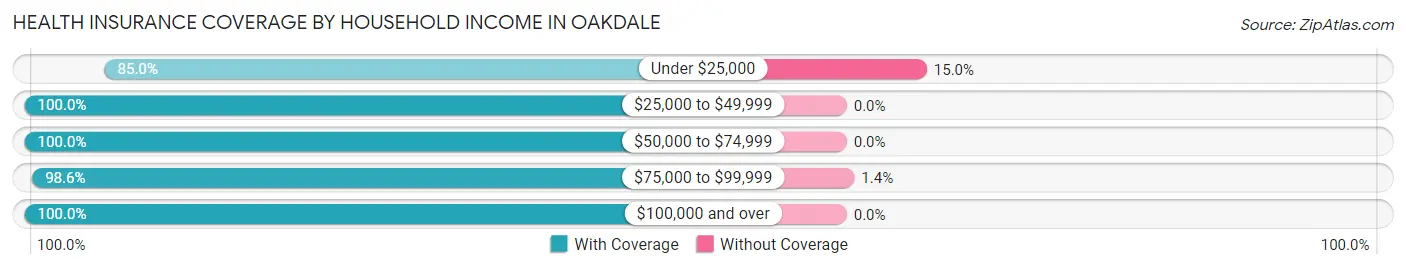
| Household Income | With Coverage | Without Coverage |
| Under $25,000 | 17 (85.0%) | 3 (15.0%) |
| $25,000 to $49,999 | 9 (100.0%) | 0 (0.0%) |
| $50,000 to $74,999 | 35 (100.0%) | 0 (0.0%) |
| $75,000 to $99,999 | 69 (98.6%) | 1 (1.4%) |
| $100,000 and over | 161 (100.0%) | 0 (0.0%) |
Public vs Private Health Insurance Coverage by Age in Oakdale
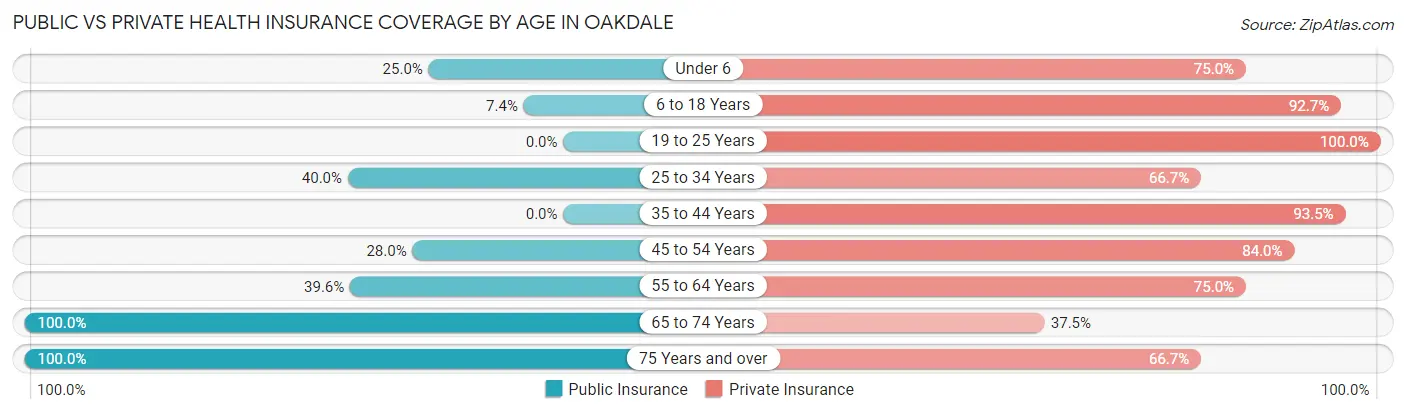
| Age Bracket | Public Insurance | Private Insurance |
| Under 6 | 2 (25.0%) | 6 (75.0%) |
| 6 to 18 Years | 5 (7.3%) | 63 (92.6%) |
| 19 to 25 Years | 0 (0.0%) | 54 (100.0%) |
| 25 to 34 Years | 6 (40.0%) | 10 (66.7%) |
| 35 to 44 Years | 0 (0.0%) | 43 (93.5%) |
| 45 to 54 Years | 7 (28.0%) | 21 (84.0%) |
| 55 to 64 Years | 19 (39.6%) | 36 (75.0%) |
| 65 to 74 Years | 16 (100.0%) | 6 (37.5%) |
| 75 Years and over | 15 (100.0%) | 10 (66.7%) |
| Total | 70 (23.7%) | 249 (84.4%) |
Disability Status by Sex by Age in Oakdale
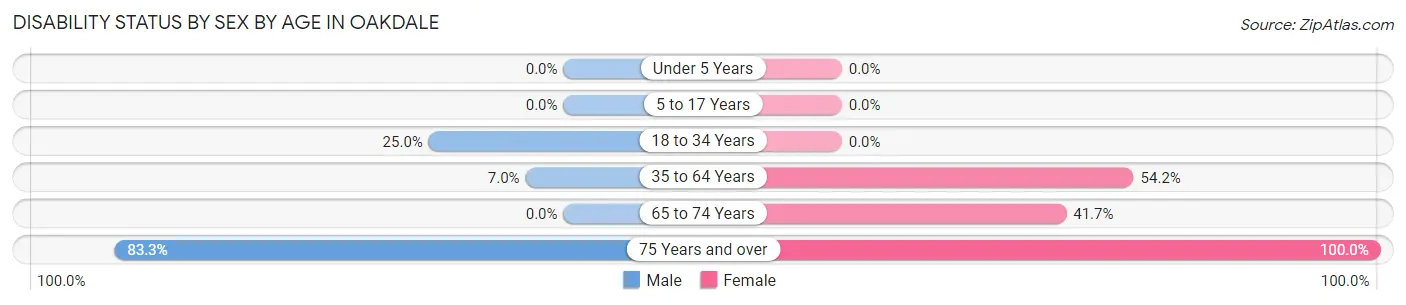
| Age Bracket | Male | Female |
| Under 5 Years | 0 (0.0%) | 0 (0.0%) |
| 5 to 17 Years | 0 (0.0%) | 0 (0.0%) |
| 18 to 34 Years | 8 (25.0%) | 0 (0.0%) |
| 35 to 64 Years | 5 (7.0%) | 26 (54.2%) |
| 65 to 74 Years | 0 (0.0%) | 5 (41.7%) |
| 75 Years and over | 10 (83.3%) | 3 (100.0%) |
Disability Class by Sex by Age in Oakdale
Disability Class: Hearing Difficulty
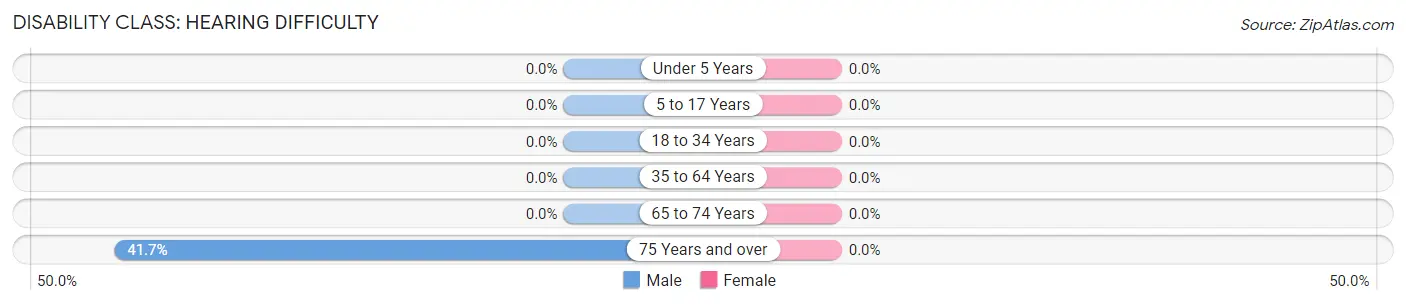
| Age Bracket | Male | Female |
| Under 5 Years | 0 (0.0%) | 0 (0.0%) |
| 5 to 17 Years | 0 (0.0%) | 0 (0.0%) |
| 18 to 34 Years | 0 (0.0%) | 0 (0.0%) |
| 35 to 64 Years | 0 (0.0%) | 0 (0.0%) |
| 65 to 74 Years | 0 (0.0%) | 0 (0.0%) |
| 75 Years and over | 5 (41.7%) | 0 (0.0%) |
Disability Class: Vision Difficulty
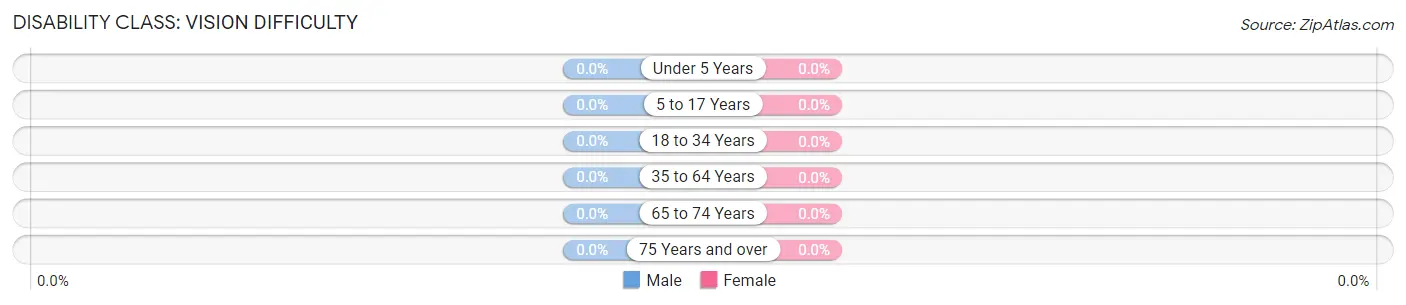
| Age Bracket | Male | Female |
| Under 5 Years | 0 (0.0%) | 0 (0.0%) |
| 5 to 17 Years | 0 (0.0%) | 0 (0.0%) |
| 18 to 34 Years | 0 (0.0%) | 0 (0.0%) |
| 35 to 64 Years | 0 (0.0%) | 0 (0.0%) |
| 65 to 74 Years | 0 (0.0%) | 0 (0.0%) |
| 75 Years and over | 0 (0.0%) | 0 (0.0%) |
Disability Class: Cognitive Difficulty
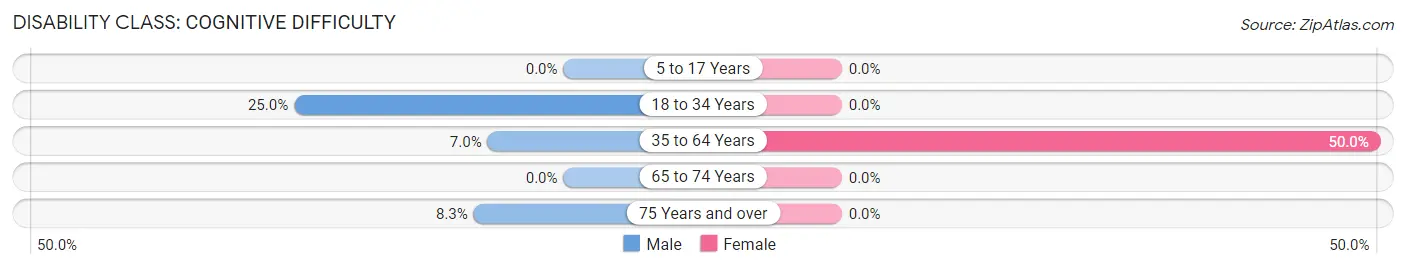
| Age Bracket | Male | Female |
| 5 to 17 Years | 0 (0.0%) | 0 (0.0%) |
| 18 to 34 Years | 8 (25.0%) | 0 (0.0%) |
| 35 to 64 Years | 5 (7.0%) | 24 (50.0%) |
| 65 to 74 Years | 0 (0.0%) | 0 (0.0%) |
| 75 Years and over | 1 (8.3%) | 0 (0.0%) |
Disability Class: Ambulatory Difficulty
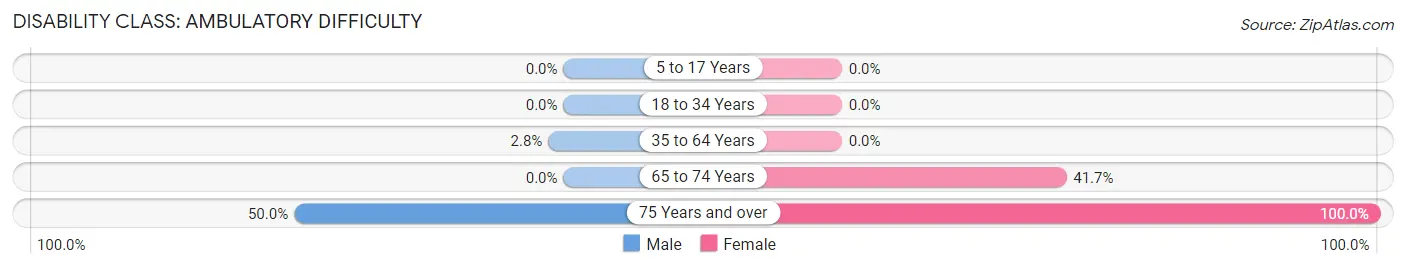
| Age Bracket | Male | Female |
| 5 to 17 Years | 0 (0.0%) | 0 (0.0%) |
| 18 to 34 Years | 0 (0.0%) | 0 (0.0%) |
| 35 to 64 Years | 2 (2.8%) | 0 (0.0%) |
| 65 to 74 Years | 0 (0.0%) | 5 (41.7%) |
| 75 Years and over | 6 (50.0%) | 3 (100.0%) |
Disability Class: Self-Care Difficulty
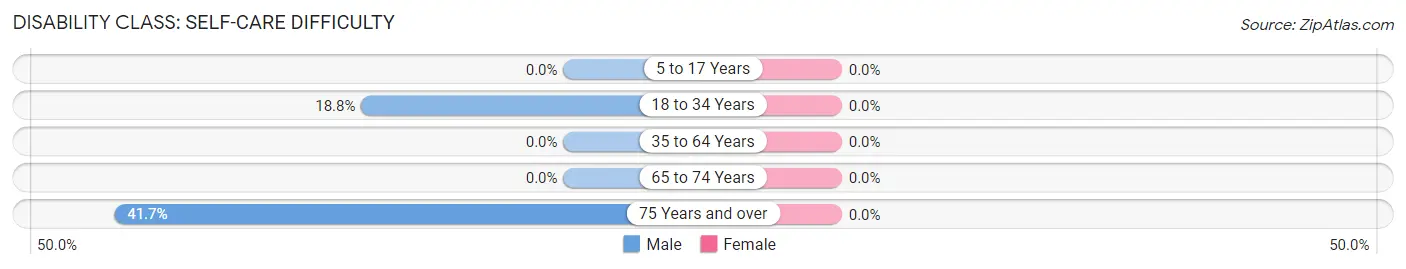
| Age Bracket | Male | Female |
| 5 to 17 Years | 0 (0.0%) | 0 (0.0%) |
| 18 to 34 Years | 6 (18.8%) | 0 (0.0%) |
| 35 to 64 Years | 0 (0.0%) | 0 (0.0%) |
| 65 to 74 Years | 0 (0.0%) | 0 (0.0%) |
| 75 Years and over | 5 (41.7%) | 0 (0.0%) |
Technology Access in Oakdale
Computing Device Access in Oakdale
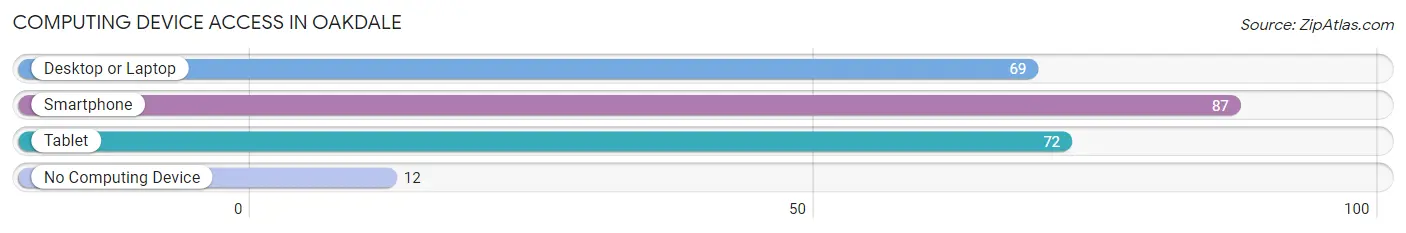
| Device Type | # Households | % Households |
| Desktop or Laptop | 69 | 66.3% |
| Smartphone | 87 | 83.7% |
| Tablet | 72 | 69.2% |
| No Computing Device | 12 | 11.5% |
| Total | 104 | 100.0% |
Internet Access in Oakdale
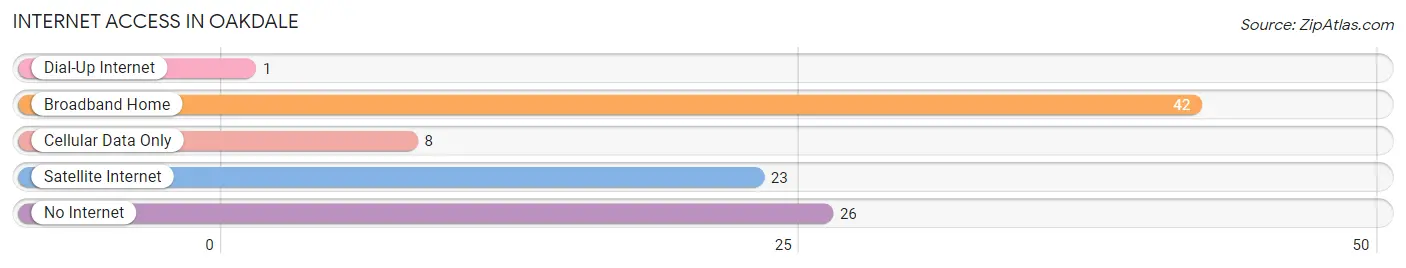
| Internet Type | # Households | % Households |
| Dial-Up Internet | 1 | 1.0% |
| Broadband Home | 42 | 40.4% |
| Cellular Data Only | 8 | 7.7% |
| Satellite Internet | 23 | 22.1% |
| No Internet | 26 | 25.0% |
| Total | 104 | 100.0% |
Oakdale Summary
Oakdale, Illinois is a small village located in Madison County, Illinois. It is situated on the banks of the Mississippi River, just south of the city of Alton. The village has a population of just over 1,000 people and is part of the Greater St. Louis metropolitan area.
History
Oakdale was first settled in 1818 by a group of settlers from Kentucky. The village was originally known as “Oak Grove” and was later changed to “Oakdale” in 1836. The village was incorporated in 1872 and has remained a small, rural community ever since.
The village was home to a number of industries in the late 19th and early 20th centuries, including a brickyard, a sawmill, a flour mill, and a canning factory. The village also had a number of stores and businesses, including a hotel, a bank, a post office, and a blacksmith shop.
Geography
Oakdale is located in Madison County, Illinois, on the banks of the Mississippi River. The village is situated on the western edge of the American Bottom, a large floodplain that stretches from the Mississippi River to the Illinois River. The village is located approximately 10 miles south of the city of Alton and is part of the Greater St. Louis metropolitan area.
The village is situated on a bluff overlooking the Mississippi River and is surrounded by rolling hills and farmland. The village is located in a temperate climate, with hot, humid summers and cold, wet winters.
Economy
Oakdale’s economy is largely based on agriculture and tourism. The village is home to a number of farms, including dairy farms, beef farms, and vegetable farms. The village also has a number of small businesses, including restaurants, stores, and a gas station.
The village is also home to a number of tourist attractions, including the historic Cahokia Mounds State Historic Site, the Lewis and Clark State Historic Site, and the National Great Rivers Museum. The village is also home to a number of wineries and vineyards, as well as a number of golf courses.
Demographics
As of the 2010 census, the population of Oakdale was 1,072. The village is predominantly white, with a small African American population. The median household income in the village is $45,000, and the median home value is $125,000. The village has a low unemployment rate and a high rate of homeownership.
Conclusion
Oakdale, Illinois is a small village located in Madison County, Illinois. It is situated on the banks of the Mississippi River, just south of the city of Alton. The village has a population of just over 1,000 people and is part of the Greater St. Louis metropolitan area. The village is home to a number of farms, businesses, and tourist attractions, and has a predominantly white population with a median household income of $45,000 and a median home value of $125,000.
Common Questions
What is Per Capita Income in Oakdale?
Per Capita income in Oakdale is $31,052.
What is the Median Family Income in Oakdale?
Median Family Income in Oakdale is $120,119.
What is the Median Household income in Oakdale?
Median Household Income in Oakdale is $84,286.
What is Inequality or Gini Index in Oakdale?
Inequality or Gini Index in Oakdale is 0.27.
What is the Total Population of Oakdale?
Total Population of Oakdale is 295.
What is the Total Male Population of Oakdale?
Total Male Population of Oakdale is 132.
What is the Total Female Population of Oakdale?
Total Female Population of Oakdale is 163.
What is the Ratio of Males per 100 Females in Oakdale?
There are 80.98 Males per 100 Females in Oakdale.
What is the Ratio of Females per 100 Males in Oakdale?
There are 123.48 Females per 100 Males in Oakdale.
What is the Median Population Age in Oakdale?
Median Population Age in Oakdale is 35.8 Years.
What is the Average Family Size in Oakdale
Average Family Size in Oakdale is 3.8 People.
What is the Average Household Size in Oakdale
Average Household Size in Oakdale is 2.8 People.
How Large is the Labor Force in Oakdale?
There are 164 People in the Labor Forcein in Oakdale.
What is the Percentage of People in the Labor Force in Oakdale?
65.3% of People are in the Labor Force in Oakdale.
What is the Unemployment Rate in Oakdale?
Unemployment Rate in Oakdale is 20.7%.