Rowes Run, PA Map & Demographics
Rowes Run Map
Rowes Run Overview
$29,820
PER CAPITA INCOME
$78,125
AVG FAMILY INCOME
$60,714
AVG HOUSEHOLD INCOME
0.35
INEQUALITY / GINI INDEX
432
TOTAL POPULATION
224
MALE POPULATION
208
FEMALE POPULATION
107.69
MALES / 100 FEMALES
92.86
FEMALES / 100 MALES
43.4
MEDIAN AGE
2.5
AVG FAMILY SIZE
2.2
AVG HOUSEHOLD SIZE
222
LABOR FORCE [ PEOPLE ]
59.0%
PERCENT IN LABOR FORCE
11.7%
UNEMPLOYMENT RATE
Income in Rowes Run
Income Overview in Rowes Run
Per Capita Income in Rowes Run is $29,820, while median incomes of families and households are $78,125 and $60,714 respectively.
| Characteristic | Number | Measure |
| Per Capita Income | 432 | $29,820 |
| Median Family Income | 137 | $78,125 |
| Mean Family Income | 137 | $80,989 |
| Median Household Income | 200 | $60,714 |
| Mean Household Income | 200 | $64,266 |
| Income Deficit | 137 | $0 |
| Wage / Income Gap (%) | 432 | 0.00% |
| Wage / Income Gap ($) | 432 | 100.00¢ per $1 |
| Gini / Inequality Index | 432 | 0.35 |
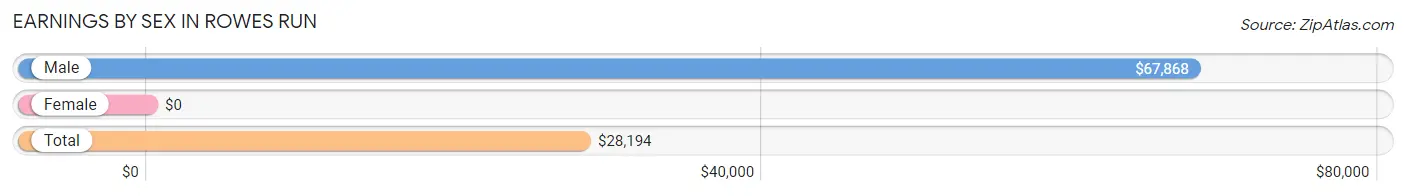
Earnings by Sex in Rowes Run
| Sex | Number | Average Earnings |
| Male | 129 (55.6%) | $67,868 |
| Female | 103 (44.4%) | $0 |
| Total | 232 (100.0%) | $28,194 |
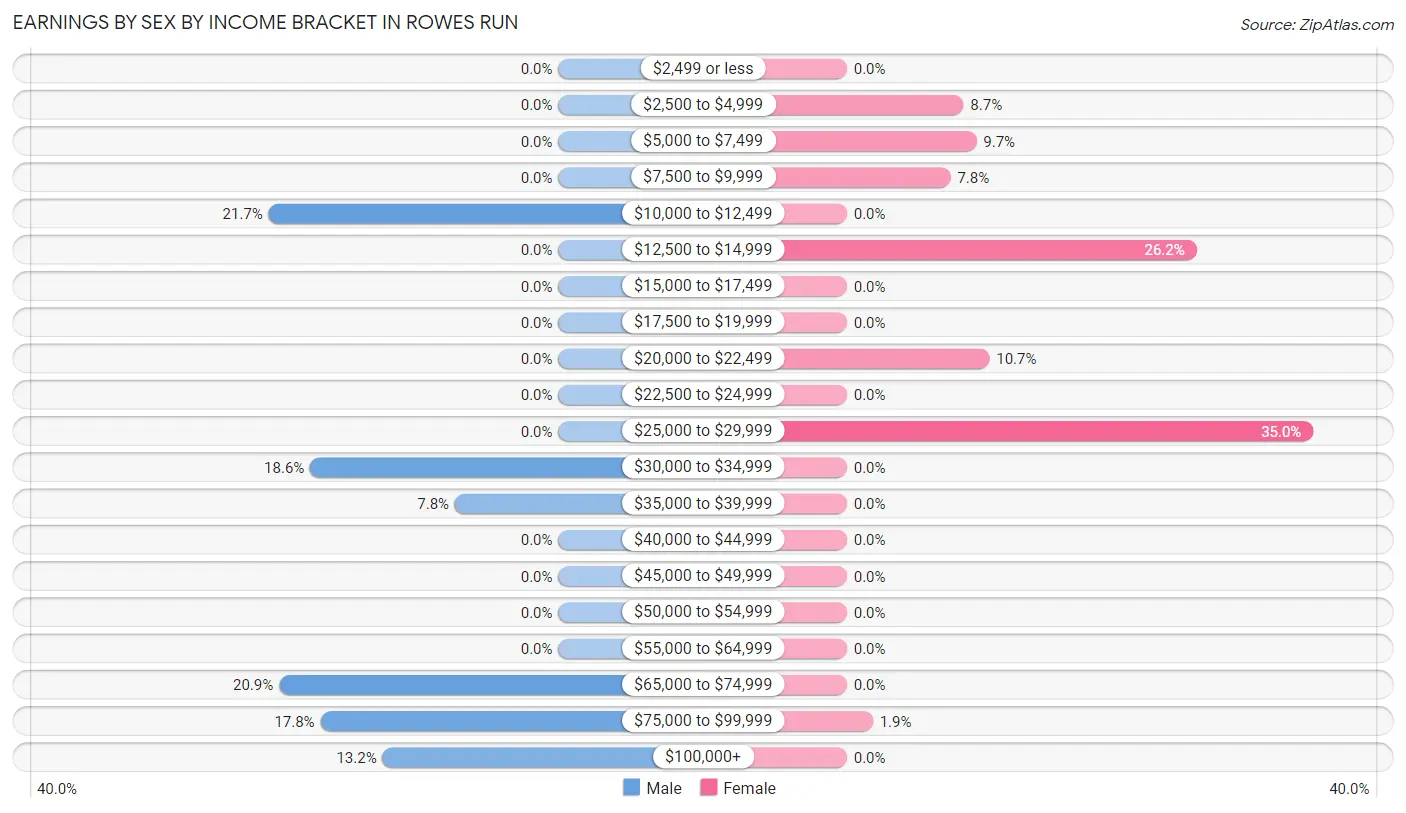
Earnings by Sex by Income Bracket in Rowes Run
The most common earnings brackets in Rowes Run are $10,000 to $12,499 for men (28 | 21.7%) and $25,000 to $29,999 for women (36 | 34.9%).
| Income | Male | Female |
| $2,499 or less | 0 (0.0%) | 0 (0.0%) |
| $2,500 to $4,999 | 0 (0.0%) | 9 (8.7%) |
| $5,000 to $7,499 | 0 (0.0%) | 10 (9.7%) |
| $7,500 to $9,999 | 0 (0.0%) | 8 (7.8%) |
| $10,000 to $12,499 | 28 (21.7%) | 0 (0.0%) |
| $12,500 to $14,999 | 0 (0.0%) | 27 (26.2%) |
| $15,000 to $17,499 | 0 (0.0%) | 0 (0.0%) |
| $17,500 to $19,999 | 0 (0.0%) | 0 (0.0%) |
| $20,000 to $22,499 | 0 (0.0%) | 11 (10.7%) |
| $22,500 to $24,999 | 0 (0.0%) | 0 (0.0%) |
| $25,000 to $29,999 | 0 (0.0%) | 36 (34.9%) |
| $30,000 to $34,999 | 24 (18.6%) | 0 (0.0%) |
| $35,000 to $39,999 | 10 (7.7%) | 0 (0.0%) |
| $40,000 to $44,999 | 0 (0.0%) | 0 (0.0%) |
| $45,000 to $49,999 | 0 (0.0%) | 0 (0.0%) |
| $50,000 to $54,999 | 0 (0.0%) | 0 (0.0%) |
| $55,000 to $64,999 | 0 (0.0%) | 0 (0.0%) |
| $65,000 to $74,999 | 27 (20.9%) | 0 (0.0%) |
| $75,000 to $99,999 | 23 (17.8%) | 2 (1.9%) |
| $100,000+ | 17 (13.2%) | 0 (0.0%) |
| Total | 129 (100.0%) | 103 (100.0%) |
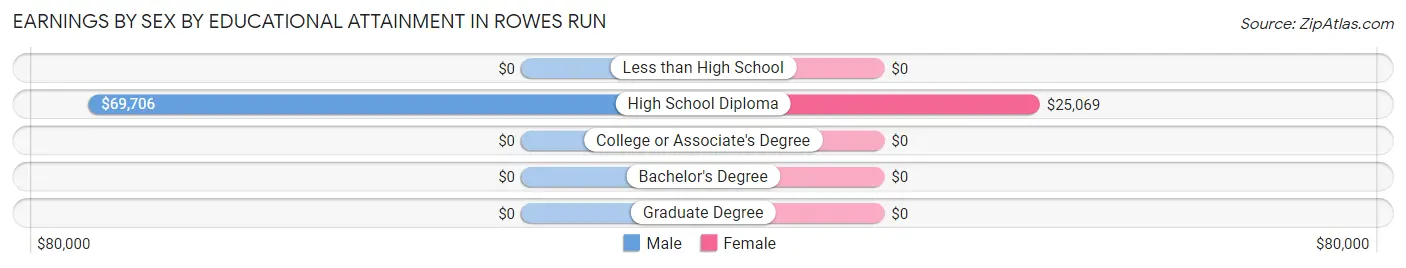
Earnings by Sex by Educational Attainment in Rowes Run
| Educational Attainment | Male Income | Female Income |
| Less than High School | - | - |
| High School Diploma | $69,706 | $25,069 |
| College or Associate's Degree | - | - |
| Bachelor's Degree | - | - |
| Graduate Degree | - | - |
| Total | $67,868 | $0 |
Family Income in Rowes Run
Family Income Brackets in Rowes Run
According to the Rowes Run family income data, there are 43 families falling into the $75,000 to $99,999 income range, which is the most common income bracket and makes up 31.4% of all families.
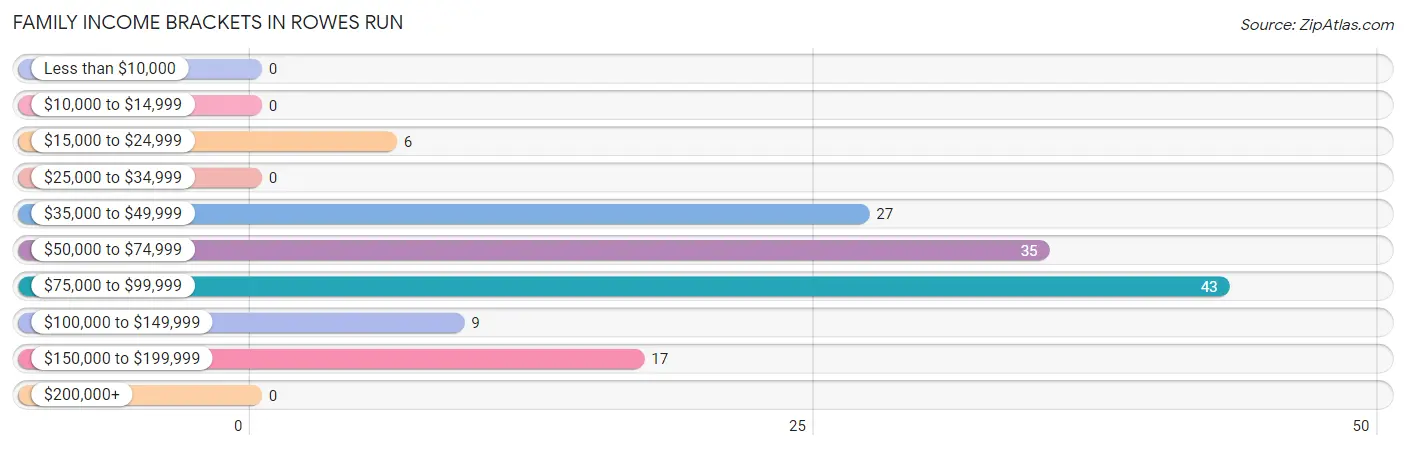
| Income Bracket | # Families | % Families |
| Less than $10,000 | 0 | 0.0% |
| $10,000 to $14,999 | 0 | 0.0% |
| $15,000 to $24,999 | 6 | 4.4% |
| $25,000 to $34,999 | 0 | 0.0% |
| $35,000 to $49,999 | 27 | 19.7% |
| $50,000 to $74,999 | 35 | 25.5% |
| $75,000 to $99,999 | 43 | 31.4% |
| $100,000 to $149,999 | 9 | 6.6% |
| $150,000 to $199,999 | 17 | 12.4% |
| $200,000+ | 0 | 0.0% |
Family Income by Famaliy Size in Rowes Run
2-person families (94 | 68.6%) account for the highest median family income in Rowes Run with $66,364 per family, while 2-person families (94 | 68.6%) have the highest median income of $33,182 per family member.
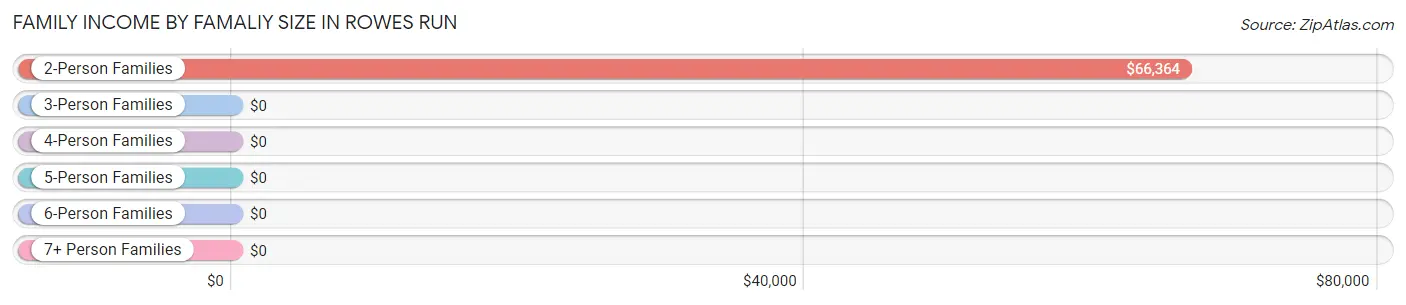
| Income Bracket | # Families | Median Income |
| 2-Person Families | 94 (68.6%) | $66,364 |
| 3-Person Families | 19 (13.9%) | $0 |
| 4-Person Families | 24 (17.5%) | $0 |
| 5-Person Families | 0 (0.0%) | $0 |
| 6-Person Families | 0 (0.0%) | $0 |
| 7+ Person Families | 0 (0.0%) | $0 |
| Total | 137 (100.0%) | $78,125 |
Family Income by Number of Earners in Rowes Run
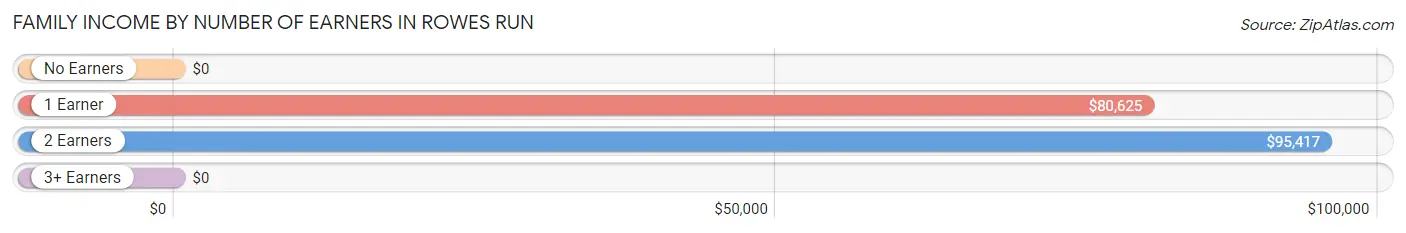
| Number of Earners | # Families | Median Income |
| No Earners | 14 (10.2%) | $0 |
| 1 Earner | 41 (29.9%) | $80,625 |
| 2 Earners | 82 (59.9%) | $95,417 |
| 3+ Earners | 0 (0.0%) | $0 |
| Total | 137 (100.0%) | $78,125 |
Household Income in Rowes Run
Household Income Brackets in Rowes Run
With 47 households falling in the category, the $50,000 to $74,999 income range is the most frequent in Rowes Run, accounting for 23.5% of all households.
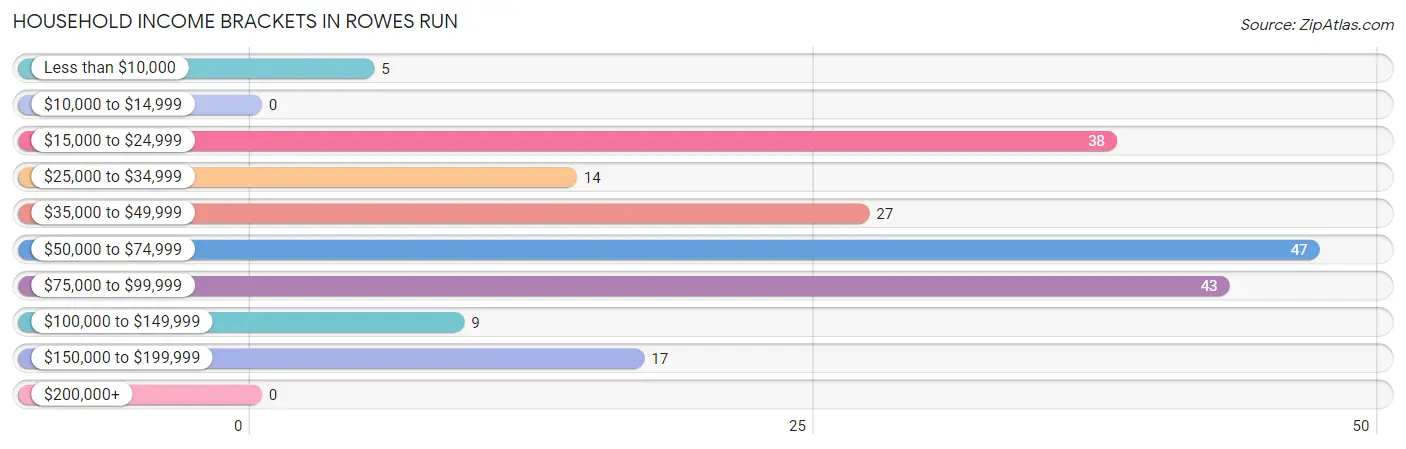
| Income Bracket | # Households | % Households |
| Less than $10,000 | 5 | 2.5% |
| $10,000 to $14,999 | 0 | 0.0% |
| $15,000 to $24,999 | 38 | 19.0% |
| $25,000 to $34,999 | 14 | 7.0% |
| $35,000 to $49,999 | 27 | 13.5% |
| $50,000 to $74,999 | 47 | 23.5% |
| $75,000 to $99,999 | 43 | 21.5% |
| $100,000 to $149,999 | 9 | 4.5% |
| $150,000 to $199,999 | 17 | 8.5% |
| $200,000+ | 0 | 0.0% |
Household Income by Householder Age in Rowes Run
The median household income in Rowes Run is $60,714, with the highest median household income of $95,417 found in the 25 to 44 years age bracket for the primary householder. A total of 64 households (32.0%) fall into this category.
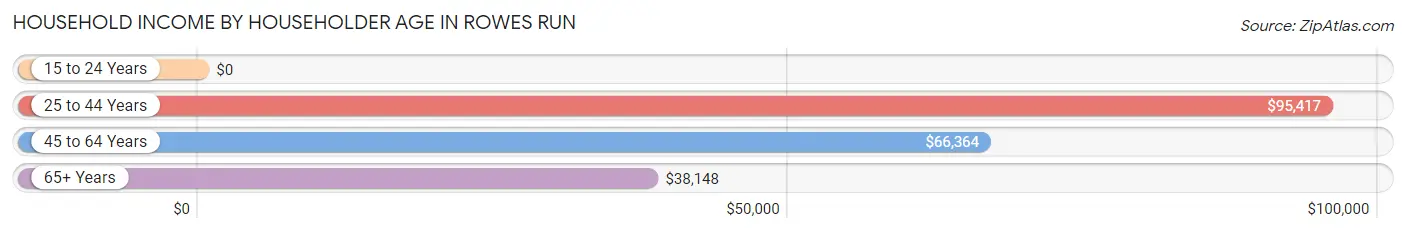
| Income Bracket | # Households | Median Income |
| 15 to 24 Years | 0 (0.0%) | $0 |
| 25 to 44 Years | 64 (32.0%) | $95,417 |
| 45 to 64 Years | 48 (24.0%) | $66,364 |
| 65+ Years | 88 (44.0%) | $38,148 |
| Total | 200 (100.0%) | $60,714 |
Poverty in Rowes Run
Income Below Poverty by Sex and Age in Rowes Run
With 5.8% poverty level for males and 15.8% for females among the residents of Rowes Run, 16 and 17 year old males and 18 to 24 year old females are the most vulnerable to poverty, with 7 males (100.0%) and 8 females (100.0%) in their respective age groups living below the poverty level.
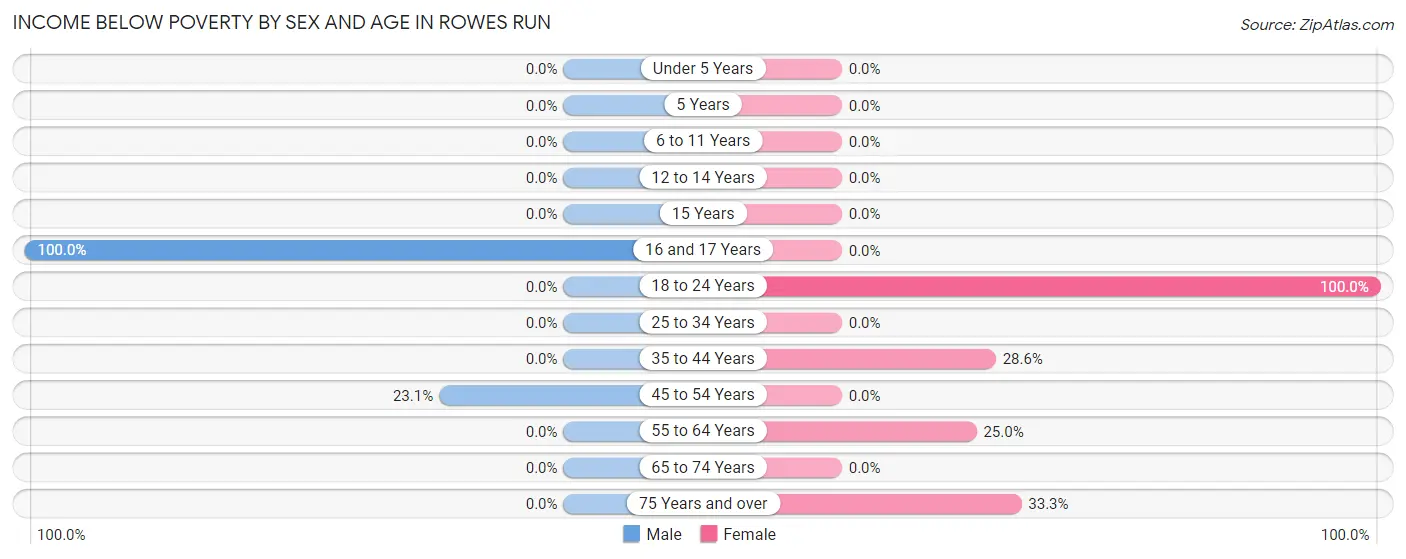
| Age Bracket | Male | Female |
| Under 5 Years | 0 (0.0%) | 0 (0.0%) |
| 5 Years | 0 (0.0%) | 0 (0.0%) |
| 6 to 11 Years | 0 (0.0%) | 0 (0.0%) |
| 12 to 14 Years | 0 (0.0%) | 0 (0.0%) |
| 15 Years | 0 (0.0%) | 0 (0.0%) |
| 16 and 17 Years | 7 (100.0%) | 0 (0.0%) |
| 18 to 24 Years | 0 (0.0%) | 8 (100.0%) |
| 25 to 34 Years | 0 (0.0%) | 0 (0.0%) |
| 35 to 44 Years | 0 (0.0%) | 8 (28.6%) |
| 45 to 54 Years | 6 (23.1%) | 0 (0.0%) |
| 55 to 64 Years | 0 (0.0%) | 10 (25.0%) |
| 65 to 74 Years | 0 (0.0%) | 0 (0.0%) |
| 75 Years and over | 0 (0.0%) | 5 (33.3%) |
| Total | 13 (5.8%) | 31 (15.8%) |
Income Above Poverty by Sex and Age in Rowes Run
According to the poverty statistics in Rowes Run, males aged 15 years and females aged 6 to 11 years are the age groups that are most secure financially, with 100.0% of males and 100.0% of females in these age groups living above the poverty line.
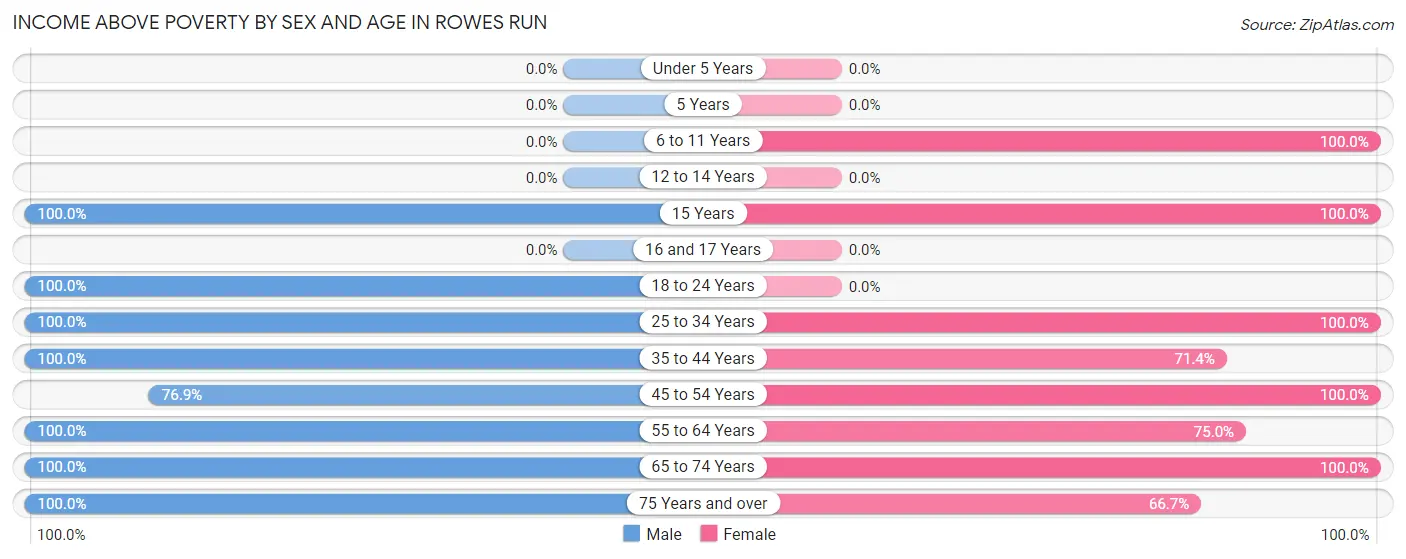
| Age Bracket | Male | Female |
| Under 5 Years | 0 (0.0%) | 0 (0.0%) |
| 5 Years | 0 (0.0%) | 0 (0.0%) |
| 6 to 11 Years | 0 (0.0%) | 9 (100.0%) |
| 12 to 14 Years | 0 (0.0%) | 0 (0.0%) |
| 15 Years | 18 (100.0%) | 17 (100.0%) |
| 16 and 17 Years | 0 (0.0%) | 0 (0.0%) |
| 18 to 24 Years | 17 (100.0%) | 0 (0.0%) |
| 25 to 34 Years | 54 (100.0%) | 18 (100.0%) |
| 35 to 44 Years | 44 (100.0%) | 20 (71.4%) |
| 45 to 54 Years | 20 (76.9%) | 11 (100.0%) |
| 55 to 64 Years | 22 (100.0%) | 30 (75.0%) |
| 65 to 74 Years | 10 (100.0%) | 50 (100.0%) |
| 75 Years and over | 26 (100.0%) | 10 (66.7%) |
| Total | 211 (94.2%) | 165 (84.2%) |
Income Below Poverty Among Married-Couple Families in Rowes Run
The poverty statistics for married-couple families in Rowes Run show that 6.3% or 6 of the total 95 families live below the poverty line. Families with 1 or 2 children have the highest poverty rate of 18.2%, comprising of 6 families. On the other hand, families with no children have the lowest poverty rate of 0.0%, which includes 0 families.
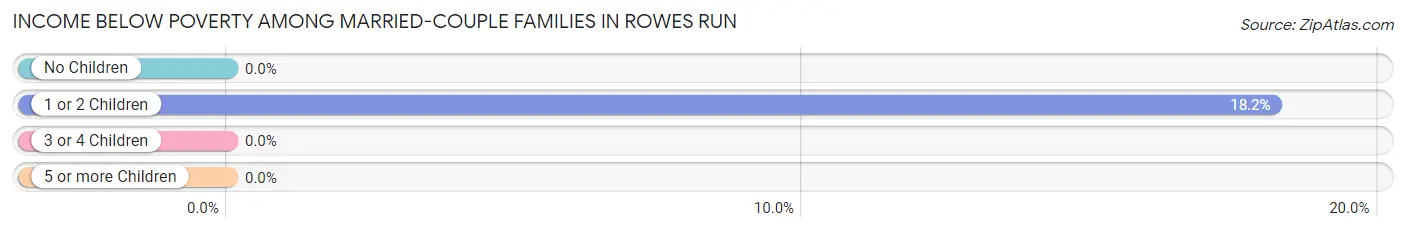
| Children | Above Poverty | Below Poverty |
| No Children | 62 (100.0%) | 0 (0.0%) |
| 1 or 2 Children | 27 (81.8%) | 6 (18.2%) |
| 3 or 4 Children | 0 (0.0%) | 0 (0.0%) |
| 5 or more Children | 0 (0.0%) | 0 (0.0%) |
| Total | 89 (93.7%) | 6 (6.3%) |
Income Below Poverty Among Single-Parent Households in Rowes Run
| Children | Single Father | Single Mother |
| No Children | 0 (0.0%) | 0 (0.0%) |
| 1 or 2 Children | 0 (0.0%) | 0 (0.0%) |
| 3 or 4 Children | 0 (0.0%) | 0 (0.0%) |
| 5 or more Children | 0 (0.0%) | 0 (0.0%) |
| Total | 0 (0.0%) | 0 (0.0%) |
Income Below Poverty Among Married-Couple vs Single-Parent Households in Rowes Run
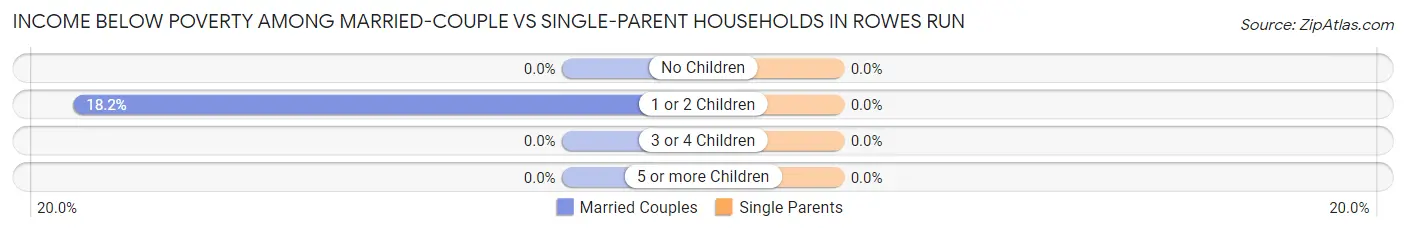
| Children | Married-Couple Families | Single-Parent Households |
| No Children | 0 (0.0%) | 0 (0.0%) |
| 1 or 2 Children | 6 (18.2%) | 0 (0.0%) |
| 3 or 4 Children | 0 (0.0%) | 0 (0.0%) |
| 5 or more Children | 0 (0.0%) | 0 (0.0%) |
| Total | 6 (6.3%) | 0 (0.0%) |
Race in Rowes Run
The most populous races in Rowes Run are White / Caucasian (420 | 97.2%), and Some other Race (12 | 2.8%).
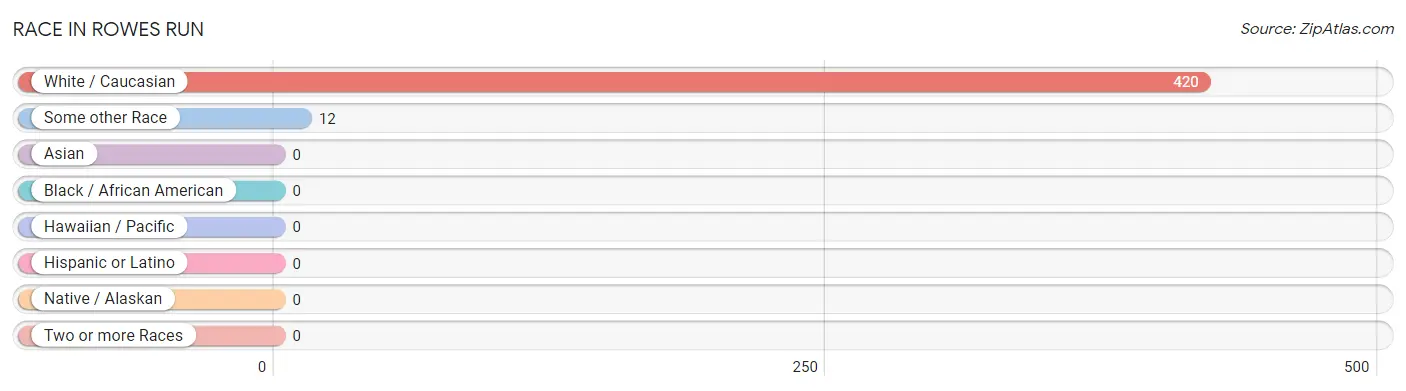
| Race | # Population | % Population |
| Asian | 0 | 0.0% |
| Black / African American | 0 | 0.0% |
| Hawaiian / Pacific | 0 | 0.0% |
| Hispanic or Latino | 0 | 0.0% |
| Native / Alaskan | 0 | 0.0% |
| White / Caucasian | 420 | 97.2% |
| Two or more Races | 0 | 0.0% |
| Some other Race | 12 | 2.8% |
| Total | 432 | 100.0% |
Ancestry in Rowes Run
The most populous ancestries reported in Rowes Run are German (108 | 25.0%), Irish (94 | 21.8%), Slovak (92 | 21.3%), Polish (48 | 11.1%), and Italian (43 | 10.0%), together accounting for 89.1% of all Rowes Run residents.
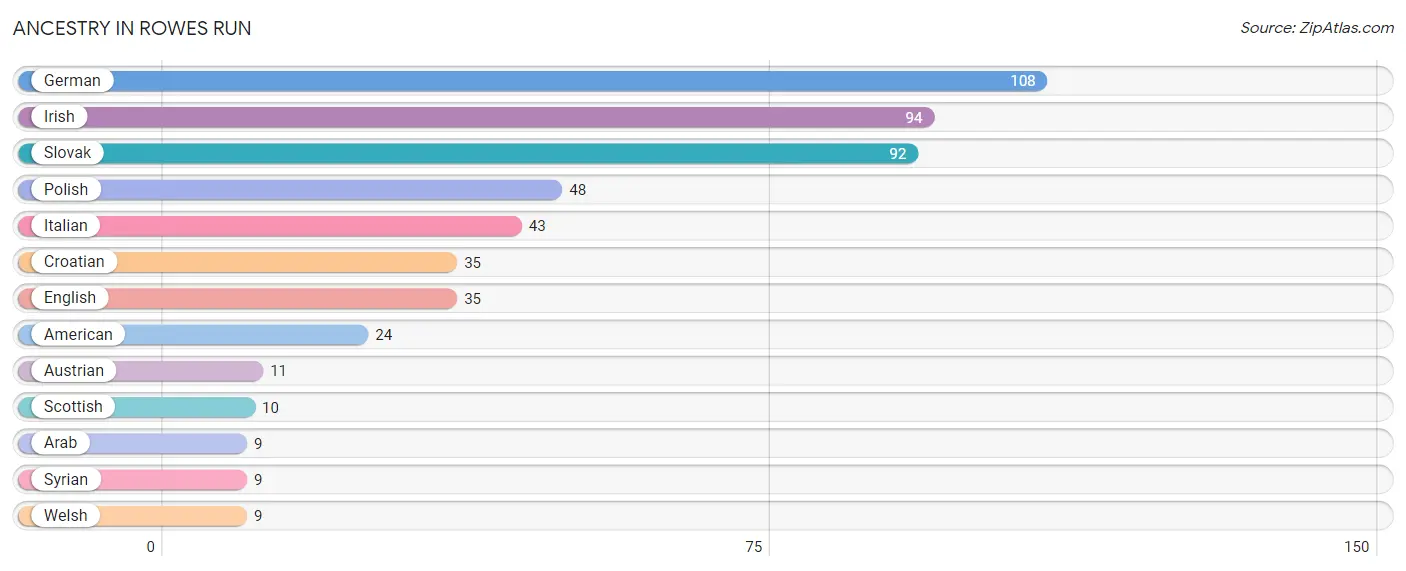
| Ancestry | # Population | % Population |
| American | 24 | 5.6% |
| Arab | 9 | 2.1% |
| Austrian | 11 | 2.5% |
| Croatian | 35 | 8.1% |
| English | 35 | 8.1% |
| German | 108 | 25.0% |
| Irish | 94 | 21.8% |
| Italian | 43 | 10.0% |
| Polish | 48 | 11.1% |
| Scottish | 10 | 2.3% |
| Slovak | 92 | 21.3% |
| Syrian | 9 | 2.1% |
| Welsh | 9 | 2.1% | View All 13 Rows |
Immigrants in Rowes Run

| Immigration Origin | # Population | % Population | View All 0 Rows |
Sex and Age in Rowes Run
Sex and Age in Rowes Run
The most populous age groups in Rowes Run are 15 to 19 Years (42 | 18.8%) for men and 70 to 74 Years (40 | 19.2%) for women.
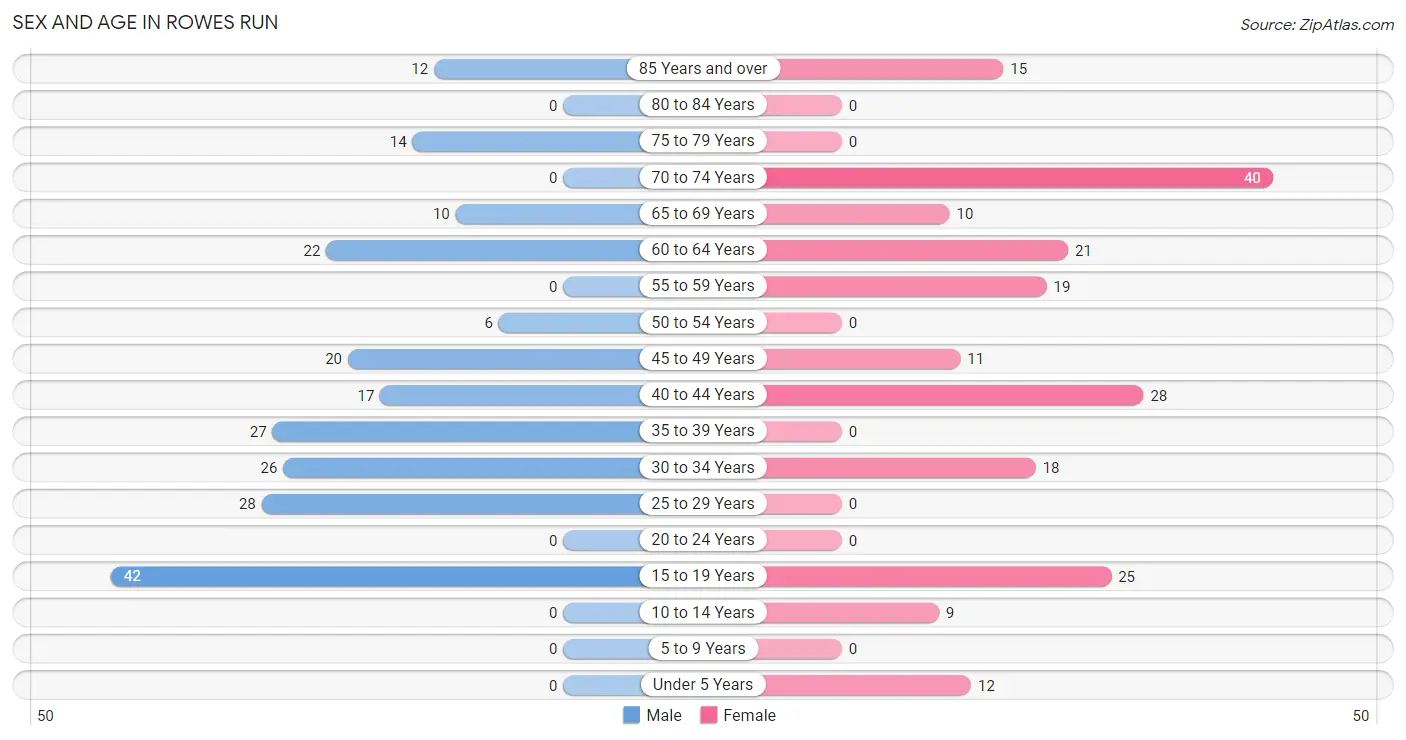
| Age Bracket | Male | Female |
| Under 5 Years | 0 (0.0%) | 12 (5.8%) |
| 5 to 9 Years | 0 (0.0%) | 0 (0.0%) |
| 10 to 14 Years | 0 (0.0%) | 9 (4.3%) |
| 15 to 19 Years | 42 (18.8%) | 25 (12.0%) |
| 20 to 24 Years | 0 (0.0%) | 0 (0.0%) |
| 25 to 29 Years | 28 (12.5%) | 0 (0.0%) |
| 30 to 34 Years | 26 (11.6%) | 18 (8.6%) |
| 35 to 39 Years | 27 (12.0%) | 0 (0.0%) |
| 40 to 44 Years | 17 (7.6%) | 28 (13.5%) |
| 45 to 49 Years | 20 (8.9%) | 11 (5.3%) |
| 50 to 54 Years | 6 (2.7%) | 0 (0.0%) |
| 55 to 59 Years | 0 (0.0%) | 19 (9.1%) |
| 60 to 64 Years | 22 (9.8%) | 21 (10.1%) |
| 65 to 69 Years | 10 (4.5%) | 10 (4.8%) |
| 70 to 74 Years | 0 (0.0%) | 40 (19.2%) |
| 75 to 79 Years | 14 (6.2%) | 0 (0.0%) |
| 80 to 84 Years | 0 (0.0%) | 0 (0.0%) |
| 85 Years and over | 12 (5.4%) | 15 (7.2%) |
| Total | 224 (100.0%) | 208 (100.0%) |
Families and Households in Rowes Run
Median Family Size in Rowes Run
The median family size in Rowes Run is 2.53 persons per family, with married-couple families (95 | 69.3%) accounting for the largest median family size of 2.74 persons per family. On the other hand, single female/mother families (29 | 21.2%) represent the smallest median family size with 2.03 persons per family.
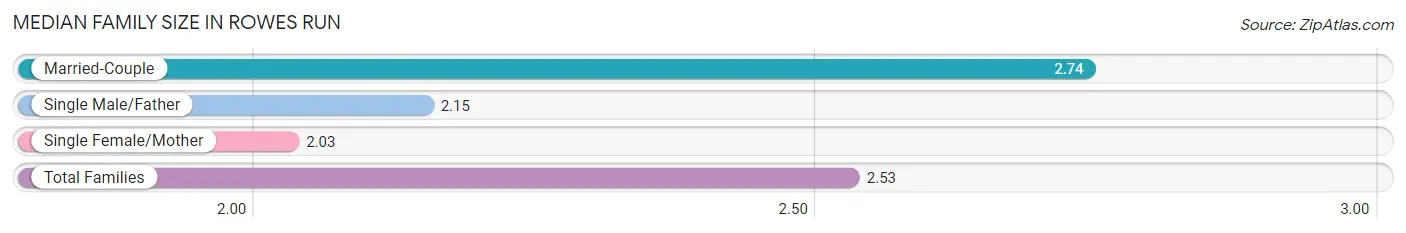
| Family Type | # Families | Family Size |
| Married-Couple | 95 (69.3%) | 2.74 |
| Single Male/Father | 13 (9.5%) | 2.15 |
| Single Female/Mother | 29 (21.2%) | 2.03 |
| Total Families | 137 (100.0%) | 2.53 |
Median Household Size in Rowes Run
The median household size in Rowes Run is 2.16 persons per household, with married-couple households (95 | 47.5%) accounting for the largest median household size of 2.86 persons per household. non-family households (63 | 31.5%) represent the smallest median household size with 1.16 persons per household.
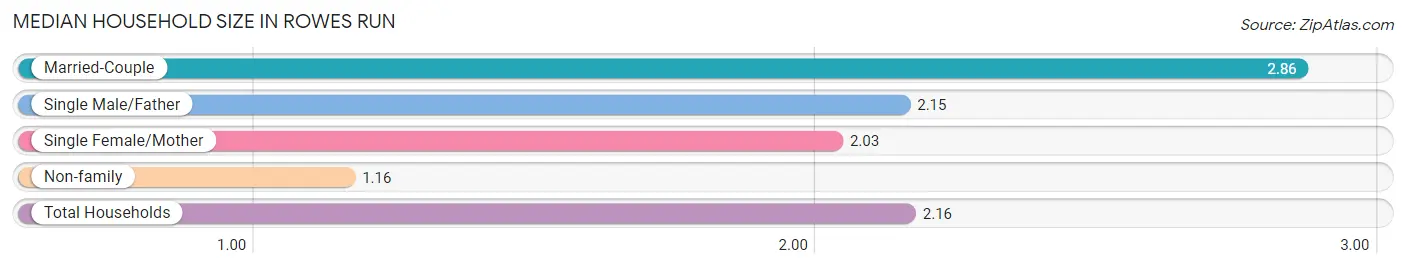
| Household Type | # Households | Household Size |
| Married-Couple | 95 (47.5%) | 2.86 |
| Single Male/Father | 13 (6.5%) | 2.15 |
| Single Female/Mother | 29 (14.5%) | 2.03 |
| Non-family | 63 (31.5%) | 1.16 |
| Total Households | 200 (100.0%) | 2.16 |
Household Size by Marriage Status in Rowes Run
Out of a total of 200 households in Rowes Run, 137 (68.5%) are family households, while 63 (31.5%) are nonfamily households. The most numerous type of family households are 2-person households, comprising 84, and the most common type of nonfamily households are 1-person households, comprising 51.
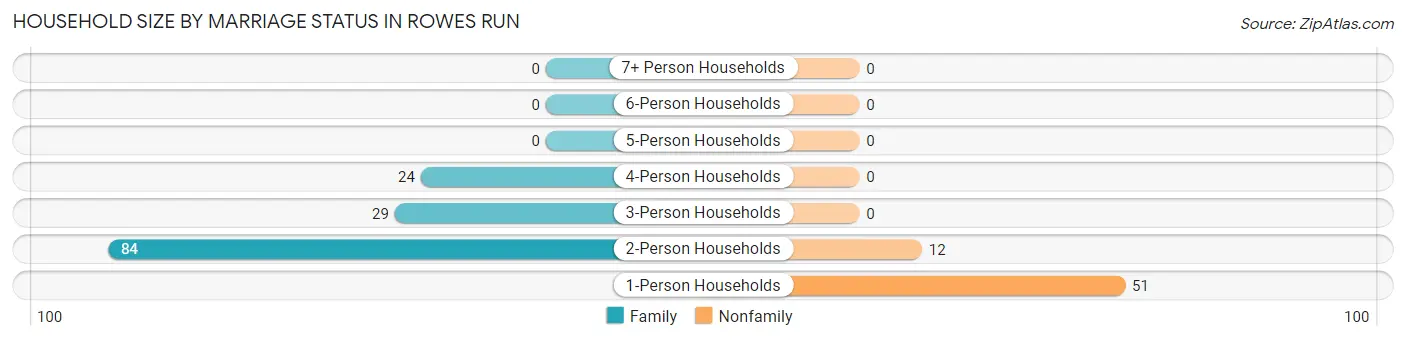
| Household Size | Family Households | Nonfamily Households |
| 1-Person Households | - | 51 (25.5%) |
| 2-Person Households | 84 (42.0%) | 12 (6.0%) |
| 3-Person Households | 29 (14.5%) | 0 (0.0%) |
| 4-Person Households | 24 (12.0%) | 0 (0.0%) |
| 5-Person Households | 0 (0.0%) | 0 (0.0%) |
| 6-Person Households | 0 (0.0%) | 0 (0.0%) |
| 7+ Person Households | 0 (0.0%) | 0 (0.0%) |
| Total | 137 (68.5%) | 63 (31.5%) |
Female Fertility in Rowes Run
Fertility by Age in Rowes Run
| Age Bracket | Women with Births | Births / 1,000 Women |
| 15 to 19 years | 0 (0.0%) | 0.0 |
| 20 to 34 years | 0 (0.0%) | 0.0 |
| 35 to 50 years | 0 (0.0%) | 0.0 |
| Total | 0 (0.0%) | 0.0 |
Fertility by Age by Marriage Status in Rowes Run
| Age Bracket | Married | Unmarried |
| 15 to 19 years | 0 (0.0%) | 0 (0.0%) |
| 20 to 34 years | 0 (0.0%) | 0 (0.0%) |
| 35 to 50 years | 0 (0.0%) | 0 (0.0%) |
| Total | 0 (0.0%) | 0 (0.0%) |
Fertility by Education in Rowes Run
| Educational Attainment | Women with Births | Births / 1,000 Women |
| Less than High School | 0 (0.0%) | 0.0 |
| High School Diploma | 0 (0.0%) | 0.0 |
| College or Associate's Degree | 0 (0.0%) | 0.0 |
| Bachelor's Degree | 0 (0.0%) | 0.0 |
| Graduate Degree | 0 (0.0%) | 0.0 |
| Total | 0 (0.0%) | 0.0 |
Fertility by Education by Marriage Status in Rowes Run
| Educational Attainment | Married | Unmarried |
| Less than High School | 0 (0.0%) | 0 (0.0%) |
| High School Diploma | 0 (0.0%) | 0 (0.0%) |
| College or Associate's Degree | 0 (0.0%) | 0 (0.0%) |
| Bachelor's Degree | 0 (0.0%) | 0 (0.0%) |
| Graduate Degree | 0 (0.0%) | 0 (0.0%) |
| Total | 0 (0.0%) | 0 (0.0%) |
Employment Characteristics in Rowes Run
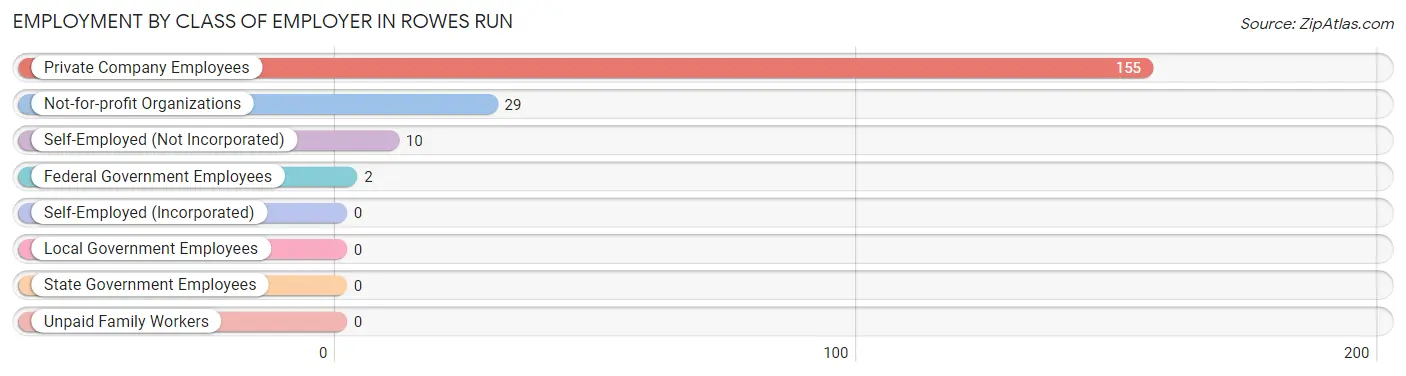
Employment by Class of Employer in Rowes Run
Among the 196 employed individuals in Rowes Run, private company employees (155 | 79.1%), not-for-profit organizations (29 | 14.8%), and self-employed (not incorporated) (10 | 5.1%) make up the most common classes of employment.
| Employer Class | # Employees | % Employees |
| Private Company Employees | 155 | 79.1% |
| Self-Employed (Incorporated) | 0 | 0.0% |
| Self-Employed (Not Incorporated) | 10 | 5.1% |
| Not-for-profit Organizations | 29 | 14.8% |
| Local Government Employees | 0 | 0.0% |
| State Government Employees | 0 | 0.0% |
| Federal Government Employees | 2 | 1.0% |
| Unpaid Family Workers | 0 | 0.0% |
| Total | 196 | 100.0% |
Employment Status by Age in Rowes Run
According to the labor force statistics for Rowes Run, out of the total population over 16 years of age (376), 59.0% or 222 individuals are in the labor force, with 11.7% or 26 of them unemployed. The age group with the highest labor force participation rate is 25 to 29 years, with 100.0% or 28 individuals in the labor force. Within the labor force, the 55 to 59 years age range has the highest percentage of unemployed individuals, with 100.0% or 9 of them being unemployed.
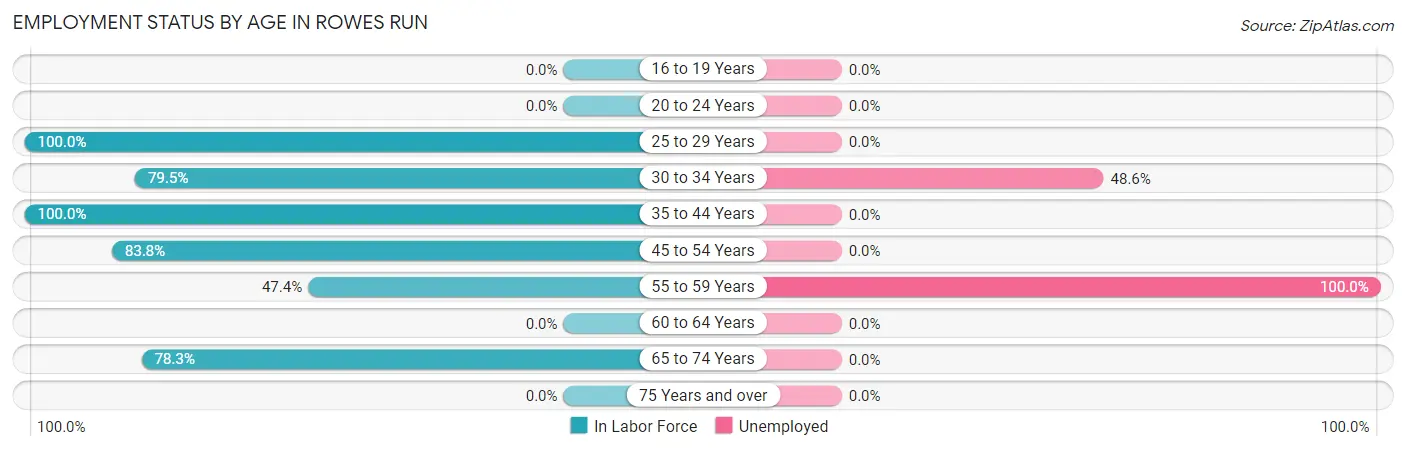
| Age Bracket | In Labor Force | Unemployed |
| 16 to 19 Years | 0 (0.0%) | 0 (0.0%) |
| 20 to 24 Years | 0 (0.0%) | 0 (0.0%) |
| 25 to 29 Years | 28 (100.0%) | 0 (0.0%) |
| 30 to 34 Years | 35 (79.5%) | 17 (48.6%) |
| 35 to 44 Years | 72 (100.0%) | 0 (0.0%) |
| 45 to 54 Years | 31 (83.8%) | 0 (0.0%) |
| 55 to 59 Years | 9 (47.4%) | 9 (100.0%) |
| 60 to 64 Years | 0 (0.0%) | 0 (0.0%) |
| 65 to 74 Years | 47 (78.3%) | 0 (0.0%) |
| 75 Years and over | 0 (0.0%) | 0 (0.0%) |
| Total | 222 (59.0%) | 26 (11.7%) |
Employment Status by Educational Attainment in Rowes Run
According to labor force statistics for Rowes Run, 72.0% of individuals (175) out of the total population between 25 and 64 years of age (243) are in the labor force, with 14.9% or 26 of them being unemployed. The group with the highest labor force participation rate are those with the educational attainment of less than high school, with 100.0% or 8 individuals in the labor force. Within the labor force, individuals with bachelor's degree or higher education have the highest percentage of unemployment, with 22.5% or 9 of them being unemployed.
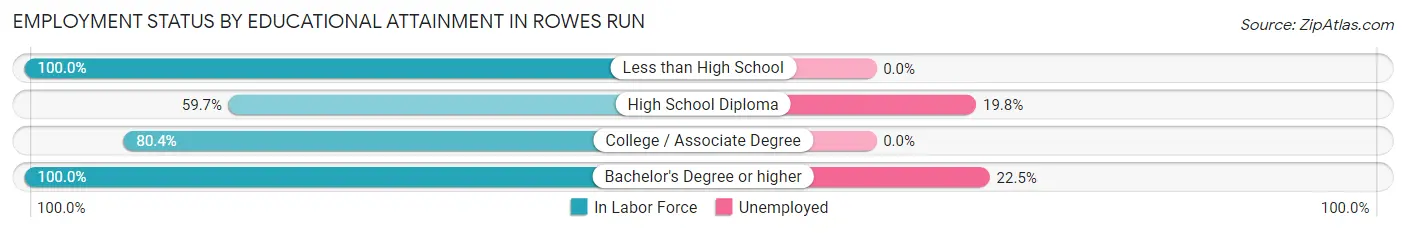
| Educational Attainment | In Labor Force | Unemployed |
| Less than High School | 8 (100.0%) | 0 (0.0%) |
| High School Diploma | 86 (59.7%) | 29 (19.8%) |
| College / Associate Degree | 41 (80.4%) | 0 (0.0%) |
| Bachelor's Degree or higher | 40 (100.0%) | 9 (22.5%) |
| Total | 175 (72.0%) | 36 (14.9%) |
Employment Occupations by Sex in Rowes Run
Management, Business, Science and Arts Occupations
The most common Management, Business, Science and Arts occupations in Rowes Run are Community & Social Service (21 | 10.7%), Education, Arts & Media (11 | 5.6%), and Education Instruction & Library (10 | 5.1%).
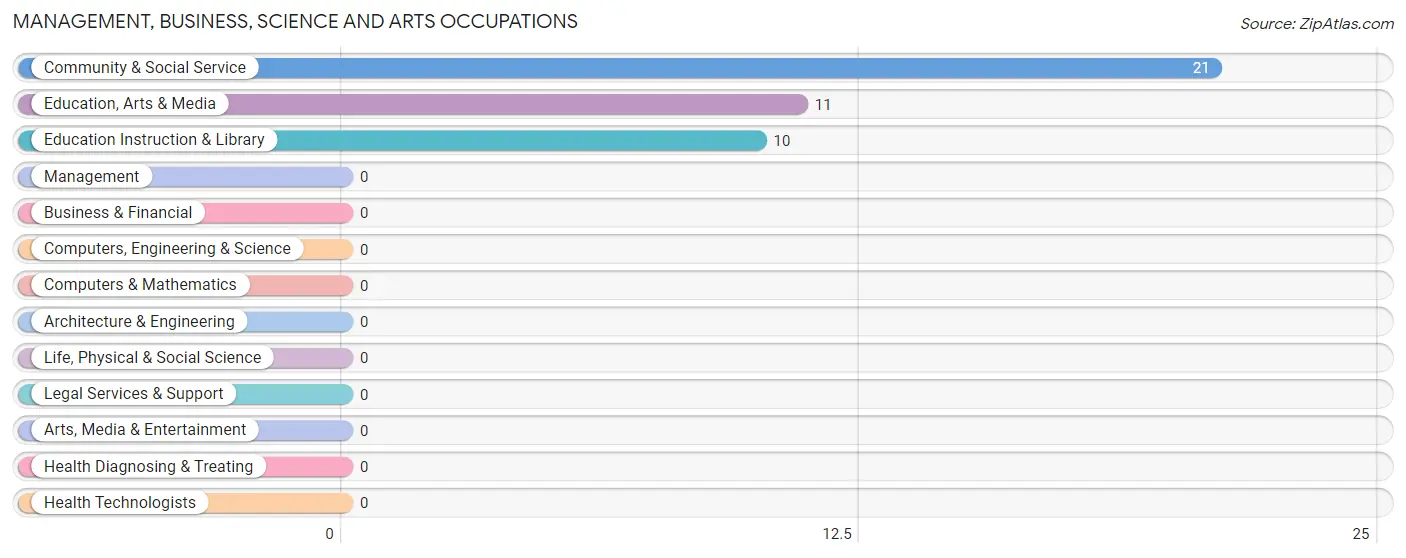
Management, Business, Science and Arts Occupations by Sex
Within the Management, Business, Science and Arts occupations in Rowes Run, the most male-oriented occupations are Education Instruction & Library (100.0%), and Community & Social Service (47.6%), while the most female-oriented occupations are Education, Arts & Media (100.0%), and Community & Social Service (52.4%).
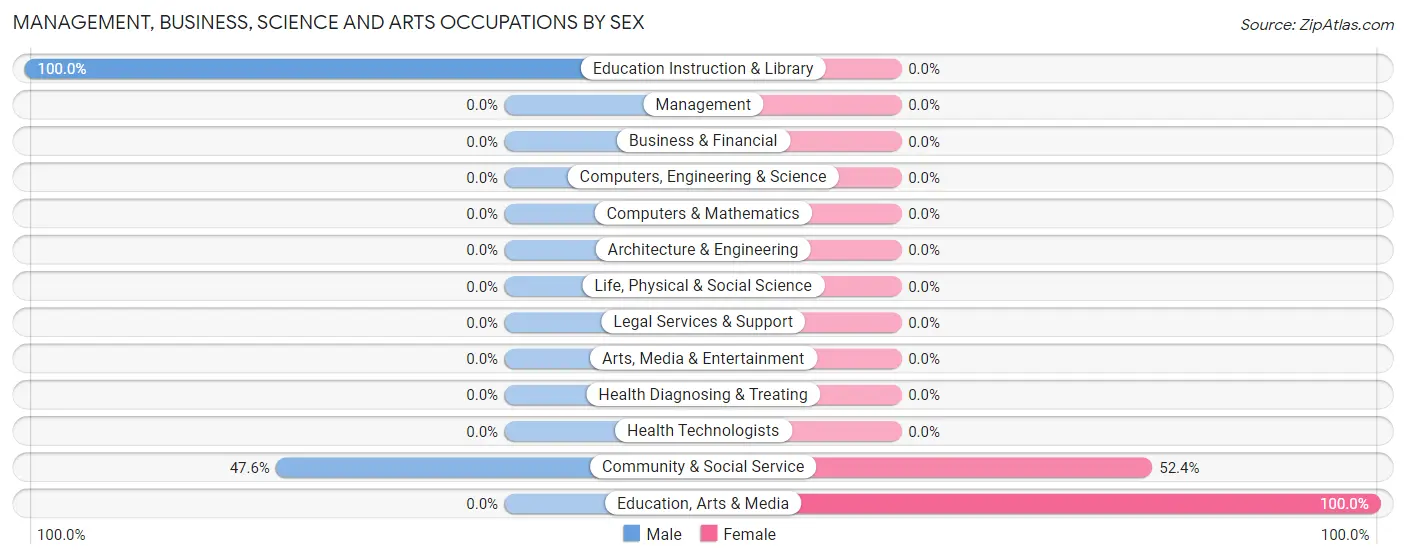
| Occupation | Male | Female |
| Management | 0 (0.0%) | 0 (0.0%) |
| Business & Financial | 0 (0.0%) | 0 (0.0%) |
| Computers, Engineering & Science | 0 (0.0%) | 0 (0.0%) |
| Computers & Mathematics | 0 (0.0%) | 0 (0.0%) |
| Architecture & Engineering | 0 (0.0%) | 0 (0.0%) |
| Life, Physical & Social Science | 0 (0.0%) | 0 (0.0%) |
| Community & Social Service | 10 (47.6%) | 11 (52.4%) |
| Education, Arts & Media | 0 (0.0%) | 11 (100.0%) |
| Legal Services & Support | 0 (0.0%) | 0 (0.0%) |
| Education Instruction & Library | 10 (100.0%) | 0 (0.0%) |
| Arts, Media & Entertainment | 0 (0.0%) | 0 (0.0%) |
| Health Diagnosing & Treating | 0 (0.0%) | 0 (0.0%) |
| Health Technologists | 0 (0.0%) | 0 (0.0%) |
| Total (Category) | 10 (47.6%) | 11 (52.4%) |
| Total (Overall) | 102 (52.0%) | 94 (48.0%) |
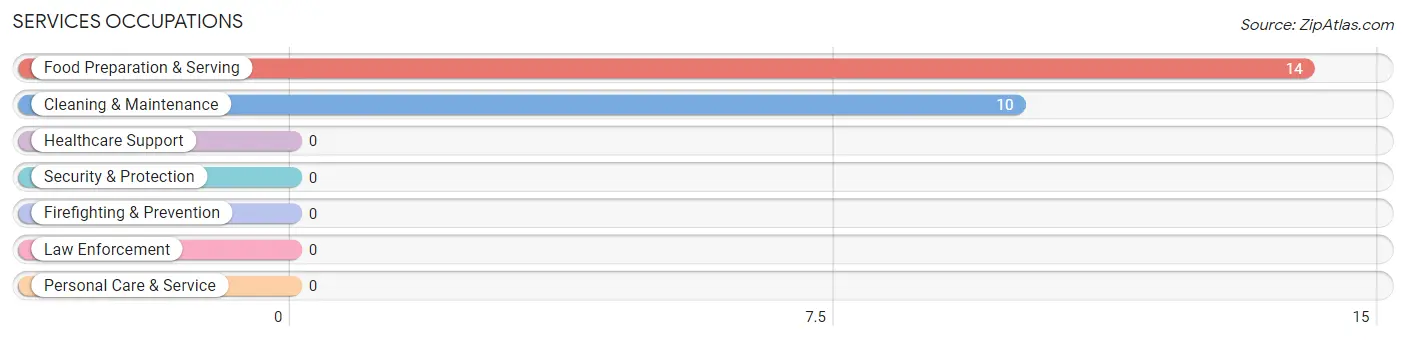
Services Occupations
The most common Services occupations in Rowes Run are Food Preparation & Serving (14 | 7.1%), and Cleaning & Maintenance (10 | 5.1%).
Services Occupations by Sex
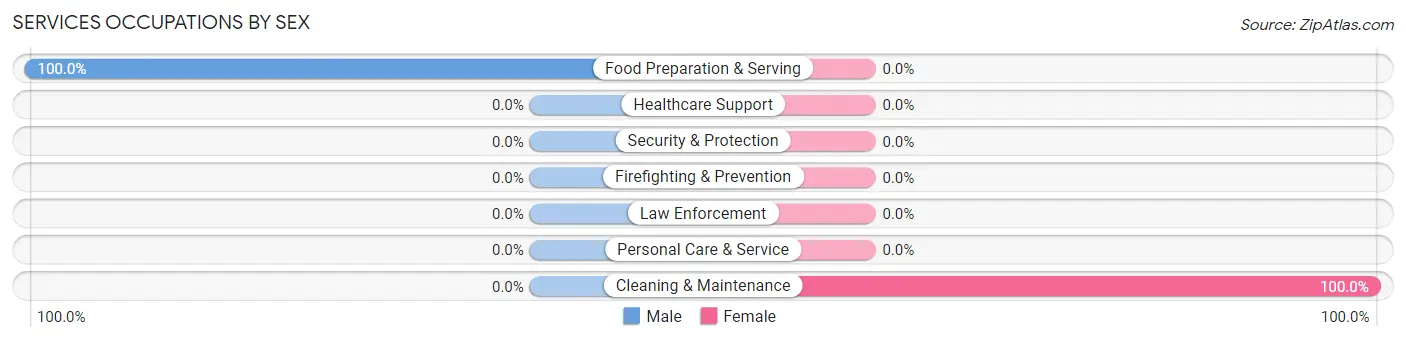
| Occupation | Male | Female |
| Healthcare Support | 0 (0.0%) | 0 (0.0%) |
| Security & Protection | 0 (0.0%) | 0 (0.0%) |
| Firefighting & Prevention | 0 (0.0%) | 0 (0.0%) |
| Law Enforcement | 0 (0.0%) | 0 (0.0%) |
| Food Preparation & Serving | 14 (100.0%) | 0 (0.0%) |
| Cleaning & Maintenance | 0 (0.0%) | 10 (100.0%) |
| Personal Care & Service | 0 (0.0%) | 0 (0.0%) |
| Total (Category) | 14 (58.3%) | 10 (41.7%) |
| Total (Overall) | 102 (52.0%) | 94 (48.0%) |
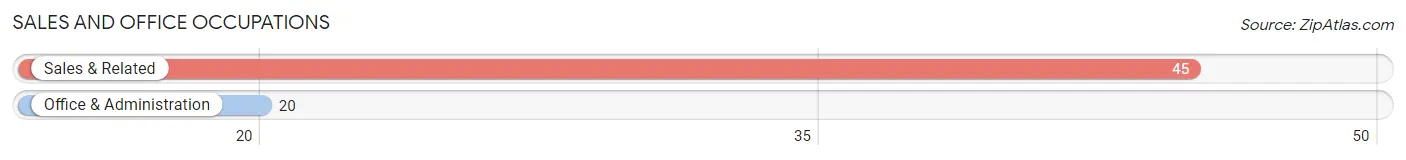
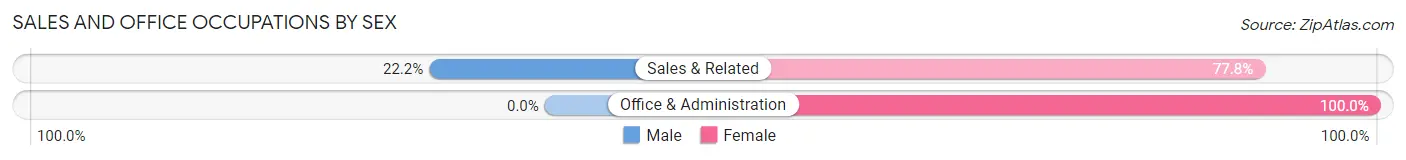
Sales and Office Occupations
The most common Sales and Office occupations in Rowes Run are Sales & Related (45 | 23.0%), and Office & Administration (20 | 10.2%).
Sales and Office Occupations by Sex
| Occupation | Male | Female |
| Sales & Related | 10 (22.2%) | 35 (77.8%) |
| Office & Administration | 0 (0.0%) | 20 (100.0%) |
| Total (Category) | 10 (15.4%) | 55 (84.6%) |
| Total (Overall) | 102 (52.0%) | 94 (48.0%) |
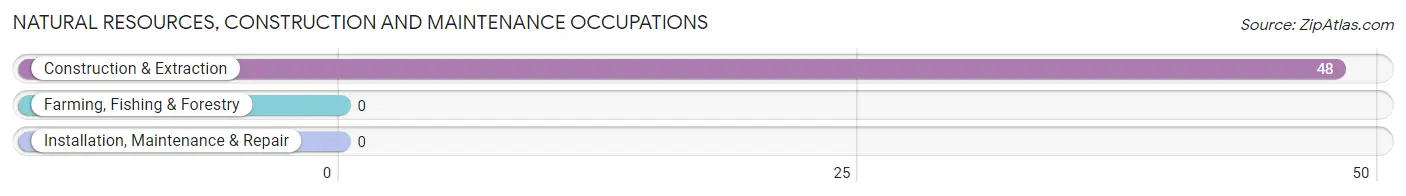
Natural Resources, Construction and Maintenance Occupations
The most common Natural Resources, Construction and Maintenance occupations in Rowes Run are , and Construction & Extraction (48 | 24.5%).
Natural Resources, Construction and Maintenance Occupations by Sex
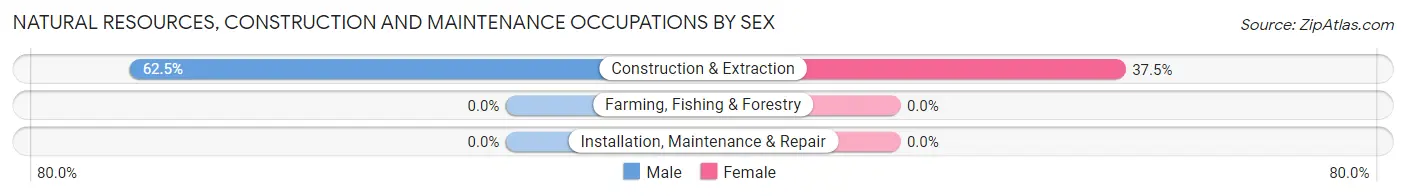
| Occupation | Male | Female |
| Farming, Fishing & Forestry | 0 (0.0%) | 0 (0.0%) |
| Construction & Extraction | 30 (62.5%) | 18 (37.5%) |
| Installation, Maintenance & Repair | 0 (0.0%) | 0 (0.0%) |
| Total (Category) | 30 (62.5%) | 18 (37.5%) |
| Total (Overall) | 102 (52.0%) | 94 (48.0%) |
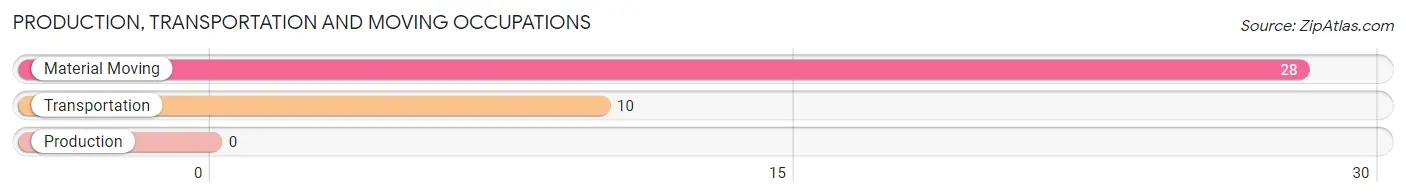
Production, Transportation and Moving Occupations
The most common Production, Transportation and Moving occupations in Rowes Run are Material Moving (28 | 14.3%), and Transportation (10 | 5.1%).
Production, Transportation and Moving Occupations by Sex
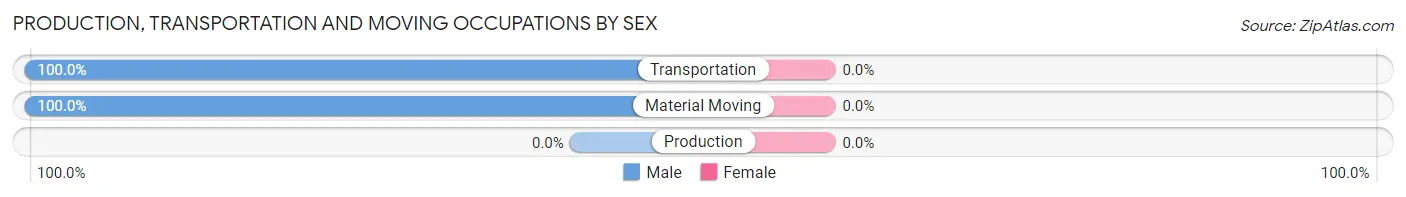
| Occupation | Male | Female |
| Production | 0 (0.0%) | 0 (0.0%) |
| Transportation | 10 (100.0%) | 0 (0.0%) |
| Material Moving | 28 (100.0%) | 0 (0.0%) |
| Total (Category) | 38 (100.0%) | 0 (0.0%) |
| Total (Overall) | 102 (52.0%) | 94 (48.0%) |
Employment Industries by Sex in Rowes Run
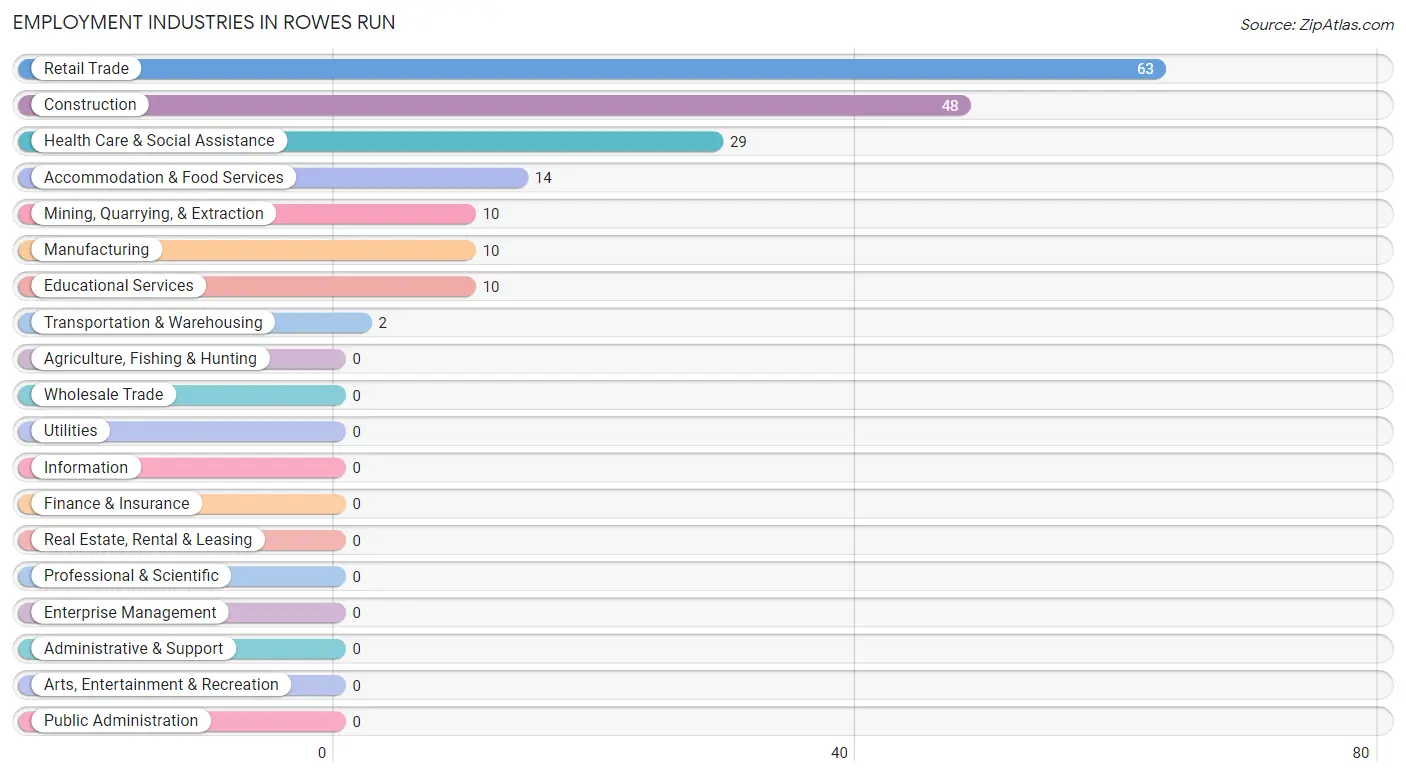
Employment Industries in Rowes Run
The major employment industries in Rowes Run include Retail Trade (63 | 32.1%), Construction (48 | 24.5%), Health Care & Social Assistance (29 | 14.8%), Accommodation & Food Services (14 | 7.1%), and Mining, Quarrying, & Extraction (10 | 5.1%).
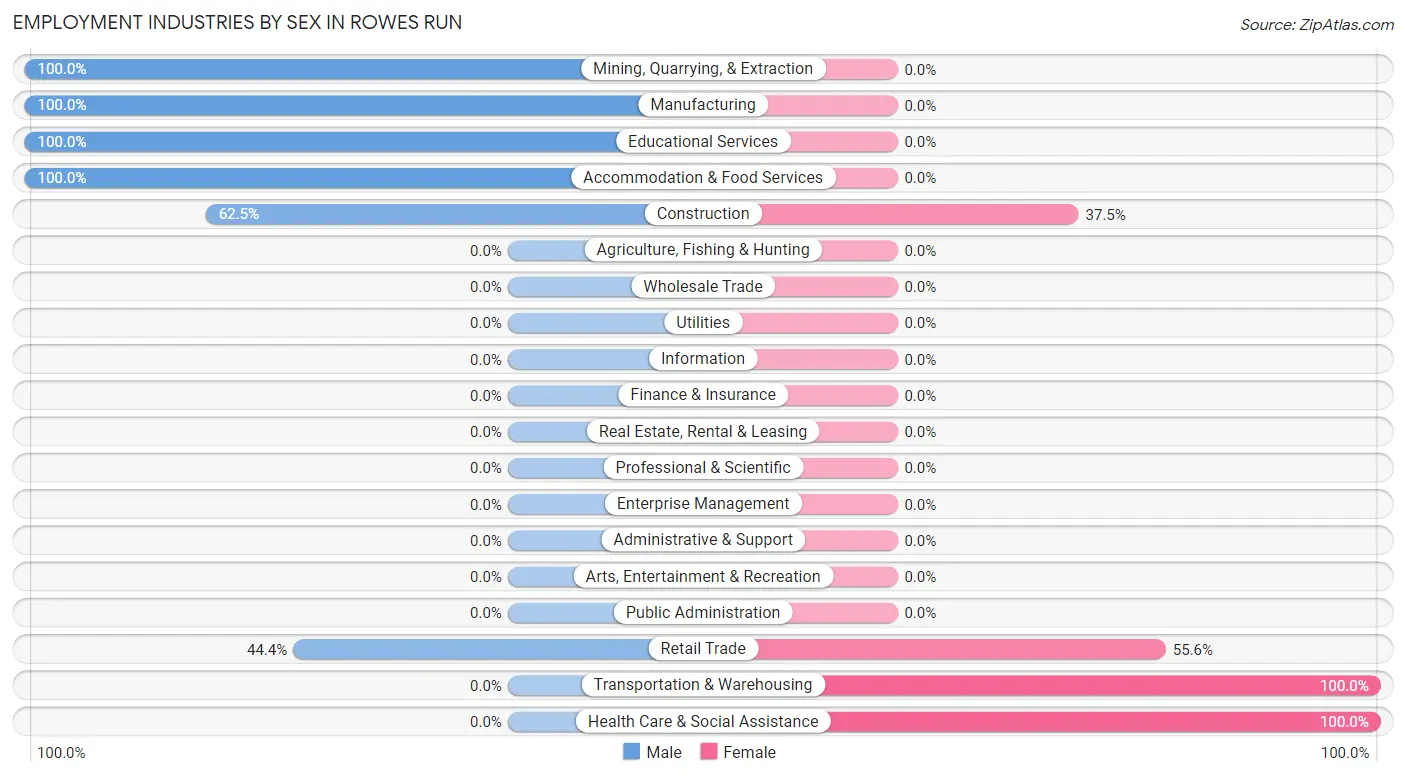
Employment Industries by Sex in Rowes Run
The Rowes Run industries that see more men than women are Mining, Quarrying, & Extraction (100.0%), Manufacturing (100.0%), and Educational Services (100.0%), whereas the industries that tend to have a higher number of women are Transportation & Warehousing (100.0%), Health Care & Social Assistance (100.0%), and Retail Trade (55.6%).
| Industry | Male | Female |
| Agriculture, Fishing & Hunting | 0 (0.0%) | 0 (0.0%) |
| Mining, Quarrying, & Extraction | 10 (100.0%) | 0 (0.0%) |
| Construction | 30 (62.5%) | 18 (37.5%) |
| Manufacturing | 10 (100.0%) | 0 (0.0%) |
| Wholesale Trade | 0 (0.0%) | 0 (0.0%) |
| Retail Trade | 28 (44.4%) | 35 (55.6%) |
| Transportation & Warehousing | 0 (0.0%) | 2 (100.0%) |
| Utilities | 0 (0.0%) | 0 (0.0%) |
| Information | 0 (0.0%) | 0 (0.0%) |
| Finance & Insurance | 0 (0.0%) | 0 (0.0%) |
| Real Estate, Rental & Leasing | 0 (0.0%) | 0 (0.0%) |
| Professional & Scientific | 0 (0.0%) | 0 (0.0%) |
| Enterprise Management | 0 (0.0%) | 0 (0.0%) |
| Administrative & Support | 0 (0.0%) | 0 (0.0%) |
| Educational Services | 10 (100.0%) | 0 (0.0%) |
| Health Care & Social Assistance | 0 (0.0%) | 29 (100.0%) |
| Arts, Entertainment & Recreation | 0 (0.0%) | 0 (0.0%) |
| Accommodation & Food Services | 14 (100.0%) | 0 (0.0%) |
| Public Administration | 0 (0.0%) | 0 (0.0%) |
| Total | 102 (52.0%) | 94 (48.0%) |
Education in Rowes Run
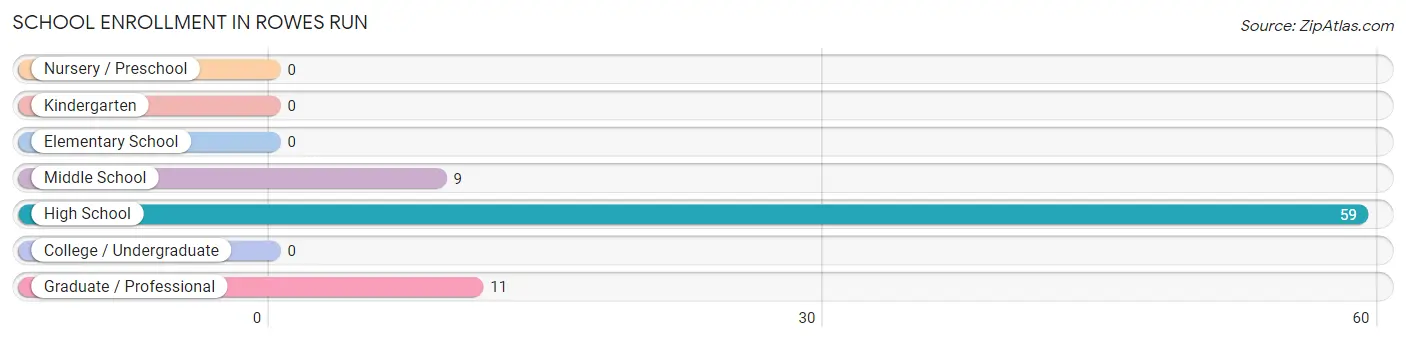
School Enrollment in Rowes Run
The most common levels of schooling among the 79 students in Rowes Run are high school (59 | 74.7%), graduate / professional (11 | 13.9%), and middle school (9 | 11.4%).
| School Level | # Students | % Students |
| Nursery / Preschool | 0 | 0.0% |
| Kindergarten | 0 | 0.0% |
| Elementary School | 0 | 0.0% |
| Middle School | 9 | 11.4% |
| High School | 59 | 74.7% |
| College / Undergraduate | 0 | 0.0% |
| Graduate / Professional | 11 | 13.9% |
| Total | 79 | 100.0% |
School Enrollment by Age by Funding Source in Rowes Run
Out of a total of 79 students who are enrolled in schools in Rowes Run, 9 (11.4%) attend a private institution, while the remaining 70 (88.6%) are enrolled in public schools. The age group of 10 to 14 year olds has the highest likelihood of being enrolled in private schools, with 9 (100.0% in the age bracket) enrolled. Conversely, the age group of 15 to 17 year olds has the lowest likelihood of being enrolled in a private school, with 42 (100.0% in the age bracket) attending a public institution.
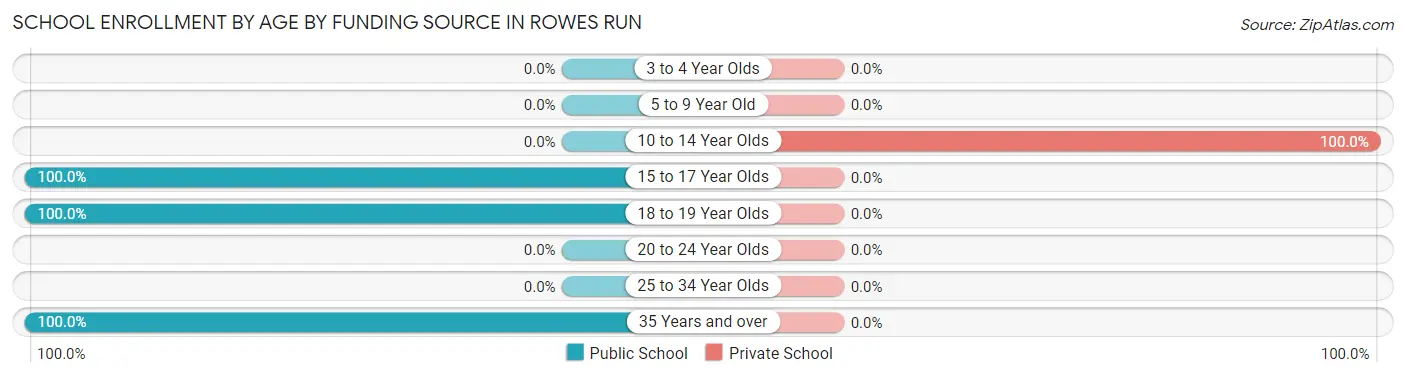
| Age Bracket | Public School | Private School |
| 3 to 4 Year Olds | 0 (0.0%) | 0 (0.0%) |
| 5 to 9 Year Old | 0 (0.0%) | 0 (0.0%) |
| 10 to 14 Year Olds | 0 (0.0%) | 9 (100.0%) |
| 15 to 17 Year Olds | 42 (100.0%) | 0 (0.0%) |
| 18 to 19 Year Olds | 17 (100.0%) | 0 (0.0%) |
| 20 to 24 Year Olds | 0 (0.0%) | 0 (0.0%) |
| 25 to 34 Year Olds | 0 (0.0%) | 0 (0.0%) |
| 35 Years and over | 11 (100.0%) | 0 (0.0%) |
| Total | 70 (88.6%) | 9 (11.4%) |
Educational Attainment by Field of Study in Rowes Run
Arts & humanities (11 | 27.5%), science & technology (10 | 25.0%), literature & languages (10 | 25.0%), and education (9 | 22.5%) are the most common fields of study among 40 individuals in Rowes Run who have obtained a bachelor's degree or higher.
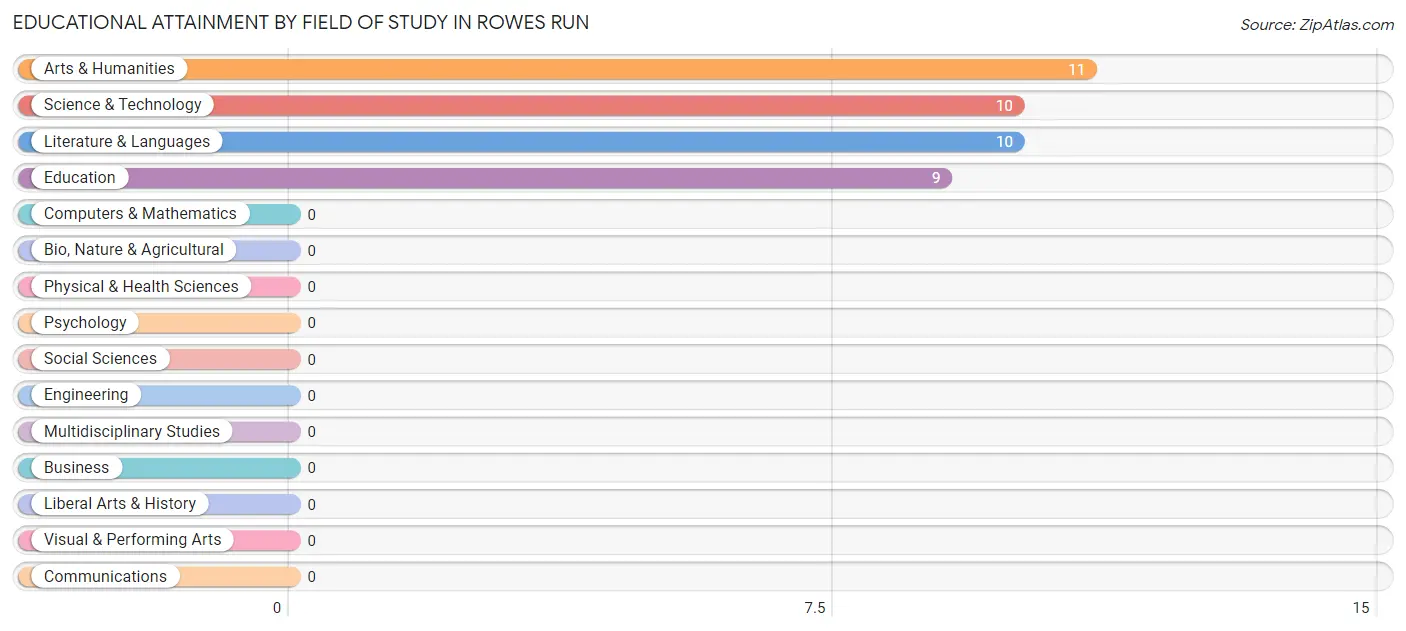
| Field of Study | # Graduates | % Graduates |
| Computers & Mathematics | 0 | 0.0% |
| Bio, Nature & Agricultural | 0 | 0.0% |
| Physical & Health Sciences | 0 | 0.0% |
| Psychology | 0 | 0.0% |
| Social Sciences | 0 | 0.0% |
| Engineering | 0 | 0.0% |
| Multidisciplinary Studies | 0 | 0.0% |
| Science & Technology | 10 | 25.0% |
| Business | 0 | 0.0% |
| Education | 9 | 22.5% |
| Literature & Languages | 10 | 25.0% |
| Liberal Arts & History | 0 | 0.0% |
| Visual & Performing Arts | 0 | 0.0% |
| Communications | 0 | 0.0% |
| Arts & Humanities | 11 | 27.5% |
| Total | 40 | 100.0% |
Transportation & Commute in Rowes Run
Vehicle Availability by Sex in Rowes Run
The most prevalent vehicle ownership categories in Rowes Run are males with 2 vehicles (79, accounting for 77.4%) and females with 2 vehicles (58, making up 84.0%).
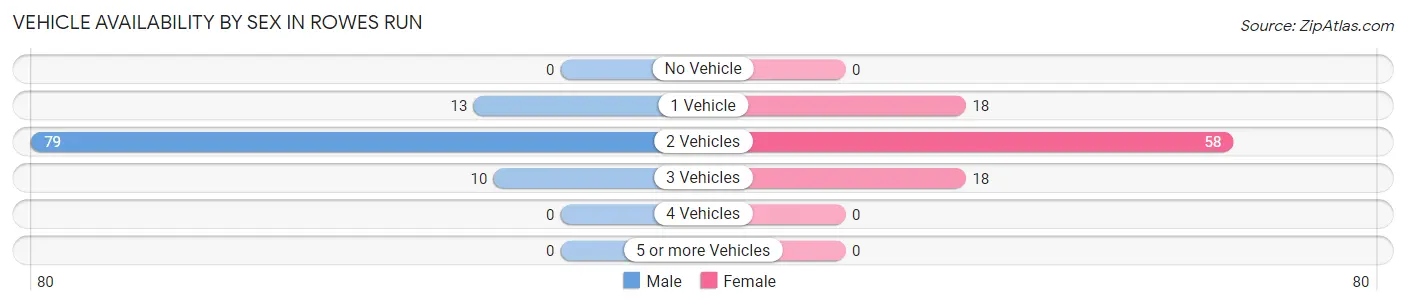
| Vehicles Available | Male | Female |
| No Vehicle | 0 (0.0%) | 0 (0.0%) |
| 1 Vehicle | 13 (12.8%) | 18 (19.2%) |
| 2 Vehicles | 79 (77.4%) | 58 (61.7%) |
| 3 Vehicles | 10 (9.8%) | 18 (19.2%) |
| 4 Vehicles | 0 (0.0%) | 0 (0.0%) |
| 5 or more Vehicles | 0 (0.0%) | 0 (0.0%) |
| Total | 102 (100.0%) | 94 (100.0%) |
Commute Time in Rowes Run
The most frequently occuring commute durations in Rowes Run are 15 to 19 minutes (54 commuters, 27.6%), 20 to 24 minutes (53 commuters, 27.0%), and 5 to 9 minutes (27 commuters, 13.8%).
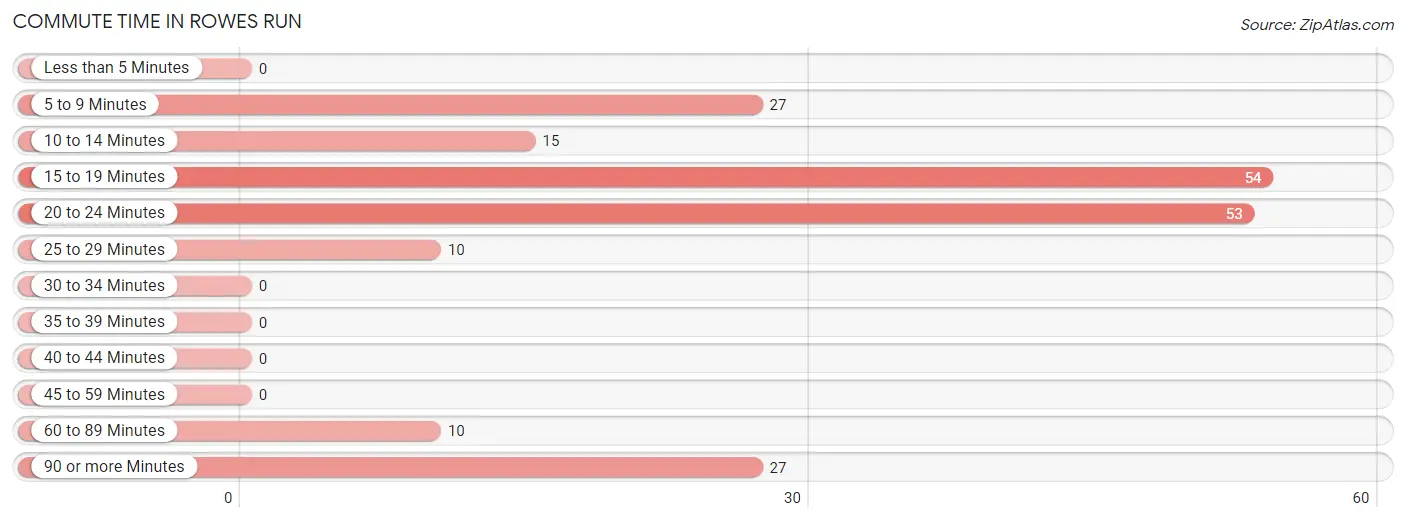
| Commute Time | # Commuters | % Commuters |
| Less than 5 Minutes | 0 | 0.0% |
| 5 to 9 Minutes | 27 | 13.8% |
| 10 to 14 Minutes | 15 | 7.6% |
| 15 to 19 Minutes | 54 | 27.6% |
| 20 to 24 Minutes | 53 | 27.0% |
| 25 to 29 Minutes | 10 | 5.1% |
| 30 to 34 Minutes | 0 | 0.0% |
| 35 to 39 Minutes | 0 | 0.0% |
| 40 to 44 Minutes | 0 | 0.0% |
| 45 to 59 Minutes | 0 | 0.0% |
| 60 to 89 Minutes | 10 | 5.1% |
| 90 or more Minutes | 27 | 13.8% |
Commute Time by Sex in Rowes Run
The most common commute times in Rowes Run are 20 to 24 minutes (42 commuters, 41.2%) for males and 15 to 19 minutes (44 commuters, 46.8%) for females.
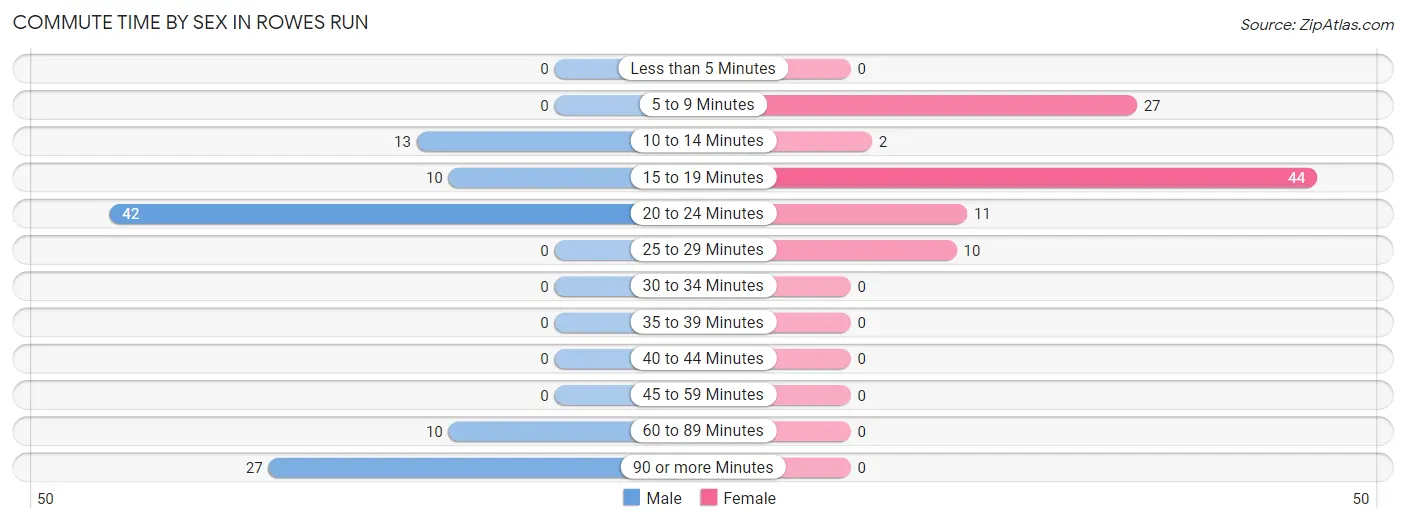
| Commute Time | Male | Female |
| Less than 5 Minutes | 0 (0.0%) | 0 (0.0%) |
| 5 to 9 Minutes | 0 (0.0%) | 27 (28.7%) |
| 10 to 14 Minutes | 13 (12.8%) | 2 (2.1%) |
| 15 to 19 Minutes | 10 (9.8%) | 44 (46.8%) |
| 20 to 24 Minutes | 42 (41.2%) | 11 (11.7%) |
| 25 to 29 Minutes | 0 (0.0%) | 10 (10.6%) |
| 30 to 34 Minutes | 0 (0.0%) | 0 (0.0%) |
| 35 to 39 Minutes | 0 (0.0%) | 0 (0.0%) |
| 40 to 44 Minutes | 0 (0.0%) | 0 (0.0%) |
| 45 to 59 Minutes | 0 (0.0%) | 0 (0.0%) |
| 60 to 89 Minutes | 10 (9.8%) | 0 (0.0%) |
| 90 or more Minutes | 27 (26.5%) | 0 (0.0%) |
Time of Departure to Work by Sex in Rowes Run
The most frequent times of departure to work in Rowes Run are 4:00 PM to 11:59 PM (38, 37.2%) for males and 8:30 AM to 8:59 AM (36, 38.3%) for females.
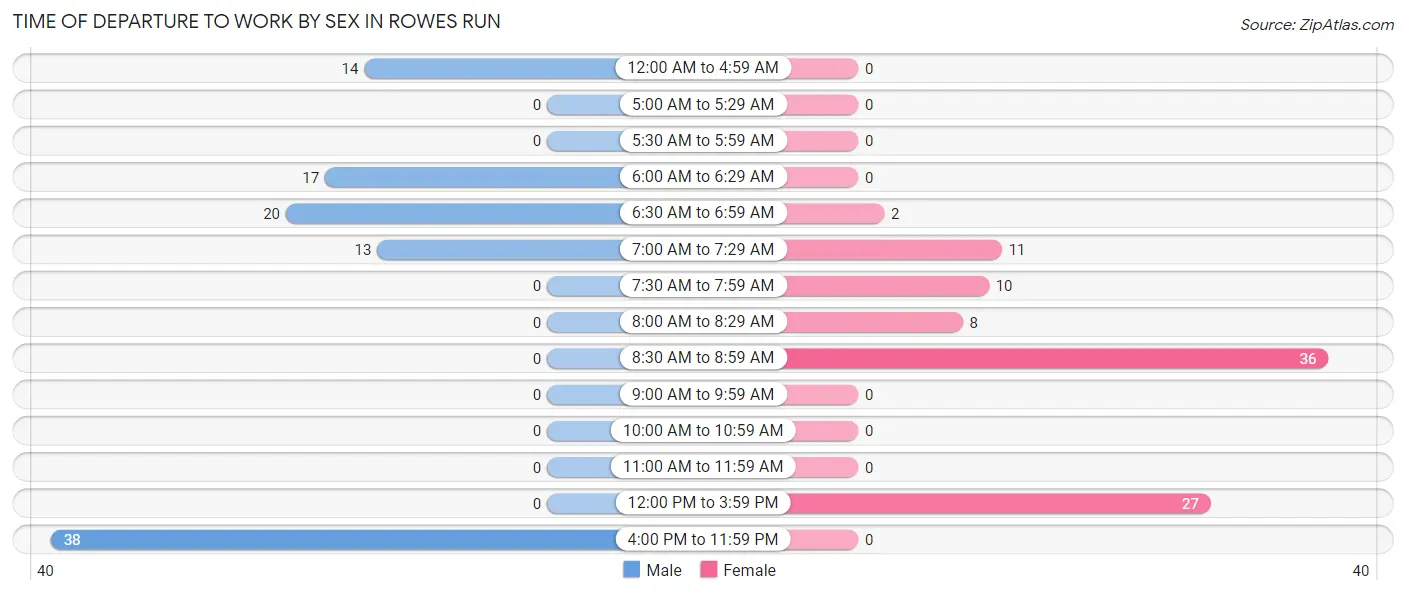
| Time of Departure | Male | Female |
| 12:00 AM to 4:59 AM | 14 (13.7%) | 0 (0.0%) |
| 5:00 AM to 5:29 AM | 0 (0.0%) | 0 (0.0%) |
| 5:30 AM to 5:59 AM | 0 (0.0%) | 0 (0.0%) |
| 6:00 AM to 6:29 AM | 17 (16.7%) | 0 (0.0%) |
| 6:30 AM to 6:59 AM | 20 (19.6%) | 2 (2.1%) |
| 7:00 AM to 7:29 AM | 13 (12.8%) | 11 (11.7%) |
| 7:30 AM to 7:59 AM | 0 (0.0%) | 10 (10.6%) |
| 8:00 AM to 8:29 AM | 0 (0.0%) | 8 (8.5%) |
| 8:30 AM to 8:59 AM | 0 (0.0%) | 36 (38.3%) |
| 9:00 AM to 9:59 AM | 0 (0.0%) | 0 (0.0%) |
| 10:00 AM to 10:59 AM | 0 (0.0%) | 0 (0.0%) |
| 11:00 AM to 11:59 AM | 0 (0.0%) | 0 (0.0%) |
| 12:00 PM to 3:59 PM | 0 (0.0%) | 27 (28.7%) |
| 4:00 PM to 11:59 PM | 38 (37.2%) | 0 (0.0%) |
| Total | 102 (100.0%) | 94 (100.0%) |
Housing Occupancy in Rowes Run
Occupancy by Ownership in Rowes Run
Of the total 200 dwellings in Rowes Run, owner-occupied units account for 181 (90.5%), while renter-occupied units make up 19 (9.5%).
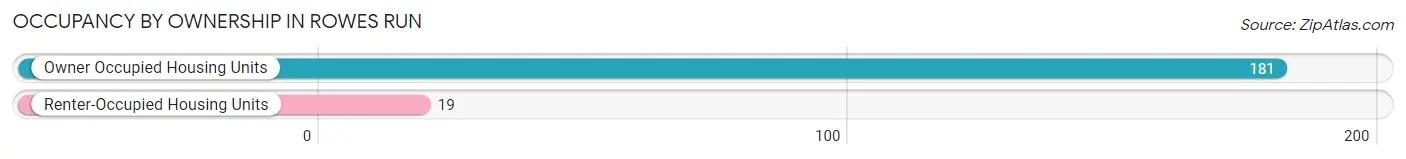
| Occupancy | # Housing Units | % Housing Units |
| Owner Occupied Housing Units | 181 | 90.5% |
| Renter-Occupied Housing Units | 19 | 9.5% |
| Total Occupied Housing Units | 200 | 100.0% |
Occupancy by Household Size in Rowes Run
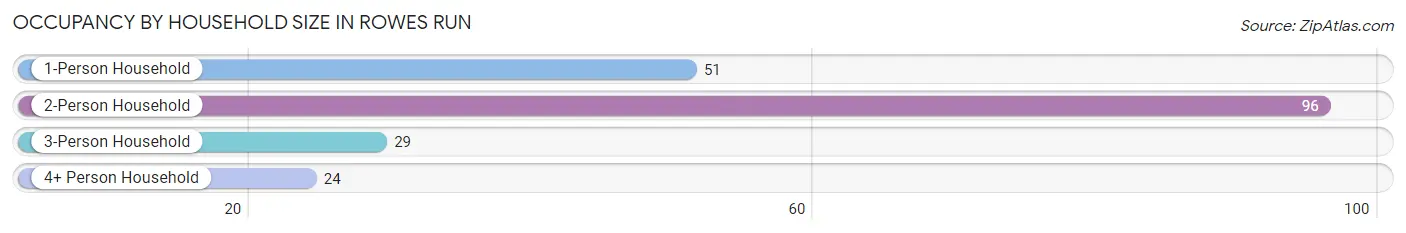
| Household Size | # Housing Units | % Housing Units |
| 1-Person Household | 51 | 25.5% |
| 2-Person Household | 96 | 48.0% |
| 3-Person Household | 29 | 14.5% |
| 4+ Person Household | 24 | 12.0% |
| Total Housing Units | 200 | 100.0% |
Occupancy by Ownership by Household Size in Rowes Run
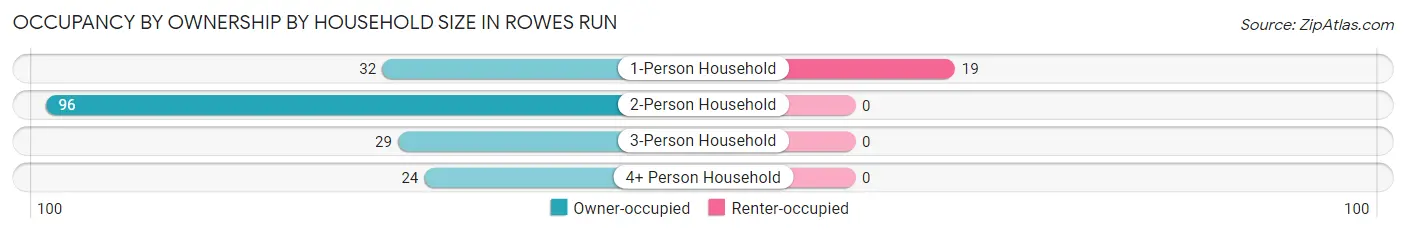
| Household Size | Owner-occupied | Renter-occupied |
| 1-Person Household | 32 (62.7%) | 19 (37.2%) |
| 2-Person Household | 96 (100.0%) | 0 (0.0%) |
| 3-Person Household | 29 (100.0%) | 0 (0.0%) |
| 4+ Person Household | 24 (100.0%) | 0 (0.0%) |
| Total Housing Units | 181 (90.5%) | 19 (9.5%) |
Occupancy by Educational Attainment in Rowes Run
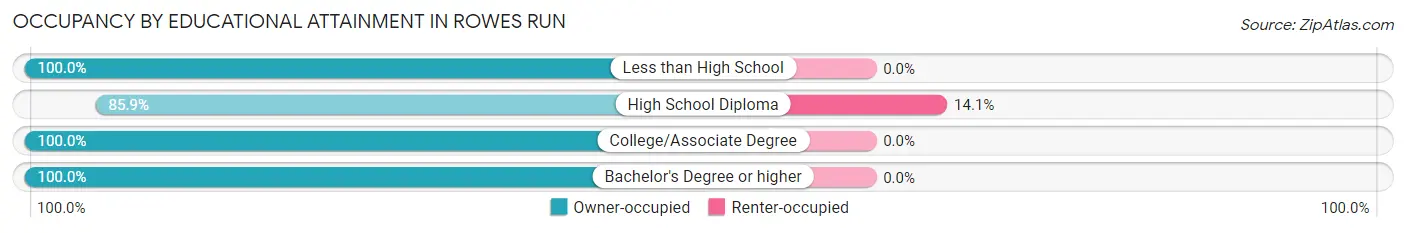
| Household Size | Owner-occupied | Renter-occupied |
| Less than High School | 12 (100.0%) | 0 (0.0%) |
| High School Diploma | 116 (85.9%) | 19 (14.1%) |
| College/Associate Degree | 33 (100.0%) | 0 (0.0%) |
| Bachelor's Degree or higher | 20 (100.0%) | 0 (0.0%) |
Occupancy by Age of Householder in Rowes Run
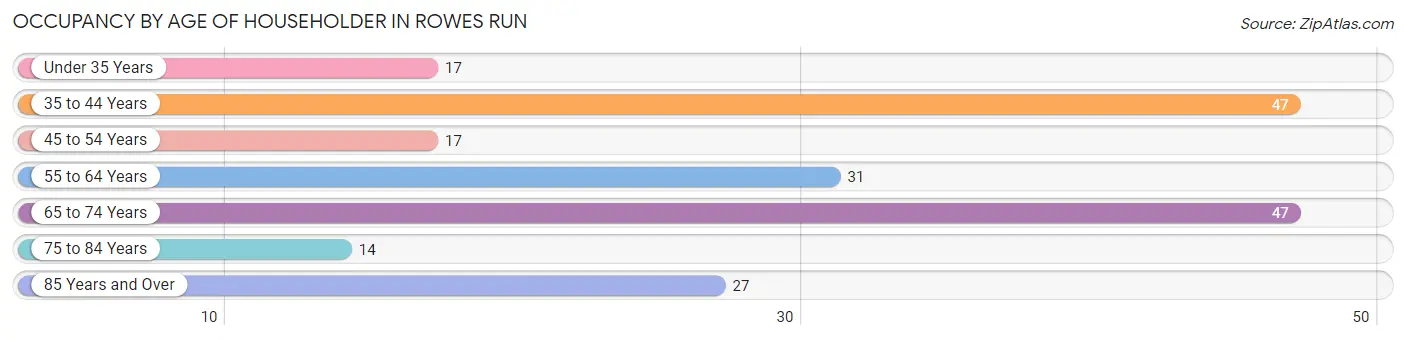
| Age Bracket | # Households | % Households |
| Under 35 Years | 17 | 8.5% |
| 35 to 44 Years | 47 | 23.5% |
| 45 to 54 Years | 17 | 8.5% |
| 55 to 64 Years | 31 | 15.5% |
| 65 to 74 Years | 47 | 23.5% |
| 75 to 84 Years | 14 | 7.0% |
| 85 Years and Over | 27 | 13.5% |
| Total | 200 | 100.0% |
Housing Finances in Rowes Run
Median Income by Occupancy in Rowes Run
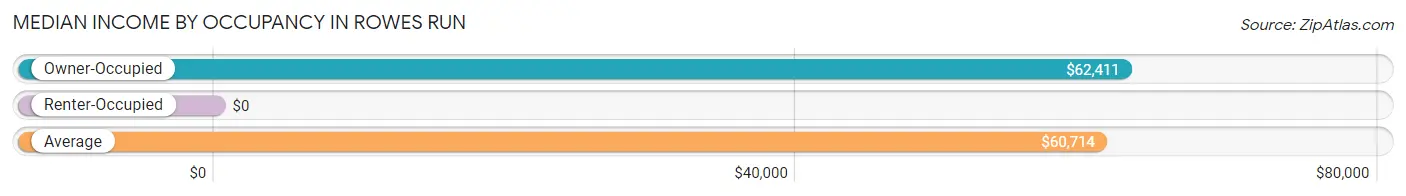
| Occupancy Type | # Households | Median Income |
| Owner-Occupied | 181 (90.5%) | $62,411 |
| Renter-Occupied | 19 (9.5%) | $0 |
| Average | 200 (100.0%) | $60,714 |
Occupancy by Householder Income Bracket in Rowes Run
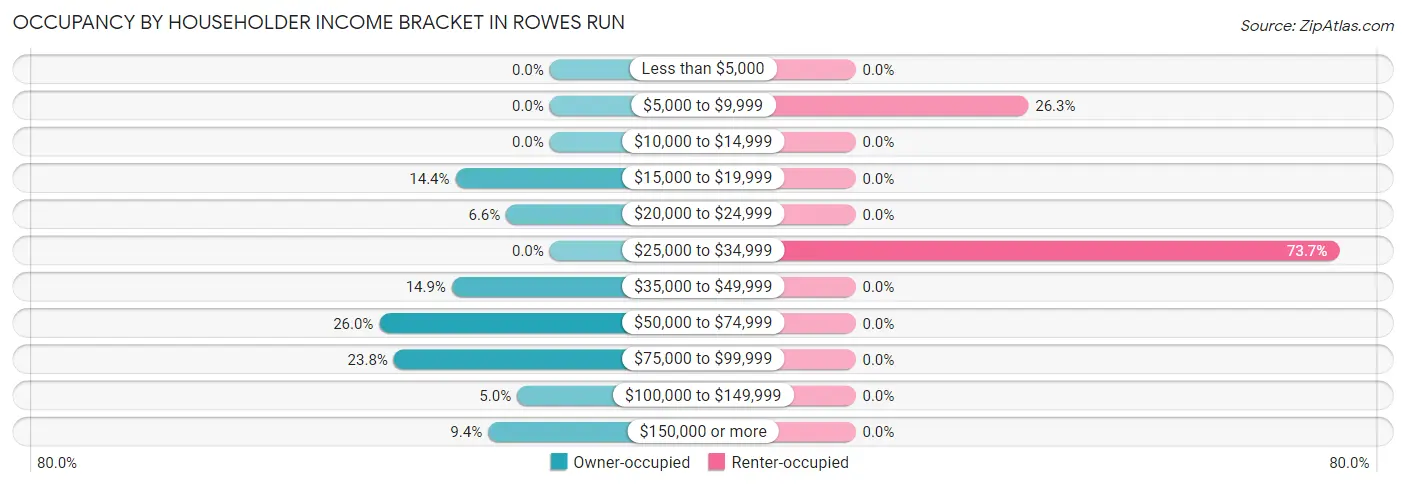
| Income Bracket | Owner-occupied | Renter-occupied |
| Less than $5,000 | 0 (0.0%) | 0 (0.0%) |
| $5,000 to $9,999 | 0 (0.0%) | 5 (26.3%) |
| $10,000 to $14,999 | 0 (0.0%) | 0 (0.0%) |
| $15,000 to $19,999 | 26 (14.4%) | 0 (0.0%) |
| $20,000 to $24,999 | 12 (6.6%) | 0 (0.0%) |
| $25,000 to $34,999 | 0 (0.0%) | 14 (73.7%) |
| $35,000 to $49,999 | 27 (14.9%) | 0 (0.0%) |
| $50,000 to $74,999 | 47 (26.0%) | 0 (0.0%) |
| $75,000 to $99,999 | 43 (23.8%) | 0 (0.0%) |
| $100,000 to $149,999 | 9 (5.0%) | 0 (0.0%) |
| $150,000 or more | 17 (9.4%) | 0 (0.0%) |
| Total | 181 (100.0%) | 19 (100.0%) |
Monthly Housing Cost Tiers in Rowes Run
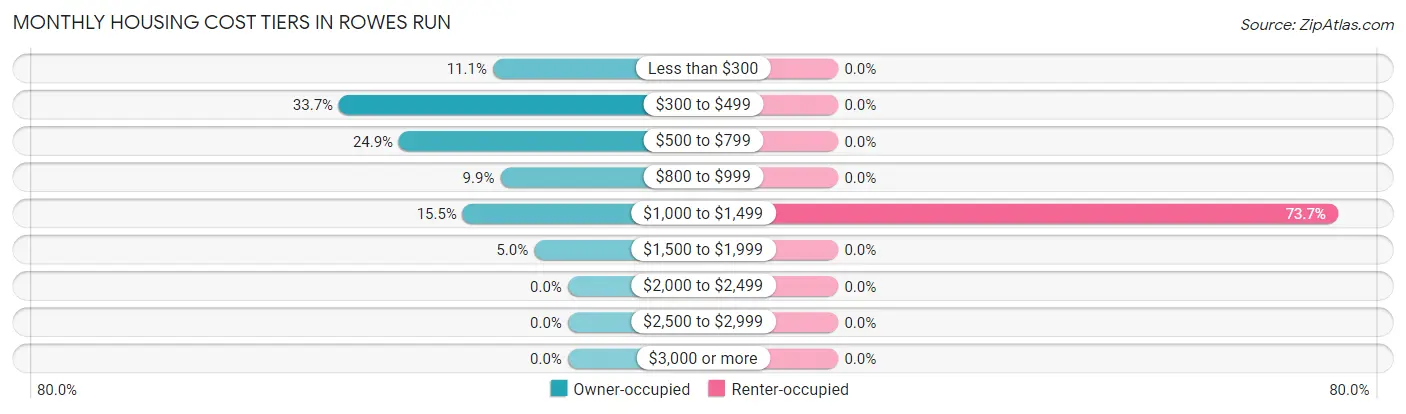
| Monthly Cost | Owner-occupied | Renter-occupied |
| Less than $300 | 20 (11.1%) | 0 (0.0%) |
| $300 to $499 | 61 (33.7%) | 0 (0.0%) |
| $500 to $799 | 45 (24.9%) | 0 (0.0%) |
| $800 to $999 | 18 (9.9%) | 0 (0.0%) |
| $1,000 to $1,499 | 28 (15.5%) | 14 (73.7%) |
| $1,500 to $1,999 | 9 (5.0%) | 0 (0.0%) |
| $2,000 to $2,499 | 0 (0.0%) | 0 (0.0%) |
| $2,500 to $2,999 | 0 (0.0%) | 0 (0.0%) |
| $3,000 or more | 0 (0.0%) | 0 (0.0%) |
| Total | 181 (100.0%) | 19 (100.0%) |
Physical Housing Characteristics in Rowes Run
Housing Structures in Rowes Run
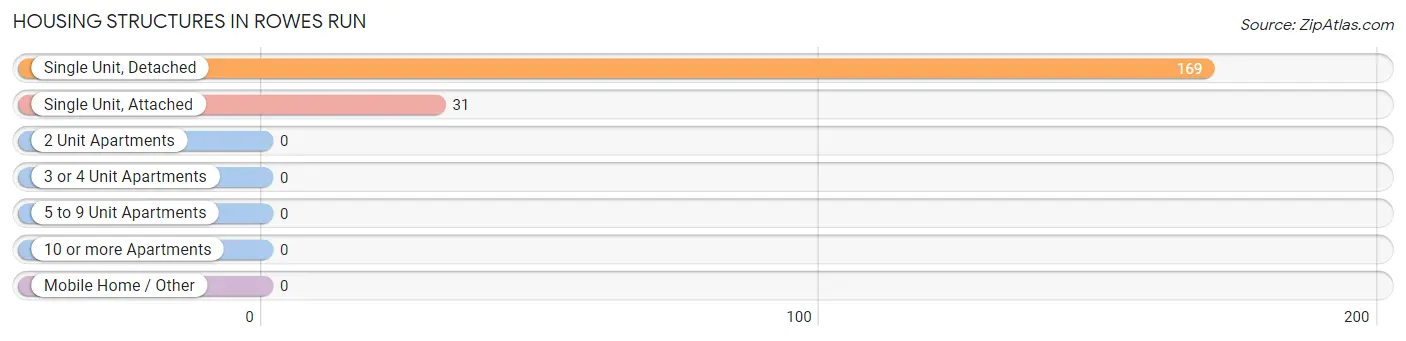
| Structure Type | # Housing Units | % Housing Units |
| Single Unit, Detached | 169 | 84.5% |
| Single Unit, Attached | 31 | 15.5% |
| 2 Unit Apartments | 0 | 0.0% |
| 3 or 4 Unit Apartments | 0 | 0.0% |
| 5 to 9 Unit Apartments | 0 | 0.0% |
| 10 or more Apartments | 0 | 0.0% |
| Mobile Home / Other | 0 | 0.0% |
| Total | 200 | 100.0% |
Housing Structures by Occupancy in Rowes Run
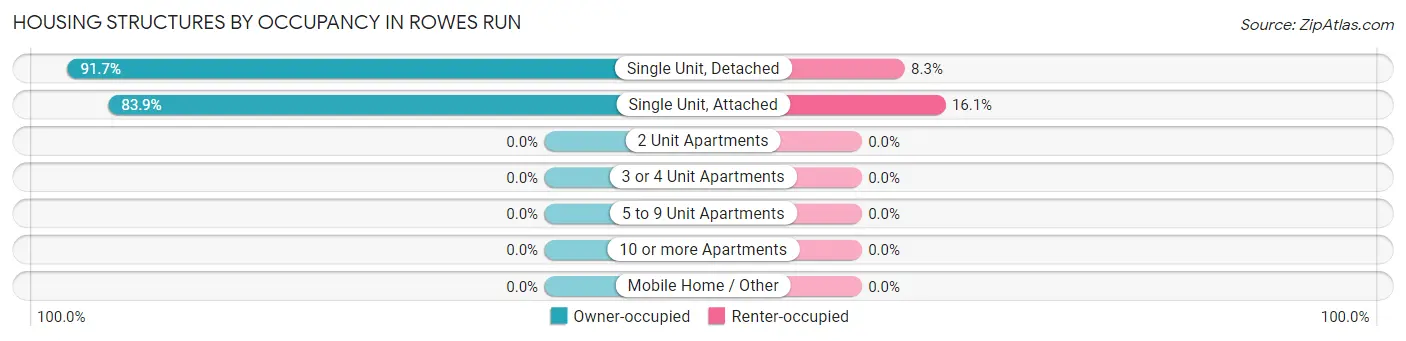
| Structure Type | Owner-occupied | Renter-occupied |
| Single Unit, Detached | 155 (91.7%) | 14 (8.3%) |
| Single Unit, Attached | 26 (83.9%) | 5 (16.1%) |
| 2 Unit Apartments | 0 (0.0%) | 0 (0.0%) |
| 3 or 4 Unit Apartments | 0 (0.0%) | 0 (0.0%) |
| 5 to 9 Unit Apartments | 0 (0.0%) | 0 (0.0%) |
| 10 or more Apartments | 0 (0.0%) | 0 (0.0%) |
| Mobile Home / Other | 0 (0.0%) | 0 (0.0%) |
| Total | 181 (90.5%) | 19 (9.5%) |
Housing Structures by Number of Rooms in Rowes Run
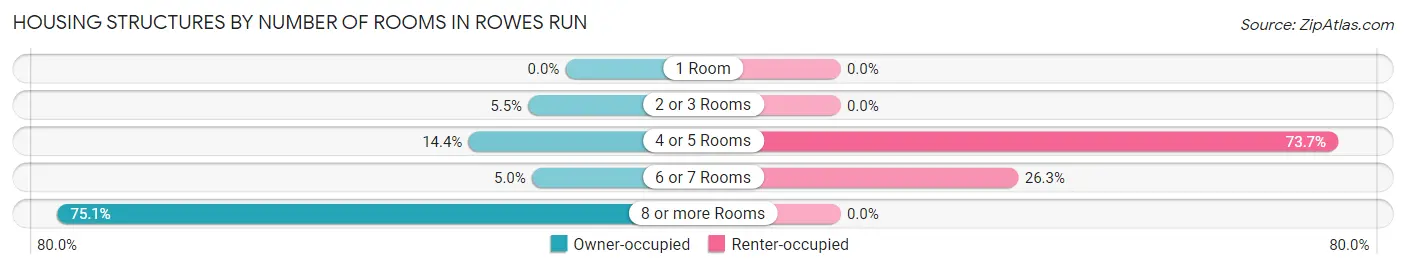
| Number of Rooms | Owner-occupied | Renter-occupied |
| 1 Room | 0 (0.0%) | 0 (0.0%) |
| 2 or 3 Rooms | 10 (5.5%) | 0 (0.0%) |
| 4 or 5 Rooms | 26 (14.4%) | 14 (73.7%) |
| 6 or 7 Rooms | 9 (5.0%) | 5 (26.3%) |
| 8 or more Rooms | 136 (75.1%) | 0 (0.0%) |
| Total | 181 (100.0%) | 19 (100.0%) |
Housing Structure by Heating Type in Rowes Run
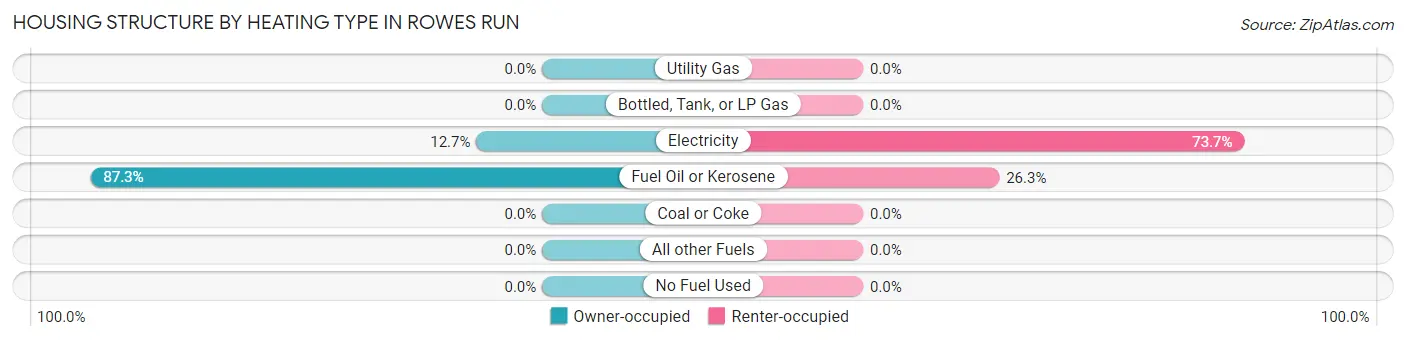
| Heating Type | Owner-occupied | Renter-occupied |
| Utility Gas | 0 (0.0%) | 0 (0.0%) |
| Bottled, Tank, or LP Gas | 0 (0.0%) | 0 (0.0%) |
| Electricity | 23 (12.7%) | 14 (73.7%) |
| Fuel Oil or Kerosene | 158 (87.3%) | 5 (26.3%) |
| Coal or Coke | 0 (0.0%) | 0 (0.0%) |
| All other Fuels | 0 (0.0%) | 0 (0.0%) |
| No Fuel Used | 0 (0.0%) | 0 (0.0%) |
| Total | 181 (100.0%) | 19 (100.0%) |
Household Vehicle Usage in Rowes Run
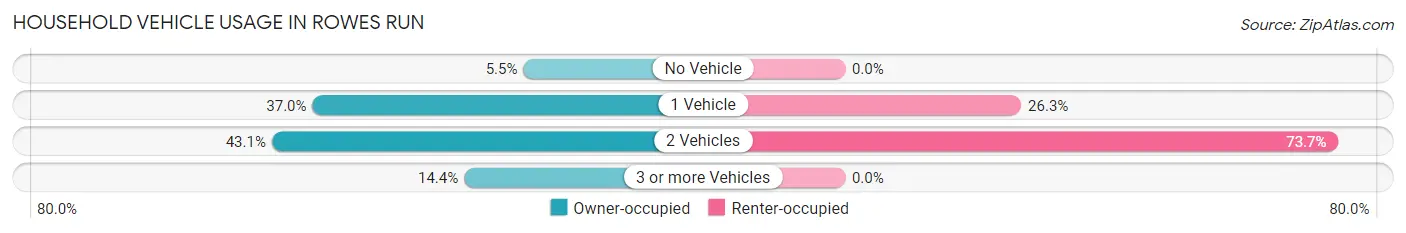
| Vehicles per Household | Owner-occupied | Renter-occupied |
| No Vehicle | 10 (5.5%) | 0 (0.0%) |
| 1 Vehicle | 67 (37.0%) | 5 (26.3%) |
| 2 Vehicles | 78 (43.1%) | 14 (73.7%) |
| 3 or more Vehicles | 26 (14.4%) | 0 (0.0%) |
| Total | 181 (100.0%) | 19 (100.0%) |
Real Estate & Mortgages in Rowes Run
Real Estate and Mortgage Overview in Rowes Run
| Characteristic | Without Mortgage | With Mortgage |
| Housing Units | 110 | 71 |
| Median Property Value | $55,000 | $81,400 |
| Median Household Income | $39,630 | $17 |
| Monthly Housing Costs | $447 | $0 |
| Real Estate Taxes | $865 | $0 |
Property Value by Mortgage Status in Rowes Run
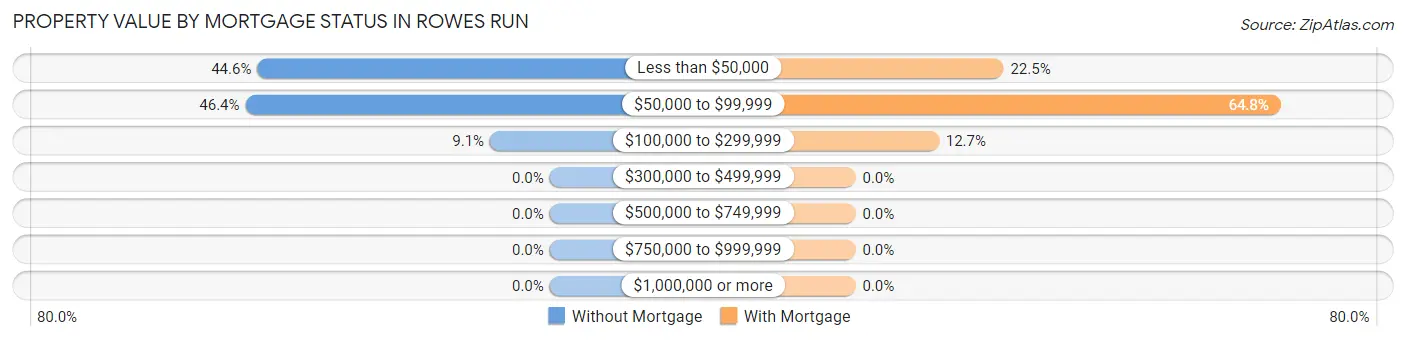
| Property Value | Without Mortgage | With Mortgage |
| Less than $50,000 | 49 (44.6%) | 16 (22.5%) |
| $50,000 to $99,999 | 51 (46.4%) | 46 (64.8%) |
| $100,000 to $299,999 | 10 (9.1%) | 9 (12.7%) |
| $300,000 to $499,999 | 0 (0.0%) | 0 (0.0%) |
| $500,000 to $749,999 | 0 (0.0%) | 0 (0.0%) |
| $750,000 to $999,999 | 0 (0.0%) | 0 (0.0%) |
| $1,000,000 or more | 0 (0.0%) | 0 (0.0%) |
| Total | 110 (100.0%) | 71 (100.0%) |
Household Income by Mortgage Status in Rowes Run
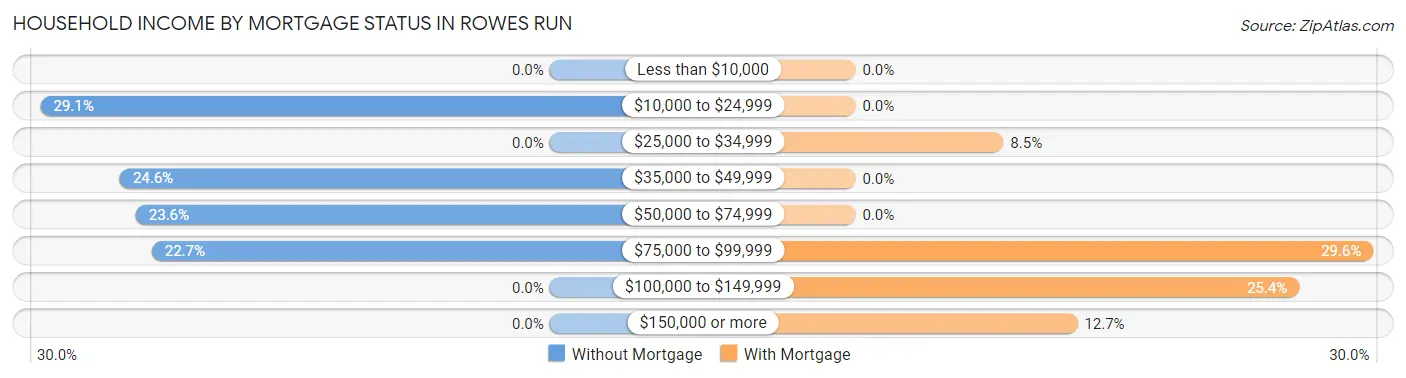
| Household Income | Without Mortgage | With Mortgage |
| Less than $10,000 | 0 (0.0%) | 0 (0.0%) |
| $10,000 to $24,999 | 32 (29.1%) | 0 (0.0%) |
| $25,000 to $34,999 | 0 (0.0%) | 6 (8.5%) |
| $35,000 to $49,999 | 27 (24.5%) | 0 (0.0%) |
| $50,000 to $74,999 | 26 (23.6%) | 0 (0.0%) |
| $75,000 to $99,999 | 25 (22.7%) | 21 (29.6%) |
| $100,000 to $149,999 | 0 (0.0%) | 18 (25.4%) |
| $150,000 or more | 0 (0.0%) | 9 (12.7%) |
| Total | 110 (100.0%) | 71 (100.0%) |
Property Value to Household Income Ratio in Rowes Run
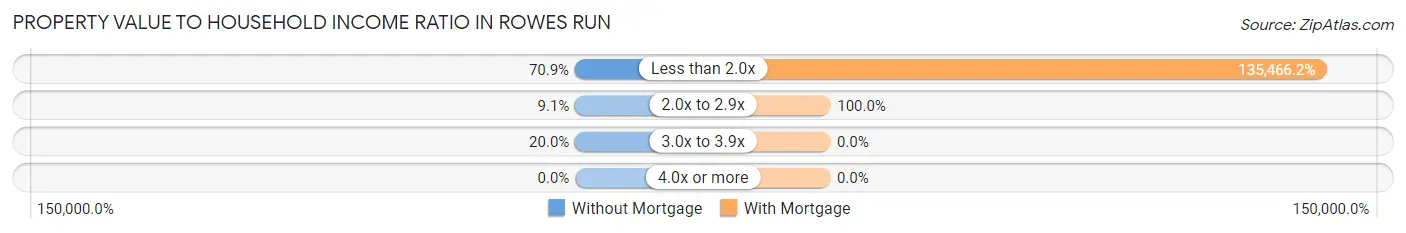
| Value-to-Income Ratio | Without Mortgage | With Mortgage |
| Less than 2.0x | 78 (70.9%) | 96,181 (135,466.2%) |
| 2.0x to 2.9x | 10 (9.1%) | 71 (100.0%) |
| 3.0x to 3.9x | 22 (20.0%) | 0 (0.0%) |
| 4.0x or more | 0 (0.0%) | 0 (0.0%) |
| Total | 110 (100.0%) | 71 (100.0%) |
Real Estate Taxes by Mortgage Status in Rowes Run
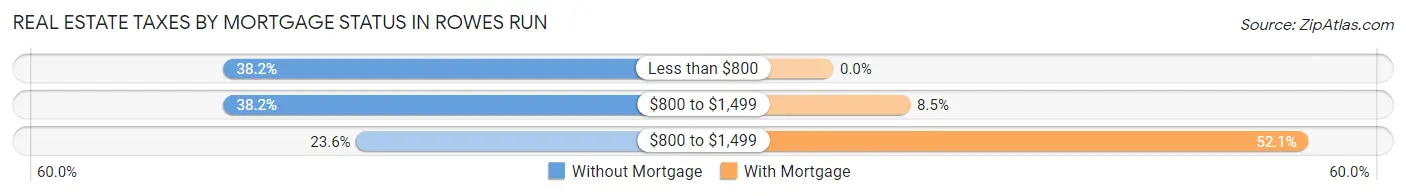
| Property Taxes | Without Mortgage | With Mortgage |
| Less than $800 | 42 (38.2%) | 0 (0.0%) |
| $800 to $1,499 | 42 (38.2%) | 6 (8.5%) |
| $800 to $1,499 | 26 (23.6%) | 37 (52.1%) |
| Total | 110 (100.0%) | 71 (100.0%) |
Health & Disability in Rowes Run
Health Insurance Coverage by Age in Rowes Run
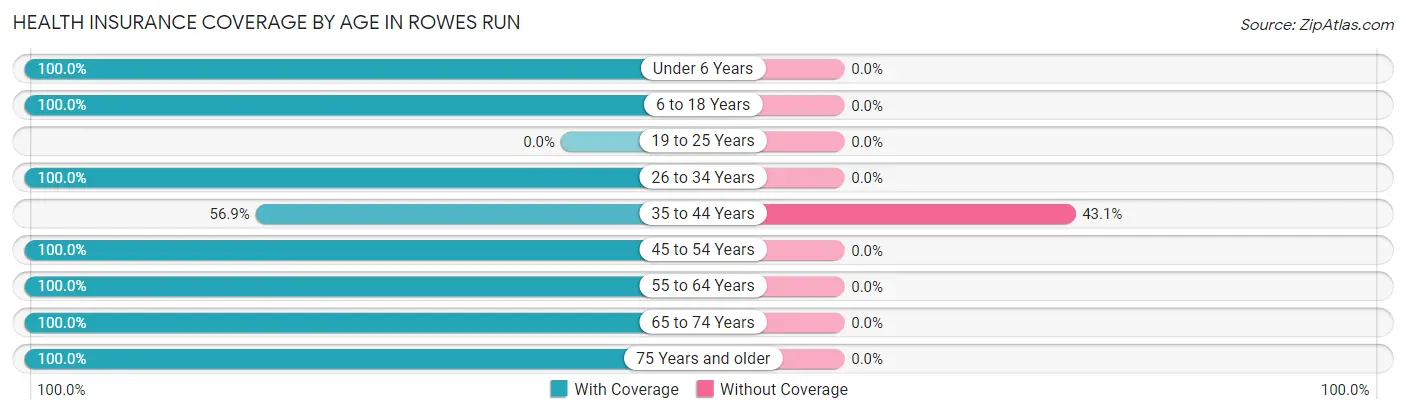
| Age Bracket | With Coverage | Without Coverage |
| Under 6 Years | 12 (100.0%) | 0 (0.0%) |
| 6 to 18 Years | 76 (100.0%) | 0 (0.0%) |
| 19 to 25 Years | 0 (0.0%) | 0 (0.0%) |
| 26 to 34 Years | 72 (100.0%) | 0 (0.0%) |
| 35 to 44 Years | 41 (56.9%) | 31 (43.1%) |
| 45 to 54 Years | 37 (100.0%) | 0 (0.0%) |
| 55 to 64 Years | 62 (100.0%) | 0 (0.0%) |
| 65 to 74 Years | 60 (100.0%) | 0 (0.0%) |
| 75 Years and older | 41 (100.0%) | 0 (0.0%) |
| Total | 401 (92.8%) | 31 (7.2%) |
Health Insurance Coverage by Citizenship Status in Rowes Run
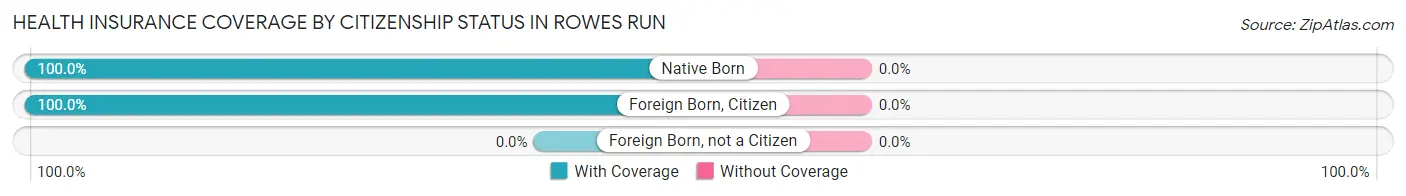
| Citizenship Status | With Coverage | Without Coverage |
| Native Born | 12 (100.0%) | 0 (0.0%) |
| Foreign Born, Citizen | 76 (100.0%) | 0 (0.0%) |
| Foreign Born, not a Citizen | 0 (0.0%) | 0 (0.0%) |
Health Insurance Coverage by Household Income in Rowes Run
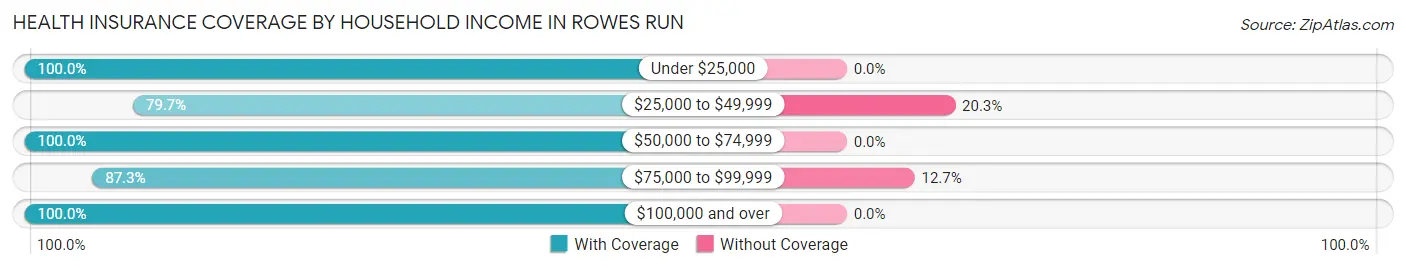
| Household Income | With Coverage | Without Coverage |
| Under $25,000 | 66 (100.0%) | 0 (0.0%) |
| $25,000 to $49,999 | 55 (79.7%) | 14 (20.3%) |
| $50,000 to $74,999 | 100 (100.0%) | 0 (0.0%) |
| $75,000 to $99,999 | 117 (87.3%) | 17 (12.7%) |
| $100,000 and over | 63 (100.0%) | 0 (0.0%) |
Public vs Private Health Insurance Coverage by Age in Rowes Run
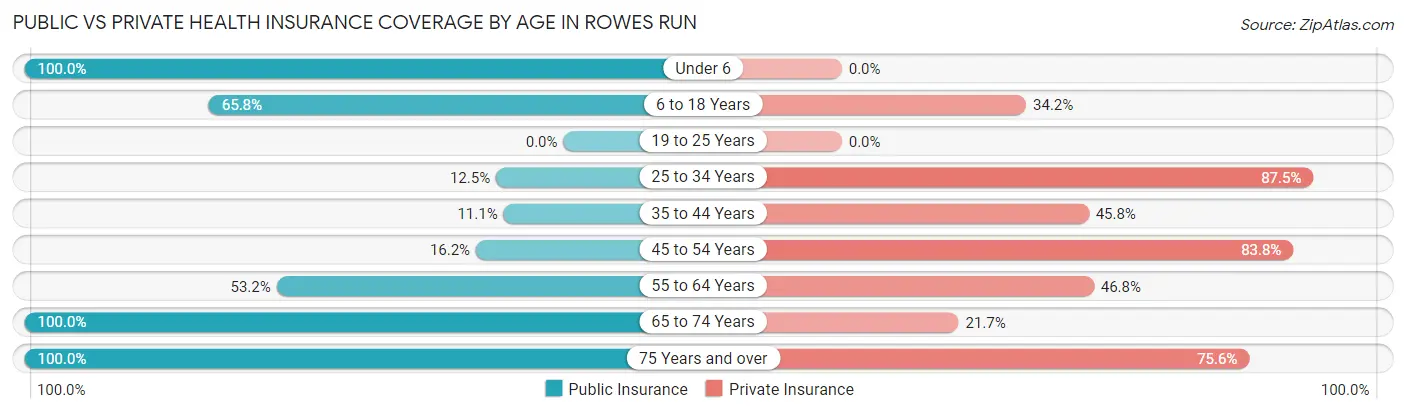
| Age Bracket | Public Insurance | Private Insurance |
| Under 6 | 12 (100.0%) | 0 (0.0%) |
| 6 to 18 Years | 50 (65.8%) | 26 (34.2%) |
| 19 to 25 Years | 0 (0.0%) | 0 (0.0%) |
| 25 to 34 Years | 9 (12.5%) | 63 (87.5%) |
| 35 to 44 Years | 8 (11.1%) | 33 (45.8%) |
| 45 to 54 Years | 6 (16.2%) | 31 (83.8%) |
| 55 to 64 Years | 33 (53.2%) | 29 (46.8%) |
| 65 to 74 Years | 60 (100.0%) | 13 (21.7%) |
| 75 Years and over | 41 (100.0%) | 31 (75.6%) |
| Total | 219 (50.7%) | 226 (52.3%) |
Disability Status by Sex by Age in Rowes Run
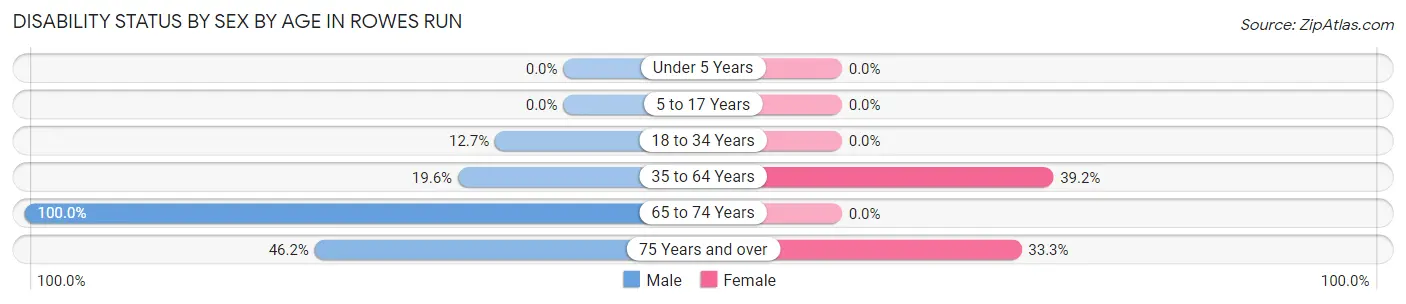
| Age Bracket | Male | Female |
| Under 5 Years | 0 (0.0%) | 0 (0.0%) |
| 5 to 17 Years | 0 (0.0%) | 0 (0.0%) |
| 18 to 34 Years | 9 (12.7%) | 0 (0.0%) |
| 35 to 64 Years | 18 (19.6%) | 31 (39.2%) |
| 65 to 74 Years | 10 (100.0%) | 0 (0.0%) |
| 75 Years and over | 12 (46.2%) | 5 (33.3%) |
Disability Class by Sex by Age in Rowes Run
Disability Class: Hearing Difficulty
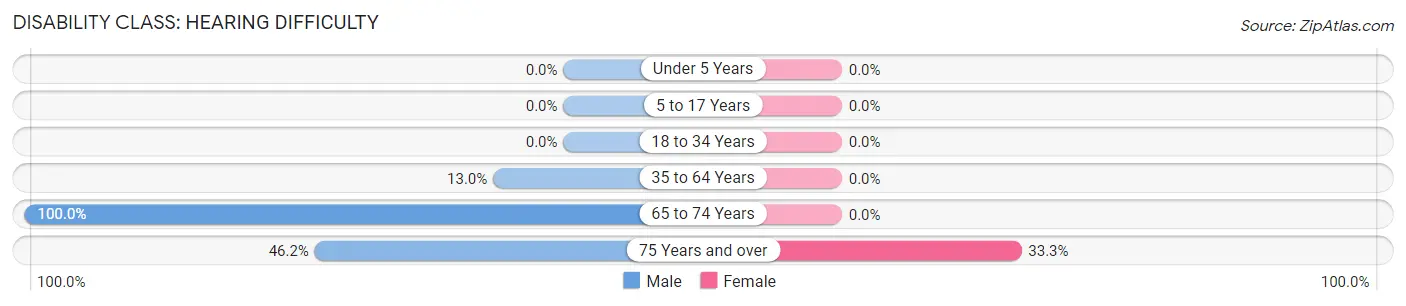
| Age Bracket | Male | Female |
| Under 5 Years | 0 (0.0%) | 0 (0.0%) |
| 5 to 17 Years | 0 (0.0%) | 0 (0.0%) |
| 18 to 34 Years | 0 (0.0%) | 0 (0.0%) |
| 35 to 64 Years | 12 (13.0%) | 0 (0.0%) |
| 65 to 74 Years | 10 (100.0%) | 0 (0.0%) |
| 75 Years and over | 12 (46.2%) | 5 (33.3%) |
Disability Class: Vision Difficulty
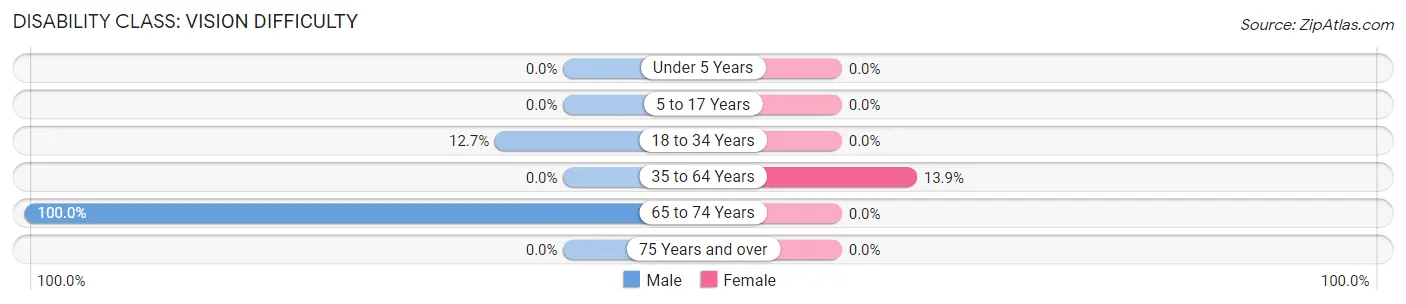
| Age Bracket | Male | Female |
| Under 5 Years | 0 (0.0%) | 0 (0.0%) |
| 5 to 17 Years | 0 (0.0%) | 0 (0.0%) |
| 18 to 34 Years | 9 (12.7%) | 0 (0.0%) |
| 35 to 64 Years | 0 (0.0%) | 11 (13.9%) |
| 65 to 74 Years | 10 (100.0%) | 0 (0.0%) |
| 75 Years and over | 0 (0.0%) | 0 (0.0%) |
Disability Class: Cognitive Difficulty
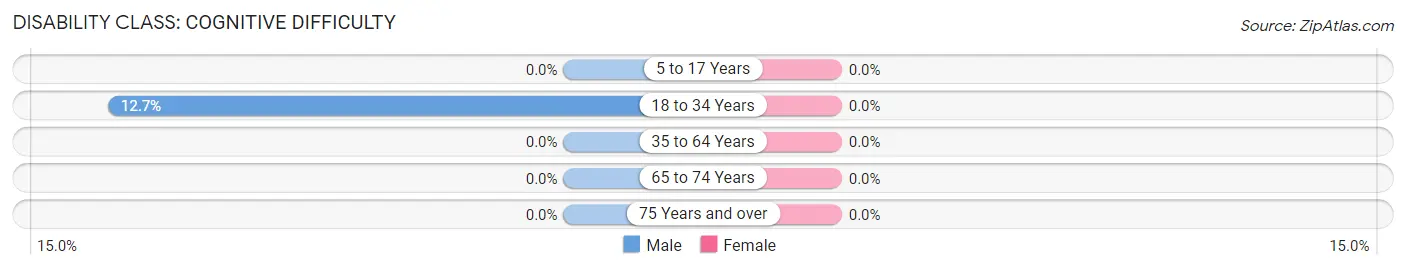
| Age Bracket | Male | Female |
| 5 to 17 Years | 0 (0.0%) | 0 (0.0%) |
| 18 to 34 Years | 9 (12.7%) | 0 (0.0%) |
| 35 to 64 Years | 0 (0.0%) | 0 (0.0%) |
| 65 to 74 Years | 0 (0.0%) | 0 (0.0%) |
| 75 Years and over | 0 (0.0%) | 0 (0.0%) |
Disability Class: Ambulatory Difficulty
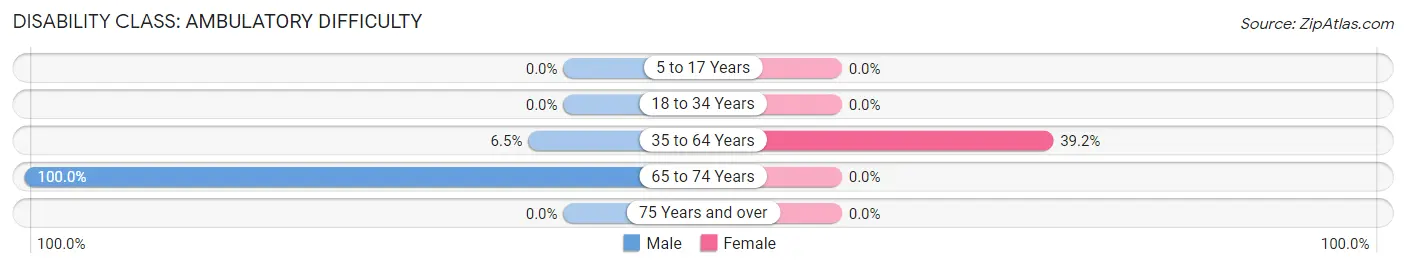
| Age Bracket | Male | Female |
| 5 to 17 Years | 0 (0.0%) | 0 (0.0%) |
| 18 to 34 Years | 0 (0.0%) | 0 (0.0%) |
| 35 to 64 Years | 6 (6.5%) | 31 (39.2%) |
| 65 to 74 Years | 10 (100.0%) | 0 (0.0%) |
| 75 Years and over | 0 (0.0%) | 0 (0.0%) |
Disability Class: Self-Care Difficulty
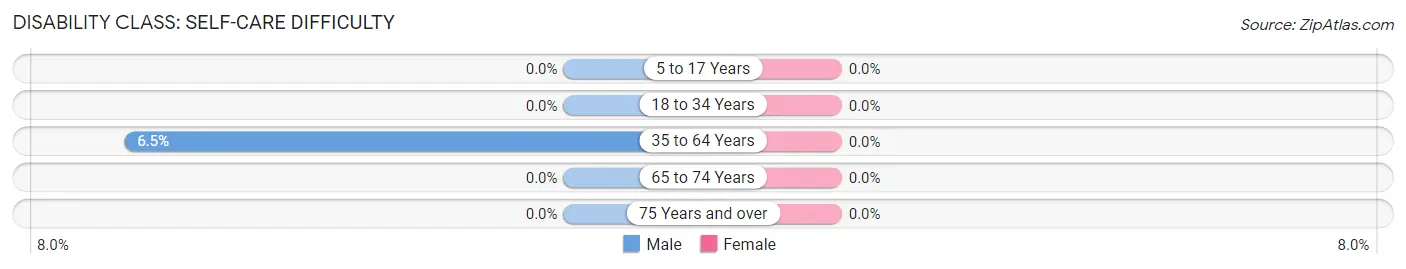
| Age Bracket | Male | Female |
| 5 to 17 Years | 0 (0.0%) | 0 (0.0%) |
| 18 to 34 Years | 0 (0.0%) | 0 (0.0%) |
| 35 to 64 Years | 6 (6.5%) | 0 (0.0%) |
| 65 to 74 Years | 0 (0.0%) | 0 (0.0%) |
| 75 Years and over | 0 (0.0%) | 0 (0.0%) |
Technology Access in Rowes Run
Computing Device Access in Rowes Run
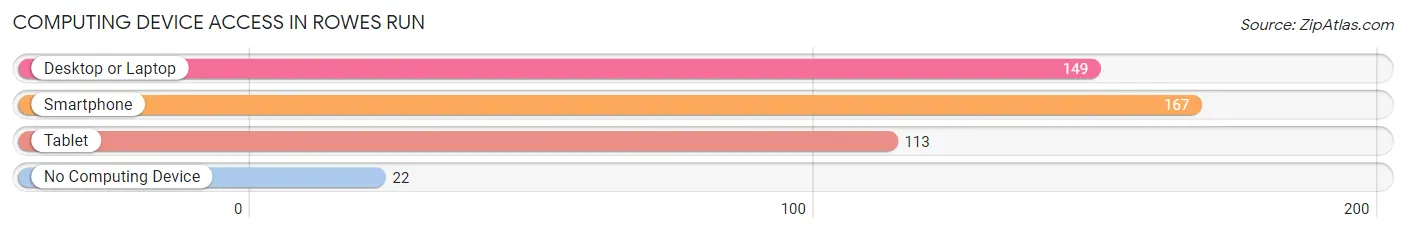
| Device Type | # Households | % Households |
| Desktop or Laptop | 149 | 74.5% |
| Smartphone | 167 | 83.5% |
| Tablet | 113 | 56.5% |
| No Computing Device | 22 | 11.0% |
| Total | 200 | 100.0% |
Internet Access in Rowes Run
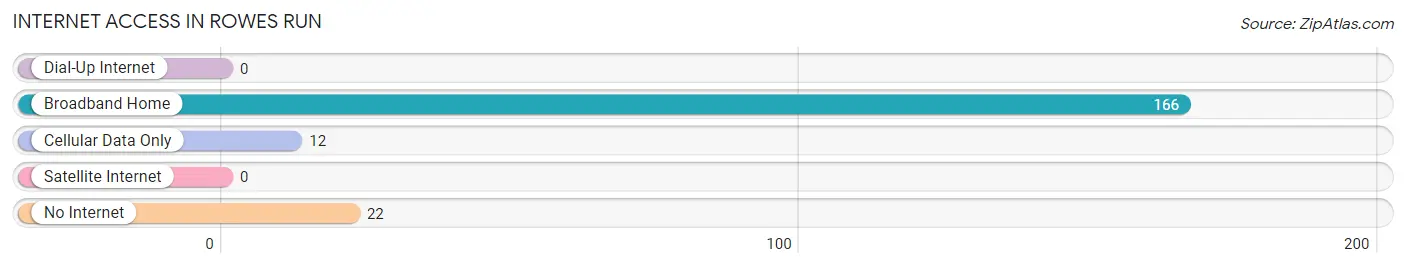
| Internet Type | # Households | % Households |
| Dial-Up Internet | 0 | 0.0% |
| Broadband Home | 166 | 83.0% |
| Cellular Data Only | 12 | 6.0% |
| Satellite Internet | 0 | 0.0% |
| No Internet | 22 | 11.0% |
| Total | 200 | 100.0% |
Rowes Run Summary
Rowes Run is a small unincorporated community located in Allegheny County, Pennsylvania. It is situated in the South Hills of Pittsburgh, approximately 10 miles south of the city. The community is bordered by the boroughs of Bethel Park and South Park, as well as the townships of Upper St. Clair and Peters.
History
Rowes Run was first settled in the late 1700s by the Rowe family, who were of German descent. The family owned a large tract of land in the area, which was used for farming and timber production. The Rowe family also operated a grist mill and a saw mill on the property.
In the early 1800s, the area was known as Rowe’s Run, and the Rowe family continued to own and operate the mills until the late 1800s. In the late 1800s, the area was renamed Rowes Run.
The community was primarily an agricultural area until the early 1900s, when the population began to grow. The population growth was due to the development of the nearby boroughs of Bethel Park and South Park, as well as the townships of Upper St. Clair and Peters.
Geography
Rowes Run is located in the South Hills of Pittsburgh, approximately 10 miles south of the city. The community is bordered by the boroughs of Bethel Park and South Park, as well as the townships of Upper St. Clair and Peters.
The area is characterized by rolling hills and valleys, with the highest elevation being approximately 1,000 feet above sea level. The area is also home to several creeks, including Rowes Run, which flows through the community.
Economy
Rowes Run is primarily a residential community, with most of the residents commuting to nearby Pittsburgh for work. The community does not have any major employers, but there are several small businesses located in the area.
The primary industries in the area are retail, healthcare, and education. The largest employers in the area are the University of Pittsburgh Medical Center, the South Hills School District, and the South Hills Village Mall.
Demographics
As of the 2010 census, the population of Rowes Run was 1,845. The racial makeup of the community was 94.3% White, 2.2% African American, 0.3% Native American, 1.2% Asian, and 1.9% from other races.
The median household income in the community was $50,945, and the median family income was $60,945. The per capita income was $25,945. The poverty rate was 8.3%.
Conclusion
Rowes Run is a small unincorporated community located in Allegheny County, Pennsylvania. It is situated in the South Hills of Pittsburgh, approximately 10 miles south of the city. The community is primarily a residential area, with most of the residents commuting to nearby Pittsburgh for work. The primary industries in the area are retail, healthcare, and education. As of the 2010 census, the population of Rowes Run was 1,845. The median household income in the community was $50,945, and the median family income was $60,945. The per capita income was $25,945. The poverty rate was 8.3%.
Common Questions
What is Per Capita Income in Rowes Run?
Per Capita income in Rowes Run is $29,820.
What is the Median Family Income in Rowes Run?
Median Family Income in Rowes Run is $78,125.
What is the Median Household income in Rowes Run?
Median Household Income in Rowes Run is $60,714.
What is Inequality or Gini Index in Rowes Run?
Inequality or Gini Index in Rowes Run is 0.35.
What is the Total Population of Rowes Run?
Total Population of Rowes Run is 432.
What is the Total Male Population of Rowes Run?
Total Male Population of Rowes Run is 224.
What is the Total Female Population of Rowes Run?
Total Female Population of Rowes Run is 208.
What is the Ratio of Males per 100 Females in Rowes Run?
There are 107.69 Males per 100 Females in Rowes Run.
What is the Ratio of Females per 100 Males in Rowes Run?
There are 92.86 Females per 100 Males in Rowes Run.
What is the Median Population Age in Rowes Run?
Median Population Age in Rowes Run is 43.4 Years.
What is the Average Family Size in Rowes Run
Average Family Size in Rowes Run is 2.5 People.
What is the Average Household Size in Rowes Run
Average Household Size in Rowes Run is 2.2 People.
How Large is the Labor Force in Rowes Run?
There are 222 People in the Labor Forcein in Rowes Run.
What is the Percentage of People in the Labor Force in Rowes Run?
59.0% of People are in the Labor Force in Rowes Run.
What is the Unemployment Rate in Rowes Run?
Unemployment Rate in Rowes Run is 11.7%.