Lake Arthur Estates, PA Map & Demographics
Lake Arthur Estates Map
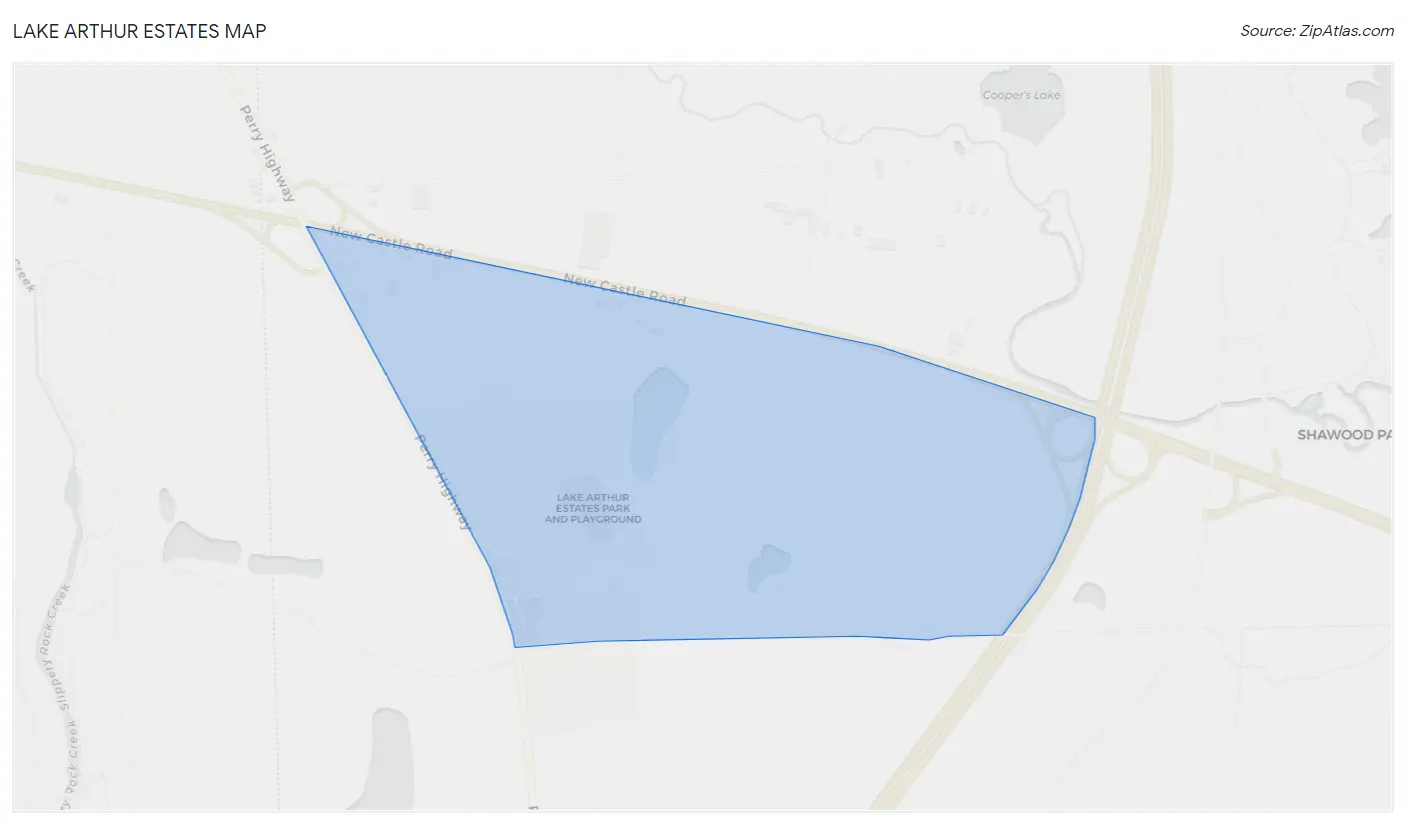
Lake Arthur Estates Overview
$27,911
PER CAPITA INCOME
$60,446
AVG FAMILY INCOME
$39,420
AVG HOUSEHOLD INCOME
44.1%
WAGE / INCOME GAP [ % ]
55.9¢/ $1
WAGE / INCOME GAP [ $ ]
0.39
INEQUALITY / GINI INDEX
479
TOTAL POPULATION
243
MALE POPULATION
236
FEMALE POPULATION
102.97
MALES / 100 FEMALES
97.12
FEMALES / 100 MALES
39.6
MEDIAN AGE
3.0
AVG FAMILY SIZE
2.0
AVG HOUSEHOLD SIZE
269
LABOR FORCE [ PEOPLE ]
71.2%
PERCENT IN LABOR FORCE
Income in Lake Arthur Estates
Income Overview in Lake Arthur Estates
Per Capita Income in Lake Arthur Estates is $27,911, while median incomes of families and households are $60,446 and $39,420 respectively.
| Characteristic | Number | Measure |
| Per Capita Income | 479 | $27,911 |
| Median Family Income | 113 | $60,446 |
| Mean Family Income | 113 | $76,142 |
| Median Household Income | 239 | $39,420 |
| Mean Household Income | 239 | $54,259 |
| Income Deficit | 113 | $0 |
| Wage / Income Gap (%) | 479 | 44.14% |
| Wage / Income Gap ($) | 479 | 55.86¢ per $1 |
| Gini / Inequality Index | 479 | 0.39 |
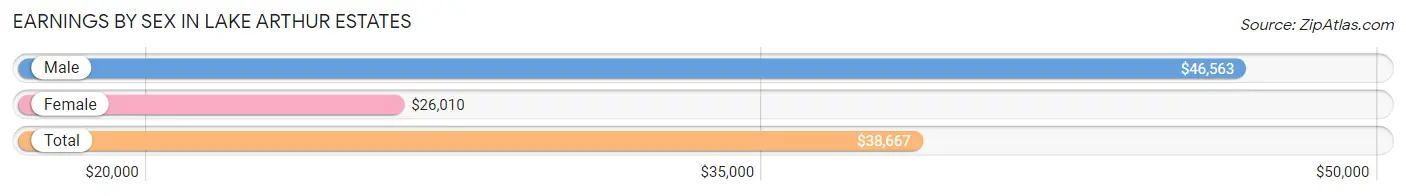
Earnings by Sex in Lake Arthur Estates
Average Earnings in Lake Arthur Estates are $38,667, $46,563 for men and $26,010 for women, a difference of 44.1%.
| Sex | Number | Average Earnings |
| Male | 137 (50.0%) | $46,563 |
| Female | 137 (50.0%) | $26,010 |
| Total | 274 (100.0%) | $38,667 |
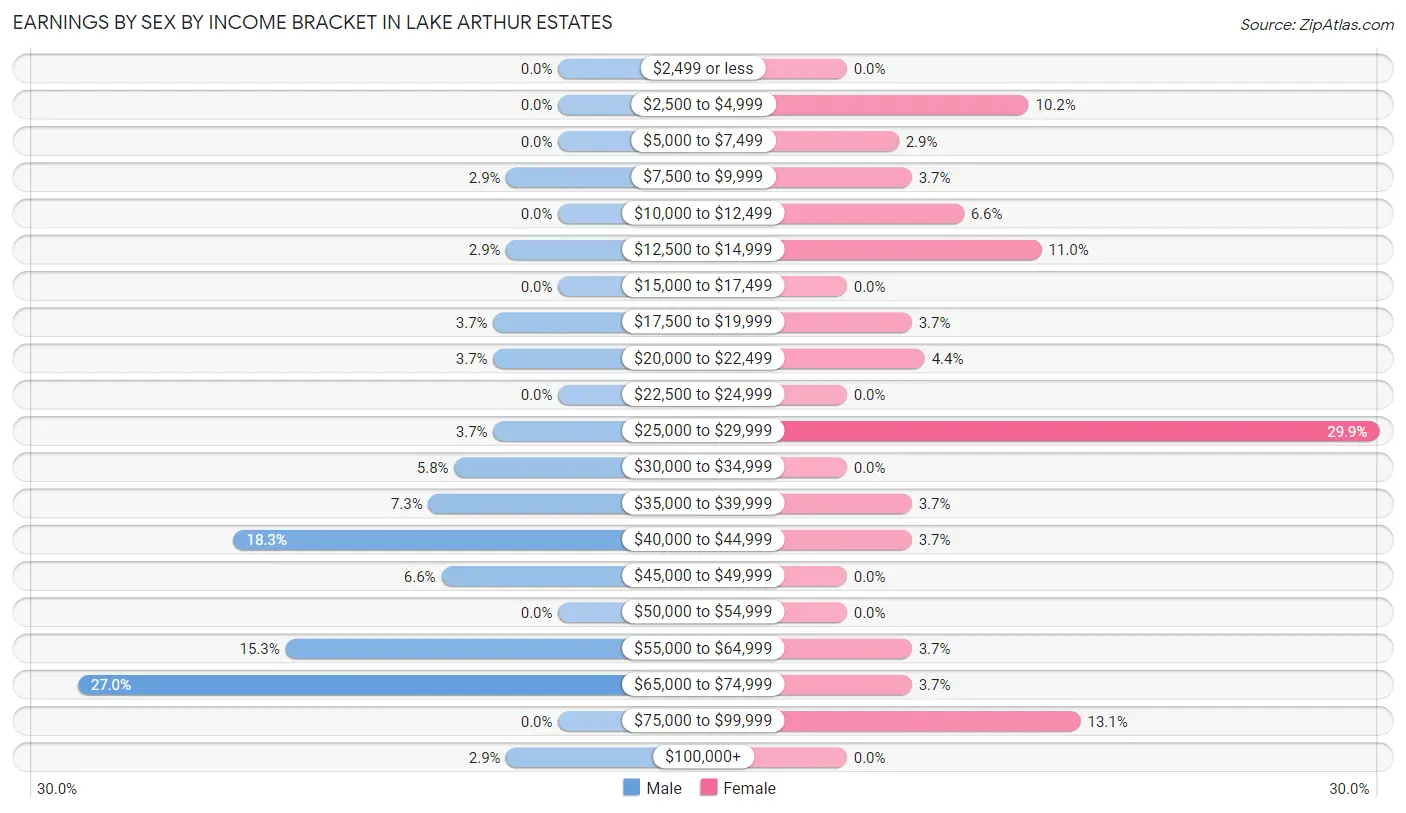
Earnings by Sex by Income Bracket in Lake Arthur Estates
The most common earnings brackets in Lake Arthur Estates are $65,000 to $74,999 for men (37 | 27.0%) and $25,000 to $29,999 for women (41 | 29.9%).
| Income | Male | Female |
| $2,499 or less | 0 (0.0%) | 0 (0.0%) |
| $2,500 to $4,999 | 0 (0.0%) | 14 (10.2%) |
| $5,000 to $7,499 | 0 (0.0%) | 4 (2.9%) |
| $7,500 to $9,999 | 4 (2.9%) | 5 (3.6%) |
| $10,000 to $12,499 | 0 (0.0%) | 9 (6.6%) |
| $12,500 to $14,999 | 4 (2.9%) | 15 (11.0%) |
| $15,000 to $17,499 | 0 (0.0%) | 0 (0.0%) |
| $17,500 to $19,999 | 5 (3.6%) | 5 (3.6%) |
| $20,000 to $22,499 | 5 (3.6%) | 6 (4.4%) |
| $22,500 to $24,999 | 0 (0.0%) | 0 (0.0%) |
| $25,000 to $29,999 | 5 (3.6%) | 41 (29.9%) |
| $30,000 to $34,999 | 8 (5.8%) | 0 (0.0%) |
| $35,000 to $39,999 | 10 (7.3%) | 5 (3.6%) |
| $40,000 to $44,999 | 25 (18.2%) | 5 (3.6%) |
| $45,000 to $49,999 | 9 (6.6%) | 0 (0.0%) |
| $50,000 to $54,999 | 0 (0.0%) | 0 (0.0%) |
| $55,000 to $64,999 | 21 (15.3%) | 5 (3.6%) |
| $65,000 to $74,999 | 37 (27.0%) | 5 (3.6%) |
| $75,000 to $99,999 | 0 (0.0%) | 18 (13.1%) |
| $100,000+ | 4 (2.9%) | 0 (0.0%) |
| Total | 137 (100.0%) | 137 (100.0%) |
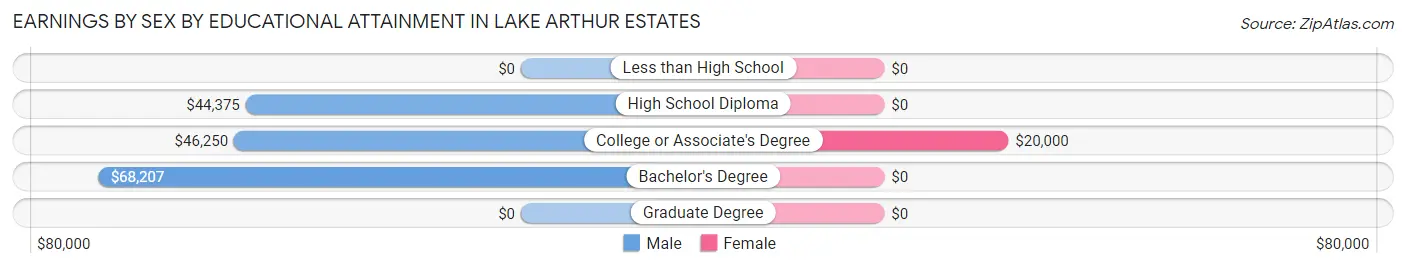
Earnings by Sex by Educational Attainment in Lake Arthur Estates
Average earnings in Lake Arthur Estates are $46,563 for men and $21,458 for women, a difference of 53.9%. Men with an educational attainment of bachelor's degree enjoy the highest average annual earnings of $68,207, while those with high school diploma education earn the least with $44,375. Women with an educational attainment of college or associate's degree earn the most with the average annual earnings of $20,000, while those with college or associate's degree education have the smallest earnings of $20,000.
| Educational Attainment | Male Income | Female Income |
| Less than High School | - | - |
| High School Diploma | $44,375 | $0 |
| College or Associate's Degree | $46,250 | $20,000 |
| Bachelor's Degree | $68,207 | $0 |
| Graduate Degree | - | - |
| Total | $46,563 | $21,458 |
Family Income in Lake Arthur Estates
Family Income Brackets in Lake Arthur Estates
According to the Lake Arthur Estates family income data, there are 39 families falling into the $50,000 to $74,999 income range, which is the most common income bracket and makes up 34.5% of all families.
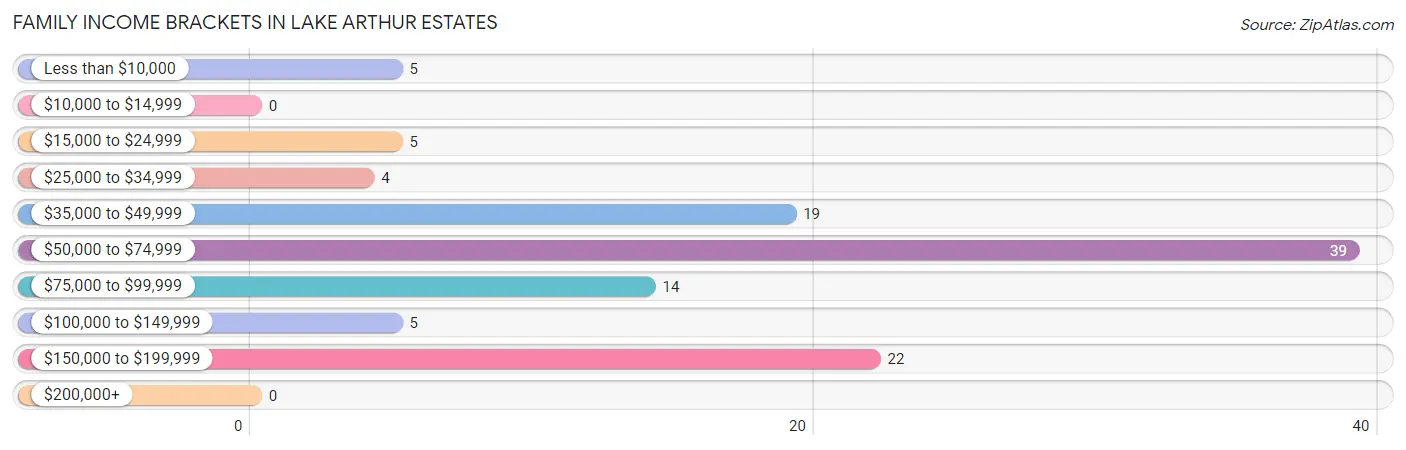
| Income Bracket | # Families | % Families |
| Less than $10,000 | 5 | 4.4% |
| $10,000 to $14,999 | 0 | 0.0% |
| $15,000 to $24,999 | 5 | 4.4% |
| $25,000 to $34,999 | 4 | 3.5% |
| $35,000 to $49,999 | 19 | 16.8% |
| $50,000 to $74,999 | 39 | 34.5% |
| $75,000 to $99,999 | 14 | 12.4% |
| $100,000 to $149,999 | 5 | 4.4% |
| $150,000 to $199,999 | 22 | 19.5% |
| $200,000+ | 0 | 0.0% |
Family Income by Famaliy Size in Lake Arthur Estates
2-person families (60 | 53.1%) account for the highest median family income in Lake Arthur Estates with $86,250 per family, while 2-person families (60 | 53.1%) have the highest median income of $43,125 per family member.
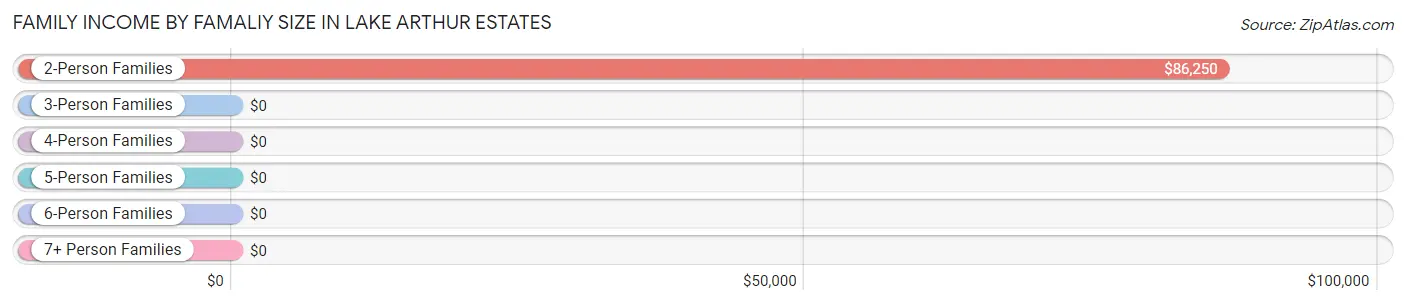
| Income Bracket | # Families | Median Income |
| 2-Person Families | 60 (53.1%) | $86,250 |
| 3-Person Families | 30 (26.6%) | $0 |
| 4-Person Families | 4 (3.5%) | $0 |
| 5-Person Families | 10 (8.8%) | $0 |
| 6-Person Families | 9 (8.0%) | $0 |
| 7+ Person Families | 0 (0.0%) | $0 |
| Total | 113 (100.0%) | $60,446 |
Family Income by Number of Earners in Lake Arthur Estates
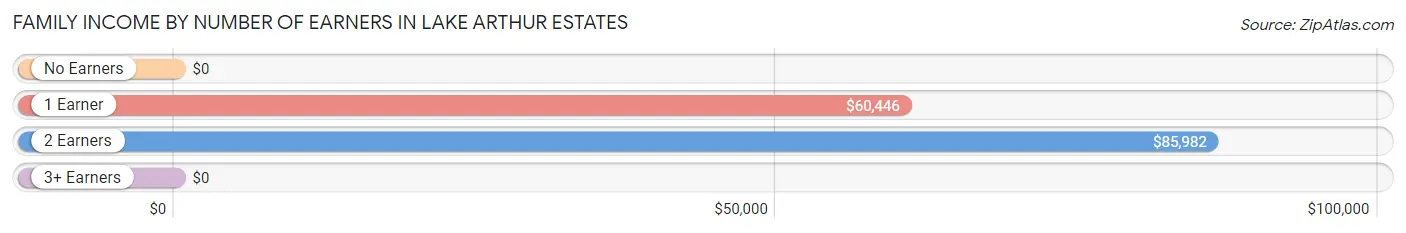
| Number of Earners | # Families | Median Income |
| No Earners | 11 (9.7%) | $0 |
| 1 Earner | 31 (27.4%) | $60,446 |
| 2 Earners | 71 (62.8%) | $85,982 |
| 3+ Earners | 0 (0.0%) | $0 |
| Total | 113 (100.0%) | $60,446 |
Household Income in Lake Arthur Estates
Household Income Brackets in Lake Arthur Estates
With 53 households falling in the category, the $25,000 to $34,999 income range is the most frequent in Lake Arthur Estates, accounting for 22.2% of all households.
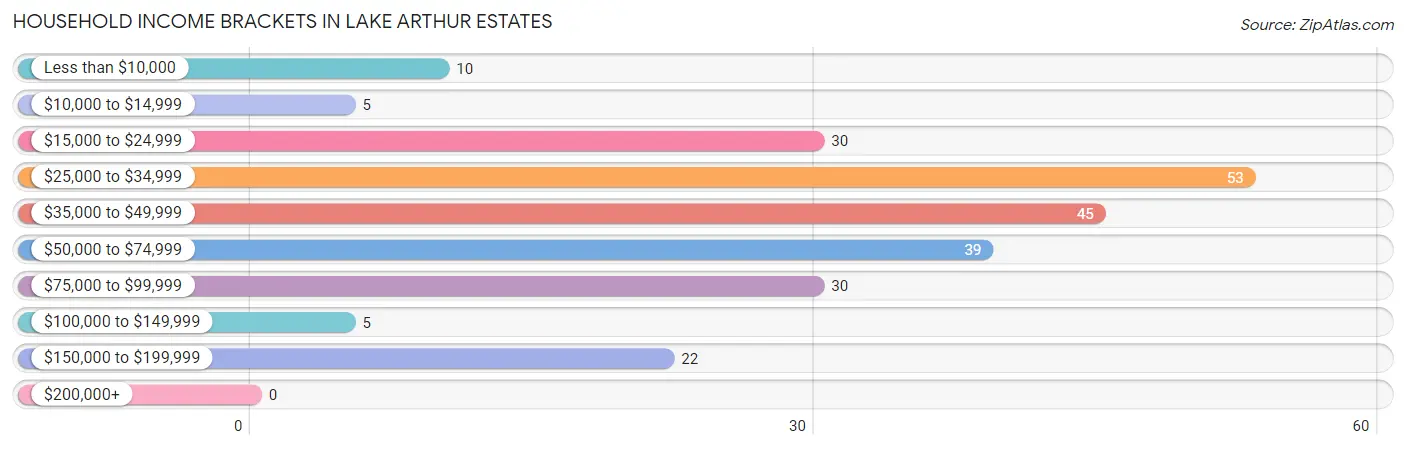
| Income Bracket | # Households | % Households |
| Less than $10,000 | 10 | 4.2% |
| $10,000 to $14,999 | 5 | 2.1% |
| $15,000 to $24,999 | 30 | 12.6% |
| $25,000 to $34,999 | 53 | 22.2% |
| $35,000 to $49,999 | 45 | 18.8% |
| $50,000 to $74,999 | 39 | 16.3% |
| $75,000 to $99,999 | 30 | 12.6% |
| $100,000 to $149,999 | 5 | 2.1% |
| $150,000 to $199,999 | 22 | 9.2% |
| $200,000+ | 0 | 0.0% |
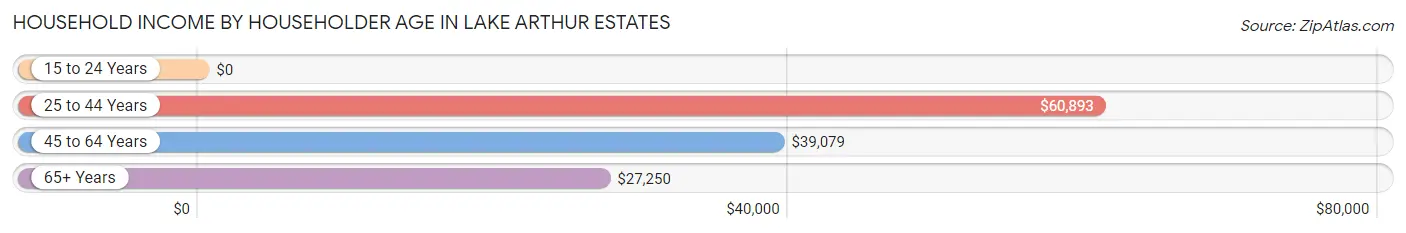
Household Income by Householder Age in Lake Arthur Estates
The median household income in Lake Arthur Estates is $39,420, with the highest median household income of $60,893 found in the 25 to 44 years age bracket for the primary householder. A total of 72 households (30.1%) fall into this category. Meanwhile, the 15 to 24 years age bracket for the primary householder has the lowest median household income of $0, with 26 households (10.9%) in this group.
| Income Bracket | # Households | Median Income |
| 15 to 24 Years | 26 (10.9%) | $0 |
| 25 to 44 Years | 72 (30.1%) | $60,893 |
| 45 to 64 Years | 84 (35.1%) | $39,079 |
| 65+ Years | 57 (23.8%) | $27,250 |
| Total | 239 (100.0%) | $39,420 |
Poverty in Lake Arthur Estates
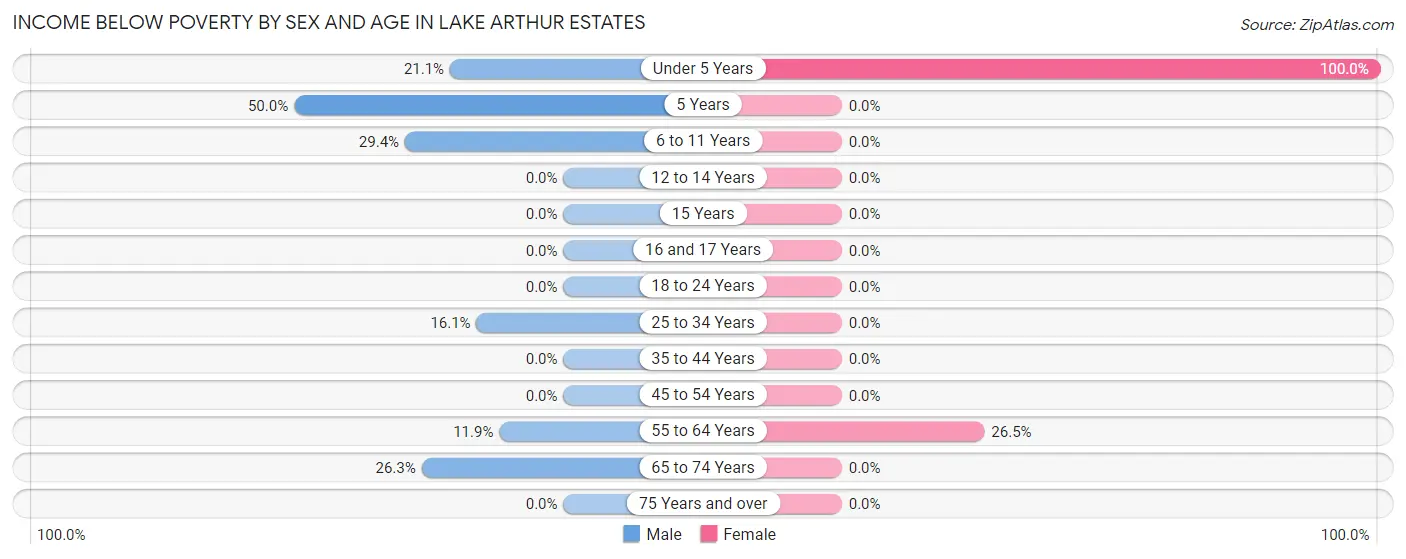
Income Below Poverty by Sex and Age in Lake Arthur Estates
With 14.0% poverty level for males and 5.9% for females among the residents of Lake Arthur Estates, 5 year old males and under 5 year old females are the most vulnerable to poverty, with 5 males (50.0%) and 5 females (100.0%) in their respective age groups living below the poverty level.
| Age Bracket | Male | Female |
| Under 5 Years | 4 (21.0%) | 5 (100.0%) |
| 5 Years | 5 (50.0%) | 0 (0.0%) |
| 6 to 11 Years | 10 (29.4%) | 0 (0.0%) |
| 12 to 14 Years | 0 (0.0%) | 0 (0.0%) |
| 15 Years | 0 (0.0%) | 0 (0.0%) |
| 16 and 17 Years | 0 (0.0%) | 0 (0.0%) |
| 18 to 24 Years | 0 (0.0%) | 0 (0.0%) |
| 25 to 34 Years | 5 (16.1%) | 0 (0.0%) |
| 35 to 44 Years | 0 (0.0%) | 0 (0.0%) |
| 45 to 54 Years | 0 (0.0%) | 0 (0.0%) |
| 55 to 64 Years | 5 (11.9%) | 9 (26.5%) |
| 65 to 74 Years | 5 (26.3%) | 0 (0.0%) |
| 75 Years and over | 0 (0.0%) | 0 (0.0%) |
| Total | 34 (14.0%) | 14 (5.9%) |
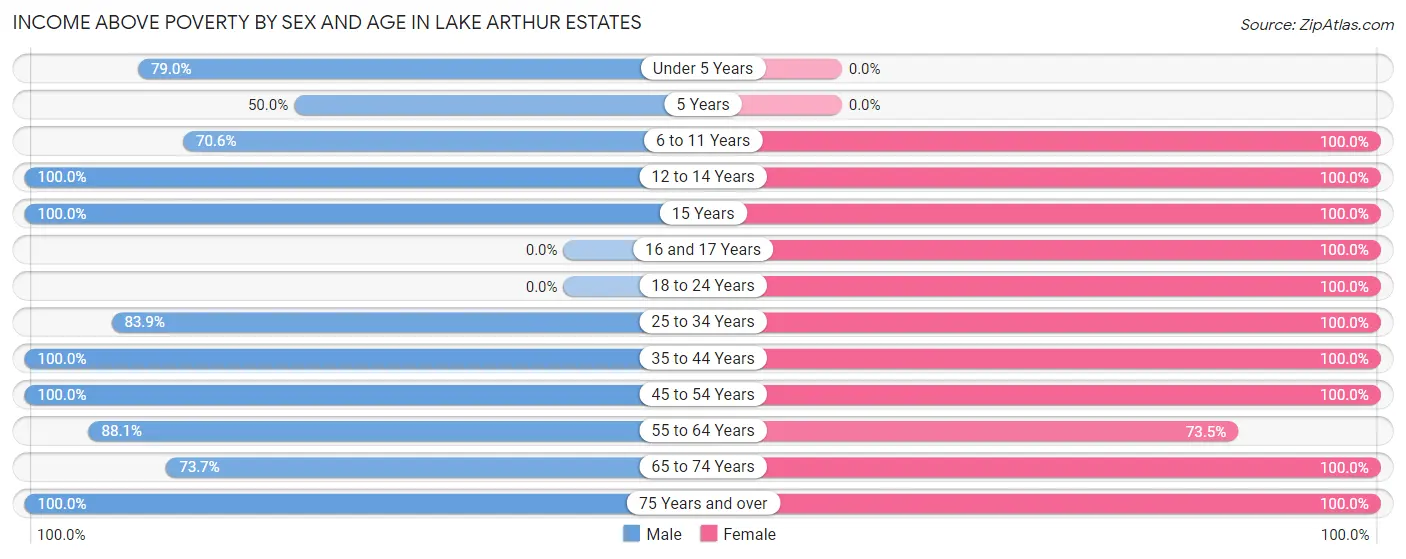
Income Above Poverty by Sex and Age in Lake Arthur Estates
According to the poverty statistics in Lake Arthur Estates, males aged 12 to 14 years and females aged 6 to 11 years are the age groups that are most secure financially, with 100.0% of males and 100.0% of females in these age groups living above the poverty line.
| Age Bracket | Male | Female |
| Under 5 Years | 15 (78.9%) | 0 (0.0%) |
| 5 Years | 5 (50.0%) | 0 (0.0%) |
| 6 to 11 Years | 24 (70.6%) | 9 (100.0%) |
| 12 to 14 Years | 6 (100.0%) | 4 (100.0%) |
| 15 Years | 6 (100.0%) | 8 (100.0%) |
| 16 and 17 Years | 0 (0.0%) | 9 (100.0%) |
| 18 to 24 Years | 0 (0.0%) | 26 (100.0%) |
| 25 to 34 Years | 26 (83.9%) | 33 (100.0%) |
| 35 to 44 Years | 49 (100.0%) | 38 (100.0%) |
| 45 to 54 Years | 25 (100.0%) | 19 (100.0%) |
| 55 to 64 Years | 37 (88.1%) | 25 (73.5%) |
| 65 to 74 Years | 14 (73.7%) | 35 (100.0%) |
| 75 Years and over | 2 (100.0%) | 16 (100.0%) |
| Total | 209 (86.0%) | 222 (94.1%) |
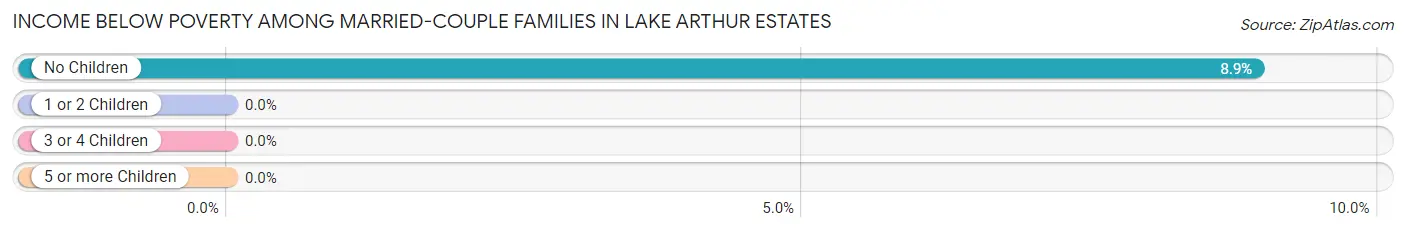
Income Below Poverty Among Married-Couple Families in Lake Arthur Estates
The poverty statistics for married-couple families in Lake Arthur Estates show that 4.8% or 5 of the total 104 families live below the poverty line. Families with no children have the highest poverty rate of 8.9%, comprising of 5 families. On the other hand, families with 1 or 2 children have the lowest poverty rate of 0.0%, which includes 0 families.
| Children | Above Poverty | Below Poverty |
| No Children | 51 (91.1%) | 5 (8.9%) |
| 1 or 2 Children | 34 (100.0%) | 0 (0.0%) |
| 3 or 4 Children | 14 (100.0%) | 0 (0.0%) |
| 5 or more Children | 0 (0.0%) | 0 (0.0%) |
| Total | 99 (95.2%) | 5 (4.8%) |
Income Below Poverty Among Single-Parent Households in Lake Arthur Estates
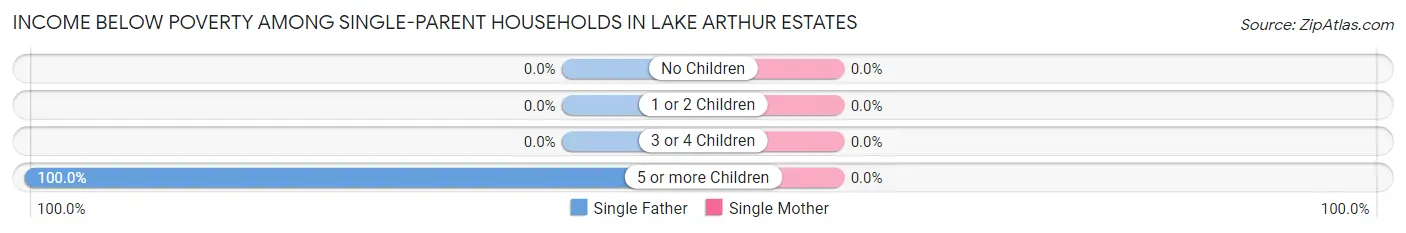
| Children | Single Father | Single Mother |
| No Children | 0 (0.0%) | 0 (0.0%) |
| 1 or 2 Children | 0 (0.0%) | 0 (0.0%) |
| 3 or 4 Children | 0 (0.0%) | 0 (0.0%) |
| 5 or more Children | 5 (100.0%) | 0 (0.0%) |
| Total | 5 (100.0%) | 0 (0.0%) |
Income Below Poverty Among Married-Couple vs Single-Parent Households in Lake Arthur Estates
The poverty data for Lake Arthur Estates shows that 5 of the married-couple family households (4.8%) and 5 of the single-parent households (55.6%) are living below the poverty level. Within the married-couple family households, those with no children have the highest poverty rate, with 5 households (8.9%) falling below the poverty line. Among the single-parent households, those with 5 or more children have the highest poverty rate, with 5 household (100.0%) living below poverty.
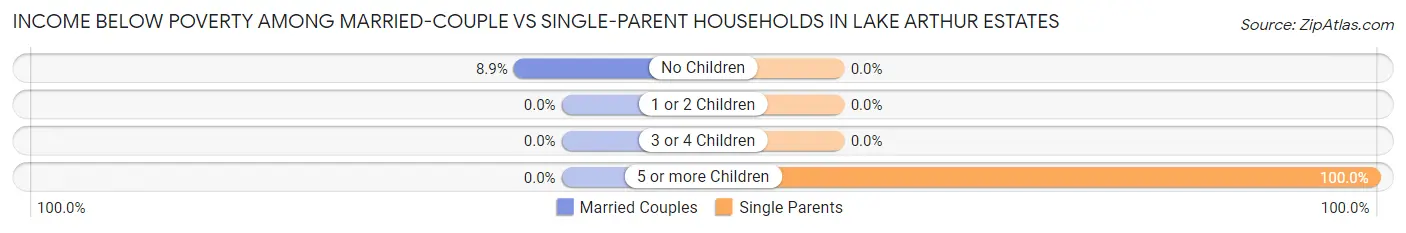
| Children | Married-Couple Families | Single-Parent Households |
| No Children | 5 (8.9%) | 0 (0.0%) |
| 1 or 2 Children | 0 (0.0%) | 0 (0.0%) |
| 3 or 4 Children | 0 (0.0%) | 0 (0.0%) |
| 5 or more Children | 0 (0.0%) | 5 (100.0%) |
| Total | 5 (4.8%) | 5 (55.6%) |
Race in Lake Arthur Estates
The most populous races in Lake Arthur Estates are White / Caucasian (474 | 99.0%), Hispanic or Latino (20 | 4.2%), and Two or more Races (5 | 1.0%).
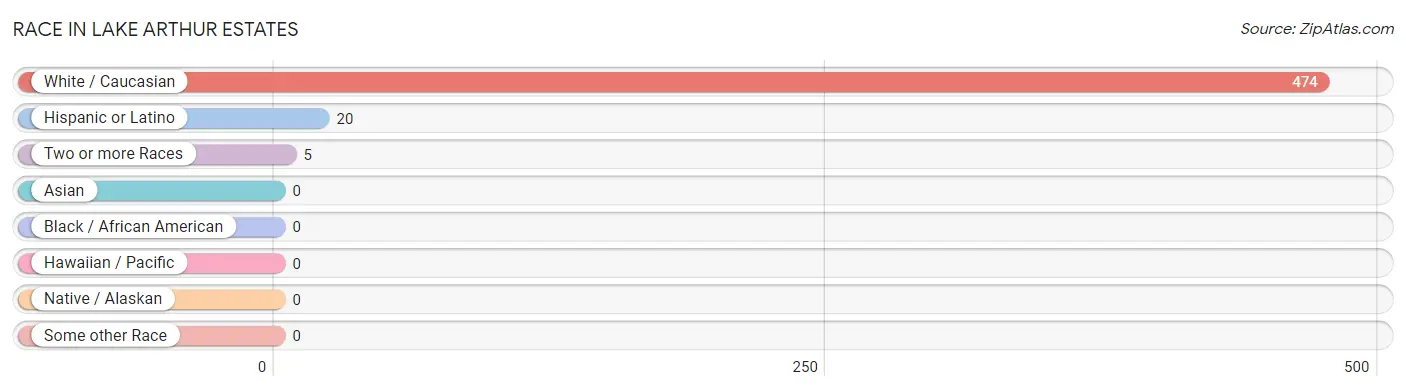
| Race | # Population | % Population |
| Asian | 0 | 0.0% |
| Black / African American | 0 | 0.0% |
| Hawaiian / Pacific | 0 | 0.0% |
| Hispanic or Latino | 20 | 4.2% |
| Native / Alaskan | 0 | 0.0% |
| White / Caucasian | 474 | 99.0% |
| Two or more Races | 5 | 1.0% |
| Some other Race | 0 | 0.0% |
| Total | 479 | 100.0% |
Ancestry in Lake Arthur Estates
The most populous ancestries reported in Lake Arthur Estates are German (170 | 35.5%), Irish (111 | 23.2%), Italian (79 | 16.5%), English (45 | 9.4%), and Polish (31 | 6.5%), together accounting for 91.0% of all Lake Arthur Estates residents.
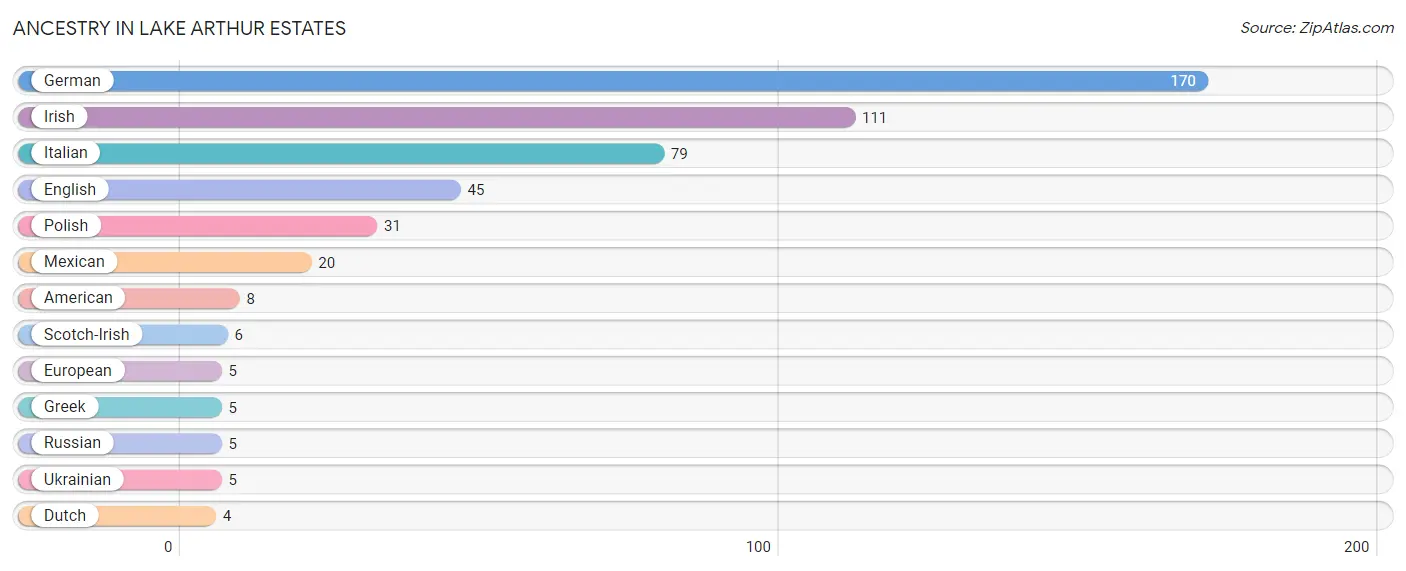
| Ancestry | # Population | % Population |
| American | 8 | 1.7% |
| Dutch | 4 | 0.8% |
| English | 45 | 9.4% |
| European | 5 | 1.0% |
| German | 170 | 35.5% |
| Greek | 5 | 1.0% |
| Irish | 111 | 23.2% |
| Italian | 79 | 16.5% |
| Mexican | 20 | 4.2% |
| Polish | 31 | 6.5% |
| Russian | 5 | 1.0% |
| Scotch-Irish | 6 | 1.3% |
| Ukrainian | 5 | 1.0% | View All 13 Rows |
Immigrants in Lake Arthur Estates

| Immigration Origin | # Population | % Population | View All 0 Rows |
Sex and Age in Lake Arthur Estates
Sex and Age in Lake Arthur Estates
The most populous age groups in Lake Arthur Estates are 5 to 9 Years (39 | 16.1%) for men and 70 to 74 Years (27 | 11.4%) for women.
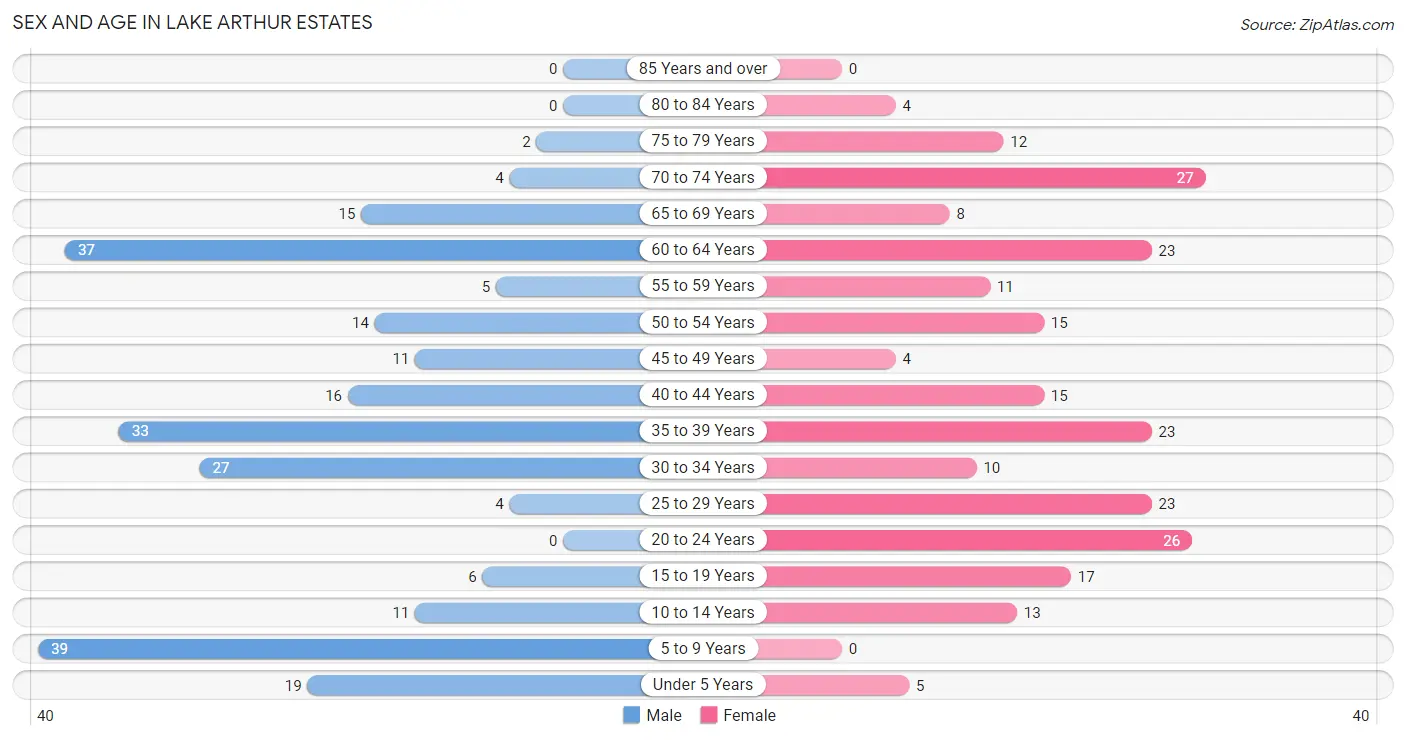
| Age Bracket | Male | Female |
| Under 5 Years | 19 (7.8%) | 5 (2.1%) |
| 5 to 9 Years | 39 (16.1%) | 0 (0.0%) |
| 10 to 14 Years | 11 (4.5%) | 13 (5.5%) |
| 15 to 19 Years | 6 (2.5%) | 17 (7.2%) |
| 20 to 24 Years | 0 (0.0%) | 26 (11.0%) |
| 25 to 29 Years | 4 (1.7%) | 23 (9.8%) |
| 30 to 34 Years | 27 (11.1%) | 10 (4.2%) |
| 35 to 39 Years | 33 (13.6%) | 23 (9.8%) |
| 40 to 44 Years | 16 (6.6%) | 15 (6.4%) |
| 45 to 49 Years | 11 (4.5%) | 4 (1.7%) |
| 50 to 54 Years | 14 (5.8%) | 15 (6.4%) |
| 55 to 59 Years | 5 (2.1%) | 11 (4.7%) |
| 60 to 64 Years | 37 (15.2%) | 23 (9.8%) |
| 65 to 69 Years | 15 (6.2%) | 8 (3.4%) |
| 70 to 74 Years | 4 (1.7%) | 27 (11.4%) |
| 75 to 79 Years | 2 (0.8%) | 12 (5.1%) |
| 80 to 84 Years | 0 (0.0%) | 4 (1.7%) |
| 85 Years and over | 0 (0.0%) | 0 (0.0%) |
| Total | 243 (100.0%) | 236 (100.0%) |
Families and Households in Lake Arthur Estates
Median Family Size in Lake Arthur Estates
The median family size in Lake Arthur Estates is 2.99 persons per family, with single male/father families (5 | 4.4%) accounting for the largest median family size of 5.8 persons per family. On the other hand, single female/mother families (4 | 3.5%) represent the smallest median family size with 2.00 persons per family.
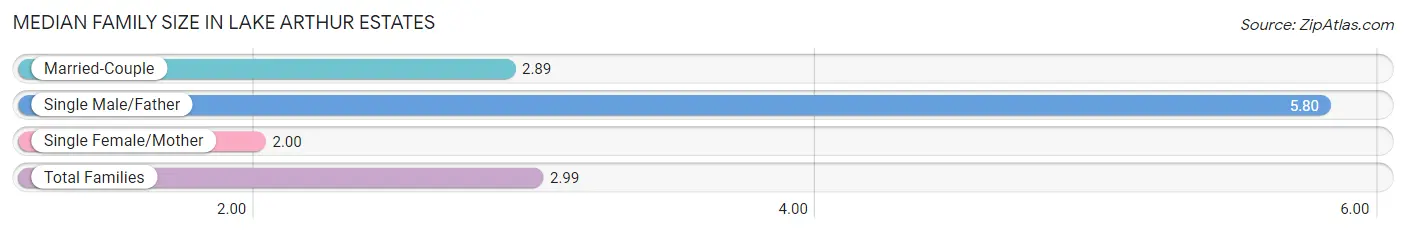
| Family Type | # Families | Family Size |
| Married-Couple | 104 (92.0%) | 2.89 |
| Single Male/Father | 5 (4.4%) | 5.80 |
| Single Female/Mother | 4 (3.5%) | 2.00 |
| Total Families | 113 (100.0%) | 2.99 |
Median Household Size in Lake Arthur Estates
The median household size in Lake Arthur Estates is 2.00 persons per household, with single male/father households (5 | 2.1%) accounting for the largest median household size of 6.8 persons per household. non-family households (126 | 52.7%) represent the smallest median household size with 1.08 persons per household.
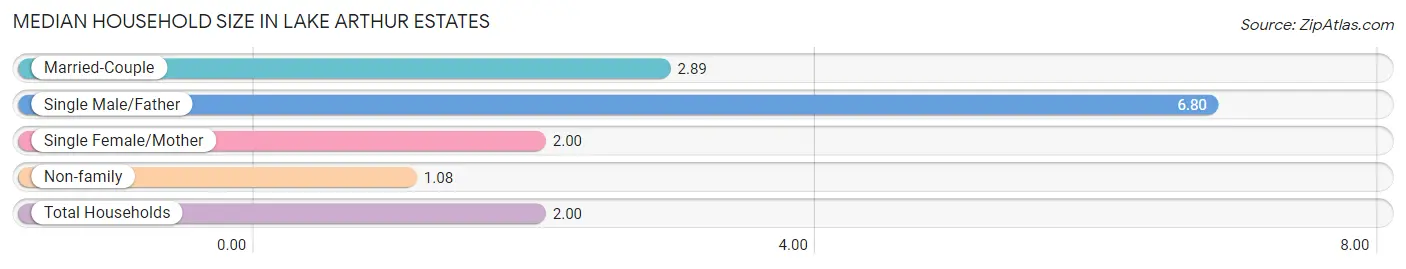
| Household Type | # Households | Household Size |
| Married-Couple | 104 (43.5%) | 2.89 |
| Single Male/Father | 5 (2.1%) | 6.80 |
| Single Female/Mother | 4 (1.7%) | 2.00 |
| Non-family | 126 (52.7%) | 1.08 |
| Total Households | 239 (100.0%) | 2.00 |
Household Size by Marriage Status in Lake Arthur Estates
Out of a total of 239 households in Lake Arthur Estates, 113 (47.3%) are family households, while 126 (52.7%) are nonfamily households. The most numerous type of family households are 2-person households, comprising 60, and the most common type of nonfamily households are 1-person households, comprising 115.
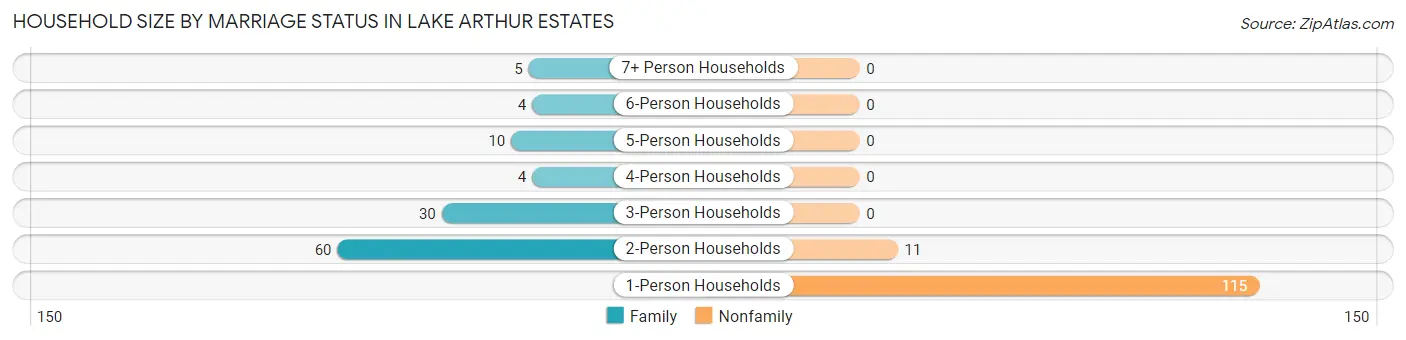
| Household Size | Family Households | Nonfamily Households |
| 1-Person Households | - | 115 (48.1%) |
| 2-Person Households | 60 (25.1%) | 11 (4.6%) |
| 3-Person Households | 30 (12.6%) | 0 (0.0%) |
| 4-Person Households | 4 (1.7%) | 0 (0.0%) |
| 5-Person Households | 10 (4.2%) | 0 (0.0%) |
| 6-Person Households | 4 (1.7%) | 0 (0.0%) |
| 7+ Person Households | 5 (2.1%) | 0 (0.0%) |
| Total | 113 (47.3%) | 126 (52.7%) |
Female Fertility in Lake Arthur Estates
Fertility by Age in Lake Arthur Estates
Average fertility rate in Lake Arthur Estates is 114.0 births per 1,000 women. Women in the age bracket of 20 to 34 years have the highest fertility rate with 237.0 births per 1,000 women. Women in the age bracket of 20 to 34 years acount for 100.0% of all women with births.
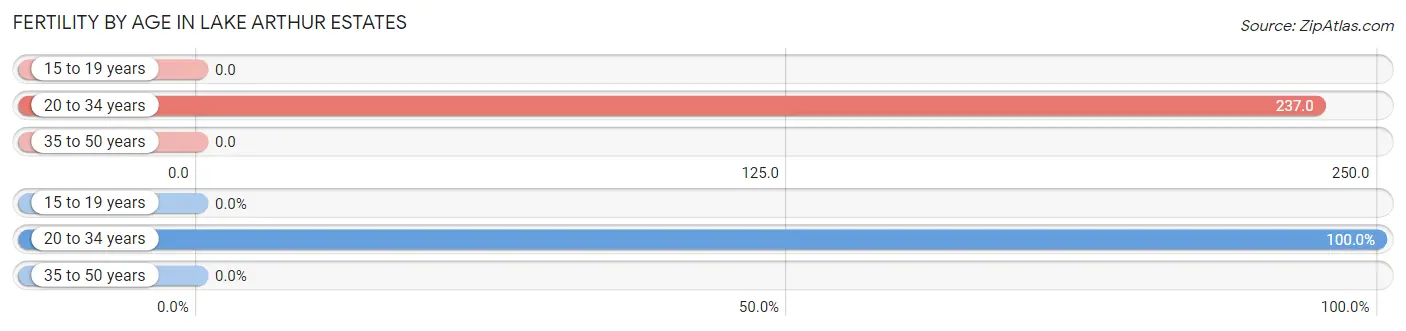
| Age Bracket | Women with Births | Births / 1,000 Women |
| 15 to 19 years | 0 (0.0%) | 0.0 |
| 20 to 34 years | 14 (100.0%) | 237.0 |
| 35 to 50 years | 0 (0.0%) | 0.0 |
| Total | 14 (100.0%) | 114.0 |
Fertility by Age by Marriage Status in Lake Arthur Estates
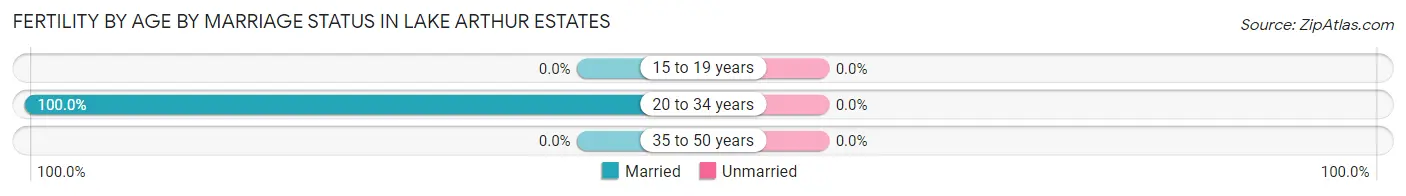
| Age Bracket | Married | Unmarried |
| 15 to 19 years | 0 (0.0%) | 0 (0.0%) |
| 20 to 34 years | 14 (100.0%) | 0 (0.0%) |
| 35 to 50 years | 0 (0.0%) | 0 (0.0%) |
| Total | 14 (100.0%) | 0 (0.0%) |
Fertility by Education in Lake Arthur Estates
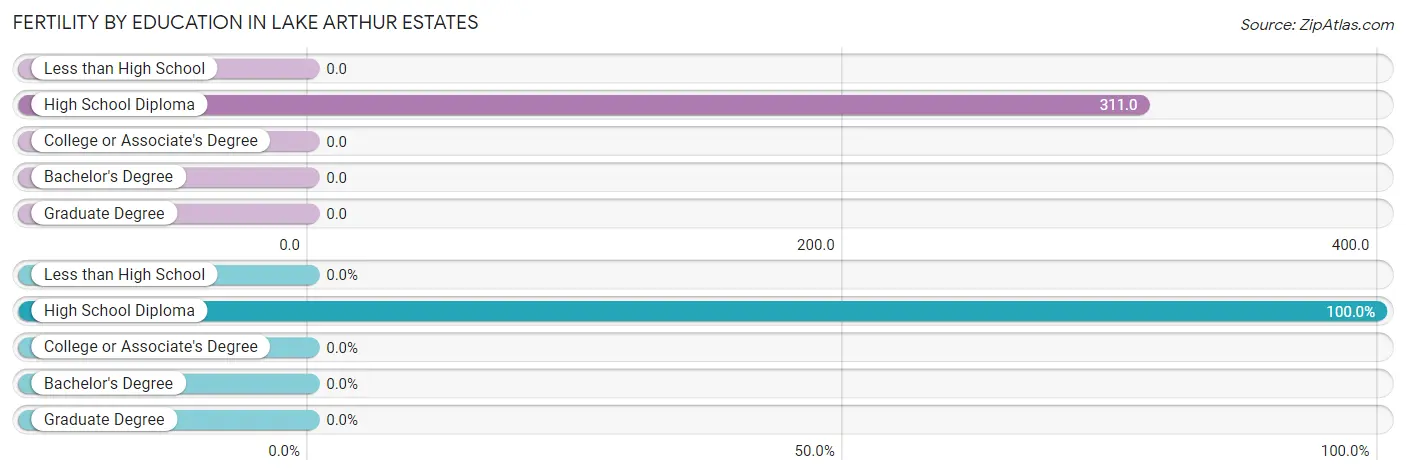
| Educational Attainment | Women with Births | Births / 1,000 Women |
| Less than High School | 0 (0.0%) | 0.0 |
| High School Diploma | 14 (100.0%) | 311.0 |
| College or Associate's Degree | 0 (0.0%) | 0.0 |
| Bachelor's Degree | 0 (0.0%) | 0.0 |
| Graduate Degree | 0 (0.0%) | 0.0 |
| Total | 14 (100.0%) | 114.0 |
Fertility by Education by Marriage Status in Lake Arthur Estates
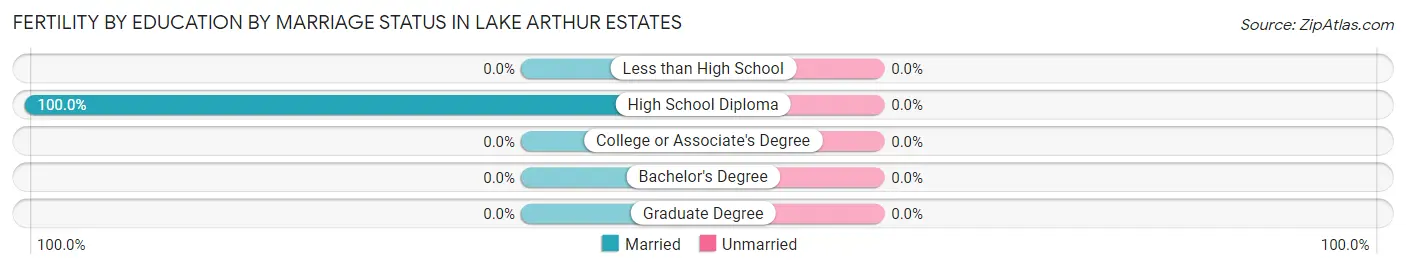
| Educational Attainment | Married | Unmarried |
| Less than High School | 0 (0.0%) | 0 (0.0%) |
| High School Diploma | 14 (100.0%) | 0 (0.0%) |
| College or Associate's Degree | 0 (0.0%) | 0 (0.0%) |
| Bachelor's Degree | 0 (0.0%) | 0 (0.0%) |
| Graduate Degree | 0 (0.0%) | 0 (0.0%) |
| Total | 14 (100.0%) | 0 (0.0%) |
Employment Characteristics in Lake Arthur Estates
Employment by Class of Employer in Lake Arthur Estates
Among the 269 employed individuals in Lake Arthur Estates, private company employees (223 | 82.9%), federal government employees (24 | 8.9%), and local government employees (18 | 6.7%) make up the most common classes of employment.
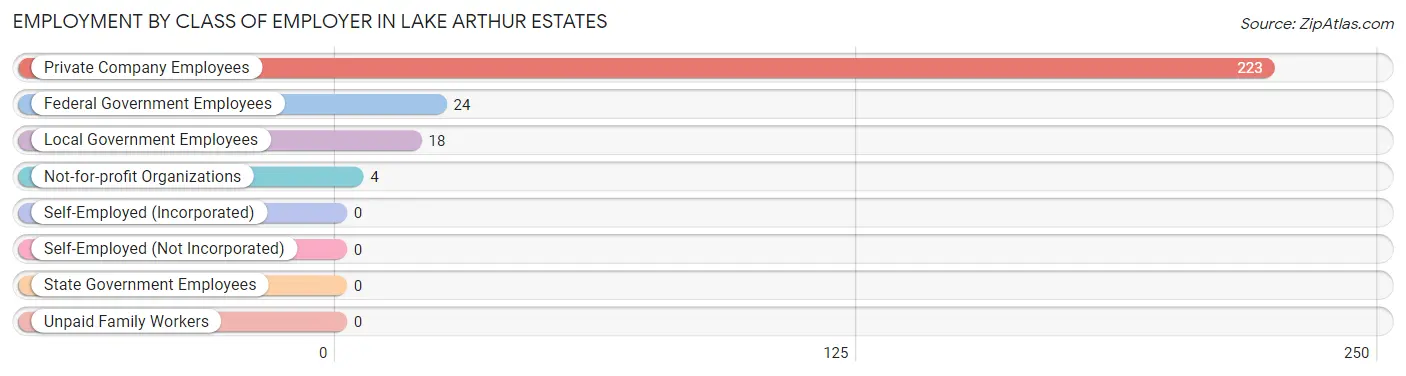
| Employer Class | # Employees | % Employees |
| Private Company Employees | 223 | 82.9% |
| Self-Employed (Incorporated) | 0 | 0.0% |
| Self-Employed (Not Incorporated) | 0 | 0.0% |
| Not-for-profit Organizations | 4 | 1.5% |
| Local Government Employees | 18 | 6.7% |
| State Government Employees | 0 | 0.0% |
| Federal Government Employees | 24 | 8.9% |
| Unpaid Family Workers | 0 | 0.0% |
| Total | 269 | 100.0% |
Employment Status by Age in Lake Arthur Estates
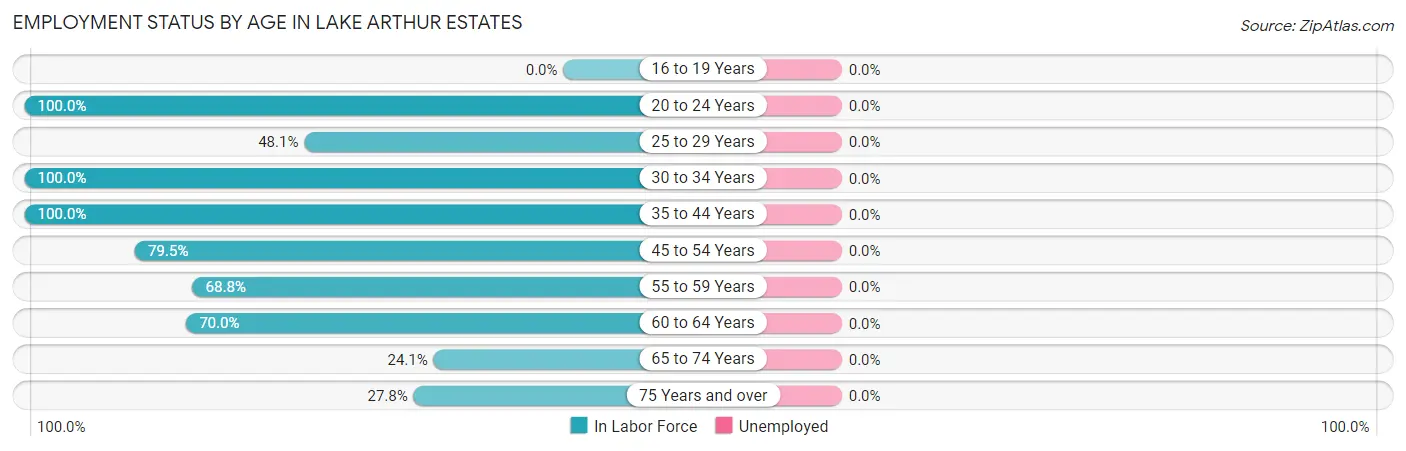
| Age Bracket | In Labor Force | Unemployed |
| 16 to 19 Years | 0 (0.0%) | 0 (0.0%) |
| 20 to 24 Years | 26 (100.0%) | 0 (0.0%) |
| 25 to 29 Years | 13 (48.1%) | 0 (0.0%) |
| 30 to 34 Years | 37 (100.0%) | 0 (0.0%) |
| 35 to 44 Years | 87 (100.0%) | 0 (0.0%) |
| 45 to 54 Years | 35 (79.5%) | 0 (0.0%) |
| 55 to 59 Years | 11 (68.8%) | 0 (0.0%) |
| 60 to 64 Years | 42 (70.0%) | 0 (0.0%) |
| 65 to 74 Years | 13 (24.1%) | 0 (0.0%) |
| 75 Years and over | 5 (27.8%) | 0 (0.0%) |
| Total | 269 (71.2%) | 0 (0.0%) |
Employment Status by Educational Attainment in Lake Arthur Estates
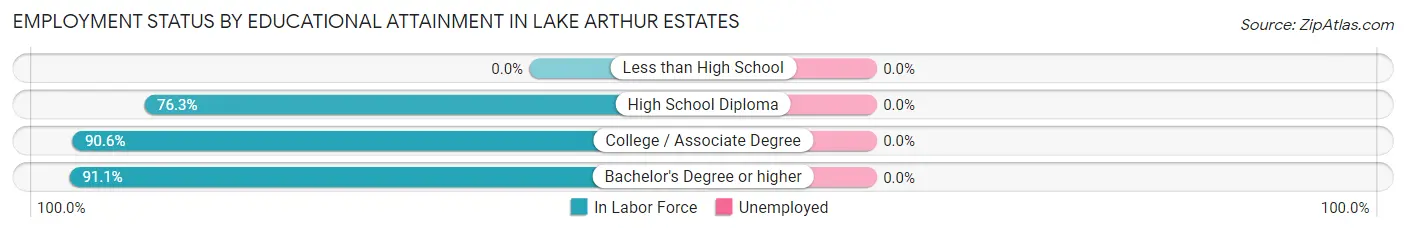
| Educational Attainment | In Labor Force | Unemployed |
| Less than High School | 0 (0.0%) | 0 (0.0%) |
| High School Diploma | 87 (76.3%) | 0 (0.0%) |
| College / Associate Degree | 87 (90.6%) | 0 (0.0%) |
| Bachelor's Degree or higher | 51 (91.1%) | 0 (0.0%) |
| Total | 225 (83.0%) | 0 (0.0%) |
Employment Occupations by Sex in Lake Arthur Estates
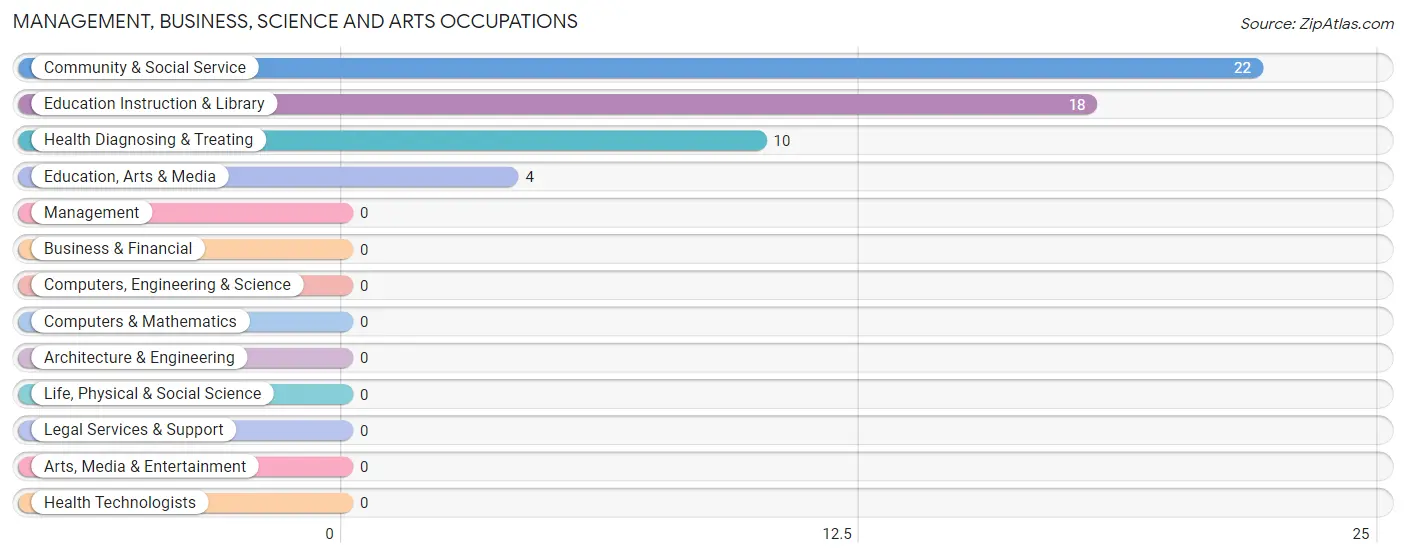
Management, Business, Science and Arts Occupations
The most common Management, Business, Science and Arts occupations in Lake Arthur Estates are Community & Social Service (22 | 8.2%), Education Instruction & Library (18 | 6.7%), Health Diagnosing & Treating (10 | 3.7%), and Education, Arts & Media (4 | 1.5%).
Management, Business, Science and Arts Occupations by Sex
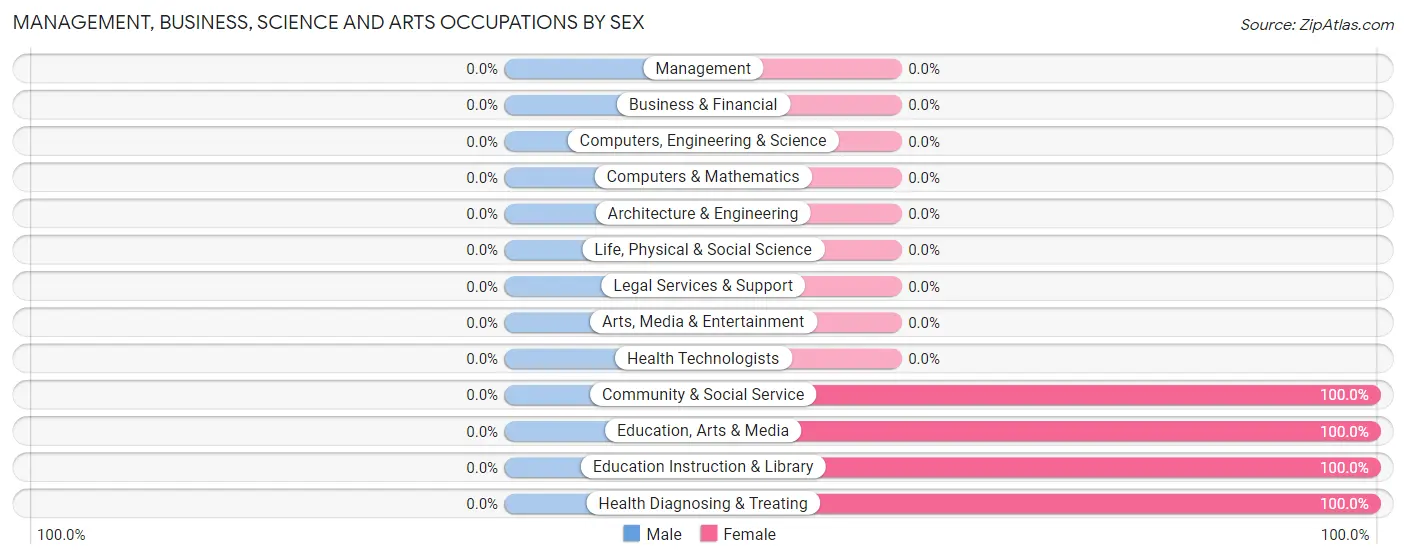
| Occupation | Male | Female |
| Management | 0 (0.0%) | 0 (0.0%) |
| Business & Financial | 0 (0.0%) | 0 (0.0%) |
| Computers, Engineering & Science | 0 (0.0%) | 0 (0.0%) |
| Computers & Mathematics | 0 (0.0%) | 0 (0.0%) |
| Architecture & Engineering | 0 (0.0%) | 0 (0.0%) |
| Life, Physical & Social Science | 0 (0.0%) | 0 (0.0%) |
| Community & Social Service | 0 (0.0%) | 22 (100.0%) |
| Education, Arts & Media | 0 (0.0%) | 4 (100.0%) |
| Legal Services & Support | 0 (0.0%) | 0 (0.0%) |
| Education Instruction & Library | 0 (0.0%) | 18 (100.0%) |
| Arts, Media & Entertainment | 0 (0.0%) | 0 (0.0%) |
| Health Diagnosing & Treating | 0 (0.0%) | 10 (100.0%) |
| Health Technologists | 0 (0.0%) | 0 (0.0%) |
| Total (Category) | 0 (0.0%) | 32 (100.0%) |
| Total (Overall) | 132 (49.1%) | 137 (50.9%) |
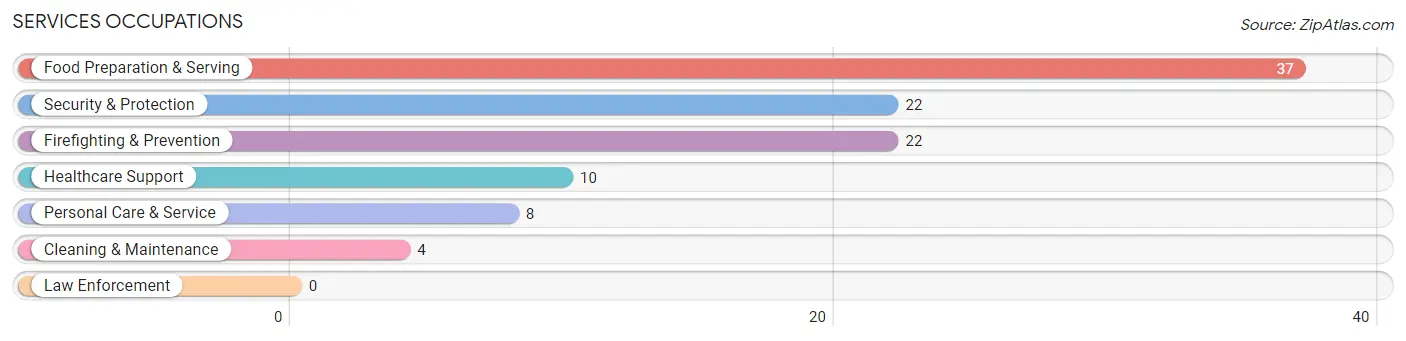
Services Occupations
The most common Services occupations in Lake Arthur Estates are Food Preparation & Serving (37 | 13.8%), Security & Protection (22 | 8.2%), Firefighting & Prevention (22 | 8.2%), Healthcare Support (10 | 3.7%), and Personal Care & Service (8 | 3.0%).
Services Occupations by Sex
Within the Services occupations in Lake Arthur Estates, the most male-oriented occupations are Personal Care & Service (100.0%), Security & Protection (81.8%), and Firefighting & Prevention (81.8%), while the most female-oriented occupations are Healthcare Support (100.0%), Cleaning & Maintenance (100.0%), and Food Preparation & Serving (86.5%).
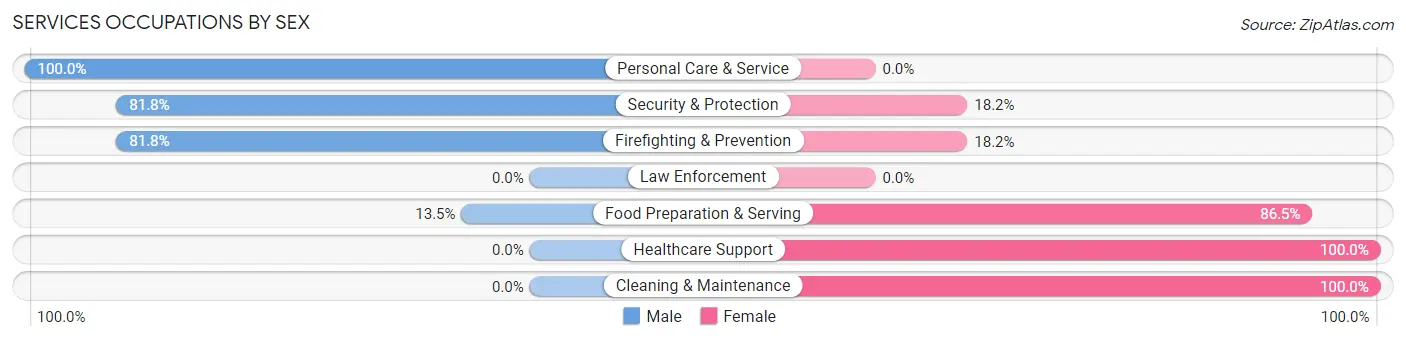
| Occupation | Male | Female |
| Healthcare Support | 0 (0.0%) | 10 (100.0%) |
| Security & Protection | 18 (81.8%) | 4 (18.2%) |
| Firefighting & Prevention | 18 (81.8%) | 4 (18.2%) |
| Law Enforcement | 0 (0.0%) | 0 (0.0%) |
| Food Preparation & Serving | 5 (13.5%) | 32 (86.5%) |
| Cleaning & Maintenance | 0 (0.0%) | 4 (100.0%) |
| Personal Care & Service | 8 (100.0%) | 0 (0.0%) |
| Total (Category) | 31 (38.3%) | 50 (61.7%) |
| Total (Overall) | 132 (49.1%) | 137 (50.9%) |
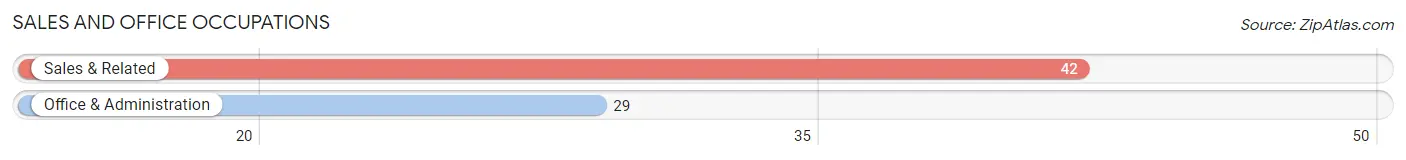
Sales and Office Occupations
The most common Sales and Office occupations in Lake Arthur Estates are Sales & Related (42 | 15.6%), and Office & Administration (29 | 10.8%).
Sales and Office Occupations by Sex
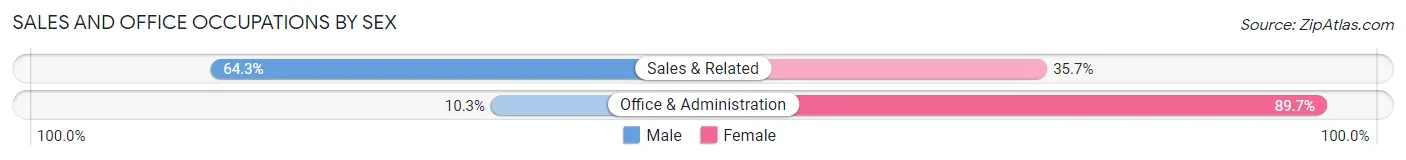
| Occupation | Male | Female |
| Sales & Related | 27 (64.3%) | 15 (35.7%) |
| Office & Administration | 3 (10.3%) | 26 (89.7%) |
| Total (Category) | 30 (42.2%) | 41 (57.8%) |
| Total (Overall) | 132 (49.1%) | 137 (50.9%) |
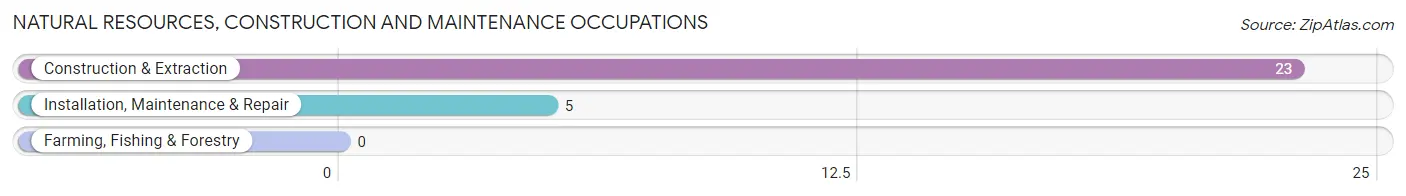
Natural Resources, Construction and Maintenance Occupations
The most common Natural Resources, Construction and Maintenance occupations in Lake Arthur Estates are Construction & Extraction (23 | 8.6%), and Installation, Maintenance & Repair (5 | 1.9%).
Natural Resources, Construction and Maintenance Occupations by Sex
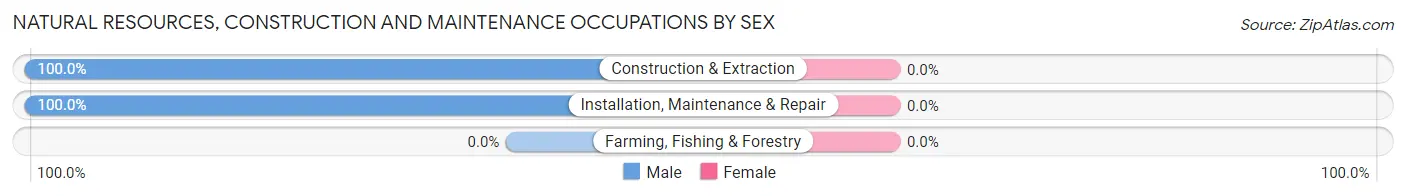
| Occupation | Male | Female |
| Farming, Fishing & Forestry | 0 (0.0%) | 0 (0.0%) |
| Construction & Extraction | 23 (100.0%) | 0 (0.0%) |
| Installation, Maintenance & Repair | 5 (100.0%) | 0 (0.0%) |
| Total (Category) | 28 (100.0%) | 0 (0.0%) |
| Total (Overall) | 132 (49.1%) | 137 (50.9%) |
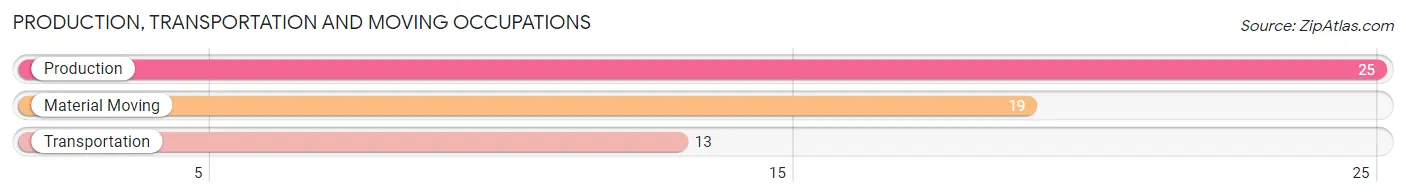
Production, Transportation and Moving Occupations
The most common Production, Transportation and Moving occupations in Lake Arthur Estates are Production (25 | 9.3%), Material Moving (19 | 7.1%), and Transportation (13 | 4.8%).
Production, Transportation and Moving Occupations by Sex
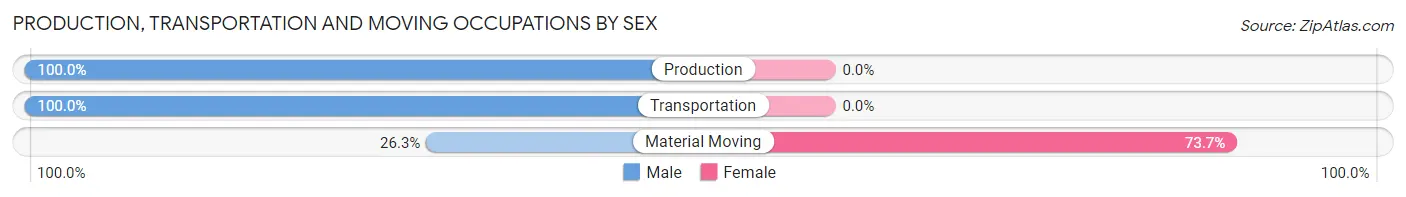
| Occupation | Male | Female |
| Production | 25 (100.0%) | 0 (0.0%) |
| Transportation | 13 (100.0%) | 0 (0.0%) |
| Material Moving | 5 (26.3%) | 14 (73.7%) |
| Total (Category) | 43 (75.4%) | 14 (24.6%) |
| Total (Overall) | 132 (49.1%) | 137 (50.9%) |
Employment Industries by Sex in Lake Arthur Estates
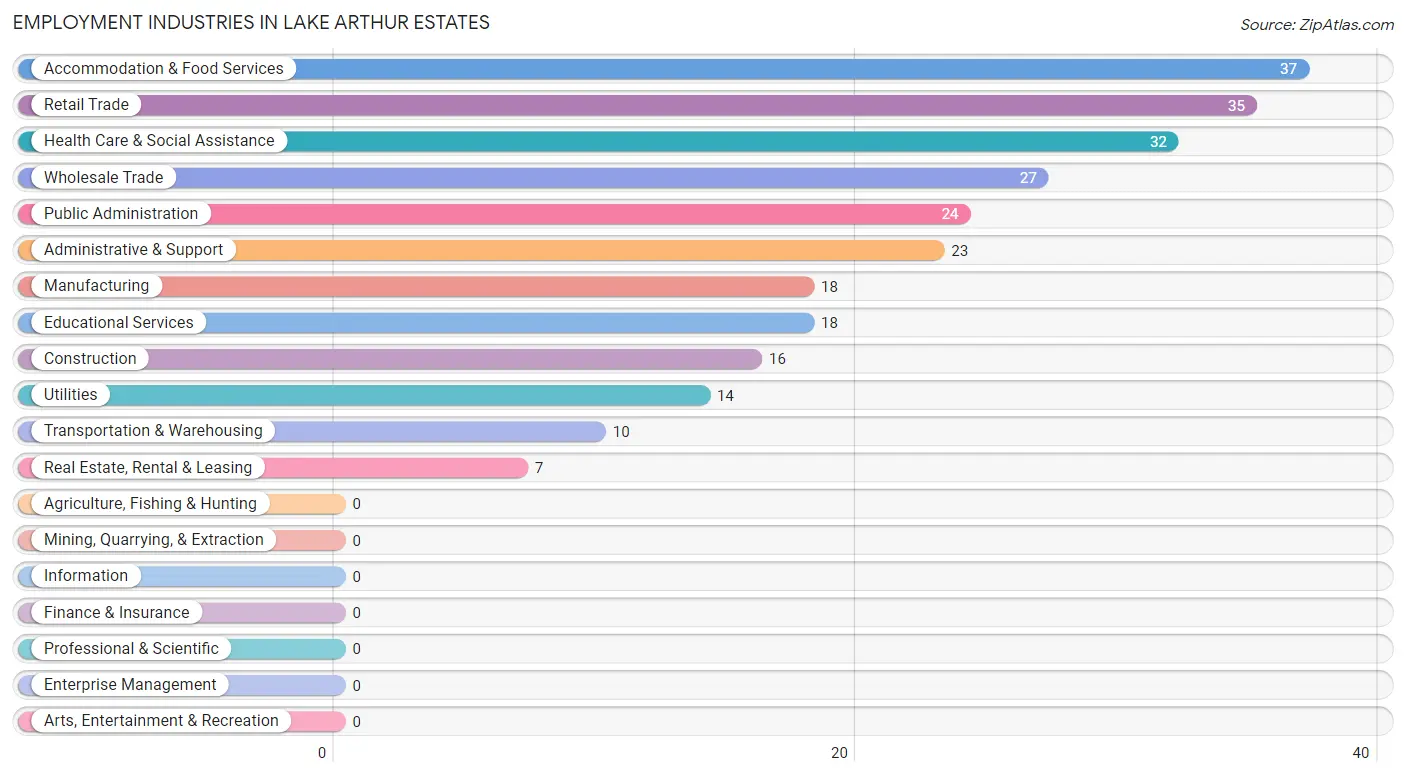
Employment Industries in Lake Arthur Estates
The major employment industries in Lake Arthur Estates include Accommodation & Food Services (37 | 13.8%), Retail Trade (35 | 13.0%), Health Care & Social Assistance (32 | 11.9%), Wholesale Trade (27 | 10.0%), and Public Administration (24 | 8.9%).
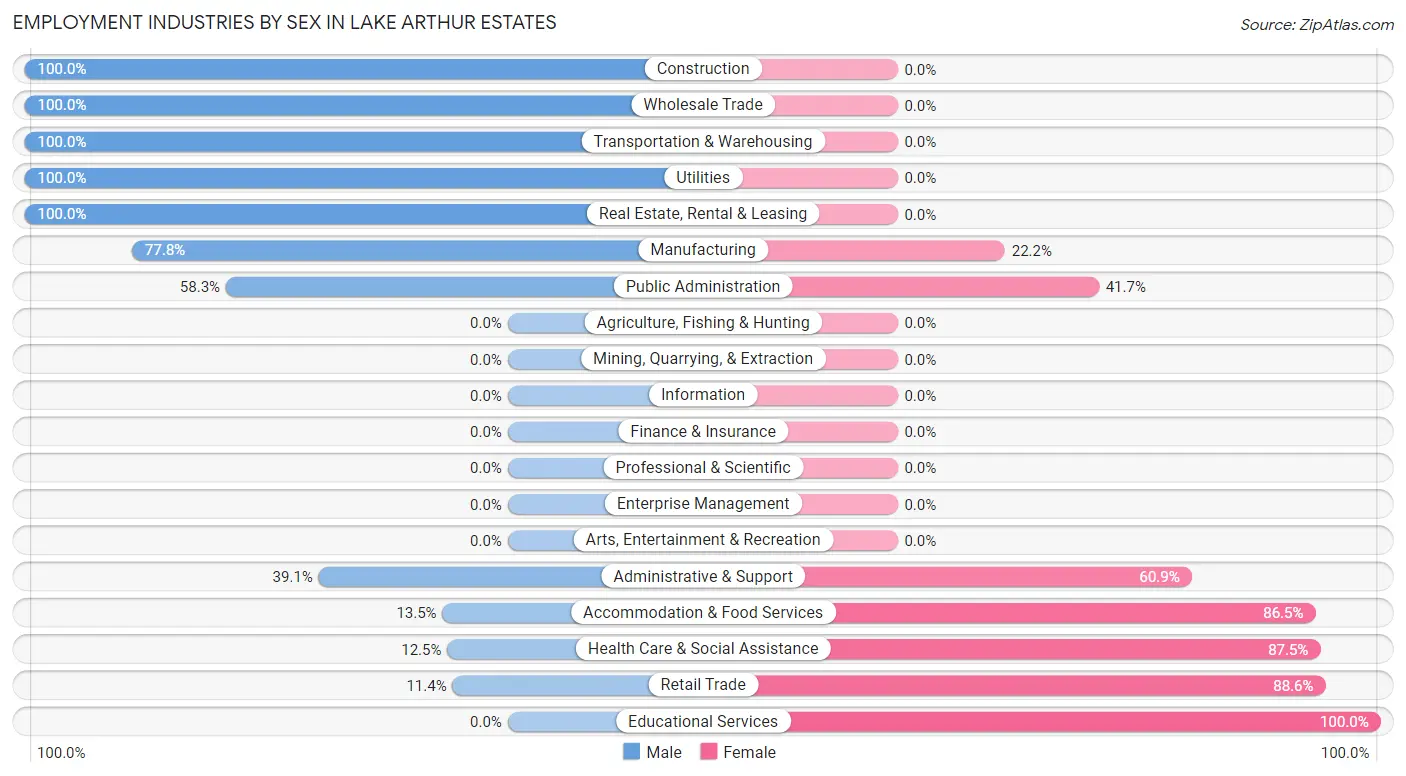
Employment Industries by Sex in Lake Arthur Estates
The Lake Arthur Estates industries that see more men than women are Construction (100.0%), Wholesale Trade (100.0%), and Transportation & Warehousing (100.0%), whereas the industries that tend to have a higher number of women are Educational Services (100.0%), Retail Trade (88.6%), and Health Care & Social Assistance (87.5%).
| Industry | Male | Female |
| Agriculture, Fishing & Hunting | 0 (0.0%) | 0 (0.0%) |
| Mining, Quarrying, & Extraction | 0 (0.0%) | 0 (0.0%) |
| Construction | 16 (100.0%) | 0 (0.0%) |
| Manufacturing | 14 (77.8%) | 4 (22.2%) |
| Wholesale Trade | 27 (100.0%) | 0 (0.0%) |
| Retail Trade | 4 (11.4%) | 31 (88.6%) |
| Transportation & Warehousing | 10 (100.0%) | 0 (0.0%) |
| Utilities | 14 (100.0%) | 0 (0.0%) |
| Information | 0 (0.0%) | 0 (0.0%) |
| Finance & Insurance | 0 (0.0%) | 0 (0.0%) |
| Real Estate, Rental & Leasing | 7 (100.0%) | 0 (0.0%) |
| Professional & Scientific | 0 (0.0%) | 0 (0.0%) |
| Enterprise Management | 0 (0.0%) | 0 (0.0%) |
| Administrative & Support | 9 (39.1%) | 14 (60.9%) |
| Educational Services | 0 (0.0%) | 18 (100.0%) |
| Health Care & Social Assistance | 4 (12.5%) | 28 (87.5%) |
| Arts, Entertainment & Recreation | 0 (0.0%) | 0 (0.0%) |
| Accommodation & Food Services | 5 (13.5%) | 32 (86.5%) |
| Public Administration | 14 (58.3%) | 10 (41.7%) |
| Total | 132 (49.1%) | 137 (50.9%) |
Education in Lake Arthur Estates
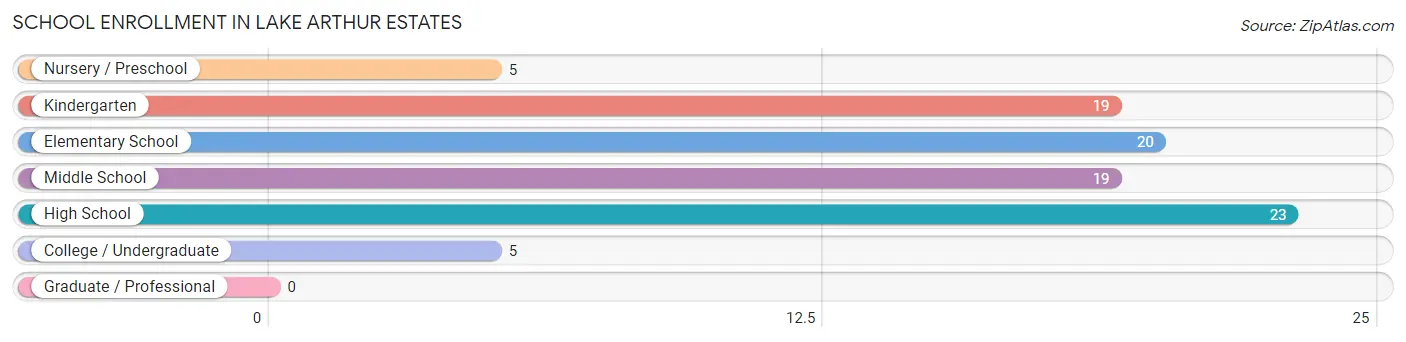
School Enrollment in Lake Arthur Estates
The most common levels of schooling among the 91 students in Lake Arthur Estates are high school (23 | 25.3%), elementary school (20 | 22.0%), and kindergarten (19 | 20.9%).
| School Level | # Students | % Students |
| Nursery / Preschool | 5 | 5.5% |
| Kindergarten | 19 | 20.9% |
| Elementary School | 20 | 22.0% |
| Middle School | 19 | 20.9% |
| High School | 23 | 25.3% |
| College / Undergraduate | 5 | 5.5% |
| Graduate / Professional | 0 | 0.0% |
| Total | 91 | 100.0% |
School Enrollment by Age by Funding Source in Lake Arthur Estates
Out of a total of 91 students who are enrolled in schools in Lake Arthur Estates, 20 (22.0%) attend a private institution, while the remaining 71 (78.0%) are enrolled in public schools. The age group of 25 to 34 year olds has the highest likelihood of being enrolled in private schools, with 5 (100.0% in the age bracket) enrolled. Conversely, the age group of 5 to 9 year old has the lowest likelihood of being enrolled in a private school, with 35 (89.7% in the age bracket) attending a public institution.
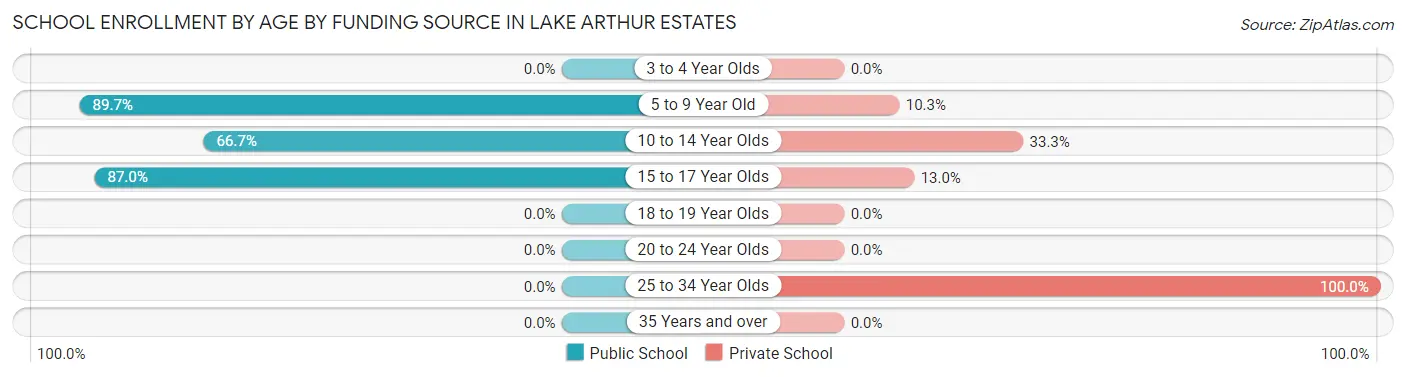
| Age Bracket | Public School | Private School |
| 3 to 4 Year Olds | 0 (0.0%) | 0 (0.0%) |
| 5 to 9 Year Old | 35 (89.7%) | 4 (10.3%) |
| 10 to 14 Year Olds | 16 (66.7%) | 8 (33.3%) |
| 15 to 17 Year Olds | 20 (87.0%) | 3 (13.0%) |
| 18 to 19 Year Olds | 0 (0.0%) | 0 (0.0%) |
| 20 to 24 Year Olds | 0 (0.0%) | 0 (0.0%) |
| 25 to 34 Year Olds | 0 (0.0%) | 5 (100.0%) |
| 35 Years and over | 0 (0.0%) | 0 (0.0%) |
| Total | 71 (78.0%) | 20 (22.0%) |
Educational Attainment by Field of Study in Lake Arthur Estates
Business (33 | 40.2%), education (23 | 28.1%), literature & languages (18 | 22.0%), science & technology (4 | 4.9%), and arts & humanities (4 | 4.9%) are the most common fields of study among 82 individuals in Lake Arthur Estates who have obtained a bachelor's degree or higher.
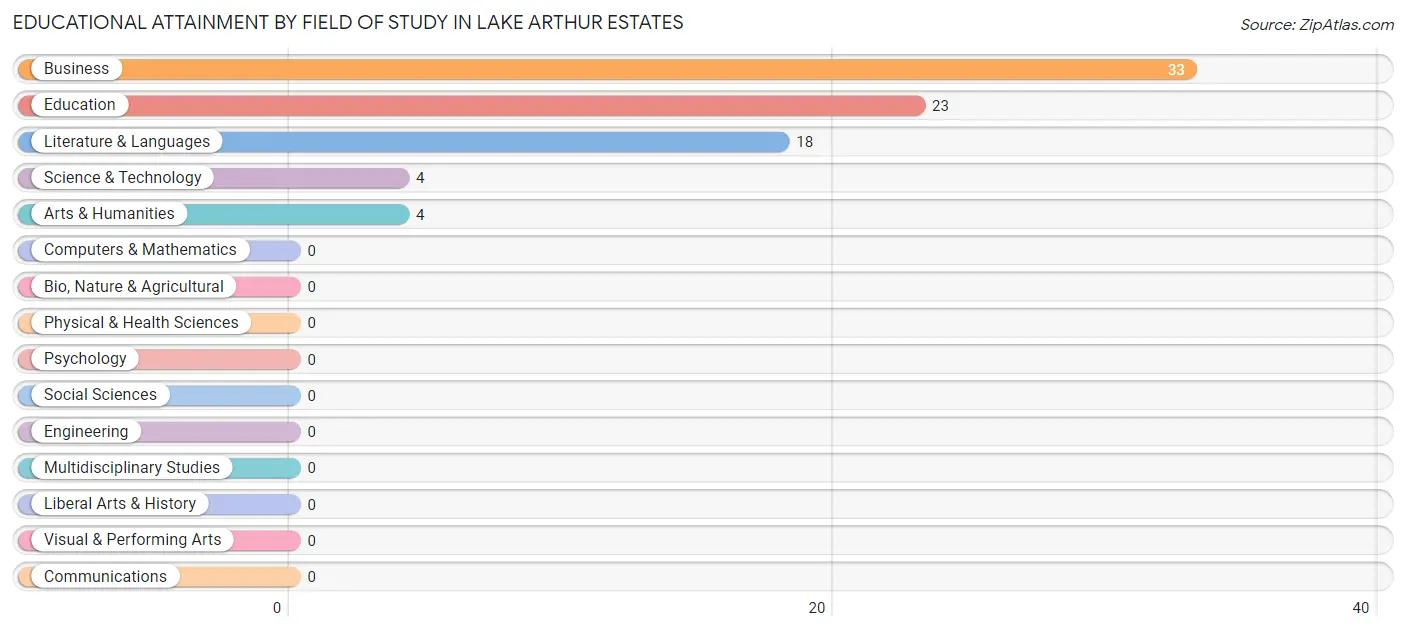
| Field of Study | # Graduates | % Graduates |
| Computers & Mathematics | 0 | 0.0% |
| Bio, Nature & Agricultural | 0 | 0.0% |
| Physical & Health Sciences | 0 | 0.0% |
| Psychology | 0 | 0.0% |
| Social Sciences | 0 | 0.0% |
| Engineering | 0 | 0.0% |
| Multidisciplinary Studies | 0 | 0.0% |
| Science & Technology | 4 | 4.9% |
| Business | 33 | 40.2% |
| Education | 23 | 28.1% |
| Literature & Languages | 18 | 22.0% |
| Liberal Arts & History | 0 | 0.0% |
| Visual & Performing Arts | 0 | 0.0% |
| Communications | 0 | 0.0% |
| Arts & Humanities | 4 | 4.9% |
| Total | 82 | 100.0% |
Transportation & Commute in Lake Arthur Estates
Vehicle Availability by Sex in Lake Arthur Estates
The most prevalent vehicle ownership categories in Lake Arthur Estates are males with 2 vehicles (67, accounting for 50.8%) and females with 2 vehicles (59, making up 48.9%).
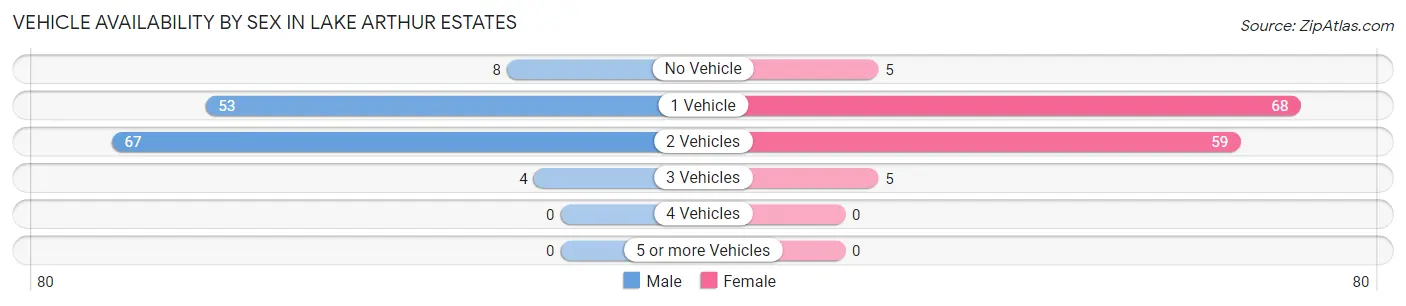
| Vehicles Available | Male | Female |
| No Vehicle | 8 (6.1%) | 5 (3.6%) |
| 1 Vehicle | 53 (40.2%) | 68 (49.6%) |
| 2 Vehicles | 67 (50.8%) | 59 (43.1%) |
| 3 Vehicles | 4 (3.0%) | 5 (3.6%) |
| 4 Vehicles | 0 (0.0%) | 0 (0.0%) |
| 5 or more Vehicles | 0 (0.0%) | 0 (0.0%) |
| Total | 132 (100.0%) | 137 (100.0%) |
Commute Time in Lake Arthur Estates
The most frequently occuring commute durations in Lake Arthur Estates are 30 to 34 minutes (90 commuters, 37.7%), 25 to 29 minutes (46 commuters, 19.3%), and 15 to 19 minutes (42 commuters, 17.6%).
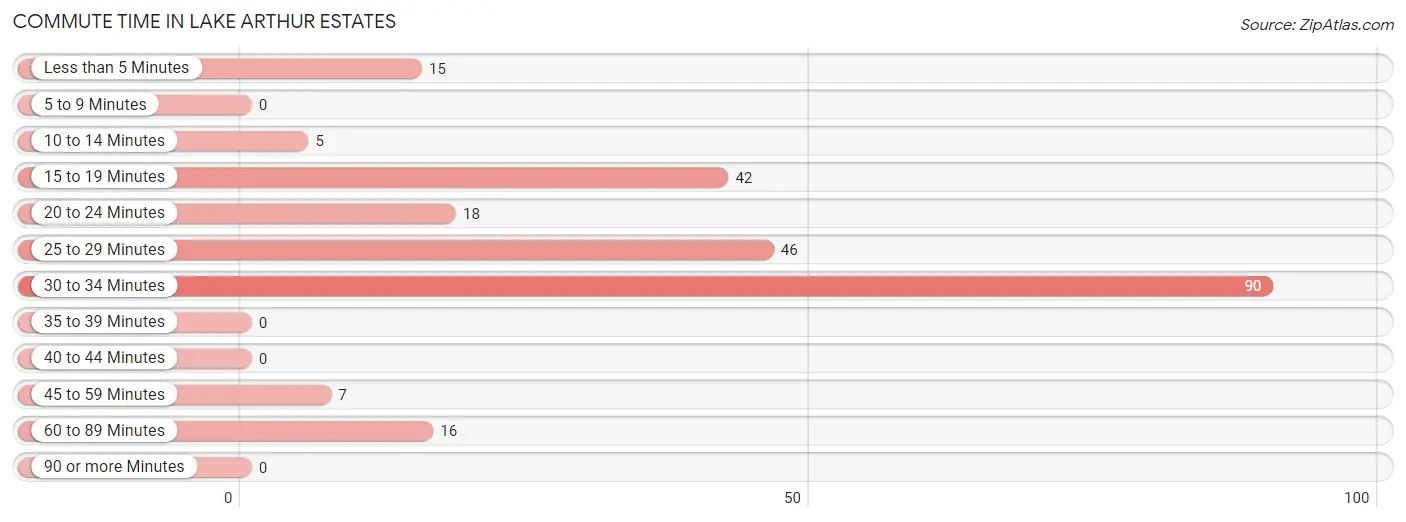
| Commute Time | # Commuters | % Commuters |
| Less than 5 Minutes | 15 | 6.3% |
| 5 to 9 Minutes | 0 | 0.0% |
| 10 to 14 Minutes | 5 | 2.1% |
| 15 to 19 Minutes | 42 | 17.6% |
| 20 to 24 Minutes | 18 | 7.5% |
| 25 to 29 Minutes | 46 | 19.3% |
| 30 to 34 Minutes | 90 | 37.7% |
| 35 to 39 Minutes | 0 | 0.0% |
| 40 to 44 Minutes | 0 | 0.0% |
| 45 to 59 Minutes | 7 | 2.9% |
| 60 to 89 Minutes | 16 | 6.7% |
| 90 or more Minutes | 0 | 0.0% |
Commute Time by Sex in Lake Arthur Estates
The most common commute times in Lake Arthur Estates are 30 to 34 minutes (62 commuters, 47.0%) for males and 25 to 29 minutes (30 commuters, 28.0%) for females.
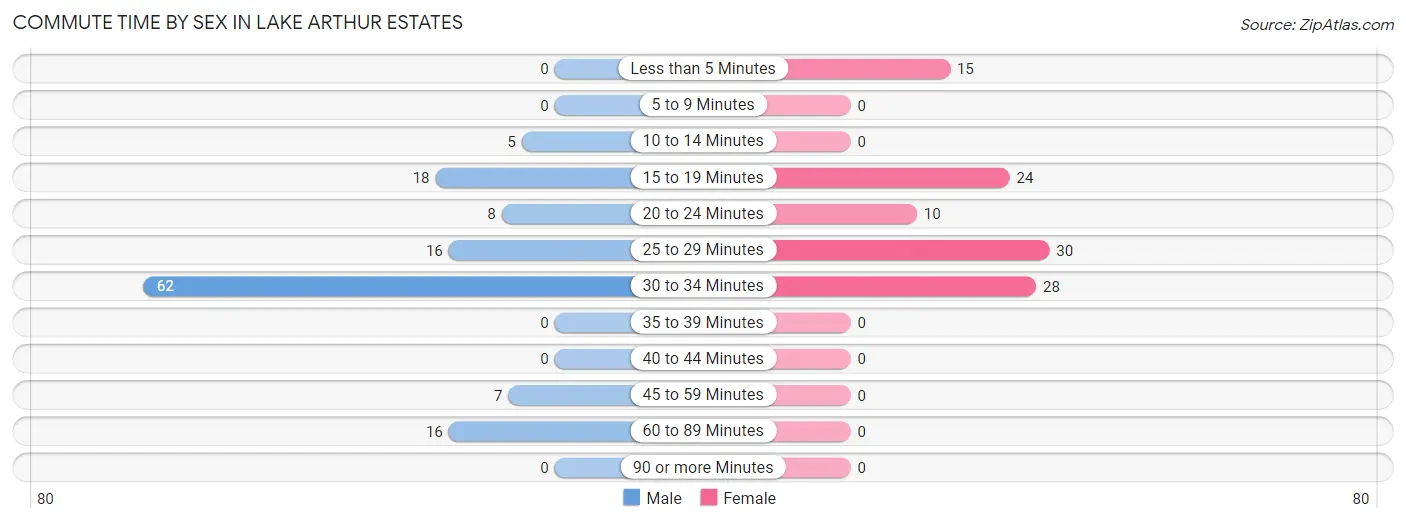
| Commute Time | Male | Female |
| Less than 5 Minutes | 0 (0.0%) | 15 (14.0%) |
| 5 to 9 Minutes | 0 (0.0%) | 0 (0.0%) |
| 10 to 14 Minutes | 5 (3.8%) | 0 (0.0%) |
| 15 to 19 Minutes | 18 (13.6%) | 24 (22.4%) |
| 20 to 24 Minutes | 8 (6.1%) | 10 (9.3%) |
| 25 to 29 Minutes | 16 (12.1%) | 30 (28.0%) |
| 30 to 34 Minutes | 62 (47.0%) | 28 (26.2%) |
| 35 to 39 Minutes | 0 (0.0%) | 0 (0.0%) |
| 40 to 44 Minutes | 0 (0.0%) | 0 (0.0%) |
| 45 to 59 Minutes | 7 (5.3%) | 0 (0.0%) |
| 60 to 89 Minutes | 16 (12.1%) | 0 (0.0%) |
| 90 or more Minutes | 0 (0.0%) | 0 (0.0%) |
Time of Departure to Work by Sex in Lake Arthur Estates
The most frequent times of departure to work in Lake Arthur Estates are 5:00 AM to 5:29 AM (31, 23.5%) for males and 9:00 AM to 9:59 AM (26, 24.3%) for females.
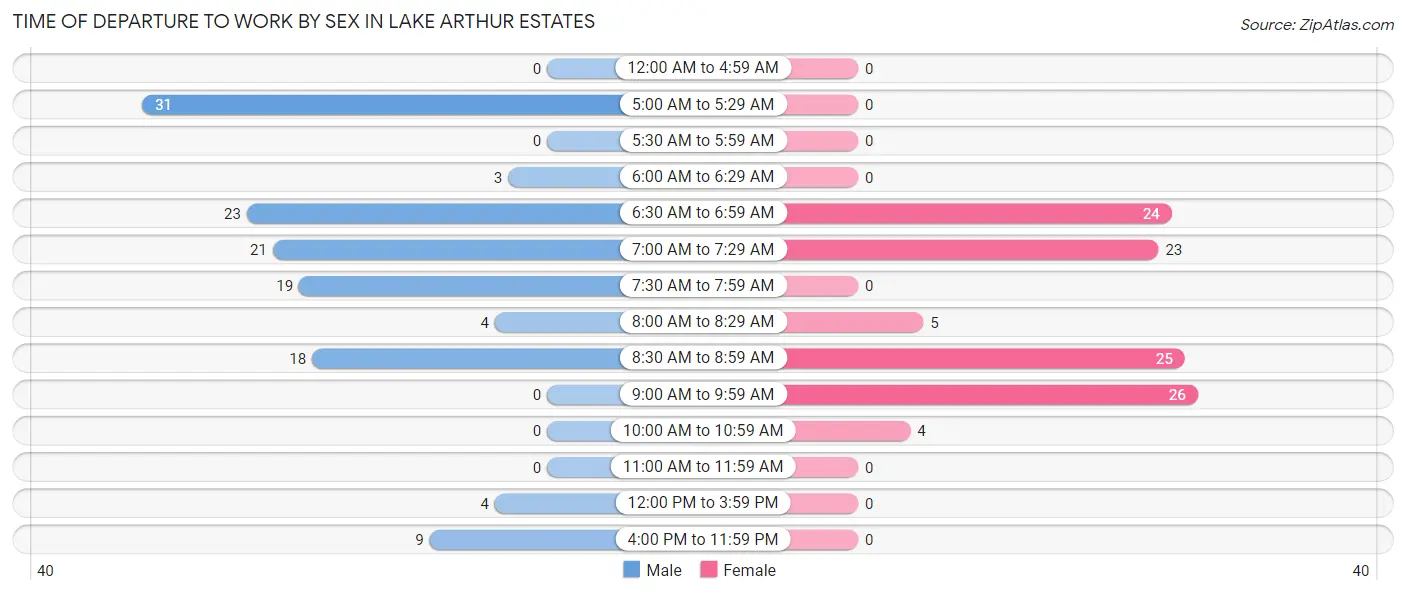
| Time of Departure | Male | Female |
| 12:00 AM to 4:59 AM | 0 (0.0%) | 0 (0.0%) |
| 5:00 AM to 5:29 AM | 31 (23.5%) | 0 (0.0%) |
| 5:30 AM to 5:59 AM | 0 (0.0%) | 0 (0.0%) |
| 6:00 AM to 6:29 AM | 3 (2.3%) | 0 (0.0%) |
| 6:30 AM to 6:59 AM | 23 (17.4%) | 24 (22.4%) |
| 7:00 AM to 7:29 AM | 21 (15.9%) | 23 (21.5%) |
| 7:30 AM to 7:59 AM | 19 (14.4%) | 0 (0.0%) |
| 8:00 AM to 8:29 AM | 4 (3.0%) | 5 (4.7%) |
| 8:30 AM to 8:59 AM | 18 (13.6%) | 25 (23.4%) |
| 9:00 AM to 9:59 AM | 0 (0.0%) | 26 (24.3%) |
| 10:00 AM to 10:59 AM | 0 (0.0%) | 4 (3.7%) |
| 11:00 AM to 11:59 AM | 0 (0.0%) | 0 (0.0%) |
| 12:00 PM to 3:59 PM | 4 (3.0%) | 0 (0.0%) |
| 4:00 PM to 11:59 PM | 9 (6.8%) | 0 (0.0%) |
| Total | 132 (100.0%) | 107 (100.0%) |
Housing Occupancy in Lake Arthur Estates
Occupancy by Ownership in Lake Arthur Estates
Of the total 239 dwellings in Lake Arthur Estates, owner-occupied units account for 229 (95.8%), while renter-occupied units make up 10 (4.2%).
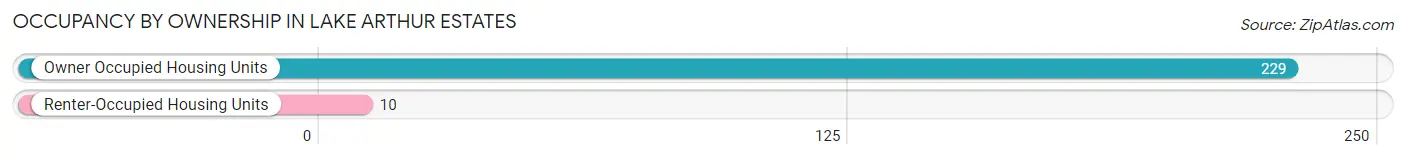
| Occupancy | # Housing Units | % Housing Units |
| Owner Occupied Housing Units | 229 | 95.8% |
| Renter-Occupied Housing Units | 10 | 4.2% |
| Total Occupied Housing Units | 239 | 100.0% |
Occupancy by Household Size in Lake Arthur Estates

| Household Size | # Housing Units | % Housing Units |
| 1-Person Household | 115 | 48.1% |
| 2-Person Household | 71 | 29.7% |
| 3-Person Household | 30 | 12.6% |
| 4+ Person Household | 23 | 9.6% |
| Total Housing Units | 239 | 100.0% |
Occupancy by Ownership by Household Size in Lake Arthur Estates
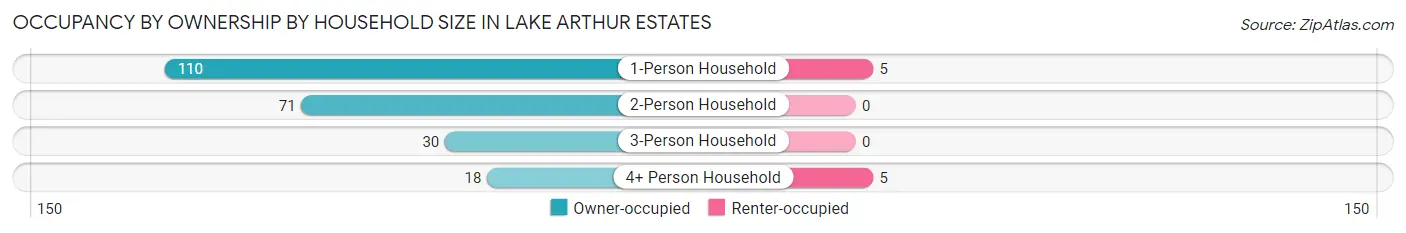
| Household Size | Owner-occupied | Renter-occupied |
| 1-Person Household | 110 (95.7%) | 5 (4.3%) |
| 2-Person Household | 71 (100.0%) | 0 (0.0%) |
| 3-Person Household | 30 (100.0%) | 0 (0.0%) |
| 4+ Person Household | 18 (78.3%) | 5 (21.7%) |
| Total Housing Units | 229 (95.8%) | 10 (4.2%) |
Occupancy by Educational Attainment in Lake Arthur Estates
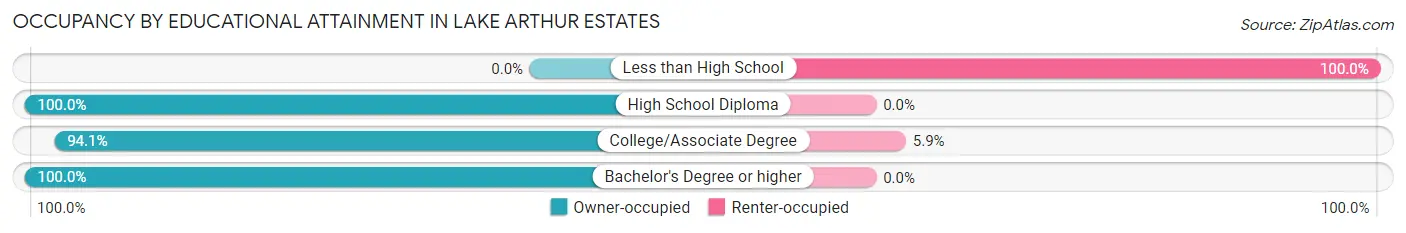
| Household Size | Owner-occupied | Renter-occupied |
| Less than High School | 0 (0.0%) | 5 (100.0%) |
| High School Diploma | 121 (100.0%) | 0 (0.0%) |
| College/Associate Degree | 80 (94.1%) | 5 (5.9%) |
| Bachelor's Degree or higher | 28 (100.0%) | 0 (0.0%) |
Occupancy by Age of Householder in Lake Arthur Estates
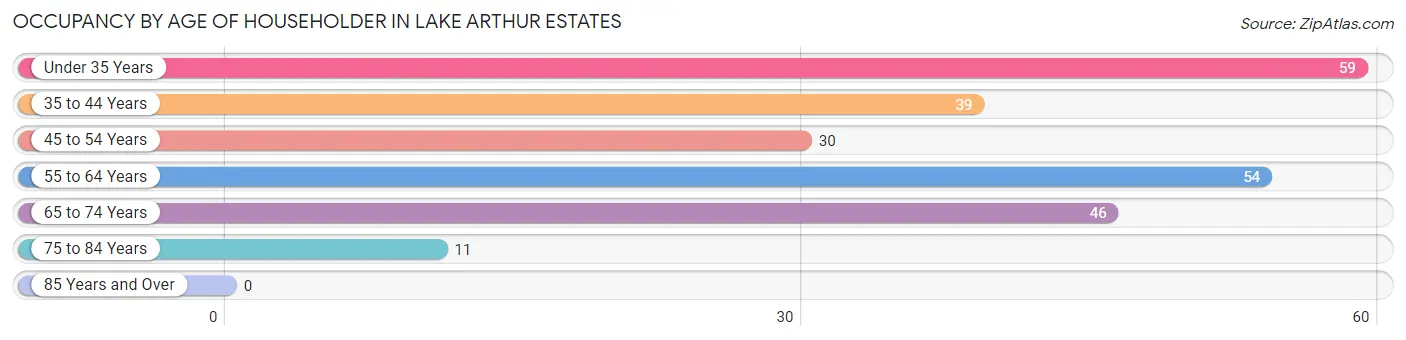
| Age Bracket | # Households | % Households |
| Under 35 Years | 59 | 24.7% |
| 35 to 44 Years | 39 | 16.3% |
| 45 to 54 Years | 30 | 12.6% |
| 55 to 64 Years | 54 | 22.6% |
| 65 to 74 Years | 46 | 19.3% |
| 75 to 84 Years | 11 | 4.6% |
| 85 Years and Over | 0 | 0.0% |
| Total | 239 | 100.0% |
Housing Finances in Lake Arthur Estates
Median Income by Occupancy in Lake Arthur Estates
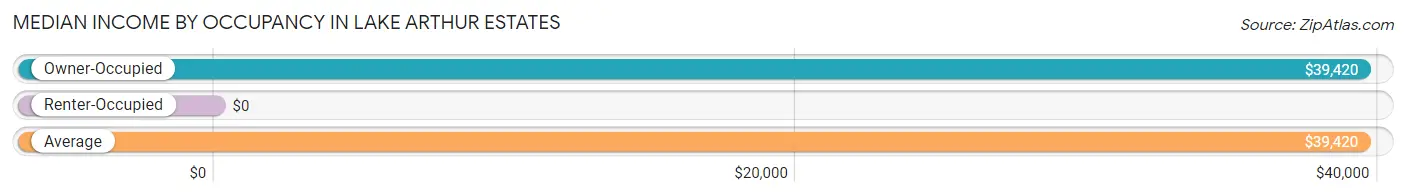
| Occupancy Type | # Households | Median Income |
| Owner-Occupied | 229 (95.8%) | $39,420 |
| Renter-Occupied | 10 (4.2%) | $0 |
| Average | 239 (100.0%) | $39,420 |
Occupancy by Householder Income Bracket in Lake Arthur Estates
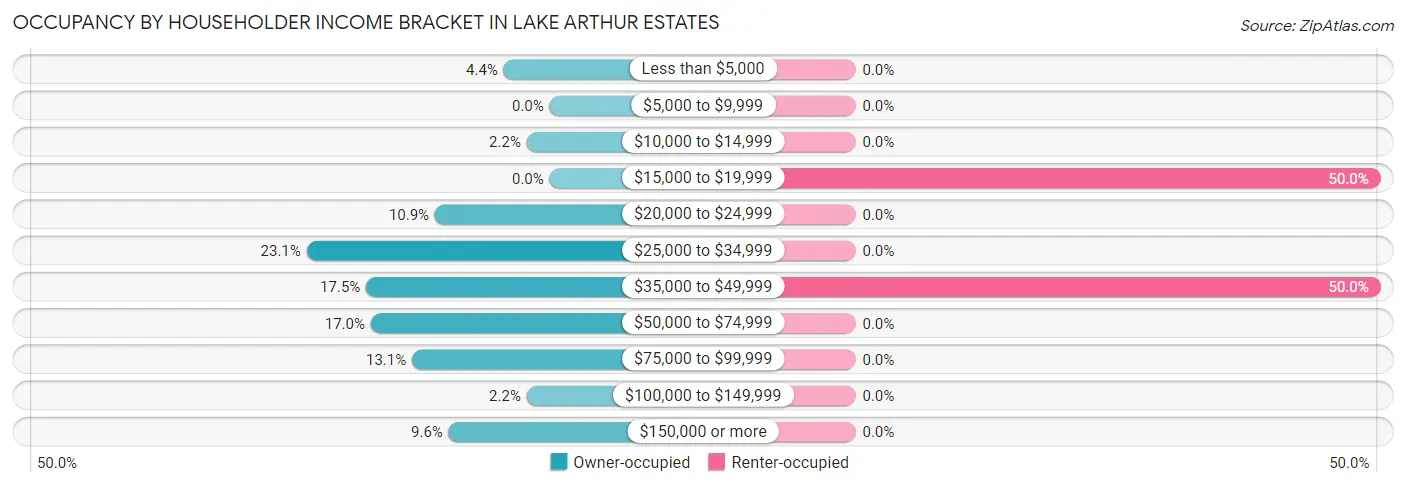
| Income Bracket | Owner-occupied | Renter-occupied |
| Less than $5,000 | 10 (4.4%) | 0 (0.0%) |
| $5,000 to $9,999 | 0 (0.0%) | 0 (0.0%) |
| $10,000 to $14,999 | 5 (2.2%) | 0 (0.0%) |
| $15,000 to $19,999 | 0 (0.0%) | 5 (50.0%) |
| $20,000 to $24,999 | 25 (10.9%) | 0 (0.0%) |
| $25,000 to $34,999 | 53 (23.1%) | 0 (0.0%) |
| $35,000 to $49,999 | 40 (17.5%) | 5 (50.0%) |
| $50,000 to $74,999 | 39 (17.0%) | 0 (0.0%) |
| $75,000 to $99,999 | 30 (13.1%) | 0 (0.0%) |
| $100,000 to $149,999 | 5 (2.2%) | 0 (0.0%) |
| $150,000 or more | 22 (9.6%) | 0 (0.0%) |
| Total | 229 (100.0%) | 10 (100.0%) |
Monthly Housing Cost Tiers in Lake Arthur Estates
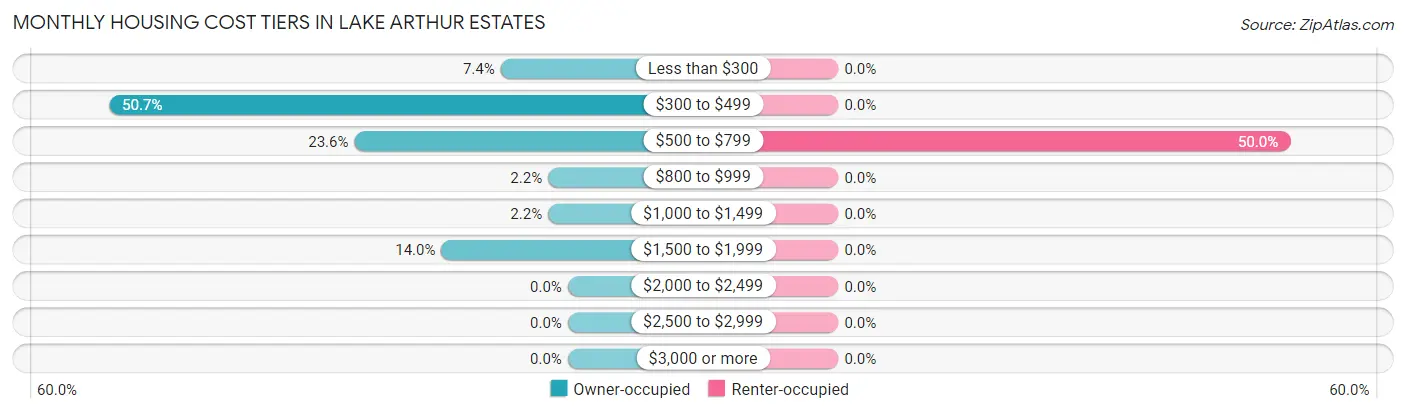
| Monthly Cost | Owner-occupied | Renter-occupied |
| Less than $300 | 17 (7.4%) | 0 (0.0%) |
| $300 to $499 | 116 (50.7%) | 0 (0.0%) |
| $500 to $799 | 54 (23.6%) | 5 (50.0%) |
| $800 to $999 | 5 (2.2%) | 0 (0.0%) |
| $1,000 to $1,499 | 5 (2.2%) | 0 (0.0%) |
| $1,500 to $1,999 | 32 (14.0%) | 0 (0.0%) |
| $2,000 to $2,499 | 0 (0.0%) | 0 (0.0%) |
| $2,500 to $2,999 | 0 (0.0%) | 0 (0.0%) |
| $3,000 or more | 0 (0.0%) | 0 (0.0%) |
| Total | 229 (100.0%) | 10 (100.0%) |
Physical Housing Characteristics in Lake Arthur Estates
Housing Structures in Lake Arthur Estates
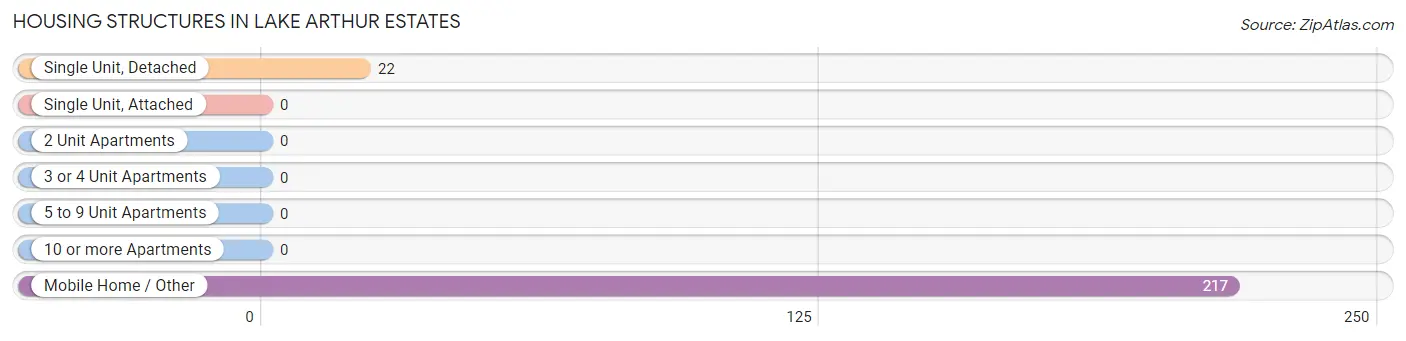
| Structure Type | # Housing Units | % Housing Units |
| Single Unit, Detached | 22 | 9.2% |
| Single Unit, Attached | 0 | 0.0% |
| 2 Unit Apartments | 0 | 0.0% |
| 3 or 4 Unit Apartments | 0 | 0.0% |
| 5 to 9 Unit Apartments | 0 | 0.0% |
| 10 or more Apartments | 0 | 0.0% |
| Mobile Home / Other | 217 | 90.8% |
| Total | 239 | 100.0% |
Housing Structures by Occupancy in Lake Arthur Estates
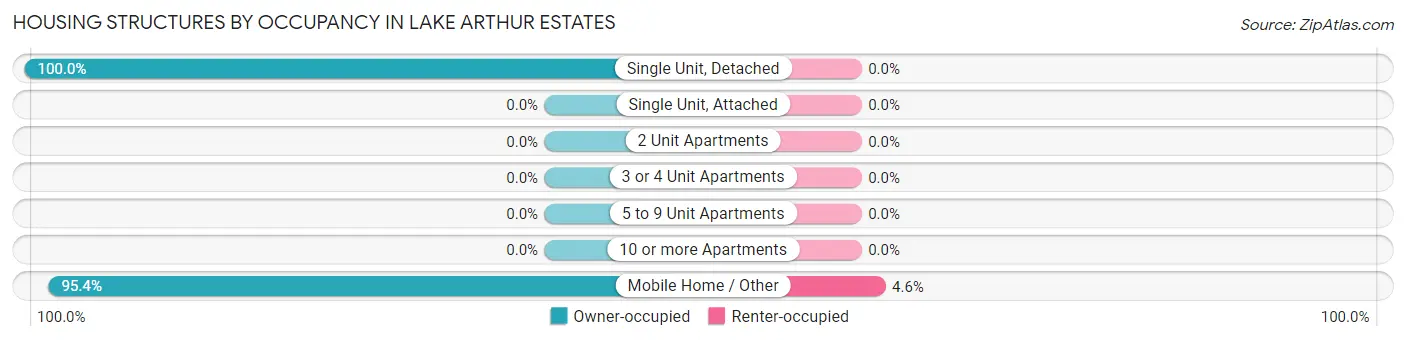
| Structure Type | Owner-occupied | Renter-occupied |
| Single Unit, Detached | 22 (100.0%) | 0 (0.0%) |
| Single Unit, Attached | 0 (0.0%) | 0 (0.0%) |
| 2 Unit Apartments | 0 (0.0%) | 0 (0.0%) |
| 3 or 4 Unit Apartments | 0 (0.0%) | 0 (0.0%) |
| 5 to 9 Unit Apartments | 0 (0.0%) | 0 (0.0%) |
| 10 or more Apartments | 0 (0.0%) | 0 (0.0%) |
| Mobile Home / Other | 207 (95.4%) | 10 (4.6%) |
| Total | 229 (95.8%) | 10 (4.2%) |
Housing Structures by Number of Rooms in Lake Arthur Estates
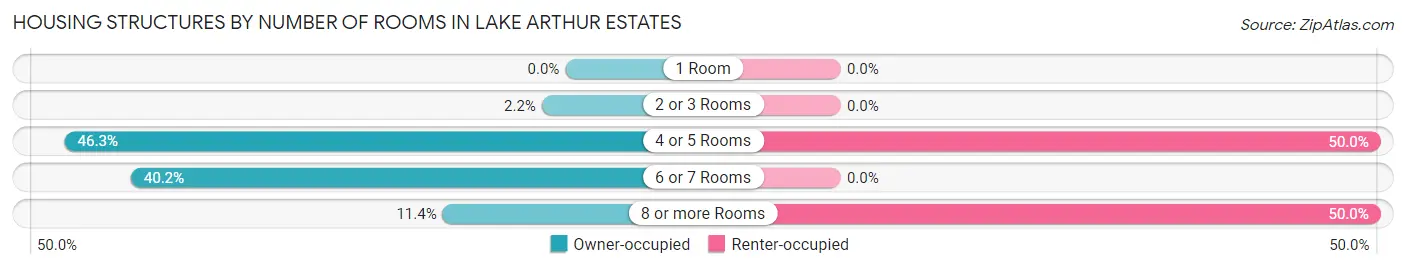
| Number of Rooms | Owner-occupied | Renter-occupied |
| 1 Room | 0 (0.0%) | 0 (0.0%) |
| 2 or 3 Rooms | 5 (2.2%) | 0 (0.0%) |
| 4 or 5 Rooms | 106 (46.3%) | 5 (50.0%) |
| 6 or 7 Rooms | 92 (40.2%) | 0 (0.0%) |
| 8 or more Rooms | 26 (11.4%) | 5 (50.0%) |
| Total | 229 (100.0%) | 10 (100.0%) |
Housing Structure by Heating Type in Lake Arthur Estates
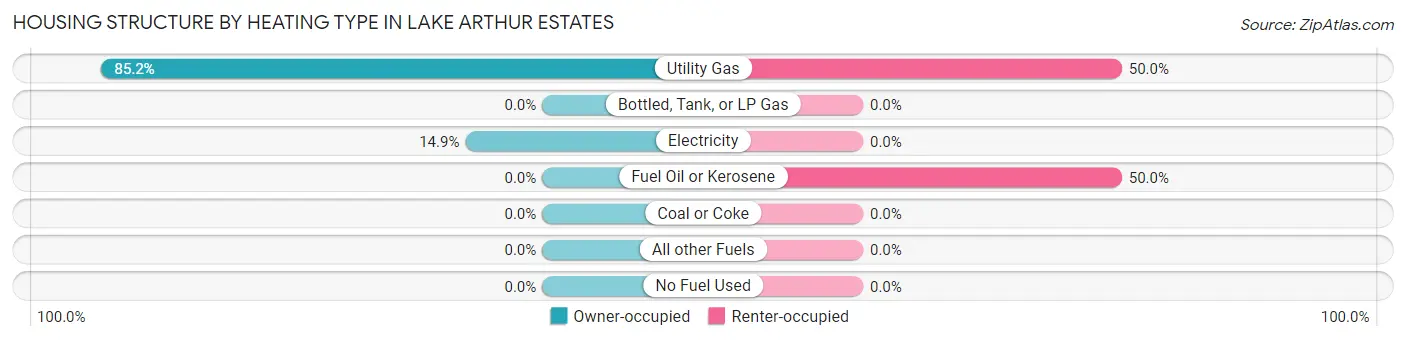
| Heating Type | Owner-occupied | Renter-occupied |
| Utility Gas | 195 (85.2%) | 5 (50.0%) |
| Bottled, Tank, or LP Gas | 0 (0.0%) | 0 (0.0%) |
| Electricity | 34 (14.8%) | 0 (0.0%) |
| Fuel Oil or Kerosene | 0 (0.0%) | 5 (50.0%) |
| Coal or Coke | 0 (0.0%) | 0 (0.0%) |
| All other Fuels | 0 (0.0%) | 0 (0.0%) |
| No Fuel Used | 0 (0.0%) | 0 (0.0%) |
| Total | 229 (100.0%) | 10 (100.0%) |
Household Vehicle Usage in Lake Arthur Estates
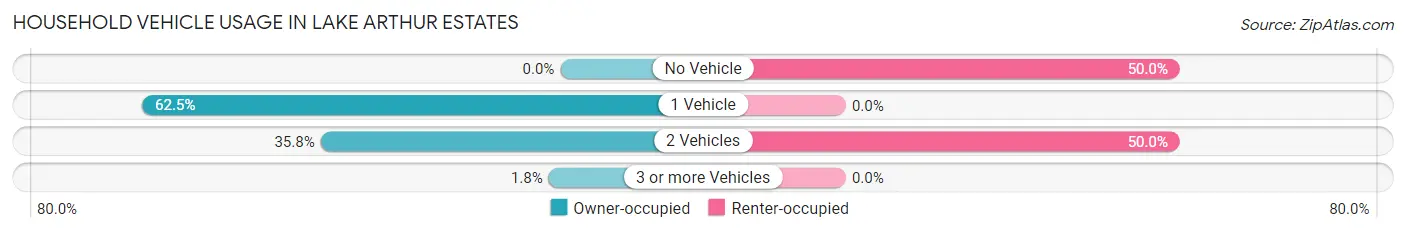
| Vehicles per Household | Owner-occupied | Renter-occupied |
| No Vehicle | 0 (0.0%) | 5 (50.0%) |
| 1 Vehicle | 143 (62.5%) | 0 (0.0%) |
| 2 Vehicles | 82 (35.8%) | 5 (50.0%) |
| 3 or more Vehicles | 4 (1.8%) | 0 (0.0%) |
| Total | 229 (100.0%) | 10 (100.0%) |
Real Estate & Mortgages in Lake Arthur Estates
Real Estate and Mortgage Overview in Lake Arthur Estates
| Characteristic | Without Mortgage | With Mortgage |
| Housing Units | 192 | 37 |
| Median Property Value | $9,999 | $0 |
| Median Household Income | $38,684 | $22 |
| Monthly Housing Costs | $420 | $0 |
| Real Estate Taxes | $199 | $0 |
Property Value by Mortgage Status in Lake Arthur Estates
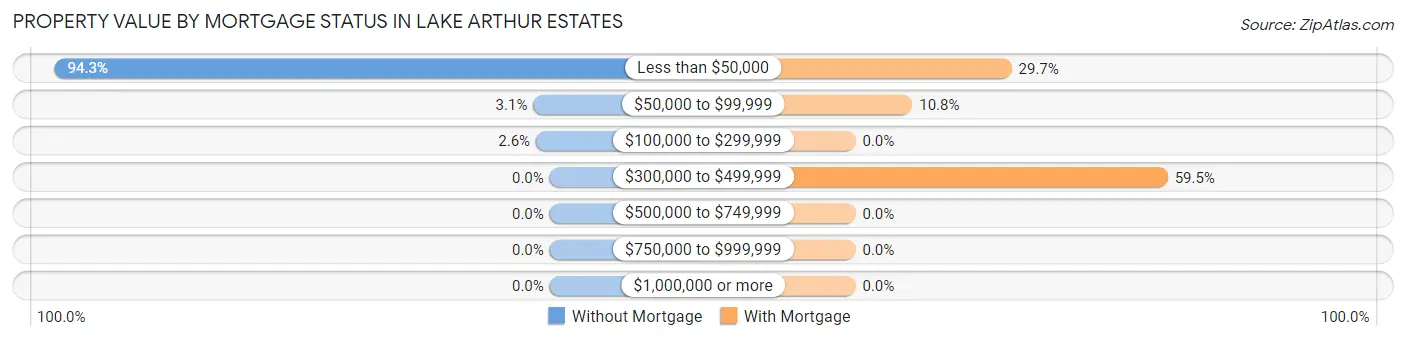
| Property Value | Without Mortgage | With Mortgage |
| Less than $50,000 | 181 (94.3%) | 11 (29.7%) |
| $50,000 to $99,999 | 6 (3.1%) | 4 (10.8%) |
| $100,000 to $299,999 | 5 (2.6%) | 0 (0.0%) |
| $300,000 to $499,999 | 0 (0.0%) | 22 (59.5%) |
| $500,000 to $749,999 | 0 (0.0%) | 0 (0.0%) |
| $750,000 to $999,999 | 0 (0.0%) | 0 (0.0%) |
| $1,000,000 or more | 0 (0.0%) | 0 (0.0%) |
| Total | 192 (100.0%) | 37 (100.0%) |
Household Income by Mortgage Status in Lake Arthur Estates
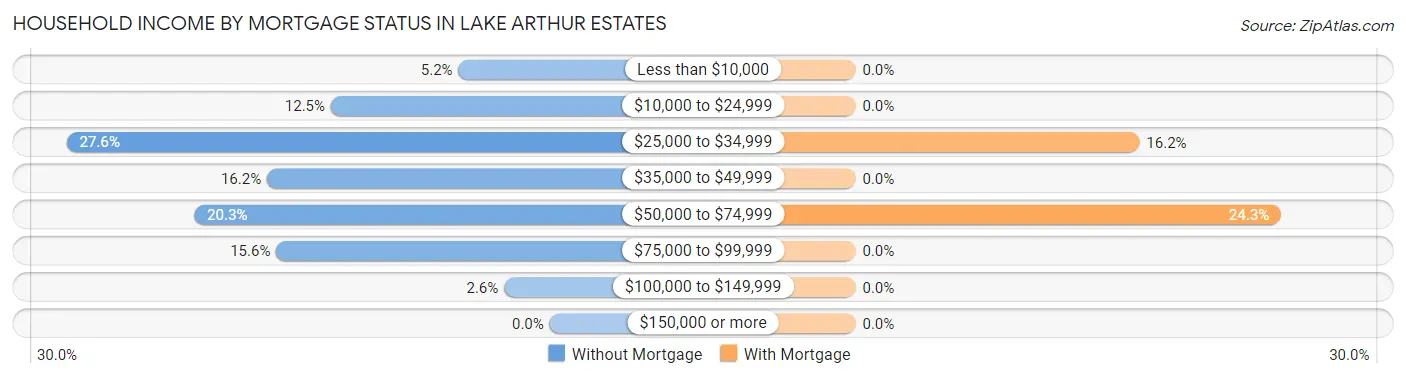
| Household Income | Without Mortgage | With Mortgage |
| Less than $10,000 | 10 (5.2%) | 0 (0.0%) |
| $10,000 to $24,999 | 24 (12.5%) | 0 (0.0%) |
| $25,000 to $34,999 | 53 (27.6%) | 6 (16.2%) |
| $35,000 to $49,999 | 31 (16.2%) | 0 (0.0%) |
| $50,000 to $74,999 | 39 (20.3%) | 9 (24.3%) |
| $75,000 to $99,999 | 30 (15.6%) | 0 (0.0%) |
| $100,000 to $149,999 | 5 (2.6%) | 0 (0.0%) |
| $150,000 or more | 0 (0.0%) | 0 (0.0%) |
| Total | 192 (100.0%) | 37 (100.0%) |
Property Value to Household Income Ratio in Lake Arthur Estates
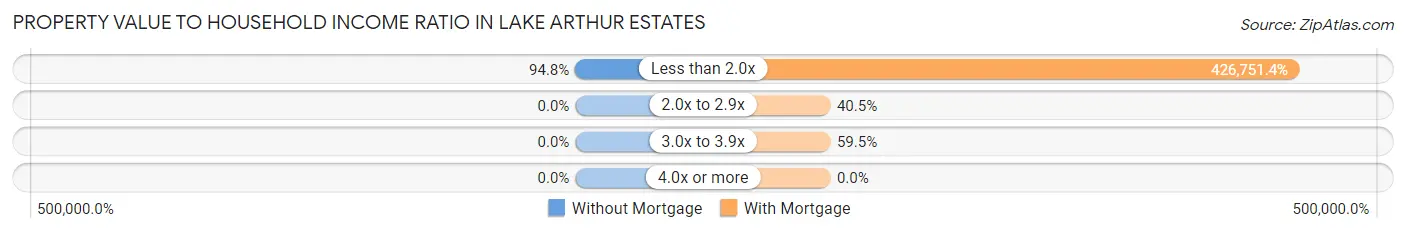
| Value-to-Income Ratio | Without Mortgage | With Mortgage |
| Less than 2.0x | 182 (94.8%) | 157,898 (426,751.4%) |
| 2.0x to 2.9x | 0 (0.0%) | 15 (40.5%) |
| 3.0x to 3.9x | 0 (0.0%) | 22 (59.5%) |
| 4.0x or more | 0 (0.0%) | 0 (0.0%) |
| Total | 192 (100.0%) | 37 (100.0%) |
Real Estate Taxes by Mortgage Status in Lake Arthur Estates
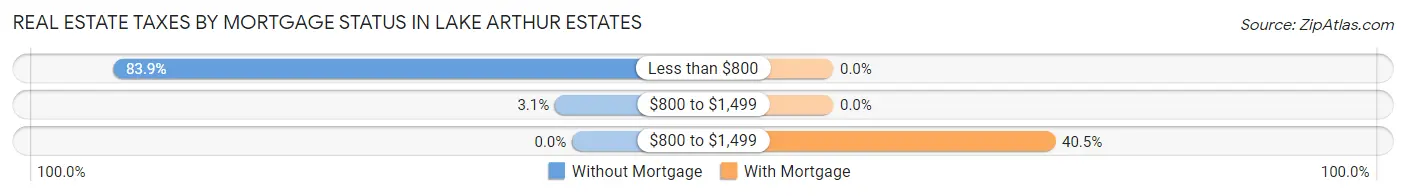
| Property Taxes | Without Mortgage | With Mortgage |
| Less than $800 | 161 (83.9%) | 0 (0.0%) |
| $800 to $1,499 | 6 (3.1%) | 0 (0.0%) |
| $800 to $1,499 | 0 (0.0%) | 15 (40.5%) |
| Total | 192 (100.0%) | 37 (100.0%) |
Health & Disability in Lake Arthur Estates
Health Insurance Coverage by Age in Lake Arthur Estates
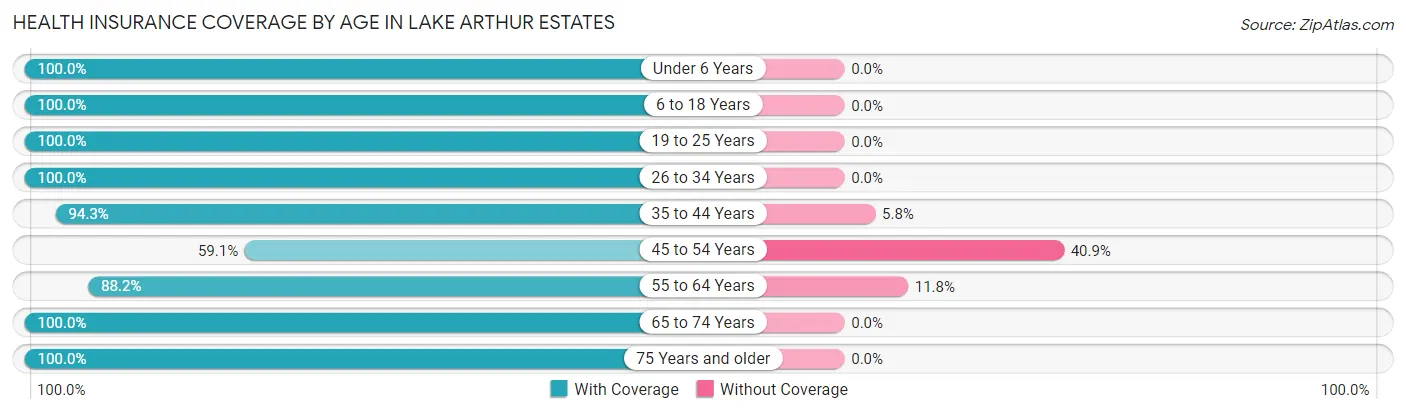
| Age Bracket | With Coverage | Without Coverage |
| Under 6 Years | 34 (100.0%) | 0 (0.0%) |
| 6 to 18 Years | 76 (100.0%) | 0 (0.0%) |
| 19 to 25 Years | 26 (100.0%) | 0 (0.0%) |
| 26 to 34 Years | 64 (100.0%) | 0 (0.0%) |
| 35 to 44 Years | 82 (94.3%) | 5 (5.8%) |
| 45 to 54 Years | 26 (59.1%) | 18 (40.9%) |
| 55 to 64 Years | 67 (88.2%) | 9 (11.8%) |
| 65 to 74 Years | 54 (100.0%) | 0 (0.0%) |
| 75 Years and older | 18 (100.0%) | 0 (0.0%) |
| Total | 447 (93.3%) | 32 (6.7%) |
Health Insurance Coverage by Citizenship Status in Lake Arthur Estates
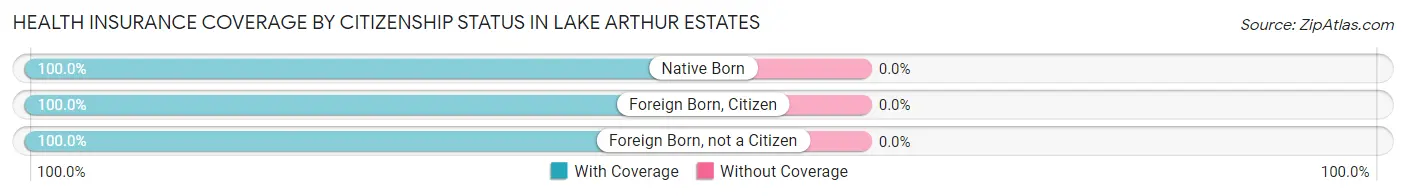
| Citizenship Status | With Coverage | Without Coverage |
| Native Born | 34 (100.0%) | 0 (0.0%) |
| Foreign Born, Citizen | 76 (100.0%) | 0 (0.0%) |
| Foreign Born, not a Citizen | 26 (100.0%) | 0 (0.0%) |
Health Insurance Coverage by Household Income in Lake Arthur Estates
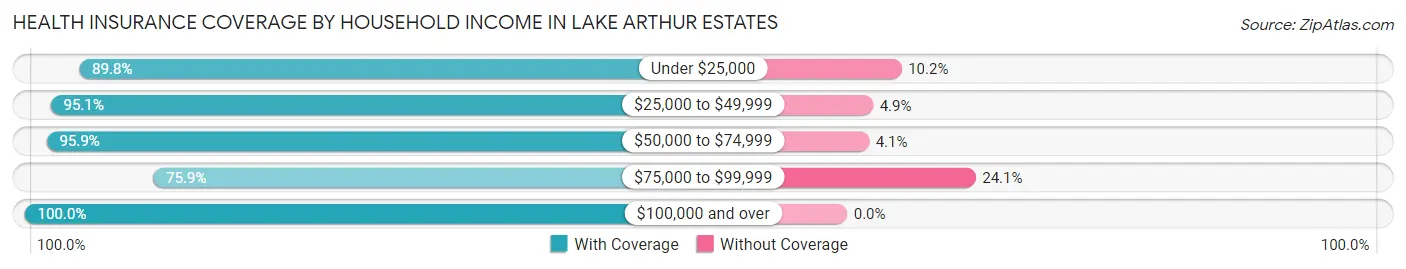
| Household Income | With Coverage | Without Coverage |
| Under $25,000 | 44 (89.8%) | 5 (10.2%) |
| $25,000 to $49,999 | 176 (95.1%) | 9 (4.9%) |
| $50,000 to $74,999 | 117 (95.9%) | 5 (4.1%) |
| $75,000 to $99,999 | 41 (75.9%) | 13 (24.1%) |
| $100,000 and over | 69 (100.0%) | 0 (0.0%) |
Public vs Private Health Insurance Coverage by Age in Lake Arthur Estates
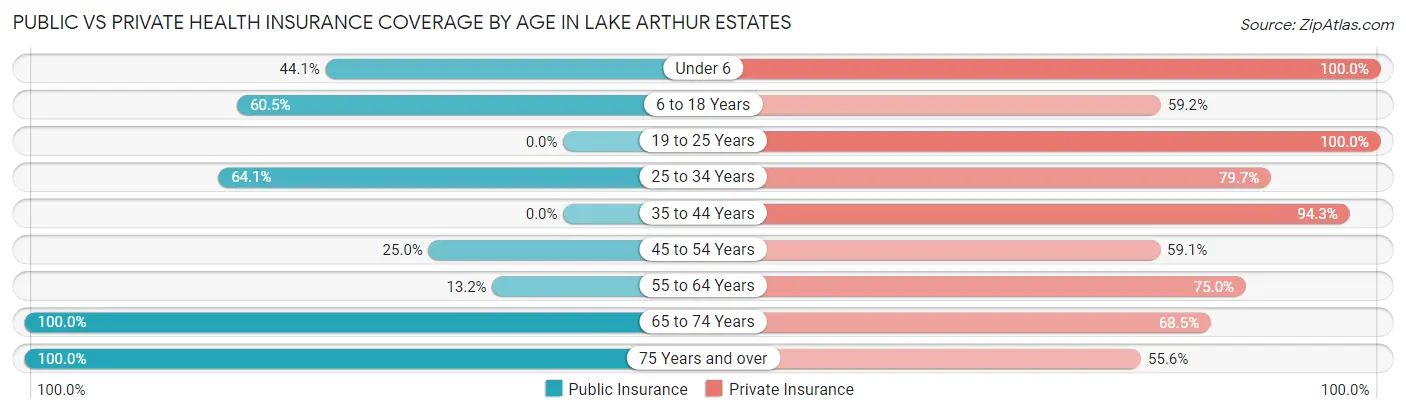
| Age Bracket | Public Insurance | Private Insurance |
| Under 6 | 15 (44.1%) | 34 (100.0%) |
| 6 to 18 Years | 46 (60.5%) | 45 (59.2%) |
| 19 to 25 Years | 0 (0.0%) | 26 (100.0%) |
| 25 to 34 Years | 41 (64.1%) | 51 (79.7%) |
| 35 to 44 Years | 0 (0.0%) | 82 (94.3%) |
| 45 to 54 Years | 11 (25.0%) | 26 (59.1%) |
| 55 to 64 Years | 10 (13.2%) | 57 (75.0%) |
| 65 to 74 Years | 54 (100.0%) | 37 (68.5%) |
| 75 Years and over | 18 (100.0%) | 10 (55.6%) |
| Total | 195 (40.7%) | 368 (76.8%) |
Disability Status by Sex by Age in Lake Arthur Estates
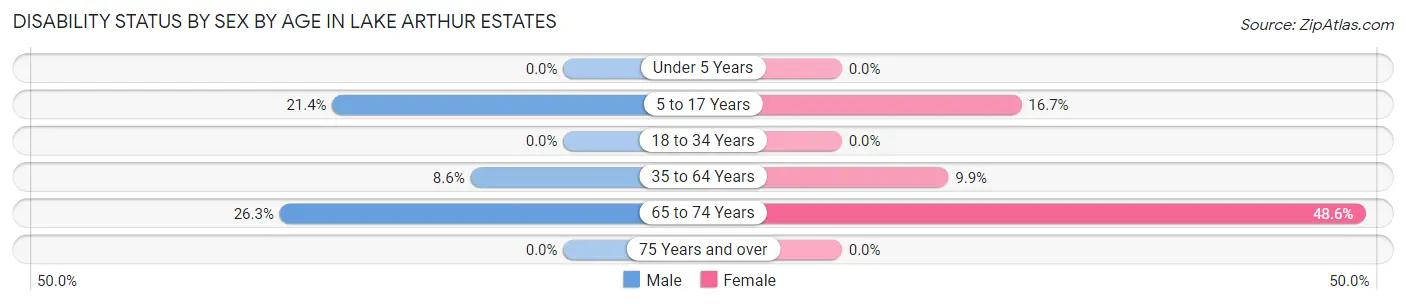
| Age Bracket | Male | Female |
| Under 5 Years | 0 (0.0%) | 0 (0.0%) |
| 5 to 17 Years | 12 (21.4%) | 5 (16.7%) |
| 18 to 34 Years | 0 (0.0%) | 0 (0.0%) |
| 35 to 64 Years | 10 (8.6%) | 9 (9.9%) |
| 65 to 74 Years | 5 (26.3%) | 17 (48.6%) |
| 75 Years and over | 0 (0.0%) | 0 (0.0%) |
Disability Class by Sex by Age in Lake Arthur Estates
Disability Class: Hearing Difficulty
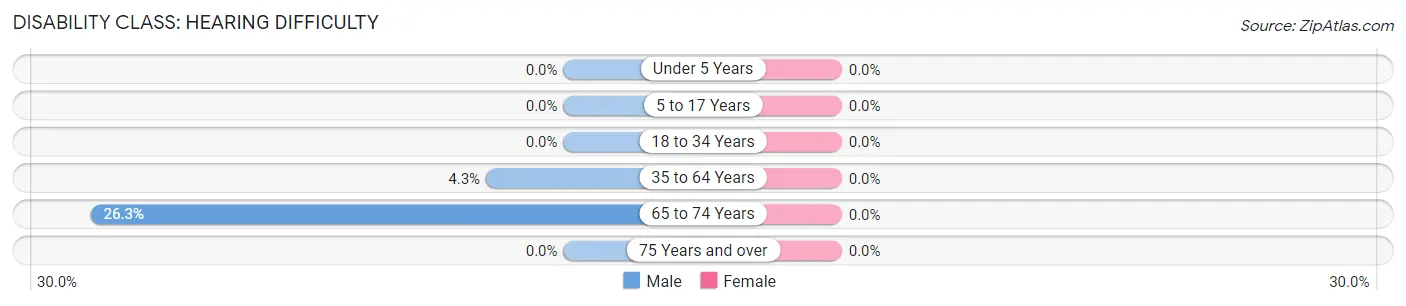
| Age Bracket | Male | Female |
| Under 5 Years | 0 (0.0%) | 0 (0.0%) |
| 5 to 17 Years | 0 (0.0%) | 0 (0.0%) |
| 18 to 34 Years | 0 (0.0%) | 0 (0.0%) |
| 35 to 64 Years | 5 (4.3%) | 0 (0.0%) |
| 65 to 74 Years | 5 (26.3%) | 0 (0.0%) |
| 75 Years and over | 0 (0.0%) | 0 (0.0%) |
Disability Class: Vision Difficulty
| Age Bracket | Male | Female |
| Under 5 Years | 0 (0.0%) | 0 (0.0%) |
| 5 to 17 Years | 0 (0.0%) | 0 (0.0%) |
| 18 to 34 Years | 0 (0.0%) | 0 (0.0%) |
| 35 to 64 Years | 0 (0.0%) | 0 (0.0%) |
| 65 to 74 Years | 0 (0.0%) | 0 (0.0%) |
| 75 Years and over | 0 (0.0%) | 0 (0.0%) |
Disability Class: Cognitive Difficulty
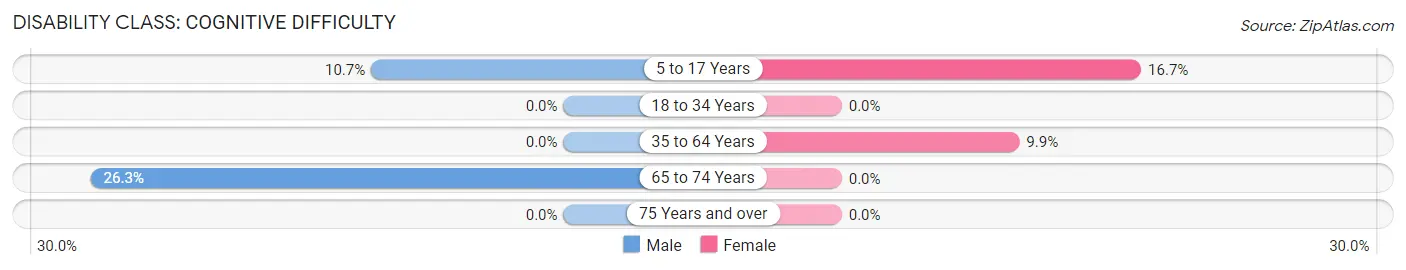
| Age Bracket | Male | Female |
| 5 to 17 Years | 6 (10.7%) | 5 (16.7%) |
| 18 to 34 Years | 0 (0.0%) | 0 (0.0%) |
| 35 to 64 Years | 0 (0.0%) | 9 (9.9%) |
| 65 to 74 Years | 5 (26.3%) | 0 (0.0%) |
| 75 Years and over | 0 (0.0%) | 0 (0.0%) |
Disability Class: Ambulatory Difficulty
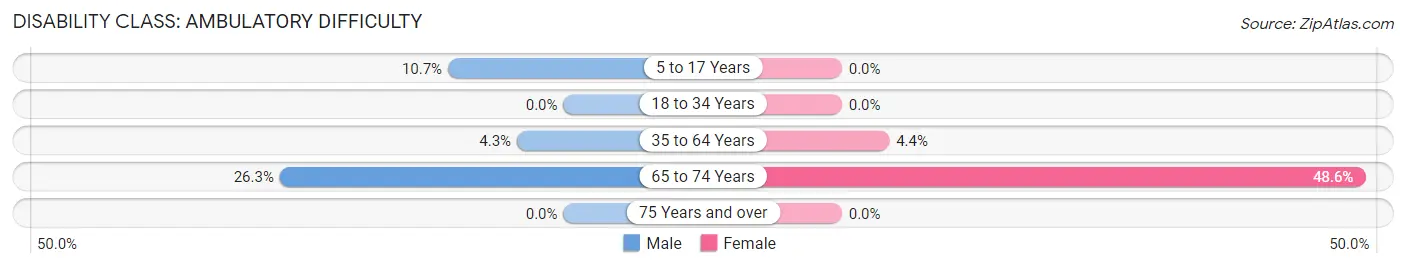
| Age Bracket | Male | Female |
| 5 to 17 Years | 6 (10.7%) | 0 (0.0%) |
| 18 to 34 Years | 0 (0.0%) | 0 (0.0%) |
| 35 to 64 Years | 5 (4.3%) | 4 (4.4%) |
| 65 to 74 Years | 5 (26.3%) | 17 (48.6%) |
| 75 Years and over | 0 (0.0%) | 0 (0.0%) |
Disability Class: Self-Care Difficulty
| Age Bracket | Male | Female |
| 5 to 17 Years | 0 (0.0%) | 0 (0.0%) |
| 18 to 34 Years | 0 (0.0%) | 0 (0.0%) |
| 35 to 64 Years | 0 (0.0%) | 0 (0.0%) |
| 65 to 74 Years | 0 (0.0%) | 0 (0.0%) |
| 75 Years and over | 0 (0.0%) | 0 (0.0%) |
Technology Access in Lake Arthur Estates
Computing Device Access in Lake Arthur Estates
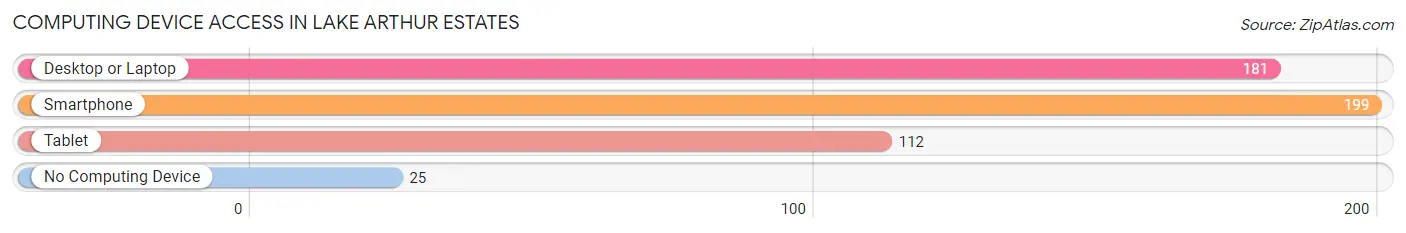
| Device Type | # Households | % Households |
| Desktop or Laptop | 181 | 75.7% |
| Smartphone | 199 | 83.3% |
| Tablet | 112 | 46.9% |
| No Computing Device | 25 | 10.5% |
| Total | 239 | 100.0% |
Internet Access in Lake Arthur Estates
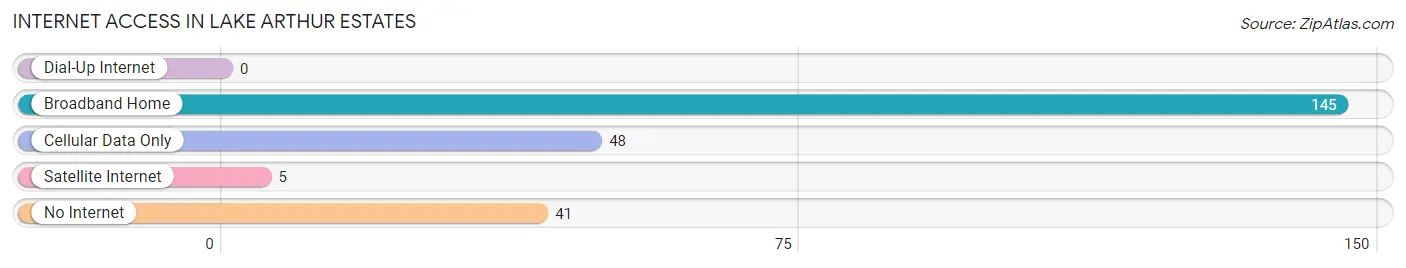
| Internet Type | # Households | % Households |
| Dial-Up Internet | 0 | 0.0% |
| Broadband Home | 145 | 60.7% |
| Cellular Data Only | 48 | 20.1% |
| Satellite Internet | 5 | 2.1% |
| No Internet | 41 | 17.2% |
| Total | 239 | 100.0% |
Lake Arthur Estates Summary
History
Lake Arthur Estates is a small, unincorporated community located in Butler County, Pennsylvania. It is situated in the southeastern corner of the county, near the border with Allegheny County. The community was founded in the late 19th century by a group of settlers who were looking for a place to settle and build a community. The area was originally known as "Lake Arthur," named after the nearby lake. The lake was named after Arthur, the son of one of the original settlers.
The community was originally a farming community, with many of the settlers growing crops such as corn, wheat, and hay. The area was also known for its dairy farms, which provided milk and other dairy products to the local population. As the population of the area grew, so did the number of businesses. In the early 20th century, a number of stores, restaurants, and other businesses were established in the area.
In the mid-20th century, the area began to experience a period of growth and development. The population of the area increased significantly, and the number of businesses in the area also increased. In the late 20th century, the area was annexed by the City of Butler, and the name of the community was changed to Lake Arthur Estates.
Geography
Lake Arthur Estates is located in the southeastern corner of Butler County, Pennsylvania. It is situated near the border with Allegheny County. The community is located in a rural area, with rolling hills and forests. The area is known for its scenic beauty, and is home to a number of lakes and streams. The area is also home to a number of wildlife species, including deer, turkey, and other small game.
The climate in the area is generally mild, with temperatures ranging from the low 30s in the winter to the mid-80s in the summer. The area receives an average of 40 inches of precipitation per year, with most of it falling in the form of snow in the winter months.
Economy
The economy of Lake Arthur Estates is largely based on agriculture and tourism. The area is home to a number of farms, which produce a variety of crops, including corn, wheat, hay, and other grains. The area is also home to a number of dairy farms, which provide milk and other dairy products to the local population.
In addition to agriculture, the area is also home to a number of businesses, including restaurants, stores, and other services. The area is also home to a number of recreational activities, including fishing, boating, and camping. The area is also home to a number of tourist attractions, including the nearby Lake Arthur State Park.
Demographics
As of the 2010 census, the population of Lake Arthur Estates was 1,845. The population is largely white, with a small percentage of African Americans and other minorities. The median age of the population is 44.7 years, and the median household income is $50,945. The area is largely rural, with a population density of just over 100 people per square mile.
Common Questions
What is Per Capita Income in Lake Arthur Estates?
Per Capita income in Lake Arthur Estates is $27,911.
What is the Median Family Income in Lake Arthur Estates?
Median Family Income in Lake Arthur Estates is $60,446.
What is the Median Household income in Lake Arthur Estates?
Median Household Income in Lake Arthur Estates is $39,420.
What is Income or Wage Gap in Lake Arthur Estates?
Income or Wage Gap in Lake Arthur Estates is 44.1%.
Women in Lake Arthur Estates earn 55.9 cents for every dollar earned by a man.
What is Inequality or Gini Index in Lake Arthur Estates?
Inequality or Gini Index in Lake Arthur Estates is 0.39.
What is the Total Population of Lake Arthur Estates?
Total Population of Lake Arthur Estates is 479.
What is the Total Male Population of Lake Arthur Estates?
Total Male Population of Lake Arthur Estates is 243.
What is the Total Female Population of Lake Arthur Estates?
Total Female Population of Lake Arthur Estates is 236.
What is the Ratio of Males per 100 Females in Lake Arthur Estates?
There are 102.97 Males per 100 Females in Lake Arthur Estates.
What is the Ratio of Females per 100 Males in Lake Arthur Estates?
There are 97.12 Females per 100 Males in Lake Arthur Estates.
What is the Median Population Age in Lake Arthur Estates?
Median Population Age in Lake Arthur Estates is 39.6 Years.
What is the Average Family Size in Lake Arthur Estates
Average Family Size in Lake Arthur Estates is 3.0 People.
What is the Average Household Size in Lake Arthur Estates
Average Household Size in Lake Arthur Estates is 2.0 People.
How Large is the Labor Force in Lake Arthur Estates?
There are 269 People in the Labor Forcein in Lake Arthur Estates.
What is the Percentage of People in the Labor Force in Lake Arthur Estates?
71.2% of People are in the Labor Force in Lake Arthur Estates.