Birchwood Lakes, PA Map & Demographics
Birchwood Lakes Map
Birchwood Lakes Overview
$29,096
PER CAPITA INCOME
$73,525
AVG FAMILY INCOME
$59,444
AVG HOUSEHOLD INCOME
65.4%
WAGE / INCOME GAP [ % ]
34.6¢/ $1
WAGE / INCOME GAP [ $ ]
0.42
INEQUALITY / GINI INDEX
1,500
TOTAL POPULATION
685
MALE POPULATION
815
FEMALE POPULATION
84.05
MALES / 100 FEMALES
118.98
FEMALES / 100 MALES
53.7
MEDIAN AGE
2.9
AVG FAMILY SIZE
2.5
AVG HOUSEHOLD SIZE
728
LABOR FORCE [ PEOPLE ]
56.9%
PERCENT IN LABOR FORCE
14.8%
UNEMPLOYMENT RATE
Income in Birchwood Lakes
Income Overview in Birchwood Lakes
Per Capita Income in Birchwood Lakes is $29,096, while median incomes of families and households are $73,525 and $59,444 respectively.
| Characteristic | Number | Measure |
| Per Capita Income | 1,500 | $29,096 |
| Median Family Income | 381 | $73,525 |
| Mean Family Income | 381 | $80,881 |
| Median Household Income | 612 | $59,444 |
| Mean Household Income | 612 | $70,549 |
| Income Deficit | 381 | $0 |
| Wage / Income Gap (%) | 1,500 | 65.39% |
| Wage / Income Gap ($) | 1,500 | 34.61¢ per $1 |
| Gini / Inequality Index | 1,500 | 0.42 |
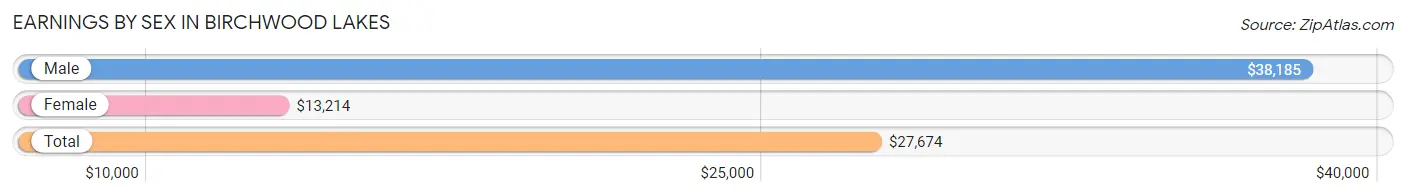
Earnings by Sex in Birchwood Lakes
Average Earnings in Birchwood Lakes are $27,674, $38,185 for men and $13,214 for women, a difference of 65.4%.
| Sex | Number | Average Earnings |
| Male | 379 (53.6%) | $38,185 |
| Female | 328 (46.4%) | $13,214 |
| Total | 707 (100.0%) | $27,674 |
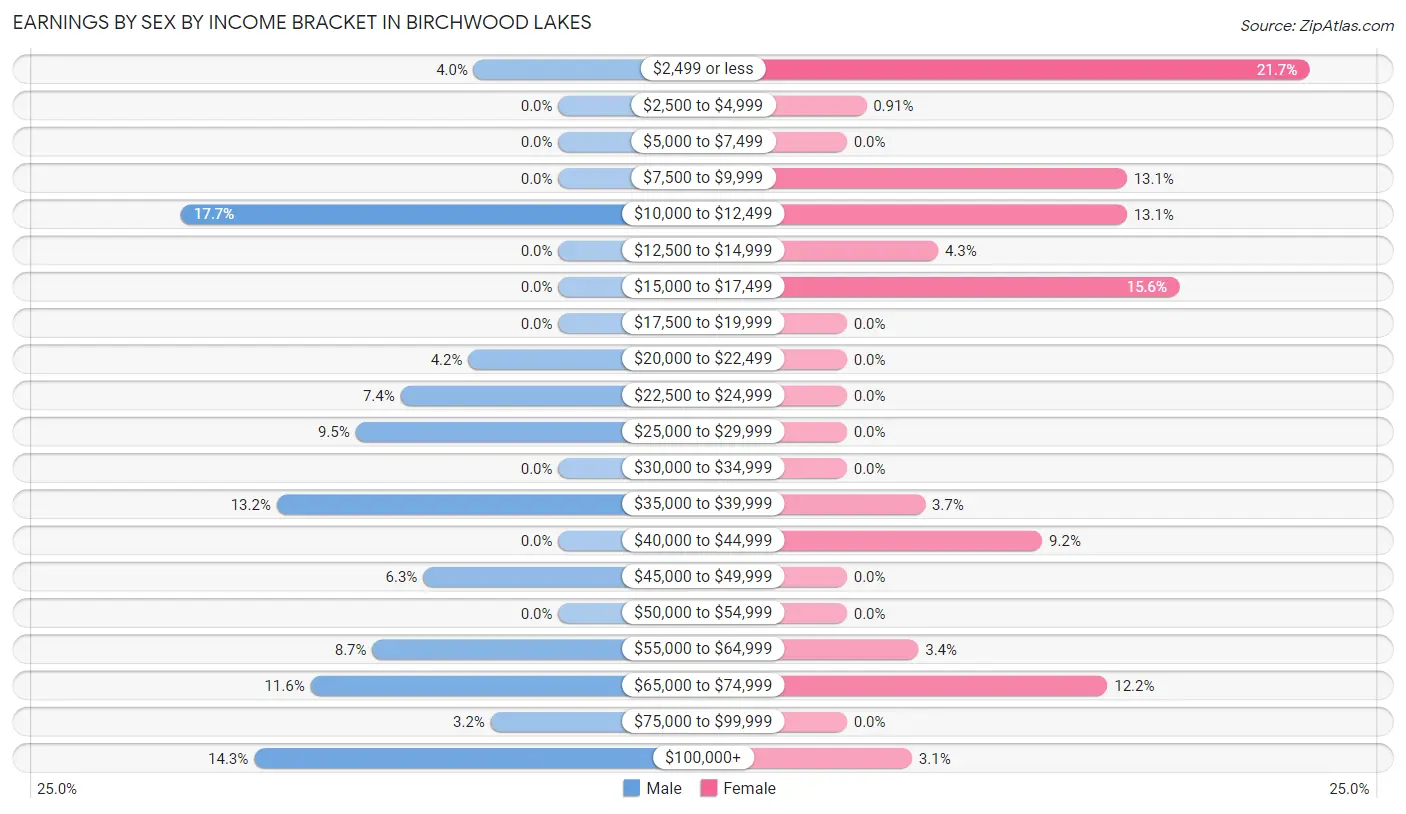
Earnings by Sex by Income Bracket in Birchwood Lakes
The most common earnings brackets in Birchwood Lakes are $10,000 to $12,499 for men (67 | 17.7%) and $2,499 or less for women (71 | 21.6%).
| Income | Male | Female |
| $2,499 or less | 15 (4.0%) | 71 (21.6%) |
| $2,500 to $4,999 | 0 (0.0%) | 3 (0.9%) |
| $5,000 to $7,499 | 0 (0.0%) | 0 (0.0%) |
| $7,500 to $9,999 | 0 (0.0%) | 43 (13.1%) |
| $10,000 to $12,499 | 67 (17.7%) | 43 (13.1%) |
| $12,500 to $14,999 | 0 (0.0%) | 14 (4.3%) |
| $15,000 to $17,499 | 0 (0.0%) | 51 (15.5%) |
| $17,500 to $19,999 | 0 (0.0%) | 0 (0.0%) |
| $20,000 to $22,499 | 16 (4.2%) | 0 (0.0%) |
| $22,500 to $24,999 | 28 (7.4%) | 0 (0.0%) |
| $25,000 to $29,999 | 36 (9.5%) | 0 (0.0%) |
| $30,000 to $34,999 | 0 (0.0%) | 0 (0.0%) |
| $35,000 to $39,999 | 50 (13.2%) | 12 (3.7%) |
| $40,000 to $44,999 | 0 (0.0%) | 30 (9.1%) |
| $45,000 to $49,999 | 24 (6.3%) | 0 (0.0%) |
| $50,000 to $54,999 | 0 (0.0%) | 0 (0.0%) |
| $55,000 to $64,999 | 33 (8.7%) | 11 (3.4%) |
| $65,000 to $74,999 | 44 (11.6%) | 40 (12.2%) |
| $75,000 to $99,999 | 12 (3.2%) | 0 (0.0%) |
| $100,000+ | 54 (14.2%) | 10 (3.0%) |
| Total | 379 (100.0%) | 328 (100.0%) |
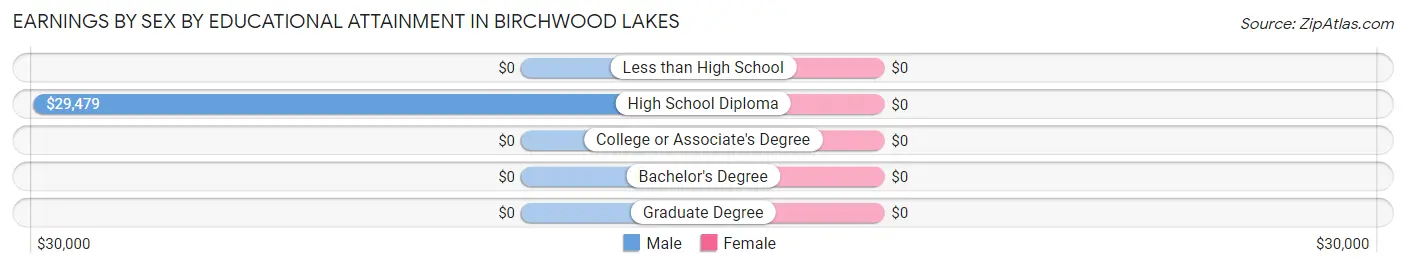
Earnings by Sex by Educational Attainment in Birchwood Lakes
| Educational Attainment | Male Income | Female Income |
| Less than High School | - | - |
| High School Diploma | $29,479 | $0 |
| College or Associate's Degree | - | - |
| Bachelor's Degree | - | - |
| Graduate Degree | - | - |
| Total | $38,347 | $15,446 |
Family Income in Birchwood Lakes
Family Income Brackets in Birchwood Lakes
According to the Birchwood Lakes family income data, there are 73 families falling into the $50,000 to $74,999 income range, which is the most common income bracket and makes up 19.2% of all families. Conversely, the less than $10,000 income bracket is the least frequent group with only 10 families (2.6%) belonging to this category.
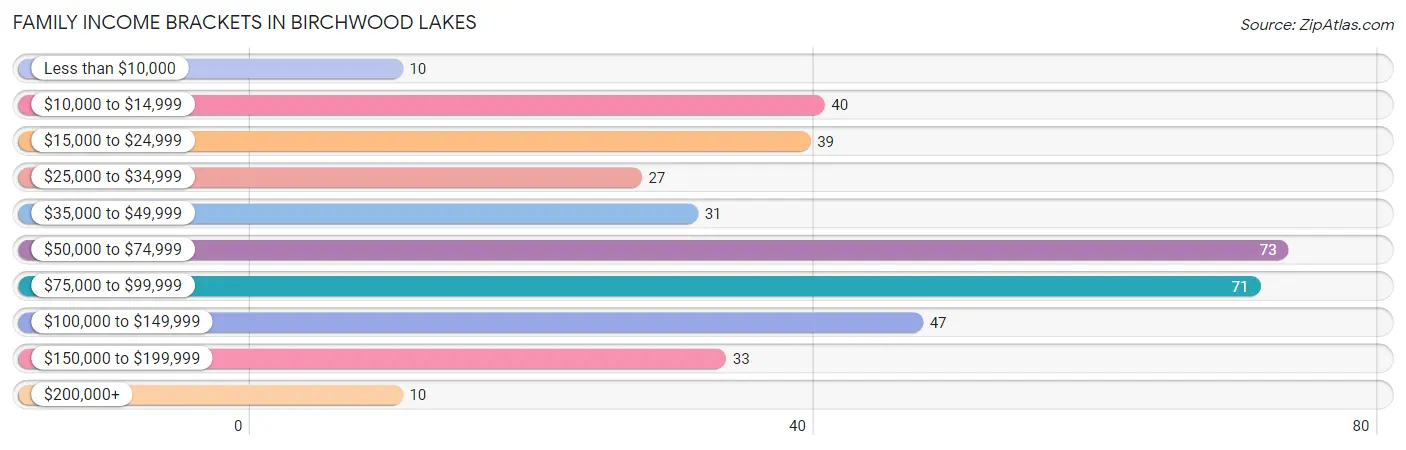
| Income Bracket | # Families | % Families |
| Less than $10,000 | 10 | 2.6% |
| $10,000 to $14,999 | 40 | 10.5% |
| $15,000 to $24,999 | 39 | 10.2% |
| $25,000 to $34,999 | 27 | 7.1% |
| $35,000 to $49,999 | 31 | 8.1% |
| $50,000 to $74,999 | 73 | 19.2% |
| $75,000 to $99,999 | 71 | 18.6% |
| $100,000 to $149,999 | 47 | 12.3% |
| $150,000 to $199,999 | 33 | 8.7% |
| $200,000+ | 10 | 2.6% |
Family Income by Famaliy Size in Birchwood Lakes
2-person families (245 | 64.3%) account for the highest median family income in Birchwood Lakes with $74,572 per family, while 2-person families (245 | 64.3%) have the highest median income of $37,286 per family member.
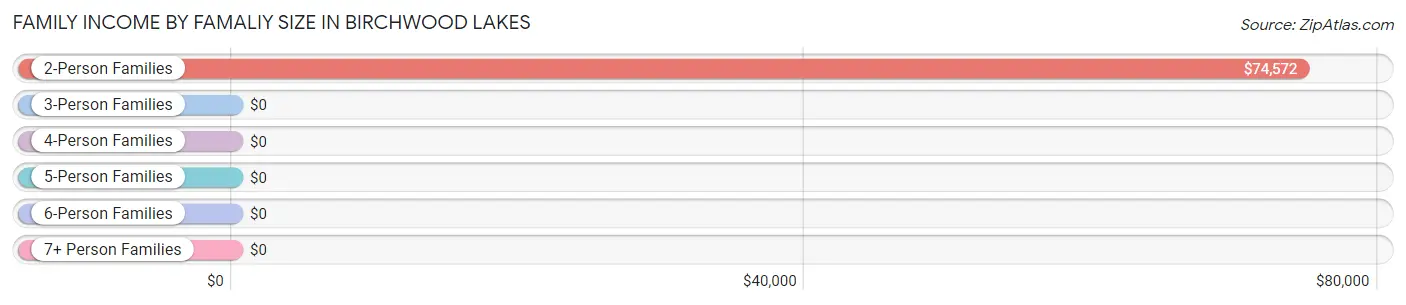
| Income Bracket | # Families | Median Income |
| 2-Person Families | 245 (64.3%) | $74,572 |
| 3-Person Families | 63 (16.5%) | $0 |
| 4-Person Families | 40 (10.5%) | $0 |
| 5-Person Families | 0 (0.0%) | $0 |
| 6-Person Families | 33 (8.7%) | $0 |
| 7+ Person Families | 0 (0.0%) | $0 |
| Total | 381 (100.0%) | $73,525 |
Family Income by Number of Earners in Birchwood Lakes
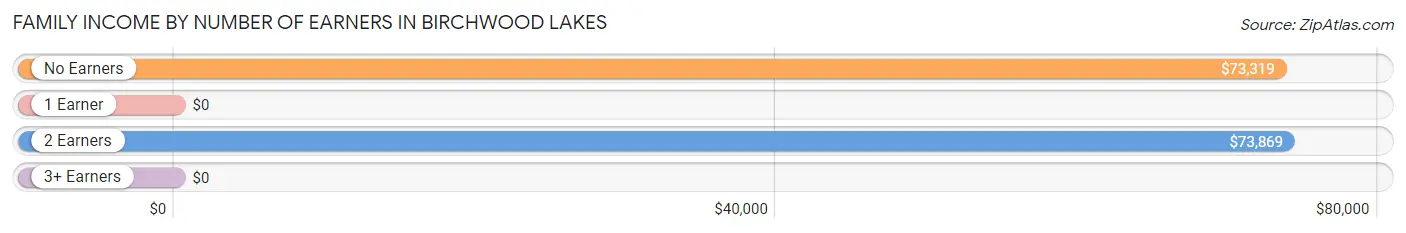
| Number of Earners | # Families | Median Income |
| No Earners | 85 (22.3%) | $73,319 |
| 1 Earner | 144 (37.8%) | $0 |
| 2 Earners | 139 (36.5%) | $73,869 |
| 3+ Earners | 13 (3.4%) | $0 |
| Total | 381 (100.0%) | $73,525 |
Household Income in Birchwood Lakes
Household Income Brackets in Birchwood Lakes
With 167 households falling in the category, the $50,000 to $74,999 income range is the most frequent in Birchwood Lakes, accounting for 27.3% of all households. In contrast, only 10 households (1.6%) fall into the $200,000+ income bracket, making it the least populous group.
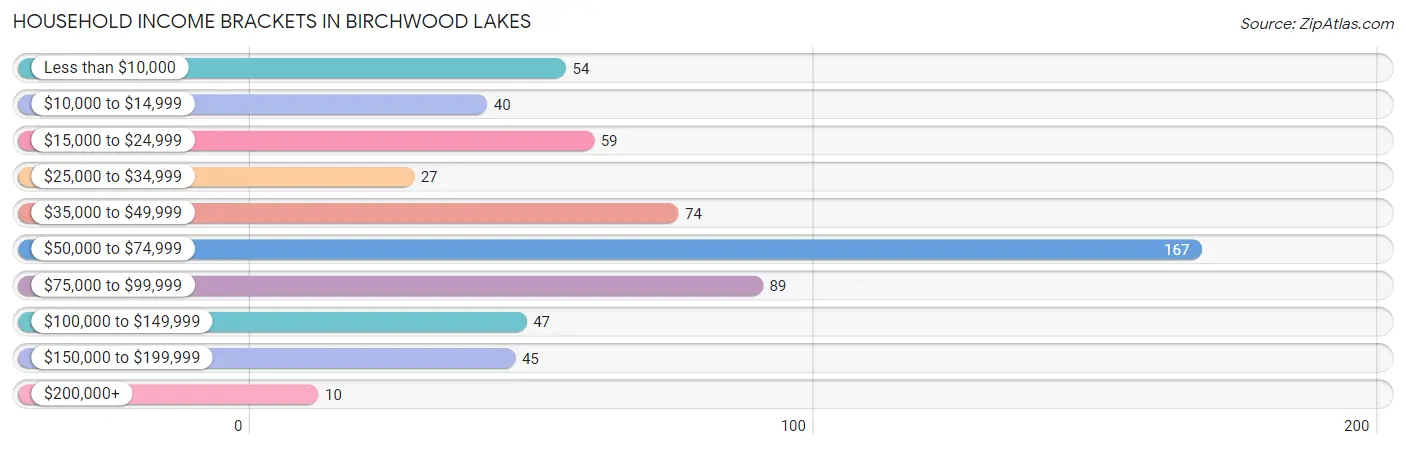
| Income Bracket | # Households | % Households |
| Less than $10,000 | 54 | 8.8% |
| $10,000 to $14,999 | 40 | 6.5% |
| $15,000 to $24,999 | 59 | 9.6% |
| $25,000 to $34,999 | 27 | 4.4% |
| $35,000 to $49,999 | 74 | 12.1% |
| $50,000 to $74,999 | 167 | 27.3% |
| $75,000 to $99,999 | 89 | 14.5% |
| $100,000 to $149,999 | 47 | 7.7% |
| $150,000 to $199,999 | 45 | 7.4% |
| $200,000+ | 10 | 1.6% |
Household Income by Householder Age in Birchwood Lakes
The median household income in Birchwood Lakes is $59,444, with the highest median household income of $73,816 found in the 65+ years age bracket for the primary householder. A total of 202 households (33.0%) fall into this category. Meanwhile, the 15 to 24 years age bracket for the primary householder has the lowest median household income of $0, with 50 households (8.2%) in this group.
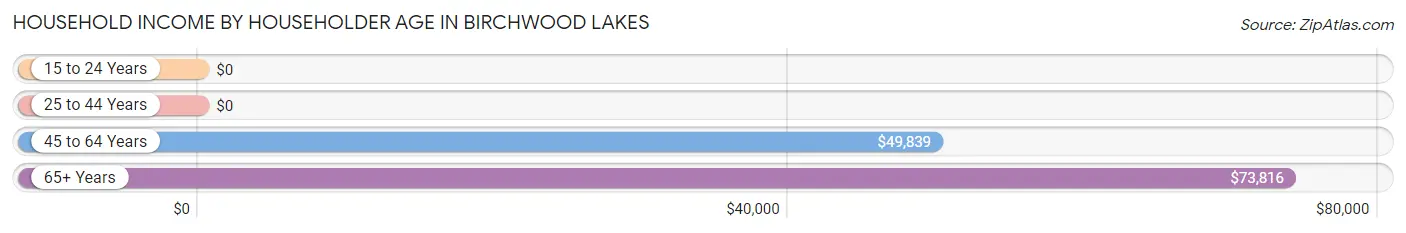
| Income Bracket | # Households | Median Income |
| 15 to 24 Years | 50 (8.2%) | $0 |
| 25 to 44 Years | 84 (13.7%) | $0 |
| 45 to 64 Years | 276 (45.1%) | $49,839 |
| 65+ Years | 202 (33.0%) | $73,816 |
| Total | 612 (100.0%) | $59,444 |
Poverty in Birchwood Lakes
Income Below Poverty by Sex and Age in Birchwood Lakes
With 15.6% poverty level for males and 32.4% for females among the residents of Birchwood Lakes, 12 to 14 year old males and 5 year old females are the most vulnerable to poverty, with 28 males (90.3%) and 31 females (100.0%) in their respective age groups living below the poverty level.
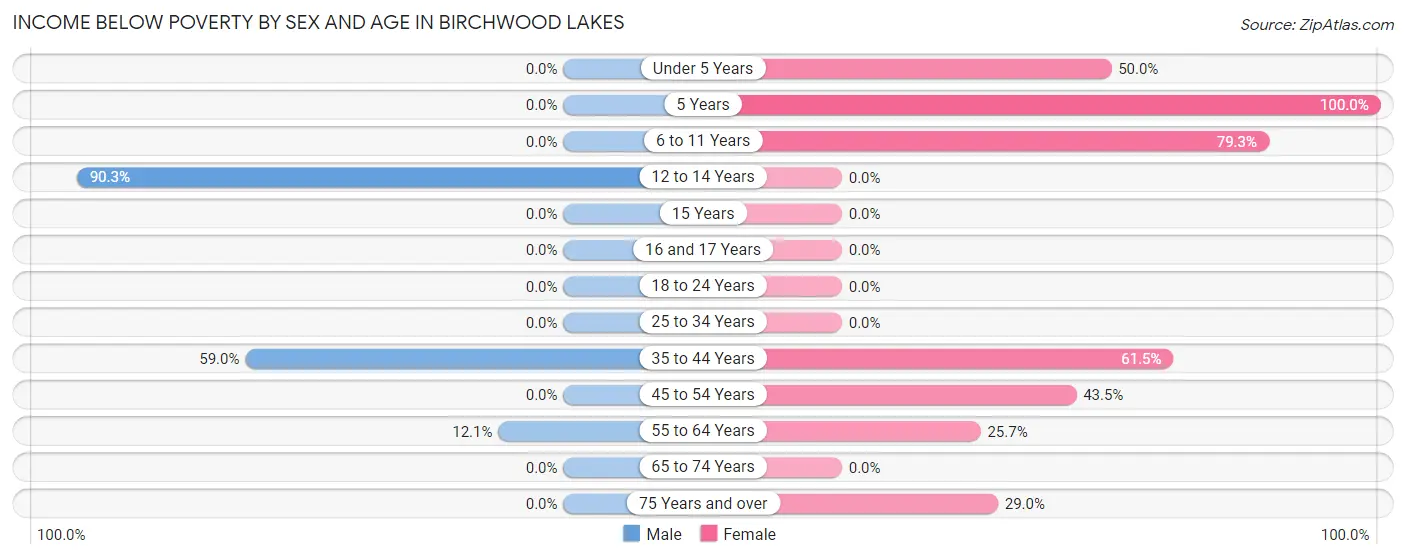
| Age Bracket | Male | Female |
| Under 5 Years | 0 (0.0%) | 31 (50.0%) |
| 5 Years | 0 (0.0%) | 31 (100.0%) |
| 6 to 11 Years | 0 (0.0%) | 42 (79.2%) |
| 12 to 14 Years | 28 (90.3%) | 0 (0.0%) |
| 15 Years | 0 (0.0%) | 0 (0.0%) |
| 16 and 17 Years | 0 (0.0%) | 0 (0.0%) |
| 18 to 24 Years | 0 (0.0%) | 0 (0.0%) |
| 25 to 34 Years | 0 (0.0%) | 0 (0.0%) |
| 35 to 44 Years | 49 (59.0%) | 40 (61.5%) |
| 45 to 54 Years | 0 (0.0%) | 57 (43.5%) |
| 55 to 64 Years | 25 (12.1%) | 52 (25.7%) |
| 65 to 74 Years | 0 (0.0%) | 0 (0.0%) |
| 75 Years and over | 0 (0.0%) | 11 (28.9%) |
| Total | 102 (15.6%) | 264 (32.4%) |
Income Above Poverty by Sex and Age in Birchwood Lakes
According to the poverty statistics in Birchwood Lakes, males aged 6 to 11 years and females aged 16 and 17 years are the age groups that are most secure financially, with 100.0% of males and 100.0% of females in these age groups living above the poverty line.
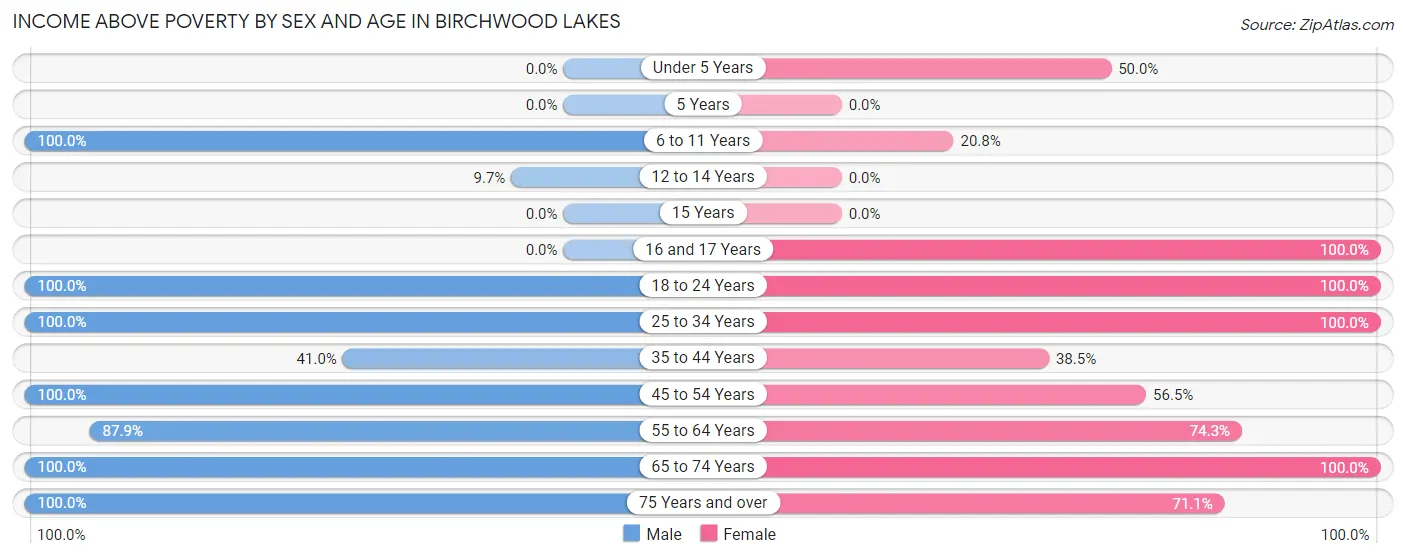
| Age Bracket | Male | Female |
| Under 5 Years | 0 (0.0%) | 31 (50.0%) |
| 5 Years | 0 (0.0%) | 0 (0.0%) |
| 6 to 11 Years | 13 (100.0%) | 11 (20.7%) |
| 12 to 14 Years | 3 (9.7%) | 0 (0.0%) |
| 15 Years | 0 (0.0%) | 0 (0.0%) |
| 16 and 17 Years | 0 (0.0%) | 13 (100.0%) |
| 18 to 24 Years | 26 (100.0%) | 62 (100.0%) |
| 25 to 34 Years | 71 (100.0%) | 34 (100.0%) |
| 35 to 44 Years | 34 (41.0%) | 25 (38.5%) |
| 45 to 54 Years | 73 (100.0%) | 74 (56.5%) |
| 55 to 64 Years | 182 (87.9%) | 150 (74.3%) |
| 65 to 74 Years | 104 (100.0%) | 124 (100.0%) |
| 75 Years and over | 46 (100.0%) | 27 (71.1%) |
| Total | 552 (84.4%) | 551 (67.6%) |
Income Below Poverty Among Married-Couple Families in Birchwood Lakes
The poverty statistics for married-couple families in Birchwood Lakes show that 11.2% or 30 of the total 268 families live below the poverty line. Families with 3 or 4 children have the highest poverty rate of 100.0%, comprising of 30 families. On the other hand, families with no children have the lowest poverty rate of 0.0%, which includes 0 families.
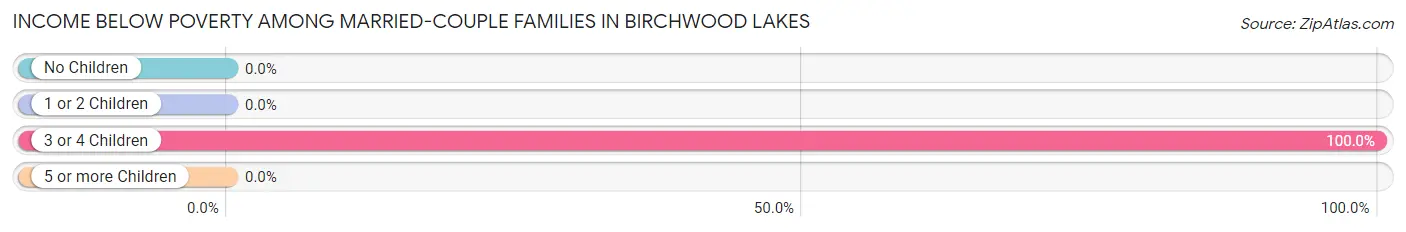
| Children | Above Poverty | Below Poverty |
| No Children | 198 (100.0%) | 0 (0.0%) |
| 1 or 2 Children | 40 (100.0%) | 0 (0.0%) |
| 3 or 4 Children | 0 (0.0%) | 30 (100.0%) |
| 5 or more Children | 0 (0.0%) | 0 (0.0%) |
| Total | 238 (88.8%) | 30 (11.2%) |
Income Below Poverty Among Single-Parent Households in Birchwood Lakes
According to the poverty data in Birchwood Lakes, 76.9% or 10 single-father households and 10.0% or 10 single-mother households are living below the poverty line. Among single-father households, those with no children have the highest poverty rate, with 10 households (100.0%) experiencing poverty. Likewise, among single-mother households, those with 1 or 2 children have the highest poverty rate, with 10 households (100.0%) falling below the poverty line.
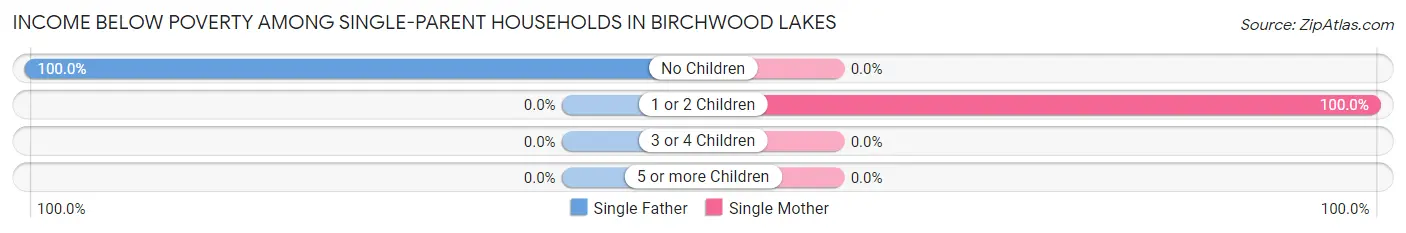
| Children | Single Father | Single Mother |
| No Children | 10 (100.0%) | 0 (0.0%) |
| 1 or 2 Children | 0 (0.0%) | 10 (100.0%) |
| 3 or 4 Children | 0 (0.0%) | 0 (0.0%) |
| 5 or more Children | 0 (0.0%) | 0 (0.0%) |
| Total | 10 (76.9%) | 10 (10.0%) |
Income Below Poverty Among Married-Couple vs Single-Parent Households in Birchwood Lakes
The poverty data for Birchwood Lakes shows that 30 of the married-couple family households (11.2%) and 20 of the single-parent households (17.7%) are living below the poverty level. Within the married-couple family households, those with 3 or 4 children have the highest poverty rate, with 30 households (100.0%) falling below the poverty line. Among the single-parent households, those with 1 or 2 children have the highest poverty rate, with 10 household (76.9%) living below poverty.
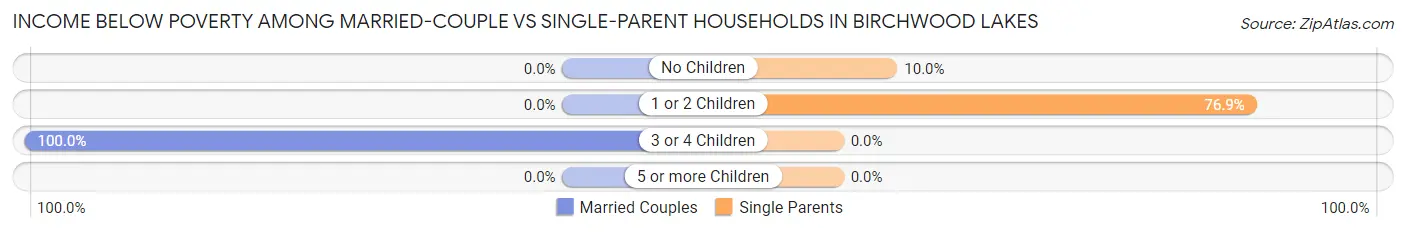
| Children | Married-Couple Families | Single-Parent Households |
| No Children | 0 (0.0%) | 10 (10.0%) |
| 1 or 2 Children | 0 (0.0%) | 10 (76.9%) |
| 3 or 4 Children | 30 (100.0%) | 0 (0.0%) |
| 5 or more Children | 0 (0.0%) | 0 (0.0%) |
| Total | 30 (11.2%) | 20 (17.7%) |
Race in Birchwood Lakes
The most populous races in Birchwood Lakes are White / Caucasian (1,433 | 95.5%), Hispanic or Latino (102 | 6.8%), and Some other Race (36 | 2.4%).
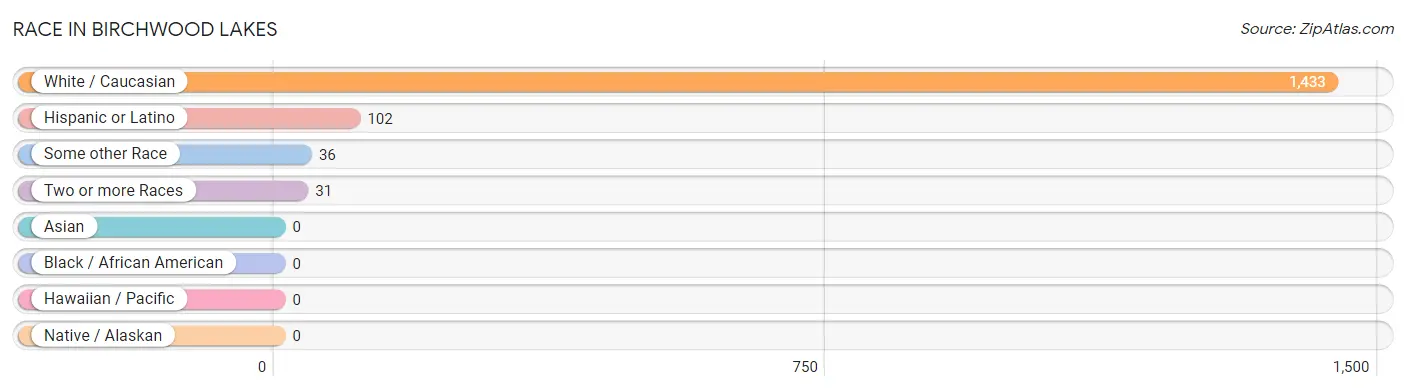
| Race | # Population | % Population |
| Asian | 0 | 0.0% |
| Black / African American | 0 | 0.0% |
| Hawaiian / Pacific | 0 | 0.0% |
| Hispanic or Latino | 102 | 6.8% |
| Native / Alaskan | 0 | 0.0% |
| White / Caucasian | 1,433 | 95.5% |
| Two or more Races | 31 | 2.1% |
| Some other Race | 36 | 2.4% |
| Total | 1,500 | 100.0% |
Ancestry in Birchwood Lakes
The most populous ancestries reported in Birchwood Lakes are German (453 | 30.2%), Irish (297 | 19.8%), Italian (232 | 15.5%), Polish (145 | 9.7%), and American (81 | 5.4%), together accounting for 80.5% of all Birchwood Lakes residents.
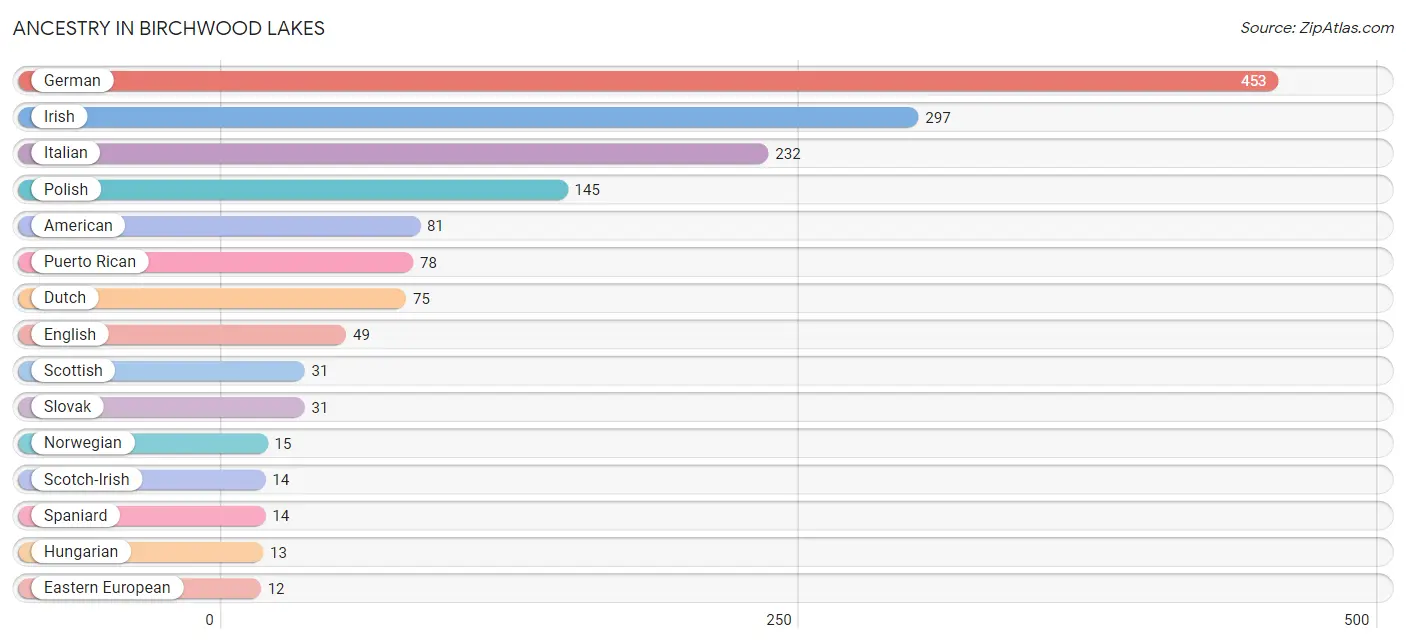
| Ancestry | # Population | % Population |
| American | 81 | 5.4% |
| Dutch | 75 | 5.0% |
| Eastern European | 12 | 0.8% |
| English | 49 | 3.3% |
| German | 453 | 30.2% |
| Hungarian | 13 | 0.9% |
| Irish | 297 | 19.8% |
| Italian | 232 | 15.5% |
| Mexican | 4 | 0.3% |
| Norwegian | 15 | 1.0% |
| Polish | 145 | 9.7% |
| Puerto Rican | 78 | 5.2% |
| Scotch-Irish | 14 | 0.9% |
| Scottish | 31 | 2.1% |
| Slovak | 31 | 2.1% |
| Spaniard | 14 | 0.9% | View All 16 Rows |
Immigrants in Birchwood Lakes
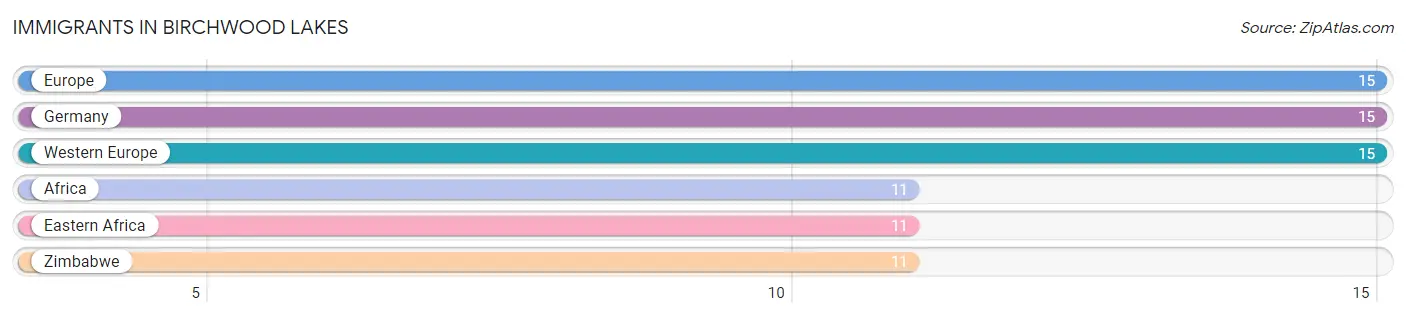
The most numerous immigrant groups reported in Birchwood Lakes came from Europe (15 | 1.0%), Germany (15 | 1.0%), Western Europe (15 | 1.0%), Africa (11 | 0.7%), and Eastern Africa (11 | 0.7%), together accounting for 4.5% of all Birchwood Lakes residents.
| Immigration Origin | # Population | % Population |
| Africa | 11 | 0.7% |
| Eastern Africa | 11 | 0.7% |
| Europe | 15 | 1.0% |
| Germany | 15 | 1.0% |
| Western Europe | 15 | 1.0% |
| Zimbabwe | 11 | 0.7% | View All 6 Rows |
Sex and Age in Birchwood Lakes
Sex and Age in Birchwood Lakes
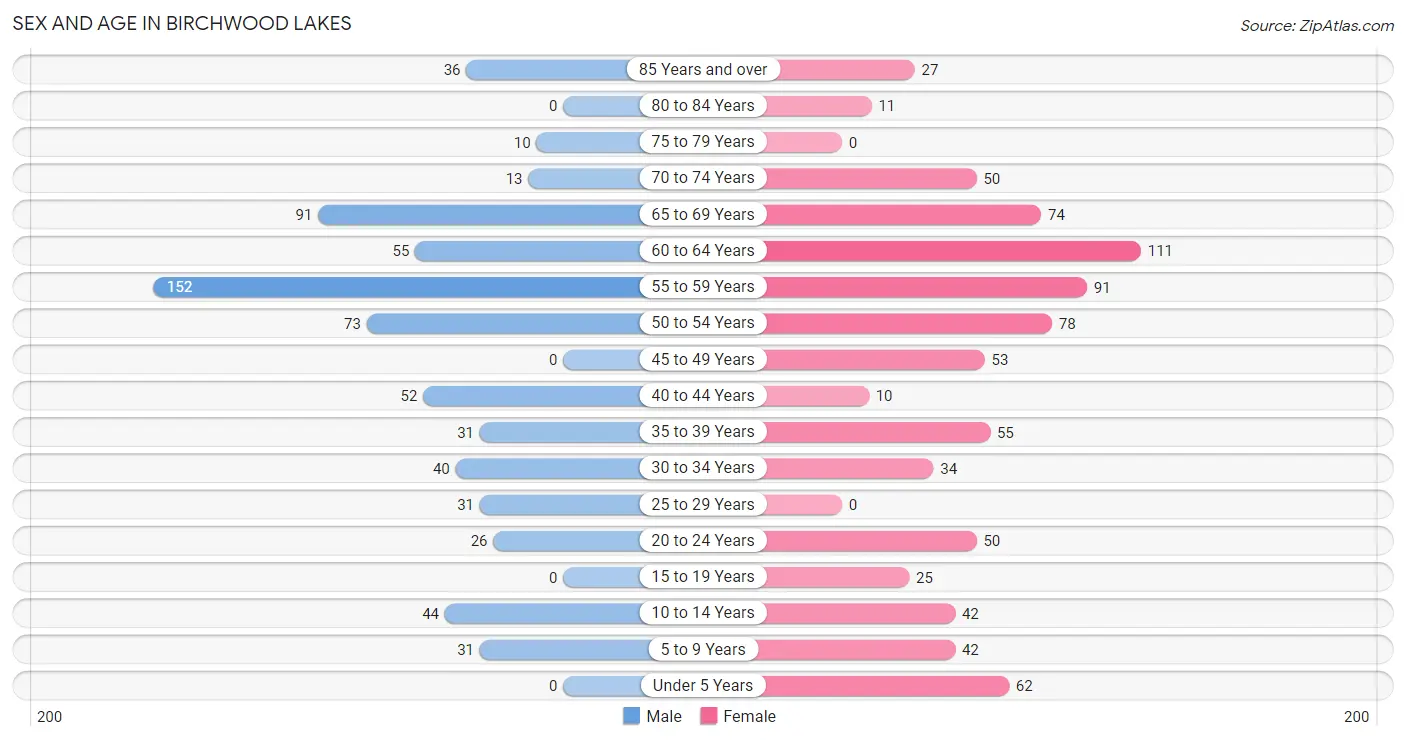
The most populous age groups in Birchwood Lakes are 55 to 59 Years (152 | 22.2%) for men and 60 to 64 Years (111 | 13.6%) for women.
| Age Bracket | Male | Female |
| Under 5 Years | 0 (0.0%) | 62 (7.6%) |
| 5 to 9 Years | 31 (4.5%) | 42 (5.1%) |
| 10 to 14 Years | 44 (6.4%) | 42 (5.1%) |
| 15 to 19 Years | 0 (0.0%) | 25 (3.1%) |
| 20 to 24 Years | 26 (3.8%) | 50 (6.1%) |
| 25 to 29 Years | 31 (4.5%) | 0 (0.0%) |
| 30 to 34 Years | 40 (5.8%) | 34 (4.2%) |
| 35 to 39 Years | 31 (4.5%) | 55 (6.8%) |
| 40 to 44 Years | 52 (7.6%) | 10 (1.2%) |
| 45 to 49 Years | 0 (0.0%) | 53 (6.5%) |
| 50 to 54 Years | 73 (10.7%) | 78 (9.6%) |
| 55 to 59 Years | 152 (22.2%) | 91 (11.2%) |
| 60 to 64 Years | 55 (8.0%) | 111 (13.6%) |
| 65 to 69 Years | 91 (13.3%) | 74 (9.1%) |
| 70 to 74 Years | 13 (1.9%) | 50 (6.1%) |
| 75 to 79 Years | 10 (1.5%) | 0 (0.0%) |
| 80 to 84 Years | 0 (0.0%) | 11 (1.3%) |
| 85 Years and over | 36 (5.3%) | 27 (3.3%) |
| Total | 685 (100.0%) | 815 (100.0%) |
Families and Households in Birchwood Lakes
Median Family Size in Birchwood Lakes
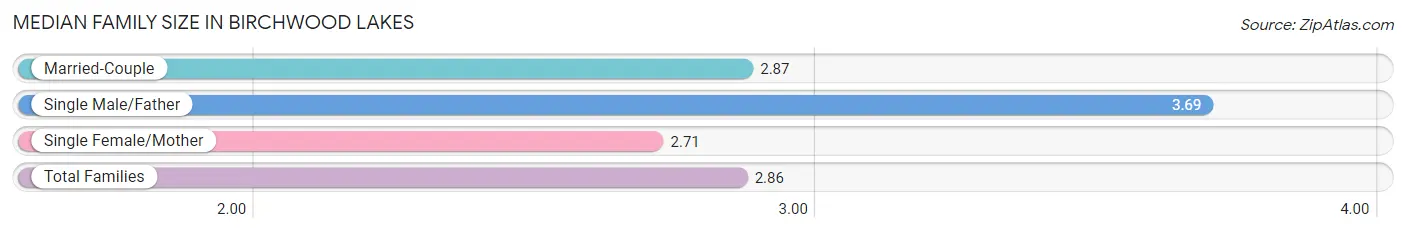
The median family size in Birchwood Lakes is 2.86 persons per family, with single male/father families (13 | 3.4%) accounting for the largest median family size of 3.69 persons per family. On the other hand, single female/mother families (100 | 26.3%) represent the smallest median family size with 2.71 persons per family.
| Family Type | # Families | Family Size |
| Married-Couple | 268 (70.3%) | 2.87 |
| Single Male/Father | 13 (3.4%) | 3.69 |
| Single Female/Mother | 100 (26.3%) | 2.71 |
| Total Families | 381 (100.0%) | 2.86 |
Median Household Size in Birchwood Lakes
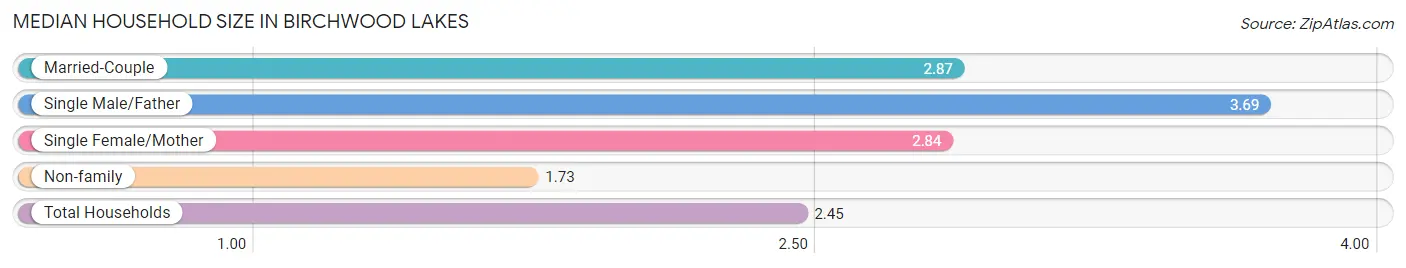
The median household size in Birchwood Lakes is 2.45 persons per household, with single male/father households (13 | 2.1%) accounting for the largest median household size of 3.69 persons per household. non-family households (231 | 37.8%) represent the smallest median household size with 1.73 persons per household.
| Household Type | # Households | Household Size |
| Married-Couple | 268 (43.8%) | 2.87 |
| Single Male/Father | 13 (2.1%) | 3.69 |
| Single Female/Mother | 100 (16.3%) | 2.84 |
| Non-family | 231 (37.8%) | 1.73 |
| Total Households | 612 (100.0%) | 2.45 |
Household Size by Marriage Status in Birchwood Lakes
Out of a total of 612 households in Birchwood Lakes, 381 (62.3%) are family households, while 231 (37.8%) are nonfamily households. The most numerous type of family households are 2-person households, comprising 235, and the most common type of nonfamily households are 1-person households, comprising 144.
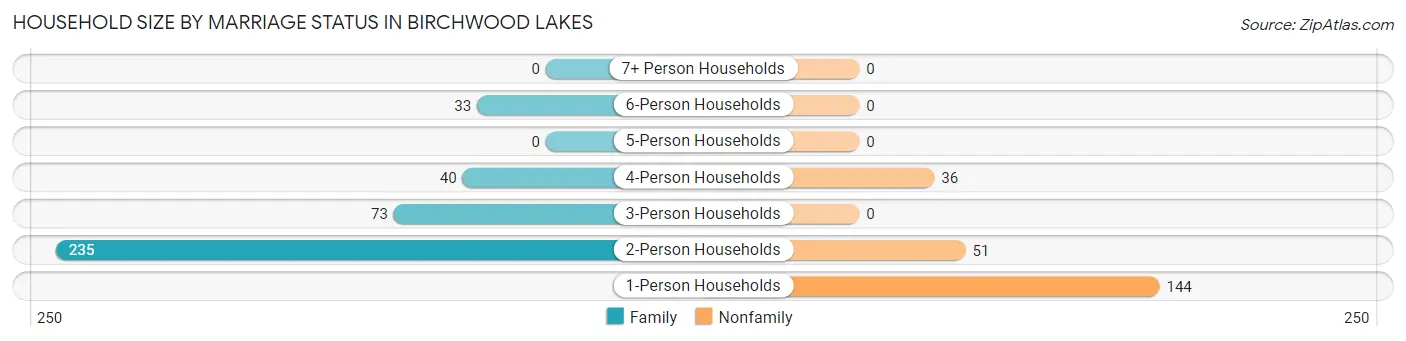
| Household Size | Family Households | Nonfamily Households |
| 1-Person Households | - | 144 (23.5%) |
| 2-Person Households | 235 (38.4%) | 51 (8.3%) |
| 3-Person Households | 73 (11.9%) | 0 (0.0%) |
| 4-Person Households | 40 (6.5%) | 36 (5.9%) |
| 5-Person Households | 0 (0.0%) | 0 (0.0%) |
| 6-Person Households | 33 (5.4%) | 0 (0.0%) |
| 7+ Person Households | 0 (0.0%) | 0 (0.0%) |
| Total | 381 (62.3%) | 231 (37.8%) |
Female Fertility in Birchwood Lakes
Fertility by Age in Birchwood Lakes
| Age Bracket | Women with Births | Births / 1,000 Women |
| 15 to 19 years | 0 (0.0%) | 0.0 |
| 20 to 34 years | 0 (0.0%) | 0.0 |
| 35 to 50 years | 0 (0.0%) | 0.0 |
| Total | 0 (0.0%) | 0.0 |
Fertility by Age by Marriage Status in Birchwood Lakes
| Age Bracket | Married | Unmarried |
| 15 to 19 years | 0 (0.0%) | 0 (0.0%) |
| 20 to 34 years | 0 (0.0%) | 0 (0.0%) |
| 35 to 50 years | 0 (0.0%) | 0 (0.0%) |
| Total | 0 (0.0%) | 0 (0.0%) |
Fertility by Education in Birchwood Lakes
| Educational Attainment | Women with Births | Births / 1,000 Women |
| Less than High School | 0 (0.0%) | 0.0 |
| High School Diploma | 0 (0.0%) | 0.0 |
| College or Associate's Degree | 0 (0.0%) | 0.0 |
| Bachelor's Degree | 0 (0.0%) | 0.0 |
| Graduate Degree | 0 (0.0%) | 0.0 |
| Total | 0 (0.0%) | 0.0 |
Fertility by Education by Marriage Status in Birchwood Lakes
| Educational Attainment | Married | Unmarried |
| Less than High School | 0 (0.0%) | 0 (0.0%) |
| High School Diploma | 0 (0.0%) | 0 (0.0%) |
| College or Associate's Degree | 0 (0.0%) | 0 (0.0%) |
| Bachelor's Degree | 0 (0.0%) | 0 (0.0%) |
| Graduate Degree | 0 (0.0%) | 0 (0.0%) |
| Total | 0 (0.0%) | 0 (0.0%) |
Employment Characteristics in Birchwood Lakes
Employment by Class of Employer in Birchwood Lakes
Among the 551 employed individuals in Birchwood Lakes, private company employees (489 | 88.7%), not-for-profit organizations (14 | 2.5%), and federal government employees (13 | 2.4%) make up the most common classes of employment.
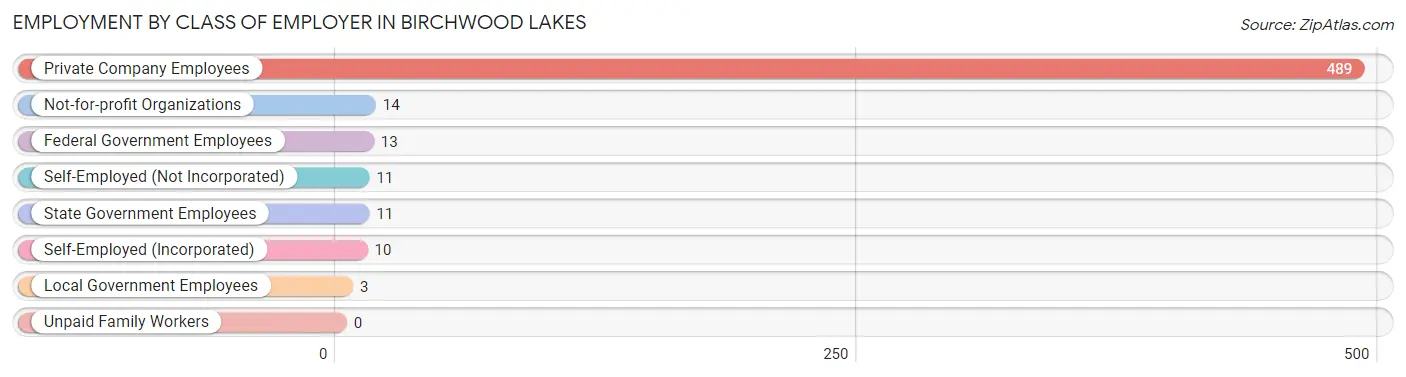
| Employer Class | # Employees | % Employees |
| Private Company Employees | 489 | 88.7% |
| Self-Employed (Incorporated) | 10 | 1.8% |
| Self-Employed (Not Incorporated) | 11 | 2.0% |
| Not-for-profit Organizations | 14 | 2.5% |
| Local Government Employees | 3 | 0.5% |
| State Government Employees | 11 | 2.0% |
| Federal Government Employees | 13 | 2.4% |
| Unpaid Family Workers | 0 | 0.0% |
| Total | 551 | 100.0% |
Employment Status by Age in Birchwood Lakes
According to the labor force statistics for Birchwood Lakes, out of the total population over 16 years of age (1,279), 56.9% or 728 individuals are in the labor force, with 14.8% or 108 of them unemployed. The age group with the highest labor force participation rate is 20 to 24 years, with 100.0% or 76 individuals in the labor force. Within the labor force, the 35 to 44 years age range has the highest percentage of unemployed individuals, with 72.4% or 89 of them being unemployed.
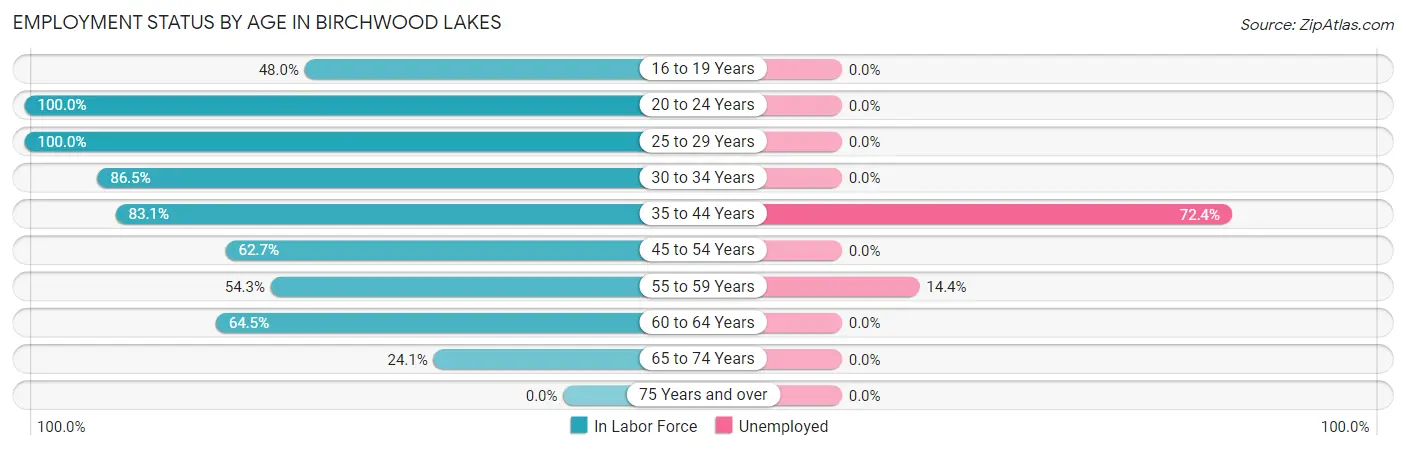
| Age Bracket | In Labor Force | Unemployed |
| 16 to 19 Years | 12 (48.0%) | 0 (0.0%) |
| 20 to 24 Years | 76 (100.0%) | 0 (0.0%) |
| 25 to 29 Years | 31 (100.0%) | 0 (0.0%) |
| 30 to 34 Years | 64 (86.5%) | 0 (0.0%) |
| 35 to 44 Years | 123 (83.1%) | 89 (72.4%) |
| 45 to 54 Years | 128 (62.7%) | 0 (0.0%) |
| 55 to 59 Years | 132 (54.3%) | 19 (14.4%) |
| 60 to 64 Years | 107 (64.5%) | 0 (0.0%) |
| 65 to 74 Years | 55 (24.1%) | 0 (0.0%) |
| 75 Years and over | 0 (0.0%) | 0 (0.0%) |
| Total | 728 (56.9%) | 108 (14.8%) |
Employment Status by Educational Attainment in Birchwood Lakes
According to labor force statistics for Birchwood Lakes, 67.6% of individuals (585) out of the total population between 25 and 64 years of age (866) are in the labor force, with 18.5% or 108 of them being unemployed. The group with the highest labor force participation rate are those with the educational attainment of less than high school, with 100.0% or 5 individuals in the labor force. Within the labor force, individuals with bachelor's degree or higher education have the highest percentage of unemployment, with 40.9% or 36 of them being unemployed.
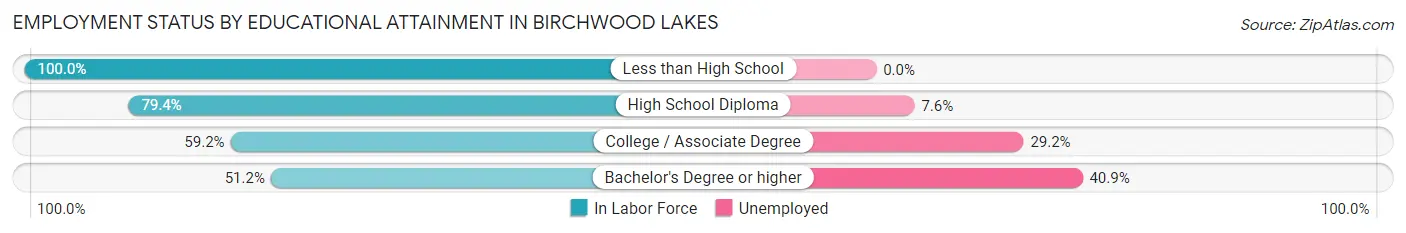
| Educational Attainment | In Labor Force | Unemployed |
| Less than High School | 5 (100.0%) | 0 (0.0%) |
| High School Diploma | 331 (79.4%) | 32 (7.6%) |
| College / Associate Degree | 161 (59.2%) | 79 (29.2%) |
| Bachelor's Degree or higher | 88 (51.2%) | 70 (40.9%) |
| Total | 585 (67.6%) | 160 (18.5%) |
Employment Occupations by Sex in Birchwood Lakes
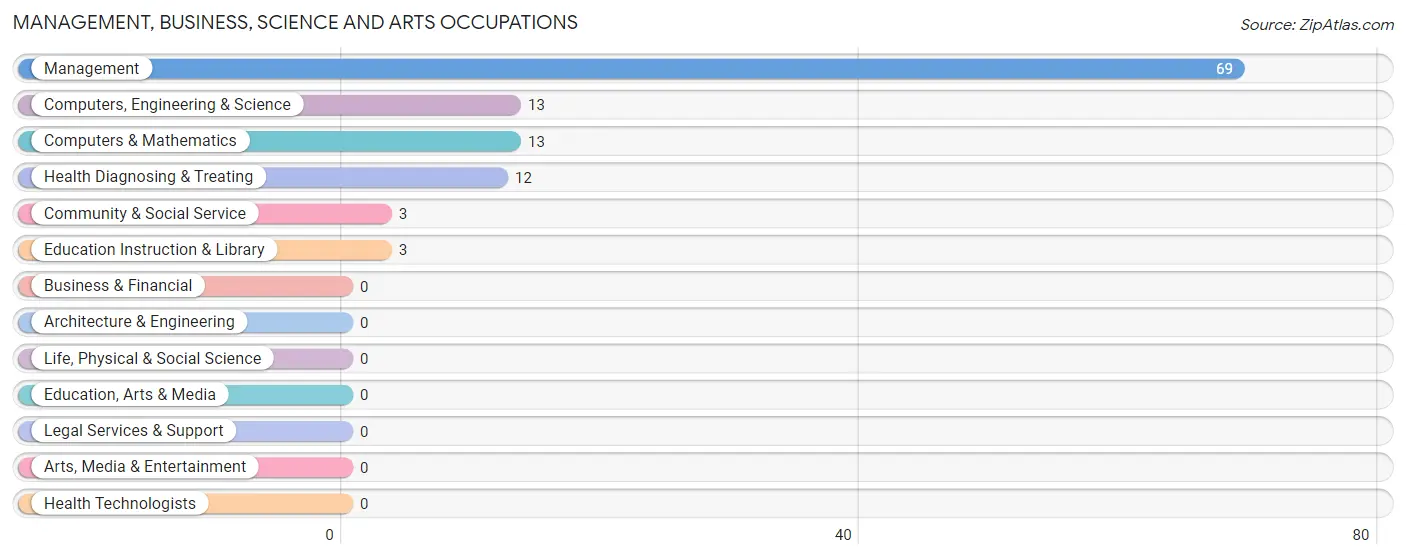
Management, Business, Science and Arts Occupations
The most common Management, Business, Science and Arts occupations in Birchwood Lakes are Management (69 | 11.1%), Computers, Engineering & Science (13 | 2.1%), Computers & Mathematics (13 | 2.1%), Health Diagnosing & Treating (12 | 1.9%), and Community & Social Service (3 | 0.5%).
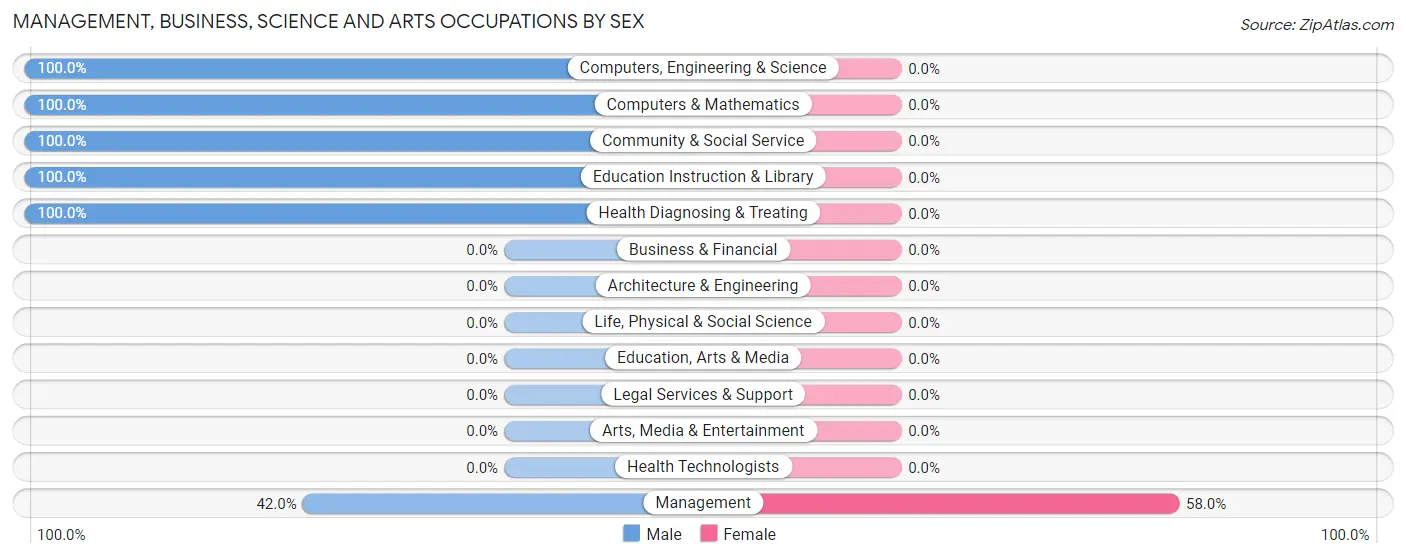
Management, Business, Science and Arts Occupations by Sex
| Occupation | Male | Female |
| Management | 29 (42.0%) | 40 (58.0%) |
| Business & Financial | 0 (0.0%) | 0 (0.0%) |
| Computers, Engineering & Science | 13 (100.0%) | 0 (0.0%) |
| Computers & Mathematics | 13 (100.0%) | 0 (0.0%) |
| Architecture & Engineering | 0 (0.0%) | 0 (0.0%) |
| Life, Physical & Social Science | 0 (0.0%) | 0 (0.0%) |
| Community & Social Service | 3 (100.0%) | 0 (0.0%) |
| Education, Arts & Media | 0 (0.0%) | 0 (0.0%) |
| Legal Services & Support | 0 (0.0%) | 0 (0.0%) |
| Education Instruction & Library | 3 (100.0%) | 0 (0.0%) |
| Arts, Media & Entertainment | 0 (0.0%) | 0 (0.0%) |
| Health Diagnosing & Treating | 12 (100.0%) | 0 (0.0%) |
| Health Technologists | 0 (0.0%) | 0 (0.0%) |
| Total (Category) | 57 (58.8%) | 40 (41.2%) |
| Total (Overall) | 317 (51.1%) | 303 (48.9%) |
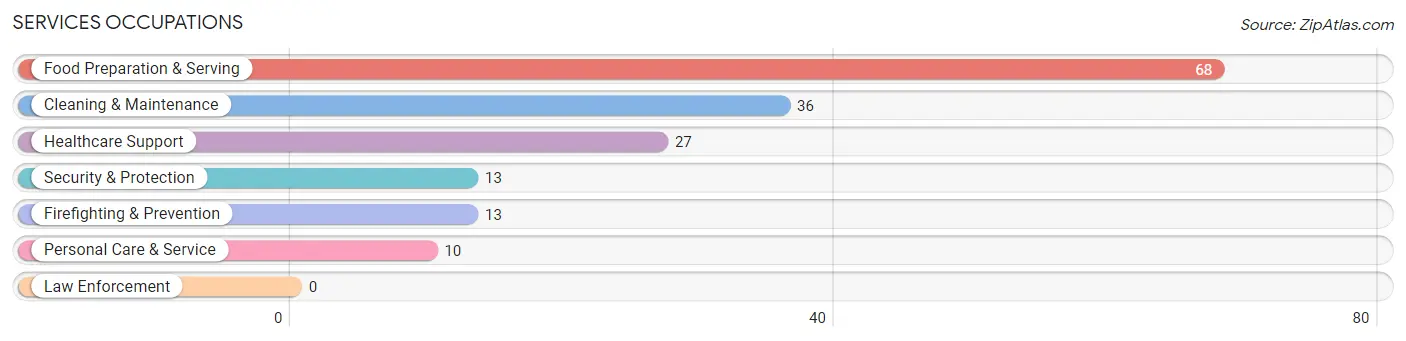
Services Occupations
The most common Services occupations in Birchwood Lakes are Food Preparation & Serving (68 | 11.0%), Cleaning & Maintenance (36 | 5.8%), Healthcare Support (27 | 4.3%), Security & Protection (13 | 2.1%), and Firefighting & Prevention (13 | 2.1%).
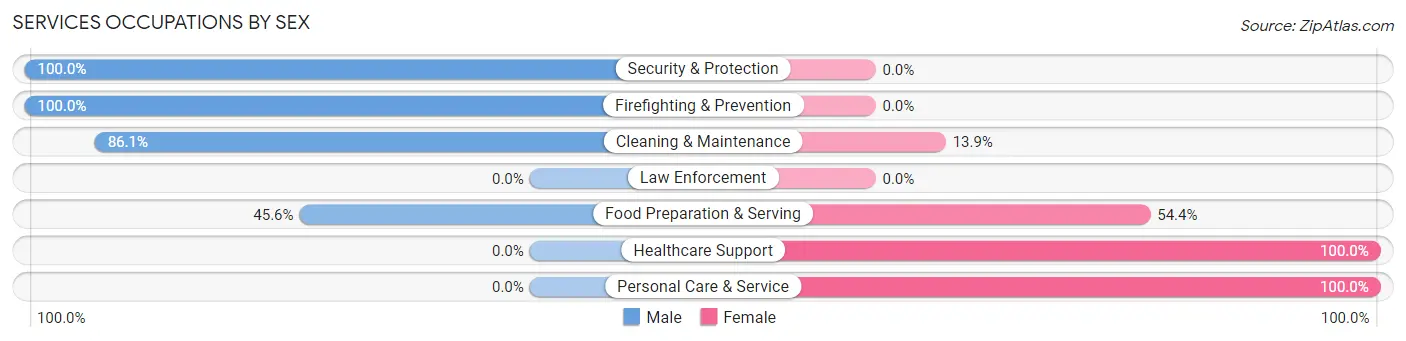
Services Occupations by Sex
Within the Services occupations in Birchwood Lakes, the most male-oriented occupations are Security & Protection (100.0%), Firefighting & Prevention (100.0%), and Cleaning & Maintenance (86.1%), while the most female-oriented occupations are Healthcare Support (100.0%), Personal Care & Service (100.0%), and Food Preparation & Serving (54.4%).
| Occupation | Male | Female |
| Healthcare Support | 0 (0.0%) | 27 (100.0%) |
| Security & Protection | 13 (100.0%) | 0 (0.0%) |
| Firefighting & Prevention | 13 (100.0%) | 0 (0.0%) |
| Law Enforcement | 0 (0.0%) | 0 (0.0%) |
| Food Preparation & Serving | 31 (45.6%) | 37 (54.4%) |
| Cleaning & Maintenance | 31 (86.1%) | 5 (13.9%) |
| Personal Care & Service | 0 (0.0%) | 10 (100.0%) |
| Total (Category) | 75 (48.7%) | 79 (51.3%) |
| Total (Overall) | 317 (51.1%) | 303 (48.9%) |
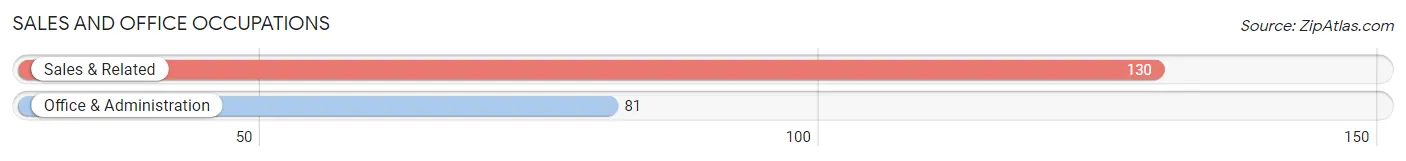
Sales and Office Occupations
The most common Sales and Office occupations in Birchwood Lakes are Sales & Related (130 | 21.0%), and Office & Administration (81 | 13.1%).
Sales and Office Occupations by Sex
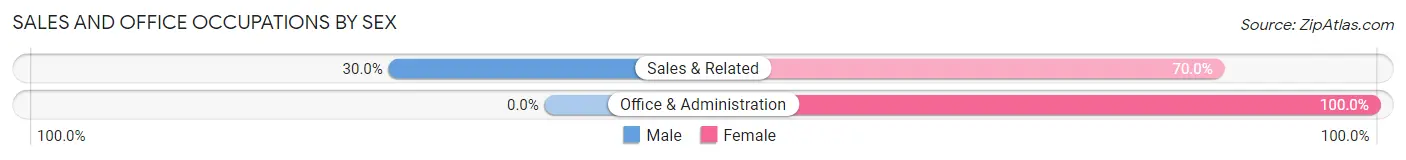
| Occupation | Male | Female |
| Sales & Related | 39 (30.0%) | 91 (70.0%) |
| Office & Administration | 0 (0.0%) | 81 (100.0%) |
| Total (Category) | 39 (18.5%) | 172 (81.5%) |
| Total (Overall) | 317 (51.1%) | 303 (48.9%) |
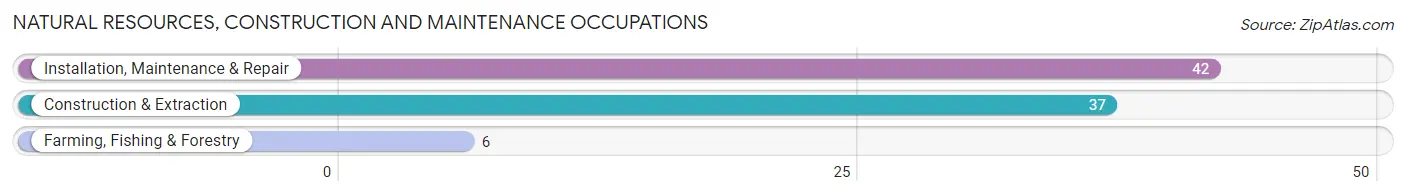
Natural Resources, Construction and Maintenance Occupations
The most common Natural Resources, Construction and Maintenance occupations in Birchwood Lakes are Installation, Maintenance & Repair (42 | 6.8%), Construction & Extraction (37 | 6.0%), and Farming, Fishing & Forestry (6 | 1.0%).
Natural Resources, Construction and Maintenance Occupations by Sex
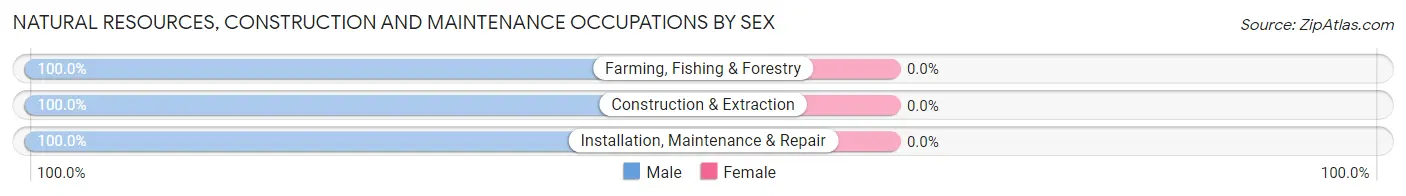
| Occupation | Male | Female |
| Farming, Fishing & Forestry | 6 (100.0%) | 0 (0.0%) |
| Construction & Extraction | 37 (100.0%) | 0 (0.0%) |
| Installation, Maintenance & Repair | 42 (100.0%) | 0 (0.0%) |
| Total (Category) | 85 (100.0%) | 0 (0.0%) |
| Total (Overall) | 317 (51.1%) | 303 (48.9%) |
Production, Transportation and Moving Occupations
The most common Production, Transportation and Moving occupations in Birchwood Lakes are Production (48 | 7.7%), Material Moving (14 | 2.3%), and Transportation (11 | 1.8%).
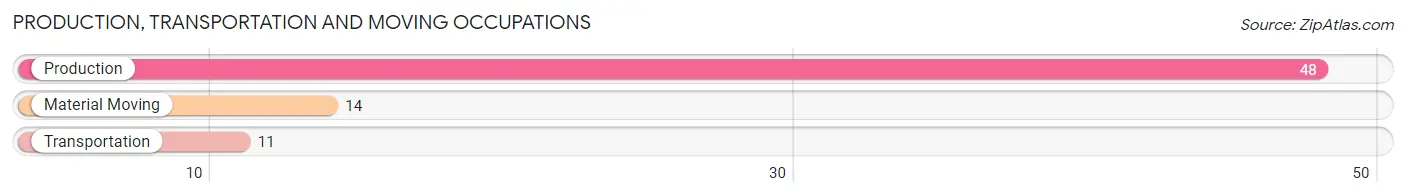
Production, Transportation and Moving Occupations by Sex
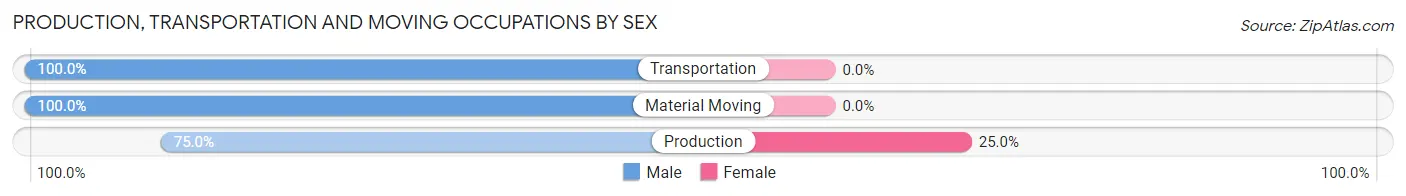
| Occupation | Male | Female |
| Production | 36 (75.0%) | 12 (25.0%) |
| Transportation | 11 (100.0%) | 0 (0.0%) |
| Material Moving | 14 (100.0%) | 0 (0.0%) |
| Total (Category) | 61 (83.6%) | 12 (16.4%) |
| Total (Overall) | 317 (51.1%) | 303 (48.9%) |
Employment Industries by Sex in Birchwood Lakes
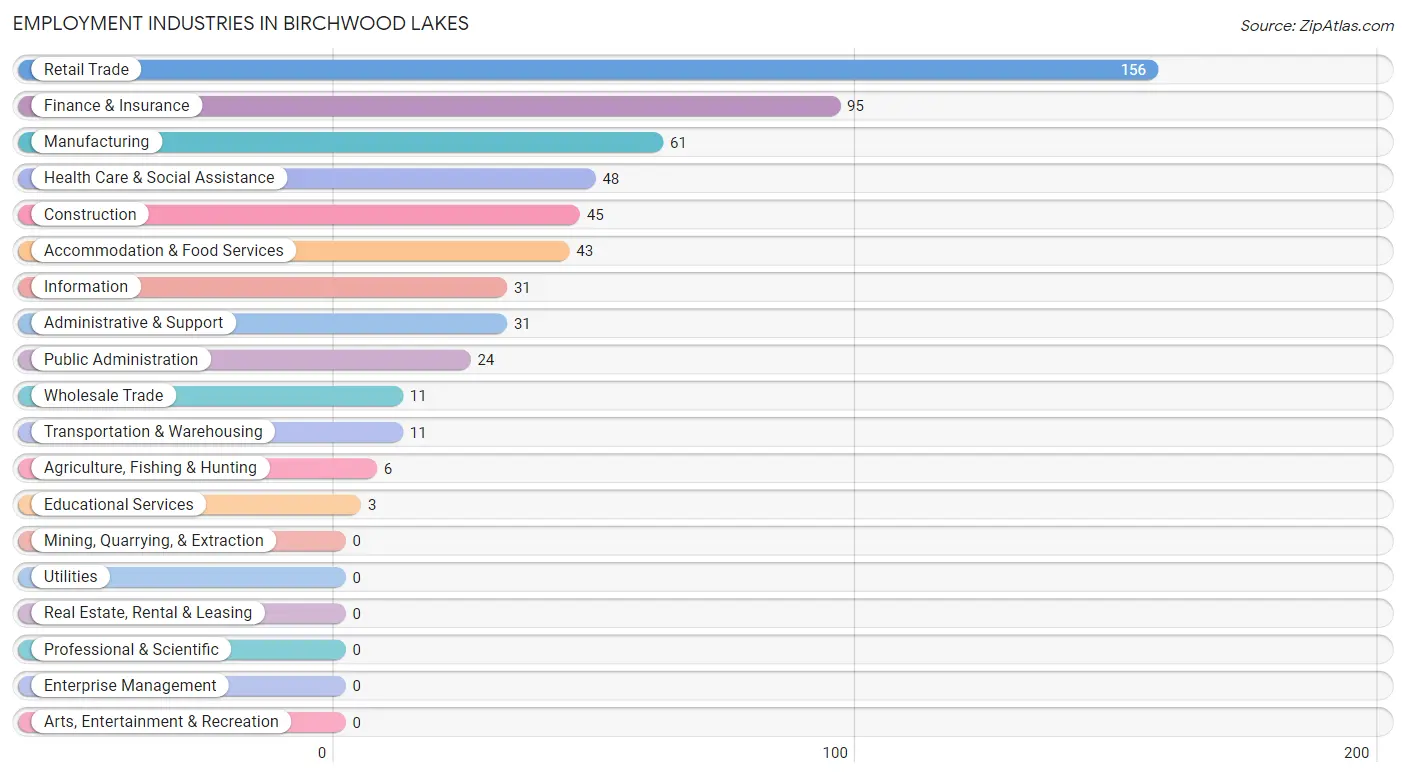
Employment Industries in Birchwood Lakes
The major employment industries in Birchwood Lakes include Retail Trade (156 | 25.2%), Finance & Insurance (95 | 15.3%), Manufacturing (61 | 9.8%), Health Care & Social Assistance (48 | 7.7%), and Construction (45 | 7.3%).
Employment Industries by Sex in Birchwood Lakes
The Birchwood Lakes industries that see more men than women are Agriculture, Fishing & Hunting (100.0%), Construction (100.0%), and Transportation & Warehousing (100.0%), whereas the industries that tend to have a higher number of women are Wholesale Trade (100.0%), Retail Trade (81.4%), and Health Care & Social Assistance (75.0%).
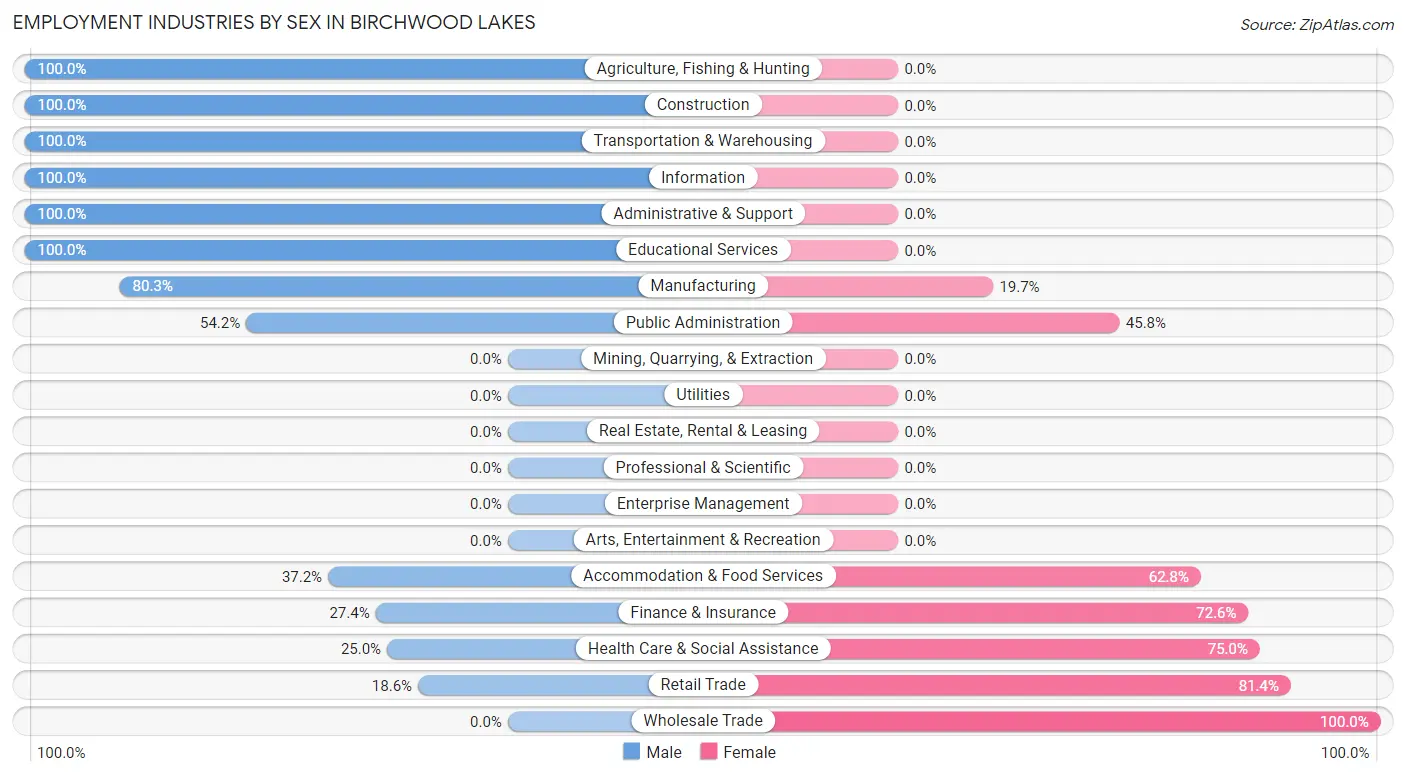
| Industry | Male | Female |
| Agriculture, Fishing & Hunting | 6 (100.0%) | 0 (0.0%) |
| Mining, Quarrying, & Extraction | 0 (0.0%) | 0 (0.0%) |
| Construction | 45 (100.0%) | 0 (0.0%) |
| Manufacturing | 49 (80.3%) | 12 (19.7%) |
| Wholesale Trade | 0 (0.0%) | 11 (100.0%) |
| Retail Trade | 29 (18.6%) | 127 (81.4%) |
| Transportation & Warehousing | 11 (100.0%) | 0 (0.0%) |
| Utilities | 0 (0.0%) | 0 (0.0%) |
| Information | 31 (100.0%) | 0 (0.0%) |
| Finance & Insurance | 26 (27.4%) | 69 (72.6%) |
| Real Estate, Rental & Leasing | 0 (0.0%) | 0 (0.0%) |
| Professional & Scientific | 0 (0.0%) | 0 (0.0%) |
| Enterprise Management | 0 (0.0%) | 0 (0.0%) |
| Administrative & Support | 31 (100.0%) | 0 (0.0%) |
| Educational Services | 3 (100.0%) | 0 (0.0%) |
| Health Care & Social Assistance | 12 (25.0%) | 36 (75.0%) |
| Arts, Entertainment & Recreation | 0 (0.0%) | 0 (0.0%) |
| Accommodation & Food Services | 16 (37.2%) | 27 (62.8%) |
| Public Administration | 13 (54.2%) | 11 (45.8%) |
| Total | 317 (51.1%) | 303 (48.9%) |
Education in Birchwood Lakes
School Enrollment in Birchwood Lakes
The most common levels of schooling among the 234 students in Birchwood Lakes are middle school (65 | 27.8%), kindergarten (62 | 26.5%), and college / undergraduate (59 | 25.2%).
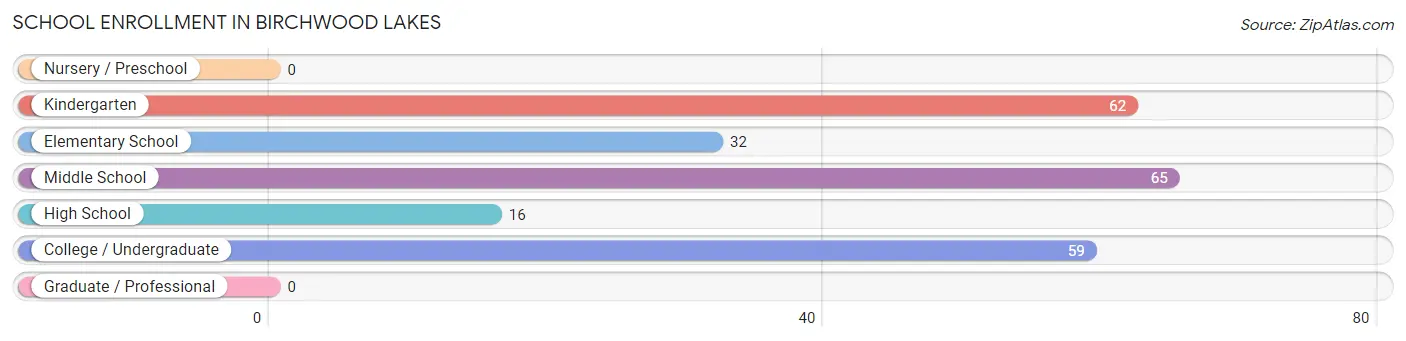
| School Level | # Students | % Students |
| Nursery / Preschool | 0 | 0.0% |
| Kindergarten | 62 | 26.5% |
| Elementary School | 32 | 13.7% |
| Middle School | 65 | 27.8% |
| High School | 16 | 6.8% |
| College / Undergraduate | 59 | 25.2% |
| Graduate / Professional | 0 | 0.0% |
| Total | 234 | 100.0% |
School Enrollment by Age by Funding Source in Birchwood Lakes
Out of a total of 234 students who are enrolled in schools in Birchwood Lakes, 50 (21.4%) attend a private institution, while the remaining 184 (78.6%) are enrolled in public schools. The age group of 20 to 24 year olds has the highest likelihood of being enrolled in private schools, with 39 (78.0% in the age bracket) enrolled. Conversely, the age group of 5 to 9 year old has the lowest likelihood of being enrolled in a private school, with 73 (100.0% in the age bracket) attending a public institution.
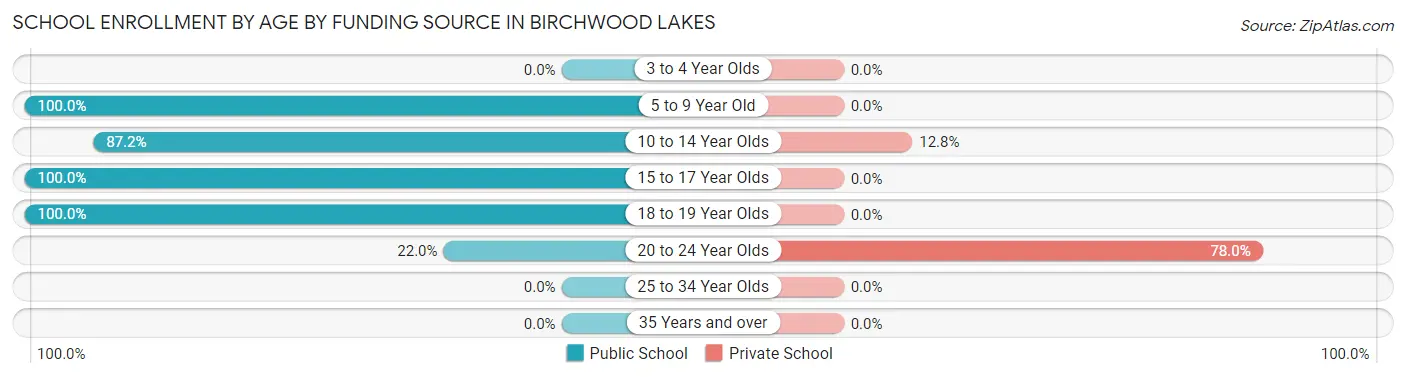
| Age Bracket | Public School | Private School |
| 3 to 4 Year Olds | 0 (0.0%) | 0 (0.0%) |
| 5 to 9 Year Old | 73 (100.0%) | 0 (0.0%) |
| 10 to 14 Year Olds | 75 (87.2%) | 11 (12.8%) |
| 15 to 17 Year Olds | 13 (100.0%) | 0 (0.0%) |
| 18 to 19 Year Olds | 12 (100.0%) | 0 (0.0%) |
| 20 to 24 Year Olds | 11 (22.0%) | 39 (78.0%) |
| 25 to 34 Year Olds | 0 (0.0%) | 0 (0.0%) |
| 35 Years and over | 0 (0.0%) | 0 (0.0%) |
| Total | 184 (78.6%) | 50 (21.4%) |
Educational Attainment by Field of Study in Birchwood Lakes
Education (84 | 32.2%), communications (43 | 16.5%), business (36 | 13.8%), literature & languages (36 | 13.8%), and visual & performing arts (23 | 8.8%) are the most common fields of study among 261 individuals in Birchwood Lakes who have obtained a bachelor's degree or higher.
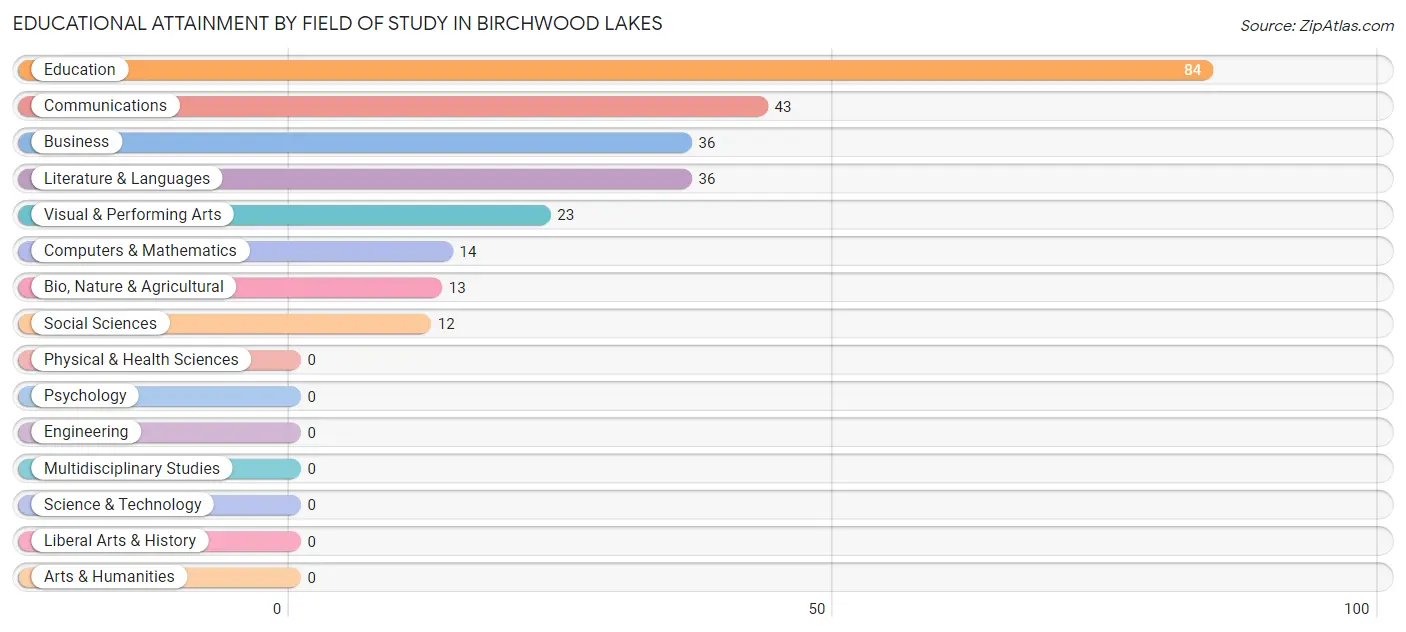
| Field of Study | # Graduates | % Graduates |
| Computers & Mathematics | 14 | 5.4% |
| Bio, Nature & Agricultural | 13 | 5.0% |
| Physical & Health Sciences | 0 | 0.0% |
| Psychology | 0 | 0.0% |
| Social Sciences | 12 | 4.6% |
| Engineering | 0 | 0.0% |
| Multidisciplinary Studies | 0 | 0.0% |
| Science & Technology | 0 | 0.0% |
| Business | 36 | 13.8% |
| Education | 84 | 32.2% |
| Literature & Languages | 36 | 13.8% |
| Liberal Arts & History | 0 | 0.0% |
| Visual & Performing Arts | 23 | 8.8% |
| Communications | 43 | 16.5% |
| Arts & Humanities | 0 | 0.0% |
| Total | 261 | 100.0% |
Transportation & Commute in Birchwood Lakes
Vehicle Availability by Sex in Birchwood Lakes
The most prevalent vehicle ownership categories in Birchwood Lakes are males with 2 vehicles (164, accounting for 57.3%) and females with 2 vehicles (145, making up 61.9%).
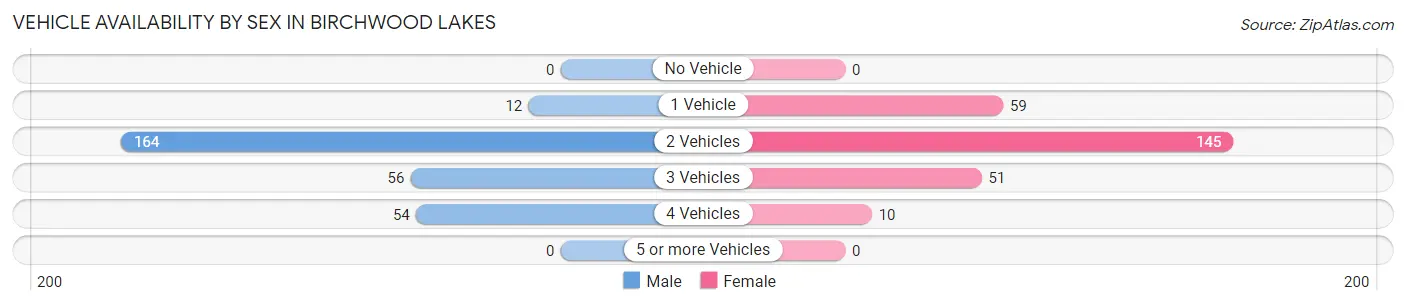
| Vehicles Available | Male | Female |
| No Vehicle | 0 (0.0%) | 0 (0.0%) |
| 1 Vehicle | 12 (4.2%) | 59 (22.3%) |
| 2 Vehicles | 164 (57.3%) | 145 (54.7%) |
| 3 Vehicles | 56 (19.6%) | 51 (19.3%) |
| 4 Vehicles | 54 (18.9%) | 10 (3.8%) |
| 5 or more Vehicles | 0 (0.0%) | 0 (0.0%) |
| Total | 286 (100.0%) | 265 (100.0%) |
Commute Time in Birchwood Lakes
The most frequently occuring commute durations in Birchwood Lakes are 45 to 59 minutes (144 commuters, 27.0%), 60 to 89 minutes (113 commuters, 21.2%), and 40 to 44 minutes (98 commuters, 18.4%).
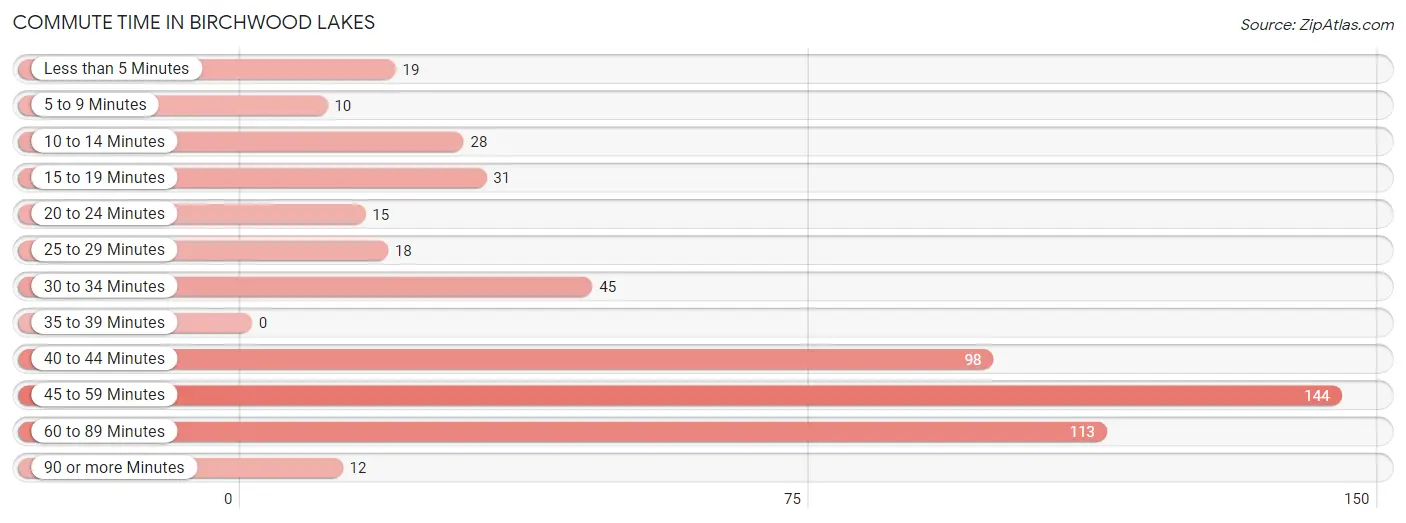
| Commute Time | # Commuters | % Commuters |
| Less than 5 Minutes | 19 | 3.6% |
| 5 to 9 Minutes | 10 | 1.9% |
| 10 to 14 Minutes | 28 | 5.2% |
| 15 to 19 Minutes | 31 | 5.8% |
| 20 to 24 Minutes | 15 | 2.8% |
| 25 to 29 Minutes | 18 | 3.4% |
| 30 to 34 Minutes | 45 | 8.4% |
| 35 to 39 Minutes | 0 | 0.0% |
| 40 to 44 Minutes | 98 | 18.4% |
| 45 to 59 Minutes | 144 | 27.0% |
| 60 to 89 Minutes | 113 | 21.2% |
| 90 or more Minutes | 12 | 2.2% |
Commute Time by Sex in Birchwood Lakes
The most common commute times in Birchwood Lakes are 45 to 59 minutes (98 commuters, 36.6%) for males and 40 to 44 minutes (67 commuters, 25.3%) for females.
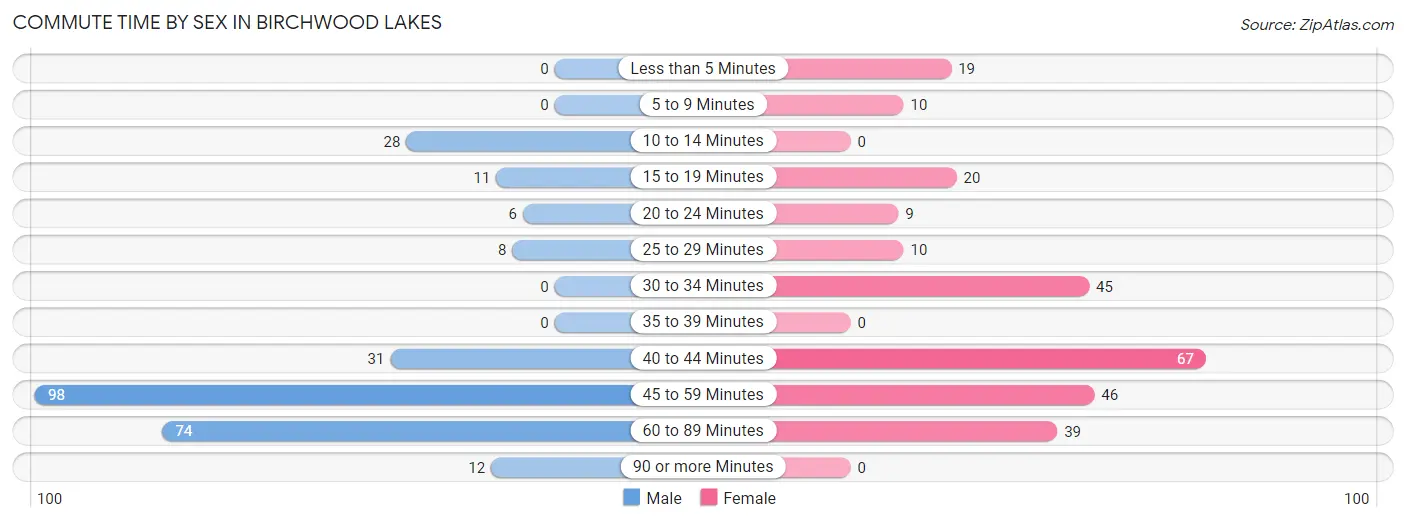
| Commute Time | Male | Female |
| Less than 5 Minutes | 0 (0.0%) | 19 (7.2%) |
| 5 to 9 Minutes | 0 (0.0%) | 10 (3.8%) |
| 10 to 14 Minutes | 28 (10.4%) | 0 (0.0%) |
| 15 to 19 Minutes | 11 (4.1%) | 20 (7.5%) |
| 20 to 24 Minutes | 6 (2.2%) | 9 (3.4%) |
| 25 to 29 Minutes | 8 (3.0%) | 10 (3.8%) |
| 30 to 34 Minutes | 0 (0.0%) | 45 (17.0%) |
| 35 to 39 Minutes | 0 (0.0%) | 0 (0.0%) |
| 40 to 44 Minutes | 31 (11.6%) | 67 (25.3%) |
| 45 to 59 Minutes | 98 (36.6%) | 46 (17.4%) |
| 60 to 89 Minutes | 74 (27.6%) | 39 (14.7%) |
| 90 or more Minutes | 12 (4.5%) | 0 (0.0%) |
Time of Departure to Work by Sex in Birchwood Lakes
The most frequent times of departure to work in Birchwood Lakes are 4:00 PM to 11:59 PM (63, 23.5%) for males and 6:30 AM to 6:59 AM (81, 30.6%) for females.
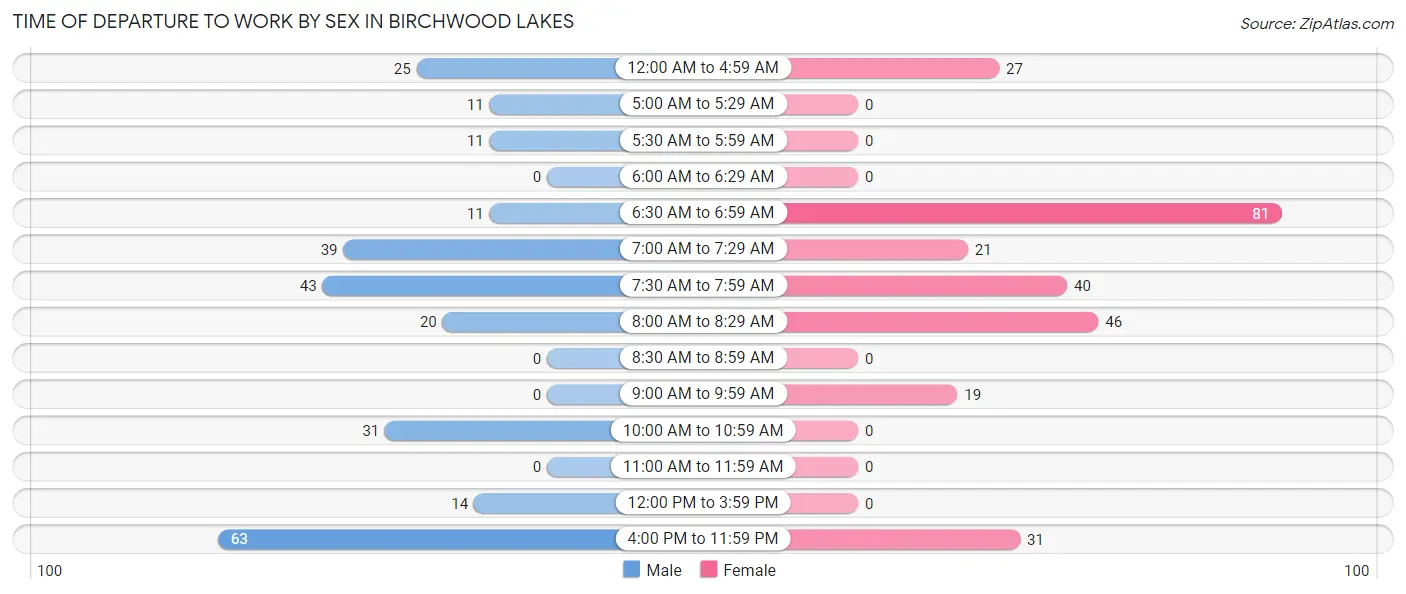
| Time of Departure | Male | Female |
| 12:00 AM to 4:59 AM | 25 (9.3%) | 27 (10.2%) |
| 5:00 AM to 5:29 AM | 11 (4.1%) | 0 (0.0%) |
| 5:30 AM to 5:59 AM | 11 (4.1%) | 0 (0.0%) |
| 6:00 AM to 6:29 AM | 0 (0.0%) | 0 (0.0%) |
| 6:30 AM to 6:59 AM | 11 (4.1%) | 81 (30.6%) |
| 7:00 AM to 7:29 AM | 39 (14.5%) | 21 (7.9%) |
| 7:30 AM to 7:59 AM | 43 (16.0%) | 40 (15.1%) |
| 8:00 AM to 8:29 AM | 20 (7.5%) | 46 (17.4%) |
| 8:30 AM to 8:59 AM | 0 (0.0%) | 0 (0.0%) |
| 9:00 AM to 9:59 AM | 0 (0.0%) | 19 (7.2%) |
| 10:00 AM to 10:59 AM | 31 (11.6%) | 0 (0.0%) |
| 11:00 AM to 11:59 AM | 0 (0.0%) | 0 (0.0%) |
| 12:00 PM to 3:59 PM | 14 (5.2%) | 0 (0.0%) |
| 4:00 PM to 11:59 PM | 63 (23.5%) | 31 (11.7%) |
| Total | 268 (100.0%) | 265 (100.0%) |
Housing Occupancy in Birchwood Lakes
Occupancy by Ownership in Birchwood Lakes
Of the total 612 dwellings in Birchwood Lakes, owner-occupied units account for 516 (84.3%), while renter-occupied units make up 96 (15.7%).
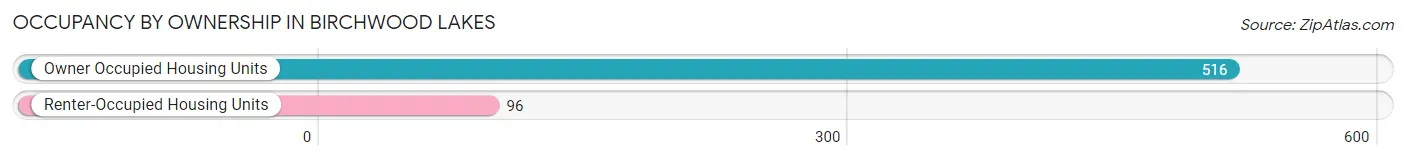
| Occupancy | # Housing Units | % Housing Units |
| Owner Occupied Housing Units | 516 | 84.3% |
| Renter-Occupied Housing Units | 96 | 15.7% |
| Total Occupied Housing Units | 612 | 100.0% |
Occupancy by Household Size in Birchwood Lakes
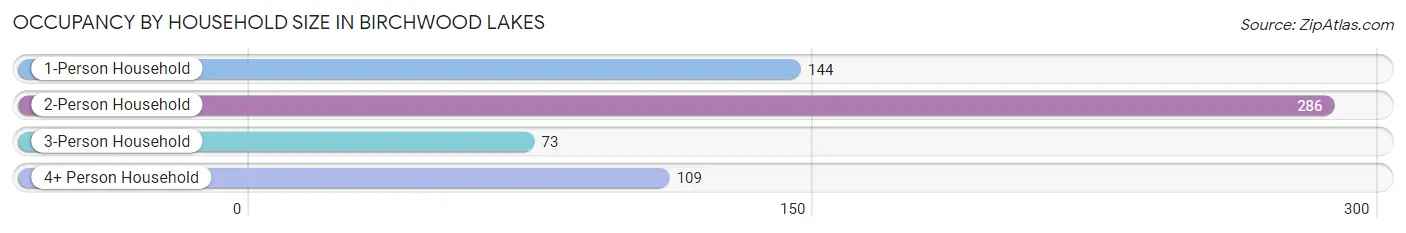
| Household Size | # Housing Units | % Housing Units |
| 1-Person Household | 144 | 23.5% |
| 2-Person Household | 286 | 46.7% |
| 3-Person Household | 73 | 11.9% |
| 4+ Person Household | 109 | 17.8% |
| Total Housing Units | 612 | 100.0% |
Occupancy by Ownership by Household Size in Birchwood Lakes
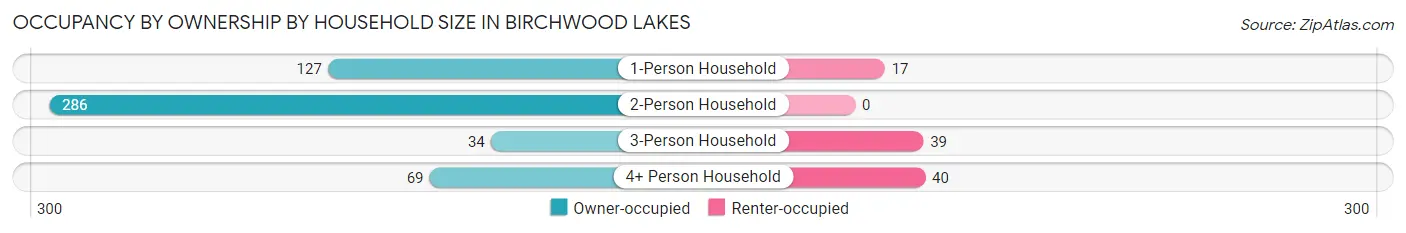
| Household Size | Owner-occupied | Renter-occupied |
| 1-Person Household | 127 (88.2%) | 17 (11.8%) |
| 2-Person Household | 286 (100.0%) | 0 (0.0%) |
| 3-Person Household | 34 (46.6%) | 39 (53.4%) |
| 4+ Person Household | 69 (63.3%) | 40 (36.7%) |
| Total Housing Units | 516 (84.3%) | 96 (15.7%) |
Occupancy by Educational Attainment in Birchwood Lakes
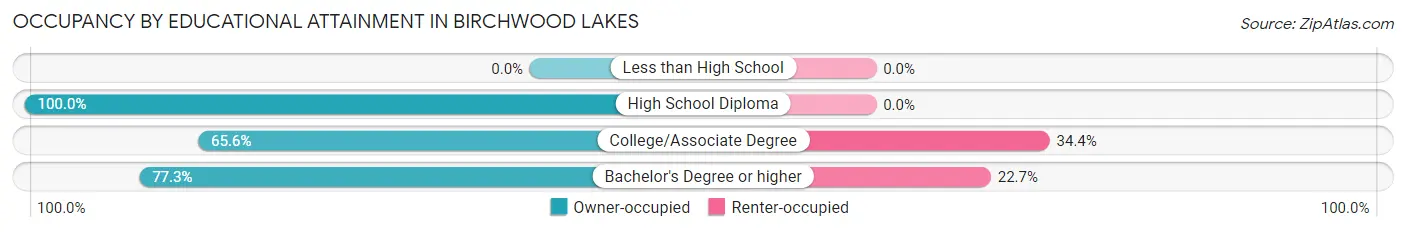
| Household Size | Owner-occupied | Renter-occupied |
| Less than High School | 0 (0.0%) | 0 (0.0%) |
| High School Diploma | 303 (100.0%) | 0 (0.0%) |
| College/Associate Degree | 145 (65.6%) | 76 (34.4%) |
| Bachelor's Degree or higher | 68 (77.3%) | 20 (22.7%) |
Occupancy by Age of Householder in Birchwood Lakes
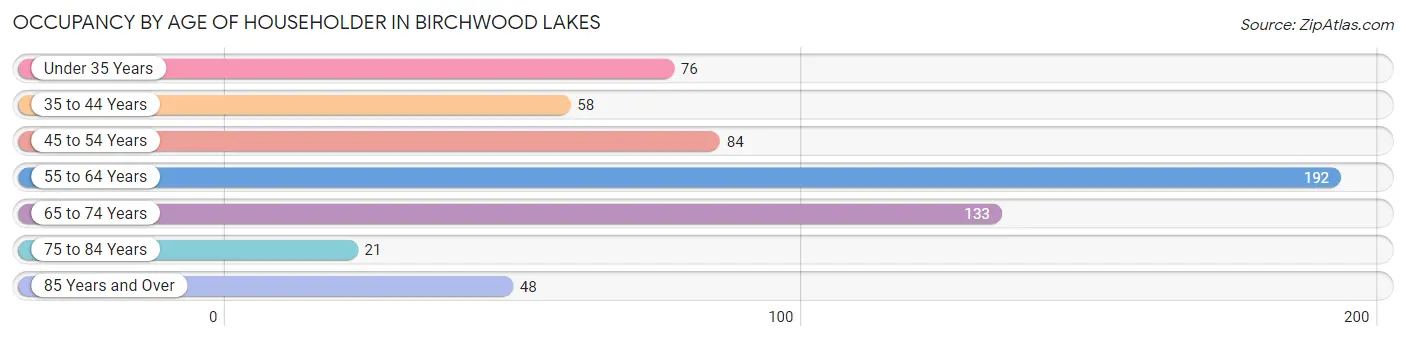
| Age Bracket | # Households | % Households |
| Under 35 Years | 76 | 12.4% |
| 35 to 44 Years | 58 | 9.5% |
| 45 to 54 Years | 84 | 13.7% |
| 55 to 64 Years | 192 | 31.4% |
| 65 to 74 Years | 133 | 21.7% |
| 75 to 84 Years | 21 | 3.4% |
| 85 Years and Over | 48 | 7.8% |
| Total | 612 | 100.0% |
Housing Finances in Birchwood Lakes
Median Income by Occupancy in Birchwood Lakes
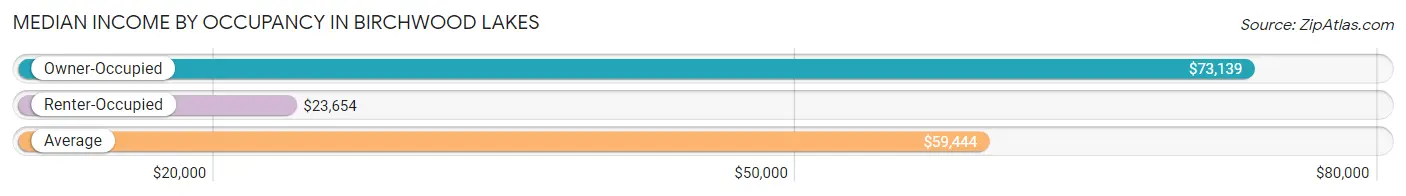
| Occupancy Type | # Households | Median Income |
| Owner-Occupied | 516 (84.3%) | $73,139 |
| Renter-Occupied | 96 (15.7%) | $23,654 |
| Average | 612 (100.0%) | $59,444 |
Occupancy by Householder Income Bracket in Birchwood Lakes
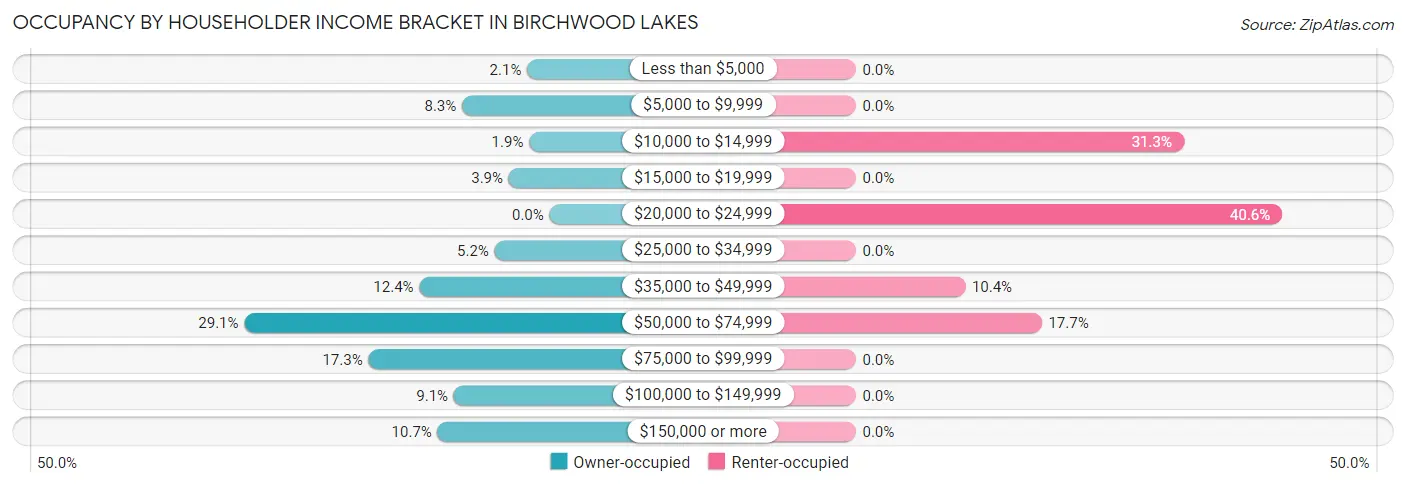
| Income Bracket | Owner-occupied | Renter-occupied |
| Less than $5,000 | 11 (2.1%) | 0 (0.0%) |
| $5,000 to $9,999 | 43 (8.3%) | 0 (0.0%) |
| $10,000 to $14,999 | 10 (1.9%) | 30 (31.2%) |
| $15,000 to $19,999 | 20 (3.9%) | 0 (0.0%) |
| $20,000 to $24,999 | 0 (0.0%) | 39 (40.6%) |
| $25,000 to $34,999 | 27 (5.2%) | 0 (0.0%) |
| $35,000 to $49,999 | 64 (12.4%) | 10 (10.4%) |
| $50,000 to $74,999 | 150 (29.1%) | 17 (17.7%) |
| $75,000 to $99,999 | 89 (17.2%) | 0 (0.0%) |
| $100,000 to $149,999 | 47 (9.1%) | 0 (0.0%) |
| $150,000 or more | 55 (10.7%) | 0 (0.0%) |
| Total | 516 (100.0%) | 96 (100.0%) |
Monthly Housing Cost Tiers in Birchwood Lakes
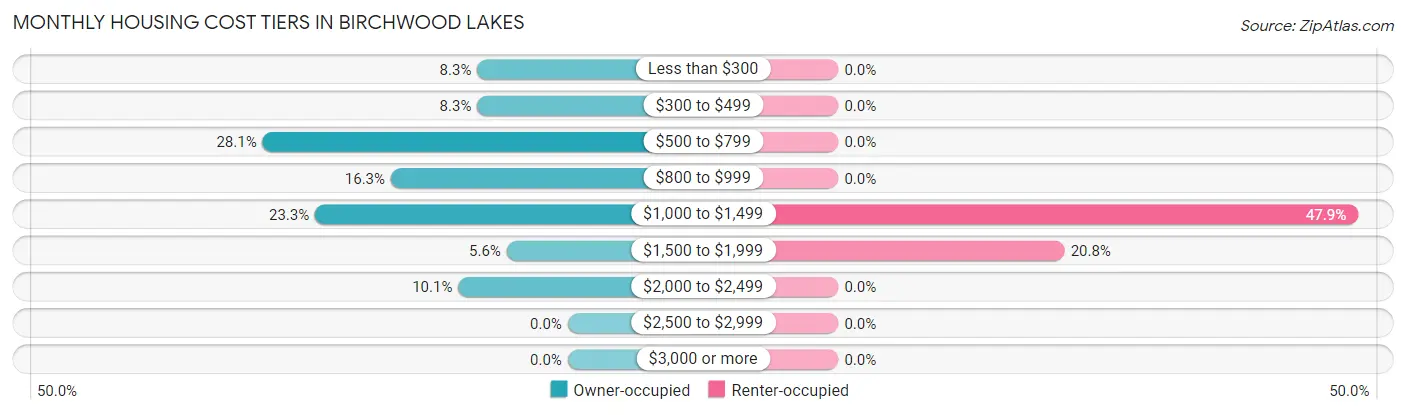
| Monthly Cost | Owner-occupied | Renter-occupied |
| Less than $300 | 43 (8.3%) | 0 (0.0%) |
| $300 to $499 | 43 (8.3%) | 0 (0.0%) |
| $500 to $799 | 145 (28.1%) | 0 (0.0%) |
| $800 to $999 | 84 (16.3%) | 0 (0.0%) |
| $1,000 to $1,499 | 120 (23.3%) | 46 (47.9%) |
| $1,500 to $1,999 | 29 (5.6%) | 20 (20.8%) |
| $2,000 to $2,499 | 52 (10.1%) | 0 (0.0%) |
| $2,500 to $2,999 | 0 (0.0%) | 0 (0.0%) |
| $3,000 or more | 0 (0.0%) | 0 (0.0%) |
| Total | 516 (100.0%) | 96 (100.0%) |
Physical Housing Characteristics in Birchwood Lakes
Housing Structures in Birchwood Lakes
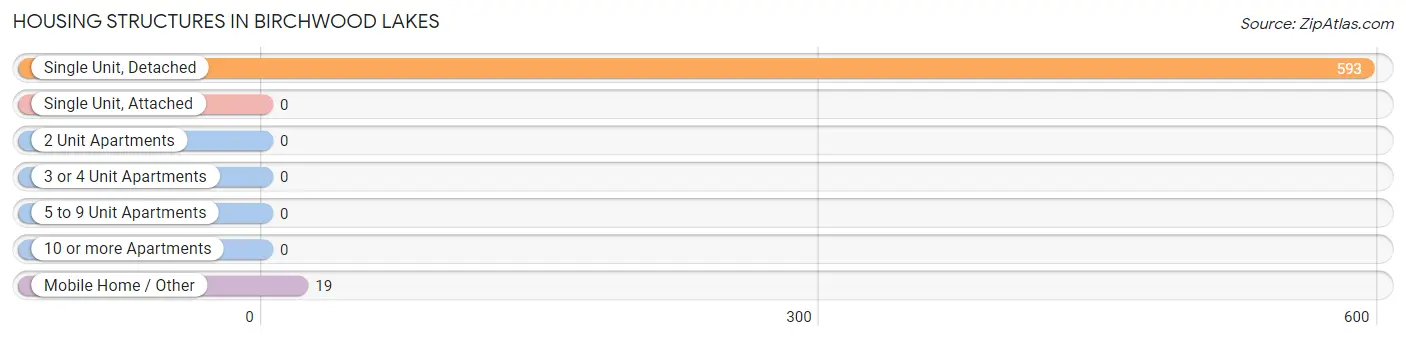
| Structure Type | # Housing Units | % Housing Units |
| Single Unit, Detached | 593 | 96.9% |
| Single Unit, Attached | 0 | 0.0% |
| 2 Unit Apartments | 0 | 0.0% |
| 3 or 4 Unit Apartments | 0 | 0.0% |
| 5 to 9 Unit Apartments | 0 | 0.0% |
| 10 or more Apartments | 0 | 0.0% |
| Mobile Home / Other | 19 | 3.1% |
| Total | 612 | 100.0% |
Housing Structures by Occupancy in Birchwood Lakes
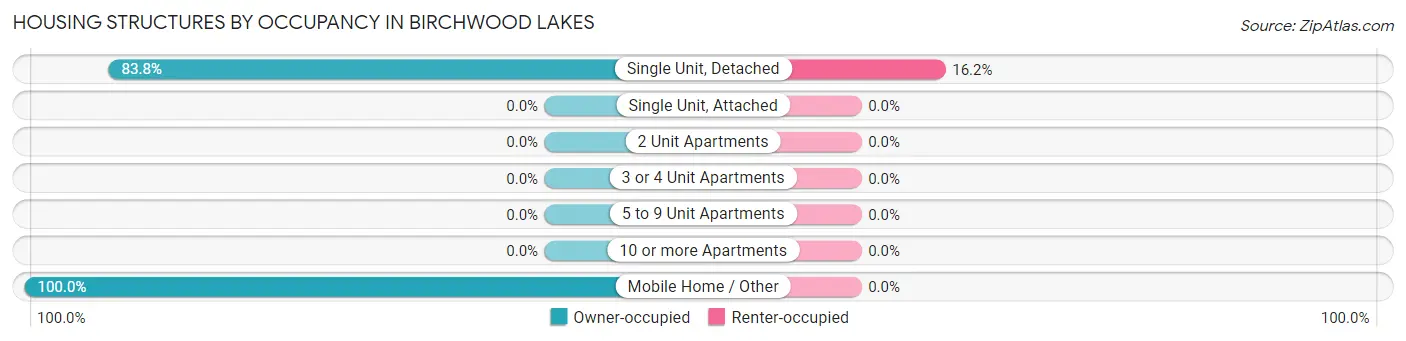
| Structure Type | Owner-occupied | Renter-occupied |
| Single Unit, Detached | 497 (83.8%) | 96 (16.2%) |
| Single Unit, Attached | 0 (0.0%) | 0 (0.0%) |
| 2 Unit Apartments | 0 (0.0%) | 0 (0.0%) |
| 3 or 4 Unit Apartments | 0 (0.0%) | 0 (0.0%) |
| 5 to 9 Unit Apartments | 0 (0.0%) | 0 (0.0%) |
| 10 or more Apartments | 0 (0.0%) | 0 (0.0%) |
| Mobile Home / Other | 19 (100.0%) | 0 (0.0%) |
| Total | 516 (84.3%) | 96 (15.7%) |
Housing Structures by Number of Rooms in Birchwood Lakes
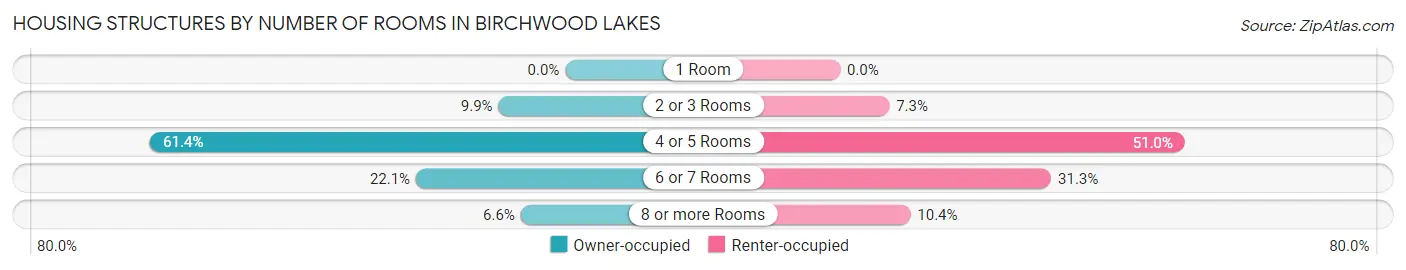
| Number of Rooms | Owner-occupied | Renter-occupied |
| 1 Room | 0 (0.0%) | 0 (0.0%) |
| 2 or 3 Rooms | 51 (9.9%) | 7 (7.3%) |
| 4 or 5 Rooms | 317 (61.4%) | 49 (51.0%) |
| 6 or 7 Rooms | 114 (22.1%) | 30 (31.2%) |
| 8 or more Rooms | 34 (6.6%) | 10 (10.4%) |
| Total | 516 (100.0%) | 96 (100.0%) |
Housing Structure by Heating Type in Birchwood Lakes
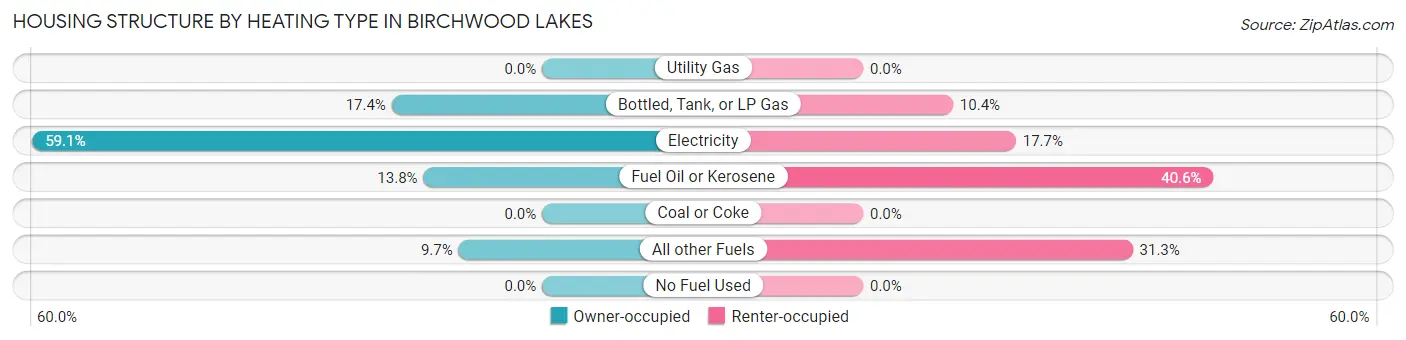
| Heating Type | Owner-occupied | Renter-occupied |
| Utility Gas | 0 (0.0%) | 0 (0.0%) |
| Bottled, Tank, or LP Gas | 90 (17.4%) | 10 (10.4%) |
| Electricity | 305 (59.1%) | 17 (17.7%) |
| Fuel Oil or Kerosene | 71 (13.8%) | 39 (40.6%) |
| Coal or Coke | 0 (0.0%) | 0 (0.0%) |
| All other Fuels | 50 (9.7%) | 30 (31.2%) |
| No Fuel Used | 0 (0.0%) | 0 (0.0%) |
| Total | 516 (100.0%) | 96 (100.0%) |
Household Vehicle Usage in Birchwood Lakes
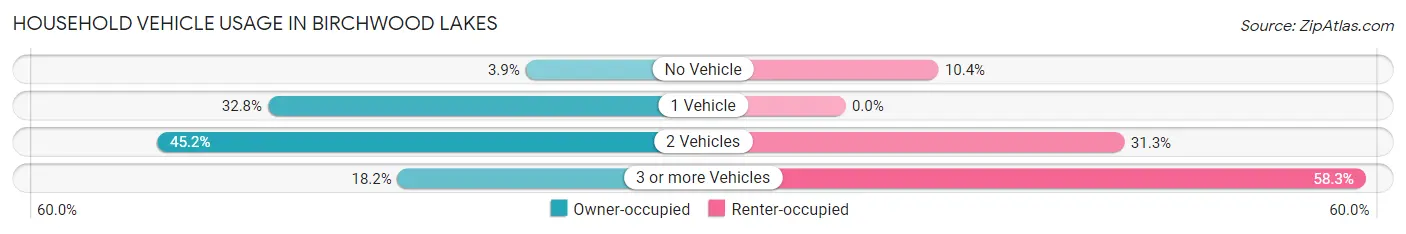
| Vehicles per Household | Owner-occupied | Renter-occupied |
| No Vehicle | 20 (3.9%) | 10 (10.4%) |
| 1 Vehicle | 169 (32.8%) | 0 (0.0%) |
| 2 Vehicles | 233 (45.2%) | 30 (31.2%) |
| 3 or more Vehicles | 94 (18.2%) | 56 (58.3%) |
| Total | 516 (100.0%) | 96 (100.0%) |
Real Estate & Mortgages in Birchwood Lakes
Real Estate and Mortgage Overview in Birchwood Lakes
| Characteristic | Without Mortgage | With Mortgage |
| Housing Units | 188 | 328 |
| Median Property Value | $117,800 | $131,800 |
| Median Household Income | $58,958 | $21 |
| Monthly Housing Costs | $535 | $0 |
| Real Estate Taxes | $2,727 | $0 |
Property Value by Mortgage Status in Birchwood Lakes
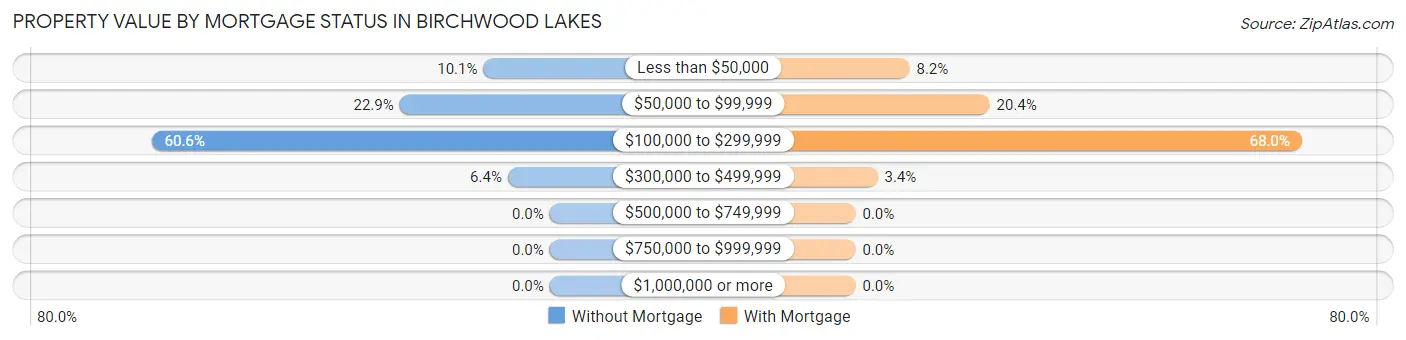
| Property Value | Without Mortgage | With Mortgage |
| Less than $50,000 | 19 (10.1%) | 27 (8.2%) |
| $50,000 to $99,999 | 43 (22.9%) | 67 (20.4%) |
| $100,000 to $299,999 | 114 (60.6%) | 223 (68.0%) |
| $300,000 to $499,999 | 12 (6.4%) | 11 (3.4%) |
| $500,000 to $749,999 | 0 (0.0%) | 0 (0.0%) |
| $750,000 to $999,999 | 0 (0.0%) | 0 (0.0%) |
| $1,000,000 or more | 0 (0.0%) | 0 (0.0%) |
| Total | 188 (100.0%) | 328 (100.0%) |
Household Income by Mortgage Status in Birchwood Lakes
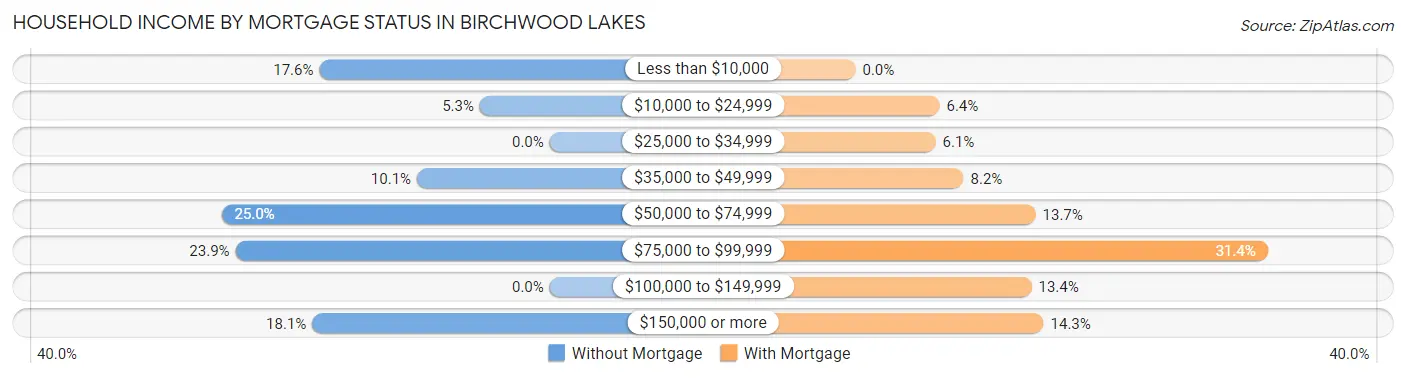
| Household Income | Without Mortgage | With Mortgage |
| Less than $10,000 | 33 (17.5%) | 0 (0.0%) |
| $10,000 to $24,999 | 10 (5.3%) | 21 (6.4%) |
| $25,000 to $34,999 | 0 (0.0%) | 20 (6.1%) |
| $35,000 to $49,999 | 19 (10.1%) | 27 (8.2%) |
| $50,000 to $74,999 | 47 (25.0%) | 45 (13.7%) |
| $75,000 to $99,999 | 45 (23.9%) | 103 (31.4%) |
| $100,000 to $149,999 | 0 (0.0%) | 44 (13.4%) |
| $150,000 or more | 34 (18.1%) | 47 (14.3%) |
| Total | 188 (100.0%) | 328 (100.0%) |
Property Value to Household Income Ratio in Birchwood Lakes
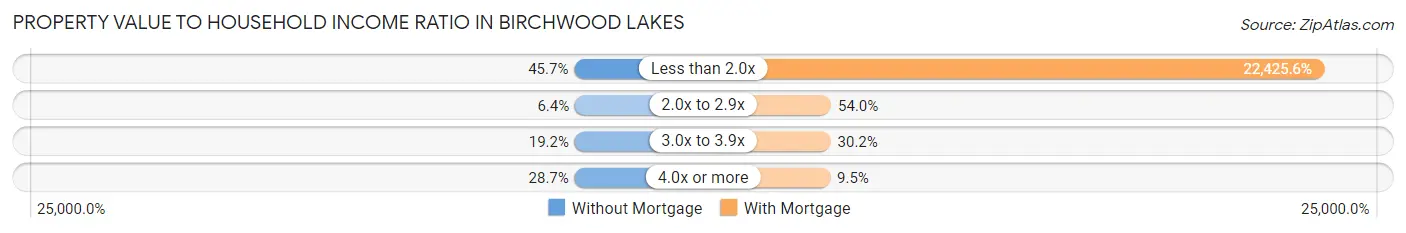
| Value-to-Income Ratio | Without Mortgage | With Mortgage |
| Less than 2.0x | 86 (45.7%) | 73,556 (22,425.6%) |
| 2.0x to 2.9x | 12 (6.4%) | 177 (54.0%) |
| 3.0x to 3.9x | 36 (19.2%) | 99 (30.2%) |
| 4.0x or more | 54 (28.7%) | 31 (9.5%) |
| Total | 188 (100.0%) | 328 (100.0%) |
Real Estate Taxes by Mortgage Status in Birchwood Lakes
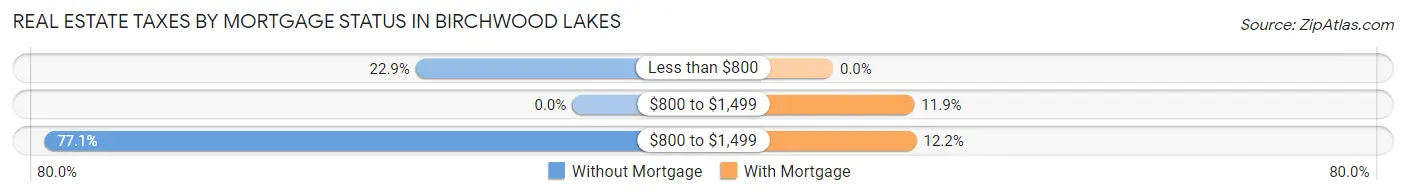
| Property Taxes | Without Mortgage | With Mortgage |
| Less than $800 | 43 (22.9%) | 0 (0.0%) |
| $800 to $1,499 | 0 (0.0%) | 39 (11.9%) |
| $800 to $1,499 | 145 (77.1%) | 40 (12.2%) |
| Total | 188 (100.0%) | 328 (100.0%) |
Health & Disability in Birchwood Lakes
Health Insurance Coverage by Age in Birchwood Lakes
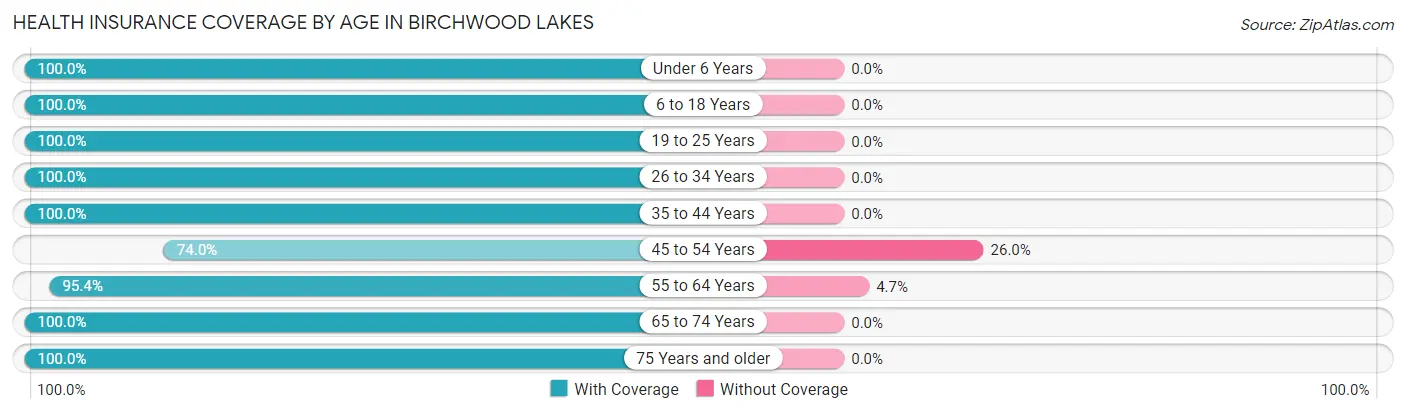
| Age Bracket | With Coverage | Without Coverage |
| Under 6 Years | 93 (100.0%) | 0 (0.0%) |
| 6 to 18 Years | 144 (100.0%) | 0 (0.0%) |
| 19 to 25 Years | 85 (100.0%) | 0 (0.0%) |
| 26 to 34 Years | 105 (100.0%) | 0 (0.0%) |
| 35 to 44 Years | 148 (100.0%) | 0 (0.0%) |
| 45 to 54 Years | 151 (74.0%) | 53 (26.0%) |
| 55 to 64 Years | 390 (95.4%) | 19 (4.6%) |
| 65 to 74 Years | 228 (100.0%) | 0 (0.0%) |
| 75 Years and older | 84 (100.0%) | 0 (0.0%) |
| Total | 1,428 (95.2%) | 72 (4.8%) |
Health Insurance Coverage by Citizenship Status in Birchwood Lakes
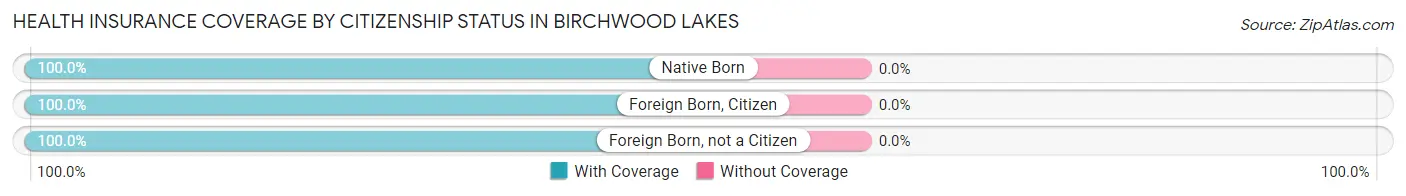
| Citizenship Status | With Coverage | Without Coverage |
| Native Born | 93 (100.0%) | 0 (0.0%) |
| Foreign Born, Citizen | 144 (100.0%) | 0 (0.0%) |
| Foreign Born, not a Citizen | 85 (100.0%) | 0 (0.0%) |
Health Insurance Coverage by Household Income in Birchwood Lakes
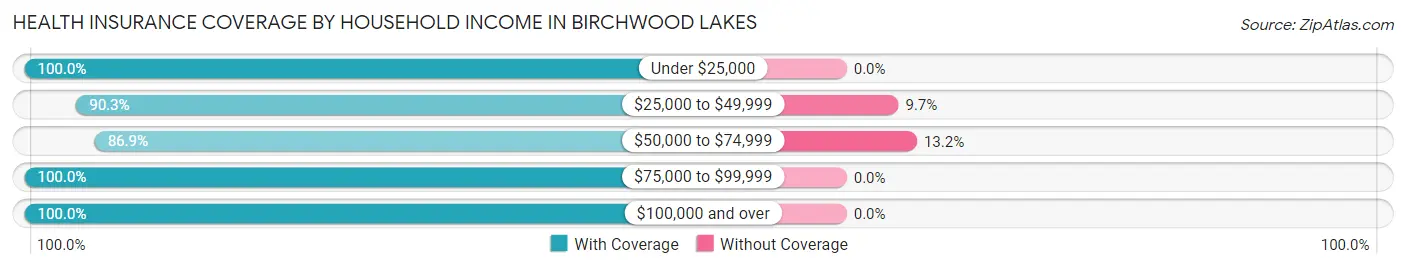
| Household Income | With Coverage | Without Coverage |
| Under $25,000 | 443 (100.0%) | 0 (0.0%) |
| $25,000 to $49,999 | 177 (90.3%) | 19 (9.7%) |
| $50,000 to $74,999 | 350 (86.9%) | 53 (13.2%) |
| $75,000 to $99,999 | 179 (100.0%) | 0 (0.0%) |
| $100,000 and over | 279 (100.0%) | 0 (0.0%) |
Public vs Private Health Insurance Coverage by Age in Birchwood Lakes
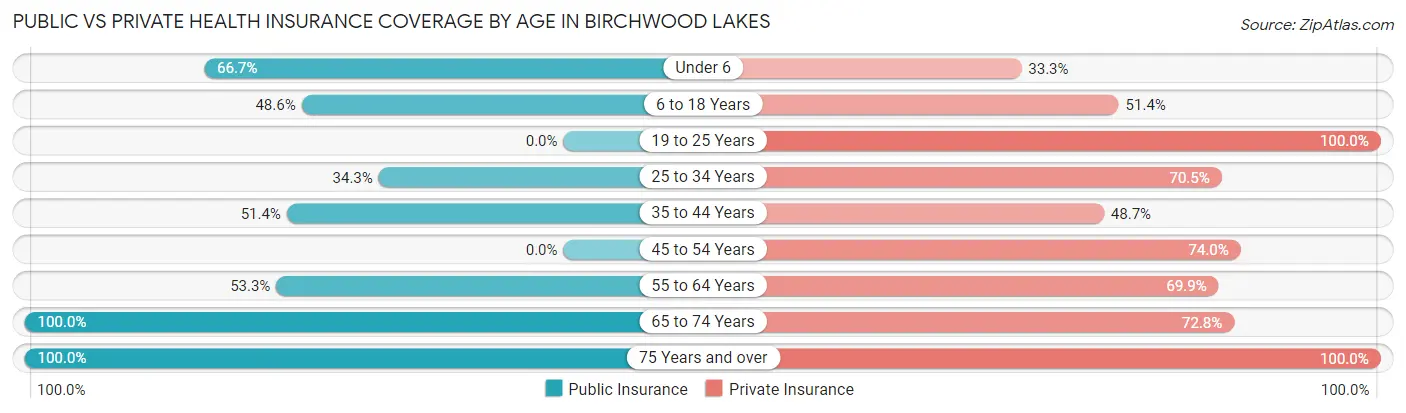
| Age Bracket | Public Insurance | Private Insurance |
| Under 6 | 62 (66.7%) | 31 (33.3%) |
| 6 to 18 Years | 70 (48.6%) | 74 (51.4%) |
| 19 to 25 Years | 0 (0.0%) | 85 (100.0%) |
| 25 to 34 Years | 36 (34.3%) | 74 (70.5%) |
| 35 to 44 Years | 76 (51.3%) | 72 (48.6%) |
| 45 to 54 Years | 0 (0.0%) | 151 (74.0%) |
| 55 to 64 Years | 218 (53.3%) | 286 (69.9%) |
| 65 to 74 Years | 228 (100.0%) | 166 (72.8%) |
| 75 Years and over | 84 (100.0%) | 84 (100.0%) |
| Total | 774 (51.6%) | 1,023 (68.2%) |
Disability Status by Sex by Age in Birchwood Lakes
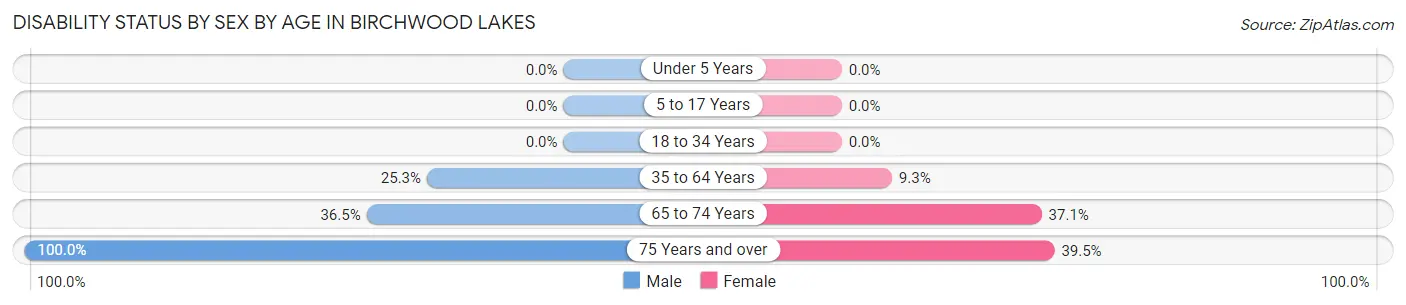
| Age Bracket | Male | Female |
| Under 5 Years | 0 (0.0%) | 0 (0.0%) |
| 5 to 17 Years | 0 (0.0%) | 0 (0.0%) |
| 18 to 34 Years | 0 (0.0%) | 0 (0.0%) |
| 35 to 64 Years | 92 (25.3%) | 37 (9.3%) |
| 65 to 74 Years | 38 (36.5%) | 46 (37.1%) |
| 75 Years and over | 46 (100.0%) | 15 (39.5%) |
Disability Class by Sex by Age in Birchwood Lakes
Disability Class: Hearing Difficulty
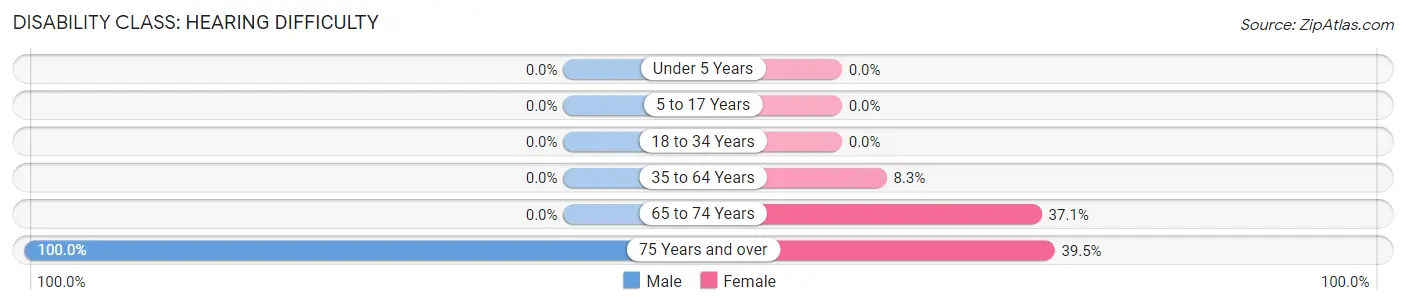
| Age Bracket | Male | Female |
| Under 5 Years | 0 (0.0%) | 0 (0.0%) |
| 5 to 17 Years | 0 (0.0%) | 0 (0.0%) |
| 18 to 34 Years | 0 (0.0%) | 0 (0.0%) |
| 35 to 64 Years | 0 (0.0%) | 33 (8.3%) |
| 65 to 74 Years | 0 (0.0%) | 46 (37.1%) |
| 75 Years and over | 46 (100.0%) | 15 (39.5%) |
Disability Class: Vision Difficulty
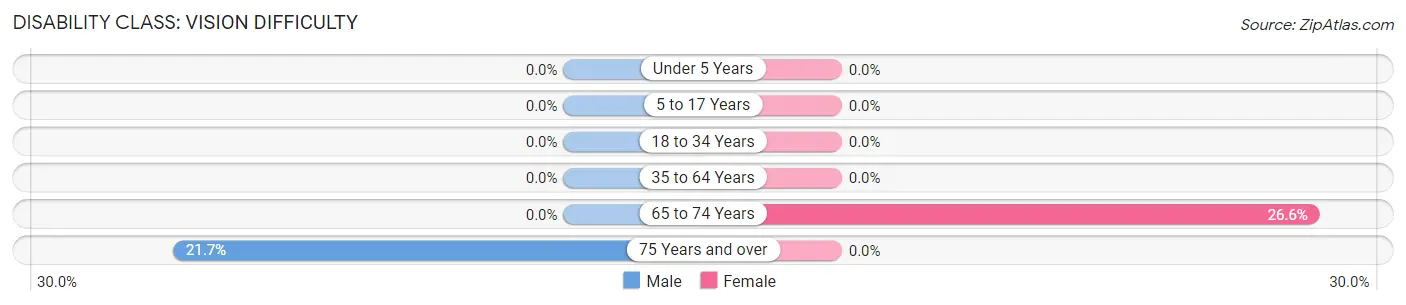
| Age Bracket | Male | Female |
| Under 5 Years | 0 (0.0%) | 0 (0.0%) |
| 5 to 17 Years | 0 (0.0%) | 0 (0.0%) |
| 18 to 34 Years | 0 (0.0%) | 0 (0.0%) |
| 35 to 64 Years | 0 (0.0%) | 0 (0.0%) |
| 65 to 74 Years | 0 (0.0%) | 33 (26.6%) |
| 75 Years and over | 10 (21.7%) | 0 (0.0%) |
Disability Class: Cognitive Difficulty
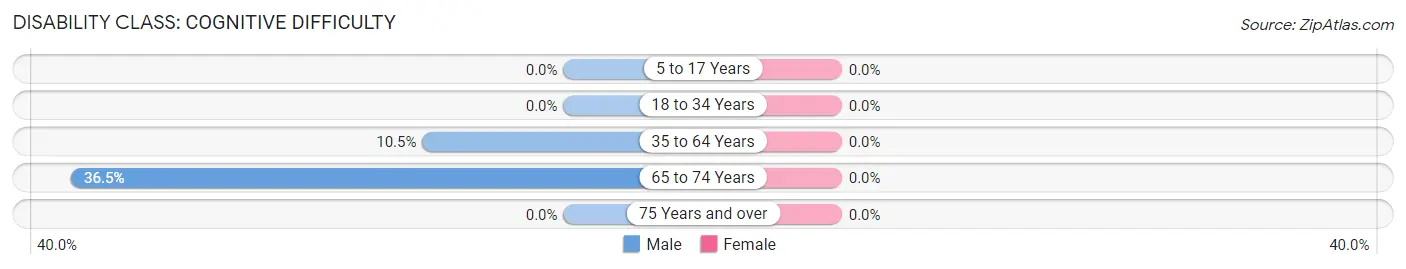
| Age Bracket | Male | Female |
| 5 to 17 Years | 0 (0.0%) | 0 (0.0%) |
| 18 to 34 Years | 0 (0.0%) | 0 (0.0%) |
| 35 to 64 Years | 38 (10.5%) | 0 (0.0%) |
| 65 to 74 Years | 38 (36.5%) | 0 (0.0%) |
| 75 Years and over | 0 (0.0%) | 0 (0.0%) |
Disability Class: Ambulatory Difficulty
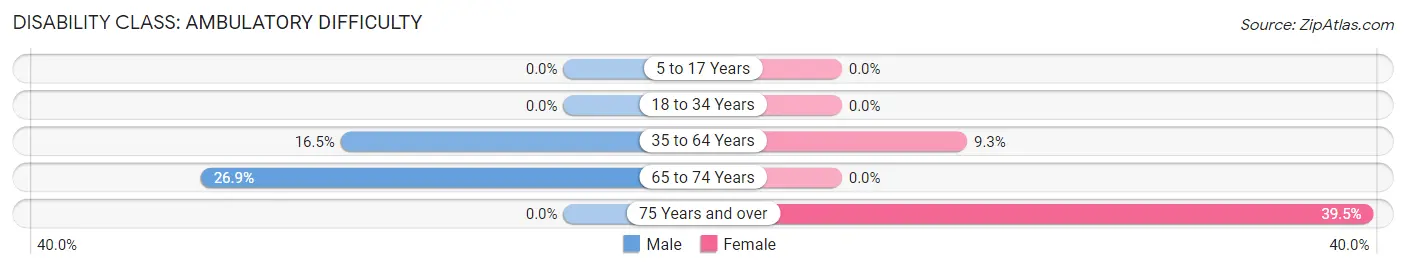
| Age Bracket | Male | Female |
| 5 to 17 Years | 0 (0.0%) | 0 (0.0%) |
| 18 to 34 Years | 0 (0.0%) | 0 (0.0%) |
| 35 to 64 Years | 60 (16.5%) | 37 (9.3%) |
| 65 to 74 Years | 28 (26.9%) | 0 (0.0%) |
| 75 Years and over | 0 (0.0%) | 15 (39.5%) |
Disability Class: Self-Care Difficulty
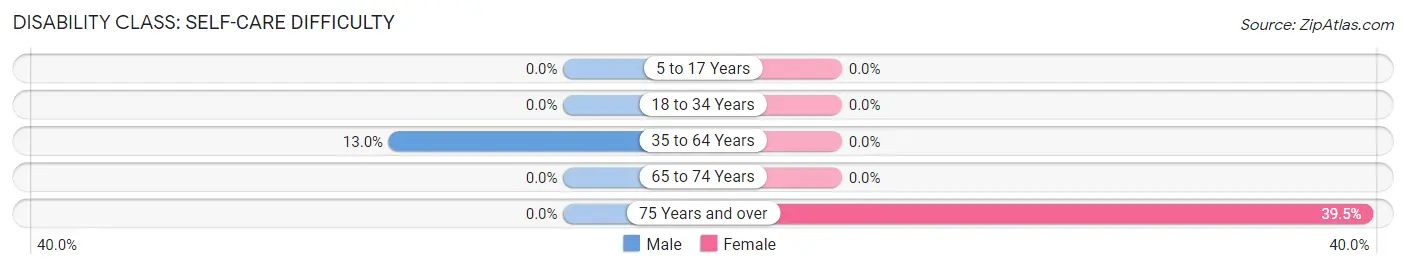
| Age Bracket | Male | Female |
| 5 to 17 Years | 0 (0.0%) | 0 (0.0%) |
| 18 to 34 Years | 0 (0.0%) | 0 (0.0%) |
| 35 to 64 Years | 47 (13.0%) | 0 (0.0%) |
| 65 to 74 Years | 0 (0.0%) | 0 (0.0%) |
| 75 Years and over | 0 (0.0%) | 15 (39.5%) |
Technology Access in Birchwood Lakes
Computing Device Access in Birchwood Lakes
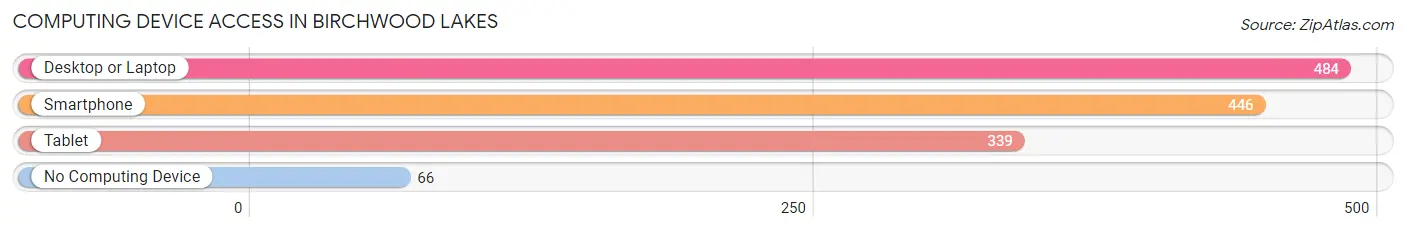
| Device Type | # Households | % Households |
| Desktop or Laptop | 484 | 79.1% |
| Smartphone | 446 | 72.9% |
| Tablet | 339 | 55.4% |
| No Computing Device | 66 | 10.8% |
| Total | 612 | 100.0% |
Internet Access in Birchwood Lakes
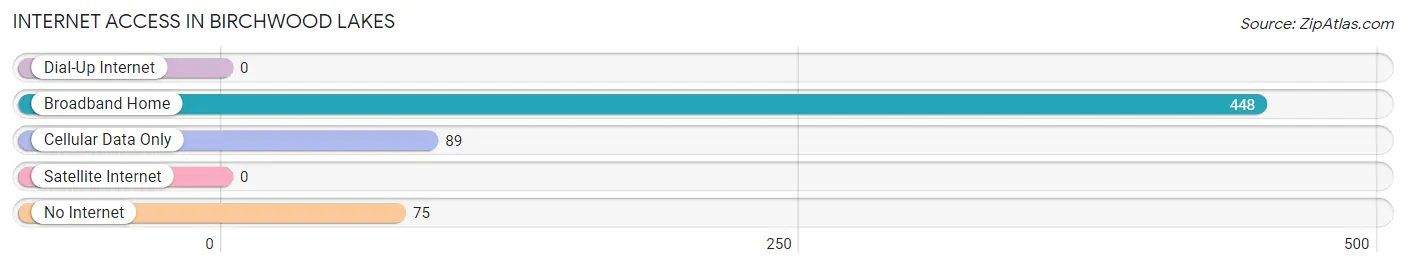
| Internet Type | # Households | % Households |
| Dial-Up Internet | 0 | 0.0% |
| Broadband Home | 448 | 73.2% |
| Cellular Data Only | 89 | 14.5% |
| Satellite Internet | 0 | 0.0% |
| No Internet | 75 | 12.2% |
| Total | 612 | 100.0% |
Birchwood Lakes Summary
Birchwood Lakes, Pennsylvania is a small, unincorporated community located in Pike County, Pennsylvania. It is situated in the northern part of the state, near the Delaware River and the New York border. The community is home to approximately 1,000 people and is known for its rural charm and natural beauty.
History
Birchwood Lakes was first settled in the late 1700s by a group of German immigrants. The area was originally known as “Birchenwald”, which translates to “Birch Forest” in English. The settlers were attracted to the area due to its abundance of natural resources, including timber and fertile soil. The community was officially established in 1820 and was named after the nearby Birchwood Lake.
In the late 1800s, the area experienced a period of growth and development. The first post office was established in 1883, and the first school was built in 1885. The community also saw the construction of several churches, a general store, and a sawmill.
Geography
Birchwood Lakes is located in the northern part of Pike County, Pennsylvania. It is situated in the Pocono Mountains, which are part of the Appalachian Mountains. The community is surrounded by forests and is home to several lakes, including Birchwood Lake, which is the largest lake in the area. The community is located approximately 90 miles from Philadelphia and 70 miles from New York City.
Economy
The economy of Birchwood Lakes is largely based on tourism and recreation. The area is home to several resorts and campgrounds, which attract visitors from all over the country. The community is also home to several small businesses, including restaurants, shops, and art galleries.
Demographics
As of the 2010 census, the population of Birchwood Lakes was 1,000. The racial makeup of the community was 97.2% White, 0.7% African American, 0.3% Native American, 0.2% Asian, and 1.6% from other races. The median household income was $45,000, and the median age was 44.
Conclusion
Birchwood Lakes, Pennsylvania is a small, unincorporated community located in Pike County, Pennsylvania. It is situated in the northern part of the state, near the Delaware River and the New York border. The community is home to approximately 1,000 people and is known for its rural charm and natural beauty. The economy of Birchwood Lakes is largely based on tourism and recreation, and the population is predominantly White. The community is a popular destination for visitors from all over the country, and is a great place to live and work.
Common Questions
What is Per Capita Income in Birchwood Lakes?
Per Capita income in Birchwood Lakes is $29,096.
What is the Median Family Income in Birchwood Lakes?
Median Family Income in Birchwood Lakes is $73,525.
What is the Median Household income in Birchwood Lakes?
Median Household Income in Birchwood Lakes is $59,444.
What is Income or Wage Gap in Birchwood Lakes?
Income or Wage Gap in Birchwood Lakes is 65.4%.
Women in Birchwood Lakes earn 34.6 cents for every dollar earned by a man.
What is Inequality or Gini Index in Birchwood Lakes?
Inequality or Gini Index in Birchwood Lakes is 0.42.
What is the Total Population of Birchwood Lakes?
Total Population of Birchwood Lakes is 1,500.
What is the Total Male Population of Birchwood Lakes?
Total Male Population of Birchwood Lakes is 685.
What is the Total Female Population of Birchwood Lakes?
Total Female Population of Birchwood Lakes is 815.
What is the Ratio of Males per 100 Females in Birchwood Lakes?
There are 84.05 Males per 100 Females in Birchwood Lakes.
What is the Ratio of Females per 100 Males in Birchwood Lakes?
There are 118.98 Females per 100 Males in Birchwood Lakes.
What is the Median Population Age in Birchwood Lakes?
Median Population Age in Birchwood Lakes is 53.7 Years.
What is the Average Family Size in Birchwood Lakes
Average Family Size in Birchwood Lakes is 2.9 People.
What is the Average Household Size in Birchwood Lakes
Average Household Size in Birchwood Lakes is 2.5 People.
How Large is the Labor Force in Birchwood Lakes?
There are 728 People in the Labor Forcein in Birchwood Lakes.
What is the Percentage of People in the Labor Force in Birchwood Lakes?
56.9% of People are in the Labor Force in Birchwood Lakes.
What is the Unemployment Rate in Birchwood Lakes?
Unemployment Rate in Birchwood Lakes is 14.8%.