New Berlinville, PA Map & Demographics
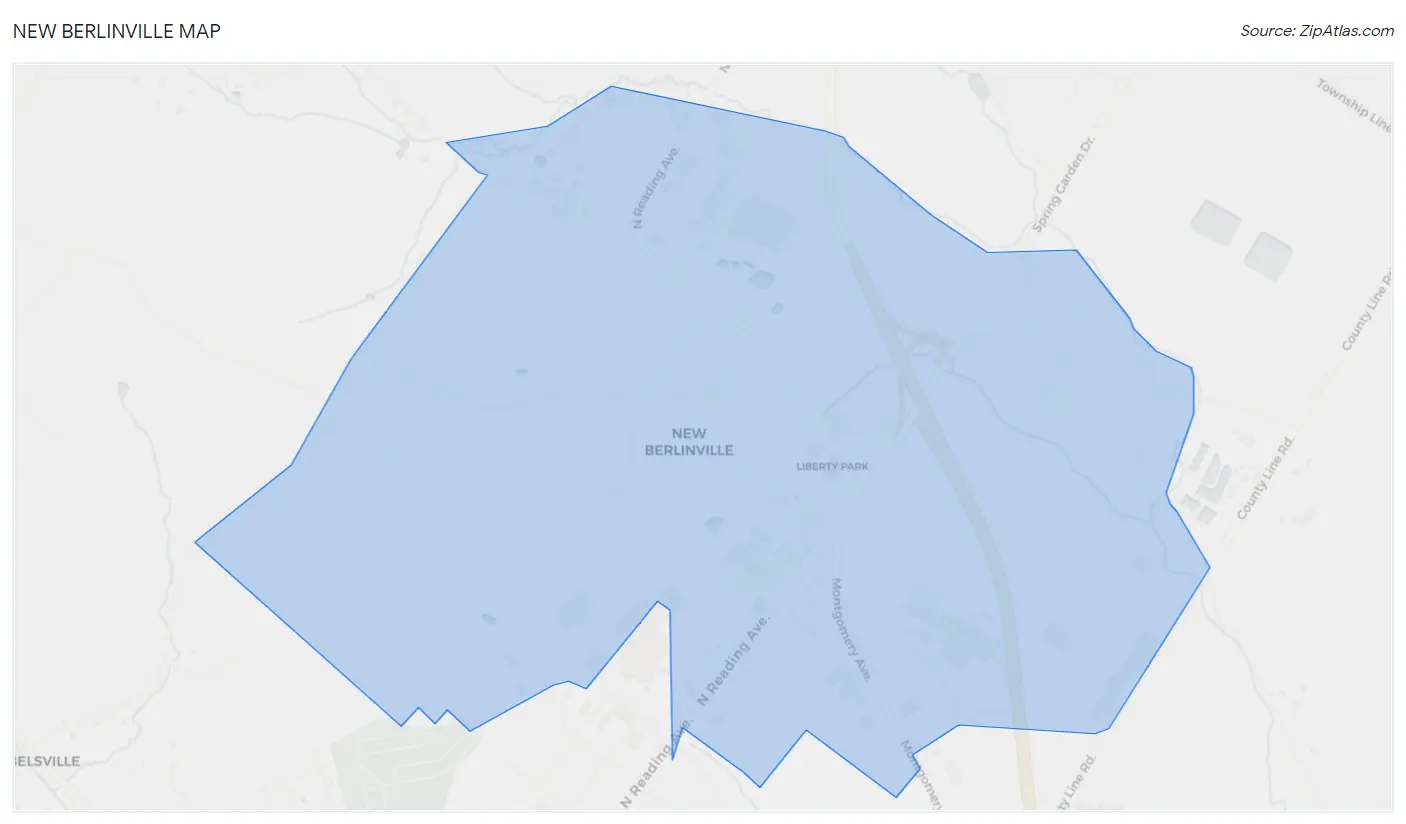
New Berlinville Map
New Berlinville Overview
$34,196
PER CAPITA INCOME
$84,246
AVG FAMILY INCOME
$83,254
AVG HOUSEHOLD INCOME
59.6%
WAGE / INCOME GAP [ % ]
40.4¢/ $1
WAGE / INCOME GAP [ $ ]
0.28
INEQUALITY / GINI INDEX
1,643
TOTAL POPULATION
785
MALE POPULATION
858
FEMALE POPULATION
91.49
MALES / 100 FEMALES
109.30
FEMALES / 100 MALES
36.4
MEDIAN AGE
3.0
AVG FAMILY SIZE
2.5
AVG HOUSEHOLD SIZE
1,181
LABOR FORCE [ PEOPLE ]
89.3%
PERCENT IN LABOR FORCE
15.4%
UNEMPLOYMENT RATE
New Berlinville Zip Codes
Income in New Berlinville
Income Overview in New Berlinville
Per Capita Income in New Berlinville is $34,196, while median incomes of families and households are $84,246 and $83,254 respectively.
| Characteristic | Number | Measure |
| Per Capita Income | 1,643 | $34,196 |
| Median Family Income | 460 | $84,246 |
| Mean Family Income | 460 | $97,955 |
| Median Household Income | 654 | $83,254 |
| Mean Household Income | 654 | $88,732 |
| Income Deficit | 460 | $0 |
| Wage / Income Gap (%) | 1,643 | 59.63% |
| Wage / Income Gap ($) | 1,643 | 40.37¢ per $1 |
| Gini / Inequality Index | 1,643 | 0.28 |
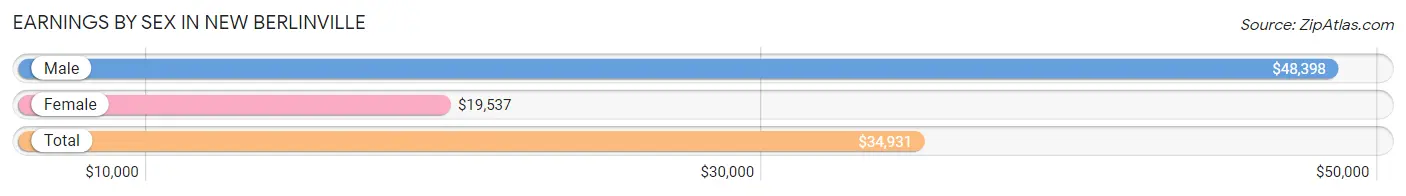
Earnings by Sex in New Berlinville
Average Earnings in New Berlinville are $34,931, $48,398 for men and $19,537 for women, a difference of 59.6%.
| Sex | Number | Average Earnings |
| Male | 473 (40.0%) | $48,398 |
| Female | 709 (60.0%) | $19,537 |
| Total | 1,182 (100.0%) | $34,931 |
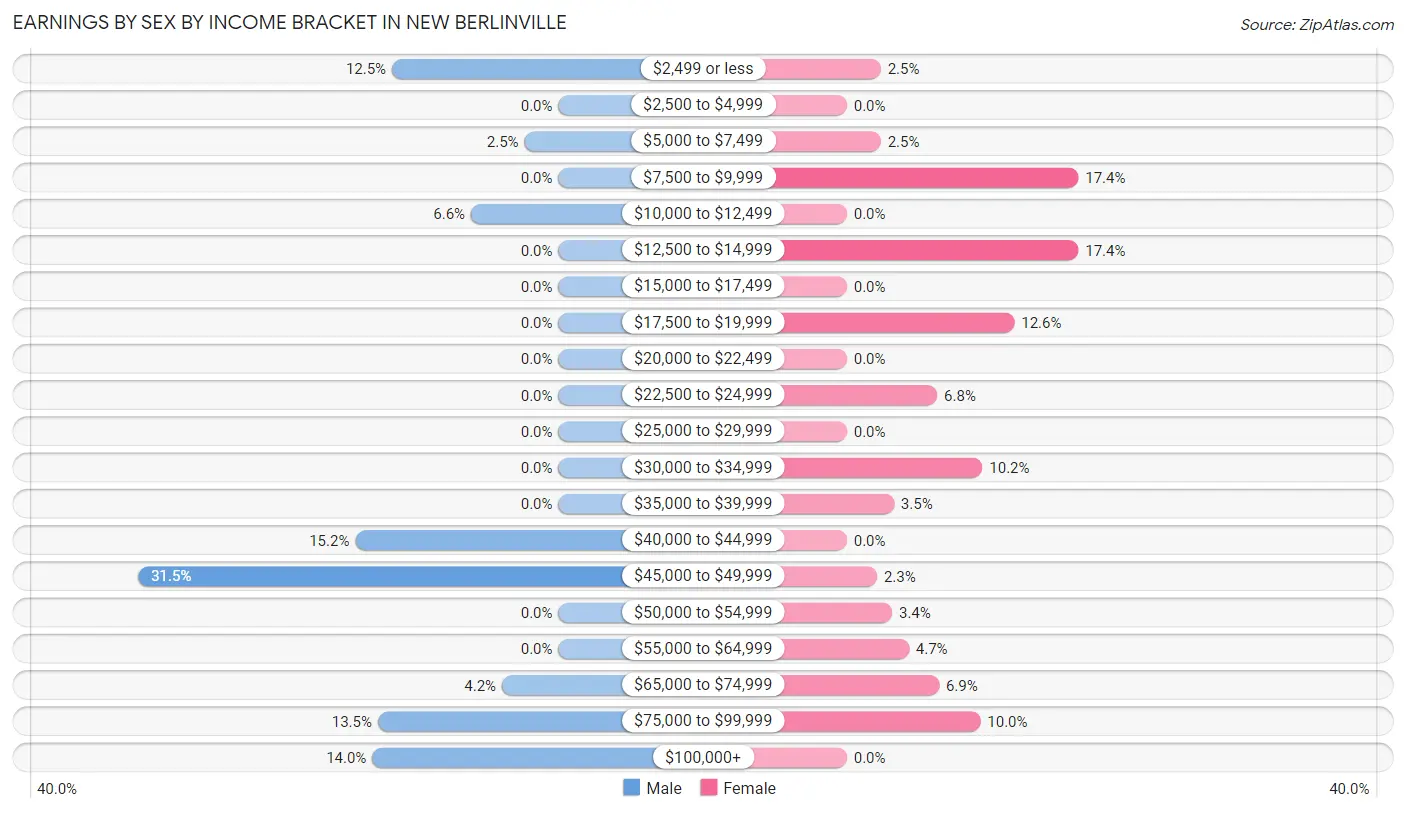
Earnings by Sex by Income Bracket in New Berlinville
The most common earnings brackets in New Berlinville are $45,000 to $49,999 for men (149 | 31.5%) and $7,500 to $9,999 for women (123 | 17.3%).
| Income | Male | Female |
| $2,499 or less | 59 (12.5%) | 18 (2.5%) |
| $2,500 to $4,999 | 0 (0.0%) | 0 (0.0%) |
| $5,000 to $7,499 | 12 (2.5%) | 18 (2.5%) |
| $7,500 to $9,999 | 0 (0.0%) | 123 (17.3%) |
| $10,000 to $12,499 | 31 (6.6%) | 0 (0.0%) |
| $12,500 to $14,999 | 0 (0.0%) | 123 (17.3%) |
| $15,000 to $17,499 | 0 (0.0%) | 0 (0.0%) |
| $17,500 to $19,999 | 0 (0.0%) | 89 (12.6%) |
| $20,000 to $22,499 | 0 (0.0%) | 0 (0.0%) |
| $22,500 to $24,999 | 0 (0.0%) | 48 (6.8%) |
| $25,000 to $29,999 | 0 (0.0%) | 0 (0.0%) |
| $30,000 to $34,999 | 0 (0.0%) | 72 (10.2%) |
| $35,000 to $39,999 | 0 (0.0%) | 25 (3.5%) |
| $40,000 to $44,999 | 72 (15.2%) | 0 (0.0%) |
| $45,000 to $49,999 | 149 (31.5%) | 16 (2.3%) |
| $50,000 to $54,999 | 0 (0.0%) | 24 (3.4%) |
| $55,000 to $64,999 | 0 (0.0%) | 33 (4.6%) |
| $65,000 to $74,999 | 20 (4.2%) | 49 (6.9%) |
| $75,000 to $99,999 | 64 (13.5%) | 71 (10.0%) |
| $100,000+ | 66 (14.0%) | 0 (0.0%) |
| Total | 473 (100.0%) | 709 (100.0%) |
Earnings by Sex by Educational Attainment in New Berlinville
Average earnings in New Berlinville are $48,944 for men and $32,569 for women, a difference of 33.5%. Men with an educational attainment of college or associate's degree enjoy the highest average annual earnings of $71,750, while those with high school diploma education earn the least with $48,838. Women with an educational attainment of bachelor's degree earn the most with the average annual earnings of $68,594, while those with bachelor's degree education have the smallest earnings of $68,594.

| Educational Attainment | Male Income | Female Income |
| Less than High School | - | - |
| High School Diploma | $48,838 | $0 |
| College or Associate's Degree | $71,750 | $0 |
| Bachelor's Degree | - | - |
| Graduate Degree | - | - |
| Total | $48,944 | $32,569 |
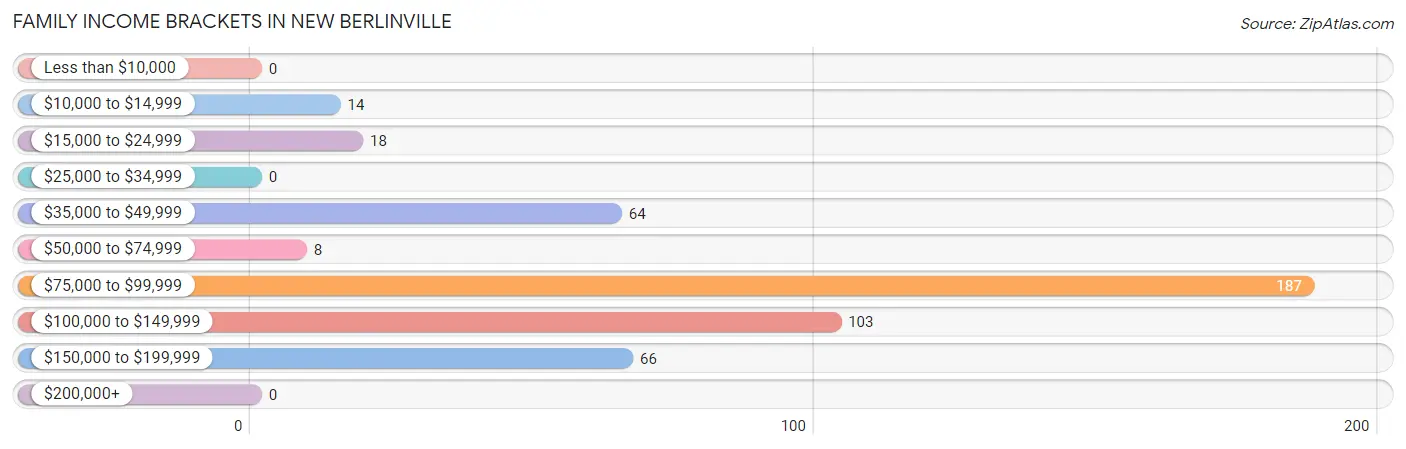
Family Income in New Berlinville
Family Income Brackets in New Berlinville
According to the New Berlinville family income data, there are 187 families falling into the $75,000 to $99,999 income range, which is the most common income bracket and makes up 40.6% of all families.
| Income Bracket | # Families | % Families |
| Less than $10,000 | 0 | 0.0% |
| $10,000 to $14,999 | 14 | 3.0% |
| $15,000 to $24,999 | 18 | 3.9% |
| $25,000 to $34,999 | 0 | 0.0% |
| $35,000 to $49,999 | 64 | 13.9% |
| $50,000 to $74,999 | 8 | 1.7% |
| $75,000 to $99,999 | 187 | 40.7% |
| $100,000 to $149,999 | 103 | 22.4% |
| $150,000 to $199,999 | 66 | 14.3% |
| $200,000+ | 0 | 0.0% |
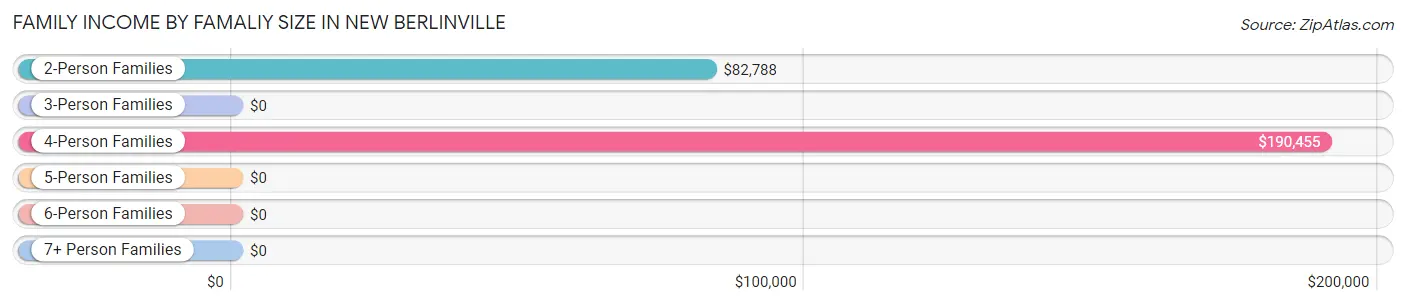
Family Income by Famaliy Size in New Berlinville
4-person families (108 | 23.5%) account for the highest median family income in New Berlinville with $190,455 per family, while 4-person families (108 | 23.5%) have the highest median income of $47,614 per family member.
| Income Bracket | # Families | Median Income |
| 2-Person Families | 221 (48.0%) | $82,788 |
| 3-Person Families | 0 (0.0%) | $0 |
| 4-Person Families | 108 (23.5%) | $190,455 |
| 5-Person Families | 131 (28.5%) | $0 |
| 6-Person Families | 0 (0.0%) | $0 |
| 7+ Person Families | 0 (0.0%) | $0 |
| Total | 460 (100.0%) | $84,246 |
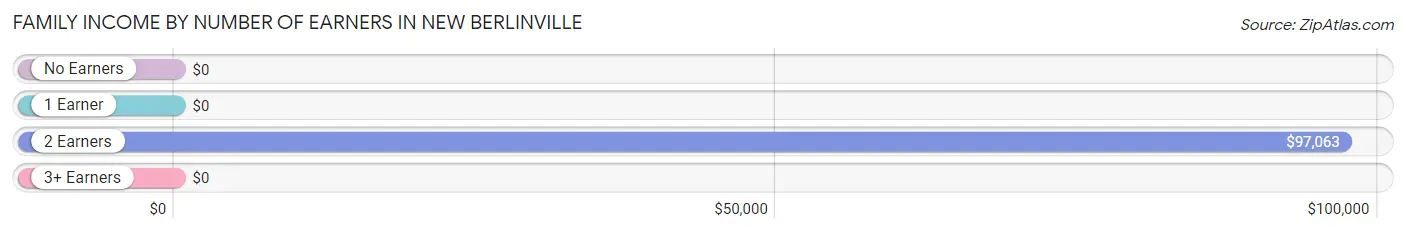
Family Income by Number of Earners in New Berlinville
| Number of Earners | # Families | Median Income |
| No Earners | 34 (7.4%) | $0 |
| 1 Earner | 134 (29.1%) | $0 |
| 2 Earners | 95 (20.6%) | $97,063 |
| 3+ Earners | 197 (42.8%) | $0 |
| Total | 460 (100.0%) | $84,246 |
Household Income in New Berlinville
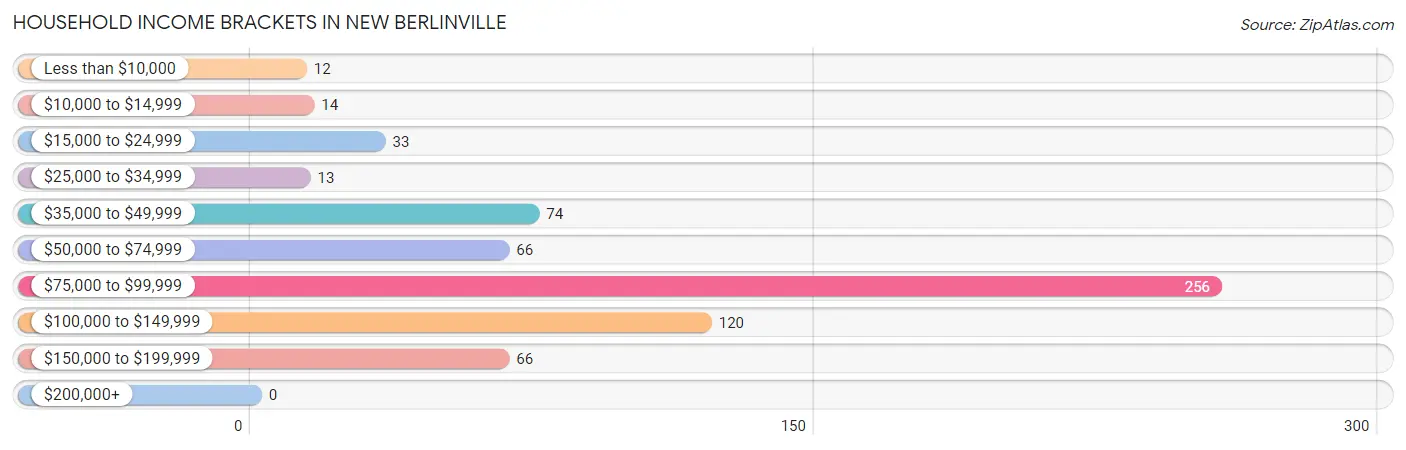
Household Income Brackets in New Berlinville
With 256 households falling in the category, the $75,000 to $99,999 income range is the most frequent in New Berlinville, accounting for 39.1% of all households.
| Income Bracket | # Households | % Households |
| Less than $10,000 | 12 | 1.8% |
| $10,000 to $14,999 | 14 | 2.1% |
| $15,000 to $24,999 | 33 | 5.0% |
| $25,000 to $34,999 | 13 | 2.0% |
| $35,000 to $49,999 | 74 | 11.3% |
| $50,000 to $74,999 | 66 | 10.1% |
| $75,000 to $99,999 | 256 | 39.1% |
| $100,000 to $149,999 | 120 | 18.3% |
| $150,000 to $199,999 | 66 | 10.1% |
| $200,000+ | 0 | 0.0% |
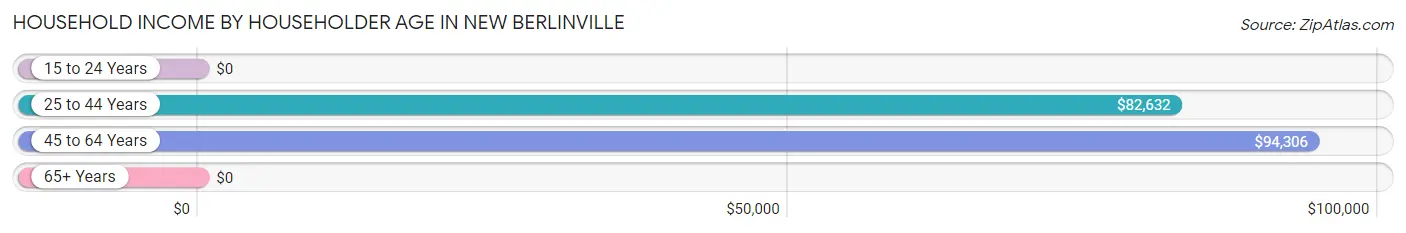
Household Income by Householder Age in New Berlinville
The median household income in New Berlinville is $83,254, with the highest median household income of $94,306 found in the 45 to 64 years age bracket for the primary householder. A total of 182 households (27.8%) fall into this category.
| Income Bracket | # Households | Median Income |
| 15 to 24 Years | 0 (0.0%) | $0 |
| 25 to 44 Years | 331 (50.6%) | $82,632 |
| 45 to 64 Years | 182 (27.8%) | $94,306 |
| 65+ Years | 141 (21.6%) | $0 |
| Total | 654 (100.0%) | $83,254 |
Poverty in New Berlinville
Income Below Poverty by Sex and Age in New Berlinville
With 9.7% poverty level for males and 3.7% for females among the residents of New Berlinville, under 5 year old males and 65 to 74 year old females are the most vulnerable to poverty, with 15 males (28.3%) and 14 females (12.6%) in their respective age groups living below the poverty level.
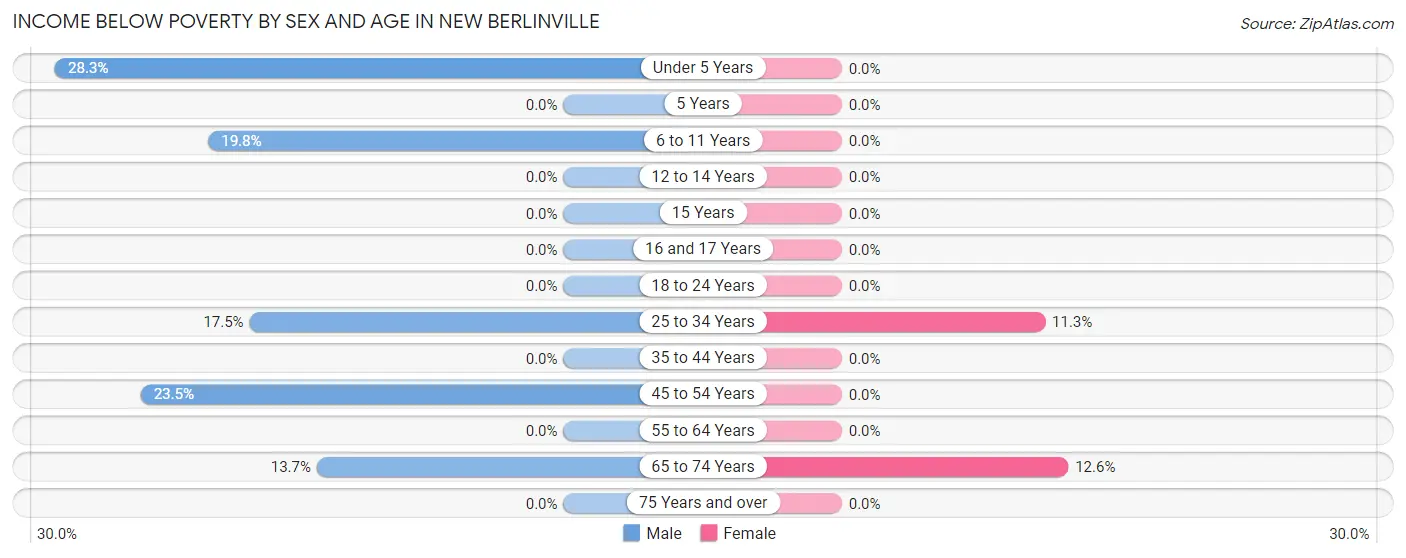
| Age Bracket | Male | Female |
| Under 5 Years | 15 (28.3%) | 0 (0.0%) |
| 5 Years | 0 (0.0%) | 0 (0.0%) |
| 6 to 11 Years | 17 (19.8%) | 0 (0.0%) |
| 12 to 14 Years | 0 (0.0%) | 0 (0.0%) |
| 15 Years | 0 (0.0%) | 0 (0.0%) |
| 16 and 17 Years | 0 (0.0%) | 0 (0.0%) |
| 18 to 24 Years | 0 (0.0%) | 0 (0.0%) |
| 25 to 34 Years | 18 (17.5%) | 18 (11.3%) |
| 35 to 44 Years | 0 (0.0%) | 0 (0.0%) |
| 45 to 54 Years | 12 (23.5%) | 0 (0.0%) |
| 55 to 64 Years | 0 (0.0%) | 0 (0.0%) |
| 65 to 74 Years | 14 (13.7%) | 14 (12.6%) |
| 75 Years and over | 0 (0.0%) | 0 (0.0%) |
| Total | 76 (9.7%) | 32 (3.7%) |
Income Above Poverty by Sex and Age in New Berlinville
According to the poverty statistics in New Berlinville, males aged 12 to 14 years and females aged 6 to 11 years are the age groups that are most secure financially, with 100.0% of males and 100.0% of females in these age groups living above the poverty line.
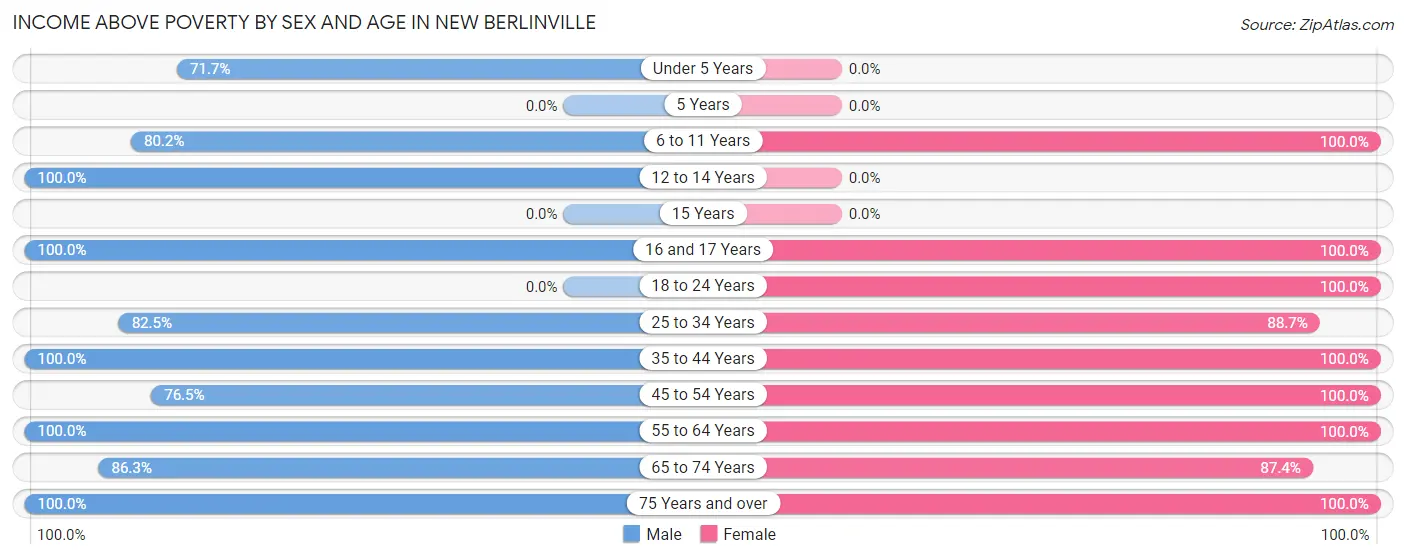
| Age Bracket | Male | Female |
| Under 5 Years | 38 (71.7%) | 0 (0.0%) |
| 5 Years | 0 (0.0%) | 0 (0.0%) |
| 6 to 11 Years | 69 (80.2%) | 80 (100.0%) |
| 12 to 14 Years | 101 (100.0%) | 0 (0.0%) |
| 15 Years | 0 (0.0%) | 0 (0.0%) |
| 16 and 17 Years | 59 (100.0%) | 18 (100.0%) |
| 18 to 24 Years | 0 (0.0%) | 115 (100.0%) |
| 25 to 34 Years | 85 (82.5%) | 141 (88.7%) |
| 35 to 44 Years | 157 (100.0%) | 211 (100.0%) |
| 45 to 54 Years | 39 (76.5%) | 45 (100.0%) |
| 55 to 64 Years | 60 (100.0%) | 99 (100.0%) |
| 65 to 74 Years | 88 (86.3%) | 97 (87.4%) |
| 75 Years and over | 13 (100.0%) | 20 (100.0%) |
| Total | 709 (90.3%) | 826 (96.3%) |
Income Below Poverty Among Married-Couple Families in New Berlinville
The poverty statistics for married-couple families in New Berlinville show that 8.7% or 32 of the total 369 families live below the poverty line. Families with no children have the highest poverty rate of 10.8%, comprising of 14 families. On the other hand, families with 3 or 4 children have the lowest poverty rate of 0.0%, which includes 0 families.
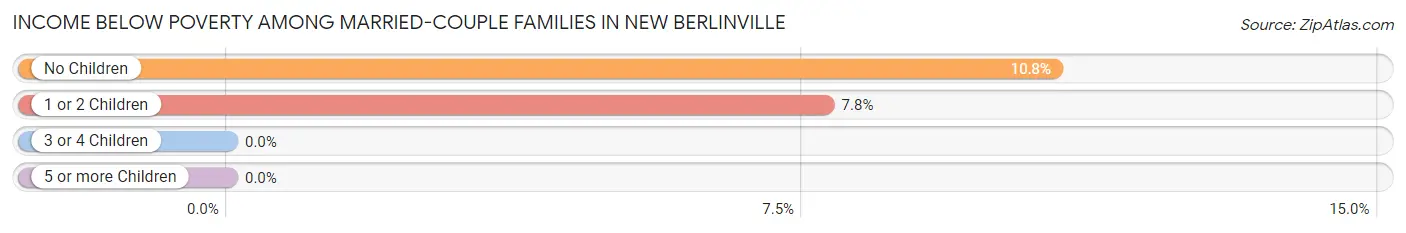
| Children | Above Poverty | Below Poverty |
| No Children | 116 (89.2%) | 14 (10.8%) |
| 1 or 2 Children | 213 (92.2%) | 18 (7.8%) |
| 3 or 4 Children | 8 (100.0%) | 0 (0.0%) |
| 5 or more Children | 0 (0.0%) | 0 (0.0%) |
| Total | 337 (91.3%) | 32 (8.7%) |
Income Below Poverty Among Single-Parent Households in New Berlinville
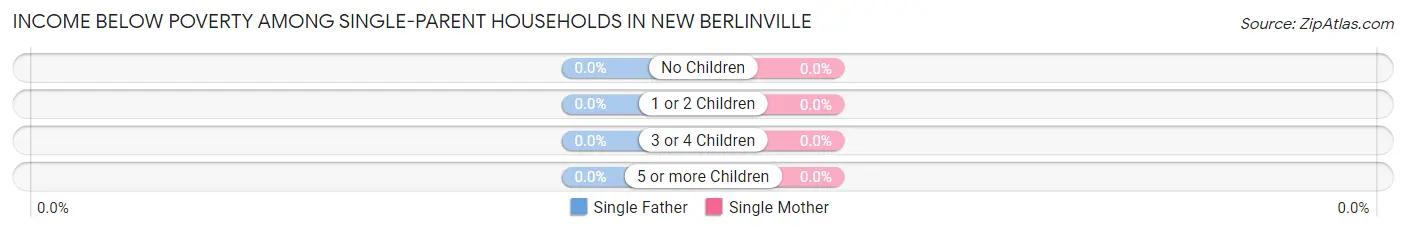
| Children | Single Father | Single Mother |
| No Children | 0 (0.0%) | 0 (0.0%) |
| 1 or 2 Children | 0 (0.0%) | 0 (0.0%) |
| 3 or 4 Children | 0 (0.0%) | 0 (0.0%) |
| 5 or more Children | 0 (0.0%) | 0 (0.0%) |
| Total | 0 (0.0%) | 0 (0.0%) |
Income Below Poverty Among Married-Couple vs Single-Parent Households in New Berlinville
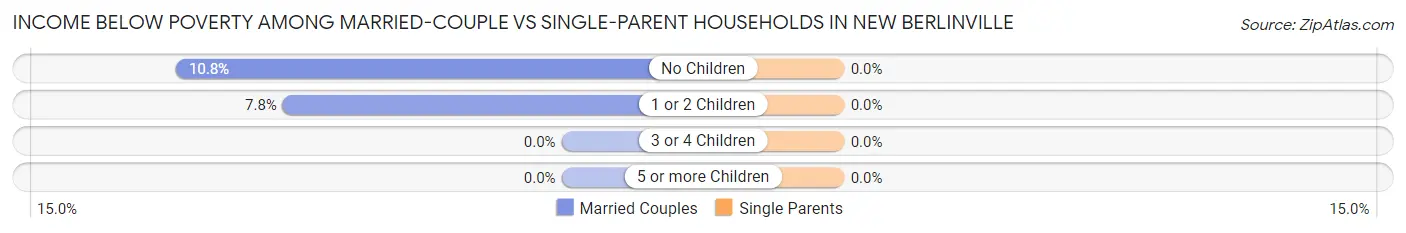
| Children | Married-Couple Families | Single-Parent Households |
| No Children | 14 (10.8%) | 0 (0.0%) |
| 1 or 2 Children | 18 (7.8%) | 0 (0.0%) |
| 3 or 4 Children | 0 (0.0%) | 0 (0.0%) |
| 5 or more Children | 0 (0.0%) | 0 (0.0%) |
| Total | 32 (8.7%) | 0 (0.0%) |
Race in New Berlinville
The most populous races in New Berlinville are White / Caucasian (1,349 | 82.1%), Two or more Races (274 | 16.7%), and Hispanic or Latino (132 | 8.0%).
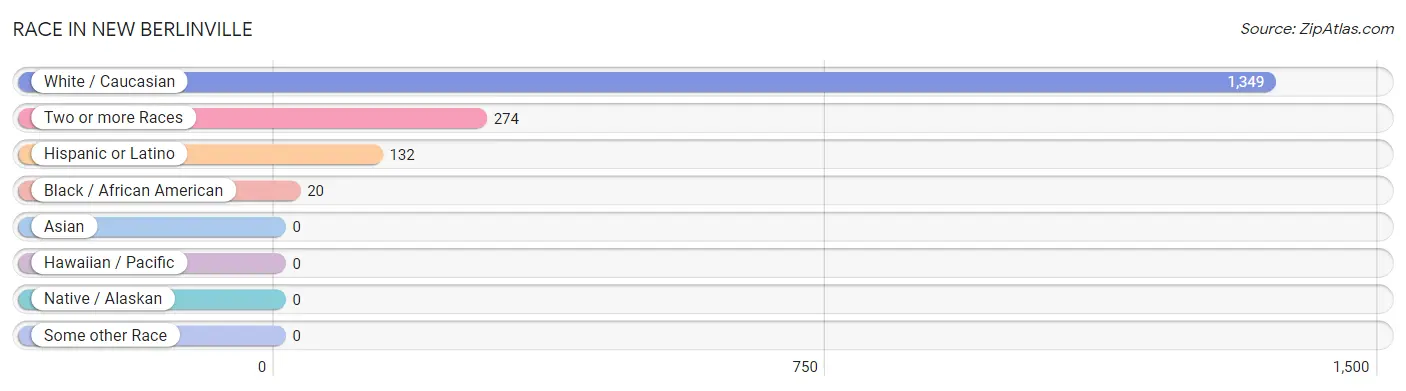
| Race | # Population | % Population |
| Asian | 0 | 0.0% |
| Black / African American | 20 | 1.2% |
| Hawaiian / Pacific | 0 | 0.0% |
| Hispanic or Latino | 132 | 8.0% |
| Native / Alaskan | 0 | 0.0% |
| White / Caucasian | 1,349 | 82.1% |
| Two or more Races | 274 | 16.7% |
| Some other Race | 0 | 0.0% |
| Total | 1,643 | 100.0% |
Ancestry in New Berlinville
The most populous ancestries reported in New Berlinville are German (923 | 56.2%), Irish (403 | 24.5%), English (292 | 17.8%), Dutch (158 | 9.6%), and Mexican (132 | 8.0%), together accounting for 116.1% of all New Berlinville residents.
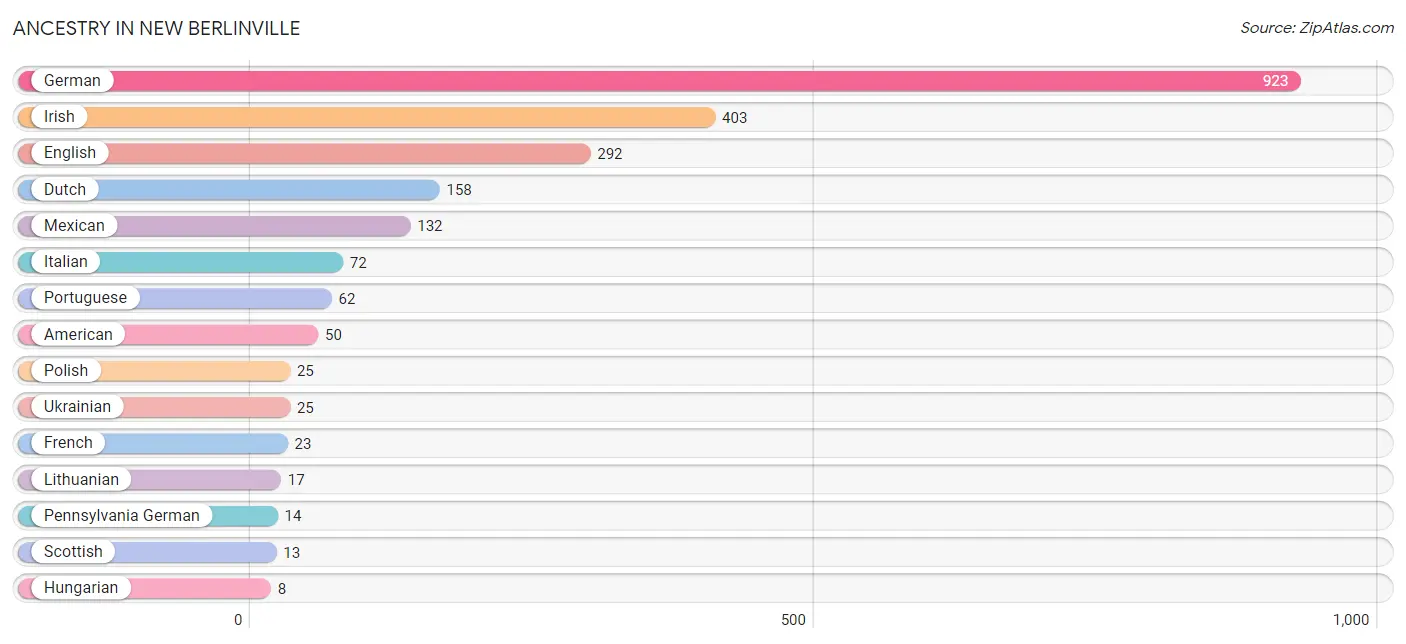
| Ancestry | # Population | % Population |
| American | 50 | 3.0% |
| Arab | 4 | 0.2% |
| Dutch | 158 | 9.6% |
| English | 292 | 17.8% |
| French | 23 | 1.4% |
| German | 923 | 56.2% |
| Hungarian | 8 | 0.5% |
| Irish | 403 | 24.5% |
| Italian | 72 | 4.4% |
| Lithuanian | 17 | 1.0% |
| Mexican | 132 | 8.0% |
| Pennsylvania German | 14 | 0.9% |
| Polish | 25 | 1.5% |
| Portuguese | 62 | 3.8% |
| Scotch-Irish | 7 | 0.4% |
| Scottish | 13 | 0.8% |
| Syrian | 4 | 0.2% |
| Ukrainian | 25 | 1.5% | View All 18 Rows |
Immigrants in New Berlinville
The most numerous immigrant groups reported in New Berlinville came from Latin America (73 | 4.4%), Central America (64 | 3.9%), Mexico (64 | 3.9%), and Caribbean (9 | 0.5%), together accounting for 12.8% of all New Berlinville residents.
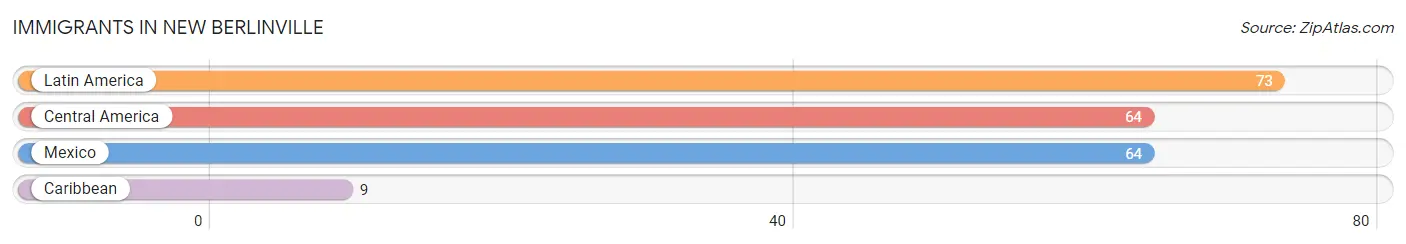
| Immigration Origin | # Population | % Population |
| Caribbean | 9 | 0.5% |
| Central America | 64 | 3.9% |
| Latin America | 73 | 4.4% |
| Mexico | 64 | 3.9% | View All 4 Rows |
Sex and Age in New Berlinville
Sex and Age in New Berlinville
The most populous age groups in New Berlinville are 10 to 14 Years (108 | 13.8%) for men and 40 to 44 Years (142 | 16.6%) for women.
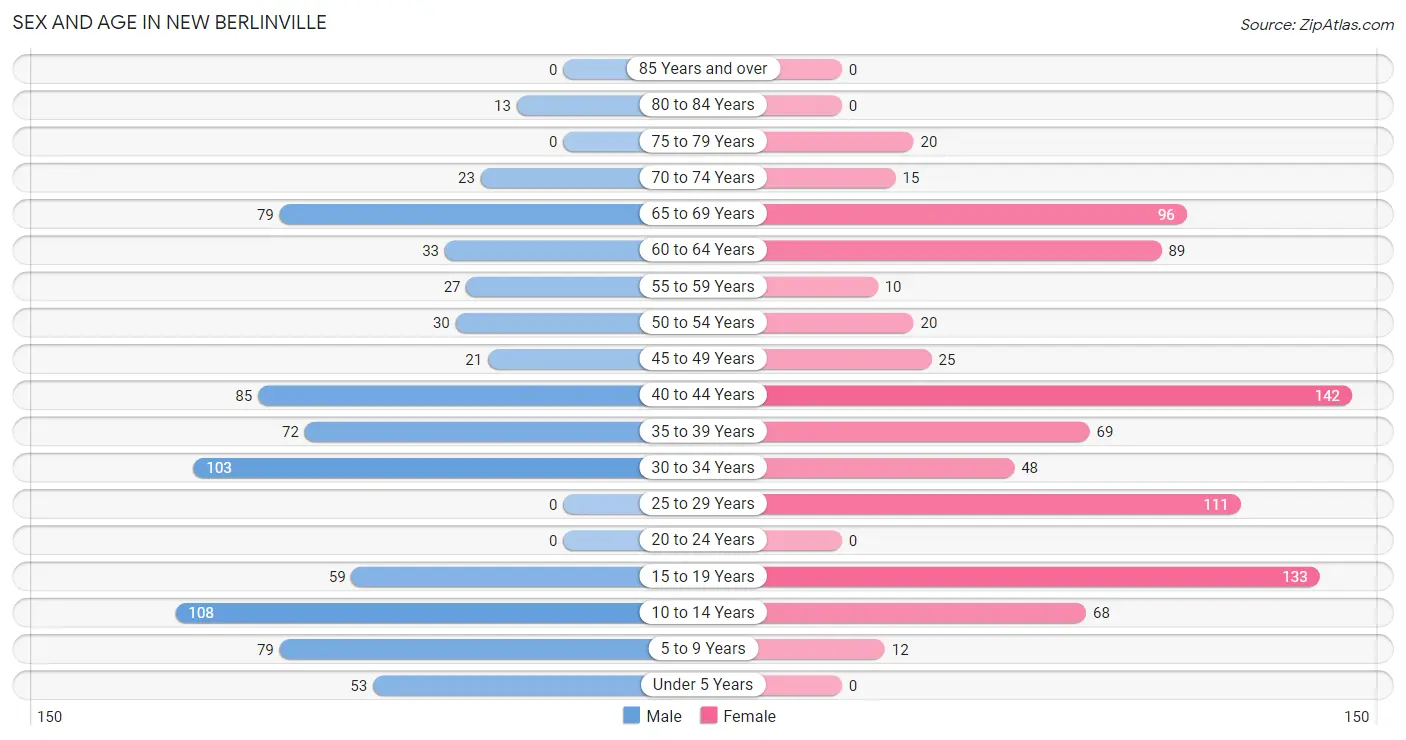
| Age Bracket | Male | Female |
| Under 5 Years | 53 (6.8%) | 0 (0.0%) |
| 5 to 9 Years | 79 (10.1%) | 12 (1.4%) |
| 10 to 14 Years | 108 (13.8%) | 68 (7.9%) |
| 15 to 19 Years | 59 (7.5%) | 133 (15.5%) |
| 20 to 24 Years | 0 (0.0%) | 0 (0.0%) |
| 25 to 29 Years | 0 (0.0%) | 111 (12.9%) |
| 30 to 34 Years | 103 (13.1%) | 48 (5.6%) |
| 35 to 39 Years | 72 (9.2%) | 69 (8.0%) |
| 40 to 44 Years | 85 (10.8%) | 142 (16.6%) |
| 45 to 49 Years | 21 (2.7%) | 25 (2.9%) |
| 50 to 54 Years | 30 (3.8%) | 20 (2.3%) |
| 55 to 59 Years | 27 (3.4%) | 10 (1.2%) |
| 60 to 64 Years | 33 (4.2%) | 89 (10.4%) |
| 65 to 69 Years | 79 (10.1%) | 96 (11.2%) |
| 70 to 74 Years | 23 (2.9%) | 15 (1.8%) |
| 75 to 79 Years | 0 (0.0%) | 20 (2.3%) |
| 80 to 84 Years | 13 (1.7%) | 0 (0.0%) |
| 85 Years and over | 0 (0.0%) | 0 (0.0%) |
| Total | 785 (100.0%) | 858 (100.0%) |
Families and Households in New Berlinville
Median Family Size in New Berlinville
The median family size in New Berlinville is 2.99 persons per family, with married-couple families (369 | 80.2%) accounting for the largest median family size of 3.21 persons per family. On the other hand, single male/father families (64 | 13.9%) represent the smallest median family size with 2.06 persons per family.
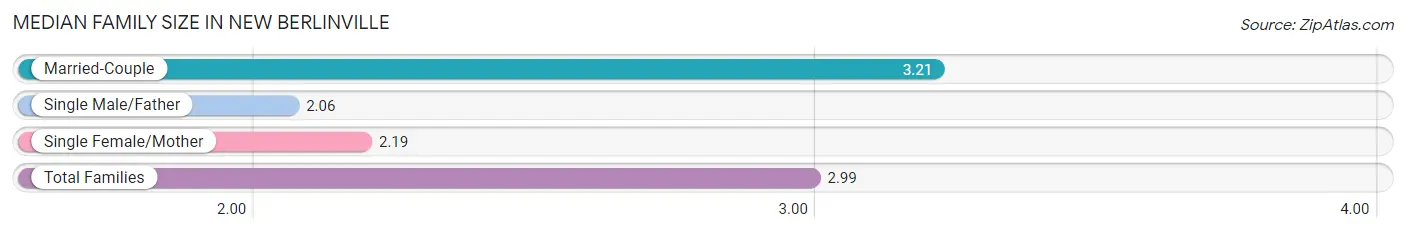
| Family Type | # Families | Family Size |
| Married-Couple | 369 (80.2%) | 3.21 |
| Single Male/Father | 64 (13.9%) | 2.06 |
| Single Female/Mother | 27 (5.9%) | 2.19 |
| Total Families | 460 (100.0%) | 2.99 |
Median Household Size in New Berlinville
The median household size in New Berlinville is 2.51 persons per household, with married-couple households (369 | 56.4%) accounting for the largest median household size of 3.21 persons per household. non-family households (194 | 29.7%) represent the smallest median household size with 1.38 persons per household.
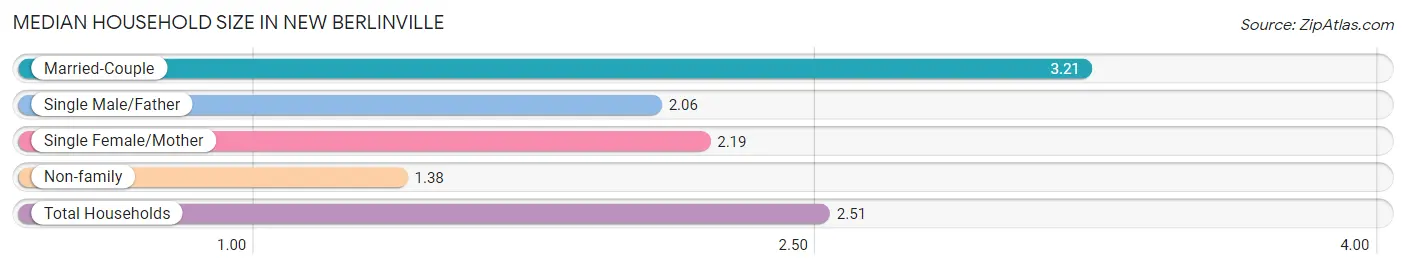
| Household Type | # Households | Household Size |
| Married-Couple | 369 (56.4%) | 3.21 |
| Single Male/Father | 64 (9.8%) | 2.06 |
| Single Female/Mother | 27 (4.1%) | 2.19 |
| Non-family | 194 (29.7%) | 1.38 |
| Total Households | 654 (100.0%) | 2.51 |
Household Size by Marriage Status in New Berlinville
Out of a total of 654 households in New Berlinville, 460 (70.3%) are family households, while 194 (29.7%) are nonfamily households. The most numerous type of family households are 2-person households, comprising 221, and the most common type of nonfamily households are 1-person households, comprising 121.
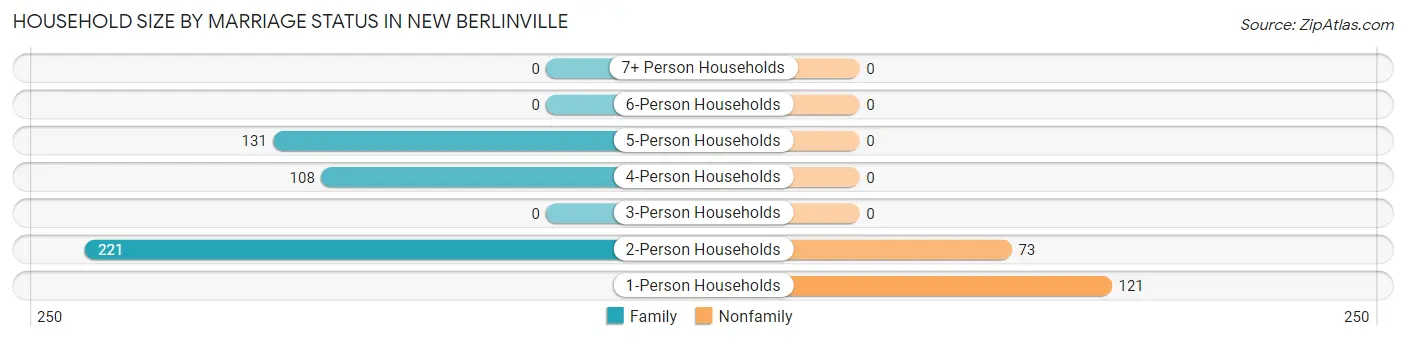
| Household Size | Family Households | Nonfamily Households |
| 1-Person Households | - | 121 (18.5%) |
| 2-Person Households | 221 (33.8%) | 73 (11.2%) |
| 3-Person Households | 0 (0.0%) | 0 (0.0%) |
| 4-Person Households | 108 (16.5%) | 0 (0.0%) |
| 5-Person Households | 131 (20.0%) | 0 (0.0%) |
| 6-Person Households | 0 (0.0%) | 0 (0.0%) |
| 7+ Person Households | 0 (0.0%) | 0 (0.0%) |
| Total | 460 (70.3%) | 194 (29.7%) |
Female Fertility in New Berlinville
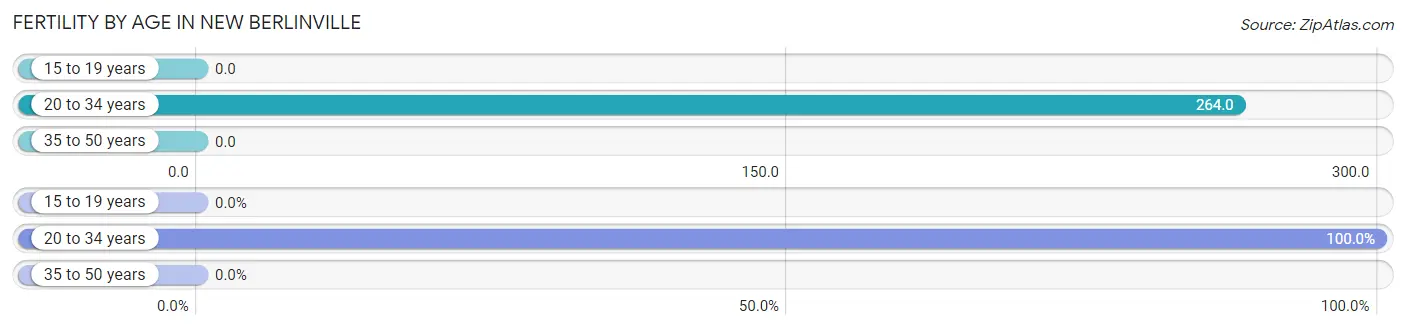
Fertility by Age in New Berlinville
Average fertility rate in New Berlinville is 80.0 births per 1,000 women. Women in the age bracket of 20 to 34 years have the highest fertility rate with 264.0 births per 1,000 women. Women in the age bracket of 20 to 34 years acount for 100.0% of all women with births.
| Age Bracket | Women with Births | Births / 1,000 Women |
| 15 to 19 years | 0 (0.0%) | 0.0 |
| 20 to 34 years | 42 (100.0%) | 264.0 |
| 35 to 50 years | 0 (0.0%) | 0.0 |
| Total | 42 (100.0%) | 80.0 |
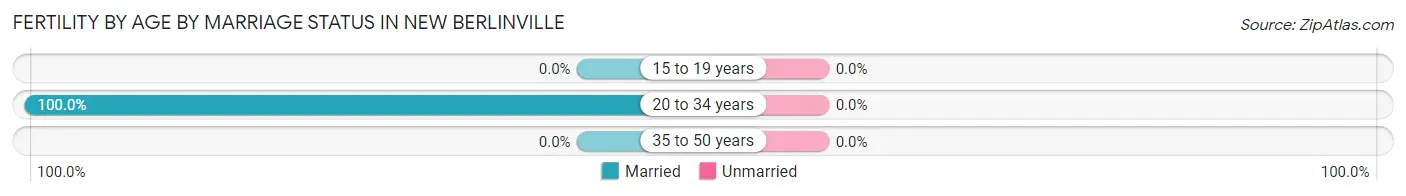
Fertility by Age by Marriage Status in New Berlinville
| Age Bracket | Married | Unmarried |
| 15 to 19 years | 0 (0.0%) | 0 (0.0%) |
| 20 to 34 years | 42 (100.0%) | 0 (0.0%) |
| 35 to 50 years | 0 (0.0%) | 0 (0.0%) |
| Total | 42 (100.0%) | 0 (0.0%) |
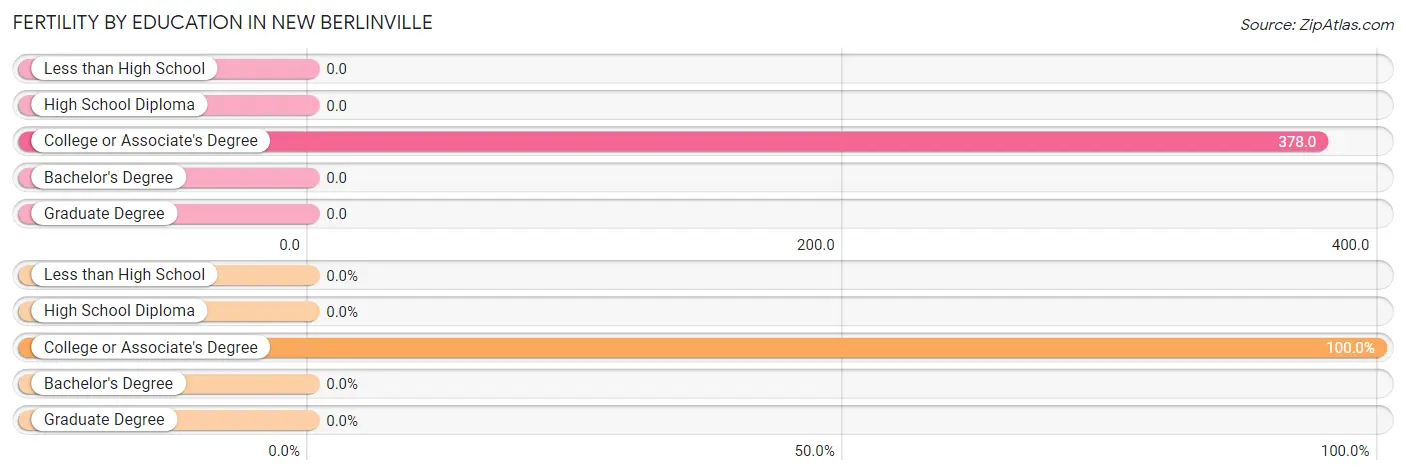
Fertility by Education in New Berlinville
| Educational Attainment | Women with Births | Births / 1,000 Women |
| Less than High School | 0 (0.0%) | 0.0 |
| High School Diploma | 0 (0.0%) | 0.0 |
| College or Associate's Degree | 42 (100.0%) | 378.0 |
| Bachelor's Degree | 0 (0.0%) | 0.0 |
| Graduate Degree | 0 (0.0%) | 0.0 |
| Total | 42 (100.0%) | 80.0 |
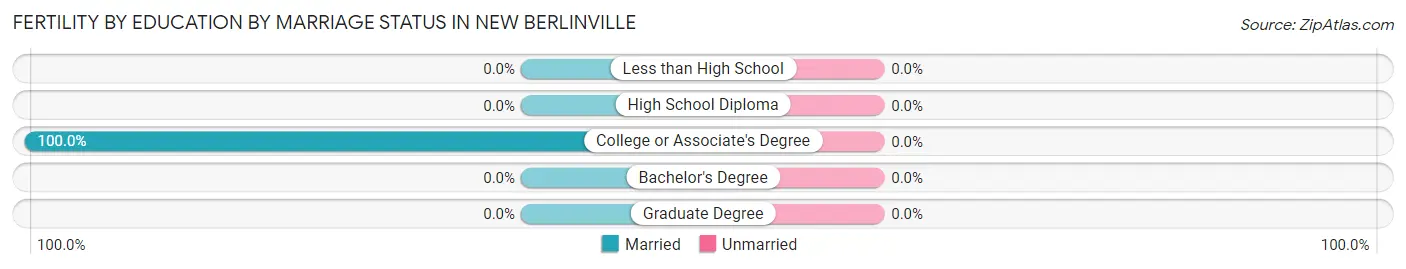
Fertility by Education by Marriage Status in New Berlinville
| Educational Attainment | Married | Unmarried |
| Less than High School | 0 (0.0%) | 0 (0.0%) |
| High School Diploma | 0 (0.0%) | 0 (0.0%) |
| College or Associate's Degree | 42 (100.0%) | 0 (0.0%) |
| Bachelor's Degree | 0 (0.0%) | 0 (0.0%) |
| Graduate Degree | 0 (0.0%) | 0 (0.0%) |
| Total | 42 (100.0%) | 0 (0.0%) |
Employment Characteristics in New Berlinville
Employment by Class of Employer in New Berlinville
Among the 1,000 employed individuals in New Berlinville, private company employees (829 | 82.9%), not-for-profit organizations (104 | 10.4%), and local government employees (26 | 2.6%) make up the most common classes of employment.
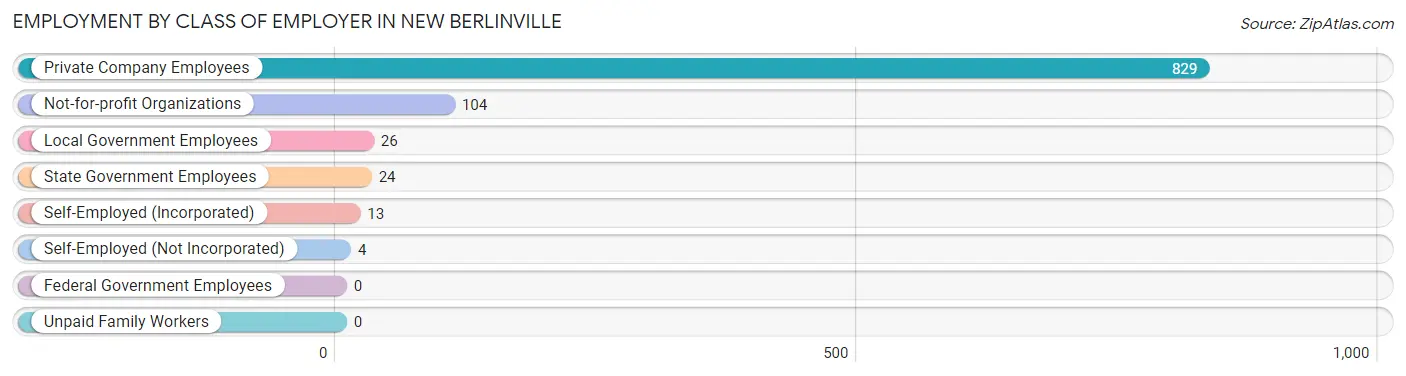
| Employer Class | # Employees | % Employees |
| Private Company Employees | 829 | 82.9% |
| Self-Employed (Incorporated) | 13 | 1.3% |
| Self-Employed (Not Incorporated) | 4 | 0.4% |
| Not-for-profit Organizations | 104 | 10.4% |
| Local Government Employees | 26 | 2.6% |
| State Government Employees | 24 | 2.4% |
| Federal Government Employees | 0 | 0.0% |
| Unpaid Family Workers | 0 | 0.0% |
| Total | 1,000 | 100.0% |
Employment Status by Age in New Berlinville
According to the labor force statistics for New Berlinville, out of the total population over 16 years of age (1,323), 89.3% or 1,181 individuals are in the labor force, with 15.4% or 182 of them unemployed. The age group with the highest labor force participation rate is 16 to 19 years, with 100.0% or 192 individuals in the labor force. Within the labor force, the 35 to 44 years age range has the highest percentage of unemployed individuals, with 33.4% or 123 of them being unemployed.
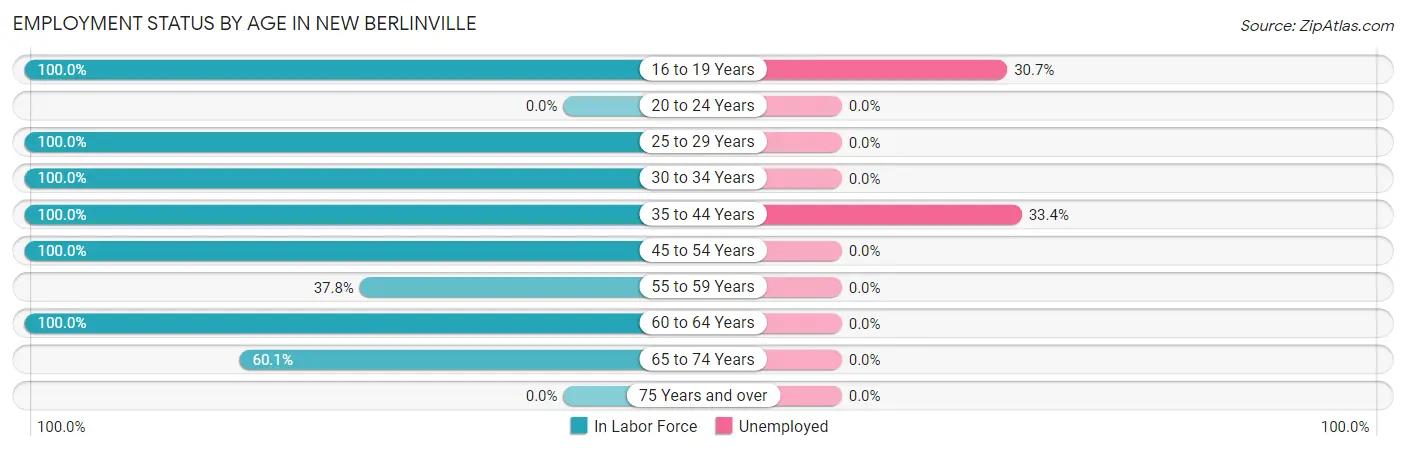
| Age Bracket | In Labor Force | Unemployed |
| 16 to 19 Years | 192 (100.0%) | 59 (30.7%) |
| 20 to 24 Years | 0 (0.0%) | 0 (0.0%) |
| 25 to 29 Years | 111 (100.0%) | 0 (0.0%) |
| 30 to 34 Years | 151 (100.0%) | 0 (0.0%) |
| 35 to 44 Years | 368 (100.0%) | 123 (33.4%) |
| 45 to 54 Years | 96 (100.0%) | 0 (0.0%) |
| 55 to 59 Years | 14 (37.8%) | 0 (0.0%) |
| 60 to 64 Years | 122 (100.0%) | 0 (0.0%) |
| 65 to 74 Years | 128 (60.1%) | 0 (0.0%) |
| 75 Years and over | 0 (0.0%) | 0 (0.0%) |
| Total | 1,181 (89.3%) | 182 (15.4%) |
Employment Status by Educational Attainment in New Berlinville
According to labor force statistics for New Berlinville, 97.4% of individuals (862) out of the total population between 25 and 64 years of age (885) are in the labor force, with 14.3% or 123 of them being unemployed. The group with the highest labor force participation rate are those with the educational attainment of less than high school, with 100.0% or 16 individuals in the labor force. Within the labor force, individuals with high school diploma education have the highest percentage of unemployment, with 24.9% or 123 of them being unemployed.
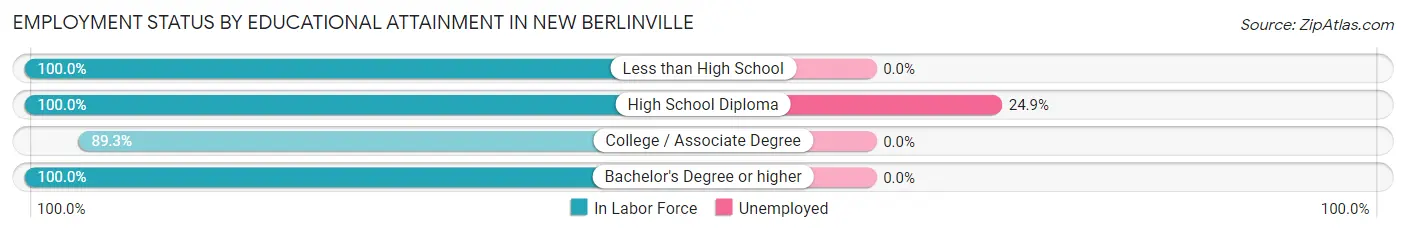
| Educational Attainment | In Labor Force | Unemployed |
| Less than High School | 16 (100.0%) | 0 (0.0%) |
| High School Diploma | 494 (100.0%) | 123 (24.9%) |
| College / Associate Degree | 192 (89.3%) | 0 (0.0%) |
| Bachelor's Degree or higher | 160 (100.0%) | 0 (0.0%) |
| Total | 862 (97.4%) | 127 (14.3%) |
Employment Occupations by Sex in New Berlinville
Management, Business, Science and Arts Occupations
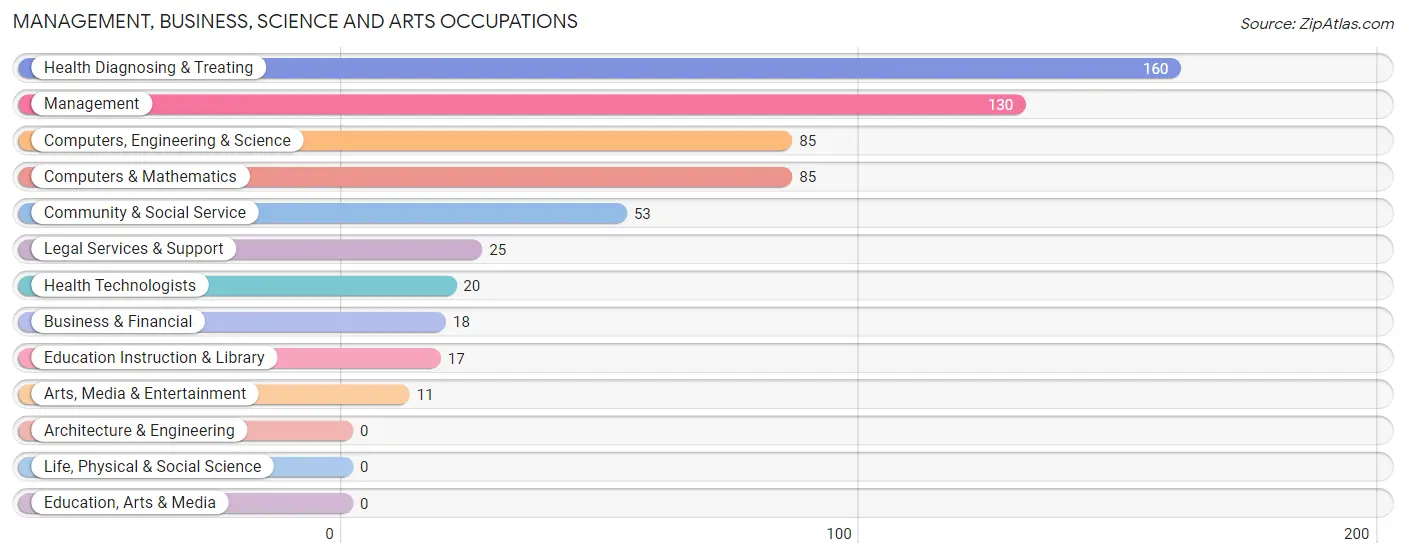
The most common Management, Business, Science and Arts occupations in New Berlinville are Health Diagnosing & Treating (160 | 16.0%), Management (130 | 13.0%), Computers, Engineering & Science (85 | 8.5%), Computers & Mathematics (85 | 8.5%), and Community & Social Service (53 | 5.3%).
Management, Business, Science and Arts Occupations by Sex
Within the Management, Business, Science and Arts occupations in New Berlinville, the most male-oriented occupations are Computers, Engineering & Science (100.0%), Computers & Mathematics (100.0%), and Management (66.9%), while the most female-oriented occupations are Business & Financial (100.0%), Community & Social Service (100.0%), and Legal Services & Support (100.0%).
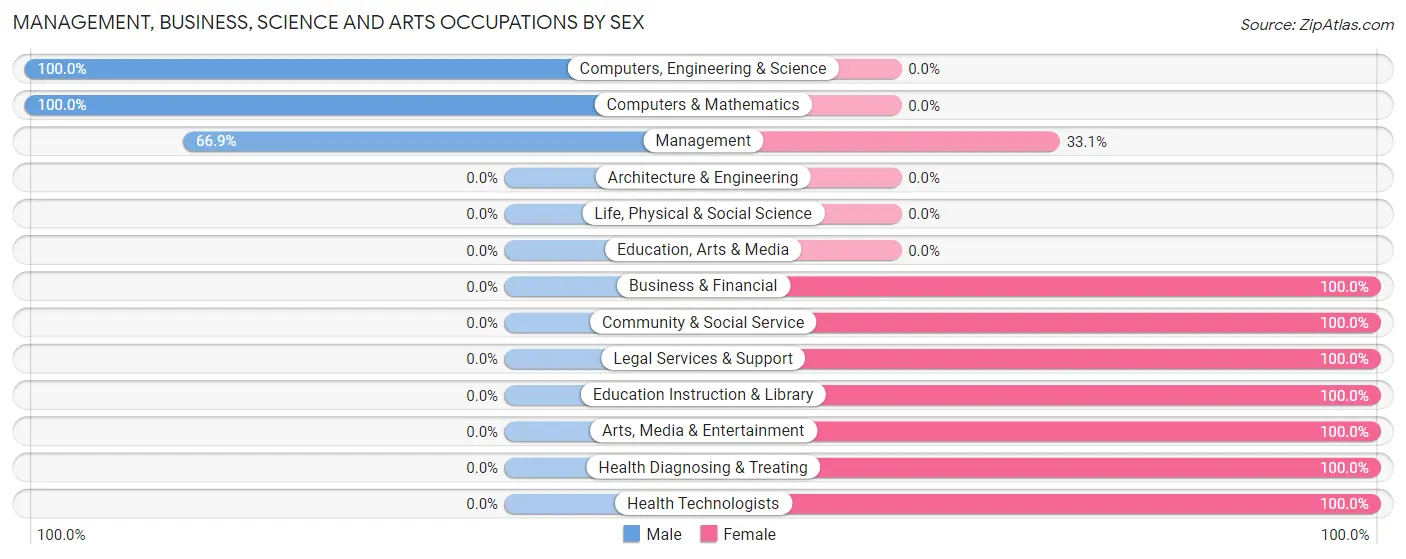
| Occupation | Male | Female |
| Management | 87 (66.9%) | 43 (33.1%) |
| Business & Financial | 0 (0.0%) | 18 (100.0%) |
| Computers, Engineering & Science | 85 (100.0%) | 0 (0.0%) |
| Computers & Mathematics | 85 (100.0%) | 0 (0.0%) |
| Architecture & Engineering | 0 (0.0%) | 0 (0.0%) |
| Life, Physical & Social Science | 0 (0.0%) | 0 (0.0%) |
| Community & Social Service | 0 (0.0%) | 53 (100.0%) |
| Education, Arts & Media | 0 (0.0%) | 0 (0.0%) |
| Legal Services & Support | 0 (0.0%) | 25 (100.0%) |
| Education Instruction & Library | 0 (0.0%) | 17 (100.0%) |
| Arts, Media & Entertainment | 0 (0.0%) | 11 (100.0%) |
| Health Diagnosing & Treating | 0 (0.0%) | 160 (100.0%) |
| Health Technologists | 0 (0.0%) | 20 (100.0%) |
| Total (Category) | 172 (38.6%) | 274 (61.4%) |
| Total (Overall) | 414 (41.4%) | 586 (58.6%) |
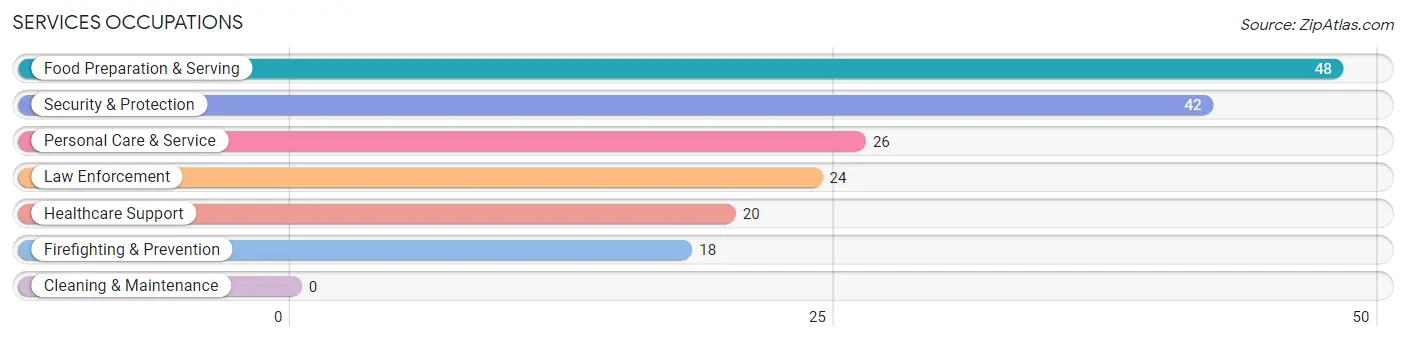
Services Occupations
The most common Services occupations in New Berlinville are Food Preparation & Serving (48 | 4.8%), Security & Protection (42 | 4.2%), Personal Care & Service (26 | 2.6%), Law Enforcement (24 | 2.4%), and Healthcare Support (20 | 2.0%).
Services Occupations by Sex
Within the Services occupations in New Berlinville, the most male-oriented occupations are Firefighting & Prevention (100.0%), and Security & Protection (42.9%), while the most female-oriented occupations are Healthcare Support (100.0%), Law Enforcement (100.0%), and Food Preparation & Serving (100.0%).
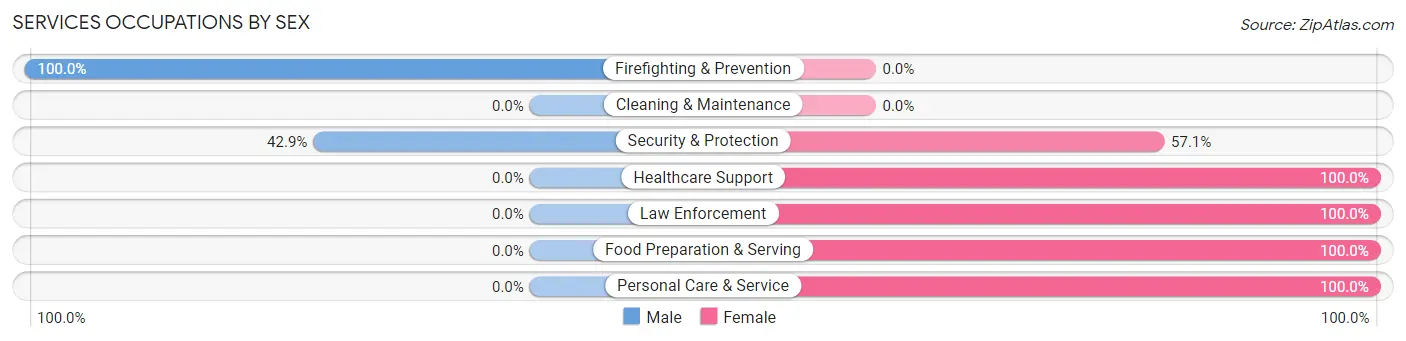
| Occupation | Male | Female |
| Healthcare Support | 0 (0.0%) | 20 (100.0%) |
| Security & Protection | 18 (42.9%) | 24 (57.1%) |
| Firefighting & Prevention | 18 (100.0%) | 0 (0.0%) |
| Law Enforcement | 0 (0.0%) | 24 (100.0%) |
| Food Preparation & Serving | 0 (0.0%) | 48 (100.0%) |
| Cleaning & Maintenance | 0 (0.0%) | 0 (0.0%) |
| Personal Care & Service | 0 (0.0%) | 26 (100.0%) |
| Total (Category) | 18 (13.2%) | 118 (86.8%) |
| Total (Overall) | 414 (41.4%) | 586 (58.6%) |
Sales and Office Occupations
The most common Sales and Office occupations in New Berlinville are Office & Administration (151 | 15.1%), and Sales & Related (121 | 12.1%).

Sales and Office Occupations by Sex

| Occupation | Male | Female |
| Sales & Related | 84 (69.4%) | 37 (30.6%) |
| Office & Administration | 10 (6.6%) | 141 (93.4%) |
| Total (Category) | 94 (34.6%) | 178 (65.4%) |
| Total (Overall) | 414 (41.4%) | 586 (58.6%) |
Natural Resources, Construction and Maintenance Occupations
The most common Natural Resources, Construction and Maintenance occupations in New Berlinville are , and Installation, Maintenance & Repair (45 | 4.5%).
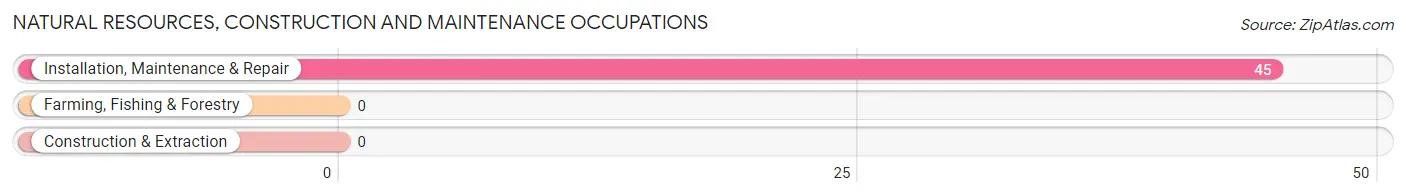
Natural Resources, Construction and Maintenance Occupations by Sex

| Occupation | Male | Female |
| Farming, Fishing & Forestry | 0 (0.0%) | 0 (0.0%) |
| Construction & Extraction | 0 (0.0%) | 0 (0.0%) |
| Installation, Maintenance & Repair | 45 (100.0%) | 0 (0.0%) |
| Total (Category) | 45 (100.0%) | 0 (0.0%) |
| Total (Overall) | 414 (41.4%) | 586 (58.6%) |
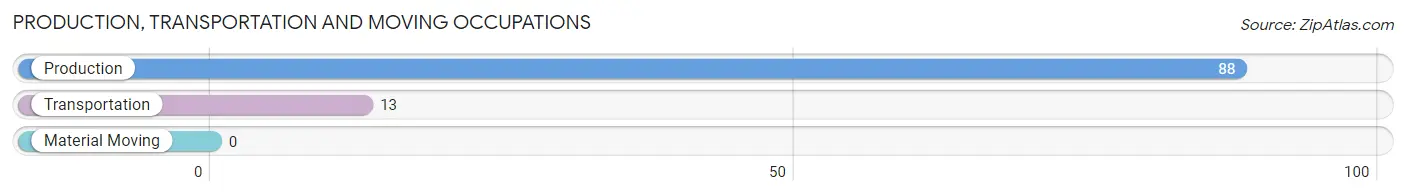
Production, Transportation and Moving Occupations
The most common Production, Transportation and Moving occupations in New Berlinville are Production (88 | 8.8%), and Transportation (13 | 1.3%).
Production, Transportation and Moving Occupations by Sex
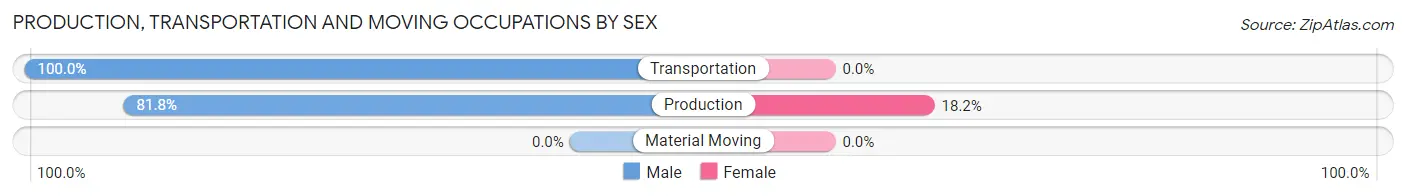
| Occupation | Male | Female |
| Production | 72 (81.8%) | 16 (18.2%) |
| Transportation | 13 (100.0%) | 0 (0.0%) |
| Material Moving | 0 (0.0%) | 0 (0.0%) |
| Total (Category) | 85 (84.2%) | 16 (15.8%) |
| Total (Overall) | 414 (41.4%) | 586 (58.6%) |
Employment Industries by Sex in New Berlinville
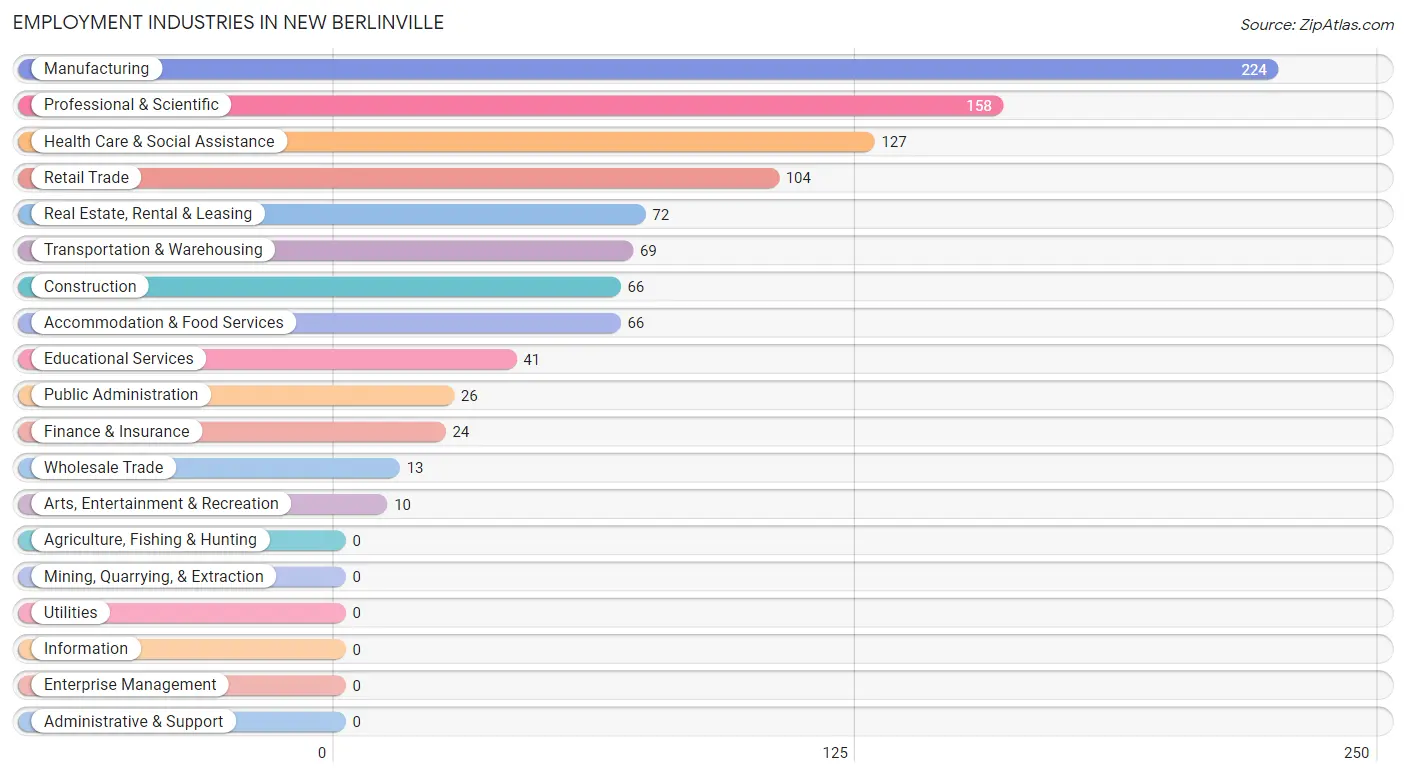
Employment Industries in New Berlinville
The major employment industries in New Berlinville include Manufacturing (224 | 22.4%), Professional & Scientific (158 | 15.8%), Health Care & Social Assistance (127 | 12.7%), Retail Trade (104 | 10.4%), and Real Estate, Rental & Leasing (72 | 7.2%).
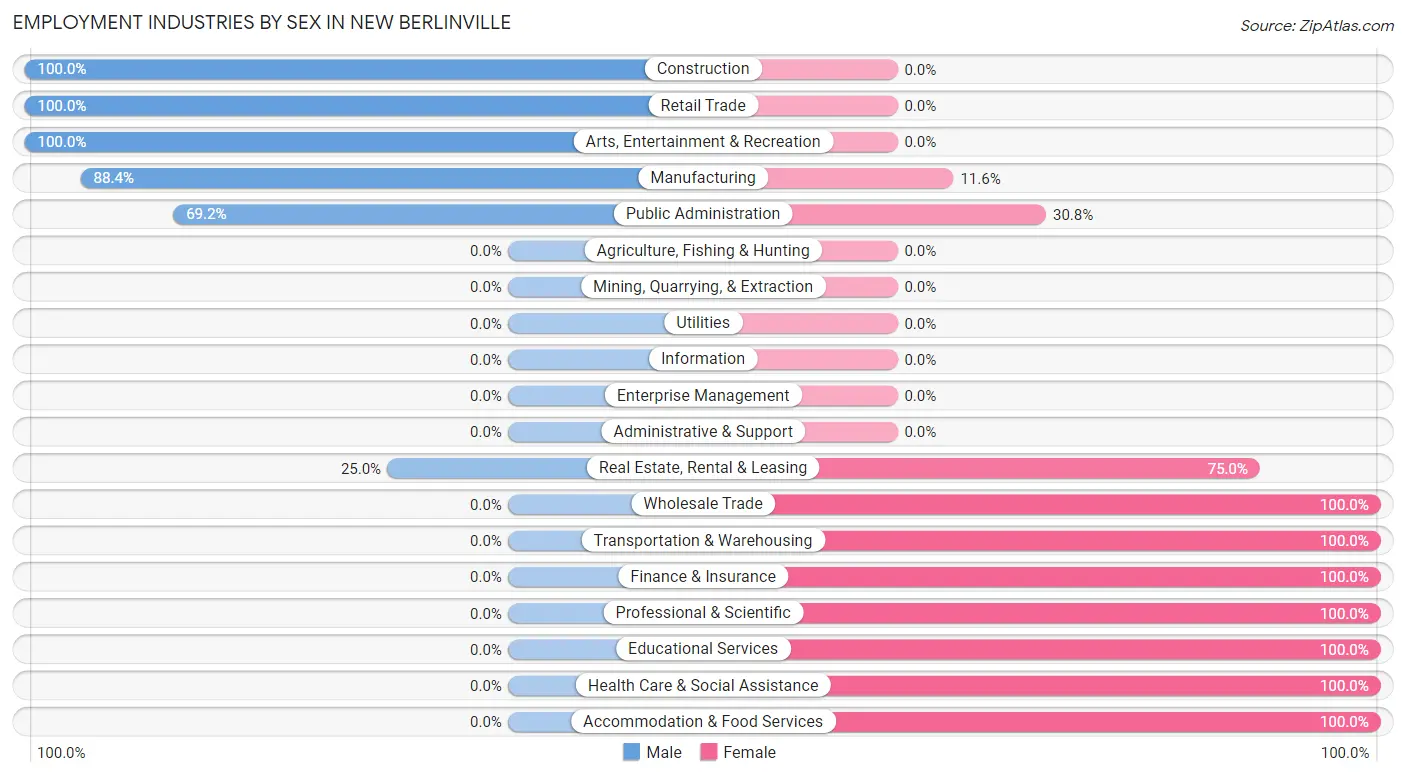
Employment Industries by Sex in New Berlinville
The New Berlinville industries that see more men than women are Construction (100.0%), Retail Trade (100.0%), and Arts, Entertainment & Recreation (100.0%), whereas the industries that tend to have a higher number of women are Wholesale Trade (100.0%), Transportation & Warehousing (100.0%), and Finance & Insurance (100.0%).
| Industry | Male | Female |
| Agriculture, Fishing & Hunting | 0 (0.0%) | 0 (0.0%) |
| Mining, Quarrying, & Extraction | 0 (0.0%) | 0 (0.0%) |
| Construction | 66 (100.0%) | 0 (0.0%) |
| Manufacturing | 198 (88.4%) | 26 (11.6%) |
| Wholesale Trade | 0 (0.0%) | 13 (100.0%) |
| Retail Trade | 104 (100.0%) | 0 (0.0%) |
| Transportation & Warehousing | 0 (0.0%) | 69 (100.0%) |
| Utilities | 0 (0.0%) | 0 (0.0%) |
| Information | 0 (0.0%) | 0 (0.0%) |
| Finance & Insurance | 0 (0.0%) | 24 (100.0%) |
| Real Estate, Rental & Leasing | 18 (25.0%) | 54 (75.0%) |
| Professional & Scientific | 0 (0.0%) | 158 (100.0%) |
| Enterprise Management | 0 (0.0%) | 0 (0.0%) |
| Administrative & Support | 0 (0.0%) | 0 (0.0%) |
| Educational Services | 0 (0.0%) | 41 (100.0%) |
| Health Care & Social Assistance | 0 (0.0%) | 127 (100.0%) |
| Arts, Entertainment & Recreation | 10 (100.0%) | 0 (0.0%) |
| Accommodation & Food Services | 0 (0.0%) | 66 (100.0%) |
| Public Administration | 18 (69.2%) | 8 (30.8%) |
| Total | 414 (41.4%) | 586 (58.6%) |
Education in New Berlinville
School Enrollment in New Berlinville
The most common levels of schooling among the 541 students in New Berlinville are elementary school (159 | 29.4%), college / undergraduate (146 | 27.0%), and middle school (108 | 20.0%).
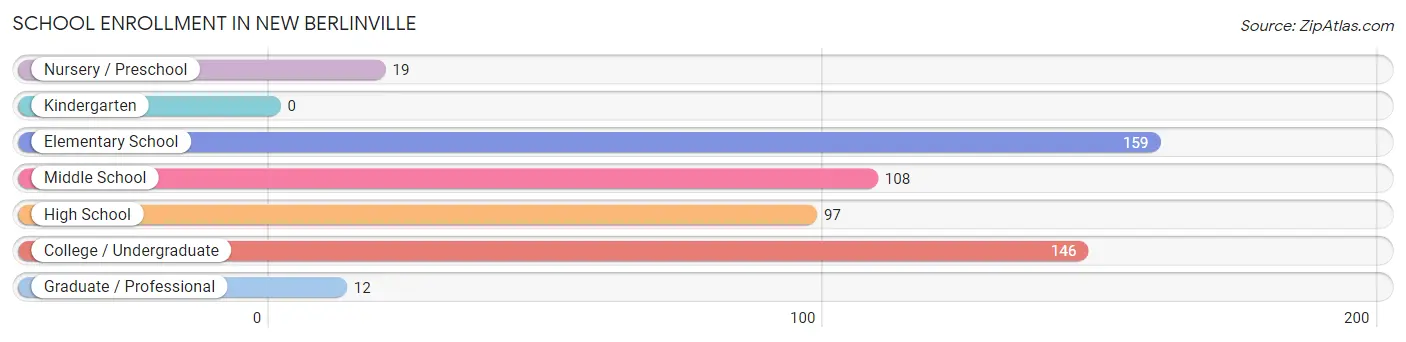
| School Level | # Students | % Students |
| Nursery / Preschool | 19 | 3.5% |
| Kindergarten | 0 | 0.0% |
| Elementary School | 159 | 29.4% |
| Middle School | 108 | 20.0% |
| High School | 97 | 17.9% |
| College / Undergraduate | 146 | 27.0% |
| Graduate / Professional | 12 | 2.2% |
| Total | 541 | 100.0% |
School Enrollment by Age by Funding Source in New Berlinville
Out of a total of 541 students who are enrolled in schools in New Berlinville, 85 (15.7%) attend a private institution, while the remaining 456 (84.3%) are enrolled in public schools. The age group of 3 to 4 year olds has the highest likelihood of being enrolled in private schools, with 19 (100.0% in the age bracket) enrolled. Conversely, the age group of 10 to 14 year olds has the lowest likelihood of being enrolled in a private school, with 176 (100.0% in the age bracket) attending a public institution.
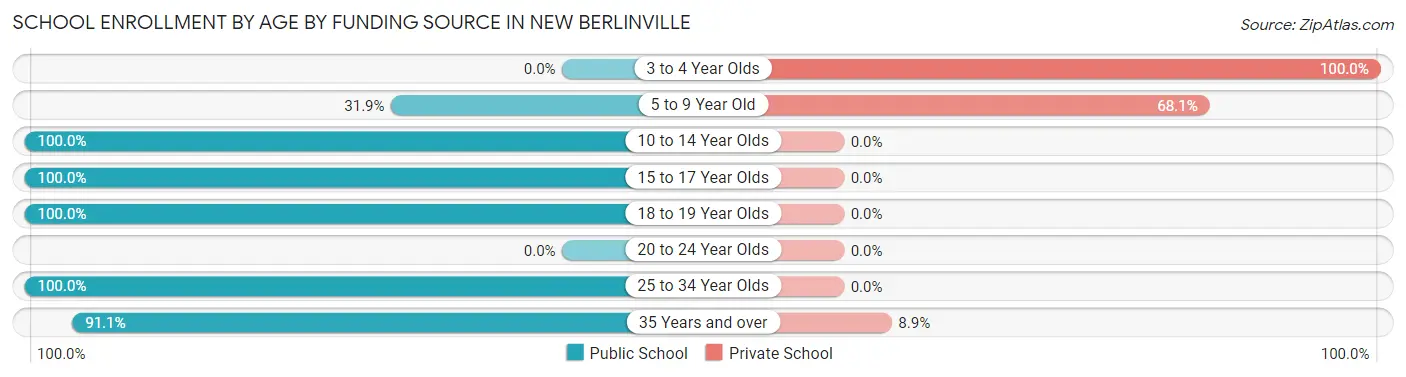
| Age Bracket | Public School | Private School |
| 3 to 4 Year Olds | 0 (0.0%) | 19 (100.0%) |
| 5 to 9 Year Old | 29 (31.9%) | 62 (68.1%) |
| 10 to 14 Year Olds | 176 (100.0%) | 0 (0.0%) |
| 15 to 17 Year Olds | 77 (100.0%) | 0 (0.0%) |
| 18 to 19 Year Olds | 115 (100.0%) | 0 (0.0%) |
| 20 to 24 Year Olds | 0 (0.0%) | 0 (0.0%) |
| 25 to 34 Year Olds | 18 (100.0%) | 0 (0.0%) |
| 35 Years and over | 41 (91.1%) | 4 (8.9%) |
| Total | 456 (84.3%) | 85 (15.7%) |
Educational Attainment by Field of Study in New Berlinville
Business (76 | 47.5%), literature & languages (25 | 15.6%), arts & humanities (24 | 15.0%), science & technology (20 | 12.5%), and visual & performing arts (11 | 6.9%) are the most common fields of study among 160 individuals in New Berlinville who have obtained a bachelor's degree or higher.
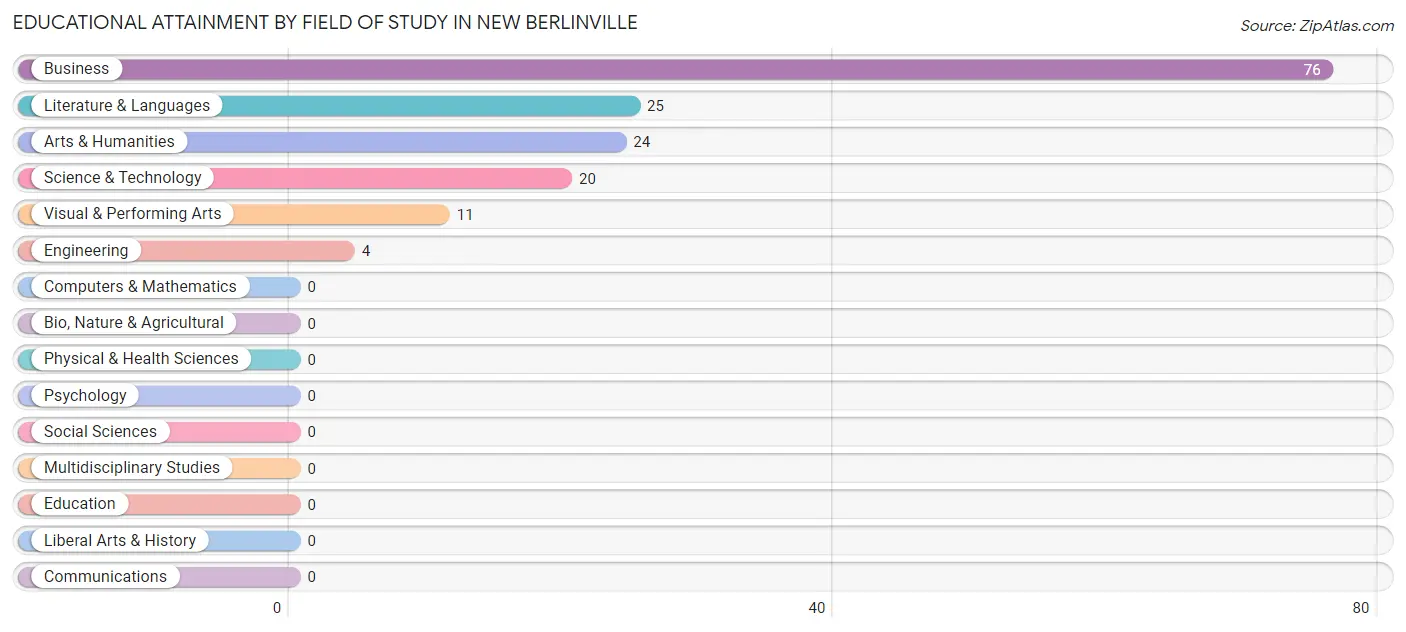
| Field of Study | # Graduates | % Graduates |
| Computers & Mathematics | 0 | 0.0% |
| Bio, Nature & Agricultural | 0 | 0.0% |
| Physical & Health Sciences | 0 | 0.0% |
| Psychology | 0 | 0.0% |
| Social Sciences | 0 | 0.0% |
| Engineering | 4 | 2.5% |
| Multidisciplinary Studies | 0 | 0.0% |
| Science & Technology | 20 | 12.5% |
| Business | 76 | 47.5% |
| Education | 0 | 0.0% |
| Literature & Languages | 25 | 15.6% |
| Liberal Arts & History | 0 | 0.0% |
| Visual & Performing Arts | 11 | 6.9% |
| Communications | 0 | 0.0% |
| Arts & Humanities | 24 | 15.0% |
| Total | 160 | 100.0% |
Transportation & Commute in New Berlinville
Vehicle Availability by Sex in New Berlinville
The most prevalent vehicle ownership categories in New Berlinville are males with 2 vehicles (266, accounting for 64.2%) and females with 2 vehicles (347, making up 45.4%).
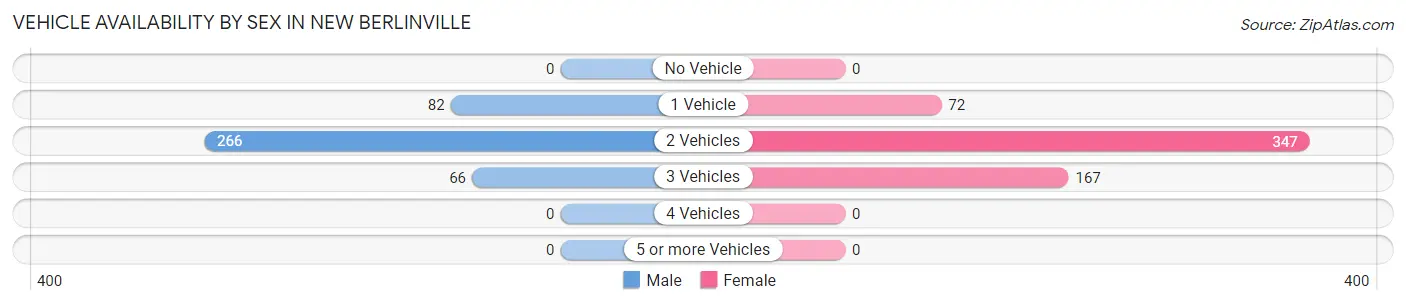
| Vehicles Available | Male | Female |
| No Vehicle | 0 (0.0%) | 0 (0.0%) |
| 1 Vehicle | 82 (19.8%) | 72 (12.3%) |
| 2 Vehicles | 266 (64.2%) | 347 (59.2%) |
| 3 Vehicles | 66 (15.9%) | 167 (28.5%) |
| 4 Vehicles | 0 (0.0%) | 0 (0.0%) |
| 5 or more Vehicles | 0 (0.0%) | 0 (0.0%) |
| Total | 414 (100.0%) | 586 (100.0%) |
Commute Time in New Berlinville
The most frequently occuring commute durations in New Berlinville are 25 to 29 minutes (251 commuters, 26.8%), 30 to 34 minutes (171 commuters, 18.3%), and 5 to 9 minutes (124 commuters, 13.3%).
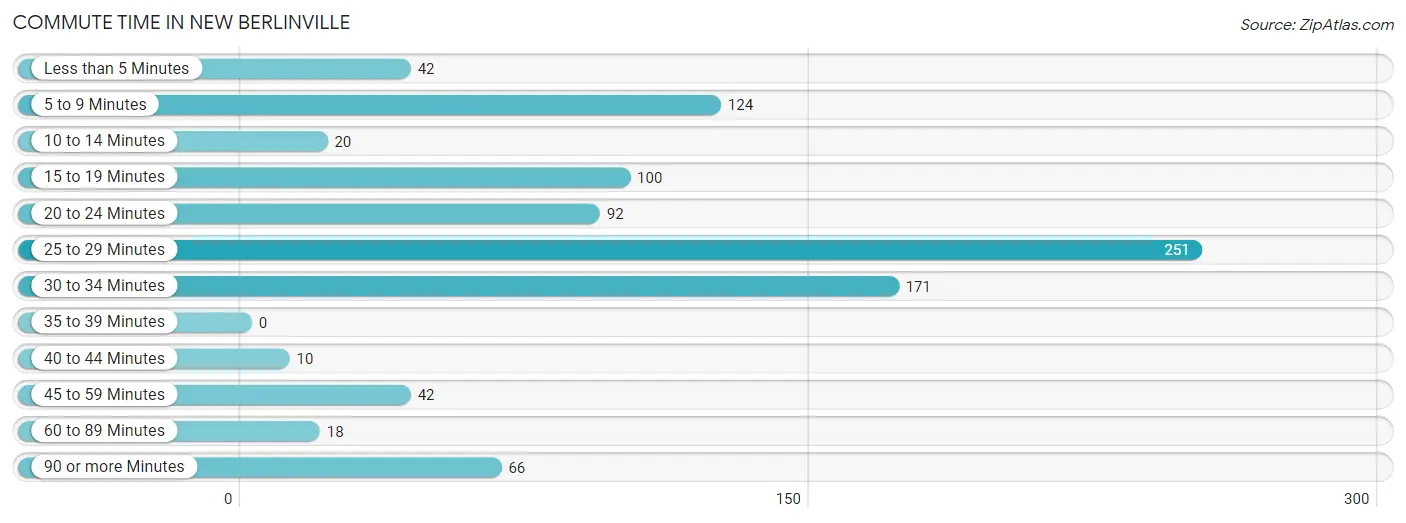
| Commute Time | # Commuters | % Commuters |
| Less than 5 Minutes | 42 | 4.5% |
| 5 to 9 Minutes | 124 | 13.3% |
| 10 to 14 Minutes | 20 | 2.1% |
| 15 to 19 Minutes | 100 | 10.7% |
| 20 to 24 Minutes | 92 | 9.8% |
| 25 to 29 Minutes | 251 | 26.8% |
| 30 to 34 Minutes | 171 | 18.3% |
| 35 to 39 Minutes | 0 | 0.0% |
| 40 to 44 Minutes | 10 | 1.1% |
| 45 to 59 Minutes | 42 | 4.5% |
| 60 to 89 Minutes | 18 | 1.9% |
| 90 or more Minutes | 66 | 7.0% |
Commute Time by Sex in New Berlinville
The most common commute times in New Berlinville are 30 to 34 minutes (124 commuters, 35.4%) for males and 25 to 29 minutes (251 commuters, 42.8%) for females.
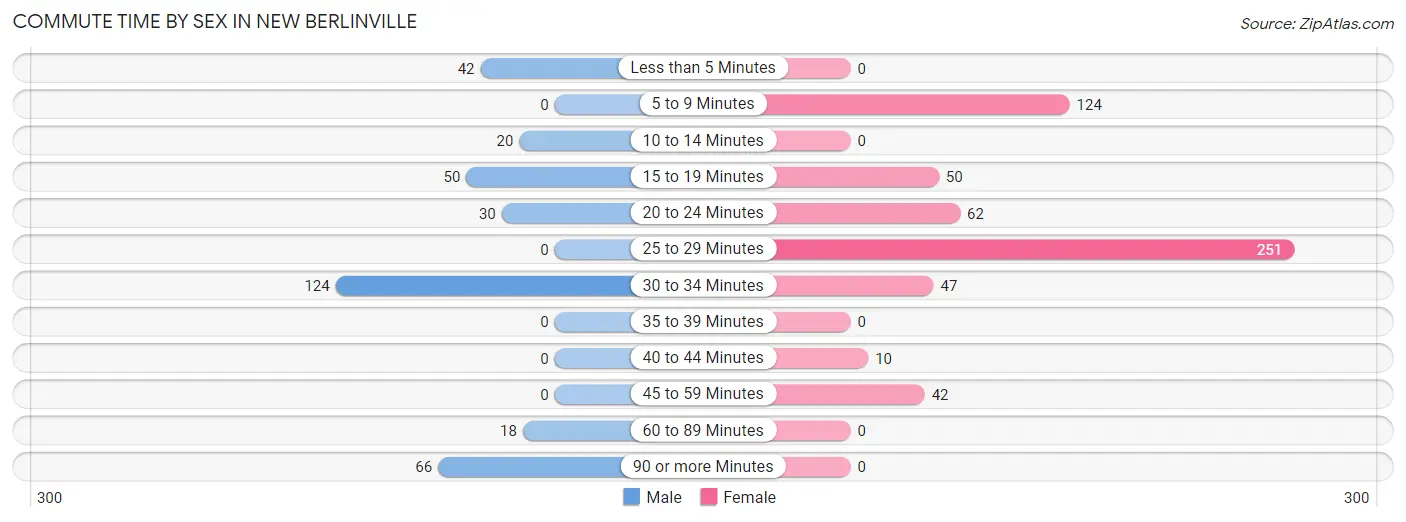
| Commute Time | Male | Female |
| Less than 5 Minutes | 42 (12.0%) | 0 (0.0%) |
| 5 to 9 Minutes | 0 (0.0%) | 124 (21.2%) |
| 10 to 14 Minutes | 20 (5.7%) | 0 (0.0%) |
| 15 to 19 Minutes | 50 (14.3%) | 50 (8.5%) |
| 20 to 24 Minutes | 30 (8.6%) | 62 (10.6%) |
| 25 to 29 Minutes | 0 (0.0%) | 251 (42.8%) |
| 30 to 34 Minutes | 124 (35.4%) | 47 (8.0%) |
| 35 to 39 Minutes | 0 (0.0%) | 0 (0.0%) |
| 40 to 44 Minutes | 0 (0.0%) | 10 (1.7%) |
| 45 to 59 Minutes | 0 (0.0%) | 42 (7.2%) |
| 60 to 89 Minutes | 18 (5.1%) | 0 (0.0%) |
| 90 or more Minutes | 66 (18.9%) | 0 (0.0%) |
Time of Departure to Work by Sex in New Berlinville
The most frequent times of departure to work in New Berlinville are 7:30 AM to 7:59 AM (118, 33.7%) for males and 7:00 AM to 7:29 AM (142, 24.2%) for females.
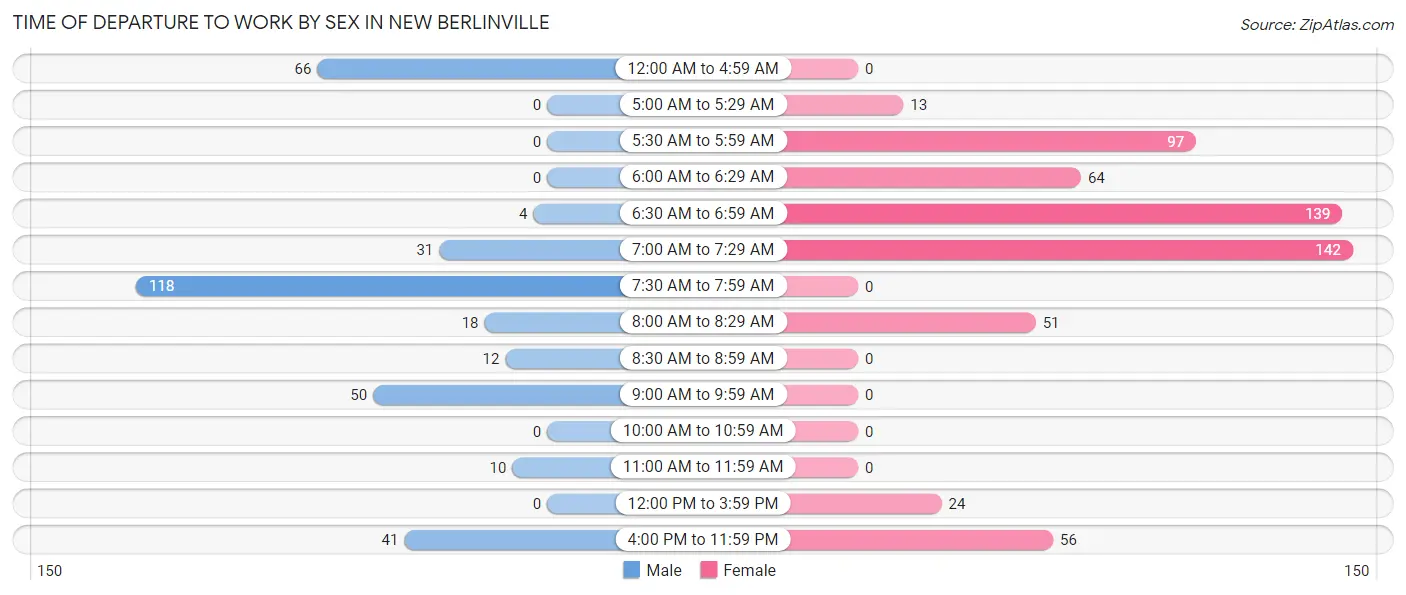
| Time of Departure | Male | Female |
| 12:00 AM to 4:59 AM | 66 (18.9%) | 0 (0.0%) |
| 5:00 AM to 5:29 AM | 0 (0.0%) | 13 (2.2%) |
| 5:30 AM to 5:59 AM | 0 (0.0%) | 97 (16.6%) |
| 6:00 AM to 6:29 AM | 0 (0.0%) | 64 (10.9%) |
| 6:30 AM to 6:59 AM | 4 (1.1%) | 139 (23.7%) |
| 7:00 AM to 7:29 AM | 31 (8.9%) | 142 (24.2%) |
| 7:30 AM to 7:59 AM | 118 (33.7%) | 0 (0.0%) |
| 8:00 AM to 8:29 AM | 18 (5.1%) | 51 (8.7%) |
| 8:30 AM to 8:59 AM | 12 (3.4%) | 0 (0.0%) |
| 9:00 AM to 9:59 AM | 50 (14.3%) | 0 (0.0%) |
| 10:00 AM to 10:59 AM | 0 (0.0%) | 0 (0.0%) |
| 11:00 AM to 11:59 AM | 10 (2.9%) | 0 (0.0%) |
| 12:00 PM to 3:59 PM | 0 (0.0%) | 24 (4.1%) |
| 4:00 PM to 11:59 PM | 41 (11.7%) | 56 (9.6%) |
| Total | 350 (100.0%) | 586 (100.0%) |
Housing Occupancy in New Berlinville
Occupancy by Ownership in New Berlinville
Of the total 654 dwellings in New Berlinville, owner-occupied units account for 541 (82.7%), while renter-occupied units make up 113 (17.3%).
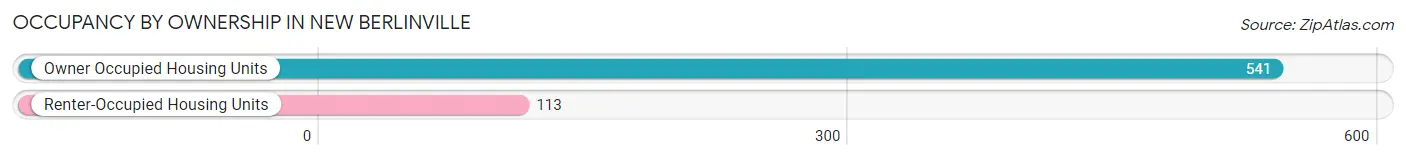
| Occupancy | # Housing Units | % Housing Units |
| Owner Occupied Housing Units | 541 | 82.7% |
| Renter-Occupied Housing Units | 113 | 17.3% |
| Total Occupied Housing Units | 654 | 100.0% |
Occupancy by Household Size in New Berlinville
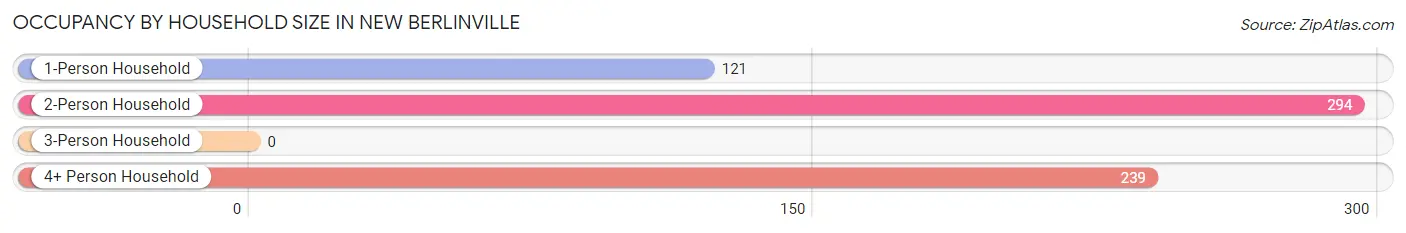
| Household Size | # Housing Units | % Housing Units |
| 1-Person Household | 121 | 18.5% |
| 2-Person Household | 294 | 45.0% |
| 3-Person Household | 0 | 0.0% |
| 4+ Person Household | 239 | 36.5% |
| Total Housing Units | 654 | 100.0% |
Occupancy by Ownership by Household Size in New Berlinville
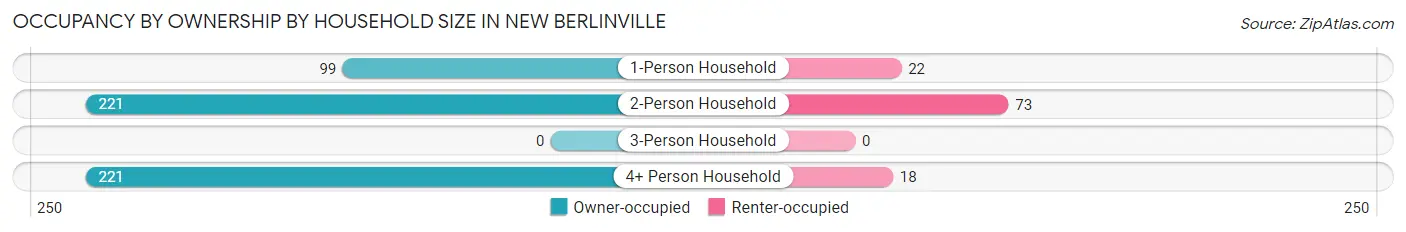
| Household Size | Owner-occupied | Renter-occupied |
| 1-Person Household | 99 (81.8%) | 22 (18.2%) |
| 2-Person Household | 221 (75.2%) | 73 (24.8%) |
| 3-Person Household | 0 (0.0%) | 0 (0.0%) |
| 4+ Person Household | 221 (92.5%) | 18 (7.5%) |
| Total Housing Units | 541 (82.7%) | 113 (17.3%) |
Occupancy by Educational Attainment in New Berlinville
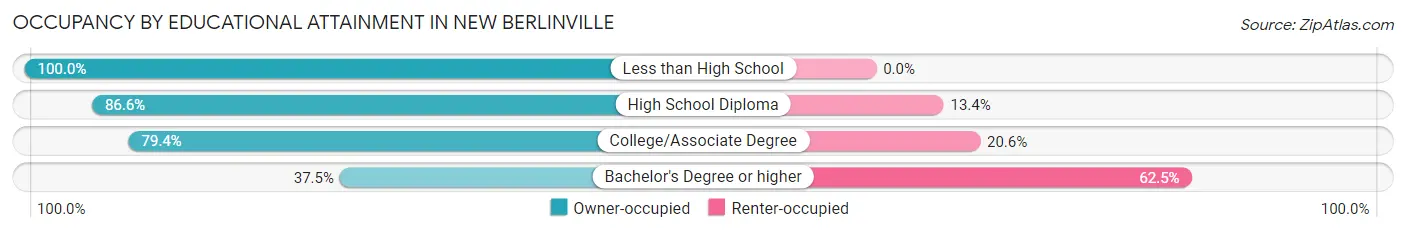
| Household Size | Owner-occupied | Renter-occupied |
| Less than High School | 29 (100.0%) | 0 (0.0%) |
| High School Diploma | 389 (86.6%) | 60 (13.4%) |
| College/Associate Degree | 108 (79.4%) | 28 (20.6%) |
| Bachelor's Degree or higher | 15 (37.5%) | 25 (62.5%) |
Occupancy by Age of Householder in New Berlinville
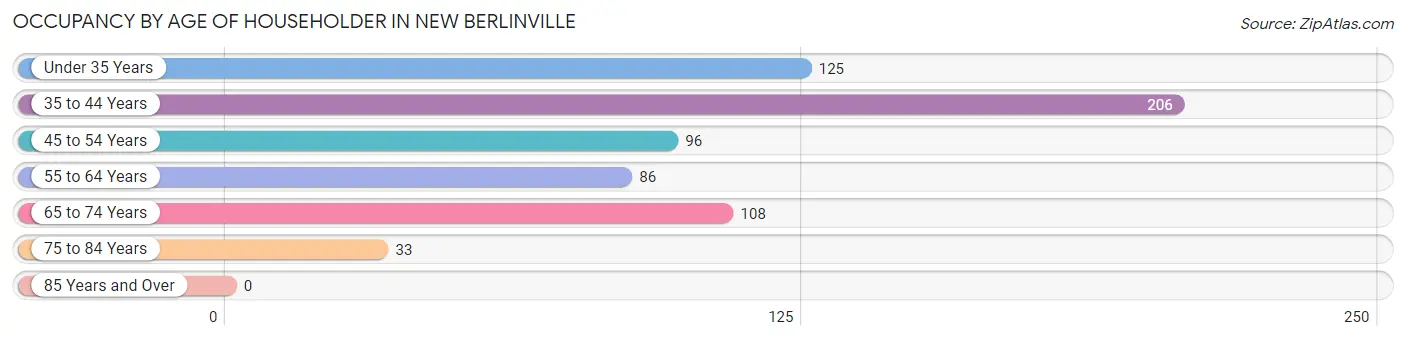
| Age Bracket | # Households | % Households |
| Under 35 Years | 125 | 19.1% |
| 35 to 44 Years | 206 | 31.5% |
| 45 to 54 Years | 96 | 14.7% |
| 55 to 64 Years | 86 | 13.2% |
| 65 to 74 Years | 108 | 16.5% |
| 75 to 84 Years | 33 | 5.1% |
| 85 Years and Over | 0 | 0.0% |
| Total | 654 | 100.0% |
Housing Finances in New Berlinville
Median Income by Occupancy in New Berlinville
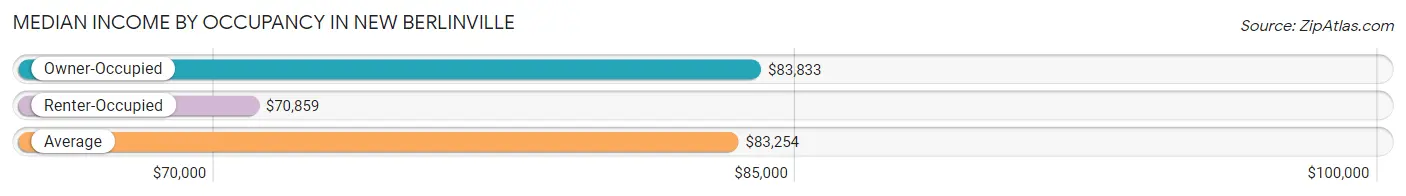
| Occupancy Type | # Households | Median Income |
| Owner-Occupied | 541 (82.7%) | $83,833 |
| Renter-Occupied | 113 (17.3%) | $70,859 |
| Average | 654 (100.0%) | $83,254 |
Occupancy by Householder Income Bracket in New Berlinville
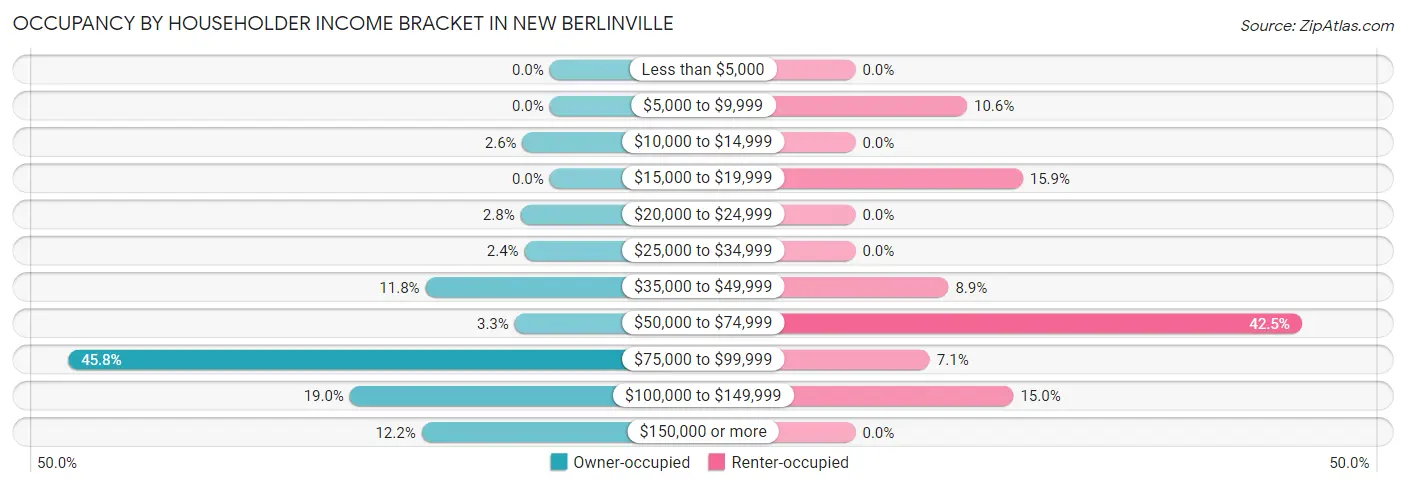
| Income Bracket | Owner-occupied | Renter-occupied |
| Less than $5,000 | 0 (0.0%) | 0 (0.0%) |
| $5,000 to $9,999 | 0 (0.0%) | 12 (10.6%) |
| $10,000 to $14,999 | 14 (2.6%) | 0 (0.0%) |
| $15,000 to $19,999 | 0 (0.0%) | 18 (15.9%) |
| $20,000 to $24,999 | 15 (2.8%) | 0 (0.0%) |
| $25,000 to $34,999 | 13 (2.4%) | 0 (0.0%) |
| $35,000 to $49,999 | 64 (11.8%) | 10 (8.8%) |
| $50,000 to $74,999 | 18 (3.3%) | 48 (42.5%) |
| $75,000 to $99,999 | 248 (45.8%) | 8 (7.1%) |
| $100,000 to $149,999 | 103 (19.0%) | 17 (15.0%) |
| $150,000 or more | 66 (12.2%) | 0 (0.0%) |
| Total | 541 (100.0%) | 113 (100.0%) |
Monthly Housing Cost Tiers in New Berlinville
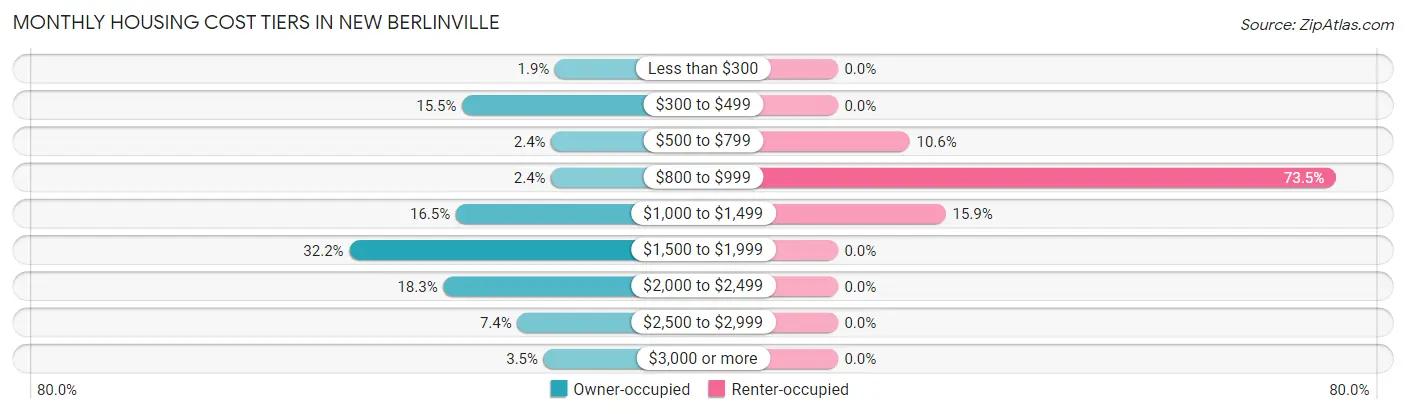
| Monthly Cost | Owner-occupied | Renter-occupied |
| Less than $300 | 10 (1.8%) | 0 (0.0%) |
| $300 to $499 | 84 (15.5%) | 0 (0.0%) |
| $500 to $799 | 13 (2.4%) | 12 (10.6%) |
| $800 to $999 | 13 (2.4%) | 83 (73.5%) |
| $1,000 to $1,499 | 89 (16.5%) | 18 (15.9%) |
| $1,500 to $1,999 | 174 (32.2%) | 0 (0.0%) |
| $2,000 to $2,499 | 99 (18.3%) | 0 (0.0%) |
| $2,500 to $2,999 | 40 (7.4%) | 0 (0.0%) |
| $3,000 or more | 19 (3.5%) | 0 (0.0%) |
| Total | 541 (100.0%) | 113 (100.0%) |
Physical Housing Characteristics in New Berlinville
Housing Structures in New Berlinville
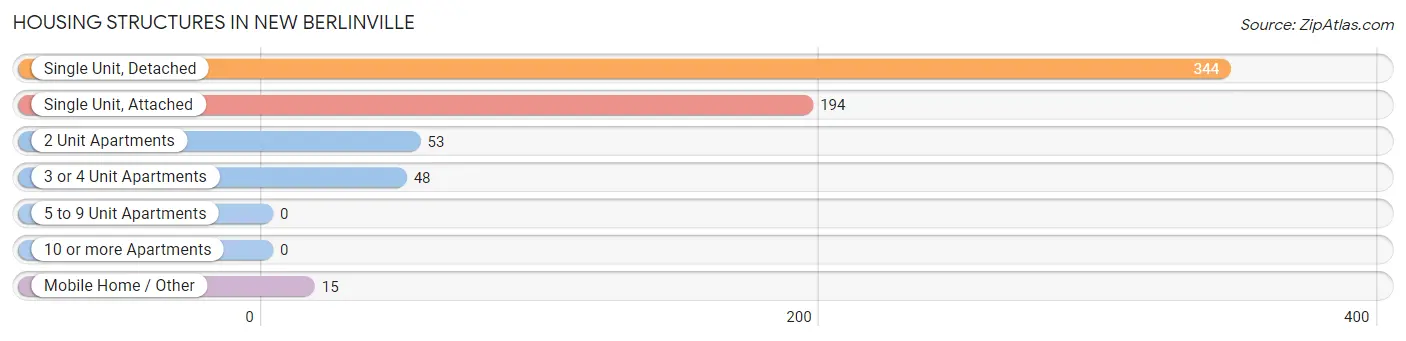
| Structure Type | # Housing Units | % Housing Units |
| Single Unit, Detached | 344 | 52.6% |
| Single Unit, Attached | 194 | 29.7% |
| 2 Unit Apartments | 53 | 8.1% |
| 3 or 4 Unit Apartments | 48 | 7.3% |
| 5 to 9 Unit Apartments | 0 | 0.0% |
| 10 or more Apartments | 0 | 0.0% |
| Mobile Home / Other | 15 | 2.3% |
| Total | 654 | 100.0% |
Housing Structures by Occupancy in New Berlinville
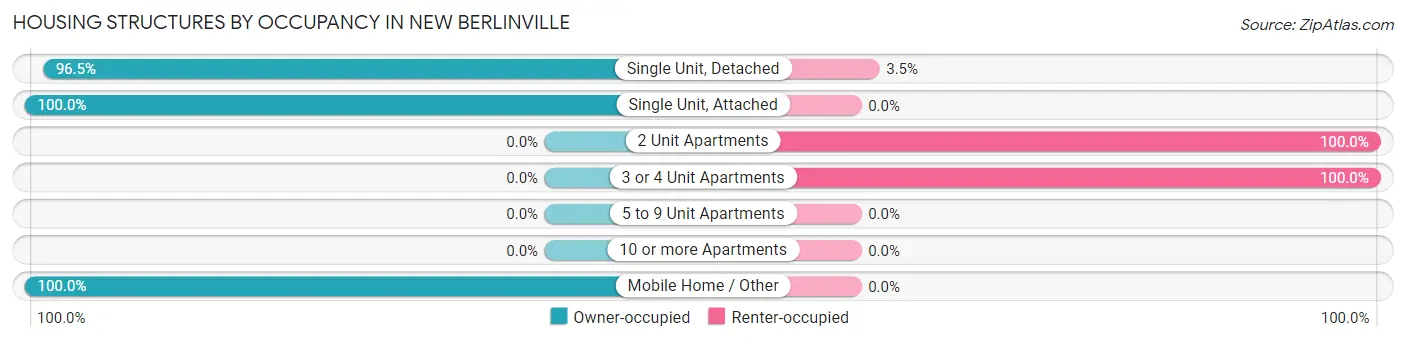
| Structure Type | Owner-occupied | Renter-occupied |
| Single Unit, Detached | 332 (96.5%) | 12 (3.5%) |
| Single Unit, Attached | 194 (100.0%) | 0 (0.0%) |
| 2 Unit Apartments | 0 (0.0%) | 53 (100.0%) |
| 3 or 4 Unit Apartments | 0 (0.0%) | 48 (100.0%) |
| 5 to 9 Unit Apartments | 0 (0.0%) | 0 (0.0%) |
| 10 or more Apartments | 0 (0.0%) | 0 (0.0%) |
| Mobile Home / Other | 15 (100.0%) | 0 (0.0%) |
| Total | 541 (82.7%) | 113 (17.3%) |
Housing Structures by Number of Rooms in New Berlinville
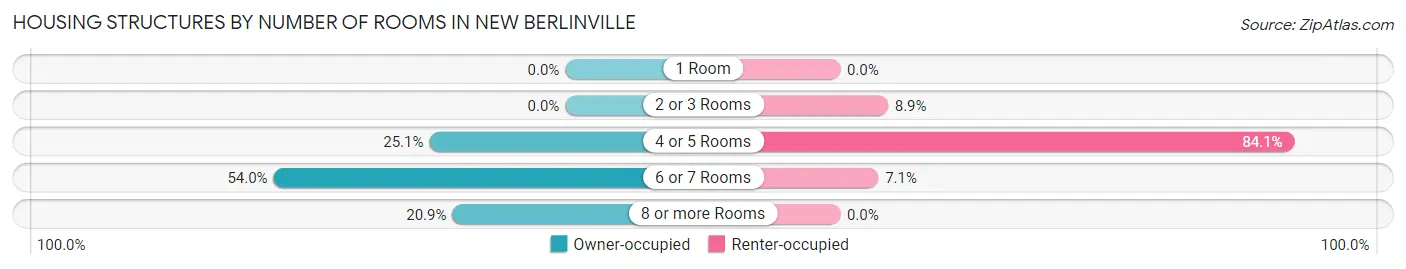
| Number of Rooms | Owner-occupied | Renter-occupied |
| 1 Room | 0 (0.0%) | 0 (0.0%) |
| 2 or 3 Rooms | 0 (0.0%) | 10 (8.8%) |
| 4 or 5 Rooms | 136 (25.1%) | 95 (84.1%) |
| 6 or 7 Rooms | 292 (54.0%) | 8 (7.1%) |
| 8 or more Rooms | 113 (20.9%) | 0 (0.0%) |
| Total | 541 (100.0%) | 113 (100.0%) |
Housing Structure by Heating Type in New Berlinville
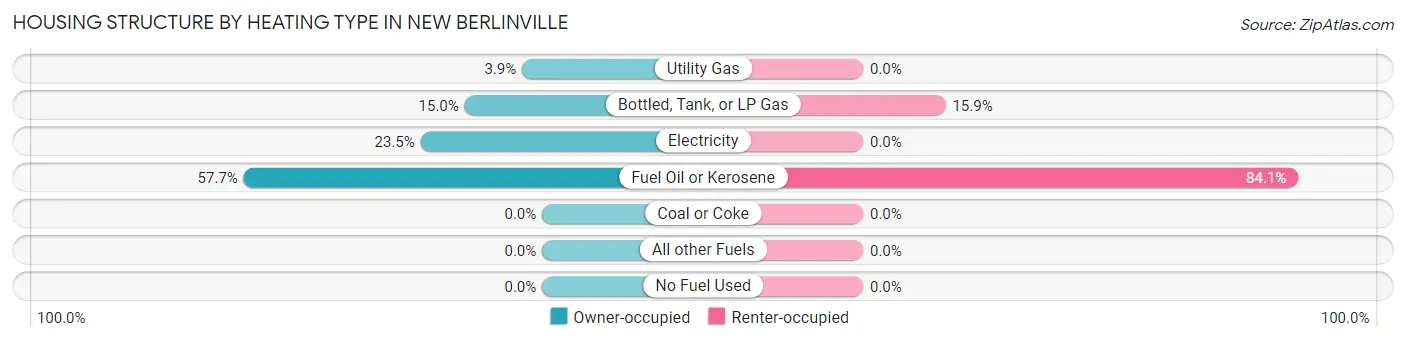
| Heating Type | Owner-occupied | Renter-occupied |
| Utility Gas | 21 (3.9%) | 0 (0.0%) |
| Bottled, Tank, or LP Gas | 81 (15.0%) | 18 (15.9%) |
| Electricity | 127 (23.5%) | 0 (0.0%) |
| Fuel Oil or Kerosene | 312 (57.7%) | 95 (84.1%) |
| Coal or Coke | 0 (0.0%) | 0 (0.0%) |
| All other Fuels | 0 (0.0%) | 0 (0.0%) |
| No Fuel Used | 0 (0.0%) | 0 (0.0%) |
| Total | 541 (100.0%) | 113 (100.0%) |
Household Vehicle Usage in New Berlinville
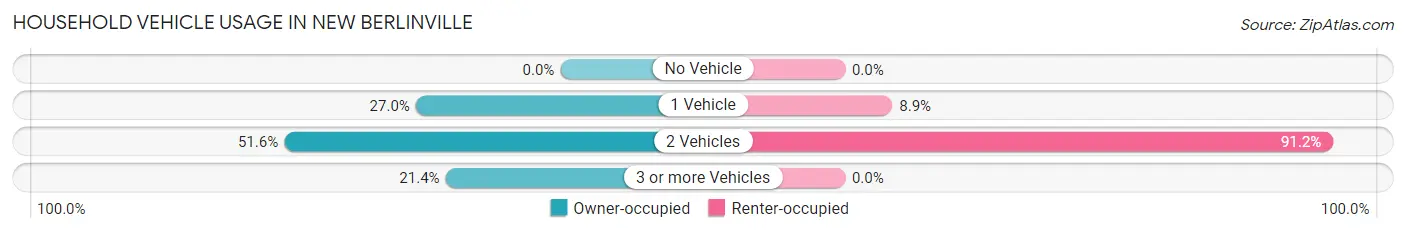
| Vehicles per Household | Owner-occupied | Renter-occupied |
| No Vehicle | 0 (0.0%) | 0 (0.0%) |
| 1 Vehicle | 146 (27.0%) | 10 (8.8%) |
| 2 Vehicles | 279 (51.6%) | 103 (91.1%) |
| 3 or more Vehicles | 116 (21.4%) | 0 (0.0%) |
| Total | 541 (100.0%) | 113 (100.0%) |
Real Estate & Mortgages in New Berlinville
Real Estate and Mortgage Overview in New Berlinville
| Characteristic | Without Mortgage | With Mortgage |
| Housing Units | 140 | 401 |
| Median Property Value | - | - |
| Median Household Income | - | - |
| Monthly Housing Costs | - | - |
| Real Estate Taxes | - | - |
Property Value by Mortgage Status in New Berlinville
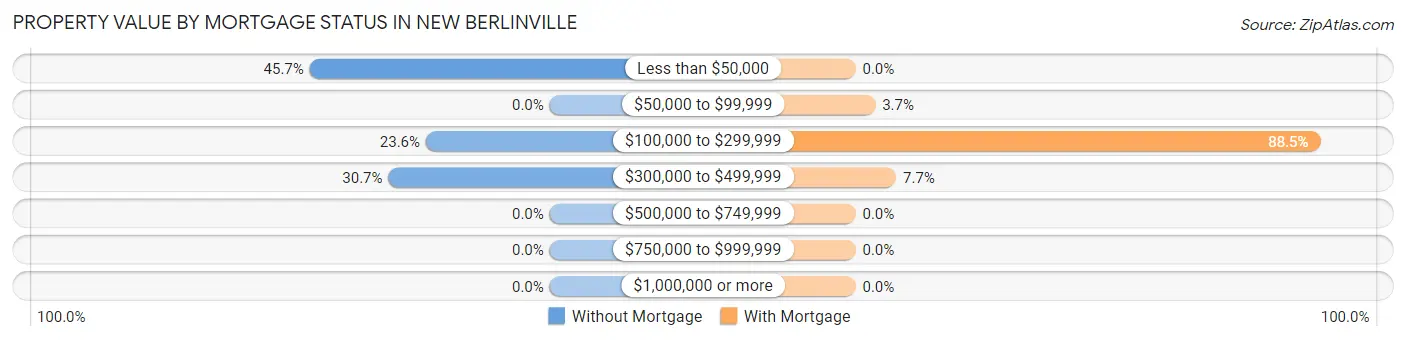
| Property Value | Without Mortgage | With Mortgage |
| Less than $50,000 | 64 (45.7%) | 0 (0.0%) |
| $50,000 to $99,999 | 0 (0.0%) | 15 (3.7%) |
| $100,000 to $299,999 | 33 (23.6%) | 355 (88.5%) |
| $300,000 to $499,999 | 43 (30.7%) | 31 (7.7%) |
| $500,000 to $749,999 | 0 (0.0%) | 0 (0.0%) |
| $750,000 to $999,999 | 0 (0.0%) | 0 (0.0%) |
| $1,000,000 or more | 0 (0.0%) | 0 (0.0%) |
| Total | 140 (100.0%) | 401 (100.0%) |
Household Income by Mortgage Status in New Berlinville
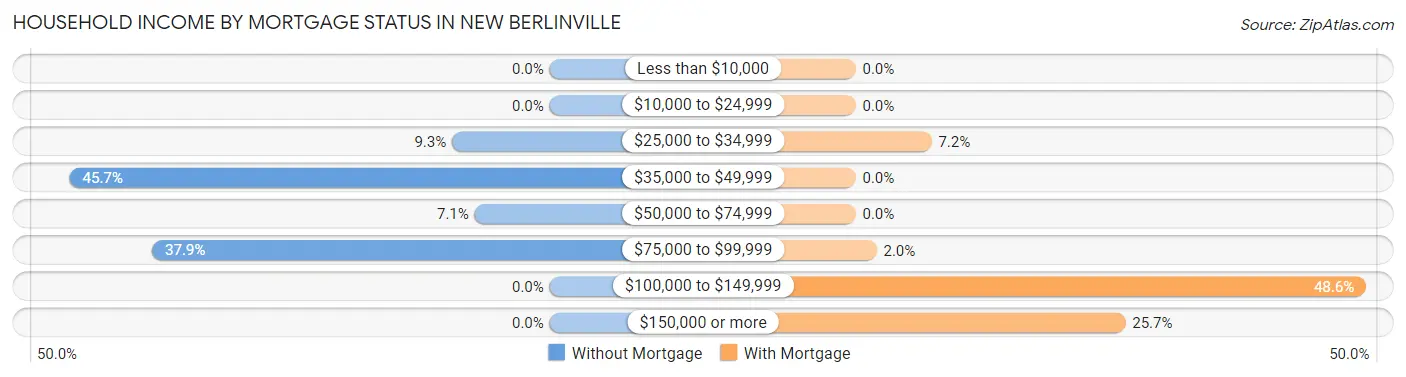
| Household Income | Without Mortgage | With Mortgage |
| Less than $10,000 | 0 (0.0%) | 0 (0.0%) |
| $10,000 to $24,999 | 0 (0.0%) | 0 (0.0%) |
| $25,000 to $34,999 | 13 (9.3%) | 29 (7.2%) |
| $35,000 to $49,999 | 64 (45.7%) | 0 (0.0%) |
| $50,000 to $74,999 | 10 (7.1%) | 0 (0.0%) |
| $75,000 to $99,999 | 53 (37.9%) | 8 (2.0%) |
| $100,000 to $149,999 | 0 (0.0%) | 195 (48.6%) |
| $150,000 or more | 0 (0.0%) | 103 (25.7%) |
| Total | 140 (100.0%) | 401 (100.0%) |
Property Value to Household Income Ratio in New Berlinville
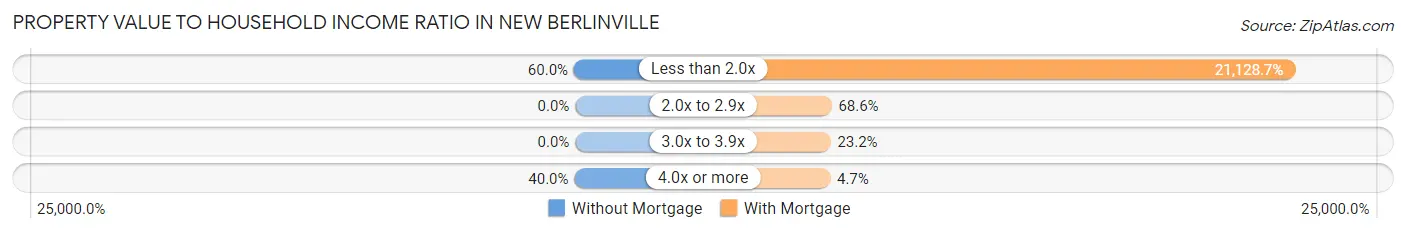
| Value-to-Income Ratio | Without Mortgage | With Mortgage |
| Less than 2.0x | 84 (60.0%) | 84,726 (21,128.7%) |
| 2.0x to 2.9x | 0 (0.0%) | 275 (68.6%) |
| 3.0x to 3.9x | 0 (0.0%) | 93 (23.2%) |
| 4.0x or more | 56 (40.0%) | 19 (4.7%) |
| Total | 140 (100.0%) | 401 (100.0%) |
Real Estate Taxes by Mortgage Status in New Berlinville
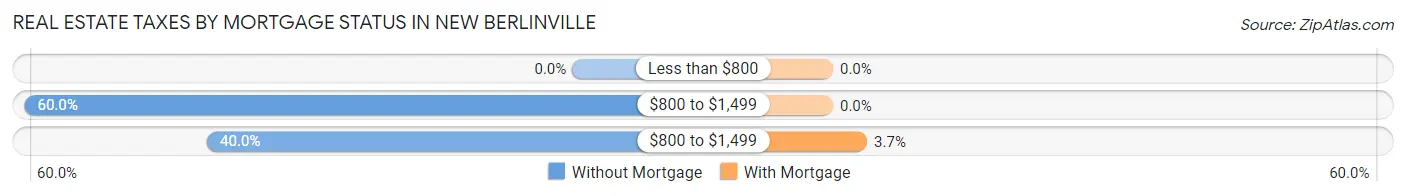
| Property Taxes | Without Mortgage | With Mortgage |
| Less than $800 | 0 (0.0%) | 0 (0.0%) |
| $800 to $1,499 | 84 (60.0%) | 0 (0.0%) |
| $800 to $1,499 | 56 (40.0%) | 15 (3.7%) |
| Total | 140 (100.0%) | 401 (100.0%) |
Health & Disability in New Berlinville
Health Insurance Coverage by Age in New Berlinville
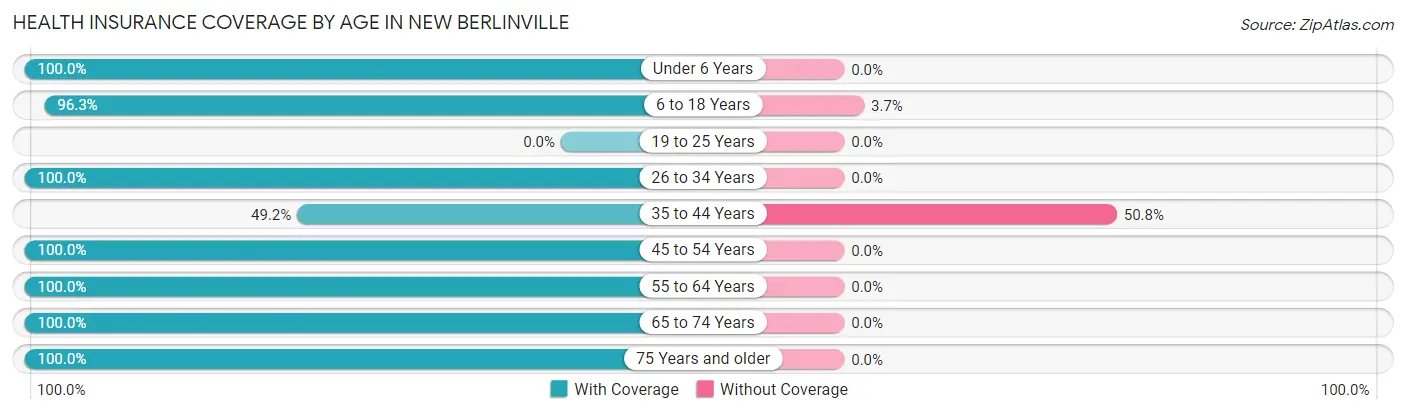
| Age Bracket | With Coverage | Without Coverage |
| Under 6 Years | 53 (100.0%) | 0 (0.0%) |
| 6 to 18 Years | 442 (96.3%) | 17 (3.7%) |
| 19 to 25 Years | 0 (0.0%) | 0 (0.0%) |
| 26 to 34 Years | 262 (100.0%) | 0 (0.0%) |
| 35 to 44 Years | 181 (49.2%) | 187 (50.8%) |
| 45 to 54 Years | 96 (100.0%) | 0 (0.0%) |
| 55 to 64 Years | 159 (100.0%) | 0 (0.0%) |
| 65 to 74 Years | 213 (100.0%) | 0 (0.0%) |
| 75 Years and older | 33 (100.0%) | 0 (0.0%) |
| Total | 1,439 (87.6%) | 204 (12.4%) |
Health Insurance Coverage by Citizenship Status in New Berlinville
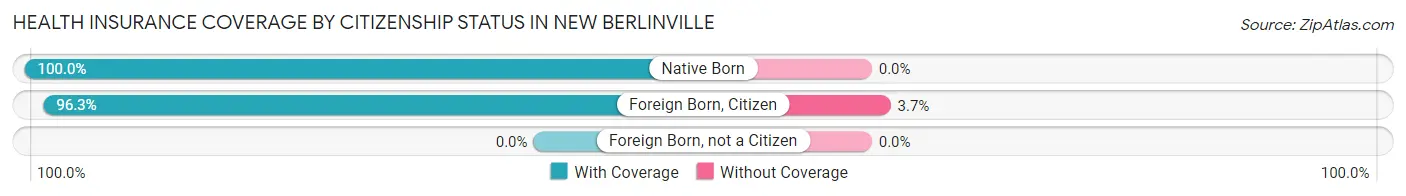
| Citizenship Status | With Coverage | Without Coverage |
| Native Born | 53 (100.0%) | 0 (0.0%) |
| Foreign Born, Citizen | 442 (96.3%) | 17 (3.7%) |
| Foreign Born, not a Citizen | 0 (0.0%) | 0 (0.0%) |
Health Insurance Coverage by Household Income in New Berlinville
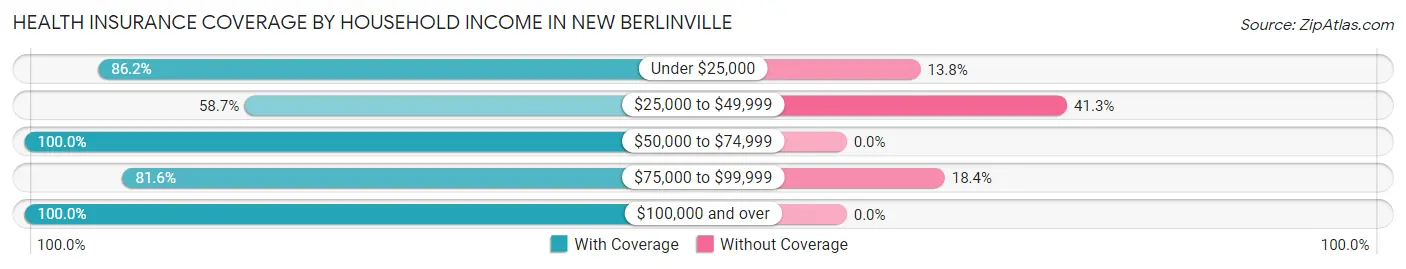
| Household Income | With Coverage | Without Coverage |
| Under $25,000 | 106 (86.2%) | 17 (13.8%) |
| $25,000 to $49,999 | 91 (58.7%) | 64 (41.3%) |
| $50,000 to $74,999 | 157 (100.0%) | 0 (0.0%) |
| $75,000 to $99,999 | 547 (81.6%) | 123 (18.4%) |
| $100,000 and over | 538 (100.0%) | 0 (0.0%) |
Public vs Private Health Insurance Coverage by Age in New Berlinville
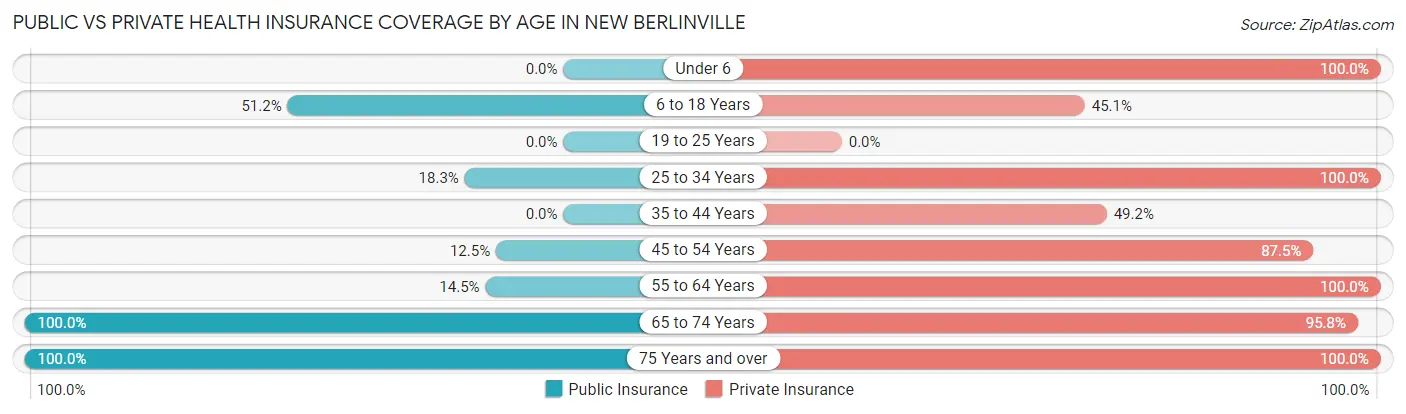
| Age Bracket | Public Insurance | Private Insurance |
| Under 6 | 0 (0.0%) | 53 (100.0%) |
| 6 to 18 Years | 235 (51.2%) | 207 (45.1%) |
| 19 to 25 Years | 0 (0.0%) | 0 (0.0%) |
| 25 to 34 Years | 48 (18.3%) | 262 (100.0%) |
| 35 to 44 Years | 0 (0.0%) | 181 (49.2%) |
| 45 to 54 Years | 12 (12.5%) | 84 (87.5%) |
| 55 to 64 Years | 23 (14.5%) | 159 (100.0%) |
| 65 to 74 Years | 213 (100.0%) | 204 (95.8%) |
| 75 Years and over | 33 (100.0%) | 33 (100.0%) |
| Total | 564 (34.3%) | 1,183 (72.0%) |
Disability Status by Sex by Age in New Berlinville
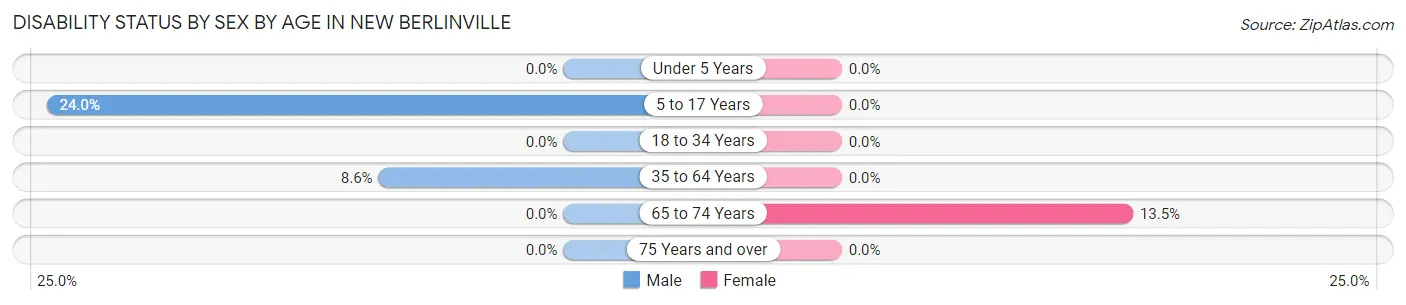
| Age Bracket | Male | Female |
| Under 5 Years | 0 (0.0%) | 0 (0.0%) |
| 5 to 17 Years | 59 (24.0%) | 0 (0.0%) |
| 18 to 34 Years | 0 (0.0%) | 0 (0.0%) |
| 35 to 64 Years | 23 (8.6%) | 0 (0.0%) |
| 65 to 74 Years | 0 (0.0%) | 15 (13.5%) |
| 75 Years and over | 0 (0.0%) | 0 (0.0%) |
Disability Class by Sex by Age in New Berlinville
Disability Class: Hearing Difficulty
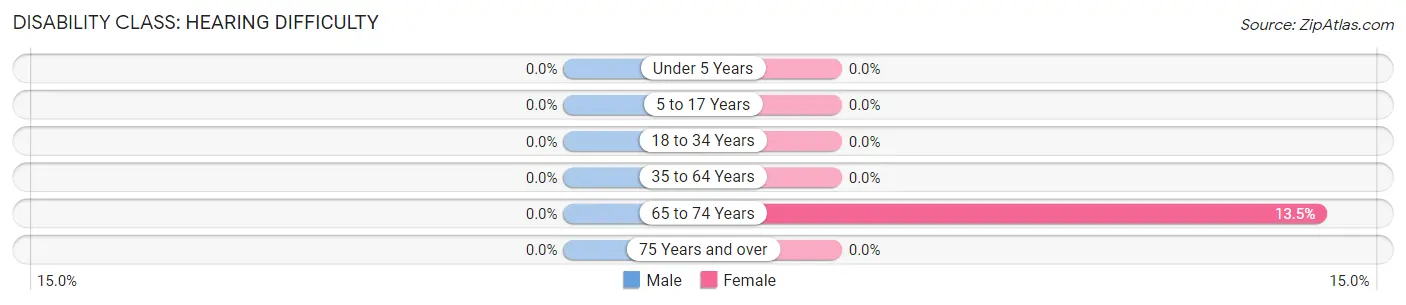
| Age Bracket | Male | Female |
| Under 5 Years | 0 (0.0%) | 0 (0.0%) |
| 5 to 17 Years | 0 (0.0%) | 0 (0.0%) |
| 18 to 34 Years | 0 (0.0%) | 0 (0.0%) |
| 35 to 64 Years | 0 (0.0%) | 0 (0.0%) |
| 65 to 74 Years | 0 (0.0%) | 15 (13.5%) |
| 75 Years and over | 0 (0.0%) | 0 (0.0%) |
Disability Class: Vision Difficulty
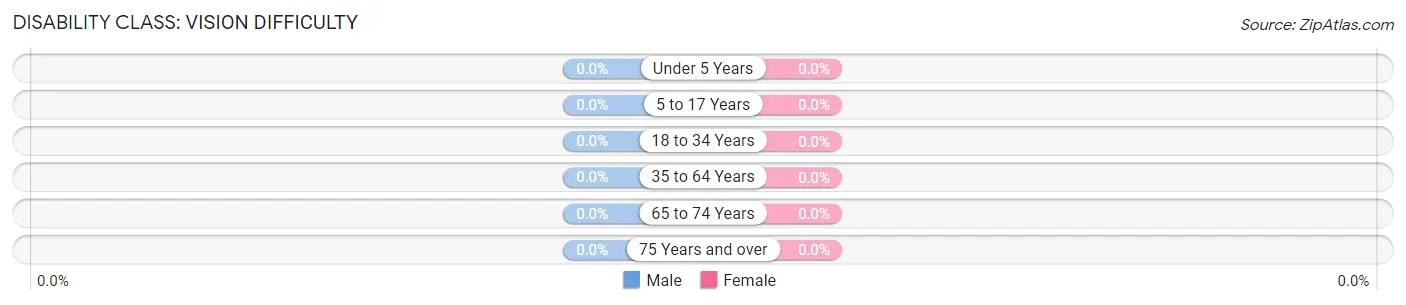
| Age Bracket | Male | Female |
| Under 5 Years | 0 (0.0%) | 0 (0.0%) |
| 5 to 17 Years | 0 (0.0%) | 0 (0.0%) |
| 18 to 34 Years | 0 (0.0%) | 0 (0.0%) |
| 35 to 64 Years | 0 (0.0%) | 0 (0.0%) |
| 65 to 74 Years | 0 (0.0%) | 0 (0.0%) |
| 75 Years and over | 0 (0.0%) | 0 (0.0%) |
Disability Class: Cognitive Difficulty
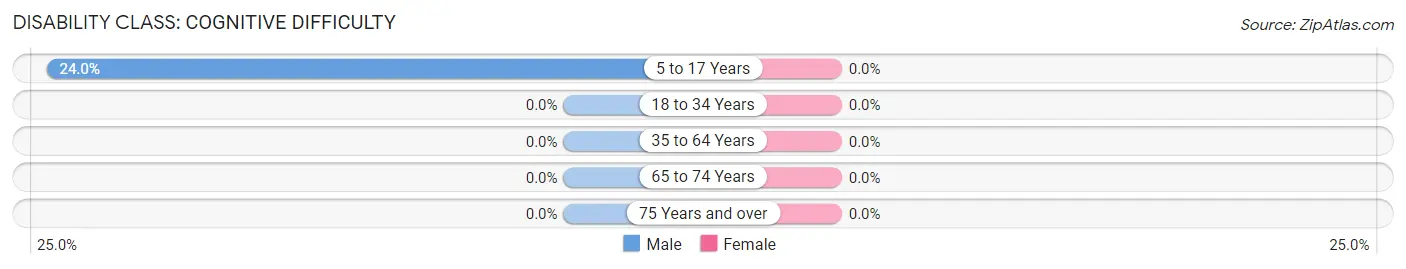
| Age Bracket | Male | Female |
| 5 to 17 Years | 59 (24.0%) | 0 (0.0%) |
| 18 to 34 Years | 0 (0.0%) | 0 (0.0%) |
| 35 to 64 Years | 0 (0.0%) | 0 (0.0%) |
| 65 to 74 Years | 0 (0.0%) | 0 (0.0%) |
| 75 Years and over | 0 (0.0%) | 0 (0.0%) |
Disability Class: Ambulatory Difficulty
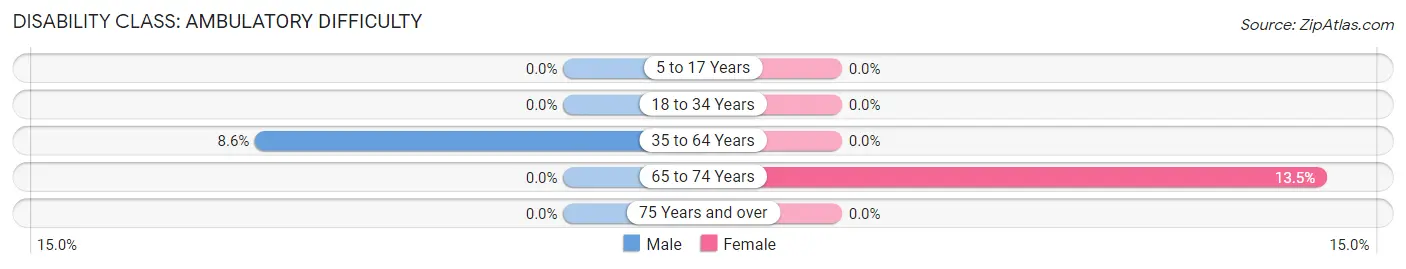
| Age Bracket | Male | Female |
| 5 to 17 Years | 0 (0.0%) | 0 (0.0%) |
| 18 to 34 Years | 0 (0.0%) | 0 (0.0%) |
| 35 to 64 Years | 23 (8.6%) | 0 (0.0%) |
| 65 to 74 Years | 0 (0.0%) | 15 (13.5%) |
| 75 Years and over | 0 (0.0%) | 0 (0.0%) |
Disability Class: Self-Care Difficulty
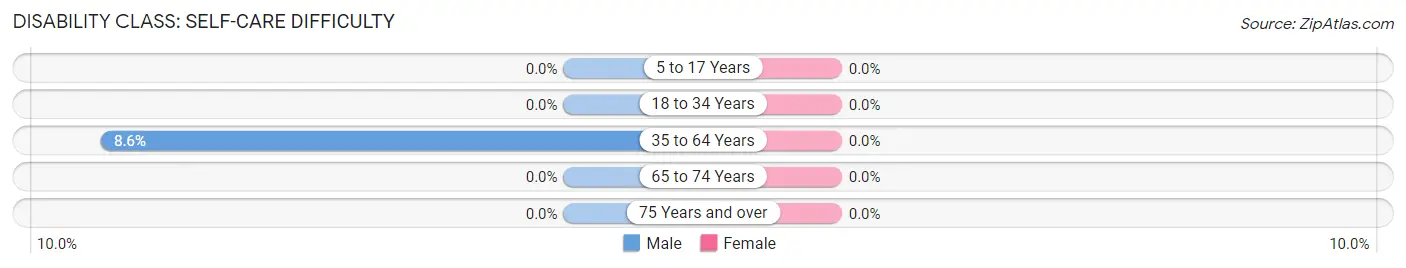
| Age Bracket | Male | Female |
| 5 to 17 Years | 0 (0.0%) | 0 (0.0%) |
| 18 to 34 Years | 0 (0.0%) | 0 (0.0%) |
| 35 to 64 Years | 23 (8.6%) | 0 (0.0%) |
| 65 to 74 Years | 0 (0.0%) | 0 (0.0%) |
| 75 Years and over | 0 (0.0%) | 0 (0.0%) |
Technology Access in New Berlinville
Computing Device Access in New Berlinville
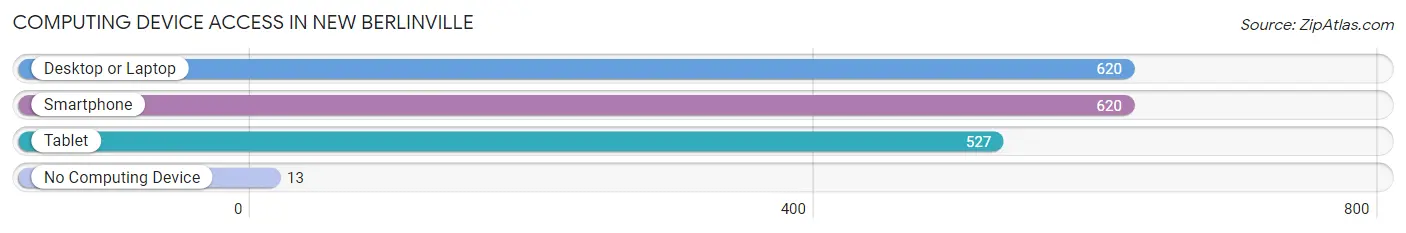
| Device Type | # Households | % Households |
| Desktop or Laptop | 620 | 94.8% |
| Smartphone | 620 | 94.8% |
| Tablet | 527 | 80.6% |
| No Computing Device | 13 | 2.0% |
| Total | 654 | 100.0% |
Internet Access in New Berlinville
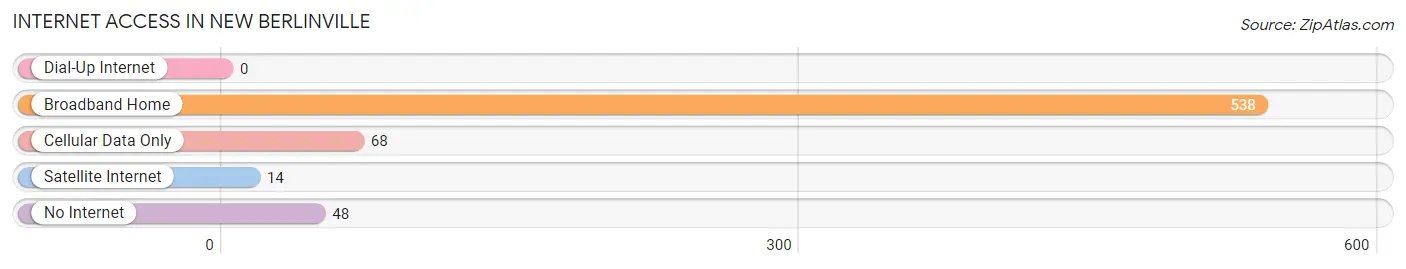
| Internet Type | # Households | % Households |
| Dial-Up Internet | 0 | 0.0% |
| Broadband Home | 538 | 82.3% |
| Cellular Data Only | 68 | 10.4% |
| Satellite Internet | 14 | 2.1% |
| No Internet | 48 | 7.3% |
| Total | 654 | 100.0% |
New Berlinville Summary
New Berlinville is a small borough located in Montgomery County, Pennsylvania. It is situated in the southeastern part of the state, approximately 25 miles northwest of Philadelphia. The borough is part of the Upper Perkiomen Valley, and is bordered by the townships of Upper Hanover, Marlborough, and Douglass. As of the 2010 census, the population of New Berlinville was 1,093.
History
New Berlinville was founded in 1741 by a group of German settlers from the Palatinate region of Germany. The settlers named the town after the city of Berlin, which was the capital of the Palatinate. The town was originally part of the township of Upper Hanover, but was incorporated as a borough in 1845.
The town was an important center of industry in the 19th century, with several mills and factories located in the area. The most prominent of these was the New Berlinville Woolen Mill, which was established in 1845 and operated until the early 20th century. The mill was a major employer in the area, and was responsible for the growth of the town.
Geography
New Berlinville is located at 40°20'N 75°37'W (40.33, -75.62). It is situated in the southeastern part of Montgomery County, approximately 25 miles northwest of Philadelphia. The borough is part of the Upper Perkiomen Valley, and is bordered by the townships of Upper Hanover, Marlborough, and Douglass.
The borough has a total area of 0.6 square miles, all of which is land. The terrain is mostly flat, with some rolling hills in the northern part of the borough. The borough is drained by the Perkiomen Creek, which flows through the center of town.
Economy
New Berlinville is a small, rural community with a limited economy. The town is home to several small businesses, including a grocery store, a hardware store, and a few restaurants. The town also has a few small manufacturing companies, including a metal fabrication shop and a printing company.
The town is also home to several farms, which produce a variety of crops, including corn, soybeans, and hay. The farms also raise livestock, including cows, pigs, and chickens.
Demographics
As of the 2010 census, the population of New Berlinville was 1,093. The racial makeup of the borough was 97.2% White, 0.7% African American, 0.2% Native American, 0.4% Asian, 0.2% from other races, and 1.3% from two or more races. Hispanic or Latino of any race were 1.3% of the population.
The median household income in New Berlinville was $50,938, and the median family income was $60,000. The per capita income was $25,938. About 4.3% of families and 5.7% of the population were below the poverty line, including 8.3% of those under age 18 and none of those age 65 or over.
Common Questions
What is Per Capita Income in New Berlinville?
Per Capita income in New Berlinville is $34,196.
What is the Median Family Income in New Berlinville?
Median Family Income in New Berlinville is $84,246.
What is the Median Household income in New Berlinville?
Median Household Income in New Berlinville is $83,254.
What is Income or Wage Gap in New Berlinville?
Income or Wage Gap in New Berlinville is 59.6%.
Women in New Berlinville earn 40.4 cents for every dollar earned by a man.
What is Inequality or Gini Index in New Berlinville?
Inequality or Gini Index in New Berlinville is 0.28.
What is the Total Population of New Berlinville?
Total Population of New Berlinville is 1,643.
What is the Total Male Population of New Berlinville?
Total Male Population of New Berlinville is 785.
What is the Total Female Population of New Berlinville?
Total Female Population of New Berlinville is 858.
What is the Ratio of Males per 100 Females in New Berlinville?
There are 91.49 Males per 100 Females in New Berlinville.
What is the Ratio of Females per 100 Males in New Berlinville?
There are 109.30 Females per 100 Males in New Berlinville.
What is the Median Population Age in New Berlinville?
Median Population Age in New Berlinville is 36.4 Years.
What is the Average Family Size in New Berlinville
Average Family Size in New Berlinville is 3.0 People.
What is the Average Household Size in New Berlinville
Average Household Size in New Berlinville is 2.5 People.
How Large is the Labor Force in New Berlinville?
There are 1,181 People in the Labor Forcein in New Berlinville.
What is the Percentage of People in the Labor Force in New Berlinville?
89.3% of People are in the Labor Force in New Berlinville.
What is the Unemployment Rate in New Berlinville?
Unemployment Rate in New Berlinville is 15.4%.