Laurel Mountain borough, PA Map & Demographics
Laurel Mountain borough Overview
$42,872
PER CAPITA INCOME
$94,250
AVG FAMILY INCOME
$55,000
AVG HOUSEHOLD INCOME
30.1%
WAGE / INCOME GAP [ % ]
69.9¢/ $1
WAGE / INCOME GAP [ $ ]
0.39
INEQUALITY / GINI INDEX
106
TOTAL POPULATION
51
MALE POPULATION
55
FEMALE POPULATION
92.73
MALES / 100 FEMALES
107.84
FEMALES / 100 MALES
50.2
MEDIAN AGE
2.6
AVG FAMILY SIZE
1.7
AVG HOUSEHOLD SIZE
65
LABOR FORCE [ PEOPLE ]
65.7%
PERCENT IN LABOR FORCE
7.7%
UNEMPLOYMENT RATE
Income in Laurel Mountain borough
Income Overview in Laurel Mountain borough
Per Capita Income in Laurel Mountain borough is $42,872, while median incomes of families and households are $94,250 and $55,000 respectively.
| Characteristic | Number | Measure |
| Per Capita Income | 106 | $42,872 |
| Median Family Income | 27 | $94,250 |
| Mean Family Income | 27 | $110,533 |
| Median Household Income | 64 | $55,000 |
| Mean Household Income | 64 | $71,641 |
| Income Deficit | 27 | $0 |
| Wage / Income Gap (%) | 106 | 30.08% |
| Wage / Income Gap ($) | 106 | 69.92¢ per $1 |
| Gini / Inequality Index | 106 | 0.39 |
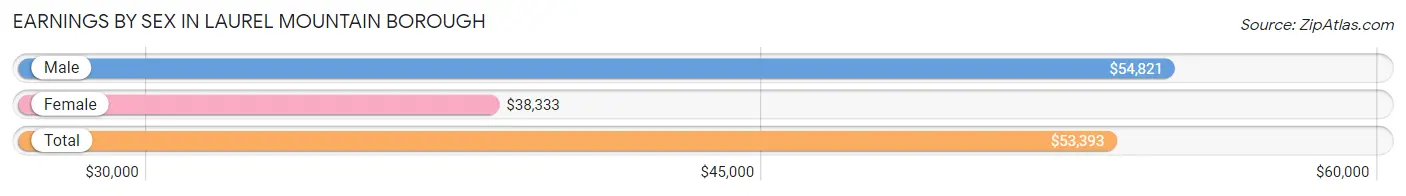
Earnings by Sex in Laurel Mountain borough
Average Earnings in Laurel Mountain borough are $53,393, $54,821 for men and $38,333 for women, a difference of 30.1%.
| Sex | Number | Average Earnings |
| Male | 37 (56.9%) | $54,821 |
| Female | 28 (43.1%) | $38,333 |
| Total | 65 (100.0%) | $53,393 |
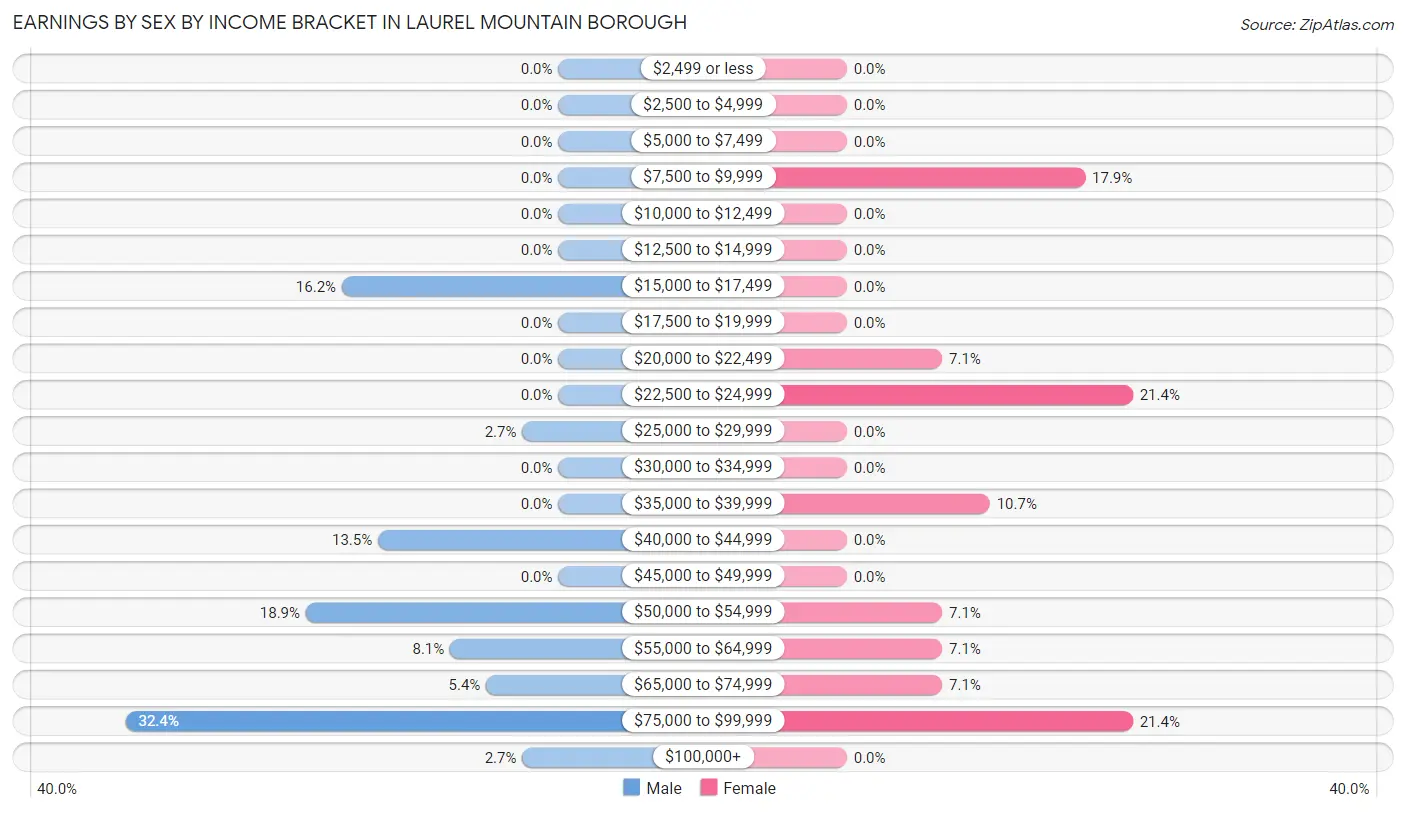
Earnings by Sex by Income Bracket in Laurel Mountain borough
The most common earnings brackets in Laurel Mountain borough are $75,000 to $99,999 for men (12 | 32.4%) and $22,500 to $24,999 for women (6 | 21.4%).
| Income | Male | Female |
| $2,499 or less | 0 (0.0%) | 0 (0.0%) |
| $2,500 to $4,999 | 0 (0.0%) | 0 (0.0%) |
| $5,000 to $7,499 | 0 (0.0%) | 0 (0.0%) |
| $7,500 to $9,999 | 0 (0.0%) | 5 (17.9%) |
| $10,000 to $12,499 | 0 (0.0%) | 0 (0.0%) |
| $12,500 to $14,999 | 0 (0.0%) | 0 (0.0%) |
| $15,000 to $17,499 | 6 (16.2%) | 0 (0.0%) |
| $17,500 to $19,999 | 0 (0.0%) | 0 (0.0%) |
| $20,000 to $22,499 | 0 (0.0%) | 2 (7.1%) |
| $22,500 to $24,999 | 0 (0.0%) | 6 (21.4%) |
| $25,000 to $29,999 | 1 (2.7%) | 0 (0.0%) |
| $30,000 to $34,999 | 0 (0.0%) | 0 (0.0%) |
| $35,000 to $39,999 | 0 (0.0%) | 3 (10.7%) |
| $40,000 to $44,999 | 5 (13.5%) | 0 (0.0%) |
| $45,000 to $49,999 | 0 (0.0%) | 0 (0.0%) |
| $50,000 to $54,999 | 7 (18.9%) | 2 (7.1%) |
| $55,000 to $64,999 | 3 (8.1%) | 2 (7.1%) |
| $65,000 to $74,999 | 2 (5.4%) | 2 (7.1%) |
| $75,000 to $99,999 | 12 (32.4%) | 6 (21.4%) |
| $100,000+ | 1 (2.7%) | 0 (0.0%) |
| Total | 37 (100.0%) | 28 (100.0%) |
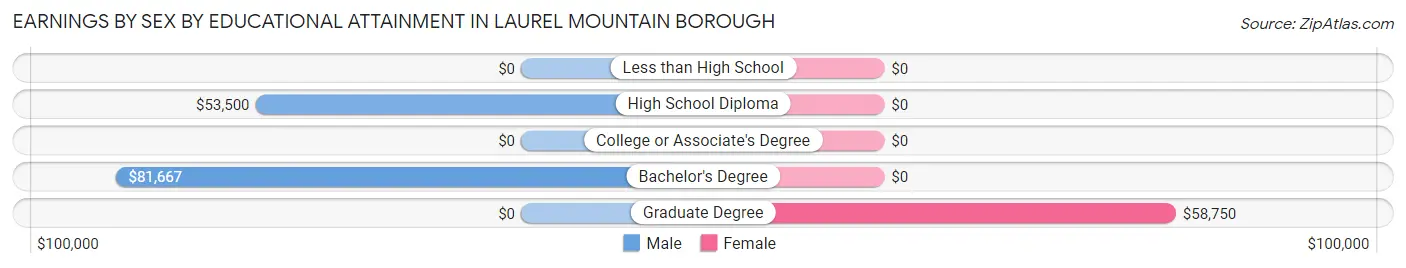
Earnings by Sex by Educational Attainment in Laurel Mountain borough
Average earnings in Laurel Mountain borough are $54,464 for men and $50,625 for women, a difference of 7.0%. Men with an educational attainment of bachelor's degree enjoy the highest average annual earnings of $81,667, while those with high school diploma education earn the least with $53,500. Women with an educational attainment of graduate degree earn the most with the average annual earnings of $58,750, while those with graduate degree education have the smallest earnings of $58,750.
| Educational Attainment | Male Income | Female Income |
| Less than High School | - | - |
| High School Diploma | $53,500 | $0 |
| College or Associate's Degree | - | - |
| Bachelor's Degree | $81,667 | $0 |
| Graduate Degree | - | - |
| Total | $54,464 | $50,625 |
Family Income in Laurel Mountain borough
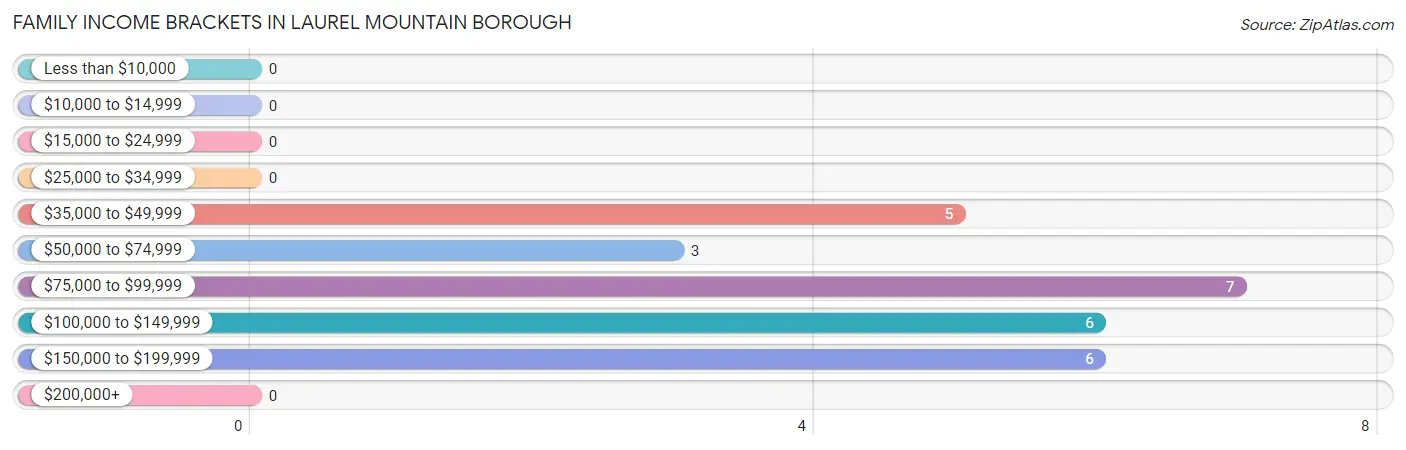
Family Income Brackets in Laurel Mountain borough
According to the Laurel Mountain borough family income data, there are 7 families falling into the $75,000 to $99,999 income range, which is the most common income bracket and makes up 25.9% of all families.
| Income Bracket | # Families | % Families |
| Less than $10,000 | 0 | 0.0% |
| $10,000 to $14,999 | 0 | 0.0% |
| $15,000 to $24,999 | 0 | 0.0% |
| $25,000 to $34,999 | 0 | 0.0% |
| $35,000 to $49,999 | 5 | 18.5% |
| $50,000 to $74,999 | 3 | 11.1% |
| $75,000 to $99,999 | 7 | 25.9% |
| $100,000 to $149,999 | 6 | 22.2% |
| $150,000 to $199,999 | 6 | 22.2% |
| $200,000+ | 0 | 0.0% |
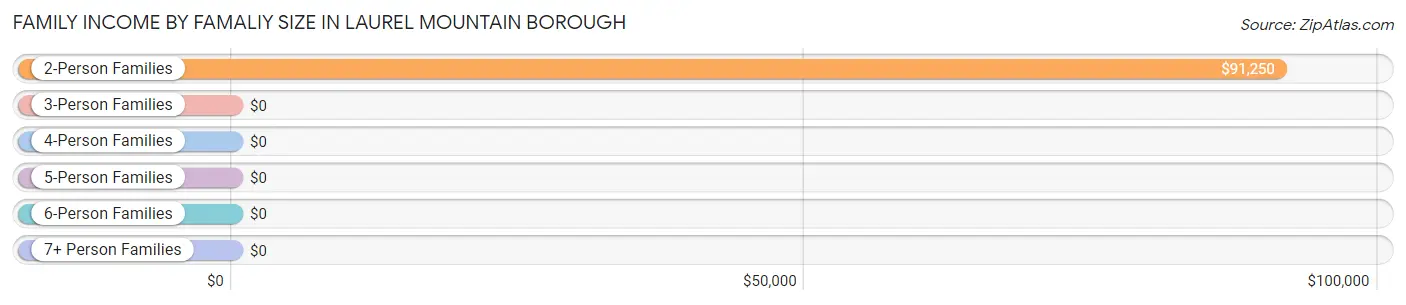
Family Income by Famaliy Size in Laurel Mountain borough
2-person families (19 | 70.4%) account for the highest median family income in Laurel Mountain borough with $91,250 per family, while 2-person families (19 | 70.4%) have the highest median income of $45,625 per family member.
| Income Bracket | # Families | Median Income |
| 2-Person Families | 19 (70.4%) | $91,250 |
| 3-Person Families | 6 (22.2%) | $0 |
| 4-Person Families | 0 (0.0%) | $0 |
| 5-Person Families | 2 (7.4%) | $0 |
| 6-Person Families | 0 (0.0%) | $0 |
| 7+ Person Families | 0 (0.0%) | $0 |
| Total | 27 (100.0%) | $94,250 |
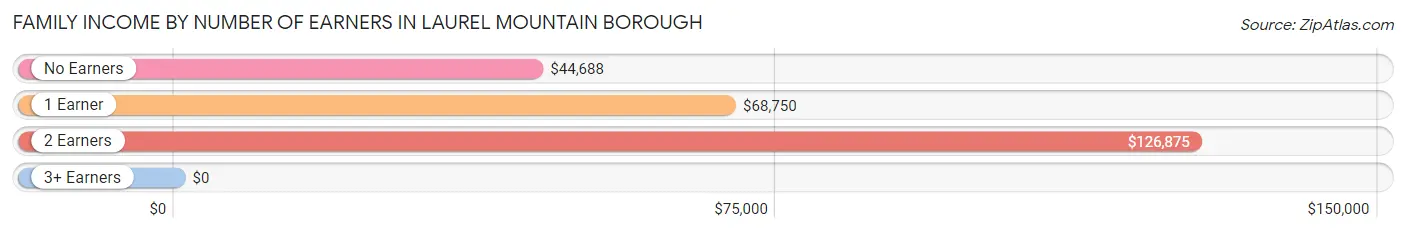
Family Income by Number of Earners in Laurel Mountain borough
| Number of Earners | # Families | Median Income |
| No Earners | 7 (25.9%) | $44,688 |
| 1 Earner | 3 (11.1%) | $68,750 |
| 2 Earners | 13 (48.1%) | $126,875 |
| 3+ Earners | 4 (14.8%) | $0 |
| Total | 27 (100.0%) | $94,250 |
Household Income in Laurel Mountain borough
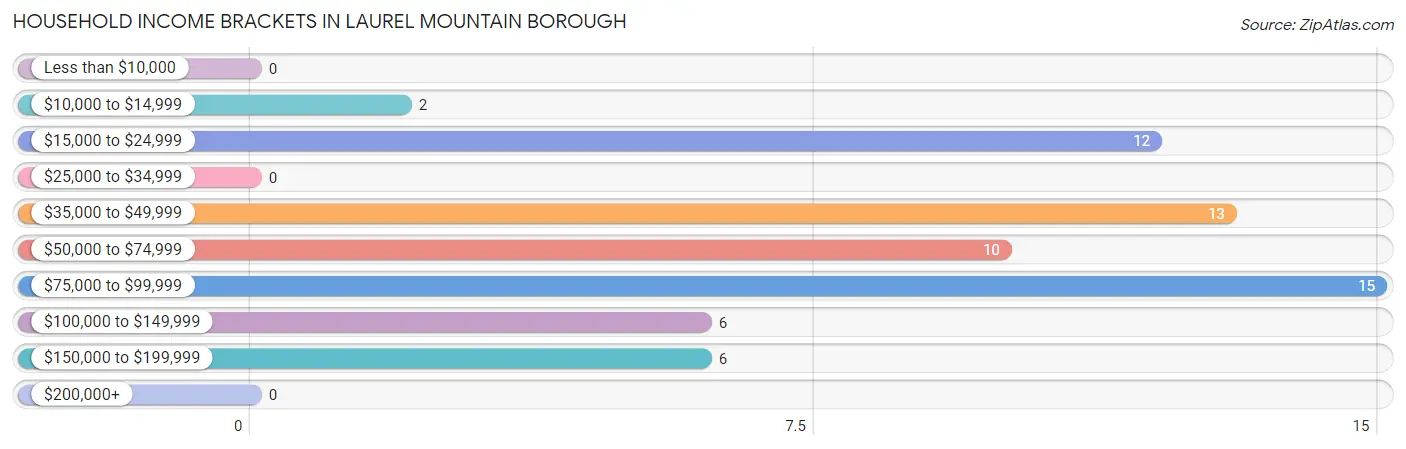
Household Income Brackets in Laurel Mountain borough
With 15 households falling in the category, the $75,000 to $99,999 income range is the most frequent in Laurel Mountain borough, accounting for 23.4% of all households.
| Income Bracket | # Households | % Households |
| Less than $10,000 | 0 | 0.0% |
| $10,000 to $14,999 | 2 | 3.1% |
| $15,000 to $24,999 | 12 | 18.8% |
| $25,000 to $34,999 | 0 | 0.0% |
| $35,000 to $49,999 | 13 | 20.3% |
| $50,000 to $74,999 | 10 | 15.6% |
| $75,000 to $99,999 | 15 | 23.4% |
| $100,000 to $149,999 | 6 | 9.4% |
| $150,000 to $199,999 | 6 | 9.4% |
| $200,000+ | 0 | 0.0% |
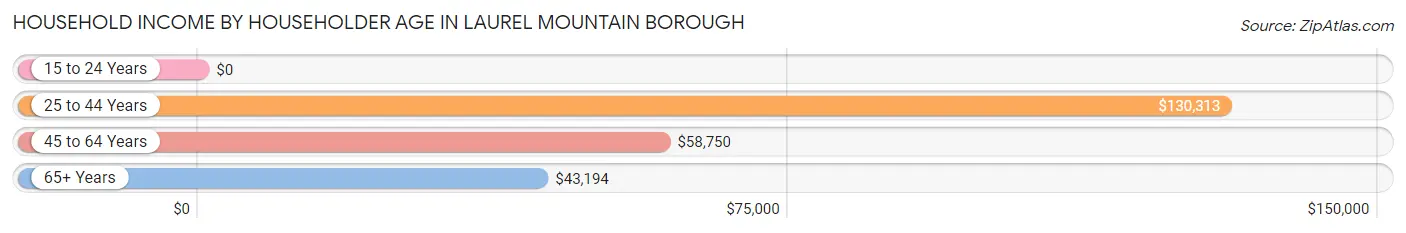
Household Income by Householder Age in Laurel Mountain borough
The median household income in Laurel Mountain borough is $55,000, with the highest median household income of $130,313 found in the 25 to 44 years age bracket for the primary householder. A total of 11 households (17.2%) fall into this category.
| Income Bracket | # Households | Median Income |
| 15 to 24 Years | 0 (0.0%) | $0 |
| 25 to 44 Years | 11 (17.2%) | $130,313 |
| 45 to 64 Years | 32 (50.0%) | $58,750 |
| 65+ Years | 21 (32.8%) | $43,194 |
| Total | 64 (100.0%) | $55,000 |
Poverty in Laurel Mountain borough
Income Below Poverty by Sex and Age in Laurel Mountain borough
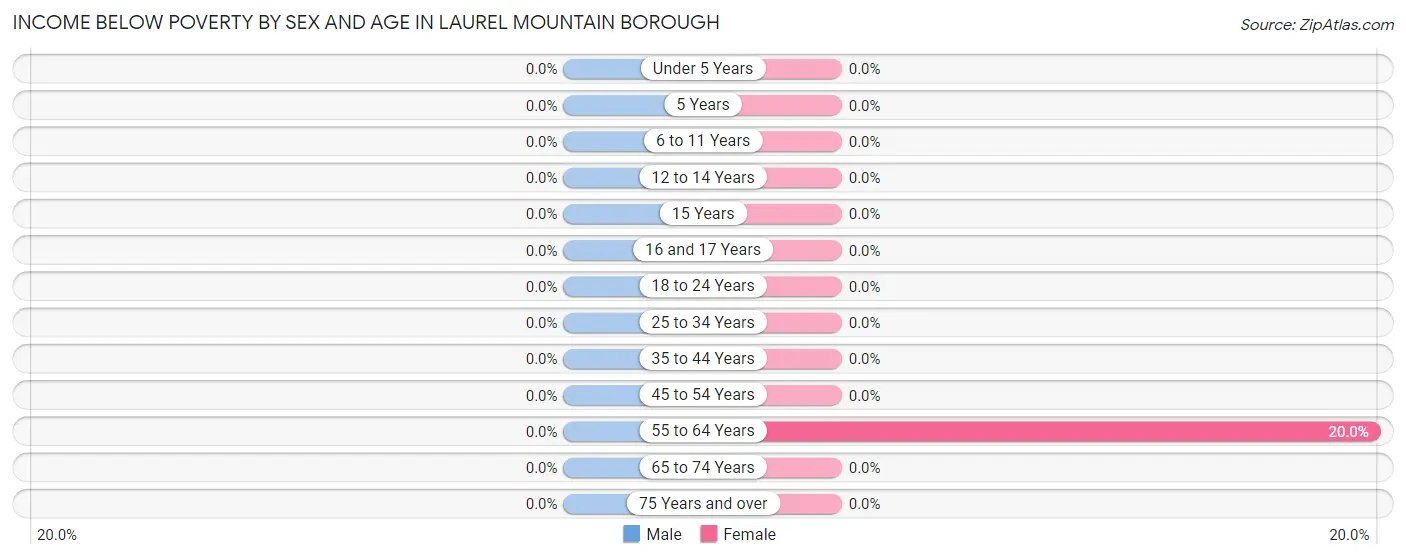
| Age Bracket | Male | Female |
| Under 5 Years | 0 (0.0%) | 0 (0.0%) |
| 5 Years | 0 (0.0%) | 0 (0.0%) |
| 6 to 11 Years | 0 (0.0%) | 0 (0.0%) |
| 12 to 14 Years | 0 (0.0%) | 0 (0.0%) |
| 15 Years | 0 (0.0%) | 0 (0.0%) |
| 16 and 17 Years | 0 (0.0%) | 0 (0.0%) |
| 18 to 24 Years | 0 (0.0%) | 0 (0.0%) |
| 25 to 34 Years | 0 (0.0%) | 0 (0.0%) |
| 35 to 44 Years | 0 (0.0%) | 0 (0.0%) |
| 45 to 54 Years | 0 (0.0%) | 0 (0.0%) |
| 55 to 64 Years | 0 (0.0%) | 2 (20.0%) |
| 65 to 74 Years | 0 (0.0%) | 0 (0.0%) |
| 75 Years and over | 0 (0.0%) | 0 (0.0%) |
| Total | 0 (0.0%) | 2 (3.6%) |
Income Above Poverty by Sex and Age in Laurel Mountain borough
According to the poverty statistics in Laurel Mountain borough, males aged under 5 years and females aged under 5 years are the age groups that are most secure financially, with 100.0% of males and 100.0% of females in these age groups living above the poverty line.
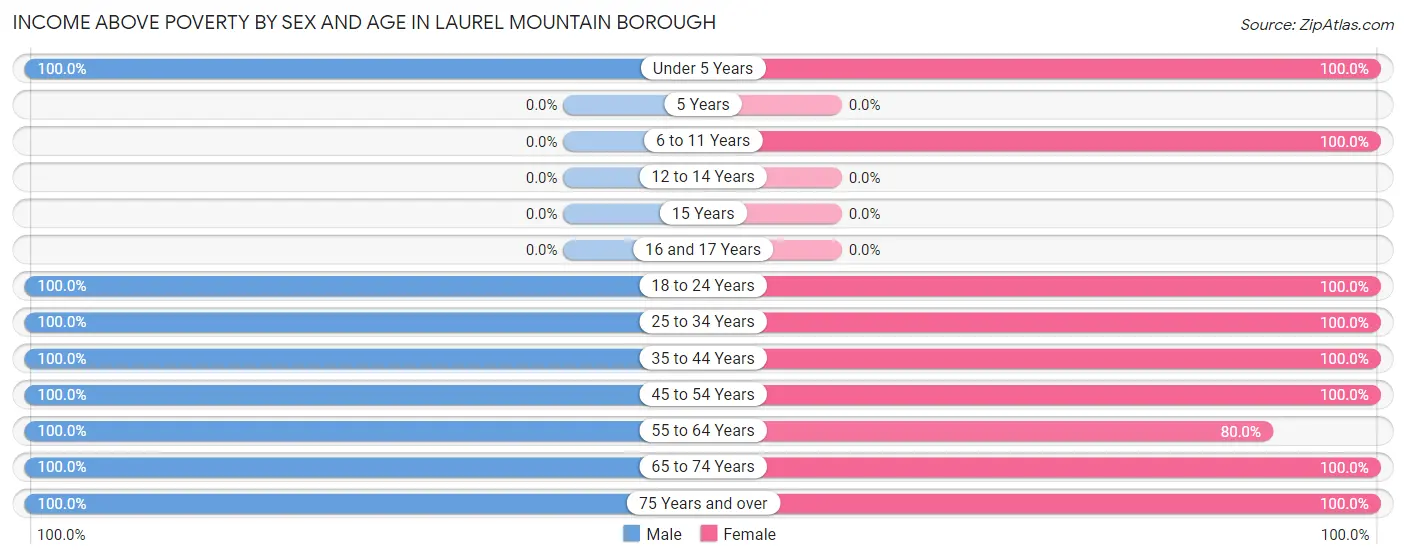
| Age Bracket | Male | Female |
| Under 5 Years | 2 (100.0%) | 3 (100.0%) |
| 5 Years | 0 (0.0%) | 0 (0.0%) |
| 6 to 11 Years | 0 (0.0%) | 2 (100.0%) |
| 12 to 14 Years | 0 (0.0%) | 0 (0.0%) |
| 15 Years | 0 (0.0%) | 0 (0.0%) |
| 16 and 17 Years | 0 (0.0%) | 0 (0.0%) |
| 18 to 24 Years | 2 (100.0%) | 5 (100.0%) |
| 25 to 34 Years | 7 (100.0%) | 4 (100.0%) |
| 35 to 44 Years | 7 (100.0%) | 2 (100.0%) |
| 45 to 54 Years | 19 (100.0%) | 10 (100.0%) |
| 55 to 64 Years | 1 (100.0%) | 8 (80.0%) |
| 65 to 74 Years | 7 (100.0%) | 13 (100.0%) |
| 75 Years and over | 6 (100.0%) | 6 (100.0%) |
| Total | 51 (100.0%) | 53 (96.4%) |
Income Below Poverty Among Married-Couple Families in Laurel Mountain borough
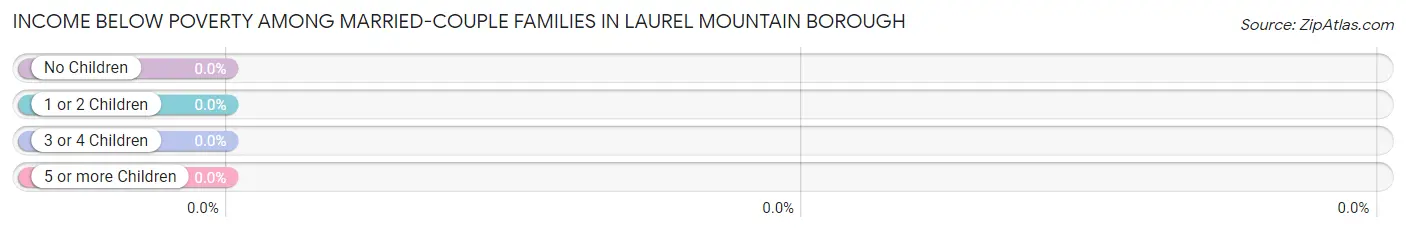
| Children | Above Poverty | Below Poverty |
| No Children | 16 (100.0%) | 0 (0.0%) |
| 1 or 2 Children | 2 (100.0%) | 0 (0.0%) |
| 3 or 4 Children | 2 (100.0%) | 0 (0.0%) |
| 5 or more Children | 0 (0.0%) | 0 (0.0%) |
| Total | 20 (100.0%) | 0 (0.0%) |
Income Below Poverty Among Single-Parent Households in Laurel Mountain borough
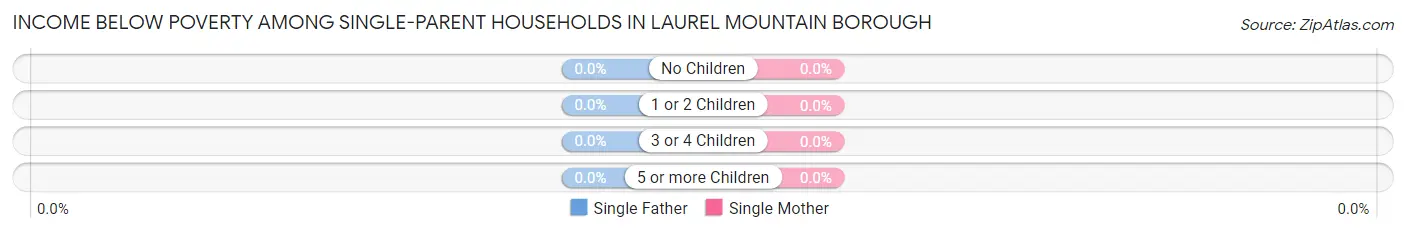
| Children | Single Father | Single Mother |
| No Children | 0 (0.0%) | 0 (0.0%) |
| 1 or 2 Children | 0 (0.0%) | 0 (0.0%) |
| 3 or 4 Children | 0 (0.0%) | 0 (0.0%) |
| 5 or more Children | 0 (0.0%) | 0 (0.0%) |
| Total | 0 (0.0%) | 0 (0.0%) |
Income Below Poverty Among Married-Couple vs Single-Parent Households in Laurel Mountain borough
| Children | Married-Couple Families | Single-Parent Households |
| No Children | 0 (0.0%) | 0 (0.0%) |
| 1 or 2 Children | 0 (0.0%) | 0 (0.0%) |
| 3 or 4 Children | 0 (0.0%) | 0 (0.0%) |
| 5 or more Children | 0 (0.0%) | 0 (0.0%) |
| Total | 0 (0.0%) | 0 (0.0%) |
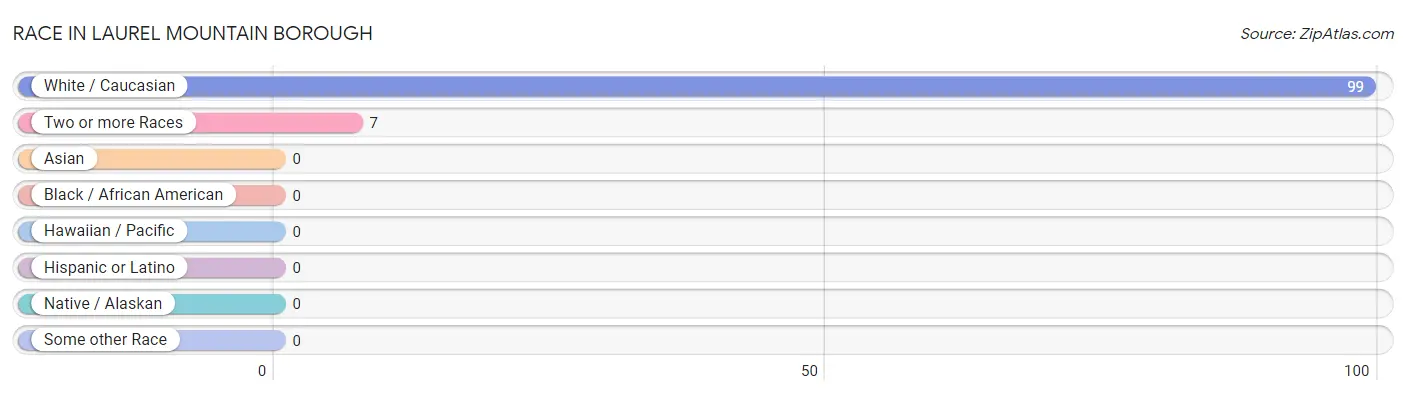
Race in Laurel Mountain borough
The most populous races in Laurel Mountain borough are White / Caucasian (99 | 93.4%), and Two or more Races (7 | 6.6%).
| Race | # Population | % Population |
| Asian | 0 | 0.0% |
| Black / African American | 0 | 0.0% |
| Hawaiian / Pacific | 0 | 0.0% |
| Hispanic or Latino | 0 | 0.0% |
| Native / Alaskan | 0 | 0.0% |
| White / Caucasian | 99 | 93.4% |
| Two or more Races | 7 | 6.6% |
| Some other Race | 0 | 0.0% |
| Total | 106 | 100.0% |
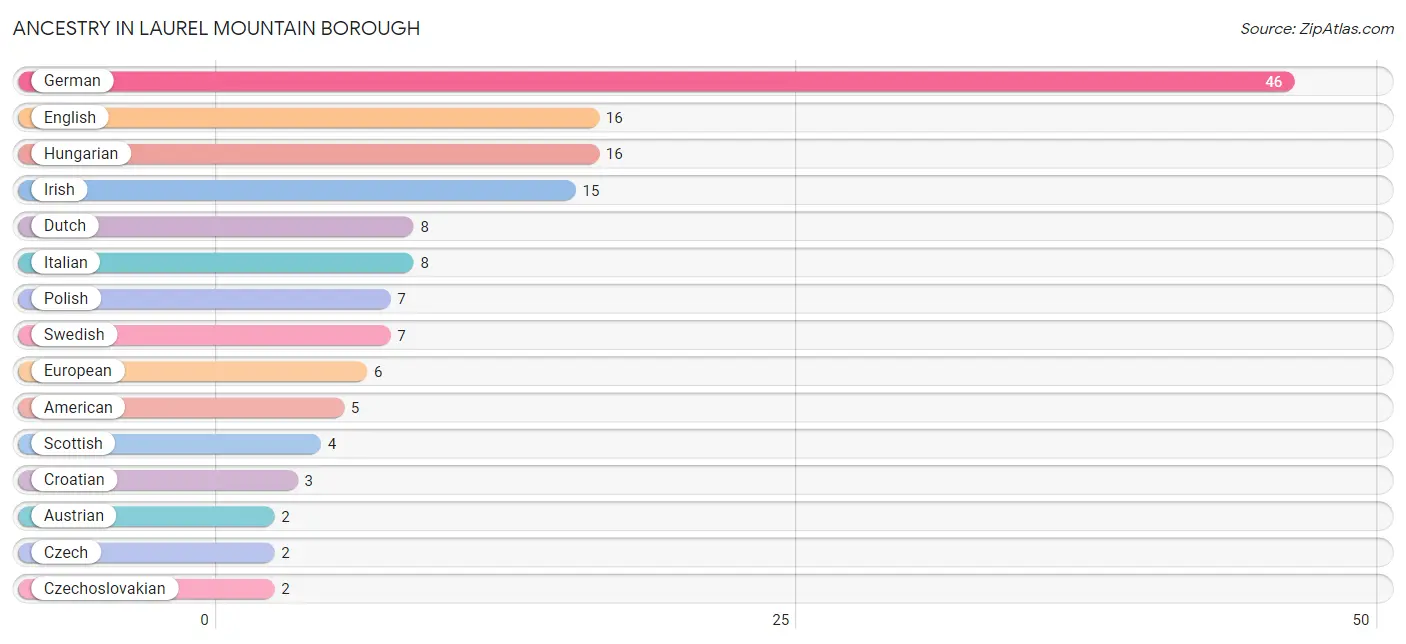
Ancestry in Laurel Mountain borough
The most populous ancestries reported in Laurel Mountain borough are German (46 | 43.4%), English (16 | 15.1%), Hungarian (16 | 15.1%), Irish (15 | 14.1%), and Dutch (8 | 7.5%), together accounting for 95.3% of all Laurel Mountain borough residents.
| Ancestry | # Population | % Population |
| American | 5 | 4.7% |
| Austrian | 2 | 1.9% |
| Croatian | 3 | 2.8% |
| Czech | 2 | 1.9% |
| Czechoslovakian | 2 | 1.9% |
| Dutch | 8 | 7.5% |
| Eastern European | 2 | 1.9% |
| English | 16 | 15.1% |
| European | 6 | 5.7% |
| German | 46 | 43.4% |
| Hungarian | 16 | 15.1% |
| Irish | 15 | 14.1% |
| Italian | 8 | 7.5% |
| Polish | 7 | 6.6% |
| Scotch-Irish | 2 | 1.9% |
| Scottish | 4 | 3.8% |
| Swedish | 7 | 6.6% |
| Welsh | 2 | 1.9% | View All 18 Rows |
Immigrants in Laurel Mountain borough

| Immigration Origin | # Population | % Population | View All 0 Rows |
Sex and Age in Laurel Mountain borough
Sex and Age in Laurel Mountain borough
The most populous age groups in Laurel Mountain borough are 50 to 54 Years (11 | 21.6%) for men and 45 to 49 Years (10 | 18.2%) for women.
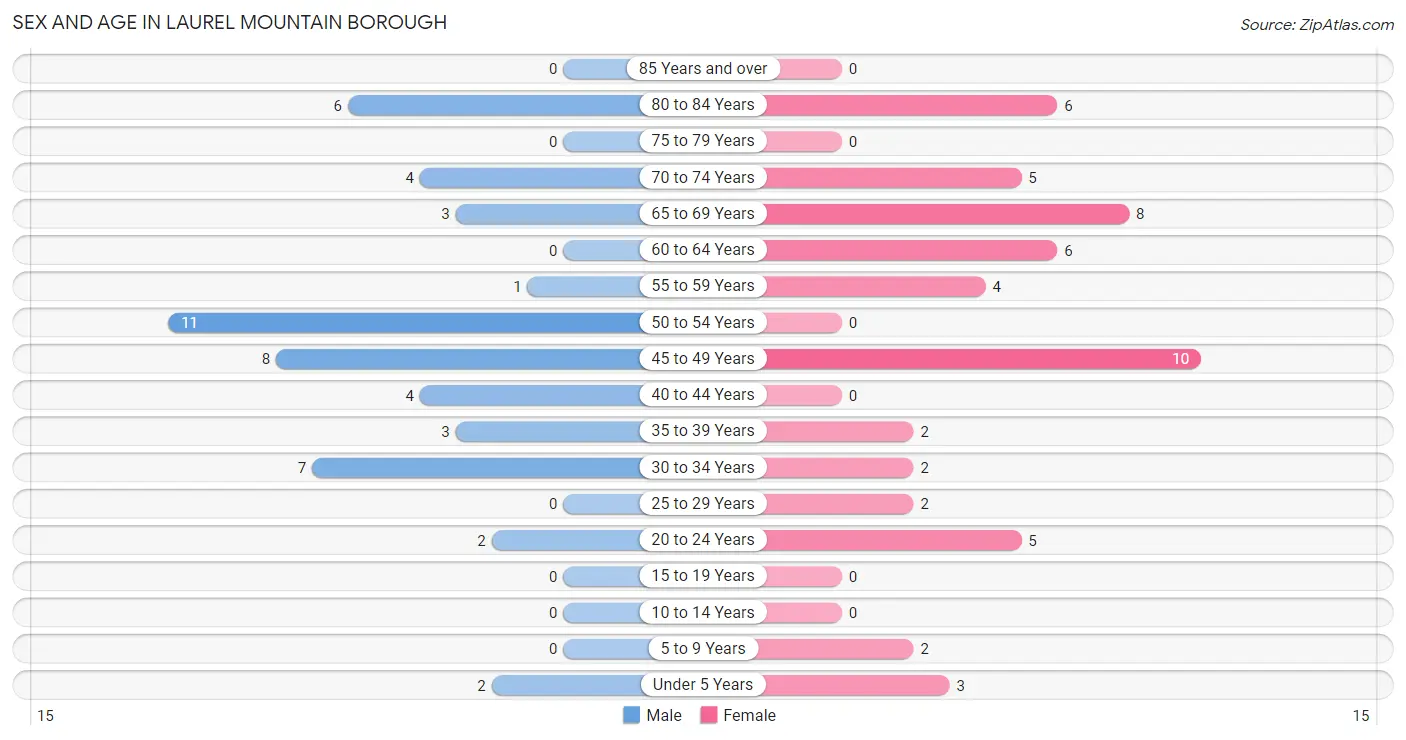
| Age Bracket | Male | Female |
| Under 5 Years | 2 (3.9%) | 3 (5.4%) |
| 5 to 9 Years | 0 (0.0%) | 2 (3.6%) |
| 10 to 14 Years | 0 (0.0%) | 0 (0.0%) |
| 15 to 19 Years | 0 (0.0%) | 0 (0.0%) |
| 20 to 24 Years | 2 (3.9%) | 5 (9.1%) |
| 25 to 29 Years | 0 (0.0%) | 2 (3.6%) |
| 30 to 34 Years | 7 (13.7%) | 2 (3.6%) |
| 35 to 39 Years | 3 (5.9%) | 2 (3.6%) |
| 40 to 44 Years | 4 (7.8%) | 0 (0.0%) |
| 45 to 49 Years | 8 (15.7%) | 10 (18.2%) |
| 50 to 54 Years | 11 (21.6%) | 0 (0.0%) |
| 55 to 59 Years | 1 (2.0%) | 4 (7.3%) |
| 60 to 64 Years | 0 (0.0%) | 6 (10.9%) |
| 65 to 69 Years | 3 (5.9%) | 8 (14.5%) |
| 70 to 74 Years | 4 (7.8%) | 5 (9.1%) |
| 75 to 79 Years | 0 (0.0%) | 0 (0.0%) |
| 80 to 84 Years | 6 (11.8%) | 6 (10.9%) |
| 85 Years and over | 0 (0.0%) | 0 (0.0%) |
| Total | 51 (100.0%) | 55 (100.0%) |
Families and Households in Laurel Mountain borough
Median Family Size in Laurel Mountain borough
The median family size in Laurel Mountain borough is 2.56 persons per family, with single female/mother families (1 | 3.7%) accounting for the largest median family size of 3 persons per family. On the other hand, single male/father families (6 | 22.2%) represent the smallest median family size with 2.33 persons per family.
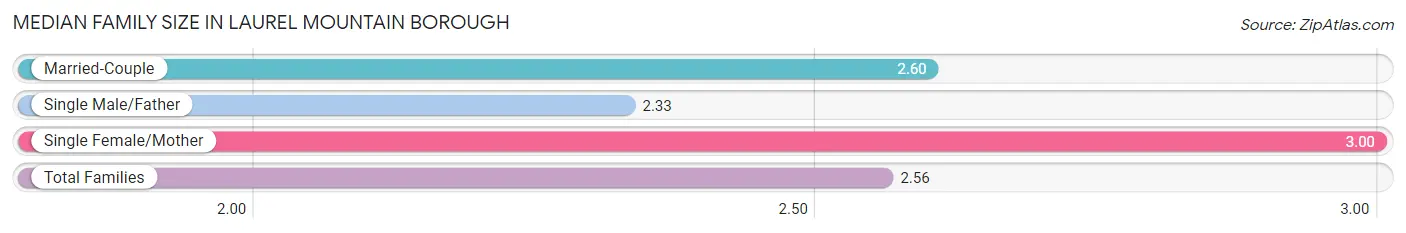
| Family Type | # Families | Family Size |
| Married-Couple | 20 (74.1%) | 2.60 |
| Single Male/Father | 6 (22.2%) | 2.33 |
| Single Female/Mother | 1 (3.7%) | 3.00 |
| Total Families | 27 (100.0%) | 2.56 |
Median Household Size in Laurel Mountain borough
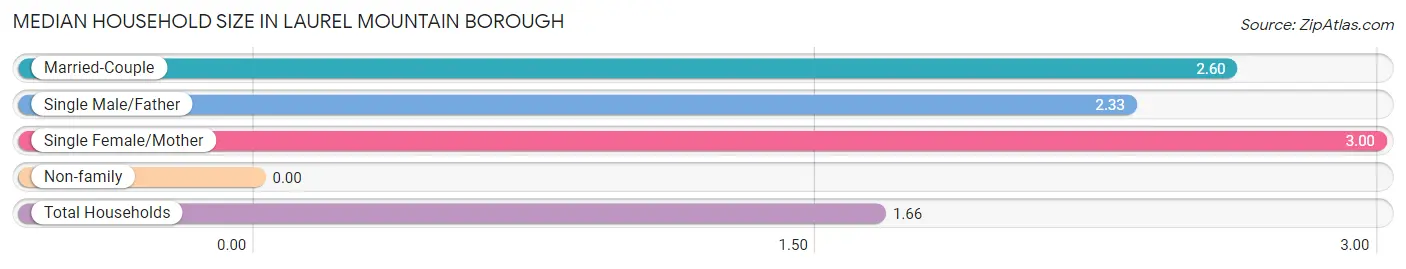
| Household Type | # Households | Household Size |
| Married-Couple | 20 (31.2%) | 2.60 |
| Single Male/Father | 6 (9.4%) | 2.33 |
| Single Female/Mother | 1 (1.6%) | 3.00 |
| Non-family | 37 (57.8%) | - |
| Total Households | 64 (100.0%) | 1.66 |
Household Size by Marriage Status in Laurel Mountain borough
Out of a total of 64 households in Laurel Mountain borough, 27 (42.2%) are family households, while 37 (57.8%) are nonfamily households. The most numerous type of family households are 2-person households, comprising 19, and the most common type of nonfamily households are 1-person households, comprising 37.
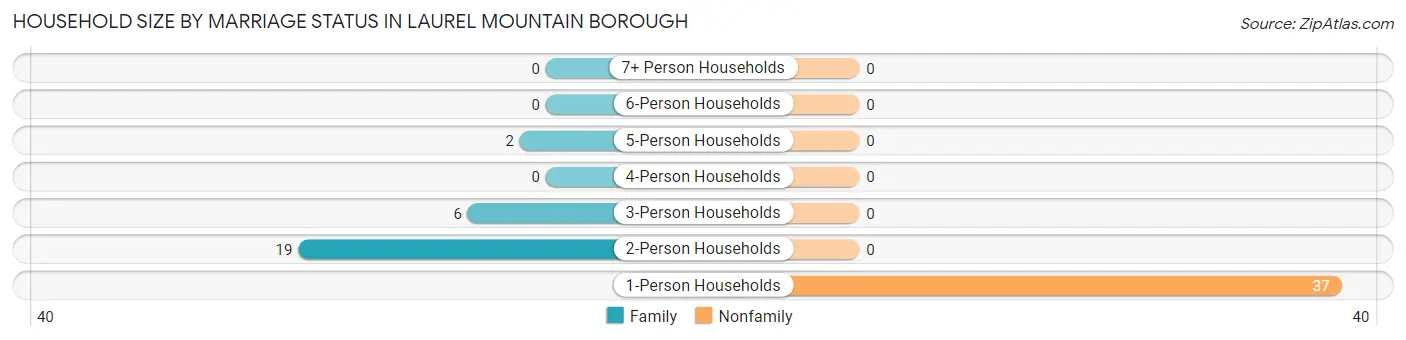
| Household Size | Family Households | Nonfamily Households |
| 1-Person Households | - | 37 (57.8%) |
| 2-Person Households | 19 (29.7%) | 0 (0.0%) |
| 3-Person Households | 6 (9.4%) | 0 (0.0%) |
| 4-Person Households | 0 (0.0%) | 0 (0.0%) |
| 5-Person Households | 2 (3.1%) | 0 (0.0%) |
| 6-Person Households | 0 (0.0%) | 0 (0.0%) |
| 7+ Person Households | 0 (0.0%) | 0 (0.0%) |
| Total | 27 (42.2%) | 37 (57.8%) |
Female Fertility in Laurel Mountain borough
Fertility by Age in Laurel Mountain borough
Average fertility rate in Laurel Mountain borough is 95.0 births per 1,000 women. Women in the age bracket of 20 to 34 years have the highest fertility rate with 222.0 births per 1,000 women. Women in the age bracket of 20 to 34 years acount for 100.0% of all women with births.
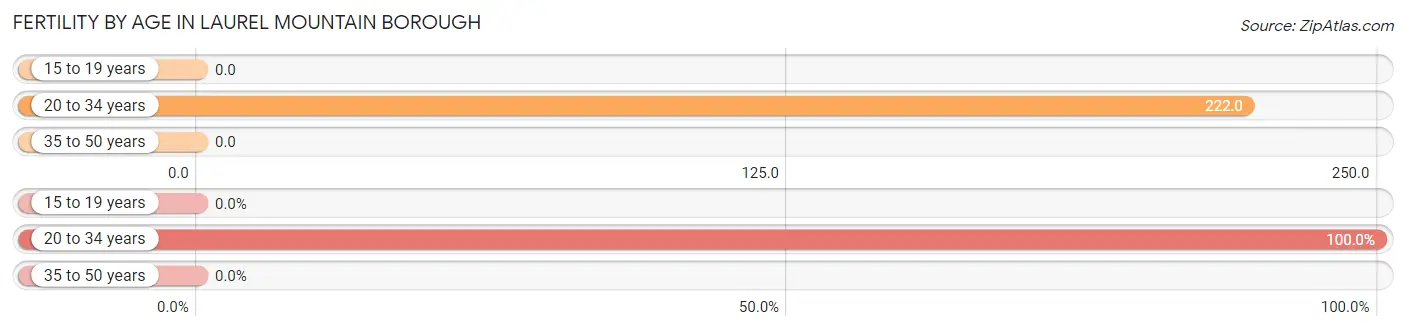
| Age Bracket | Women with Births | Births / 1,000 Women |
| 15 to 19 years | 0 (0.0%) | 0.0 |
| 20 to 34 years | 2 (100.0%) | 222.0 |
| 35 to 50 years | 0 (0.0%) | 0.0 |
| Total | 2 (100.0%) | 95.0 |
Fertility by Age by Marriage Status in Laurel Mountain borough
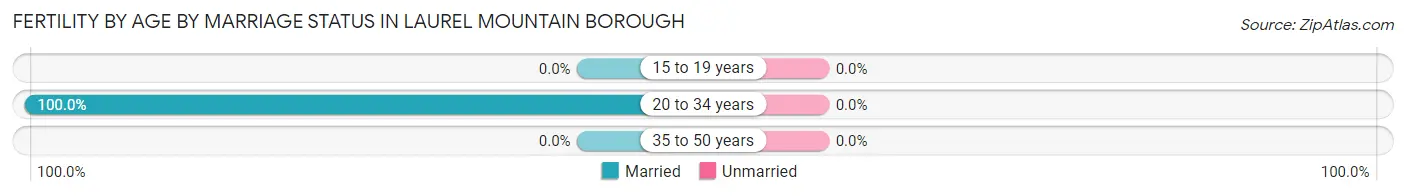
| Age Bracket | Married | Unmarried |
| 15 to 19 years | 0 (0.0%) | 0 (0.0%) |
| 20 to 34 years | 2 (100.0%) | 0 (0.0%) |
| 35 to 50 years | 0 (0.0%) | 0 (0.0%) |
| Total | 2 (100.0%) | 0 (0.0%) |
Fertility by Education in Laurel Mountain borough
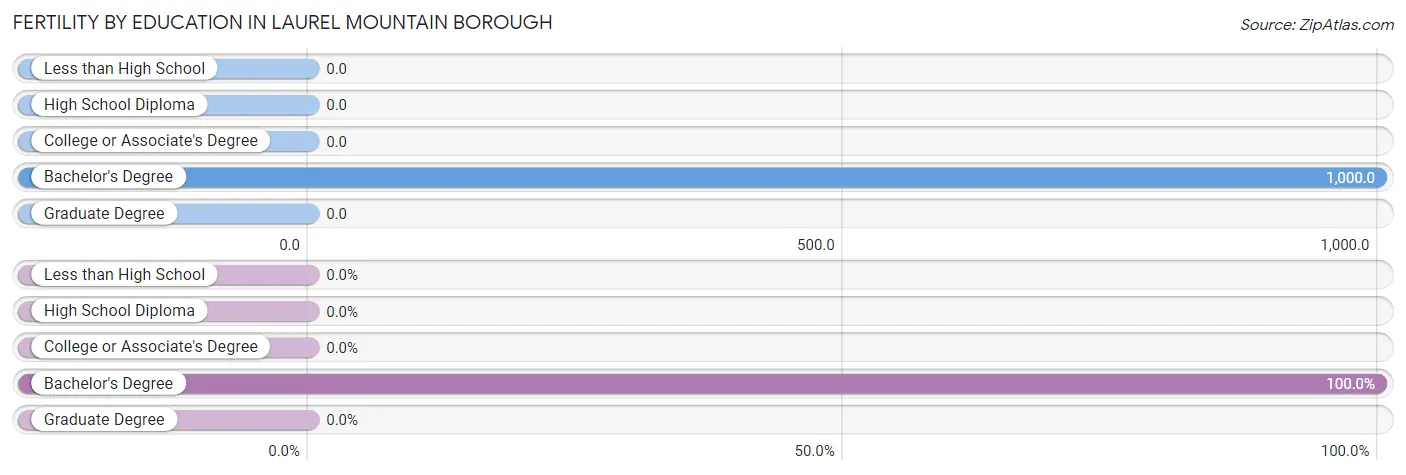
| Educational Attainment | Women with Births | Births / 1,000 Women |
| Less than High School | 0 (0.0%) | 0.0 |
| High School Diploma | 0 (0.0%) | 0.0 |
| College or Associate's Degree | 0 (0.0%) | 0.0 |
| Bachelor's Degree | 2 (100.0%) | 1,000.0 |
| Graduate Degree | 0 (0.0%) | 0.0 |
| Total | 2 (100.0%) | 95.0 |
Fertility by Education by Marriage Status in Laurel Mountain borough
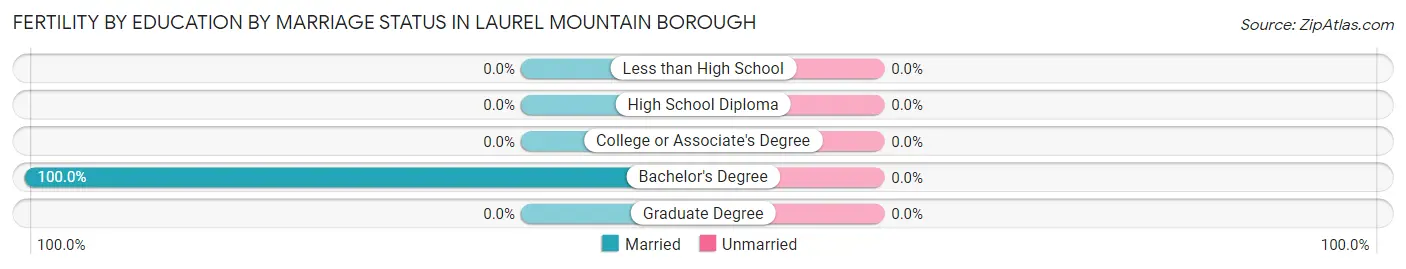
| Educational Attainment | Married | Unmarried |
| Less than High School | 0 (0.0%) | 0 (0.0%) |
| High School Diploma | 0 (0.0%) | 0 (0.0%) |
| College or Associate's Degree | 0 (0.0%) | 0 (0.0%) |
| Bachelor's Degree | 2 (100.0%) | 0 (0.0%) |
| Graduate Degree | 0 (0.0%) | 0 (0.0%) |
| Total | 2 (100.0%) | 0 (0.0%) |
Employment Characteristics in Laurel Mountain borough
Employment by Class of Employer in Laurel Mountain borough
Among the 60 employed individuals in Laurel Mountain borough, private company employees (48 | 80.0%), self-employed (not incorporated) (6 | 10.0%), and not-for-profit organizations (6 | 10.0%) make up the most common classes of employment.
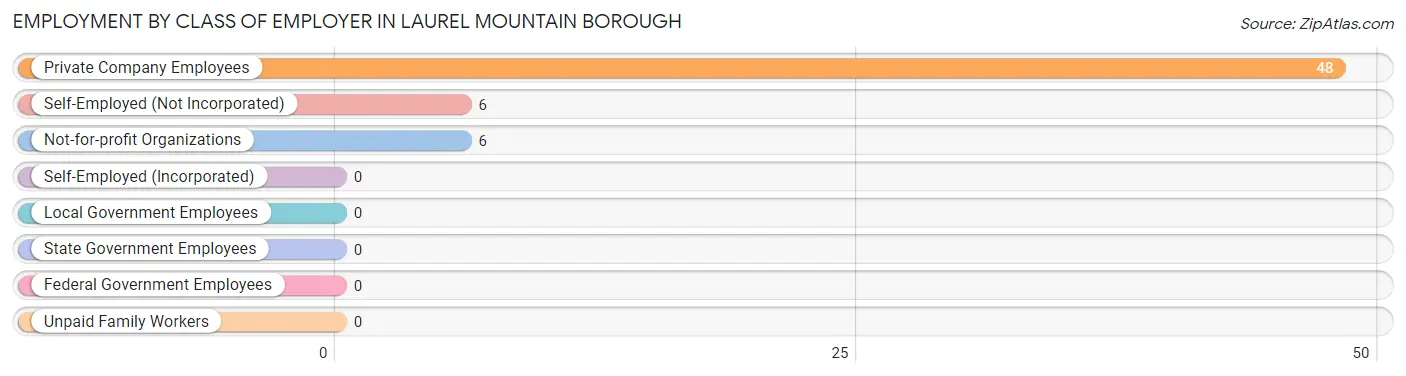
| Employer Class | # Employees | % Employees |
| Private Company Employees | 48 | 80.0% |
| Self-Employed (Incorporated) | 0 | 0.0% |
| Self-Employed (Not Incorporated) | 6 | 10.0% |
| Not-for-profit Organizations | 6 | 10.0% |
| Local Government Employees | 0 | 0.0% |
| State Government Employees | 0 | 0.0% |
| Federal Government Employees | 0 | 0.0% |
| Unpaid Family Workers | 0 | 0.0% |
| Total | 60 | 100.0% |
Employment Status by Age in Laurel Mountain borough
According to the labor force statistics for Laurel Mountain borough, out of the total population over 16 years of age (99), 65.7% or 65 individuals are in the labor force, with 7.7% or 5 of them unemployed. The age group with the highest labor force participation rate is 20 to 24 years, with 100.0% or 7 individuals in the labor force. Within the labor force, the 30 to 34 years age range has the highest percentage of unemployed individuals, with 55.6% or 5 of them being unemployed.
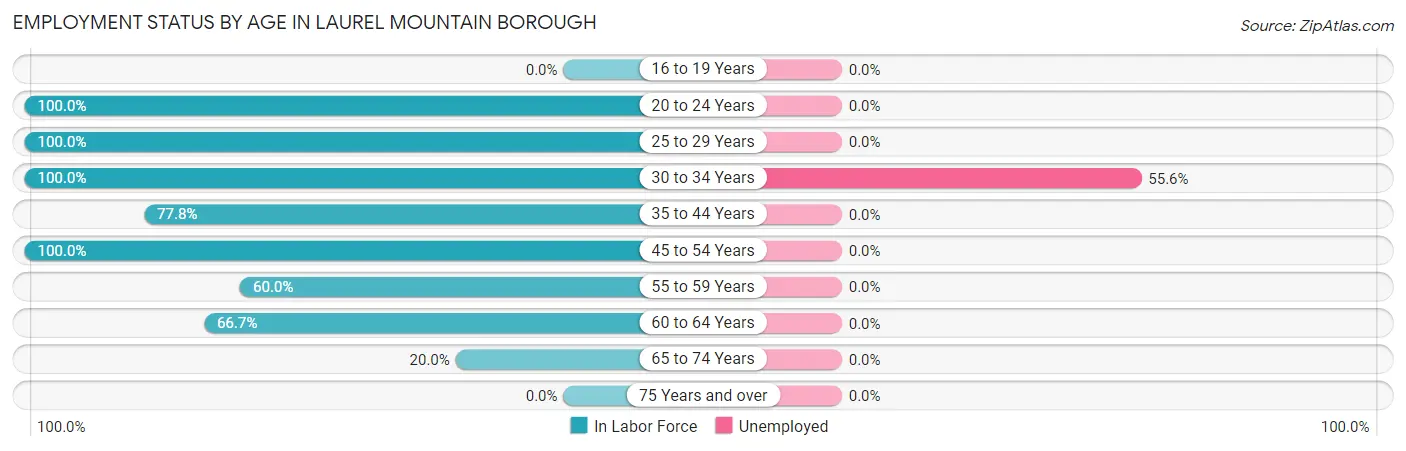
| Age Bracket | In Labor Force | Unemployed |
| 16 to 19 Years | 0 (0.0%) | 0 (0.0%) |
| 20 to 24 Years | 7 (100.0%) | 0 (0.0%) |
| 25 to 29 Years | 2 (100.0%) | 0 (0.0%) |
| 30 to 34 Years | 9 (100.0%) | 5 (55.6%) |
| 35 to 44 Years | 7 (77.8%) | 0 (0.0%) |
| 45 to 54 Years | 29 (100.0%) | 0 (0.0%) |
| 55 to 59 Years | 3 (60.0%) | 0 (0.0%) |
| 60 to 64 Years | 4 (66.7%) | 0 (0.0%) |
| 65 to 74 Years | 4 (20.0%) | 0 (0.0%) |
| 75 Years and over | 0 (0.0%) | 0 (0.0%) |
| Total | 65 (65.7%) | 5 (7.7%) |
Employment Status by Educational Attainment in Laurel Mountain borough
According to labor force statistics for Laurel Mountain borough, 90.0% of individuals (54) out of the total population between 25 and 64 years of age (60) are in the labor force, with 9.3% or 5 of them being unemployed. The group with the highest labor force participation rate are those with the educational attainment of bachelor's degree or higher, with 91.7% or 22 individuals in the labor force. Within the labor force, individuals with high school diploma education have the highest percentage of unemployment, with 35.7% or 5 of them being unemployed.
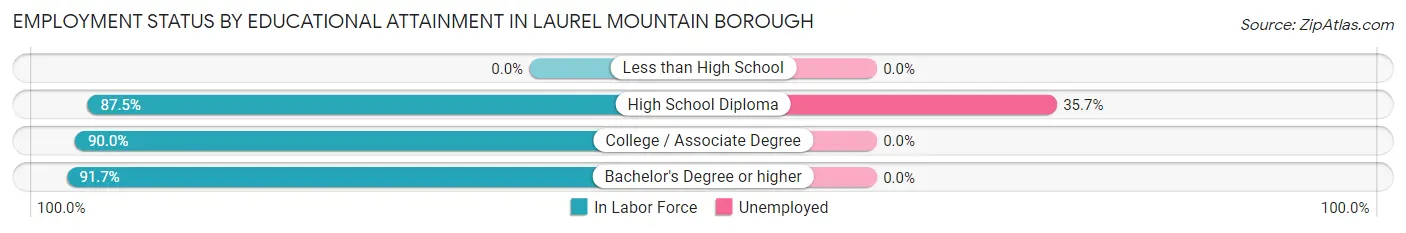
| Educational Attainment | In Labor Force | Unemployed |
| Less than High School | 0 (0.0%) | 0 (0.0%) |
| High School Diploma | 14 (87.5%) | 6 (35.7%) |
| College / Associate Degree | 18 (90.0%) | 0 (0.0%) |
| Bachelor's Degree or higher | 22 (91.7%) | 0 (0.0%) |
| Total | 54 (90.0%) | 6 (9.3%) |
Employment Occupations by Sex in Laurel Mountain borough
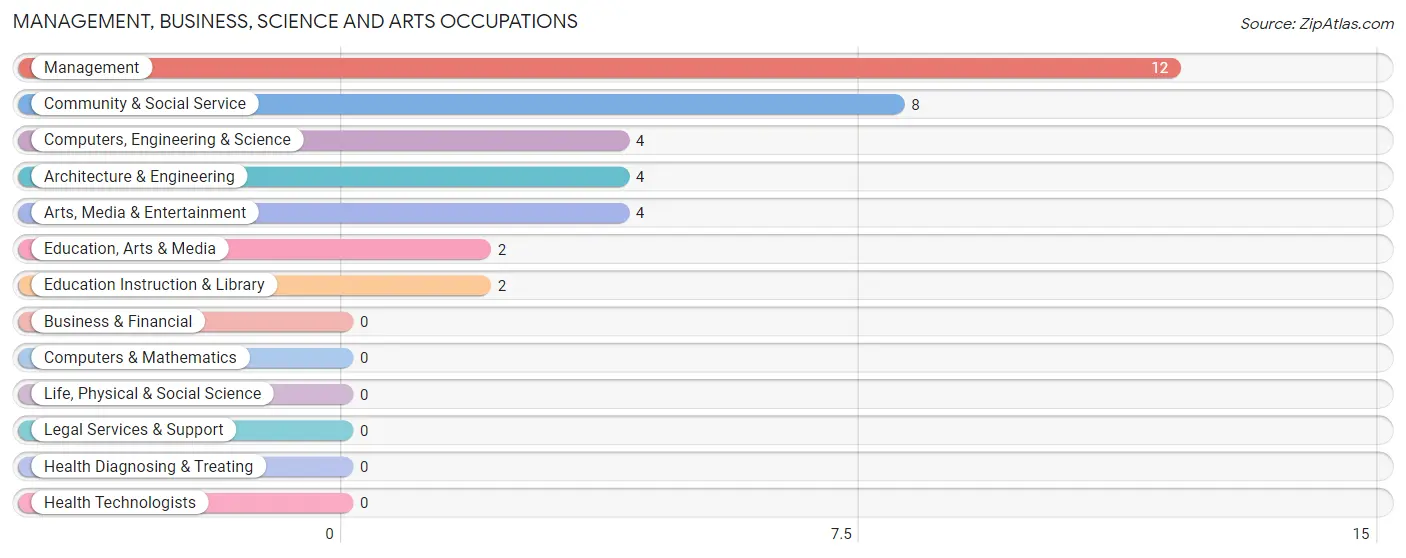
Management, Business, Science and Arts Occupations
The most common Management, Business, Science and Arts occupations in Laurel Mountain borough are Management (12 | 20.0%), Community & Social Service (8 | 13.3%), Computers, Engineering & Science (4 | 6.7%), Architecture & Engineering (4 | 6.7%), and Arts, Media & Entertainment (4 | 6.7%).
Management, Business, Science and Arts Occupations by Sex
Within the Management, Business, Science and Arts occupations in Laurel Mountain borough, the most male-oriented occupations are Computers, Engineering & Science (100.0%), Architecture & Engineering (100.0%), and Education Instruction & Library (100.0%), while the most female-oriented occupations are Education, Arts & Media (100.0%), Management (83.3%), and Community & Social Service (50.0%).
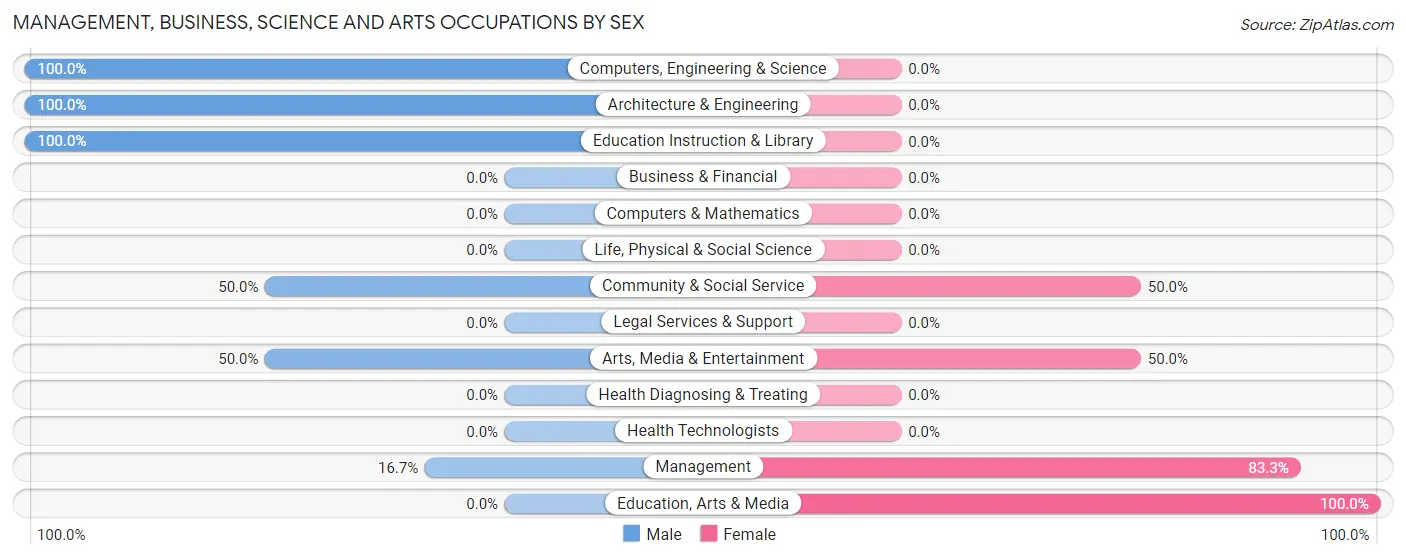
| Occupation | Male | Female |
| Management | 2 (16.7%) | 10 (83.3%) |
| Business & Financial | 0 (0.0%) | 0 (0.0%) |
| Computers, Engineering & Science | 4 (100.0%) | 0 (0.0%) |
| Computers & Mathematics | 0 (0.0%) | 0 (0.0%) |
| Architecture & Engineering | 4 (100.0%) | 0 (0.0%) |
| Life, Physical & Social Science | 0 (0.0%) | 0 (0.0%) |
| Community & Social Service | 4 (50.0%) | 4 (50.0%) |
| Education, Arts & Media | 0 (0.0%) | 2 (100.0%) |
| Legal Services & Support | 0 (0.0%) | 0 (0.0%) |
| Education Instruction & Library | 2 (100.0%) | 0 (0.0%) |
| Arts, Media & Entertainment | 2 (50.0%) | 2 (50.0%) |
| Health Diagnosing & Treating | 0 (0.0%) | 0 (0.0%) |
| Health Technologists | 0 (0.0%) | 0 (0.0%) |
| Total (Category) | 10 (41.7%) | 14 (58.3%) |
| Total (Overall) | 32 (53.3%) | 28 (46.7%) |
Services Occupations
The most common Services occupations in Laurel Mountain borough are Food Preparation & Serving (6 | 10.0%), and Personal Care & Service (2 | 3.3%).
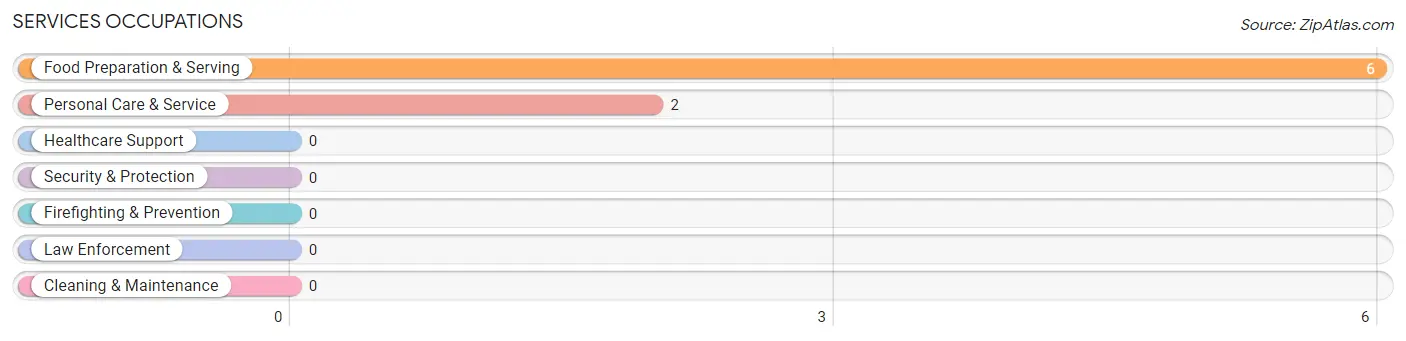
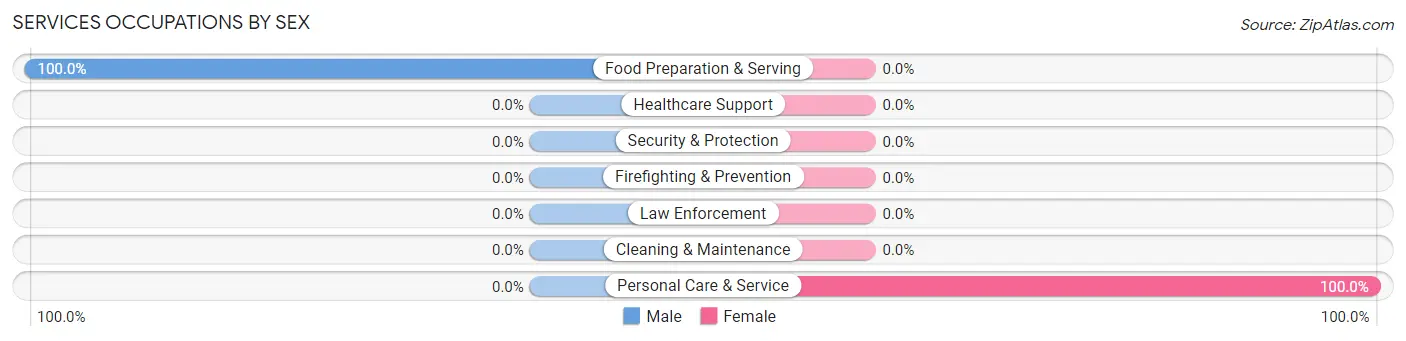
Services Occupations by Sex
| Occupation | Male | Female |
| Healthcare Support | 0 (0.0%) | 0 (0.0%) |
| Security & Protection | 0 (0.0%) | 0 (0.0%) |
| Firefighting & Prevention | 0 (0.0%) | 0 (0.0%) |
| Law Enforcement | 0 (0.0%) | 0 (0.0%) |
| Food Preparation & Serving | 6 (100.0%) | 0 (0.0%) |
| Cleaning & Maintenance | 0 (0.0%) | 0 (0.0%) |
| Personal Care & Service | 0 (0.0%) | 2 (100.0%) |
| Total (Category) | 6 (75.0%) | 2 (25.0%) |
| Total (Overall) | 32 (53.3%) | 28 (46.7%) |
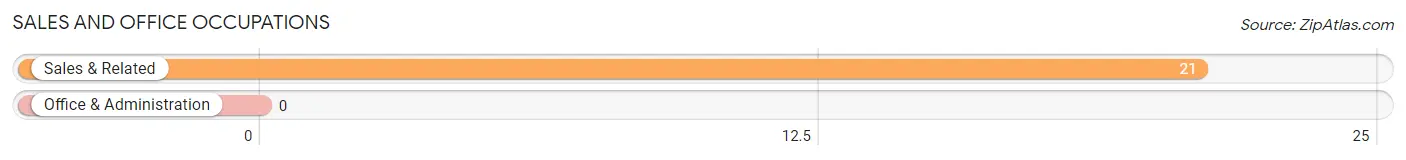
Sales and Office Occupations
The most common Sales and Office occupations in Laurel Mountain borough are , and Sales & Related (21 | 35.0%).
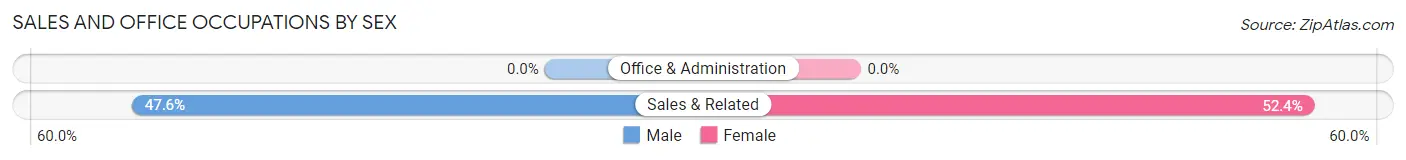
Sales and Office Occupations by Sex
| Occupation | Male | Female |
| Sales & Related | 10 (47.6%) | 11 (52.4%) |
| Office & Administration | 0 (0.0%) | 0 (0.0%) |
| Total (Category) | 10 (47.6%) | 11 (52.4%) |
| Total (Overall) | 32 (53.3%) | 28 (46.7%) |
Natural Resources, Construction and Maintenance Occupations
Natural Resources, Construction and Maintenance Occupations by Sex
| Occupation | Male | Female |
| Farming, Fishing & Forestry | 0 (0.0%) | 0 (0.0%) |
| Construction & Extraction | 0 (0.0%) | 0 (0.0%) |
| Installation, Maintenance & Repair | 0 (0.0%) | 0 (0.0%) |
| Total (Category) | 0 (0.0%) | 0 (0.0%) |
| Total (Overall) | 32 (53.3%) | 28 (46.7%) |
Production, Transportation and Moving Occupations
The most common Production, Transportation and Moving occupations in Laurel Mountain borough are Material Moving (6 | 10.0%), and Production (1 | 1.7%).
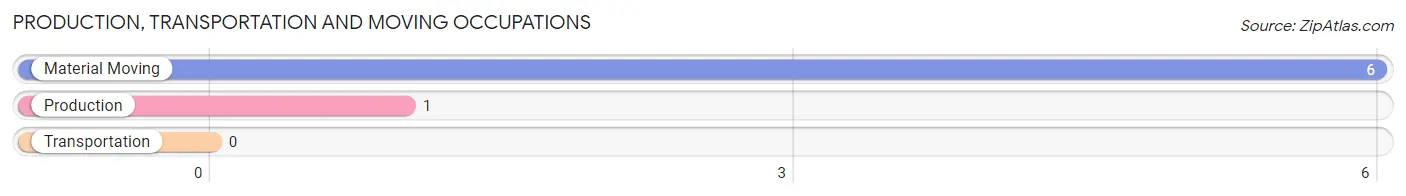
Production, Transportation and Moving Occupations by Sex
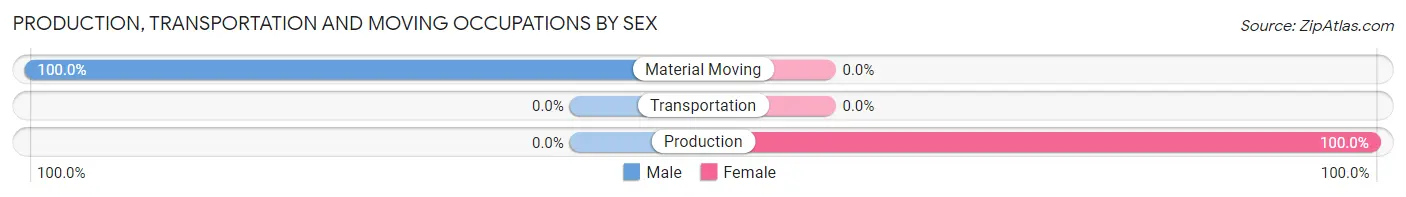
| Occupation | Male | Female |
| Production | 0 (0.0%) | 1 (100.0%) |
| Transportation | 0 (0.0%) | 0 (0.0%) |
| Material Moving | 6 (100.0%) | 0 (0.0%) |
| Total (Category) | 6 (85.7%) | 1 (14.3%) |
| Total (Overall) | 32 (53.3%) | 28 (46.7%) |
Employment Industries by Sex in Laurel Mountain borough
Employment Industries in Laurel Mountain borough
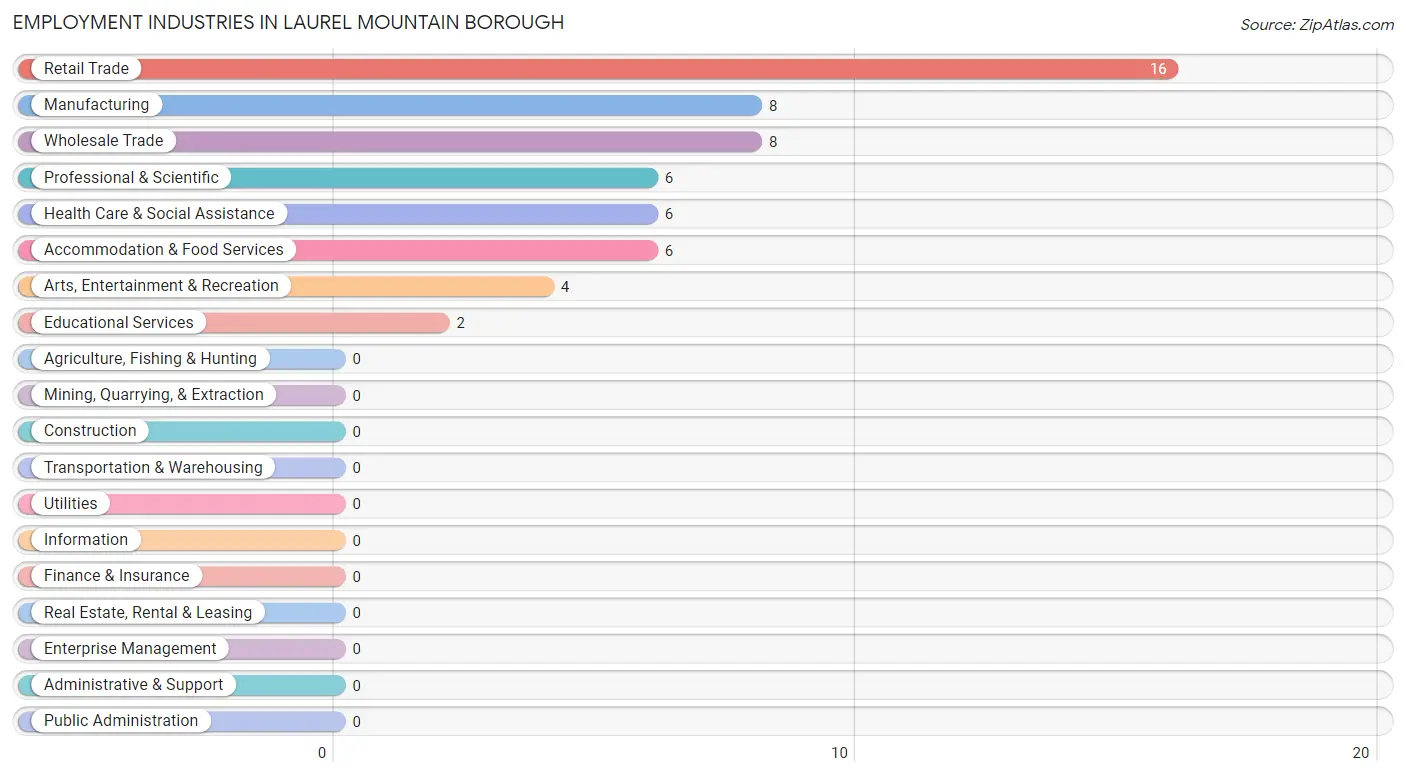
The major employment industries in Laurel Mountain borough include Retail Trade (16 | 26.7%), Manufacturing (8 | 13.3%), Wholesale Trade (8 | 13.3%), Professional & Scientific (6 | 10.0%), and Health Care & Social Assistance (6 | 10.0%).
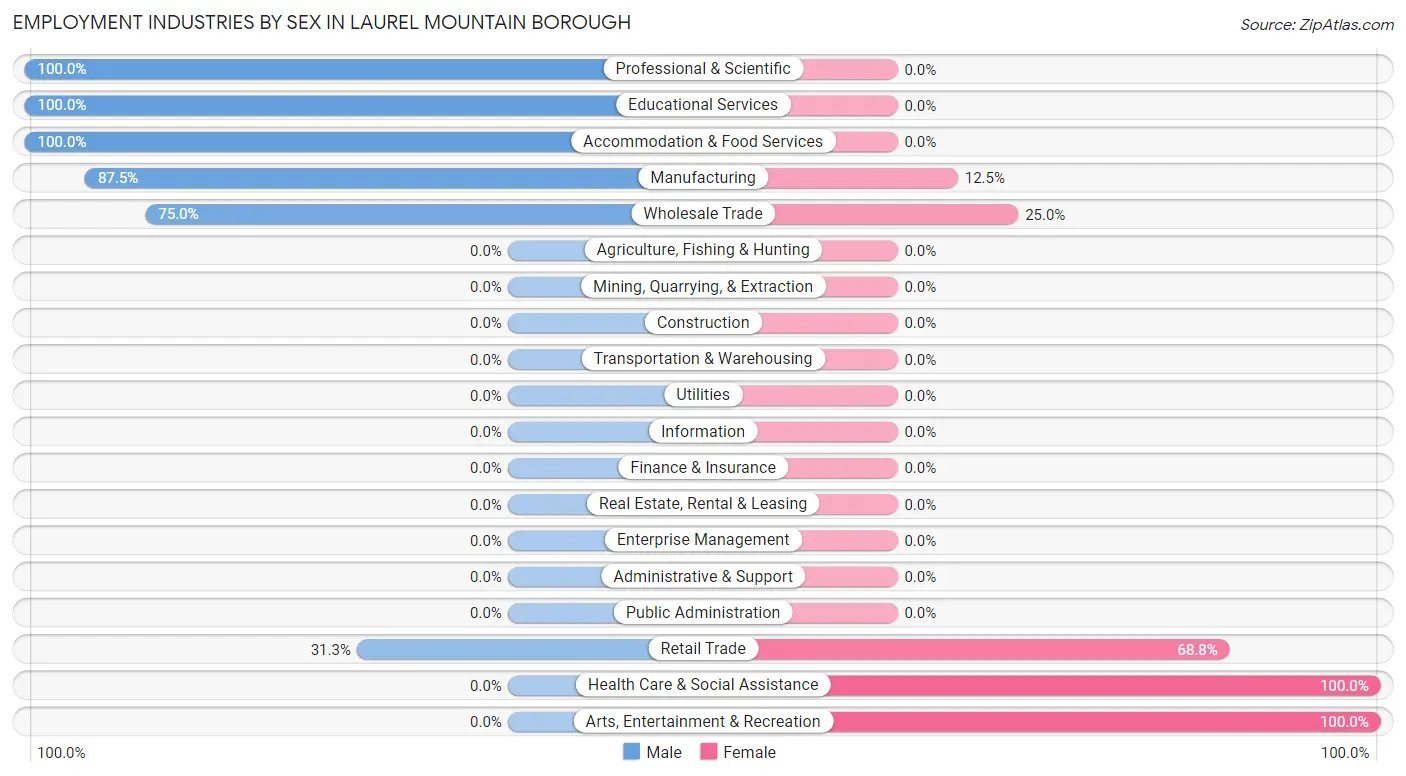
Employment Industries by Sex in Laurel Mountain borough
The Laurel Mountain borough industries that see more men than women are Professional & Scientific (100.0%), Educational Services (100.0%), and Accommodation & Food Services (100.0%), whereas the industries that tend to have a higher number of women are Health Care & Social Assistance (100.0%), Arts, Entertainment & Recreation (100.0%), and Retail Trade (68.8%).
| Industry | Male | Female |
| Agriculture, Fishing & Hunting | 0 (0.0%) | 0 (0.0%) |
| Mining, Quarrying, & Extraction | 0 (0.0%) | 0 (0.0%) |
| Construction | 0 (0.0%) | 0 (0.0%) |
| Manufacturing | 7 (87.5%) | 1 (12.5%) |
| Wholesale Trade | 6 (75.0%) | 2 (25.0%) |
| Retail Trade | 5 (31.2%) | 11 (68.8%) |
| Transportation & Warehousing | 0 (0.0%) | 0 (0.0%) |
| Utilities | 0 (0.0%) | 0 (0.0%) |
| Information | 0 (0.0%) | 0 (0.0%) |
| Finance & Insurance | 0 (0.0%) | 0 (0.0%) |
| Real Estate, Rental & Leasing | 0 (0.0%) | 0 (0.0%) |
| Professional & Scientific | 6 (100.0%) | 0 (0.0%) |
| Enterprise Management | 0 (0.0%) | 0 (0.0%) |
| Administrative & Support | 0 (0.0%) | 0 (0.0%) |
| Educational Services | 2 (100.0%) | 0 (0.0%) |
| Health Care & Social Assistance | 0 (0.0%) | 6 (100.0%) |
| Arts, Entertainment & Recreation | 0 (0.0%) | 4 (100.0%) |
| Accommodation & Food Services | 6 (100.0%) | 0 (0.0%) |
| Public Administration | 0 (0.0%) | 0 (0.0%) |
| Total | 32 (53.3%) | 28 (46.7%) |
Education in Laurel Mountain borough
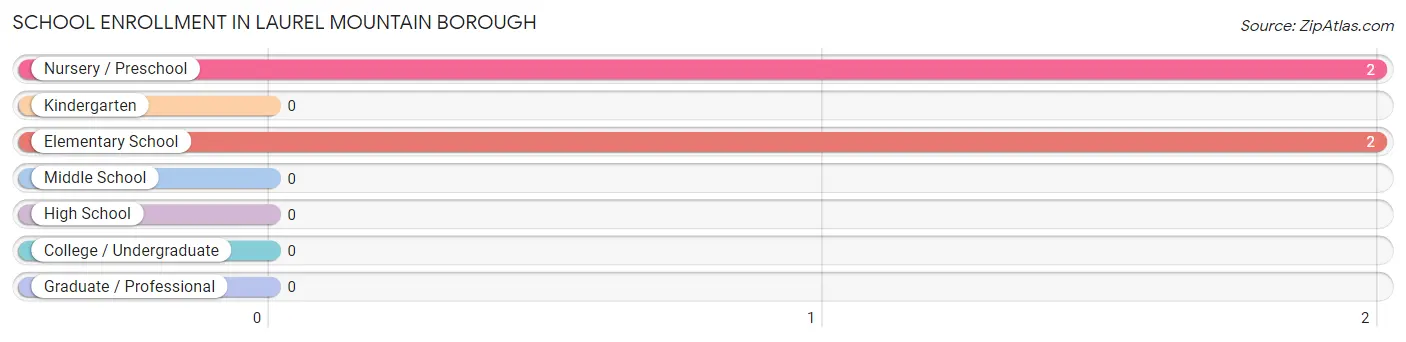
School Enrollment in Laurel Mountain borough
The most common levels of schooling among the 4 students in Laurel Mountain borough are nursery / preschool (2 | 50.0%), and elementary school (2 | 50.0%).
| School Level | # Students | % Students |
| Nursery / Preschool | 2 | 50.0% |
| Kindergarten | 0 | 0.0% |
| Elementary School | 2 | 50.0% |
| Middle School | 0 | 0.0% |
| High School | 0 | 0.0% |
| College / Undergraduate | 0 | 0.0% |
| Graduate / Professional | 0 | 0.0% |
| Total | 4 | 100.0% |
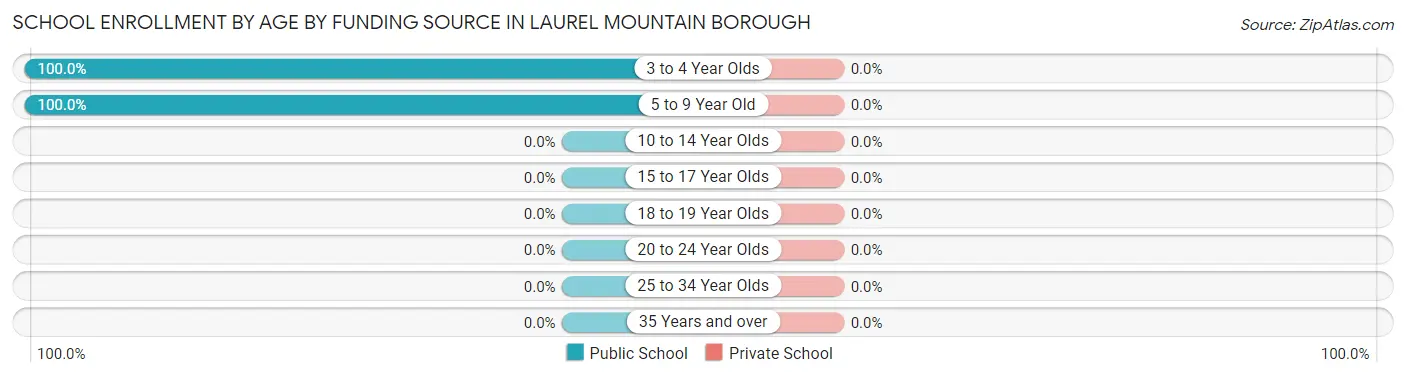
School Enrollment by Age by Funding Source in Laurel Mountain borough
| Age Bracket | Public School | Private School |
| 3 to 4 Year Olds | 2 (100.0%) | 0 (0.0%) |
| 5 to 9 Year Old | 2 (100.0%) | 0 (0.0%) |
| 10 to 14 Year Olds | 0 (0.0%) | 0 (0.0%) |
| 15 to 17 Year Olds | 0 (0.0%) | 0 (0.0%) |
| 18 to 19 Year Olds | 0 (0.0%) | 0 (0.0%) |
| 20 to 24 Year Olds | 0 (0.0%) | 0 (0.0%) |
| 25 to 34 Year Olds | 0 (0.0%) | 0 (0.0%) |
| 35 Years and over | 0 (0.0%) | 0 (0.0%) |
| Total | 4 (100.0%) | 0 (0.0%) |
Educational Attainment by Field of Study in Laurel Mountain borough
Psychology (6 | 13.6%), social sciences (6 | 13.6%), literature & languages (6 | 13.6%), communications (6 | 13.6%), and engineering (5 | 11.4%) are the most common fields of study among 44 individuals in Laurel Mountain borough who have obtained a bachelor's degree or higher.
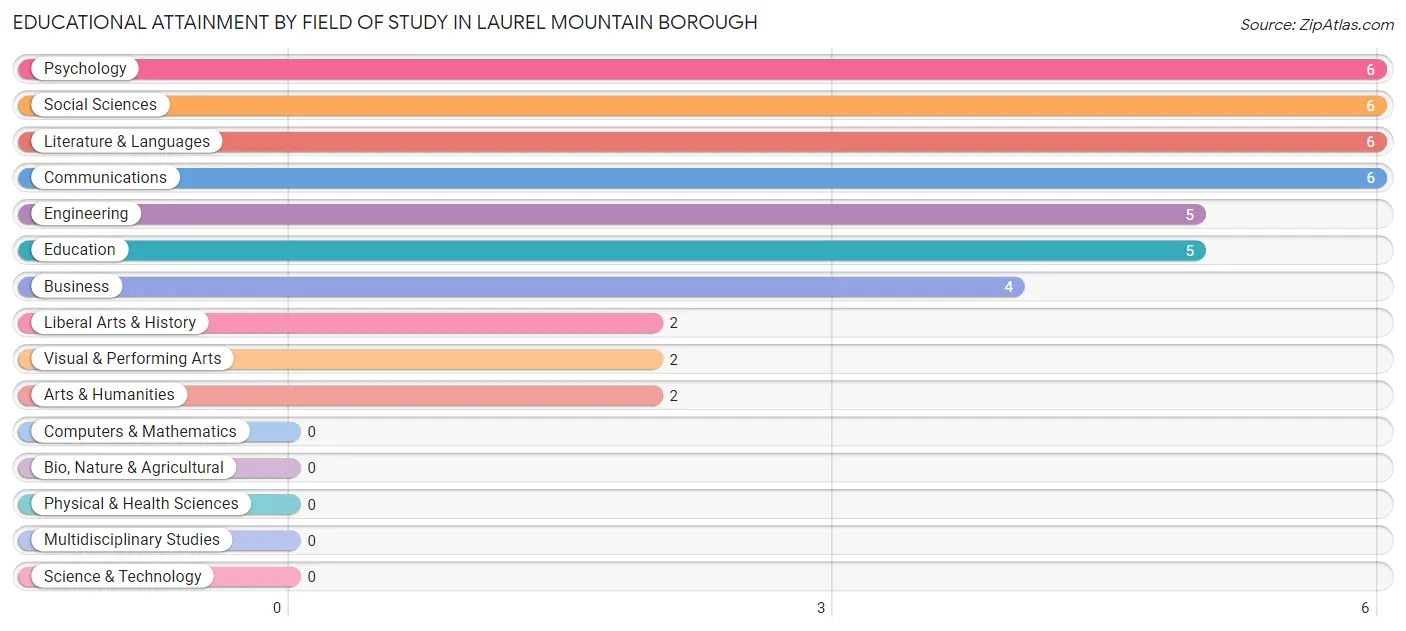
| Field of Study | # Graduates | % Graduates |
| Computers & Mathematics | 0 | 0.0% |
| Bio, Nature & Agricultural | 0 | 0.0% |
| Physical & Health Sciences | 0 | 0.0% |
| Psychology | 6 | 13.6% |
| Social Sciences | 6 | 13.6% |
| Engineering | 5 | 11.4% |
| Multidisciplinary Studies | 0 | 0.0% |
| Science & Technology | 0 | 0.0% |
| Business | 4 | 9.1% |
| Education | 5 | 11.4% |
| Literature & Languages | 6 | 13.6% |
| Liberal Arts & History | 2 | 4.5% |
| Visual & Performing Arts | 2 | 4.5% |
| Communications | 6 | 13.6% |
| Arts & Humanities | 2 | 4.5% |
| Total | 44 | 100.0% |
Transportation & Commute in Laurel Mountain borough
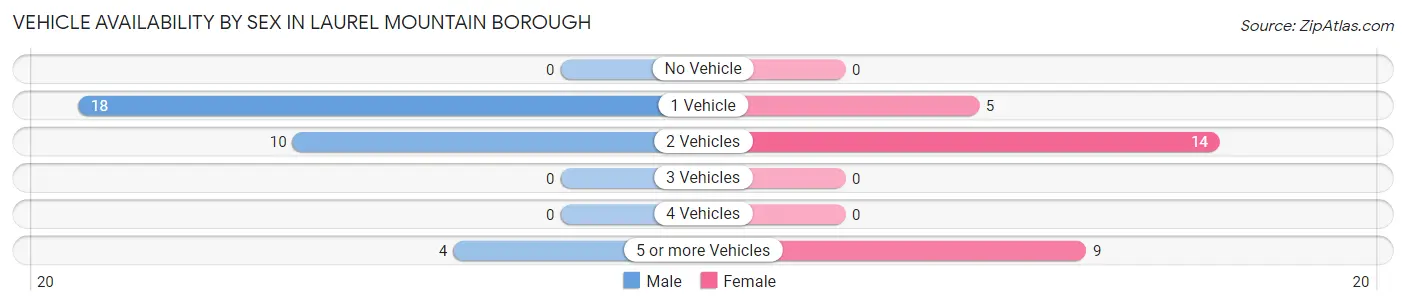
Vehicle Availability by Sex in Laurel Mountain borough
The most prevalent vehicle ownership categories in Laurel Mountain borough are males with 1 vehicle (18, accounting for 56.2%) and females with 1 vehicle (5, making up 64.3%).
| Vehicles Available | Male | Female |
| No Vehicle | 0 (0.0%) | 0 (0.0%) |
| 1 Vehicle | 18 (56.2%) | 5 (17.9%) |
| 2 Vehicles | 10 (31.2%) | 14 (50.0%) |
| 3 Vehicles | 0 (0.0%) | 0 (0.0%) |
| 4 Vehicles | 0 (0.0%) | 0 (0.0%) |
| 5 or more Vehicles | 4 (12.5%) | 9 (32.1%) |
| Total | 32 (100.0%) | 28 (100.0%) |
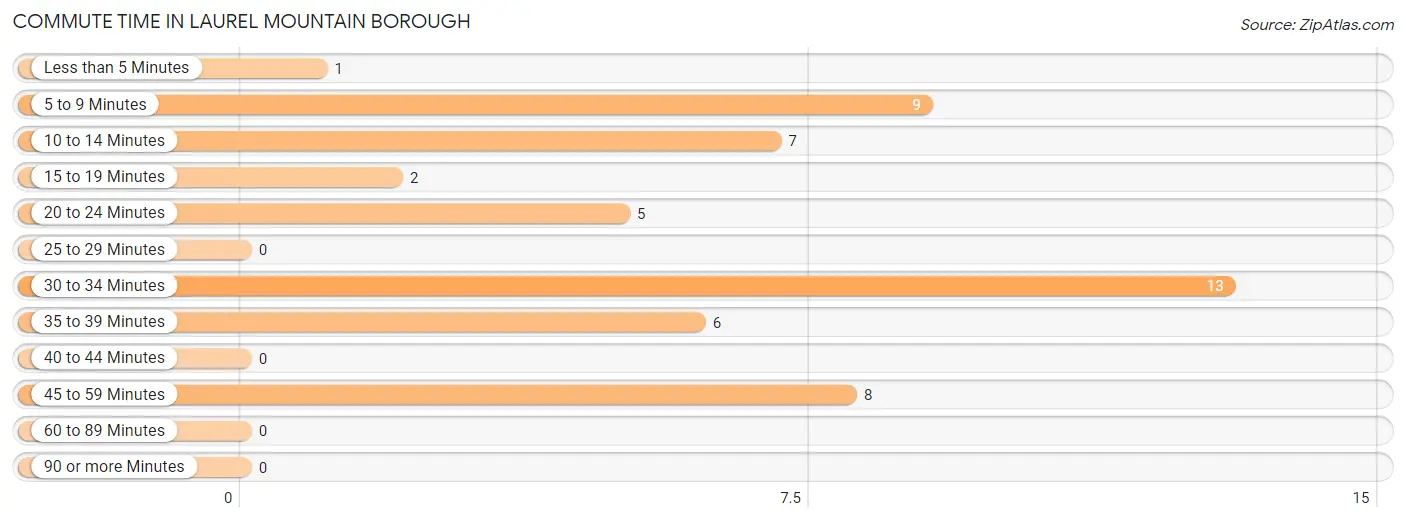
Commute Time in Laurel Mountain borough
The most frequently occuring commute durations in Laurel Mountain borough are 30 to 34 minutes (13 commuters, 25.5%), 5 to 9 minutes (9 commuters, 17.6%), and 45 to 59 minutes (8 commuters, 15.7%).
| Commute Time | # Commuters | % Commuters |
| Less than 5 Minutes | 1 | 2.0% |
| 5 to 9 Minutes | 9 | 17.6% |
| 10 to 14 Minutes | 7 | 13.7% |
| 15 to 19 Minutes | 2 | 3.9% |
| 20 to 24 Minutes | 5 | 9.8% |
| 25 to 29 Minutes | 0 | 0.0% |
| 30 to 34 Minutes | 13 | 25.5% |
| 35 to 39 Minutes | 6 | 11.8% |
| 40 to 44 Minutes | 0 | 0.0% |
| 45 to 59 Minutes | 8 | 15.7% |
| 60 to 89 Minutes | 0 | 0.0% |
| 90 or more Minutes | 0 | 0.0% |
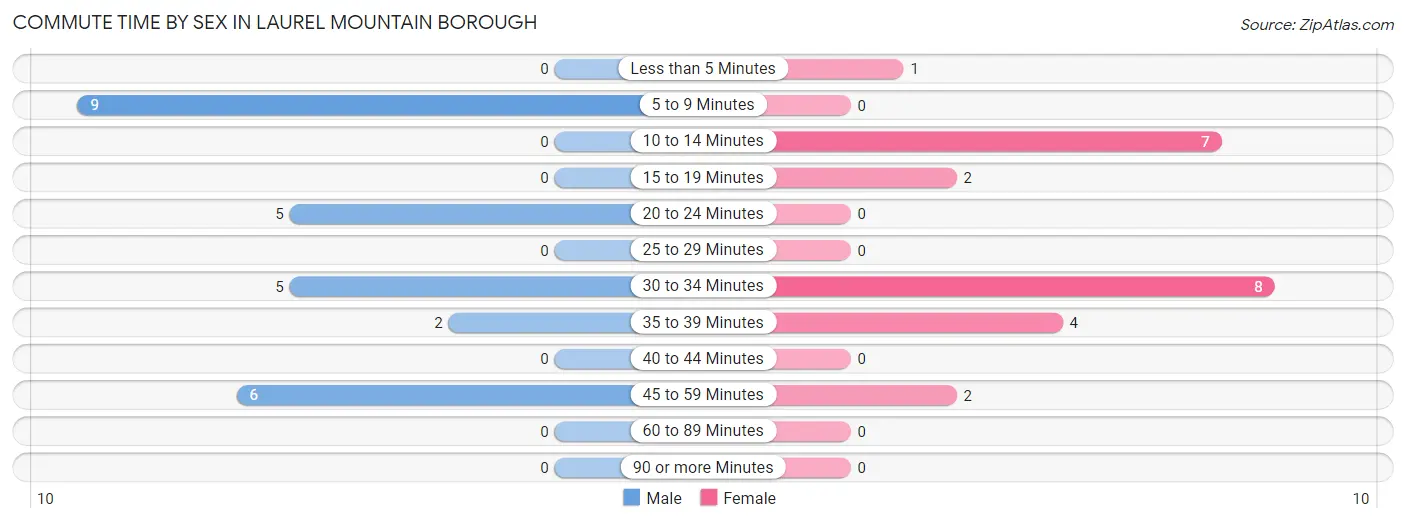
Commute Time by Sex in Laurel Mountain borough
The most common commute times in Laurel Mountain borough are 5 to 9 minutes (9 commuters, 33.3%) for males and 30 to 34 minutes (8 commuters, 33.3%) for females.
| Commute Time | Male | Female |
| Less than 5 Minutes | 0 (0.0%) | 1 (4.2%) |
| 5 to 9 Minutes | 9 (33.3%) | 0 (0.0%) |
| 10 to 14 Minutes | 0 (0.0%) | 7 (29.2%) |
| 15 to 19 Minutes | 0 (0.0%) | 2 (8.3%) |
| 20 to 24 Minutes | 5 (18.5%) | 0 (0.0%) |
| 25 to 29 Minutes | 0 (0.0%) | 0 (0.0%) |
| 30 to 34 Minutes | 5 (18.5%) | 8 (33.3%) |
| 35 to 39 Minutes | 2 (7.4%) | 4 (16.7%) |
| 40 to 44 Minutes | 0 (0.0%) | 0 (0.0%) |
| 45 to 59 Minutes | 6 (22.2%) | 2 (8.3%) |
| 60 to 89 Minutes | 0 (0.0%) | 0 (0.0%) |
| 90 or more Minutes | 0 (0.0%) | 0 (0.0%) |
Time of Departure to Work by Sex in Laurel Mountain borough
The most frequent times of departure to work in Laurel Mountain borough are 7:00 AM to 7:29 AM (6, 22.2%) for males and 7:00 AM to 7:29 AM (8, 33.3%) for females.
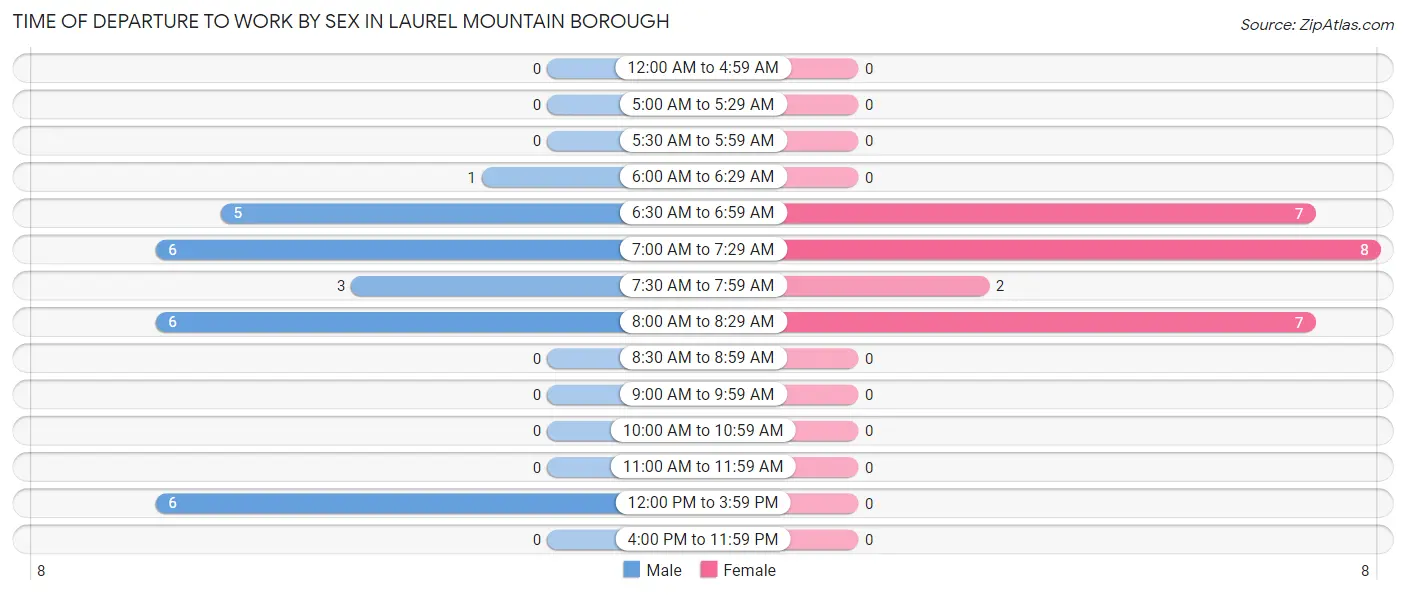
| Time of Departure | Male | Female |
| 12:00 AM to 4:59 AM | 0 (0.0%) | 0 (0.0%) |
| 5:00 AM to 5:29 AM | 0 (0.0%) | 0 (0.0%) |
| 5:30 AM to 5:59 AM | 0 (0.0%) | 0 (0.0%) |
| 6:00 AM to 6:29 AM | 1 (3.7%) | 0 (0.0%) |
| 6:30 AM to 6:59 AM | 5 (18.5%) | 7 (29.2%) |
| 7:00 AM to 7:29 AM | 6 (22.2%) | 8 (33.3%) |
| 7:30 AM to 7:59 AM | 3 (11.1%) | 2 (8.3%) |
| 8:00 AM to 8:29 AM | 6 (22.2%) | 7 (29.2%) |
| 8:30 AM to 8:59 AM | 0 (0.0%) | 0 (0.0%) |
| 9:00 AM to 9:59 AM | 0 (0.0%) | 0 (0.0%) |
| 10:00 AM to 10:59 AM | 0 (0.0%) | 0 (0.0%) |
| 11:00 AM to 11:59 AM | 0 (0.0%) | 0 (0.0%) |
| 12:00 PM to 3:59 PM | 6 (22.2%) | 0 (0.0%) |
| 4:00 PM to 11:59 PM | 0 (0.0%) | 0 (0.0%) |
| Total | 27 (100.0%) | 24 (100.0%) |
Housing Occupancy in Laurel Mountain borough
Occupancy by Ownership in Laurel Mountain borough
Of the total 64 dwellings in Laurel Mountain borough, owner-occupied units account for 52 (81.2%), while renter-occupied units make up 12 (18.8%).
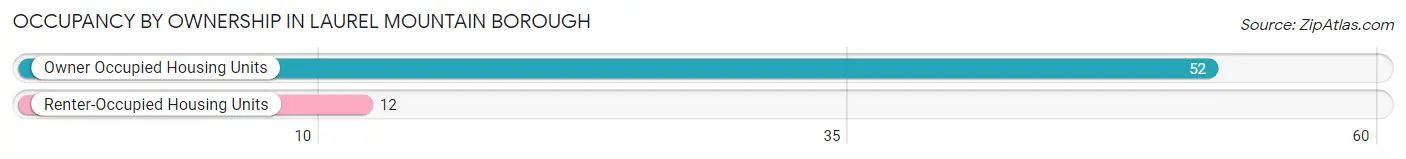
| Occupancy | # Housing Units | % Housing Units |
| Owner Occupied Housing Units | 52 | 81.2% |
| Renter-Occupied Housing Units | 12 | 18.8% |
| Total Occupied Housing Units | 64 | 100.0% |
Occupancy by Household Size in Laurel Mountain borough
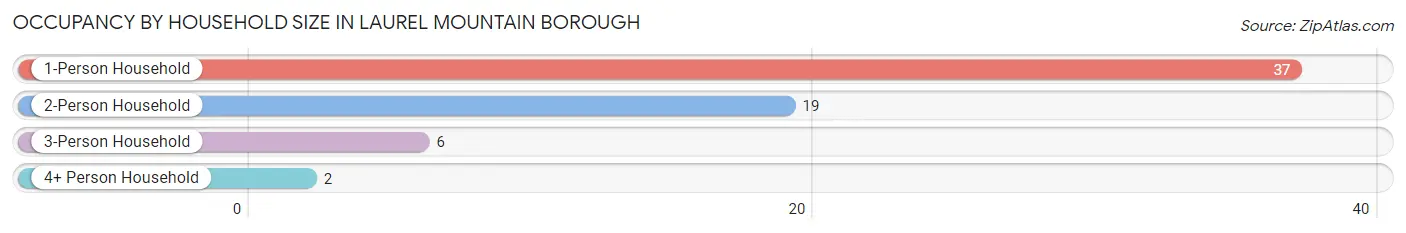
| Household Size | # Housing Units | % Housing Units |
| 1-Person Household | 37 | 57.8% |
| 2-Person Household | 19 | 29.7% |
| 3-Person Household | 6 | 9.4% |
| 4+ Person Household | 2 | 3.1% |
| Total Housing Units | 64 | 100.0% |
Occupancy by Ownership by Household Size in Laurel Mountain borough
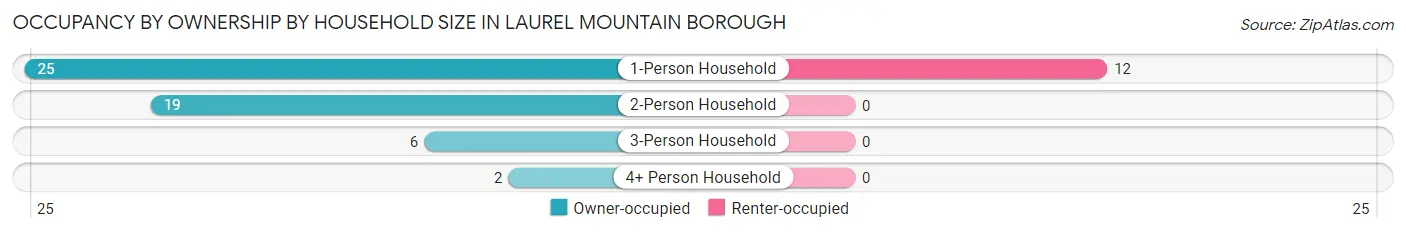
| Household Size | Owner-occupied | Renter-occupied |
| 1-Person Household | 25 (67.6%) | 12 (32.4%) |
| 2-Person Household | 19 (100.0%) | 0 (0.0%) |
| 3-Person Household | 6 (100.0%) | 0 (0.0%) |
| 4+ Person Household | 2 (100.0%) | 0 (0.0%) |
| Total Housing Units | 52 (81.2%) | 12 (18.8%) |
Occupancy by Educational Attainment in Laurel Mountain borough
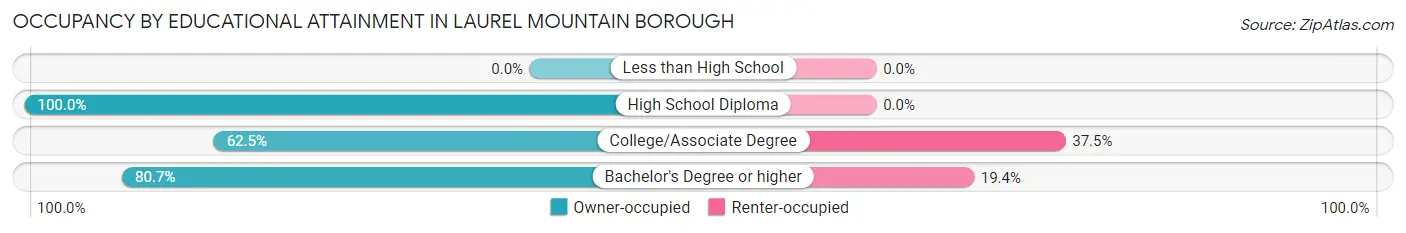
| Household Size | Owner-occupied | Renter-occupied |
| Less than High School | 0 (0.0%) | 0 (0.0%) |
| High School Diploma | 17 (100.0%) | 0 (0.0%) |
| College/Associate Degree | 10 (62.5%) | 6 (37.5%) |
| Bachelor's Degree or higher | 25 (80.6%) | 6 (19.4%) |
Occupancy by Age of Householder in Laurel Mountain borough
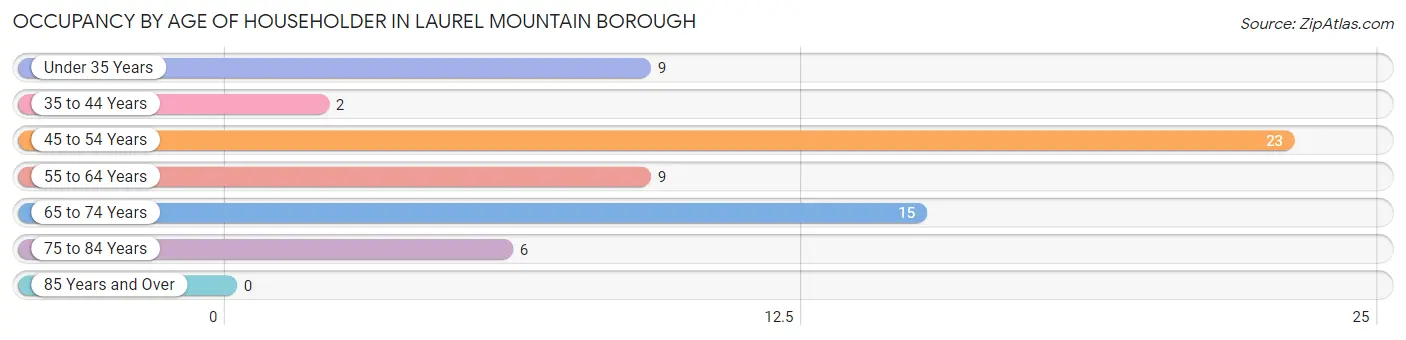
| Age Bracket | # Households | % Households |
| Under 35 Years | 9 | 14.1% |
| 35 to 44 Years | 2 | 3.1% |
| 45 to 54 Years | 23 | 35.9% |
| 55 to 64 Years | 9 | 14.1% |
| 65 to 74 Years | 15 | 23.4% |
| 75 to 84 Years | 6 | 9.4% |
| 85 Years and Over | 0 | 0.0% |
| Total | 64 | 100.0% |
Housing Finances in Laurel Mountain borough
Median Income by Occupancy in Laurel Mountain borough
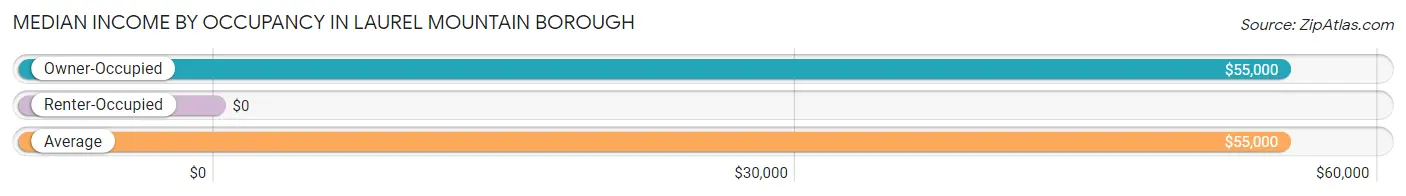
| Occupancy Type | # Households | Median Income |
| Owner-Occupied | 52 (81.2%) | $55,000 |
| Renter-Occupied | 12 (18.8%) | $0 |
| Average | 64 (100.0%) | $55,000 |
Occupancy by Householder Income Bracket in Laurel Mountain borough
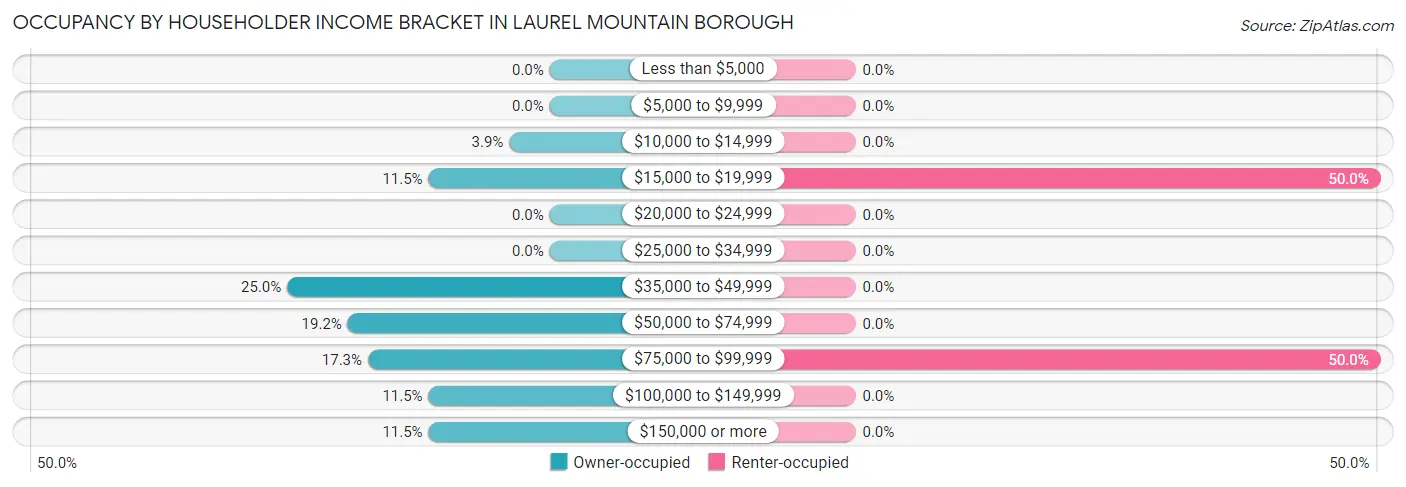
| Income Bracket | Owner-occupied | Renter-occupied |
| Less than $5,000 | 0 (0.0%) | 0 (0.0%) |
| $5,000 to $9,999 | 0 (0.0%) | 0 (0.0%) |
| $10,000 to $14,999 | 2 (3.8%) | 0 (0.0%) |
| $15,000 to $19,999 | 6 (11.5%) | 6 (50.0%) |
| $20,000 to $24,999 | 0 (0.0%) | 0 (0.0%) |
| $25,000 to $34,999 | 0 (0.0%) | 0 (0.0%) |
| $35,000 to $49,999 | 13 (25.0%) | 0 (0.0%) |
| $50,000 to $74,999 | 10 (19.2%) | 0 (0.0%) |
| $75,000 to $99,999 | 9 (17.3%) | 6 (50.0%) |
| $100,000 to $149,999 | 6 (11.5%) | 0 (0.0%) |
| $150,000 or more | 6 (11.5%) | 0 (0.0%) |
| Total | 52 (100.0%) | 12 (100.0%) |
Monthly Housing Cost Tiers in Laurel Mountain borough
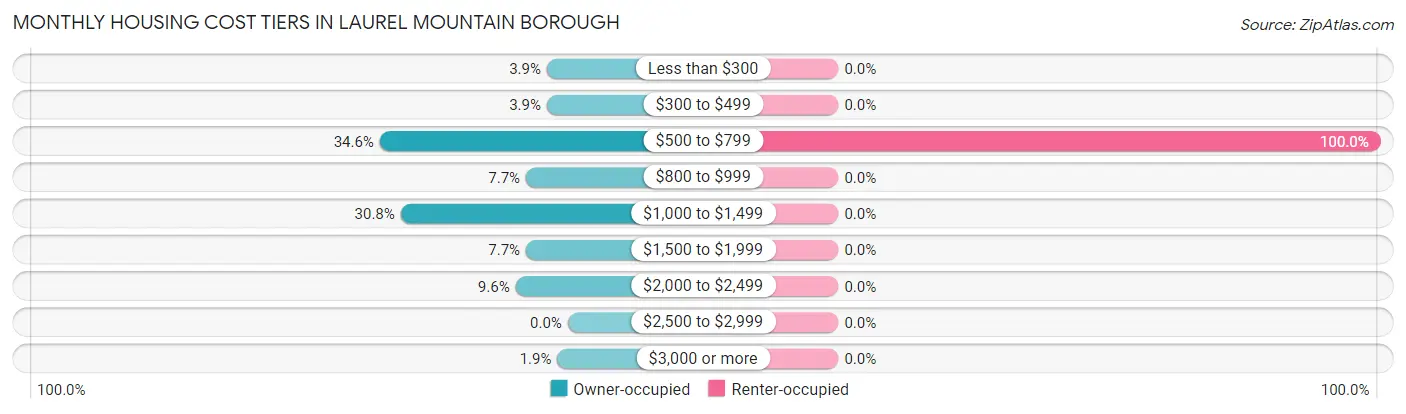
| Monthly Cost | Owner-occupied | Renter-occupied |
| Less than $300 | 2 (3.8%) | 0 (0.0%) |
| $300 to $499 | 2 (3.8%) | 0 (0.0%) |
| $500 to $799 | 18 (34.6%) | 12 (100.0%) |
| $800 to $999 | 4 (7.7%) | 0 (0.0%) |
| $1,000 to $1,499 | 16 (30.8%) | 0 (0.0%) |
| $1,500 to $1,999 | 4 (7.7%) | 0 (0.0%) |
| $2,000 to $2,499 | 5 (9.6%) | 0 (0.0%) |
| $2,500 to $2,999 | 0 (0.0%) | 0 (0.0%) |
| $3,000 or more | 1 (1.9%) | 0 (0.0%) |
| Total | 52 (100.0%) | 12 (100.0%) |
Physical Housing Characteristics in Laurel Mountain borough
Housing Structures in Laurel Mountain borough
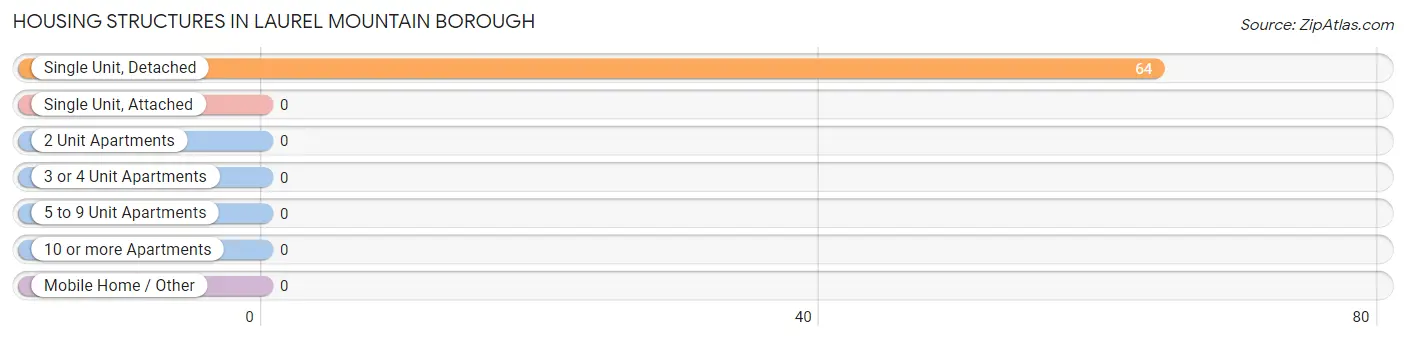
| Structure Type | # Housing Units | % Housing Units |
| Single Unit, Detached | 64 | 100.0% |
| Single Unit, Attached | 0 | 0.0% |
| 2 Unit Apartments | 0 | 0.0% |
| 3 or 4 Unit Apartments | 0 | 0.0% |
| 5 to 9 Unit Apartments | 0 | 0.0% |
| 10 or more Apartments | 0 | 0.0% |
| Mobile Home / Other | 0 | 0.0% |
| Total | 64 | 100.0% |
Housing Structures by Occupancy in Laurel Mountain borough
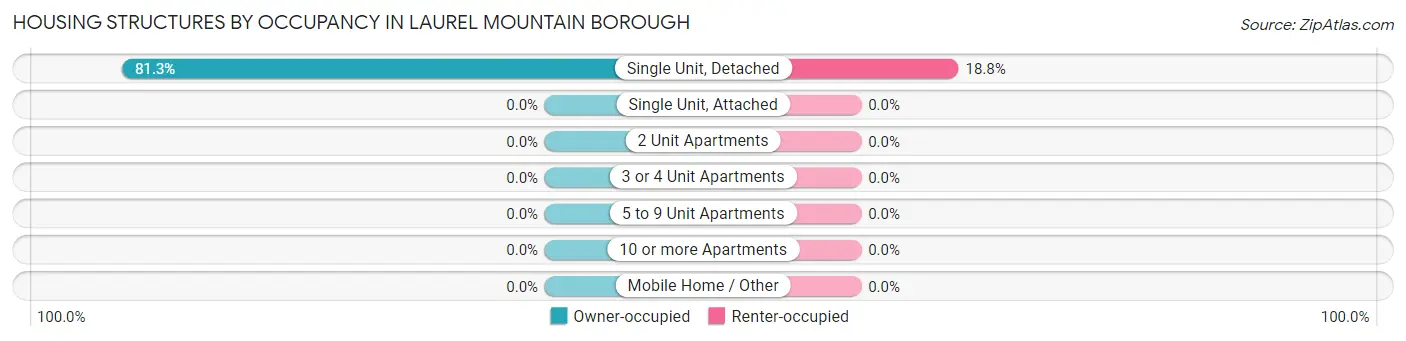
| Structure Type | Owner-occupied | Renter-occupied |
| Single Unit, Detached | 52 (81.2%) | 12 (18.8%) |
| Single Unit, Attached | 0 (0.0%) | 0 (0.0%) |
| 2 Unit Apartments | 0 (0.0%) | 0 (0.0%) |
| 3 or 4 Unit Apartments | 0 (0.0%) | 0 (0.0%) |
| 5 to 9 Unit Apartments | 0 (0.0%) | 0 (0.0%) |
| 10 or more Apartments | 0 (0.0%) | 0 (0.0%) |
| Mobile Home / Other | 0 (0.0%) | 0 (0.0%) |
| Total | 52 (81.2%) | 12 (18.8%) |
Housing Structures by Number of Rooms in Laurel Mountain borough
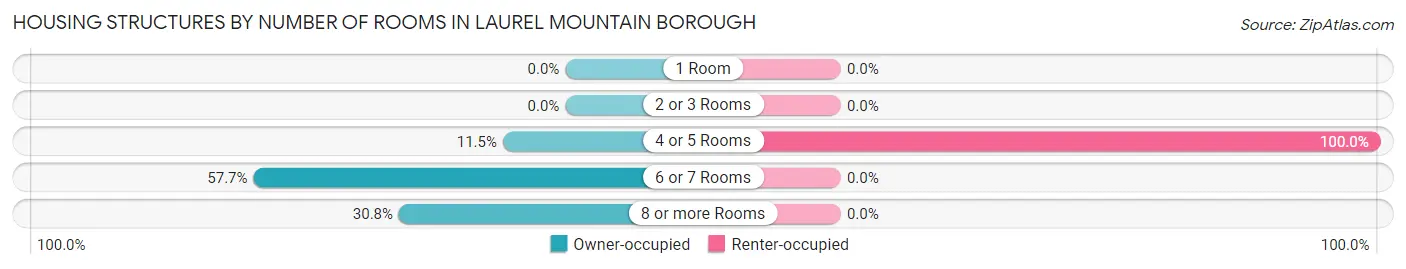
| Number of Rooms | Owner-occupied | Renter-occupied |
| 1 Room | 0 (0.0%) | 0 (0.0%) |
| 2 or 3 Rooms | 0 (0.0%) | 0 (0.0%) |
| 4 or 5 Rooms | 6 (11.5%) | 12 (100.0%) |
| 6 or 7 Rooms | 30 (57.7%) | 0 (0.0%) |
| 8 or more Rooms | 16 (30.8%) | 0 (0.0%) |
| Total | 52 (100.0%) | 12 (100.0%) |
Housing Structure by Heating Type in Laurel Mountain borough
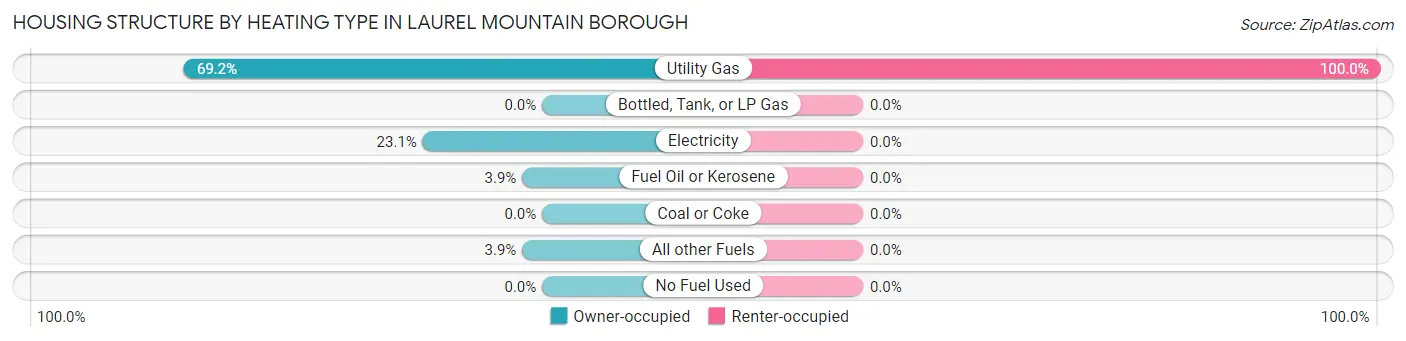
| Heating Type | Owner-occupied | Renter-occupied |
| Utility Gas | 36 (69.2%) | 12 (100.0%) |
| Bottled, Tank, or LP Gas | 0 (0.0%) | 0 (0.0%) |
| Electricity | 12 (23.1%) | 0 (0.0%) |
| Fuel Oil or Kerosene | 2 (3.8%) | 0 (0.0%) |
| Coal or Coke | 0 (0.0%) | 0 (0.0%) |
| All other Fuels | 2 (3.8%) | 0 (0.0%) |
| No Fuel Used | 0 (0.0%) | 0 (0.0%) |
| Total | 52 (100.0%) | 12 (100.0%) |
Household Vehicle Usage in Laurel Mountain borough
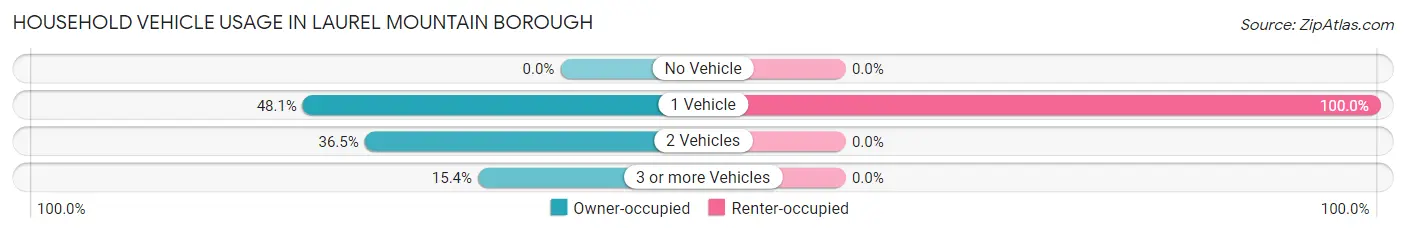
| Vehicles per Household | Owner-occupied | Renter-occupied |
| No Vehicle | 0 (0.0%) | 0 (0.0%) |
| 1 Vehicle | 25 (48.1%) | 12 (100.0%) |
| 2 Vehicles | 19 (36.5%) | 0 (0.0%) |
| 3 or more Vehicles | 8 (15.4%) | 0 (0.0%) |
| Total | 52 (100.0%) | 12 (100.0%) |
Real Estate & Mortgages in Laurel Mountain borough
Real Estate and Mortgage Overview in Laurel Mountain borough
| Characteristic | Without Mortgage | With Mortgage |
| Housing Units | 21 | 31 |
| Median Property Value | $161,300 | $203,600 |
| Median Household Income | $42,813 | $2 |
| Monthly Housing Costs | $605 | $1 |
| Real Estate Taxes | $2,458 | $0 |
Property Value by Mortgage Status in Laurel Mountain borough
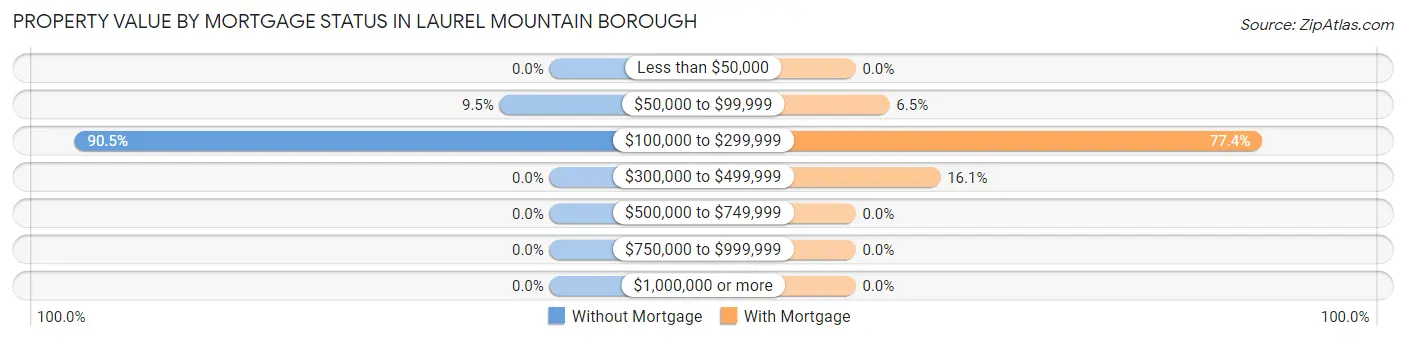
| Property Value | Without Mortgage | With Mortgage |
| Less than $50,000 | 0 (0.0%) | 0 (0.0%) |
| $50,000 to $99,999 | 2 (9.5%) | 2 (6.5%) |
| $100,000 to $299,999 | 19 (90.5%) | 24 (77.4%) |
| $300,000 to $499,999 | 0 (0.0%) | 5 (16.1%) |
| $500,000 to $749,999 | 0 (0.0%) | 0 (0.0%) |
| $750,000 to $999,999 | 0 (0.0%) | 0 (0.0%) |
| $1,000,000 or more | 0 (0.0%) | 0 (0.0%) |
| Total | 21 (100.0%) | 31 (100.0%) |
Household Income by Mortgage Status in Laurel Mountain borough
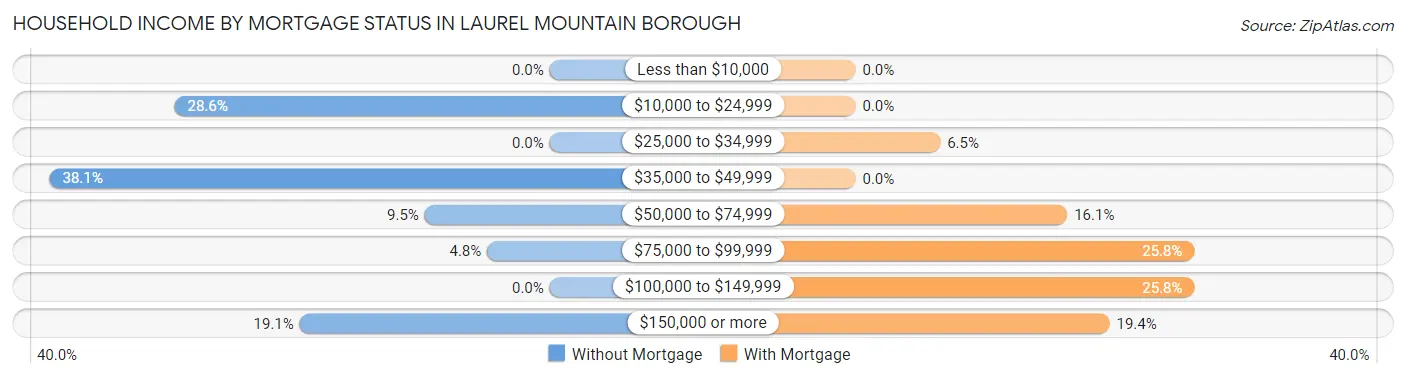
| Household Income | Without Mortgage | With Mortgage |
| Less than $10,000 | 0 (0.0%) | 0 (0.0%) |
| $10,000 to $24,999 | 6 (28.6%) | 0 (0.0%) |
| $25,000 to $34,999 | 0 (0.0%) | 2 (6.5%) |
| $35,000 to $49,999 | 8 (38.1%) | 0 (0.0%) |
| $50,000 to $74,999 | 2 (9.5%) | 5 (16.1%) |
| $75,000 to $99,999 | 1 (4.8%) | 8 (25.8%) |
| $100,000 to $149,999 | 0 (0.0%) | 8 (25.8%) |
| $150,000 or more | 4 (19.1%) | 6 (19.4%) |
| Total | 21 (100.0%) | 31 (100.0%) |
Property Value to Household Income Ratio in Laurel Mountain borough
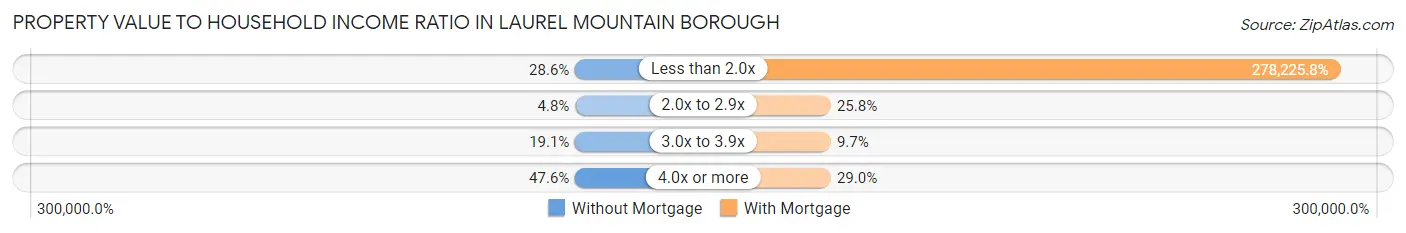
| Value-to-Income Ratio | Without Mortgage | With Mortgage |
| Less than 2.0x | 6 (28.6%) | 86,250 (278,225.8%) |
| 2.0x to 2.9x | 1 (4.8%) | 8 (25.8%) |
| 3.0x to 3.9x | 4 (19.1%) | 3 (9.7%) |
| 4.0x or more | 10 (47.6%) | 9 (29.0%) |
| Total | 21 (100.0%) | 31 (100.0%) |
Real Estate Taxes by Mortgage Status in Laurel Mountain borough
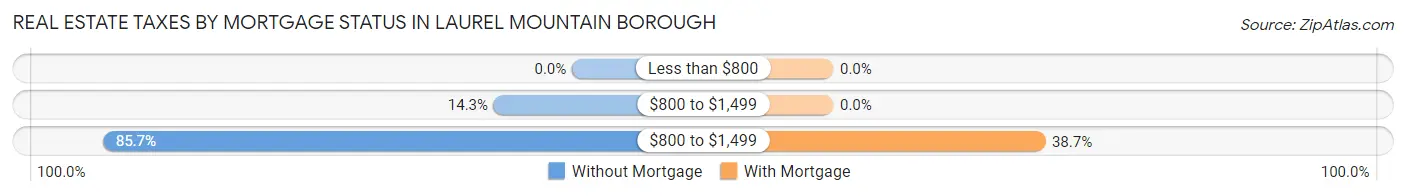
| Property Taxes | Without Mortgage | With Mortgage |
| Less than $800 | 0 (0.0%) | 0 (0.0%) |
| $800 to $1,499 | 3 (14.3%) | 0 (0.0%) |
| $800 to $1,499 | 18 (85.7%) | 12 (38.7%) |
| Total | 21 (100.0%) | 31 (100.0%) |
Health & Disability in Laurel Mountain borough
Health Insurance Coverage by Age in Laurel Mountain borough
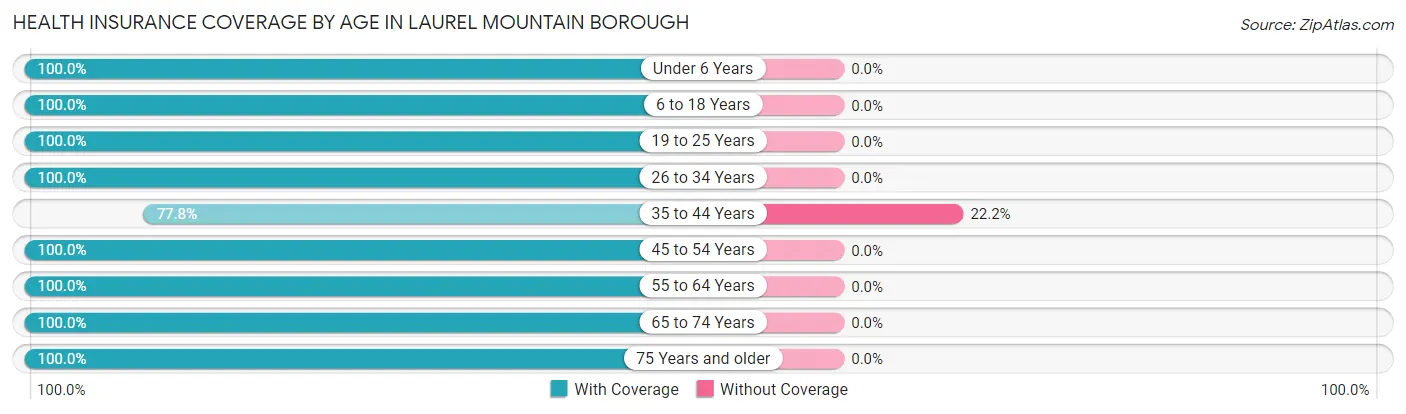
| Age Bracket | With Coverage | Without Coverage |
| Under 6 Years | 5 (100.0%) | 0 (0.0%) |
| 6 to 18 Years | 2 (100.0%) | 0 (0.0%) |
| 19 to 25 Years | 7 (100.0%) | 0 (0.0%) |
| 26 to 34 Years | 11 (100.0%) | 0 (0.0%) |
| 35 to 44 Years | 7 (77.8%) | 2 (22.2%) |
| 45 to 54 Years | 29 (100.0%) | 0 (0.0%) |
| 55 to 64 Years | 11 (100.0%) | 0 (0.0%) |
| 65 to 74 Years | 20 (100.0%) | 0 (0.0%) |
| 75 Years and older | 12 (100.0%) | 0 (0.0%) |
| Total | 104 (98.1%) | 2 (1.9%) |
Health Insurance Coverage by Citizenship Status in Laurel Mountain borough

| Citizenship Status | With Coverage | Without Coverage |
| Native Born | 5 (100.0%) | 0 (0.0%) |
| Foreign Born, Citizen | 2 (100.0%) | 0 (0.0%) |
| Foreign Born, not a Citizen | 7 (100.0%) | 0 (0.0%) |
Health Insurance Coverage by Household Income in Laurel Mountain borough
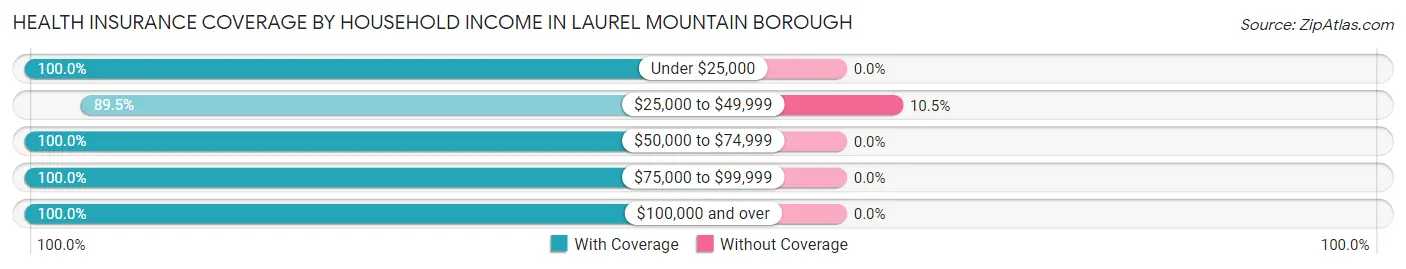
| Household Income | With Coverage | Without Coverage |
| Under $25,000 | 14 (100.0%) | 0 (0.0%) |
| $25,000 to $49,999 | 17 (89.5%) | 2 (10.5%) |
| $50,000 to $74,999 | 13 (100.0%) | 0 (0.0%) |
| $75,000 to $99,999 | 25 (100.0%) | 0 (0.0%) |
| $100,000 and over | 35 (100.0%) | 0 (0.0%) |
Public vs Private Health Insurance Coverage by Age in Laurel Mountain borough
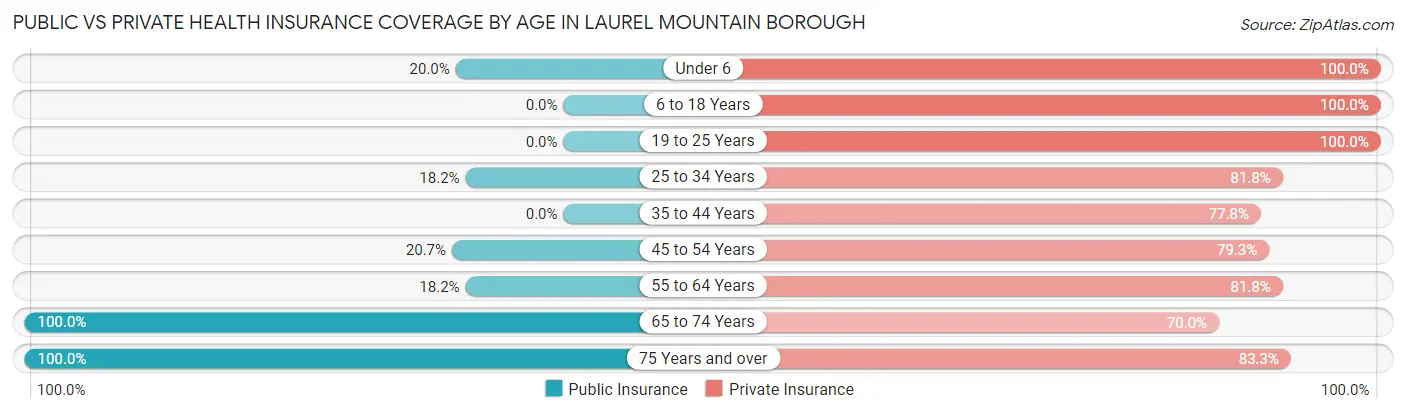
| Age Bracket | Public Insurance | Private Insurance |
| Under 6 | 1 (20.0%) | 5 (100.0%) |
| 6 to 18 Years | 0 (0.0%) | 2 (100.0%) |
| 19 to 25 Years | 0 (0.0%) | 7 (100.0%) |
| 25 to 34 Years | 2 (18.2%) | 9 (81.8%) |
| 35 to 44 Years | 0 (0.0%) | 7 (77.8%) |
| 45 to 54 Years | 6 (20.7%) | 23 (79.3%) |
| 55 to 64 Years | 2 (18.2%) | 9 (81.8%) |
| 65 to 74 Years | 20 (100.0%) | 14 (70.0%) |
| 75 Years and over | 12 (100.0%) | 10 (83.3%) |
| Total | 43 (40.6%) | 86 (81.1%) |
Disability Status by Sex by Age in Laurel Mountain borough
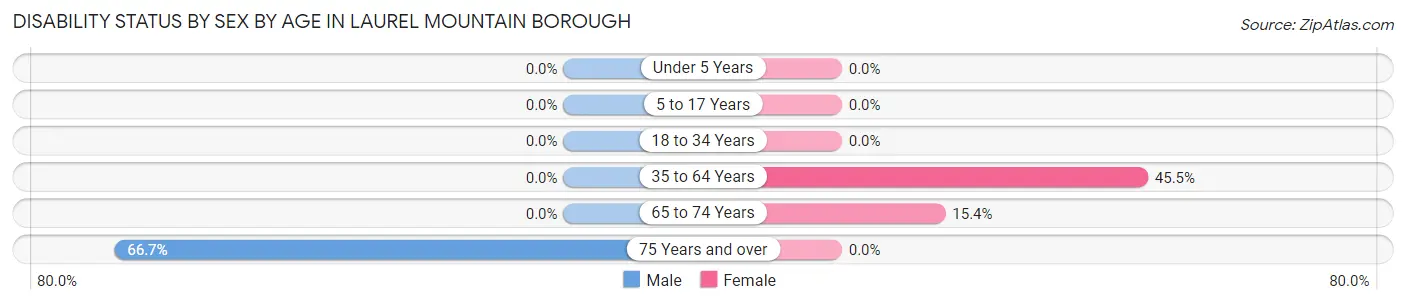
| Age Bracket | Male | Female |
| Under 5 Years | 0 (0.0%) | 0 (0.0%) |
| 5 to 17 Years | 0 (0.0%) | 0 (0.0%) |
| 18 to 34 Years | 0 (0.0%) | 0 (0.0%) |
| 35 to 64 Years | 0 (0.0%) | 10 (45.5%) |
| 65 to 74 Years | 0 (0.0%) | 2 (15.4%) |
| 75 Years and over | 4 (66.7%) | 0 (0.0%) |
Disability Class by Sex by Age in Laurel Mountain borough
Disability Class: Hearing Difficulty
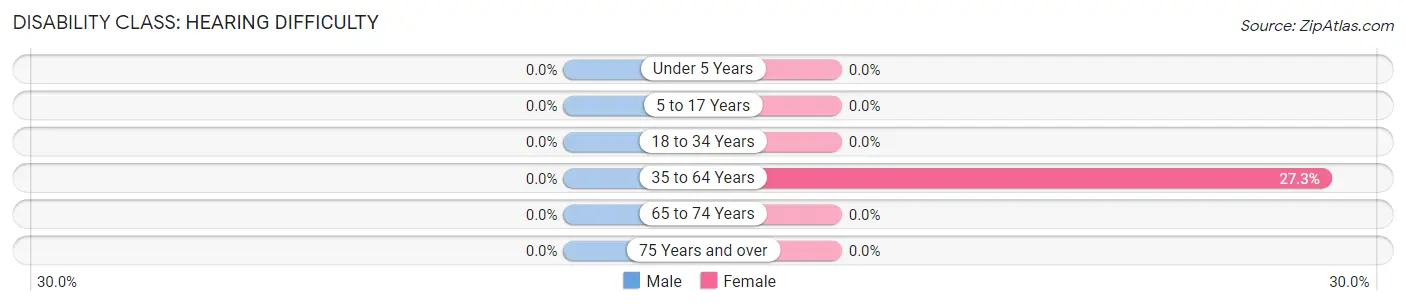
| Age Bracket | Male | Female |
| Under 5 Years | 0 (0.0%) | 0 (0.0%) |
| 5 to 17 Years | 0 (0.0%) | 0 (0.0%) |
| 18 to 34 Years | 0 (0.0%) | 0 (0.0%) |
| 35 to 64 Years | 0 (0.0%) | 6 (27.3%) |
| 65 to 74 Years | 0 (0.0%) | 0 (0.0%) |
| 75 Years and over | 0 (0.0%) | 0 (0.0%) |
Disability Class: Vision Difficulty
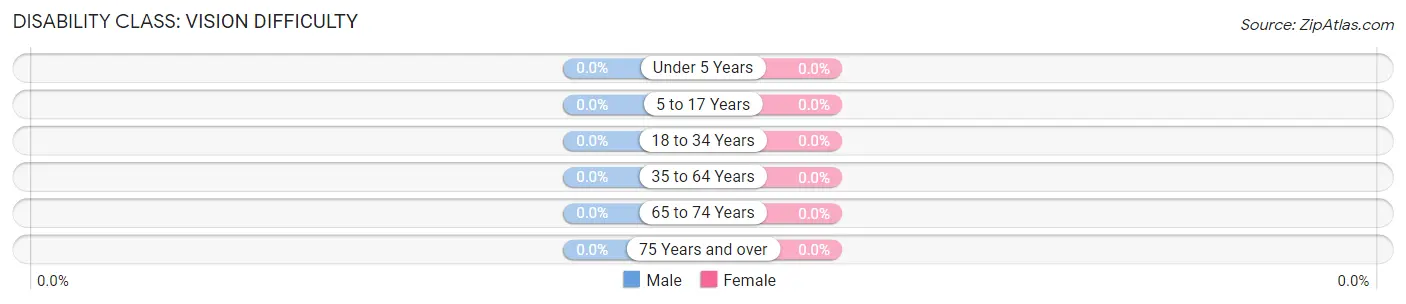
| Age Bracket | Male | Female |
| Under 5 Years | 0 (0.0%) | 0 (0.0%) |
| 5 to 17 Years | 0 (0.0%) | 0 (0.0%) |
| 18 to 34 Years | 0 (0.0%) | 0 (0.0%) |
| 35 to 64 Years | 0 (0.0%) | 0 (0.0%) |
| 65 to 74 Years | 0 (0.0%) | 0 (0.0%) |
| 75 Years and over | 0 (0.0%) | 0 (0.0%) |
Disability Class: Cognitive Difficulty
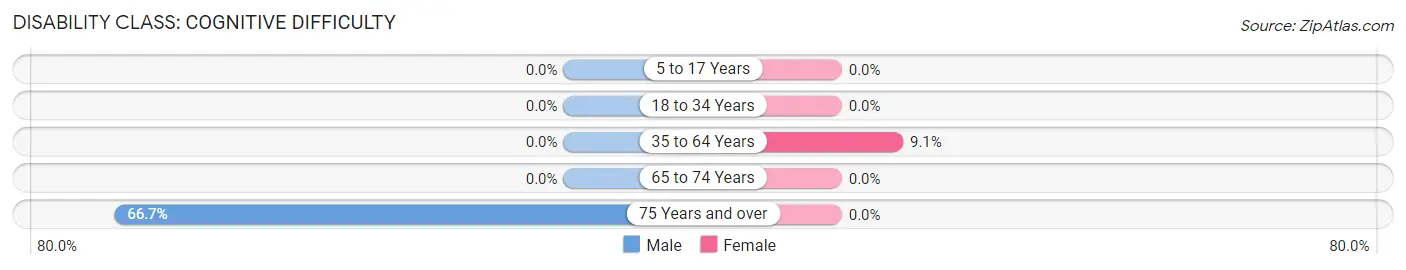
| Age Bracket | Male | Female |
| 5 to 17 Years | 0 (0.0%) | 0 (0.0%) |
| 18 to 34 Years | 0 (0.0%) | 0 (0.0%) |
| 35 to 64 Years | 0 (0.0%) | 2 (9.1%) |
| 65 to 74 Years | 0 (0.0%) | 0 (0.0%) |
| 75 Years and over | 4 (66.7%) | 0 (0.0%) |
Disability Class: Ambulatory Difficulty
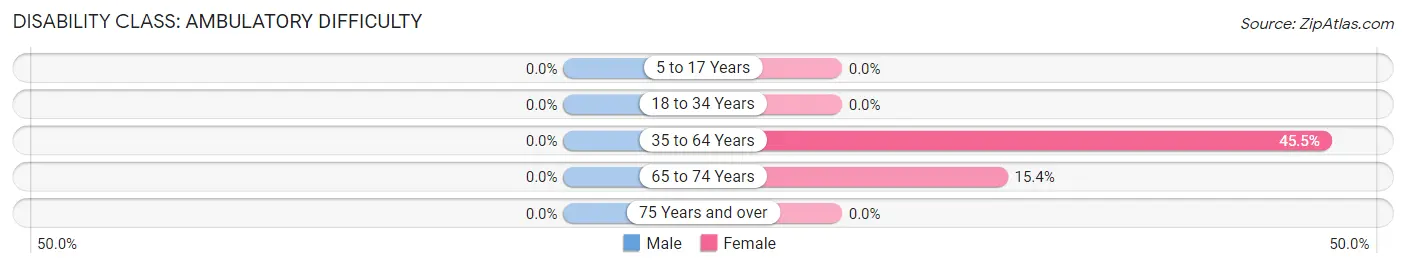
| Age Bracket | Male | Female |
| 5 to 17 Years | 0 (0.0%) | 0 (0.0%) |
| 18 to 34 Years | 0 (0.0%) | 0 (0.0%) |
| 35 to 64 Years | 0 (0.0%) | 10 (45.5%) |
| 65 to 74 Years | 0 (0.0%) | 2 (15.4%) |
| 75 Years and over | 0 (0.0%) | 0 (0.0%) |
Disability Class: Self-Care Difficulty
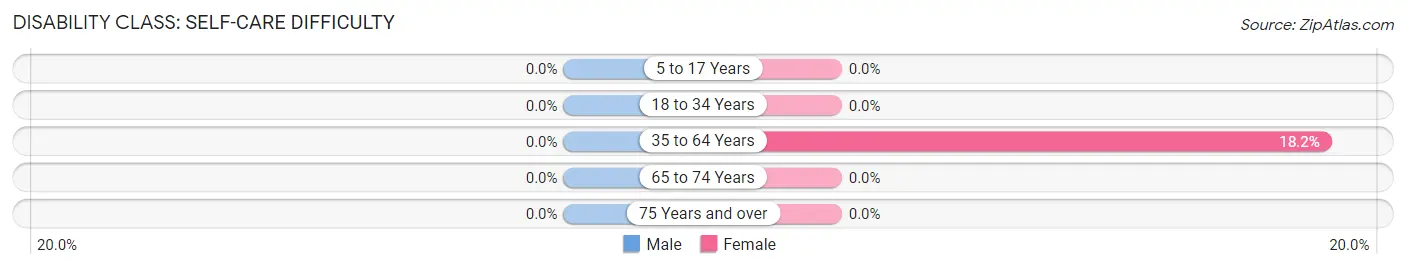
| Age Bracket | Male | Female |
| 5 to 17 Years | 0 (0.0%) | 0 (0.0%) |
| 18 to 34 Years | 0 (0.0%) | 0 (0.0%) |
| 35 to 64 Years | 0 (0.0%) | 4 (18.2%) |
| 65 to 74 Years | 0 (0.0%) | 0 (0.0%) |
| 75 Years and over | 0 (0.0%) | 0 (0.0%) |
Technology Access in Laurel Mountain borough
Computing Device Access in Laurel Mountain borough
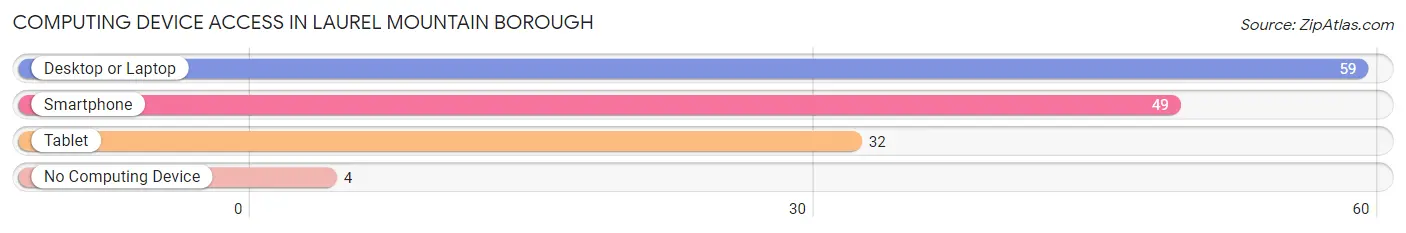
| Device Type | # Households | % Households |
| Desktop or Laptop | 59 | 92.2% |
| Smartphone | 49 | 76.6% |
| Tablet | 32 | 50.0% |
| No Computing Device | 4 | 6.2% |
| Total | 64 | 100.0% |
Internet Access in Laurel Mountain borough
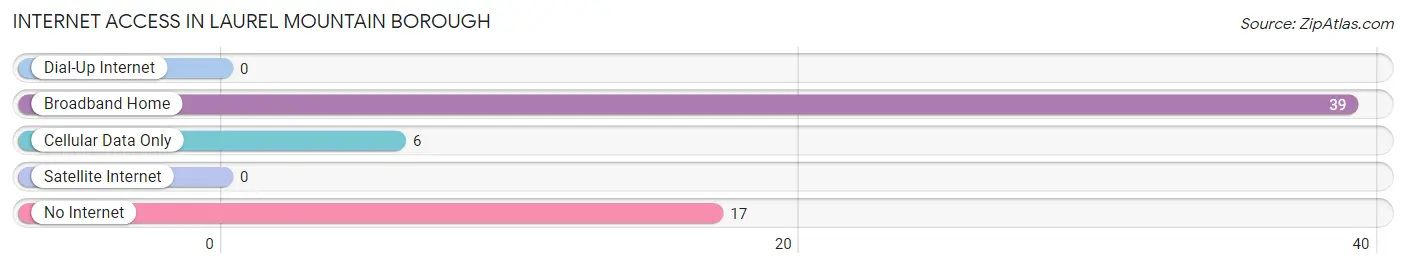
| Internet Type | # Households | % Households |
| Dial-Up Internet | 0 | 0.0% |
| Broadband Home | 39 | 60.9% |
| Cellular Data Only | 6 | 9.4% |
| Satellite Internet | 0 | 0.0% |
| No Internet | 17 | 26.6% |
| Total | 64 | 100.0% |
Laurel Mountain borough Summary
Laurel Mountain Borough is a small borough located in Westmoreland County, Pennsylvania. It is situated in the foothills of the Laurel Mountains, which are part of the Allegheny Mountains. The borough is located approximately 25 miles southeast of Pittsburgh and is part of the Greater Pittsburgh Metropolitan Area. The population of Laurel Mountain Borough was 1,093 at the 2010 census.
History
The area that is now Laurel Mountain Borough was first settled in the late 1700s by German and Scots-Irish immigrants. The first settlers were attracted to the area by the abundance of natural resources, including timber, coal, and iron ore. The area was originally part of Hempfield Township, but was incorporated as a borough in 1891. The borough was named after the nearby Laurel Mountains.
In the late 1800s and early 1900s, the borough was a center of coal mining and iron ore production. The coal and iron ore were used to fuel the steel mills in nearby Pittsburgh. The coal mines and iron ore production declined in the mid-1900s, and the borough shifted to a more residential focus.
Geography
Laurel Mountain Borough is located at 40°14'N 79°37'W (40.2333, -79.6167). It has a total area of 0.7 square miles, all of which is land. The borough is located in the foothills of the Laurel Mountains, which are part of the Allegheny Mountains. The borough is located approximately 25 miles southeast of Pittsburgh and is part of the Greater Pittsburgh Metropolitan Area.
The borough is bordered by Hempfield Township to the north, Ligonier Township to the east, and Donegal Township to the south and west. The borough is located along Pennsylvania Route 711, which runs north-south through the borough.
Economy
The economy of Laurel Mountain Borough is largely based on tourism and retail. The borough is home to several small businesses, including restaurants, shops, and a bed and breakfast. The borough is also home to a small ski resort, which attracts visitors from throughout the region.
The borough is also home to several small manufacturing companies, including a furniture manufacturer and a metal fabrication company. The borough is also home to a small coal mine, which is still in operation.
Demographics
As of the 2010 census, the population of Laurel Mountain Borough was 1,093. The racial makeup of the borough was 97.2% White, 0.7% African American, 0.2% Native American, 0.2% Asian, 0.2% from other races, and 1.7% from two or more races. Hispanic or Latino of any race were 0.7% of the population.
The median household income in the borough was $41,250, and the median family income was $50,000. The per capita income for the borough was $20,945. About 8.2% of families and 10.2% of the population were below the poverty line, including 14.3% of those under age 18 and 5.3% of those age 65 or over.
Common Questions
What is Per Capita Income in Laurel Mountain borough?
Per Capita income in Laurel Mountain borough is $42,872.
What is the Median Family Income in Laurel Mountain borough?
Median Family Income in Laurel Mountain borough is $94,250.
What is the Median Household income in Laurel Mountain borough?
Median Household Income in Laurel Mountain borough is $55,000.
What is Income or Wage Gap in Laurel Mountain borough?
Income or Wage Gap in Laurel Mountain borough is 30.1%.
Women in Laurel Mountain borough earn 69.9 cents for every dollar earned by a man.
What is Inequality or Gini Index in Laurel Mountain borough?
Inequality or Gini Index in Laurel Mountain borough is 0.39.
What is the Total Population of Laurel Mountain borough?
Total Population of Laurel Mountain borough is 106.
What is the Total Male Population of Laurel Mountain borough?
Total Male Population of Laurel Mountain borough is 51.
What is the Total Female Population of Laurel Mountain borough?
Total Female Population of Laurel Mountain borough is 55.
What is the Ratio of Males per 100 Females in Laurel Mountain borough?
There are 92.73 Males per 100 Females in Laurel Mountain borough.
What is the Ratio of Females per 100 Males in Laurel Mountain borough?
There are 107.84 Females per 100 Males in Laurel Mountain borough.
What is the Median Population Age in Laurel Mountain borough?
Median Population Age in Laurel Mountain borough is 50.2 Years.
What is the Average Family Size in Laurel Mountain borough
Average Family Size in Laurel Mountain borough is 2.6 People.
What is the Average Household Size in Laurel Mountain borough
Average Household Size in Laurel Mountain borough is 1.7 People.
How Large is the Labor Force in Laurel Mountain borough?
There are 65 People in the Labor Forcein in Laurel Mountain borough.
What is the Percentage of People in the Labor Force in Laurel Mountain borough?
65.7% of People are in the Labor Force in Laurel Mountain borough.
What is the Unemployment Rate in Laurel Mountain borough?
Unemployment Rate in Laurel Mountain borough is 7.7%.