Wiconsico, PA Map & Demographics
Wiconsico Map
Wiconsico Overview
$26,024
PER CAPITA INCOME
$78,056
AVG FAMILY INCOME
$55,938
AVG HOUSEHOLD INCOME
43.6%
WAGE / INCOME GAP [ % ]
56.4¢/ $1
WAGE / INCOME GAP [ $ ]
0.36
INEQUALITY / GINI INDEX
784
TOTAL POPULATION
419
MALE POPULATION
365
FEMALE POPULATION
114.79
MALES / 100 FEMALES
87.11
FEMALES / 100 MALES
35.1
MEDIAN AGE
2.8
AVG FAMILY SIZE
2.5
AVG HOUSEHOLD SIZE
347
LABOR FORCE [ PEOPLE ]
59.0%
PERCENT IN LABOR FORCE
8.2%
UNEMPLOYMENT RATE
Income in Wiconsico
Income Overview in Wiconsico
Per Capita Income in Wiconsico is $26,024, while median incomes of families and households are $78,056 and $55,938 respectively.
| Characteristic | Number | Measure |
| Per Capita Income | 784 | $26,024 |
| Median Family Income | 240 | $78,056 |
| Mean Family Income | 240 | $78,551 |
| Median Household Income | 319 | $55,938 |
| Mean Household Income | 319 | $66,322 |
| Income Deficit | 240 | $0 |
| Wage / Income Gap (%) | 784 | 43.55% |
| Wage / Income Gap ($) | 784 | 56.45¢ per $1 |
| Gini / Inequality Index | 784 | 0.36 |
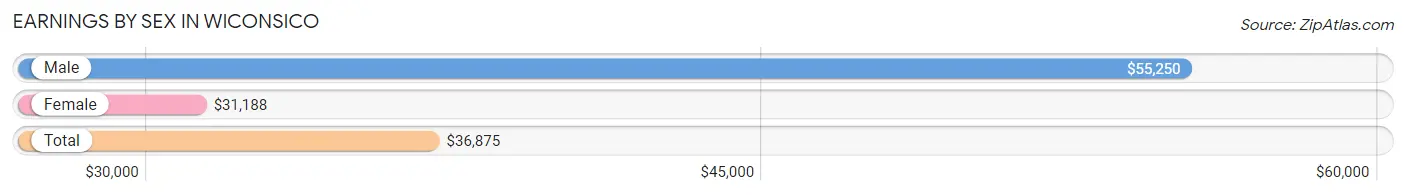
Earnings by Sex in Wiconsico
Average Earnings in Wiconsico are $36,875, $55,250 for men and $31,188 for women, a difference of 43.5%.
| Sex | Number | Average Earnings |
| Male | 143 (41.3%) | $55,250 |
| Female | 203 (58.7%) | $31,188 |
| Total | 346 (100.0%) | $36,875 |
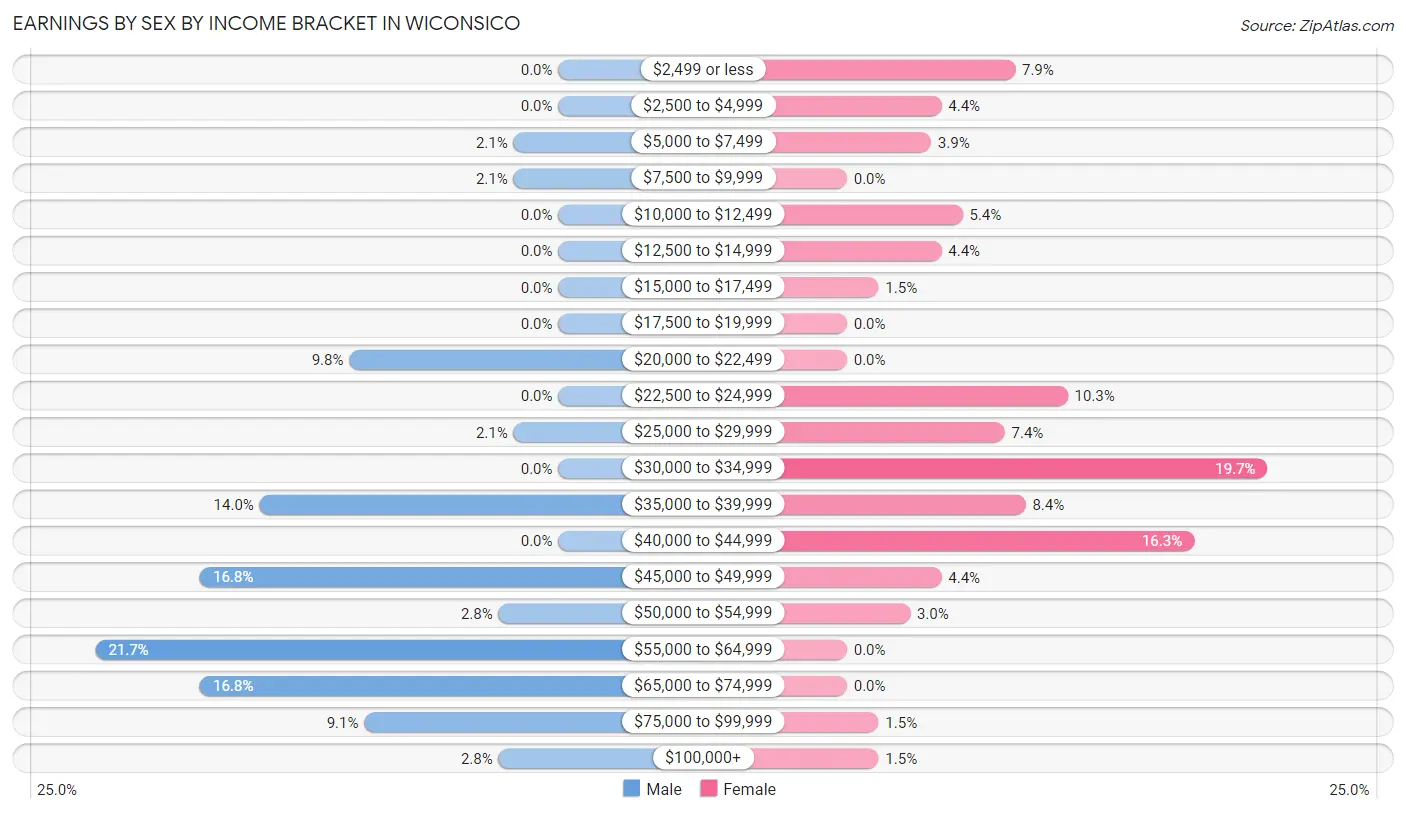
Earnings by Sex by Income Bracket in Wiconsico
The most common earnings brackets in Wiconsico are $55,000 to $64,999 for men (31 | 21.7%) and $30,000 to $34,999 for women (40 | 19.7%).
| Income | Male | Female |
| $2,499 or less | 0 (0.0%) | 16 (7.9%) |
| $2,500 to $4,999 | 0 (0.0%) | 9 (4.4%) |
| $5,000 to $7,499 | 3 (2.1%) | 8 (3.9%) |
| $7,500 to $9,999 | 3 (2.1%) | 0 (0.0%) |
| $10,000 to $12,499 | 0 (0.0%) | 11 (5.4%) |
| $12,500 to $14,999 | 0 (0.0%) | 9 (4.4%) |
| $15,000 to $17,499 | 0 (0.0%) | 3 (1.5%) |
| $17,500 to $19,999 | 0 (0.0%) | 0 (0.0%) |
| $20,000 to $22,499 | 14 (9.8%) | 0 (0.0%) |
| $22,500 to $24,999 | 0 (0.0%) | 21 (10.3%) |
| $25,000 to $29,999 | 3 (2.1%) | 15 (7.4%) |
| $30,000 to $34,999 | 0 (0.0%) | 40 (19.7%) |
| $35,000 to $39,999 | 20 (14.0%) | 17 (8.4%) |
| $40,000 to $44,999 | 0 (0.0%) | 33 (16.3%) |
| $45,000 to $49,999 | 24 (16.8%) | 9 (4.4%) |
| $50,000 to $54,999 | 4 (2.8%) | 6 (3.0%) |
| $55,000 to $64,999 | 31 (21.7%) | 0 (0.0%) |
| $65,000 to $74,999 | 24 (16.8%) | 0 (0.0%) |
| $75,000 to $99,999 | 13 (9.1%) | 3 (1.5%) |
| $100,000+ | 4 (2.8%) | 3 (1.5%) |
| Total | 143 (100.0%) | 203 (100.0%) |
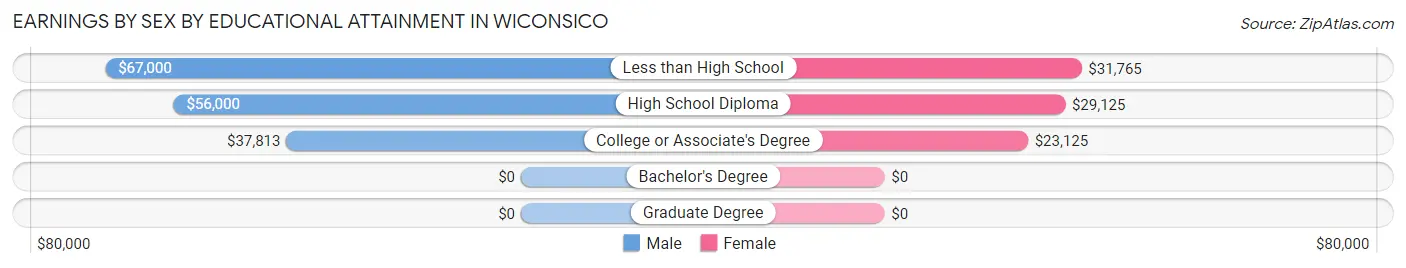
Earnings by Sex by Educational Attainment in Wiconsico
Average earnings in Wiconsico are $55,250 for men and $29,688 for women, a difference of 46.3%. Men with an educational attainment of less than high school enjoy the highest average annual earnings of $67,000, while those with college or associate's degree education earn the least with $37,813. Women with an educational attainment of less than high school earn the most with the average annual earnings of $31,765, while those with college or associate's degree education have the smallest earnings of $23,125.
| Educational Attainment | Male Income | Female Income |
| Less than High School | $67,000 | $31,765 |
| High School Diploma | $56,000 | $29,125 |
| College or Associate's Degree | $37,813 | $23,125 |
| Bachelor's Degree | - | - |
| Graduate Degree | - | - |
| Total | $55,250 | $29,688 |
Family Income in Wiconsico
Family Income Brackets in Wiconsico
According to the Wiconsico family income data, there are 67 families falling into the $100,000 to $149,999 income range, which is the most common income bracket and makes up 27.9% of all families.
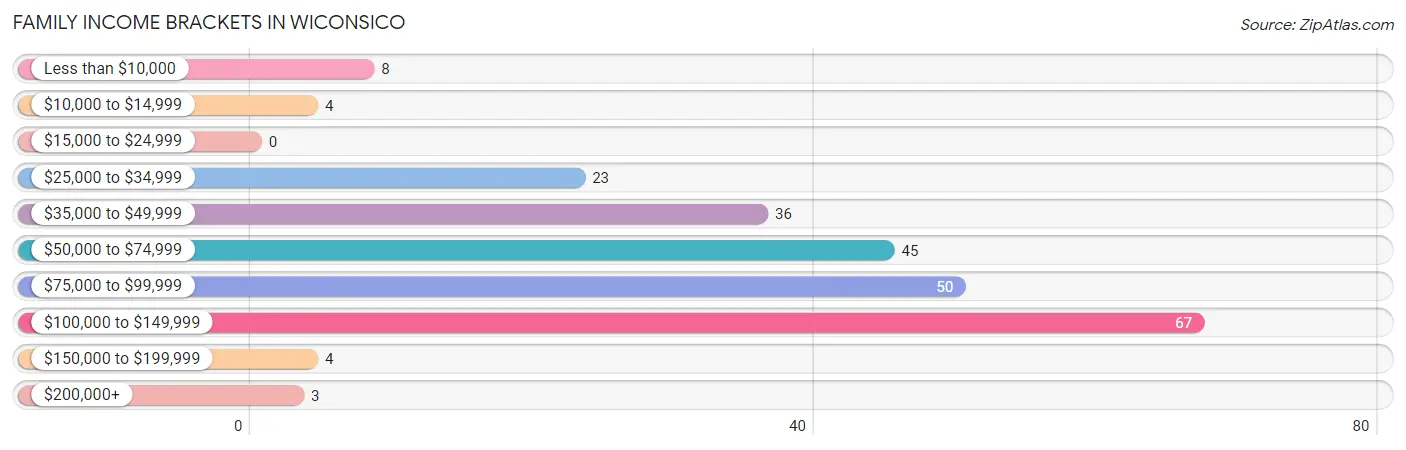
| Income Bracket | # Families | % Families |
| Less than $10,000 | 8 | 3.3% |
| $10,000 to $14,999 | 4 | 1.7% |
| $15,000 to $24,999 | 0 | 0.0% |
| $25,000 to $34,999 | 23 | 9.6% |
| $35,000 to $49,999 | 36 | 15.0% |
| $50,000 to $74,999 | 45 | 18.8% |
| $75,000 to $99,999 | 50 | 20.8% |
| $100,000 to $149,999 | 67 | 27.9% |
| $150,000 to $199,999 | 4 | 1.7% |
| $200,000+ | 3 | 1.3% |
Family Income by Famaliy Size in Wiconsico
2-person families (149 | 62.1%) account for the highest median family income in Wiconsico with $64,688 per family, while 2-person families (149 | 62.1%) have the highest median income of $32,344 per family member.
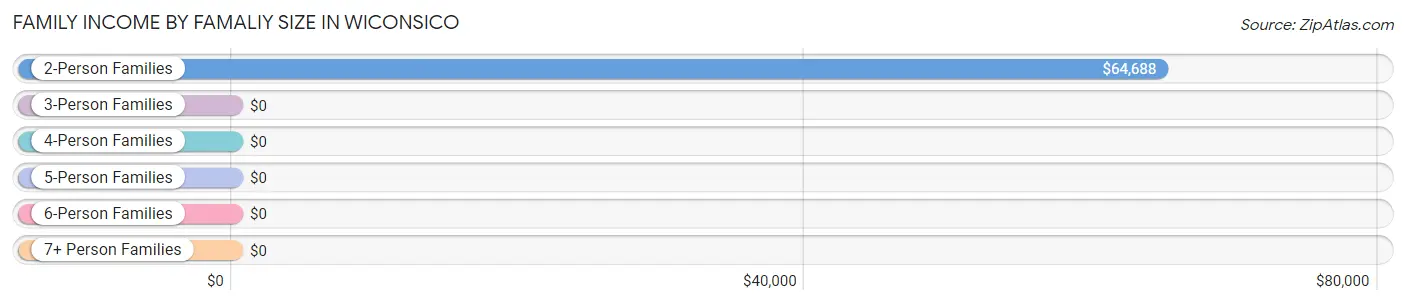
| Income Bracket | # Families | Median Income |
| 2-Person Families | 149 (62.1%) | $64,688 |
| 3-Person Families | 43 (17.9%) | $0 |
| 4-Person Families | 17 (7.1%) | $0 |
| 5-Person Families | 13 (5.4%) | $0 |
| 6-Person Families | 0 (0.0%) | $0 |
| 7+ Person Families | 18 (7.5%) | $0 |
| Total | 240 (100.0%) | $78,056 |
Family Income by Number of Earners in Wiconsico
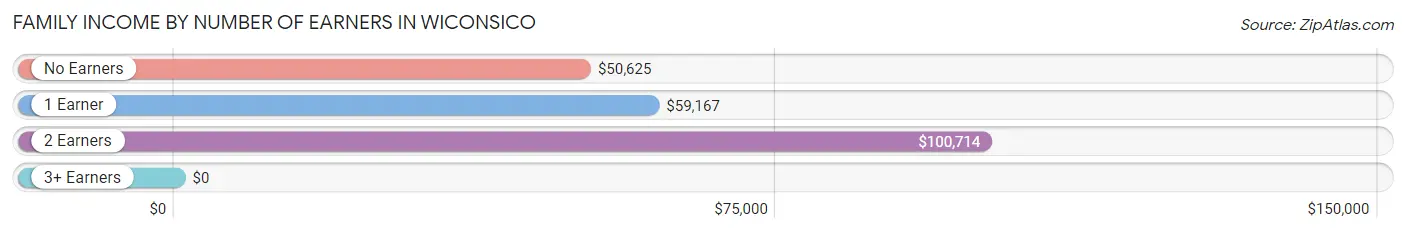
| Number of Earners | # Families | Median Income |
| No Earners | 44 (18.3%) | $50,625 |
| 1 Earner | 94 (39.2%) | $59,167 |
| 2 Earners | 102 (42.5%) | $100,714 |
| 3+ Earners | 0 (0.0%) | $0 |
| Total | 240 (100.0%) | $78,056 |
Household Income in Wiconsico
Household Income Brackets in Wiconsico
With 67 households falling in the category, the $100,000 to $149,999 income range is the most frequent in Wiconsico, accounting for 21.0% of all households.
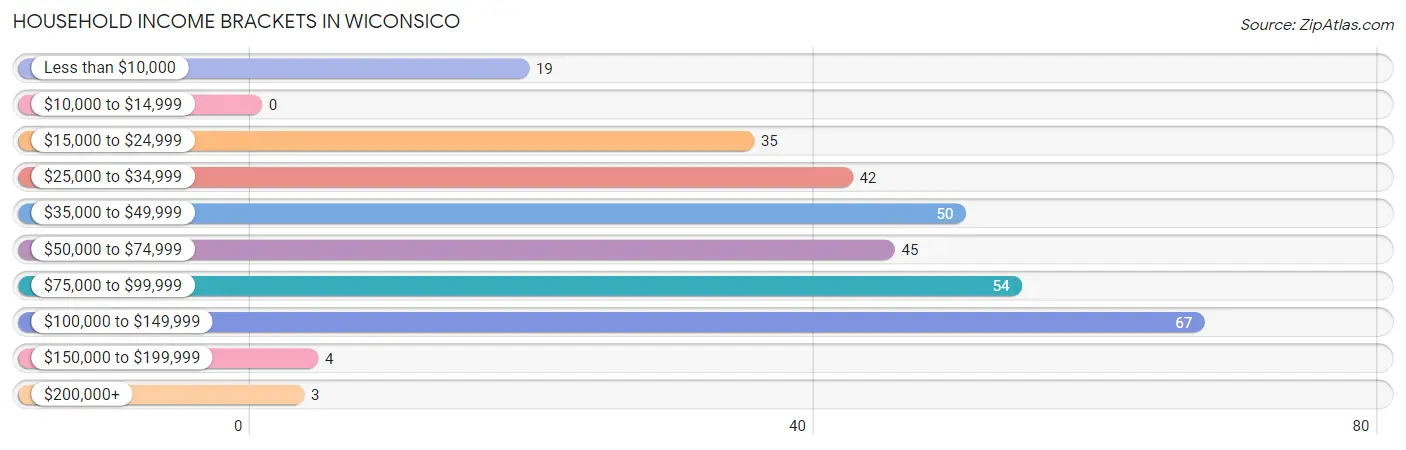
| Income Bracket | # Households | % Households |
| Less than $10,000 | 19 | 6.0% |
| $10,000 to $14,999 | 0 | 0.0% |
| $15,000 to $24,999 | 35 | 11.0% |
| $25,000 to $34,999 | 42 | 13.2% |
| $35,000 to $49,999 | 50 | 15.7% |
| $50,000 to $74,999 | 45 | 14.1% |
| $75,000 to $99,999 | 54 | 16.9% |
| $100,000 to $149,999 | 67 | 21.0% |
| $150,000 to $199,999 | 4 | 1.3% |
| $200,000+ | 3 | 0.9% |
Household Income by Householder Age in Wiconsico
The median household income in Wiconsico is $55,938, with the highest median household income of $88,839 found in the 25 to 44 years age bracket for the primary householder. A total of 83 households (26.0%) fall into this category. Meanwhile, the 15 to 24 years age bracket for the primary householder has the lowest median household income of $0, with 16 households (5.0%) in this group.
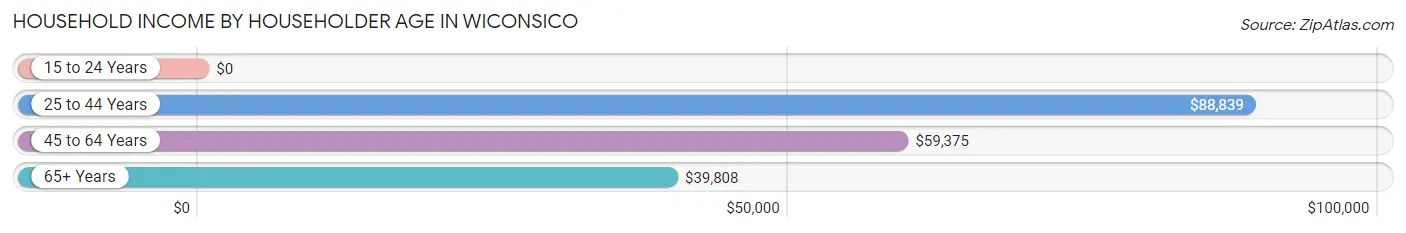
| Income Bracket | # Households | Median Income |
| 15 to 24 Years | 16 (5.0%) | $0 |
| 25 to 44 Years | 83 (26.0%) | $88,839 |
| 45 to 64 Years | 124 (38.9%) | $59,375 |
| 65+ Years | 96 (30.1%) | $39,808 |
| Total | 319 (100.0%) | $55,938 |
Poverty in Wiconsico
Income Below Poverty by Sex and Age in Wiconsico
With 12.2% poverty level for males and 14.8% for females among the residents of Wiconsico, 35 to 44 year old males and under 5 year old females are the most vulnerable to poverty, with 5 males (41.7%) and 13 females (100.0%) in their respective age groups living below the poverty level.
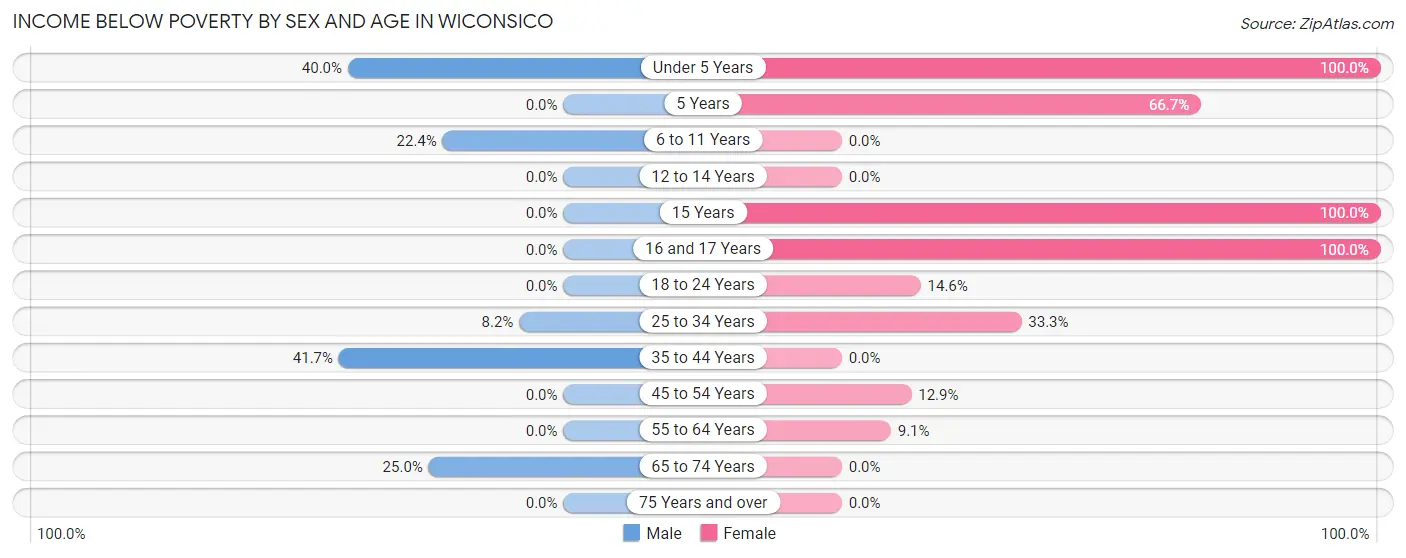
| Age Bracket | Male | Female |
| Under 5 Years | 18 (40.0%) | 13 (100.0%) |
| 5 Years | 0 (0.0%) | 4 (66.7%) |
| 6 to 11 Years | 13 (22.4%) | 0 (0.0%) |
| 12 to 14 Years | 0 (0.0%) | 0 (0.0%) |
| 15 Years | 0 (0.0%) | 3 (100.0%) |
| 16 and 17 Years | 0 (0.0%) | 3 (100.0%) |
| 18 to 24 Years | 0 (0.0%) | 6 (14.6%) |
| 25 to 34 Years | 5 (8.2%) | 13 (33.3%) |
| 35 to 44 Years | 5 (41.7%) | 0 (0.0%) |
| 45 to 54 Years | 0 (0.0%) | 4 (12.9%) |
| 55 to 64 Years | 0 (0.0%) | 8 (9.1%) |
| 65 to 74 Years | 10 (25.0%) | 0 (0.0%) |
| 75 Years and over | 0 (0.0%) | 0 (0.0%) |
| Total | 51 (12.2%) | 54 (14.8%) |
Income Above Poverty by Sex and Age in Wiconsico
According to the poverty statistics in Wiconsico, males aged 5 years and females aged 6 to 11 years are the age groups that are most secure financially, with 100.0% of males and 100.0% of females in these age groups living above the poverty line.
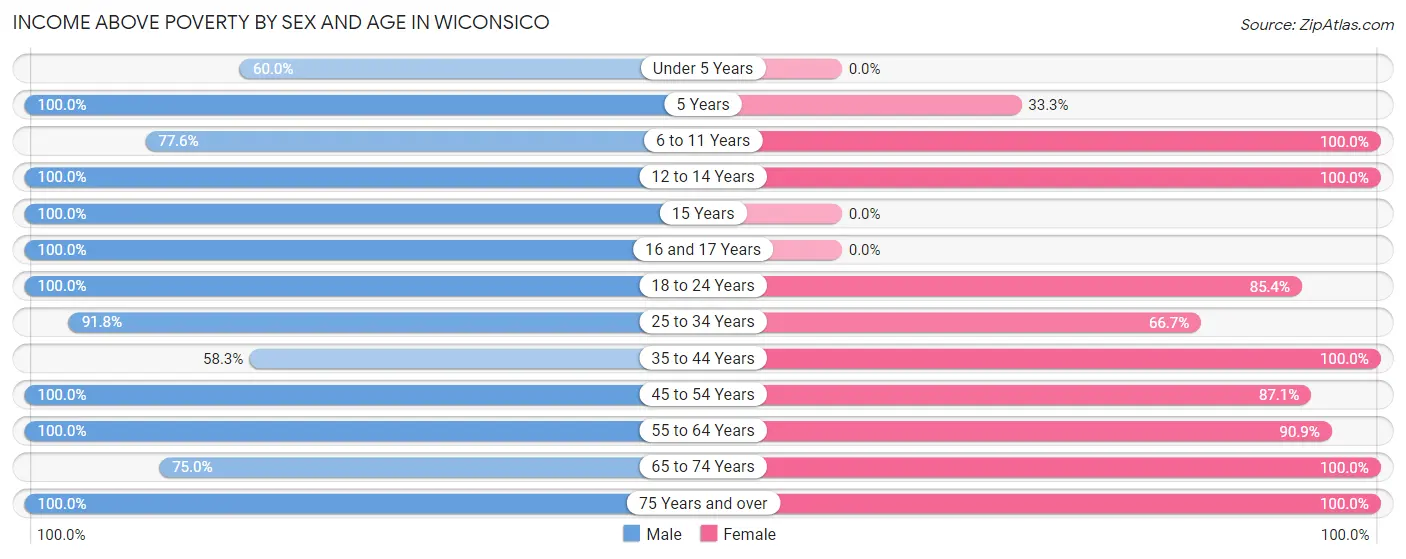
| Age Bracket | Male | Female |
| Under 5 Years | 27 (60.0%) | 0 (0.0%) |
| 5 Years | 17 (100.0%) | 2 (33.3%) |
| 6 to 11 Years | 45 (77.6%) | 20 (100.0%) |
| 12 to 14 Years | 3 (100.0%) | 13 (100.0%) |
| 15 Years | 18 (100.0%) | 0 (0.0%) |
| 16 and 17 Years | 32 (100.0%) | 0 (0.0%) |
| 18 to 24 Years | 18 (100.0%) | 35 (85.4%) |
| 25 to 34 Years | 56 (91.8%) | 26 (66.7%) |
| 35 to 44 Years | 7 (58.3%) | 39 (100.0%) |
| 45 to 54 Years | 37 (100.0%) | 27 (87.1%) |
| 55 to 64 Years | 48 (100.0%) | 80 (90.9%) |
| 65 to 74 Years | 30 (75.0%) | 36 (100.0%) |
| 75 Years and over | 30 (100.0%) | 33 (100.0%) |
| Total | 368 (87.8%) | 311 (85.2%) |
Income Below Poverty Among Married-Couple Families in Wiconsico
The poverty statistics for married-couple families in Wiconsico show that 2.7% or 5 of the total 187 families live below the poverty line. Families with 3 or 4 children have the highest poverty rate of 100.0%, comprising of 5 families. On the other hand, families with no children have the lowest poverty rate of 0.0%, which includes 0 families.
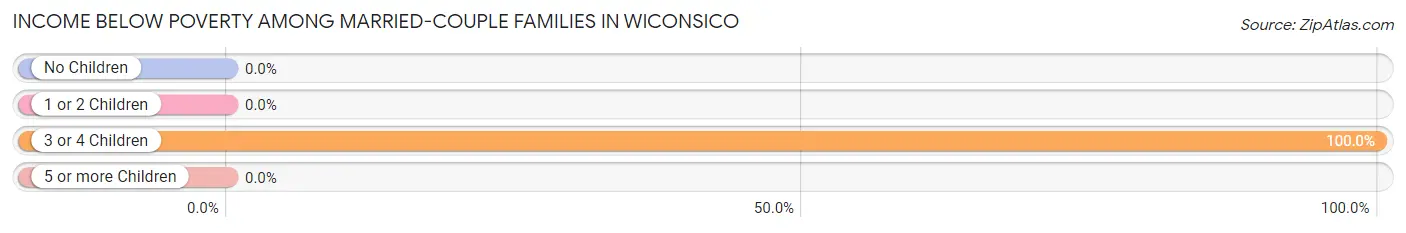
| Children | Above Poverty | Below Poverty |
| No Children | 145 (100.0%) | 0 (0.0%) |
| 1 or 2 Children | 19 (100.0%) | 0 (0.0%) |
| 3 or 4 Children | 0 (0.0%) | 5 (100.0%) |
| 5 or more Children | 18 (100.0%) | 0 (0.0%) |
| Total | 182 (97.3%) | 5 (2.7%) |
Income Below Poverty Among Single-Parent Households in Wiconsico
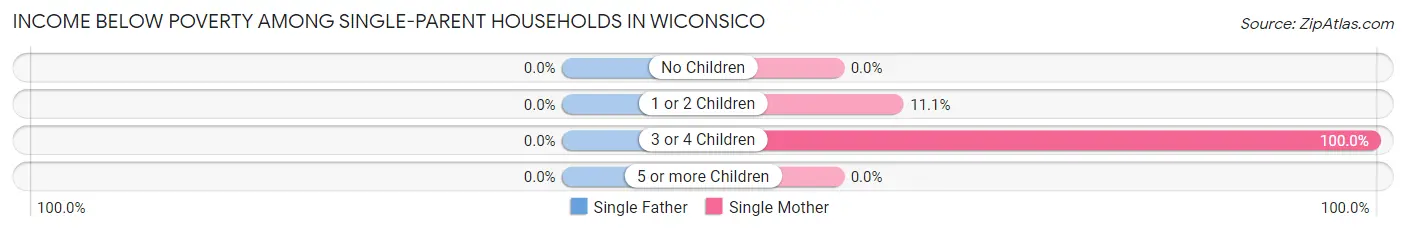
| Children | Single Father | Single Mother |
| No Children | 0 (0.0%) | 0 (0.0%) |
| 1 or 2 Children | 0 (0.0%) | 4 (11.1%) |
| 3 or 4 Children | 0 (0.0%) | 8 (100.0%) |
| 5 or more Children | 0 (0.0%) | 0 (0.0%) |
| Total | 0 (0.0%) | 12 (27.3%) |
Income Below Poverty Among Married-Couple vs Single-Parent Households in Wiconsico
The poverty data for Wiconsico shows that 5 of the married-couple family households (2.7%) and 12 of the single-parent households (22.6%) are living below the poverty level. Within the married-couple family households, those with 3 or 4 children have the highest poverty rate, with 5 households (100.0%) falling below the poverty line. Among the single-parent households, those with 3 or 4 children have the highest poverty rate, with 8 household (100.0%) living below poverty.
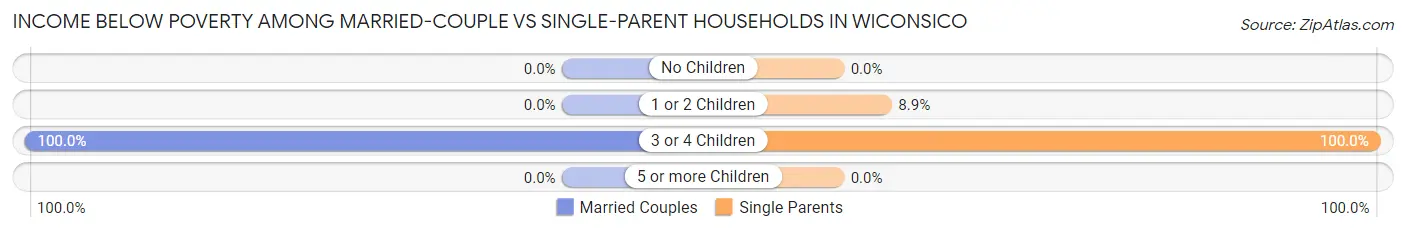
| Children | Married-Couple Families | Single-Parent Households |
| No Children | 0 (0.0%) | 0 (0.0%) |
| 1 or 2 Children | 0 (0.0%) | 4 (8.9%) |
| 3 or 4 Children | 5 (100.0%) | 8 (100.0%) |
| 5 or more Children | 0 (0.0%) | 0 (0.0%) |
| Total | 5 (2.7%) | 12 (22.6%) |
Race in Wiconsico
The most populous races in Wiconsico are White / Caucasian (755 | 96.3%), Asian (21 | 2.7%), and Two or more Races (8 | 1.0%).
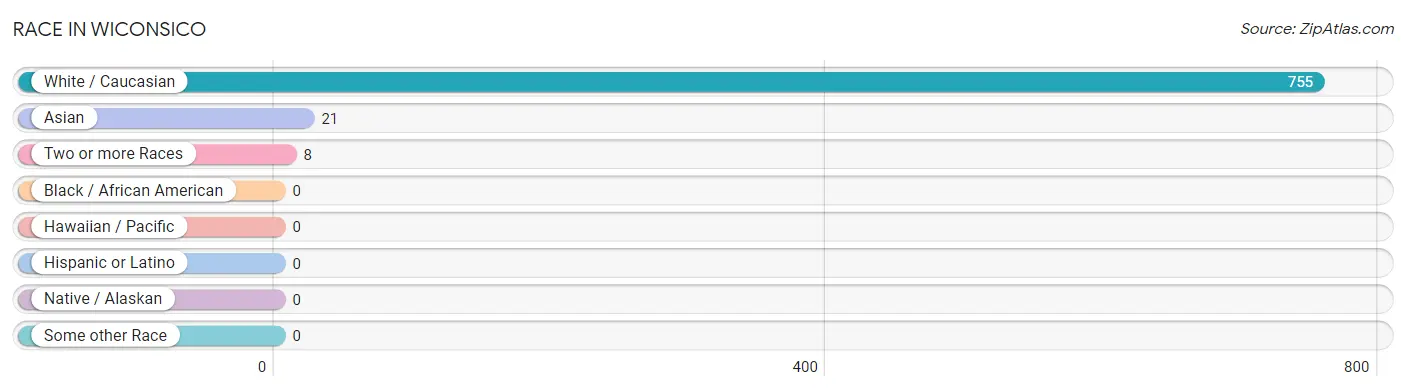
| Race | # Population | % Population |
| Asian | 21 | 2.7% |
| Black / African American | 0 | 0.0% |
| Hawaiian / Pacific | 0 | 0.0% |
| Hispanic or Latino | 0 | 0.0% |
| Native / Alaskan | 0 | 0.0% |
| White / Caucasian | 755 | 96.3% |
| Two or more Races | 8 | 1.0% |
| Some other Race | 0 | 0.0% |
| Total | 784 | 100.0% |
Ancestry in Wiconsico
The most populous ancestries reported in Wiconsico are German (287 | 36.6%), American (104 | 13.3%), Irish (97 | 12.4%), Polish (33 | 4.2%), and English (28 | 3.6%), together accounting for 70.0% of all Wiconsico residents.
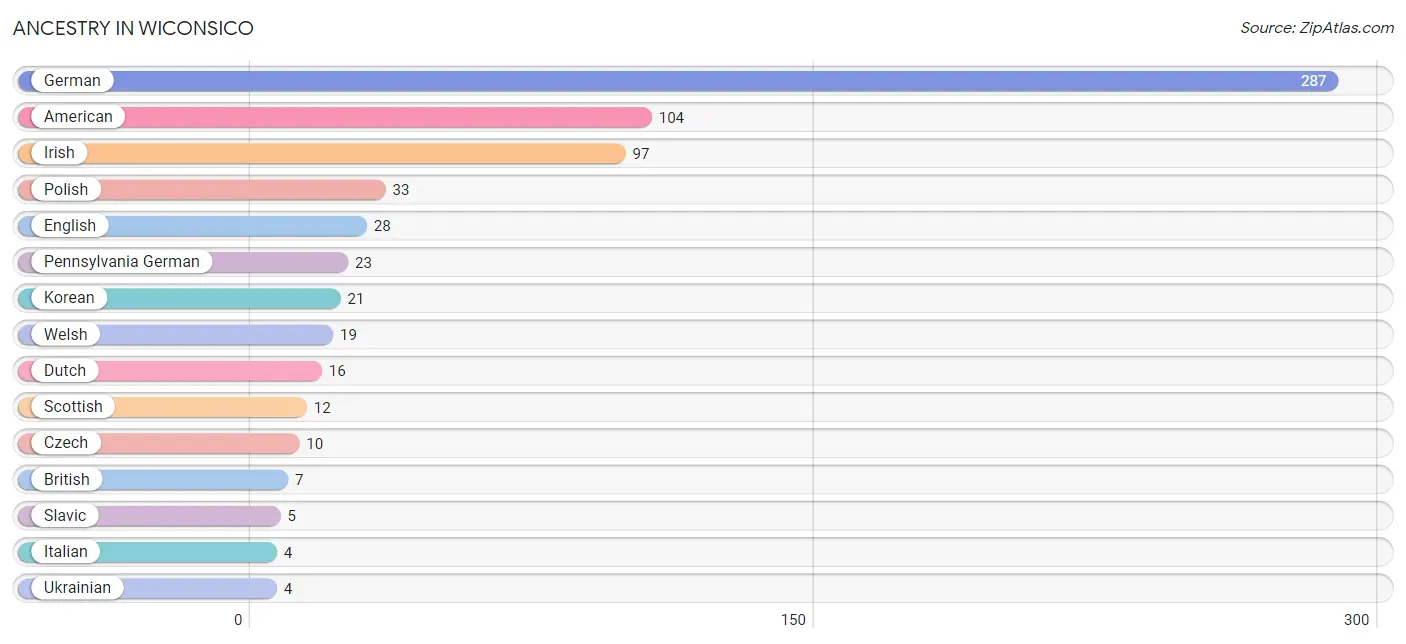
| Ancestry | # Population | % Population |
| American | 104 | 13.3% |
| British | 7 | 0.9% |
| Czech | 10 | 1.3% |
| Dutch | 16 | 2.0% |
| English | 28 | 3.6% |
| German | 287 | 36.6% |
| Irish | 97 | 12.4% |
| Italian | 4 | 0.5% |
| Korean | 21 | 2.7% |
| Pennsylvania German | 23 | 2.9% |
| Polish | 33 | 4.2% |
| Scottish | 12 | 1.5% |
| Slavic | 5 | 0.6% |
| Ukrainian | 4 | 0.5% |
| Welsh | 19 | 2.4% | View All 15 Rows |
Immigrants in Wiconsico
The most numerous immigrant groups reported in Wiconsico came from Asia (21 | 2.7%), Philippines (21 | 2.7%), and South Eastern Asia (21 | 2.7%), together accounting for 8.0% of all Wiconsico residents.
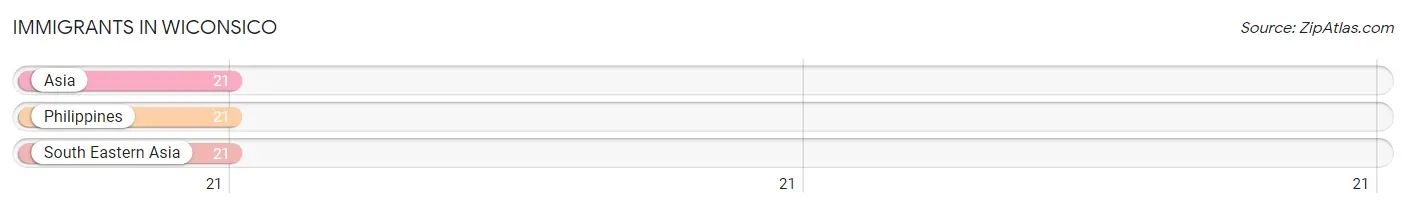
| Immigration Origin | # Population | % Population |
| Asia | 21 | 2.7% |
| Philippines | 21 | 2.7% |
| South Eastern Asia | 21 | 2.7% | View All 3 Rows |
Sex and Age in Wiconsico
Sex and Age in Wiconsico
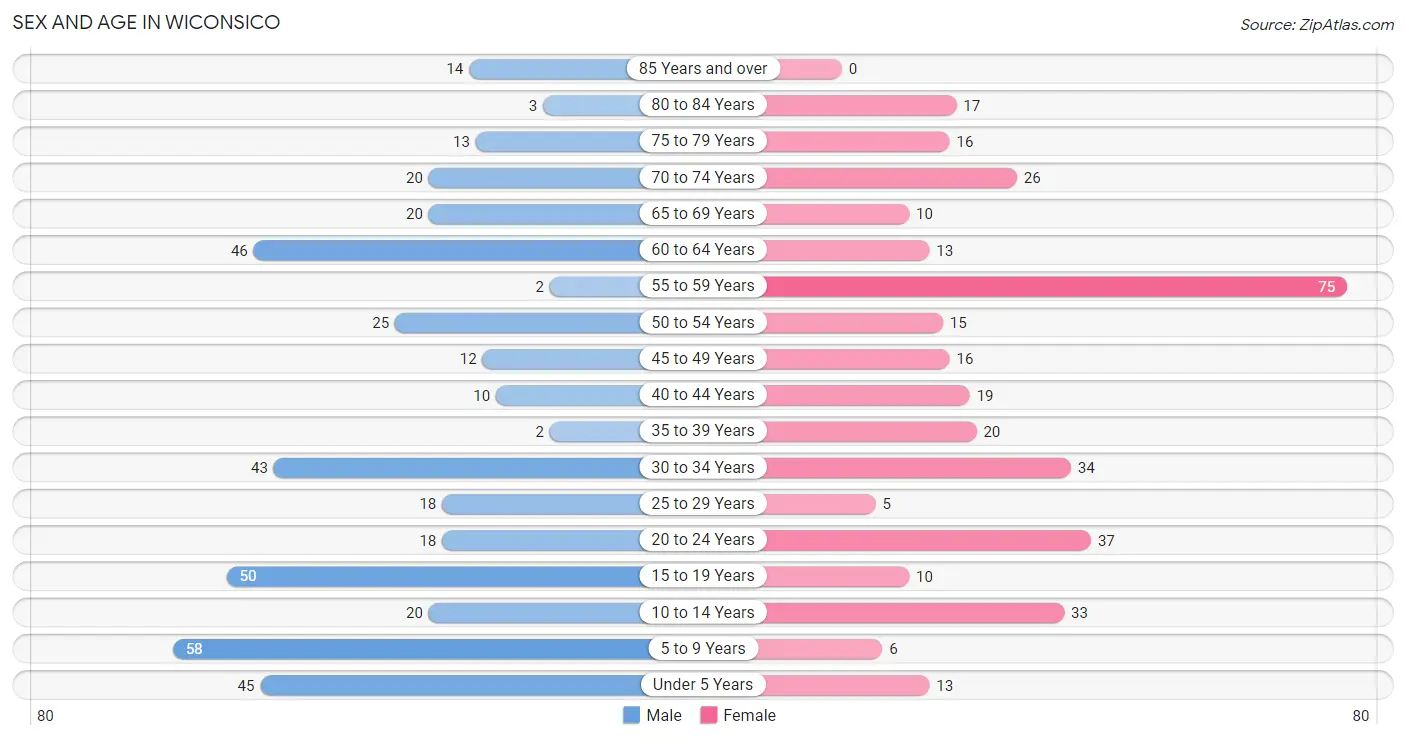
The most populous age groups in Wiconsico are 5 to 9 Years (58 | 13.8%) for men and 55 to 59 Years (75 | 20.5%) for women.
| Age Bracket | Male | Female |
| Under 5 Years | 45 (10.7%) | 13 (3.6%) |
| 5 to 9 Years | 58 (13.8%) | 6 (1.6%) |
| 10 to 14 Years | 20 (4.8%) | 33 (9.0%) |
| 15 to 19 Years | 50 (11.9%) | 10 (2.7%) |
| 20 to 24 Years | 18 (4.3%) | 37 (10.1%) |
| 25 to 29 Years | 18 (4.3%) | 5 (1.4%) |
| 30 to 34 Years | 43 (10.3%) | 34 (9.3%) |
| 35 to 39 Years | 2 (0.5%) | 20 (5.5%) |
| 40 to 44 Years | 10 (2.4%) | 19 (5.2%) |
| 45 to 49 Years | 12 (2.9%) | 16 (4.4%) |
| 50 to 54 Years | 25 (6.0%) | 15 (4.1%) |
| 55 to 59 Years | 2 (0.5%) | 75 (20.5%) |
| 60 to 64 Years | 46 (11.0%) | 13 (3.6%) |
| 65 to 69 Years | 20 (4.8%) | 10 (2.7%) |
| 70 to 74 Years | 20 (4.8%) | 26 (7.1%) |
| 75 to 79 Years | 13 (3.1%) | 16 (4.4%) |
| 80 to 84 Years | 3 (0.7%) | 17 (4.7%) |
| 85 Years and over | 14 (3.3%) | 0 (0.0%) |
| Total | 419 (100.0%) | 365 (100.0%) |
Families and Households in Wiconsico
Median Family Size in Wiconsico
The median family size in Wiconsico is 2.83 persons per family, with single female/mother families (44 | 18.3%) accounting for the largest median family size of 3.34 persons per family. On the other hand, single male/father families (9 | 3.7%) represent the smallest median family size with 2.44 persons per family.
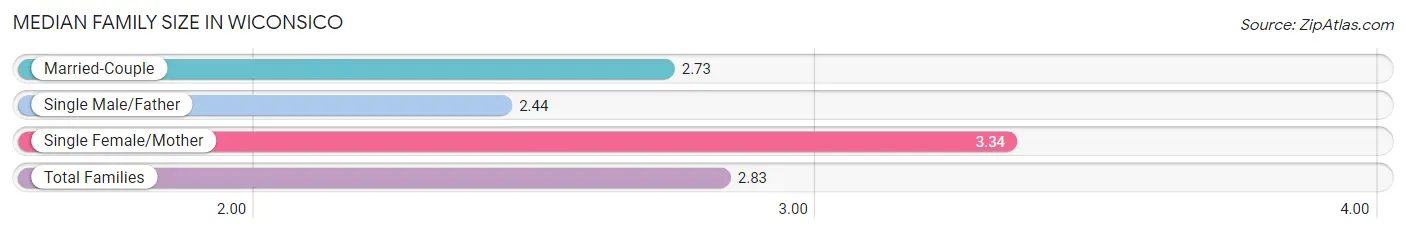
| Family Type | # Families | Family Size |
| Married-Couple | 187 (77.9%) | 2.73 |
| Single Male/Father | 9 (3.7%) | 2.44 |
| Single Female/Mother | 44 (18.3%) | 3.34 |
| Total Families | 240 (100.0%) | 2.83 |
Median Household Size in Wiconsico
The median household size in Wiconsico is 2.46 persons per household, with single female/mother households (44 | 13.8%) accounting for the largest median household size of 3.41 persons per household. non-family households (79 | 24.8%) represent the smallest median household size with 1.22 persons per household.
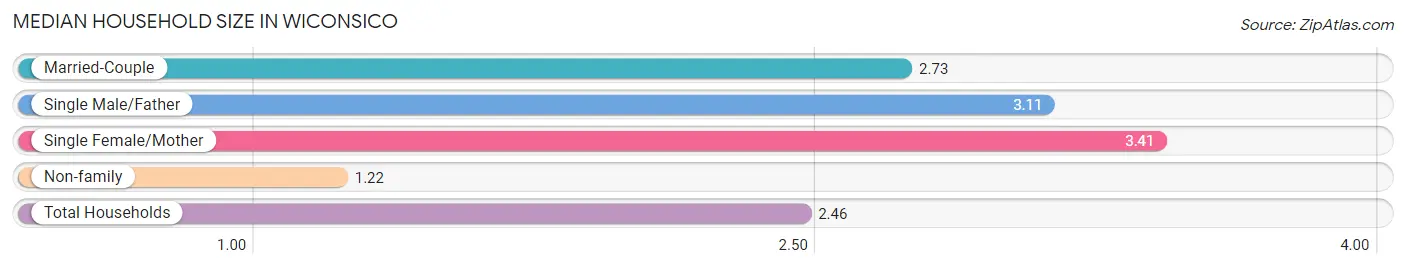
| Household Type | # Households | Household Size |
| Married-Couple | 187 (58.6%) | 2.73 |
| Single Male/Father | 9 (2.8%) | 3.11 |
| Single Female/Mother | 44 (13.8%) | 3.41 |
| Non-family | 79 (24.8%) | 1.22 |
| Total Households | 319 (100.0%) | 2.46 |
Household Size by Marriage Status in Wiconsico
Out of a total of 319 households in Wiconsico, 240 (75.2%) are family households, while 79 (24.8%) are nonfamily households. The most numerous type of family households are 2-person households, comprising 145, and the most common type of nonfamily households are 1-person households, comprising 65.
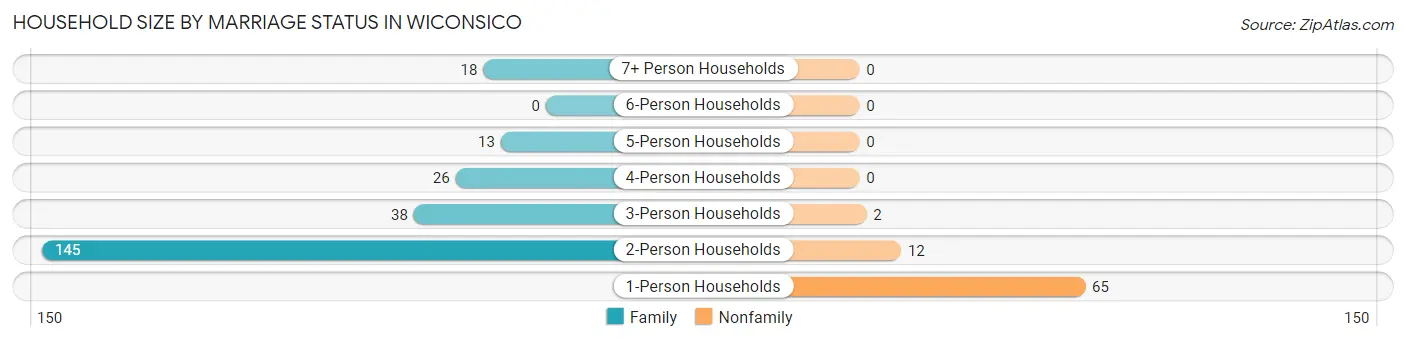
| Household Size | Family Households | Nonfamily Households |
| 1-Person Households | - | 65 (20.4%) |
| 2-Person Households | 145 (45.5%) | 12 (3.8%) |
| 3-Person Households | 38 (11.9%) | 2 (0.6%) |
| 4-Person Households | 26 (8.2%) | 0 (0.0%) |
| 5-Person Households | 13 (4.1%) | 0 (0.0%) |
| 6-Person Households | 0 (0.0%) | 0 (0.0%) |
| 7+ Person Households | 18 (5.6%) | 0 (0.0%) |
| Total | 240 (75.2%) | 79 (24.8%) |
Female Fertility in Wiconsico
Fertility by Age in Wiconsico
Average fertility rate in Wiconsico is 153.0 births per 1,000 women. Women in the age bracket of 20 to 34 years have the highest fertility rate with 289.0 births per 1,000 women. Women in the age bracket of 20 to 34 years acount for 100.0% of all women with births.
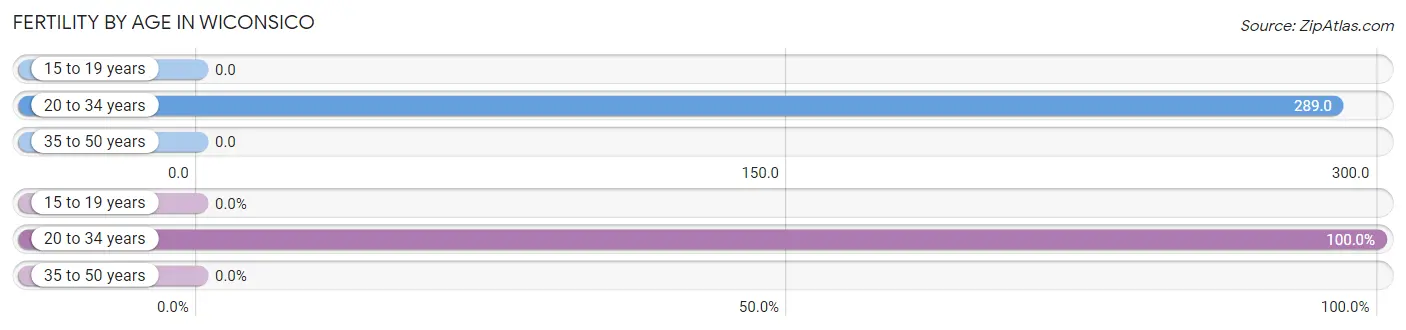
| Age Bracket | Women with Births | Births / 1,000 Women |
| 15 to 19 years | 0 (0.0%) | 0.0 |
| 20 to 34 years | 22 (100.0%) | 289.0 |
| 35 to 50 years | 0 (0.0%) | 0.0 |
| Total | 22 (100.0%) | 153.0 |
Fertility by Age by Marriage Status in Wiconsico
72.7% of women with births (22) in Wiconsico are married. The highest percentage of unmarried women with births falls into 20 to 34 years age bracket with 27.3% of them unmarried at the time of birth, while the lowest percentage of unmarried women with births belong to 20 to 34 years age bracket with 27.3% of them unmarried.
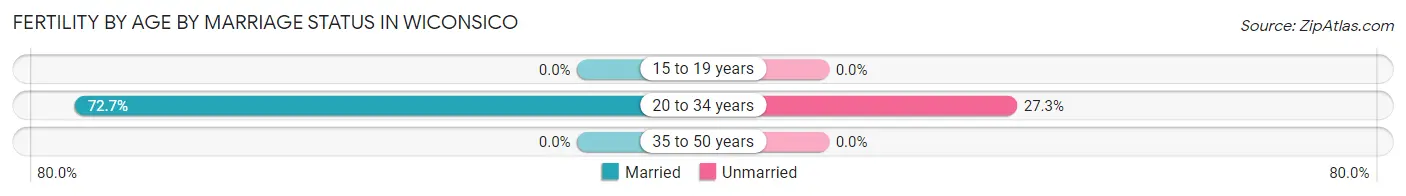
| Age Bracket | Married | Unmarried |
| 15 to 19 years | 0 (0.0%) | 0 (0.0%) |
| 20 to 34 years | 16 (72.7%) | 6 (27.3%) |
| 35 to 50 years | 0 (0.0%) | 0 (0.0%) |
| Total | 16 (72.7%) | 6 (27.3%) |
Fertility by Education in Wiconsico
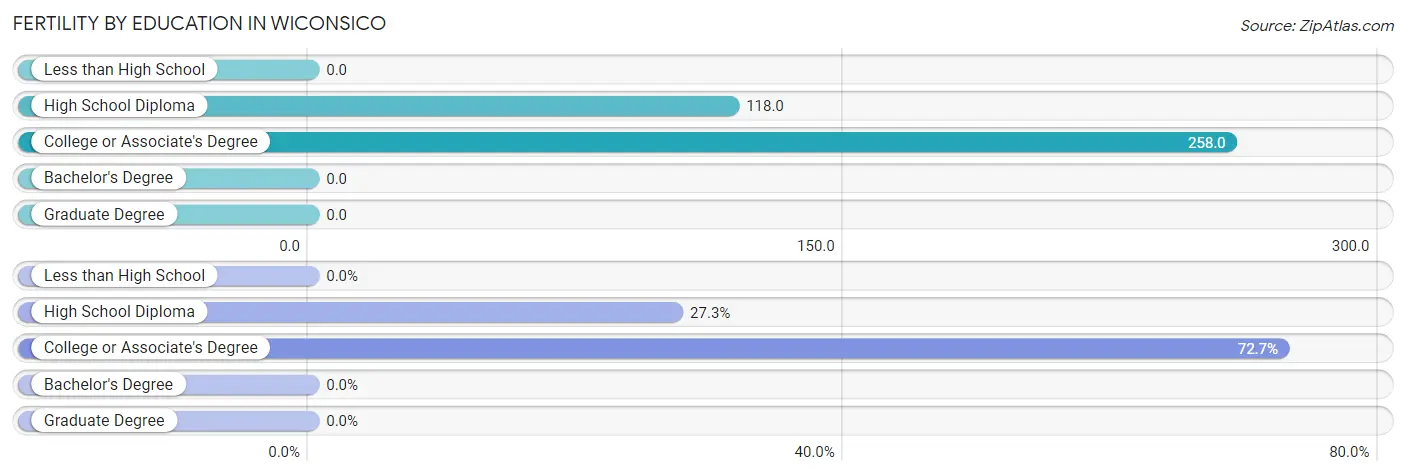
| Educational Attainment | Women with Births | Births / 1,000 Women |
| Less than High School | 0 (0.0%) | 0.0 |
| High School Diploma | 6 (27.3%) | 118.0 |
| College or Associate's Degree | 16 (72.7%) | 258.0 |
| Bachelor's Degree | 0 (0.0%) | 0.0 |
| Graduate Degree | 0 (0.0%) | 0.0 |
| Total | 22 (100.0%) | 153.0 |
Fertility by Education by Marriage Status in Wiconsico
27.3% of women with births in Wiconsico are unmarried. Women with the educational attainment of college or associate's degree are most likely to be married with 100.0% of them married at childbirth, while women with the educational attainment of high school diploma are least likely to be married with 100.0% of them unmarried at childbirth.
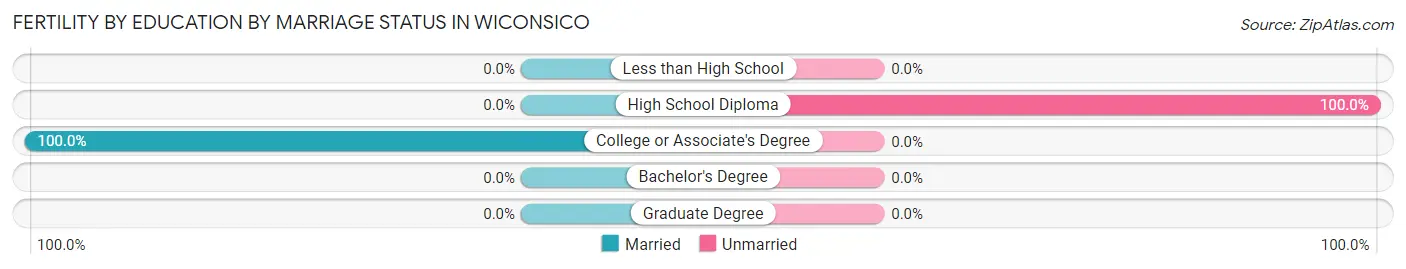
| Educational Attainment | Married | Unmarried |
| Less than High School | 0 (0.0%) | 0 (0.0%) |
| High School Diploma | 0 (0.0%) | 6 (100.0%) |
| College or Associate's Degree | 16 (100.0%) | 0 (0.0%) |
| Bachelor's Degree | 0 (0.0%) | 0 (0.0%) |
| Graduate Degree | 0 (0.0%) | 0 (0.0%) |
| Total | 16 (72.7%) | 6 (27.3%) |
Employment Characteristics in Wiconsico
Employment by Class of Employer in Wiconsico
Among the 308 employed individuals in Wiconsico, private company employees (216 | 70.1%), not-for-profit organizations (30 | 9.7%), and state government employees (23 | 7.5%) make up the most common classes of employment.
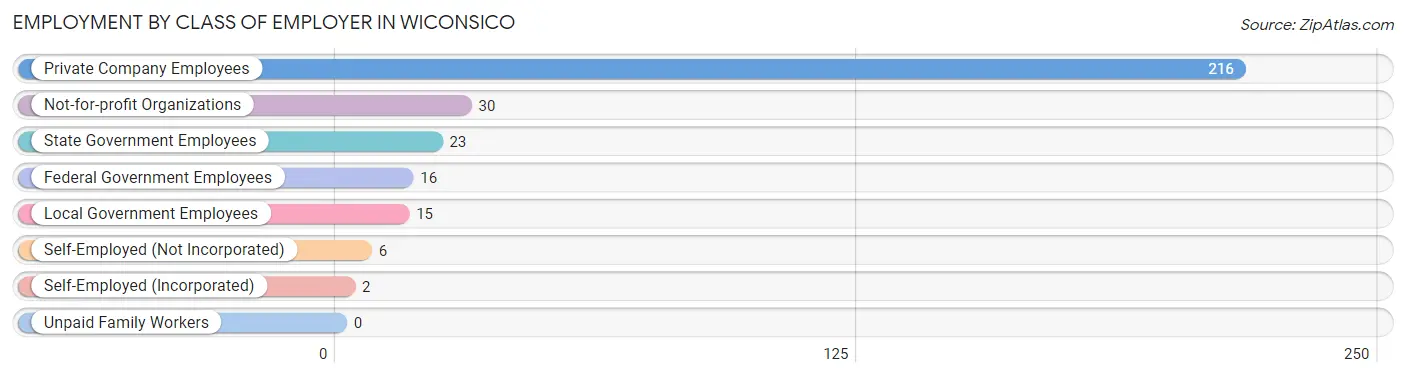
| Employer Class | # Employees | % Employees |
| Private Company Employees | 216 | 70.1% |
| Self-Employed (Incorporated) | 2 | 0.6% |
| Self-Employed (Not Incorporated) | 6 | 1.9% |
| Not-for-profit Organizations | 30 | 9.7% |
| Local Government Employees | 15 | 4.9% |
| State Government Employees | 23 | 7.5% |
| Federal Government Employees | 16 | 5.2% |
| Unpaid Family Workers | 0 | 0.0% |
| Total | 308 | 100.0% |
Employment Status by Age in Wiconsico
According to the labor force statistics for Wiconsico, out of the total population over 16 years of age (588), 59.0% or 347 individuals are in the labor force, with 8.2% or 28 of them unemployed. The age group with the highest labor force participation rate is 20 to 24 years, with 100.0% or 55 individuals in the labor force. Within the labor force, the 30 to 34 years age range has the highest percentage of unemployed individuals, with 33.3% or 24 of them being unemployed.
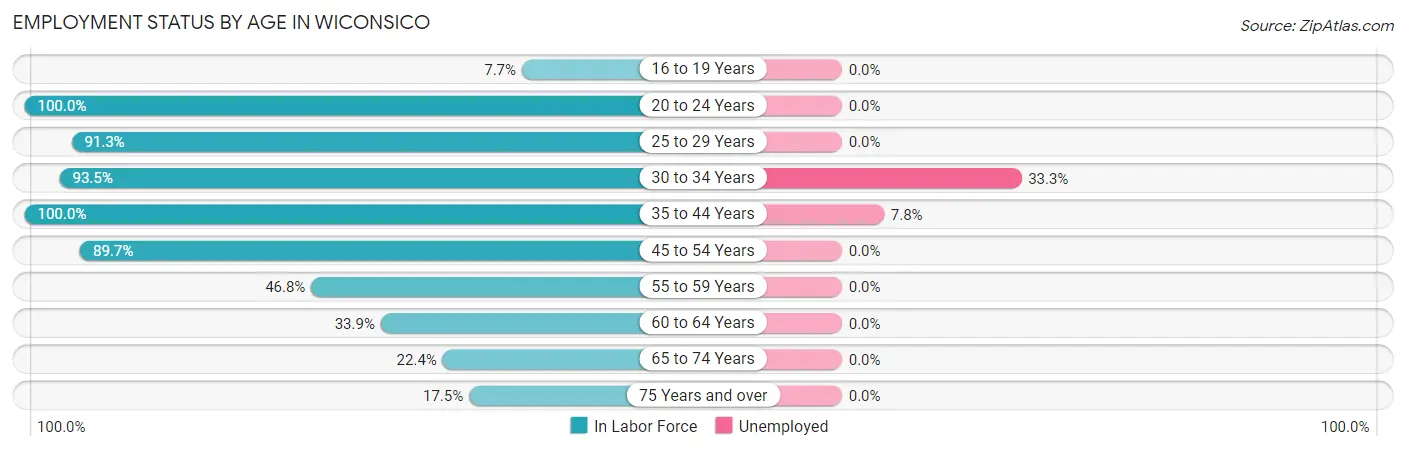
| Age Bracket | In Labor Force | Unemployed |
| 16 to 19 Years | 3 (7.7%) | 0 (0.0%) |
| 20 to 24 Years | 55 (100.0%) | 0 (0.0%) |
| 25 to 29 Years | 21 (91.3%) | 0 (0.0%) |
| 30 to 34 Years | 72 (93.5%) | 24 (33.3%) |
| 35 to 44 Years | 51 (100.0%) | 4 (7.8%) |
| 45 to 54 Years | 61 (89.7%) | 0 (0.0%) |
| 55 to 59 Years | 36 (46.8%) | 0 (0.0%) |
| 60 to 64 Years | 20 (33.9%) | 0 (0.0%) |
| 65 to 74 Years | 17 (22.4%) | 0 (0.0%) |
| 75 Years and over | 11 (17.5%) | 0 (0.0%) |
| Total | 347 (59.0%) | 28 (8.2%) |
Employment Status by Educational Attainment in Wiconsico
According to labor force statistics for Wiconsico, 73.5% of individuals (261) out of the total population between 25 and 64 years of age (355) are in the labor force, with 10.9% or 28 of them being unemployed. The group with the highest labor force participation rate are those with the educational attainment of college / associate degree, with 95.2% or 100 individuals in the labor force. Within the labor force, individuals with college / associate degree education have the highest percentage of unemployment, with 26.0% or 26 of them being unemployed.
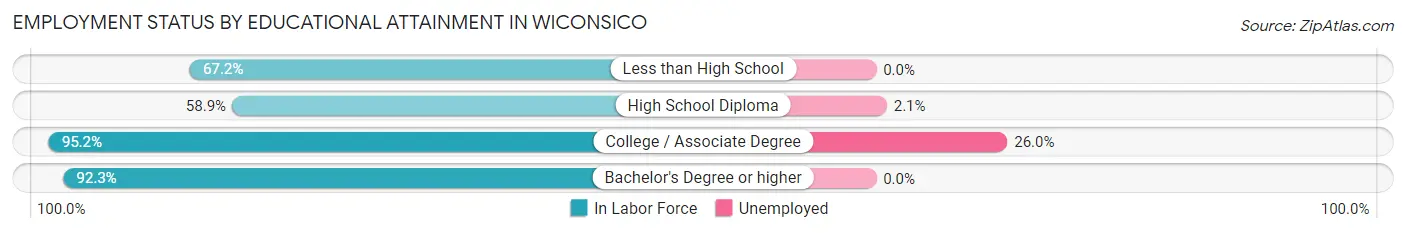
| Educational Attainment | In Labor Force | Unemployed |
| Less than High School | 41 (67.2%) | 0 (0.0%) |
| High School Diploma | 96 (58.9%) | 3 (2.1%) |
| College / Associate Degree | 100 (95.2%) | 27 (26.0%) |
| Bachelor's Degree or higher | 24 (92.3%) | 0 (0.0%) |
| Total | 261 (73.5%) | 39 (10.9%) |
Employment Occupations by Sex in Wiconsico
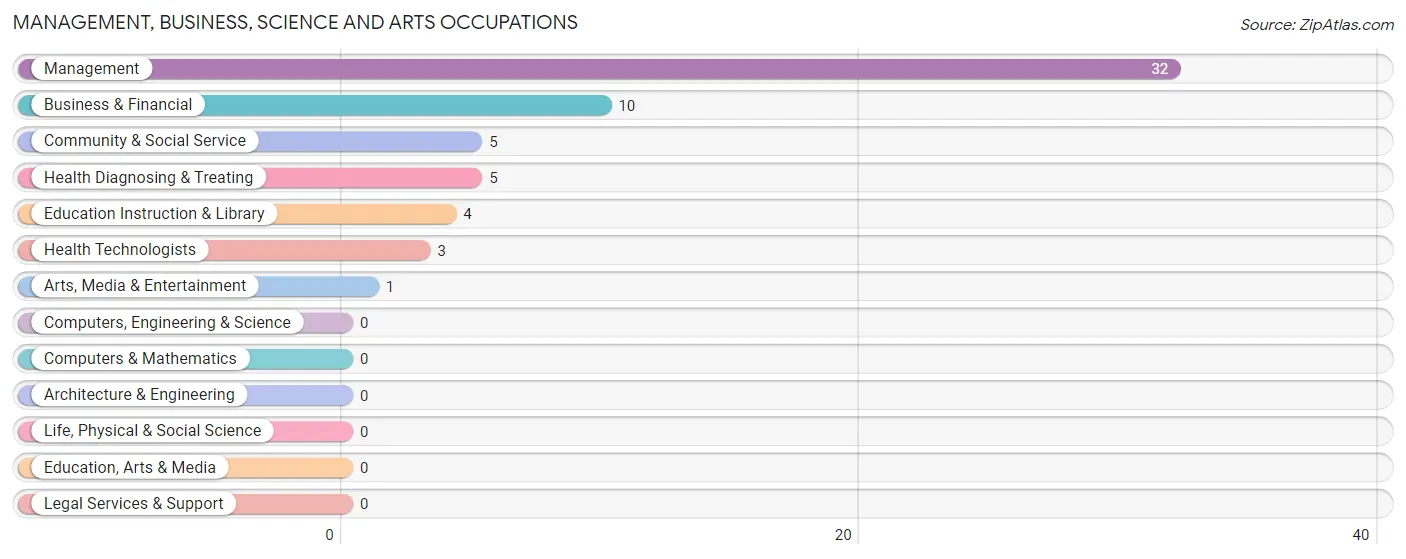
Management, Business, Science and Arts Occupations
The most common Management, Business, Science and Arts occupations in Wiconsico are Management (32 | 10.2%), Business & Financial (10 | 3.2%), Community & Social Service (5 | 1.6%), Health Diagnosing & Treating (5 | 1.6%), and Education Instruction & Library (4 | 1.3%).
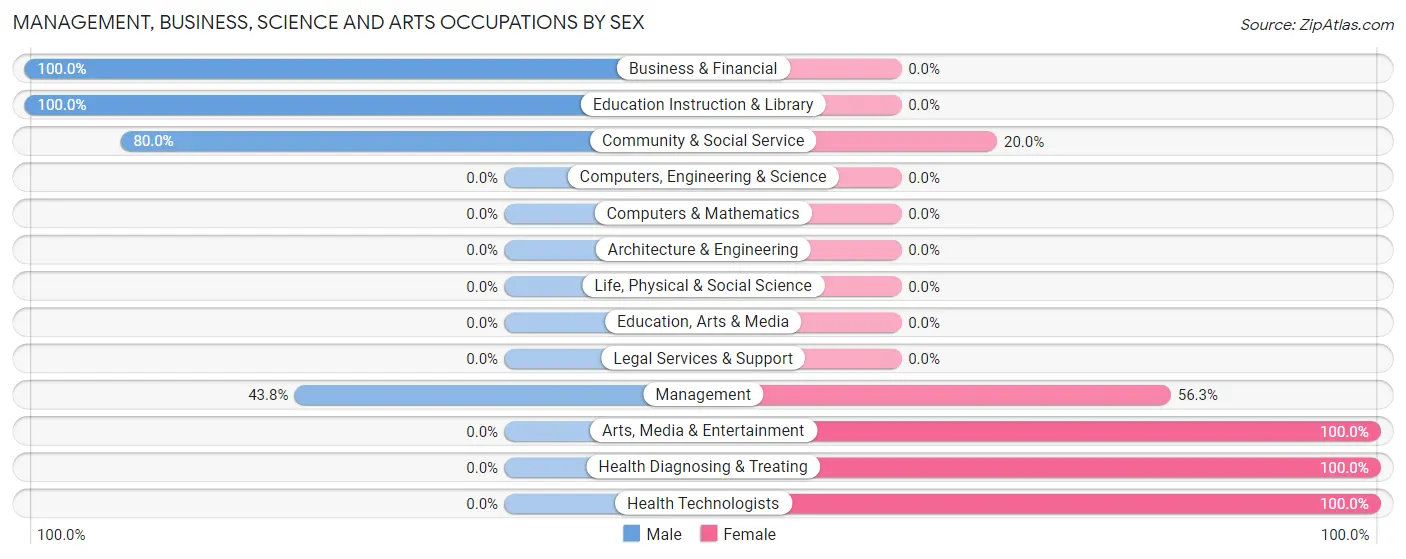
Management, Business, Science and Arts Occupations by Sex
Within the Management, Business, Science and Arts occupations in Wiconsico, the most male-oriented occupations are Business & Financial (100.0%), Education Instruction & Library (100.0%), and Community & Social Service (80.0%), while the most female-oriented occupations are Arts, Media & Entertainment (100.0%), Health Diagnosing & Treating (100.0%), and Health Technologists (100.0%).
| Occupation | Male | Female |
| Management | 14 (43.8%) | 18 (56.2%) |
| Business & Financial | 10 (100.0%) | 0 (0.0%) |
| Computers, Engineering & Science | 0 (0.0%) | 0 (0.0%) |
| Computers & Mathematics | 0 (0.0%) | 0 (0.0%) |
| Architecture & Engineering | 0 (0.0%) | 0 (0.0%) |
| Life, Physical & Social Science | 0 (0.0%) | 0 (0.0%) |
| Community & Social Service | 4 (80.0%) | 1 (20.0%) |
| Education, Arts & Media | 0 (0.0%) | 0 (0.0%) |
| Legal Services & Support | 0 (0.0%) | 0 (0.0%) |
| Education Instruction & Library | 4 (100.0%) | 0 (0.0%) |
| Arts, Media & Entertainment | 0 (0.0%) | 1 (100.0%) |
| Health Diagnosing & Treating | 0 (0.0%) | 5 (100.0%) |
| Health Technologists | 0 (0.0%) | 3 (100.0%) |
| Total (Category) | 28 (53.8%) | 24 (46.2%) |
| Total (Overall) | 136 (43.2%) | 179 (56.8%) |
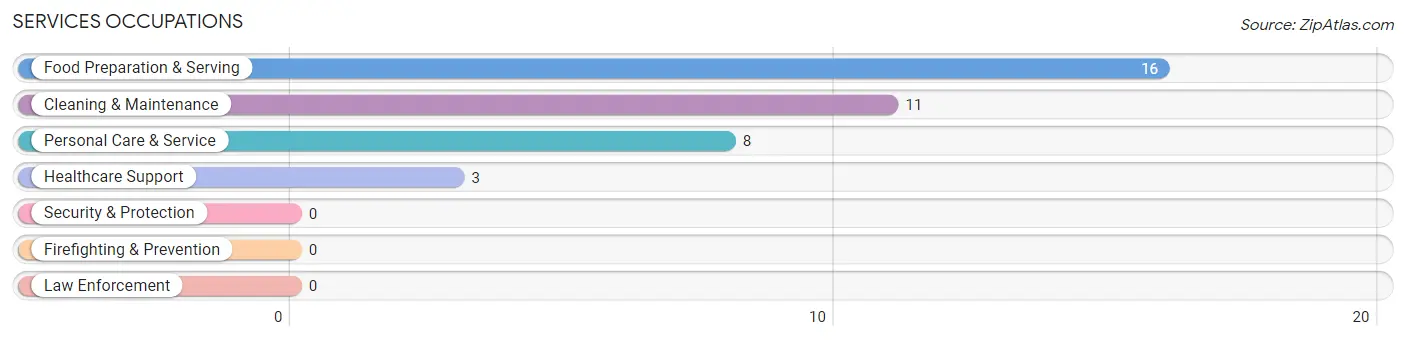
Services Occupations
The most common Services occupations in Wiconsico are Food Preparation & Serving (16 | 5.1%), Cleaning & Maintenance (11 | 3.5%), Personal Care & Service (8 | 2.5%), and Healthcare Support (3 | 0.9%).
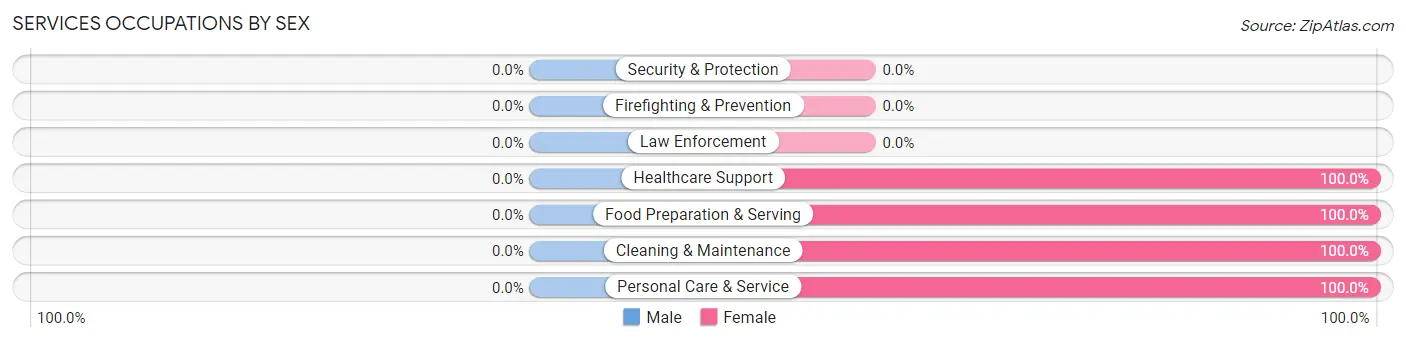
Services Occupations by Sex
| Occupation | Male | Female |
| Healthcare Support | 0 (0.0%) | 3 (100.0%) |
| Security & Protection | 0 (0.0%) | 0 (0.0%) |
| Firefighting & Prevention | 0 (0.0%) | 0 (0.0%) |
| Law Enforcement | 0 (0.0%) | 0 (0.0%) |
| Food Preparation & Serving | 0 (0.0%) | 16 (100.0%) |
| Cleaning & Maintenance | 0 (0.0%) | 11 (100.0%) |
| Personal Care & Service | 0 (0.0%) | 8 (100.0%) |
| Total (Category) | 0 (0.0%) | 38 (100.0%) |
| Total (Overall) | 136 (43.2%) | 179 (56.8%) |
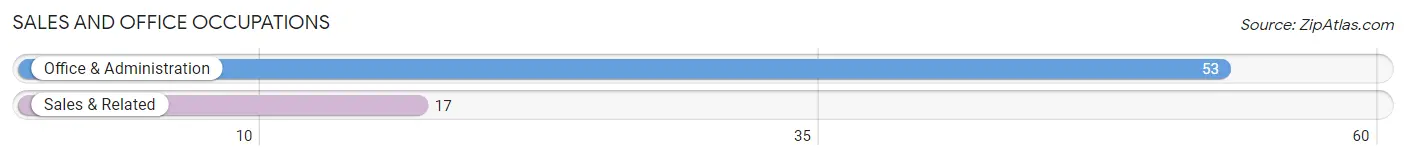
Sales and Office Occupations
The most common Sales and Office occupations in Wiconsico are Office & Administration (53 | 16.8%), and Sales & Related (17 | 5.4%).
Sales and Office Occupations by Sex
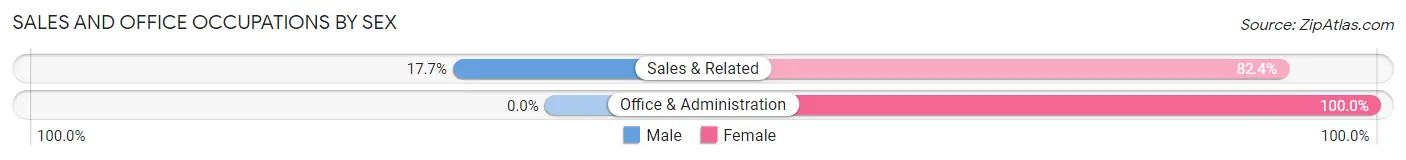
| Occupation | Male | Female |
| Sales & Related | 3 (17.6%) | 14 (82.4%) |
| Office & Administration | 0 (0.0%) | 53 (100.0%) |
| Total (Category) | 3 (4.3%) | 67 (95.7%) |
| Total (Overall) | 136 (43.2%) | 179 (56.8%) |
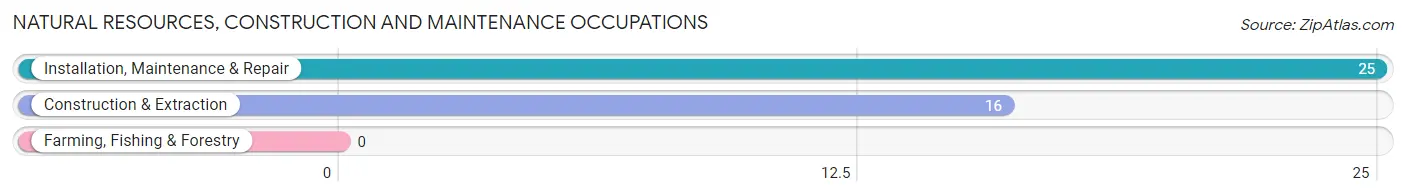
Natural Resources, Construction and Maintenance Occupations
The most common Natural Resources, Construction and Maintenance occupations in Wiconsico are Installation, Maintenance & Repair (25 | 7.9%), and Construction & Extraction (16 | 5.1%).
Natural Resources, Construction and Maintenance Occupations by Sex
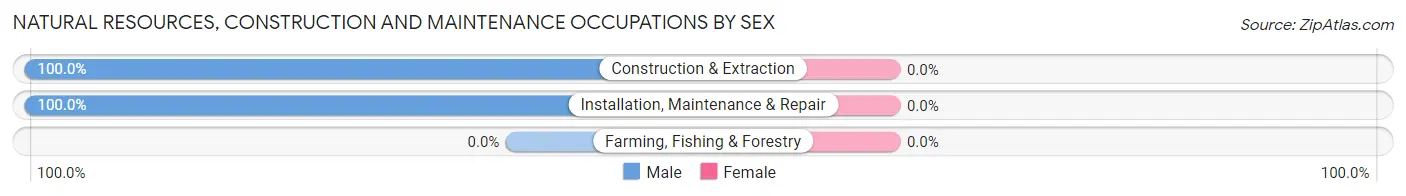
| Occupation | Male | Female |
| Farming, Fishing & Forestry | 0 (0.0%) | 0 (0.0%) |
| Construction & Extraction | 16 (100.0%) | 0 (0.0%) |
| Installation, Maintenance & Repair | 25 (100.0%) | 0 (0.0%) |
| Total (Category) | 41 (100.0%) | 0 (0.0%) |
| Total (Overall) | 136 (43.2%) | 179 (56.8%) |
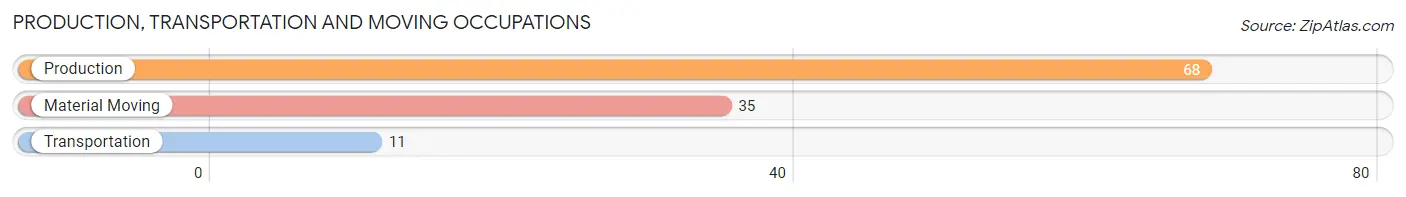
Production, Transportation and Moving Occupations
The most common Production, Transportation and Moving occupations in Wiconsico are Production (68 | 21.6%), Material Moving (35 | 11.1%), and Transportation (11 | 3.5%).
Production, Transportation and Moving Occupations by Sex
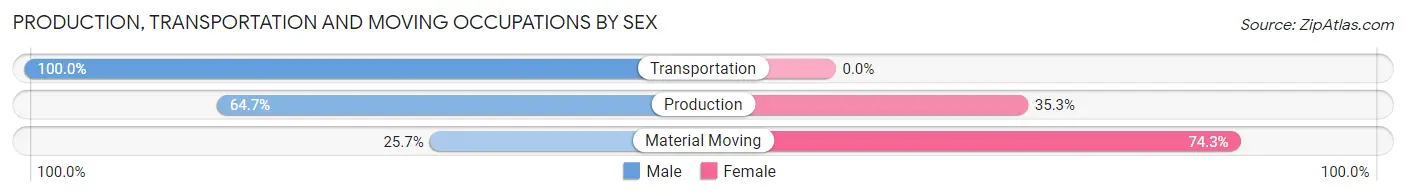
| Occupation | Male | Female |
| Production | 44 (64.7%) | 24 (35.3%) |
| Transportation | 11 (100.0%) | 0 (0.0%) |
| Material Moving | 9 (25.7%) | 26 (74.3%) |
| Total (Category) | 64 (56.1%) | 50 (43.9%) |
| Total (Overall) | 136 (43.2%) | 179 (56.8%) |
Employment Industries by Sex in Wiconsico
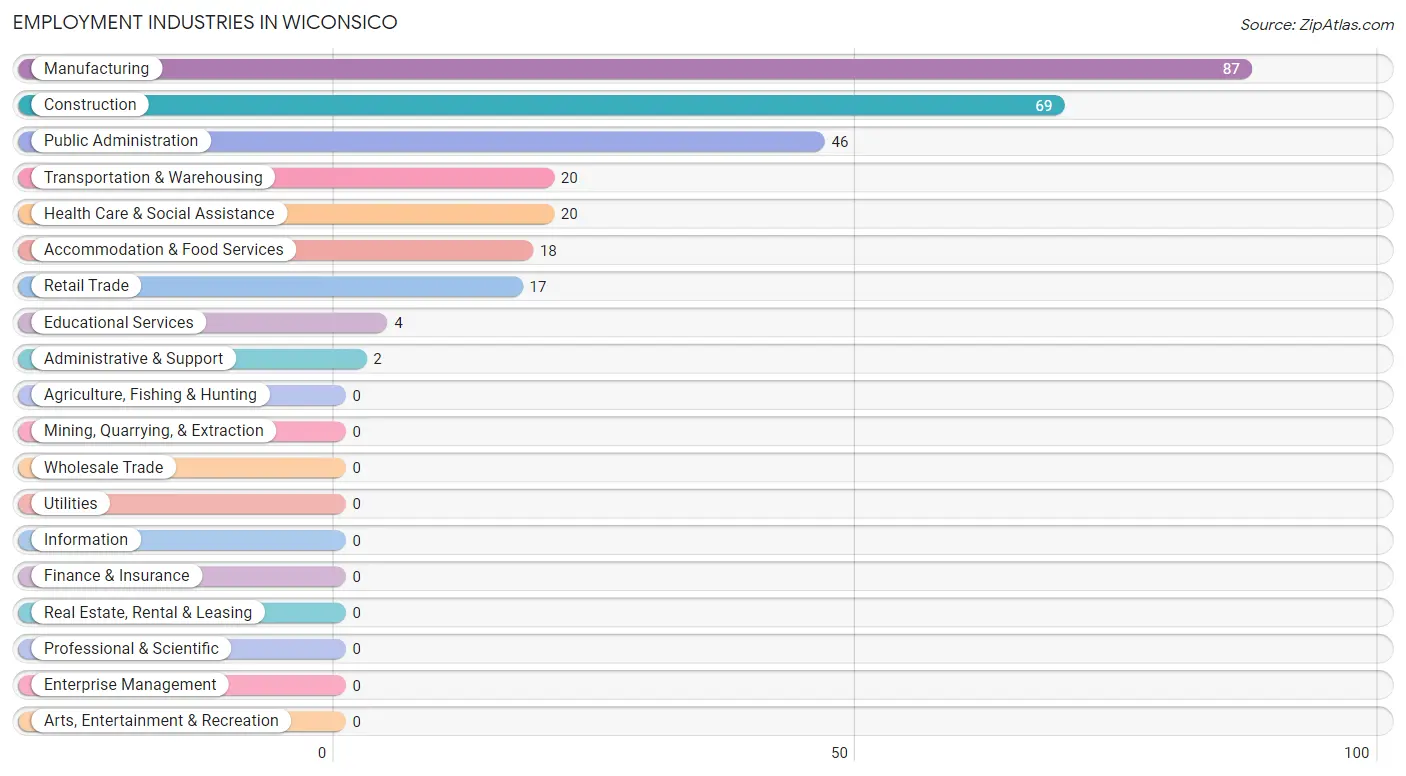
Employment Industries in Wiconsico
The major employment industries in Wiconsico include Manufacturing (87 | 27.6%), Construction (69 | 21.9%), Public Administration (46 | 14.6%), Transportation & Warehousing (20 | 6.4%), and Health Care & Social Assistance (20 | 6.4%).
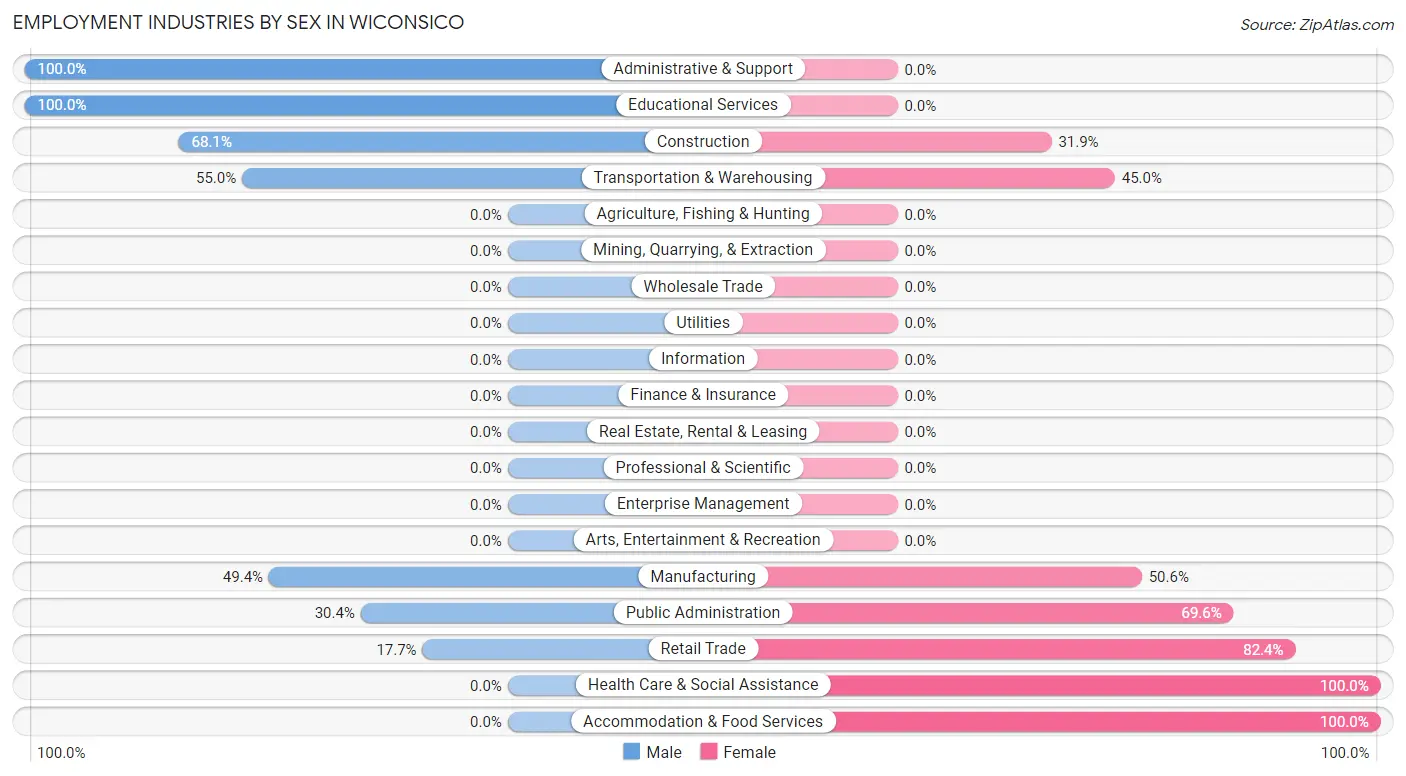
Employment Industries by Sex in Wiconsico
The Wiconsico industries that see more men than women are Administrative & Support (100.0%), Educational Services (100.0%), and Construction (68.1%), whereas the industries that tend to have a higher number of women are Health Care & Social Assistance (100.0%), Accommodation & Food Services (100.0%), and Retail Trade (82.4%).
| Industry | Male | Female |
| Agriculture, Fishing & Hunting | 0 (0.0%) | 0 (0.0%) |
| Mining, Quarrying, & Extraction | 0 (0.0%) | 0 (0.0%) |
| Construction | 47 (68.1%) | 22 (31.9%) |
| Manufacturing | 43 (49.4%) | 44 (50.6%) |
| Wholesale Trade | 0 (0.0%) | 0 (0.0%) |
| Retail Trade | 3 (17.6%) | 14 (82.4%) |
| Transportation & Warehousing | 11 (55.0%) | 9 (45.0%) |
| Utilities | 0 (0.0%) | 0 (0.0%) |
| Information | 0 (0.0%) | 0 (0.0%) |
| Finance & Insurance | 0 (0.0%) | 0 (0.0%) |
| Real Estate, Rental & Leasing | 0 (0.0%) | 0 (0.0%) |
| Professional & Scientific | 0 (0.0%) | 0 (0.0%) |
| Enterprise Management | 0 (0.0%) | 0 (0.0%) |
| Administrative & Support | 2 (100.0%) | 0 (0.0%) |
| Educational Services | 4 (100.0%) | 0 (0.0%) |
| Health Care & Social Assistance | 0 (0.0%) | 20 (100.0%) |
| Arts, Entertainment & Recreation | 0 (0.0%) | 0 (0.0%) |
| Accommodation & Food Services | 0 (0.0%) | 18 (100.0%) |
| Public Administration | 14 (30.4%) | 32 (69.6%) |
| Total | 136 (43.2%) | 179 (56.8%) |
Education in Wiconsico
School Enrollment in Wiconsico
The most common levels of schooling among the 176 students in Wiconsico are middle school (53 | 30.1%), high school (53 | 30.1%), and elementary school (41 | 23.3%).
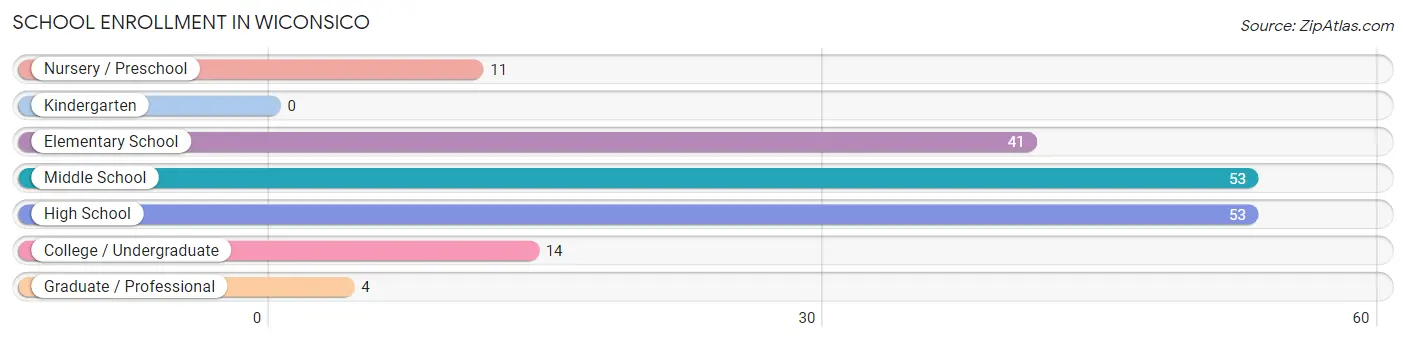
| School Level | # Students | % Students |
| Nursery / Preschool | 11 | 6.2% |
| Kindergarten | 0 | 0.0% |
| Elementary School | 41 | 23.3% |
| Middle School | 53 | 30.1% |
| High School | 53 | 30.1% |
| College / Undergraduate | 14 | 8.0% |
| Graduate / Professional | 4 | 2.3% |
| Total | 176 | 100.0% |
School Enrollment by Age by Funding Source in Wiconsico
Out of a total of 176 students who are enrolled in schools in Wiconsico, 46 (26.1%) attend a private institution, while the remaining 130 (73.9%) are enrolled in public schools. The age group of 20 to 24 year olds has the highest likelihood of being enrolled in private schools, with 5 (100.0% in the age bracket) enrolled. Conversely, the age group of 3 to 4 year olds has the lowest likelihood of being enrolled in a private school, with 9 (100.0% in the age bracket) attending a public institution.
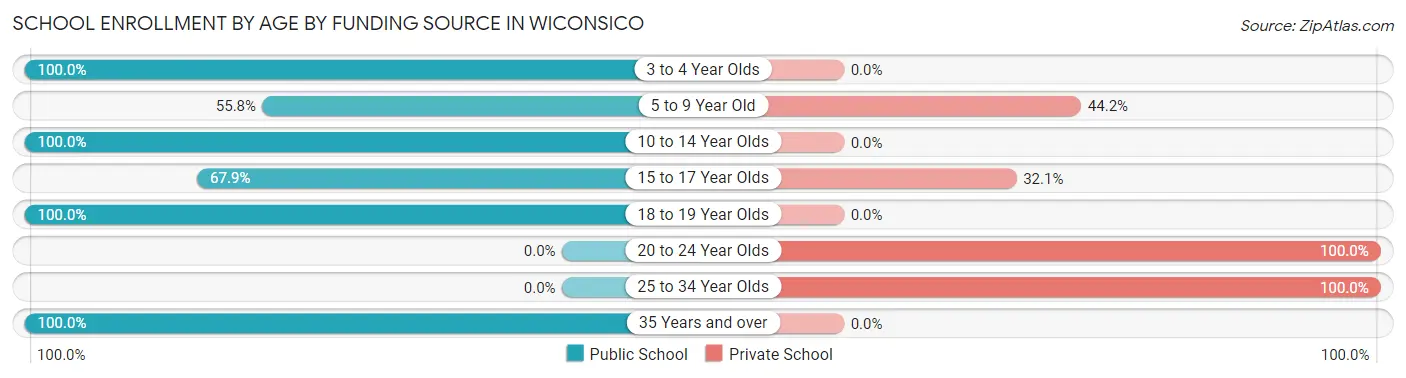
| Age Bracket | Public School | Private School |
| 3 to 4 Year Olds | 9 (100.0%) | 0 (0.0%) |
| 5 to 9 Year Old | 24 (55.8%) | 19 (44.2%) |
| 10 to 14 Year Olds | 53 (100.0%) | 0 (0.0%) |
| 15 to 17 Year Olds | 38 (67.9%) | 18 (32.1%) |
| 18 to 19 Year Olds | 4 (100.0%) | 0 (0.0%) |
| 20 to 24 Year Olds | 0 (0.0%) | 5 (100.0%) |
| 25 to 34 Year Olds | 0 (0.0%) | 4 (100.0%) |
| 35 Years and over | 2 (100.0%) | 0 (0.0%) |
| Total | 130 (73.9%) | 46 (26.1%) |
Educational Attainment by Field of Study in Wiconsico
Communications (15 | 35.7%), social sciences (8 | 19.1%), literature & languages (6 | 14.3%), business (4 | 9.5%), and education (4 | 9.5%) are the most common fields of study among 42 individuals in Wiconsico who have obtained a bachelor's degree or higher.
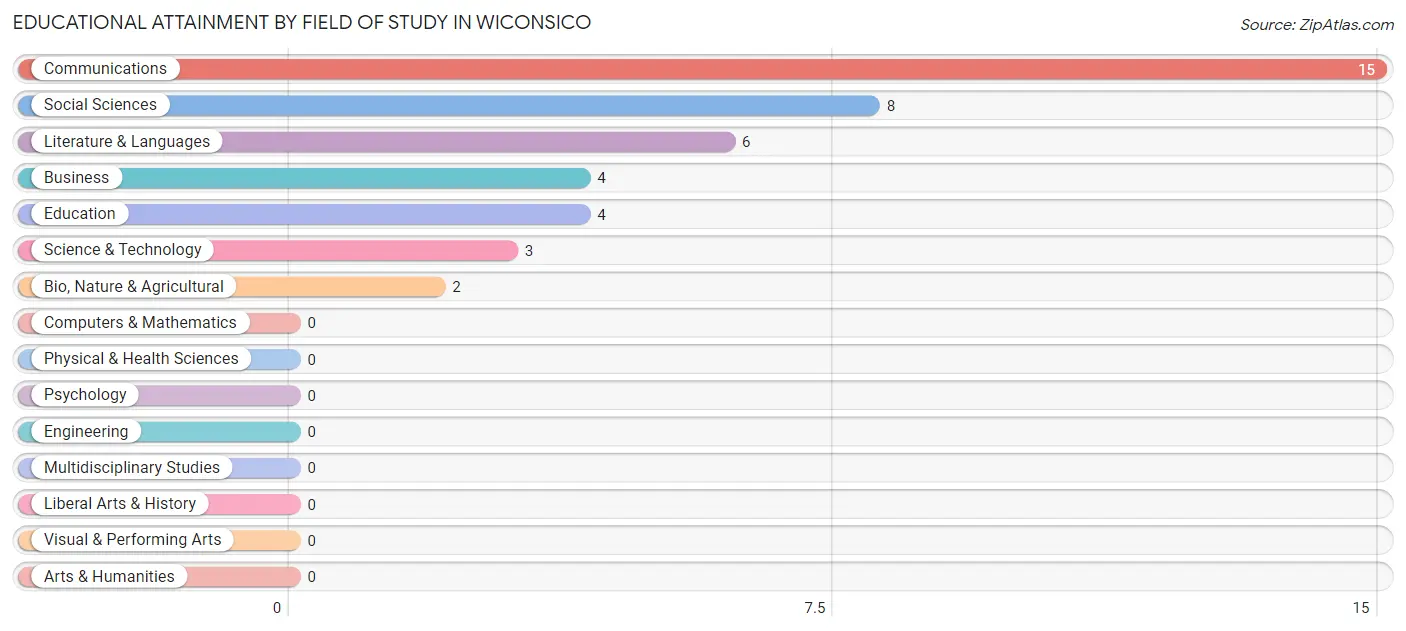
| Field of Study | # Graduates | % Graduates |
| Computers & Mathematics | 0 | 0.0% |
| Bio, Nature & Agricultural | 2 | 4.8% |
| Physical & Health Sciences | 0 | 0.0% |
| Psychology | 0 | 0.0% |
| Social Sciences | 8 | 19.1% |
| Engineering | 0 | 0.0% |
| Multidisciplinary Studies | 0 | 0.0% |
| Science & Technology | 3 | 7.1% |
| Business | 4 | 9.5% |
| Education | 4 | 9.5% |
| Literature & Languages | 6 | 14.3% |
| Liberal Arts & History | 0 | 0.0% |
| Visual & Performing Arts | 0 | 0.0% |
| Communications | 15 | 35.7% |
| Arts & Humanities | 0 | 0.0% |
| Total | 42 | 100.0% |
Transportation & Commute in Wiconsico
Vehicle Availability by Sex in Wiconsico
The most prevalent vehicle ownership categories in Wiconsico are males with 3 vehicles (55, accounting for 40.2%) and females with 3 vehicles (29, making up 32.2%).
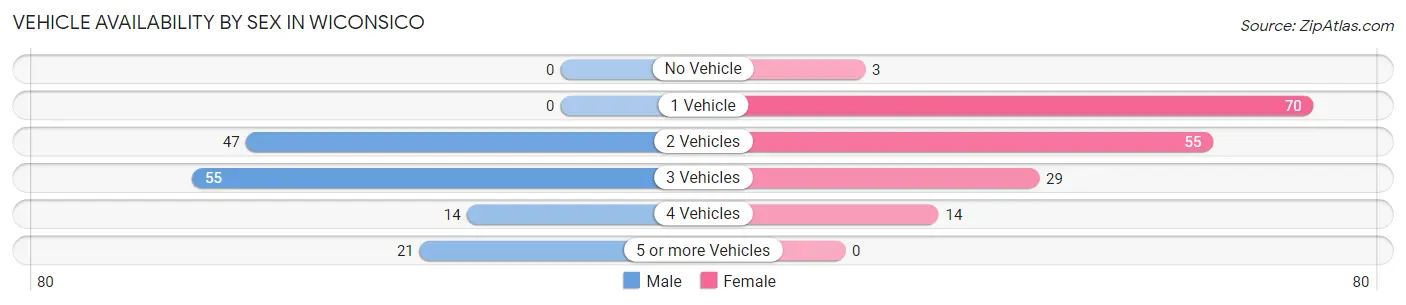
| Vehicles Available | Male | Female |
| No Vehicle | 0 (0.0%) | 3 (1.8%) |
| 1 Vehicle | 0 (0.0%) | 70 (40.9%) |
| 2 Vehicles | 47 (34.3%) | 55 (32.2%) |
| 3 Vehicles | 55 (40.2%) | 29 (17.0%) |
| 4 Vehicles | 14 (10.2%) | 14 (8.2%) |
| 5 or more Vehicles | 21 (15.3%) | 0 (0.0%) |
| Total | 137 (100.0%) | 171 (100.0%) |
Commute Time in Wiconsico
The most frequently occuring commute durations in Wiconsico are 20 to 24 minutes (70 commuters, 23.5%), 10 to 14 minutes (44 commuters, 14.8%), and 45 to 59 minutes (44 commuters, 14.8%).
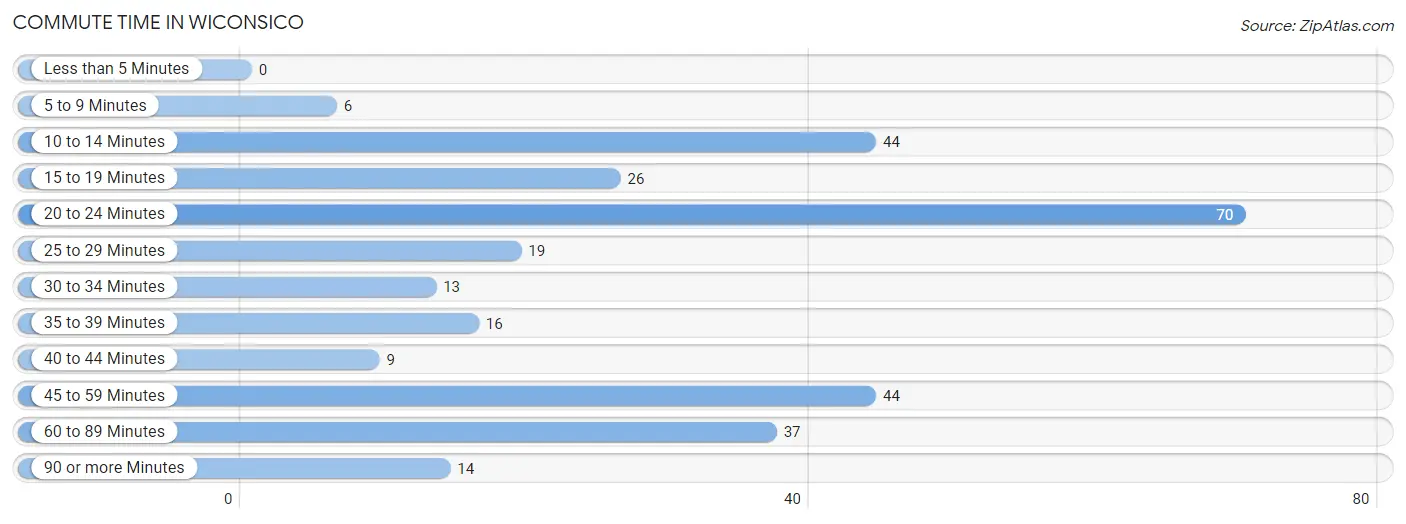
| Commute Time | # Commuters | % Commuters |
| Less than 5 Minutes | 0 | 0.0% |
| 5 to 9 Minutes | 6 | 2.0% |
| 10 to 14 Minutes | 44 | 14.8% |
| 15 to 19 Minutes | 26 | 8.7% |
| 20 to 24 Minutes | 70 | 23.5% |
| 25 to 29 Minutes | 19 | 6.4% |
| 30 to 34 Minutes | 13 | 4.4% |
| 35 to 39 Minutes | 16 | 5.4% |
| 40 to 44 Minutes | 9 | 3.0% |
| 45 to 59 Minutes | 44 | 14.8% |
| 60 to 89 Minutes | 37 | 12.4% |
| 90 or more Minutes | 14 | 4.7% |
Commute Time by Sex in Wiconsico
The most common commute times in Wiconsico are 20 to 24 minutes (31 commuters, 22.6%) for males and 20 to 24 minutes (39 commuters, 24.2%) for females.
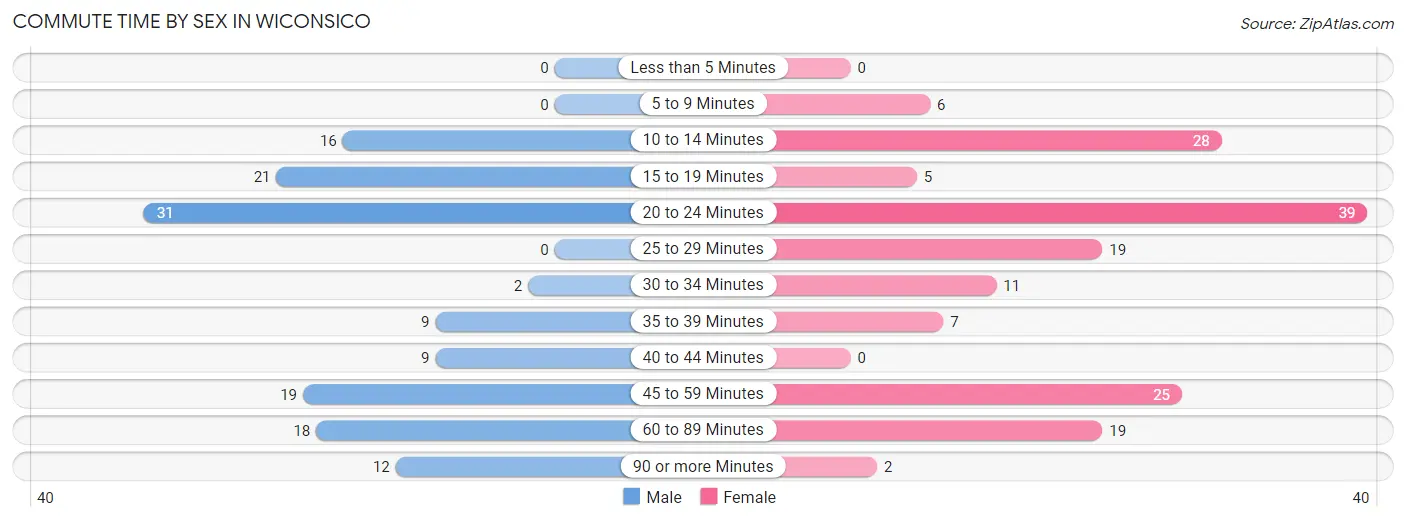
| Commute Time | Male | Female |
| Less than 5 Minutes | 0 (0.0%) | 0 (0.0%) |
| 5 to 9 Minutes | 0 (0.0%) | 6 (3.7%) |
| 10 to 14 Minutes | 16 (11.7%) | 28 (17.4%) |
| 15 to 19 Minutes | 21 (15.3%) | 5 (3.1%) |
| 20 to 24 Minutes | 31 (22.6%) | 39 (24.2%) |
| 25 to 29 Minutes | 0 (0.0%) | 19 (11.8%) |
| 30 to 34 Minutes | 2 (1.5%) | 11 (6.8%) |
| 35 to 39 Minutes | 9 (6.6%) | 7 (4.3%) |
| 40 to 44 Minutes | 9 (6.6%) | 0 (0.0%) |
| 45 to 59 Minutes | 19 (13.9%) | 25 (15.5%) |
| 60 to 89 Minutes | 18 (13.1%) | 19 (11.8%) |
| 90 or more Minutes | 12 (8.8%) | 2 (1.2%) |
Time of Departure to Work by Sex in Wiconsico
The most frequent times of departure to work in Wiconsico are 6:30 AM to 6:59 AM (37, 27.0%) for males and 7:00 AM to 7:29 AM (43, 26.7%) for females.
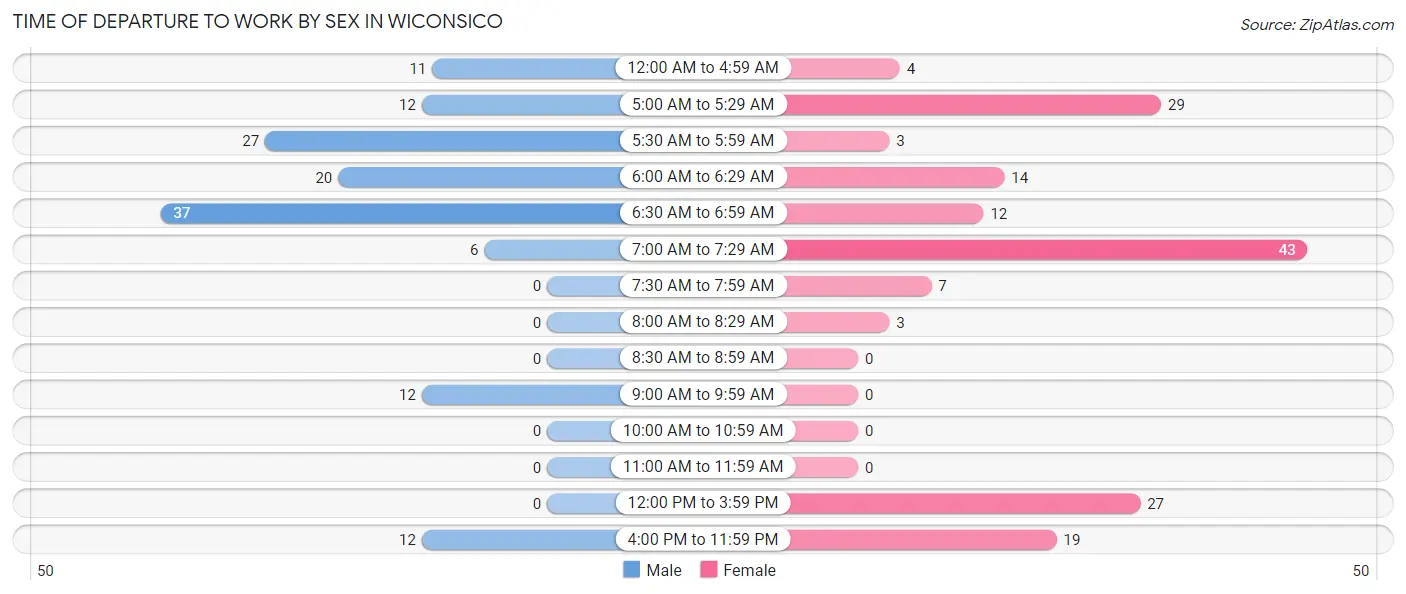
| Time of Departure | Male | Female |
| 12:00 AM to 4:59 AM | 11 (8.0%) | 4 (2.5%) |
| 5:00 AM to 5:29 AM | 12 (8.8%) | 29 (18.0%) |
| 5:30 AM to 5:59 AM | 27 (19.7%) | 3 (1.9%) |
| 6:00 AM to 6:29 AM | 20 (14.6%) | 14 (8.7%) |
| 6:30 AM to 6:59 AM | 37 (27.0%) | 12 (7.4%) |
| 7:00 AM to 7:29 AM | 6 (4.4%) | 43 (26.7%) |
| 7:30 AM to 7:59 AM | 0 (0.0%) | 7 (4.3%) |
| 8:00 AM to 8:29 AM | 0 (0.0%) | 3 (1.9%) |
| 8:30 AM to 8:59 AM | 0 (0.0%) | 0 (0.0%) |
| 9:00 AM to 9:59 AM | 12 (8.8%) | 0 (0.0%) |
| 10:00 AM to 10:59 AM | 0 (0.0%) | 0 (0.0%) |
| 11:00 AM to 11:59 AM | 0 (0.0%) | 0 (0.0%) |
| 12:00 PM to 3:59 PM | 0 (0.0%) | 27 (16.8%) |
| 4:00 PM to 11:59 PM | 12 (8.8%) | 19 (11.8%) |
| Total | 137 (100.0%) | 161 (100.0%) |
Housing Occupancy in Wiconsico
Occupancy by Ownership in Wiconsico
Of the total 319 dwellings in Wiconsico, owner-occupied units account for 266 (83.4%), while renter-occupied units make up 53 (16.6%).
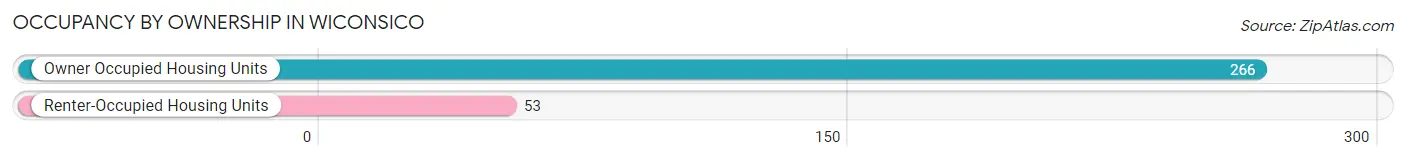
| Occupancy | # Housing Units | % Housing Units |
| Owner Occupied Housing Units | 266 | 83.4% |
| Renter-Occupied Housing Units | 53 | 16.6% |
| Total Occupied Housing Units | 319 | 100.0% |
Occupancy by Household Size in Wiconsico
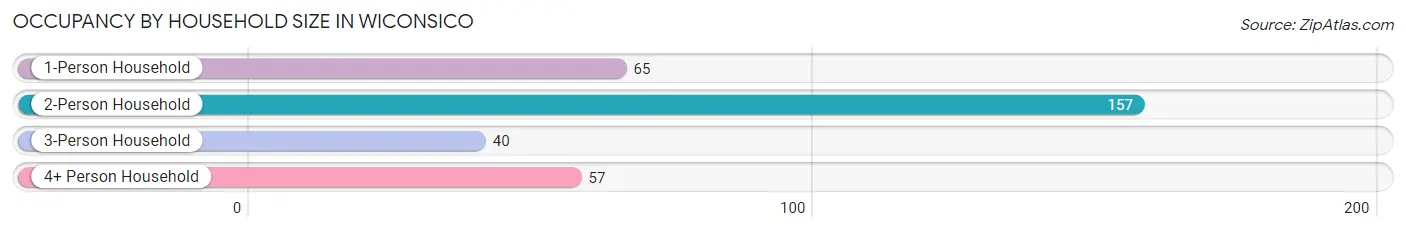
| Household Size | # Housing Units | % Housing Units |
| 1-Person Household | 65 | 20.4% |
| 2-Person Household | 157 | 49.2% |
| 3-Person Household | 40 | 12.5% |
| 4+ Person Household | 57 | 17.9% |
| Total Housing Units | 319 | 100.0% |
Occupancy by Ownership by Household Size in Wiconsico
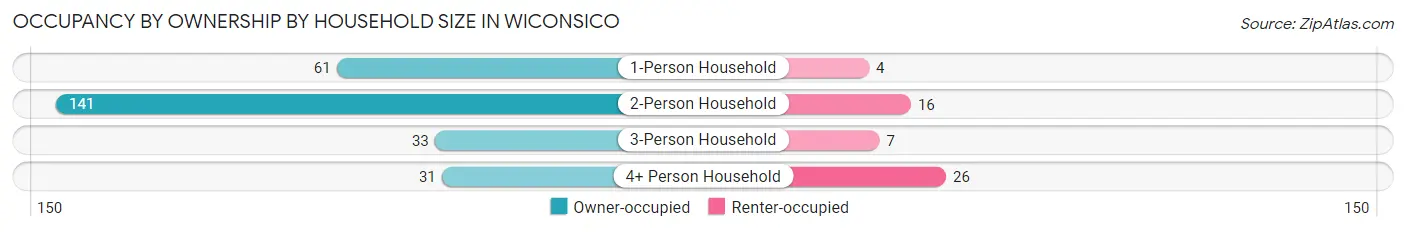
| Household Size | Owner-occupied | Renter-occupied |
| 1-Person Household | 61 (93.9%) | 4 (6.1%) |
| 2-Person Household | 141 (89.8%) | 16 (10.2%) |
| 3-Person Household | 33 (82.5%) | 7 (17.5%) |
| 4+ Person Household | 31 (54.4%) | 26 (45.6%) |
| Total Housing Units | 266 (83.4%) | 53 (16.6%) |
Occupancy by Educational Attainment in Wiconsico
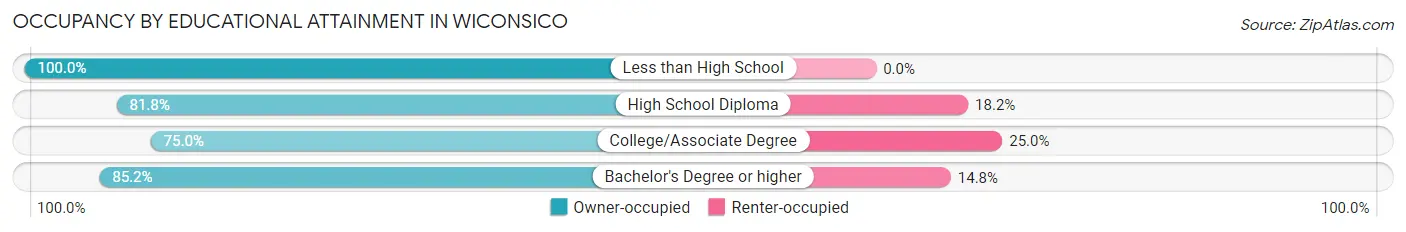
| Household Size | Owner-occupied | Renter-occupied |
| Less than High School | 53 (100.0%) | 0 (0.0%) |
| High School Diploma | 130 (81.8%) | 29 (18.2%) |
| College/Associate Degree | 60 (75.0%) | 20 (25.0%) |
| Bachelor's Degree or higher | 23 (85.2%) | 4 (14.8%) |
Occupancy by Age of Householder in Wiconsico
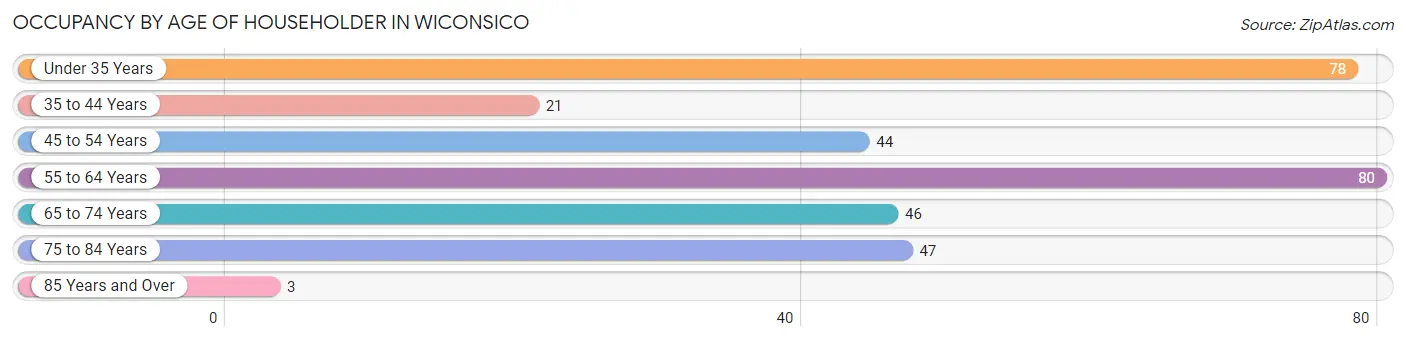
| Age Bracket | # Households | % Households |
| Under 35 Years | 78 | 24.4% |
| 35 to 44 Years | 21 | 6.6% |
| 45 to 54 Years | 44 | 13.8% |
| 55 to 64 Years | 80 | 25.1% |
| 65 to 74 Years | 46 | 14.4% |
| 75 to 84 Years | 47 | 14.7% |
| 85 Years and Over | 3 | 0.9% |
| Total | 319 | 100.0% |
Housing Finances in Wiconsico
Median Income by Occupancy in Wiconsico
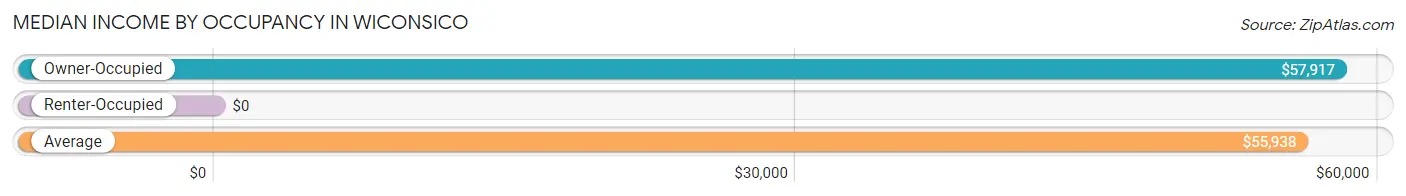
| Occupancy Type | # Households | Median Income |
| Owner-Occupied | 266 (83.4%) | $57,917 |
| Renter-Occupied | 53 (16.6%) | $0 |
| Average | 319 (100.0%) | $55,938 |
Occupancy by Householder Income Bracket in Wiconsico
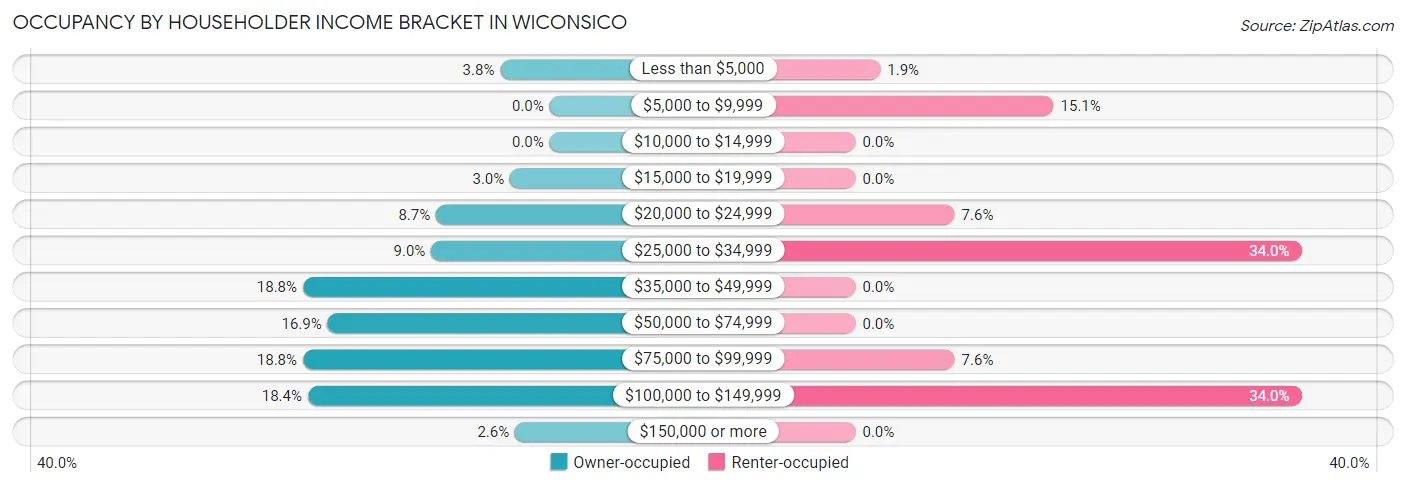
| Income Bracket | Owner-occupied | Renter-occupied |
| Less than $5,000 | 10 (3.8%) | 1 (1.9%) |
| $5,000 to $9,999 | 0 (0.0%) | 8 (15.1%) |
| $10,000 to $14,999 | 0 (0.0%) | 0 (0.0%) |
| $15,000 to $19,999 | 8 (3.0%) | 0 (0.0%) |
| $20,000 to $24,999 | 23 (8.6%) | 4 (7.5%) |
| $25,000 to $34,999 | 24 (9.0%) | 18 (34.0%) |
| $35,000 to $49,999 | 50 (18.8%) | 0 (0.0%) |
| $50,000 to $74,999 | 45 (16.9%) | 0 (0.0%) |
| $75,000 to $99,999 | 50 (18.8%) | 4 (7.5%) |
| $100,000 to $149,999 | 49 (18.4%) | 18 (34.0%) |
| $150,000 or more | 7 (2.6%) | 0 (0.0%) |
| Total | 266 (100.0%) | 53 (100.0%) |
Monthly Housing Cost Tiers in Wiconsico
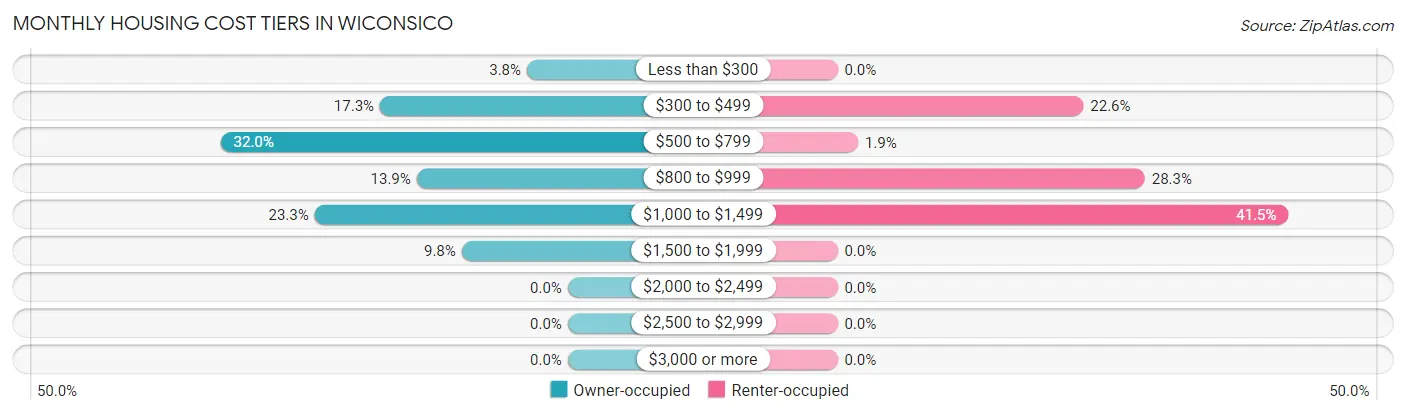
| Monthly Cost | Owner-occupied | Renter-occupied |
| Less than $300 | 10 (3.8%) | 0 (0.0%) |
| $300 to $499 | 46 (17.3%) | 12 (22.6%) |
| $500 to $799 | 85 (32.0%) | 1 (1.9%) |
| $800 to $999 | 37 (13.9%) | 15 (28.3%) |
| $1,000 to $1,499 | 62 (23.3%) | 22 (41.5%) |
| $1,500 to $1,999 | 26 (9.8%) | 0 (0.0%) |
| $2,000 to $2,499 | 0 (0.0%) | 0 (0.0%) |
| $2,500 to $2,999 | 0 (0.0%) | 0 (0.0%) |
| $3,000 or more | 0 (0.0%) | 0 (0.0%) |
| Total | 266 (100.0%) | 53 (100.0%) |
Physical Housing Characteristics in Wiconsico
Housing Structures in Wiconsico
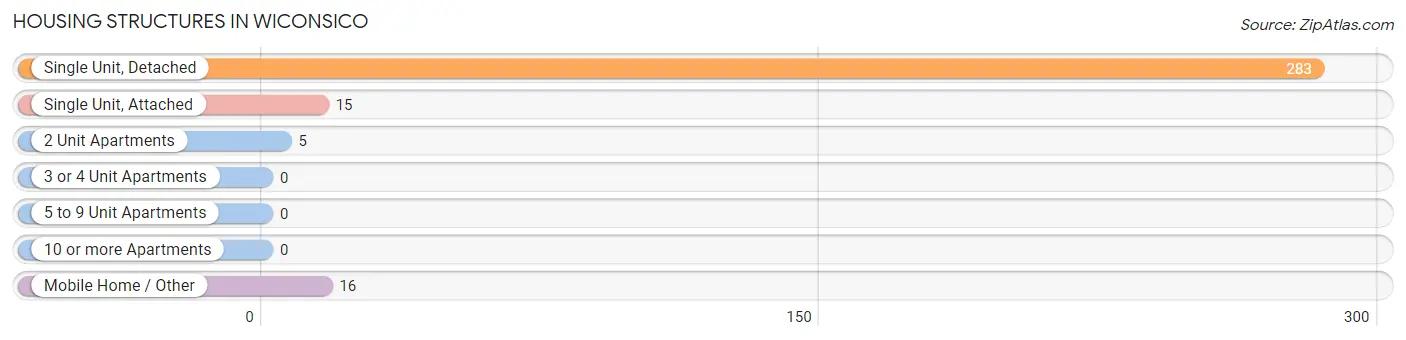
| Structure Type | # Housing Units | % Housing Units |
| Single Unit, Detached | 283 | 88.7% |
| Single Unit, Attached | 15 | 4.7% |
| 2 Unit Apartments | 5 | 1.6% |
| 3 or 4 Unit Apartments | 0 | 0.0% |
| 5 to 9 Unit Apartments | 0 | 0.0% |
| 10 or more Apartments | 0 | 0.0% |
| Mobile Home / Other | 16 | 5.0% |
| Total | 319 | 100.0% |
Housing Structures by Occupancy in Wiconsico
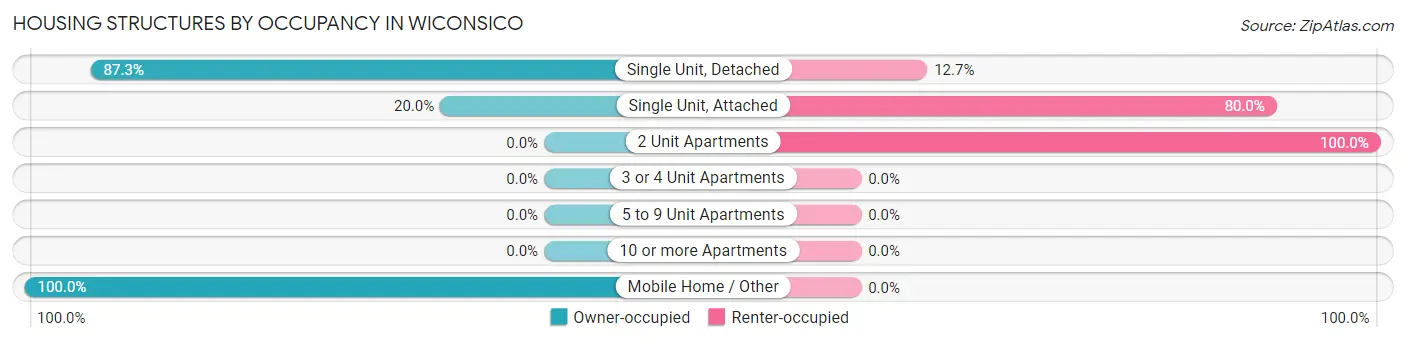
| Structure Type | Owner-occupied | Renter-occupied |
| Single Unit, Detached | 247 (87.3%) | 36 (12.7%) |
| Single Unit, Attached | 3 (20.0%) | 12 (80.0%) |
| 2 Unit Apartments | 0 (0.0%) | 5 (100.0%) |
| 3 or 4 Unit Apartments | 0 (0.0%) | 0 (0.0%) |
| 5 to 9 Unit Apartments | 0 (0.0%) | 0 (0.0%) |
| 10 or more Apartments | 0 (0.0%) | 0 (0.0%) |
| Mobile Home / Other | 16 (100.0%) | 0 (0.0%) |
| Total | 266 (83.4%) | 53 (16.6%) |
Housing Structures by Number of Rooms in Wiconsico
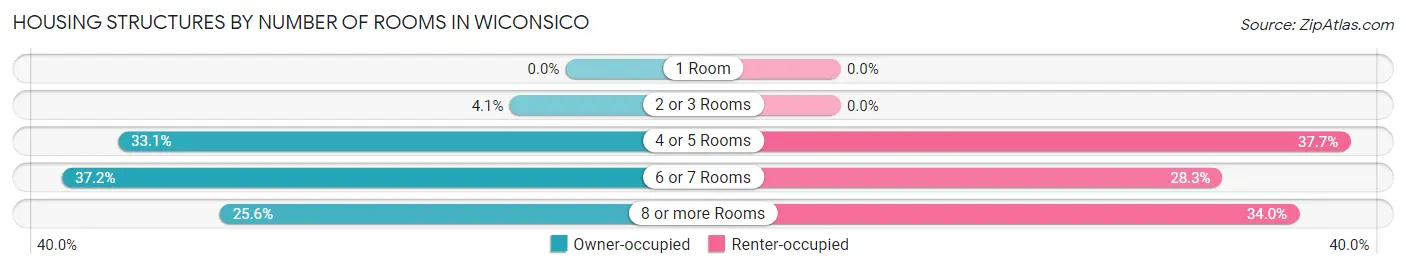
| Number of Rooms | Owner-occupied | Renter-occupied |
| 1 Room | 0 (0.0%) | 0 (0.0%) |
| 2 or 3 Rooms | 11 (4.1%) | 0 (0.0%) |
| 4 or 5 Rooms | 88 (33.1%) | 20 (37.7%) |
| 6 or 7 Rooms | 99 (37.2%) | 15 (28.3%) |
| 8 or more Rooms | 68 (25.6%) | 18 (34.0%) |
| Total | 266 (100.0%) | 53 (100.0%) |
Housing Structure by Heating Type in Wiconsico
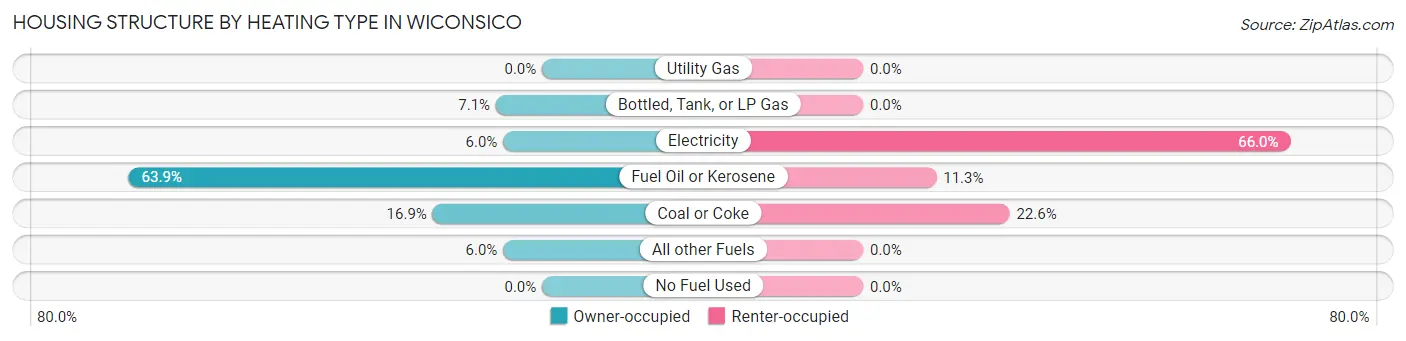
| Heating Type | Owner-occupied | Renter-occupied |
| Utility Gas | 0 (0.0%) | 0 (0.0%) |
| Bottled, Tank, or LP Gas | 19 (7.1%) | 0 (0.0%) |
| Electricity | 16 (6.0%) | 35 (66.0%) |
| Fuel Oil or Kerosene | 170 (63.9%) | 6 (11.3%) |
| Coal or Coke | 45 (16.9%) | 12 (22.6%) |
| All other Fuels | 16 (6.0%) | 0 (0.0%) |
| No Fuel Used | 0 (0.0%) | 0 (0.0%) |
| Total | 266 (100.0%) | 53 (100.0%) |
Household Vehicle Usage in Wiconsico
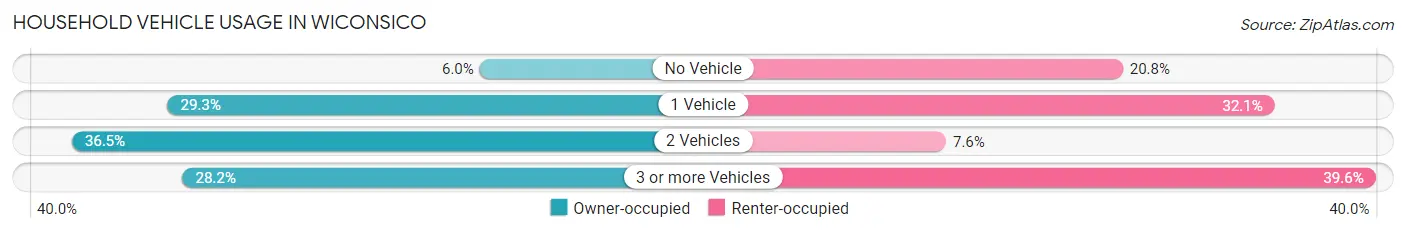
| Vehicles per Household | Owner-occupied | Renter-occupied |
| No Vehicle | 16 (6.0%) | 11 (20.7%) |
| 1 Vehicle | 78 (29.3%) | 17 (32.1%) |
| 2 Vehicles | 97 (36.5%) | 4 (7.5%) |
| 3 or more Vehicles | 75 (28.2%) | 21 (39.6%) |
| Total | 266 (100.0%) | 53 (100.0%) |
Real Estate & Mortgages in Wiconsico
Real Estate and Mortgage Overview in Wiconsico
| Characteristic | Without Mortgage | With Mortgage |
| Housing Units | 132 | 134 |
| Median Property Value | $71,300 | $94,500 |
| Median Household Income | $40,385 | $7 |
| Monthly Housing Costs | $523 | $0 |
| Real Estate Taxes | $1,147 | $9 |
Property Value by Mortgage Status in Wiconsico
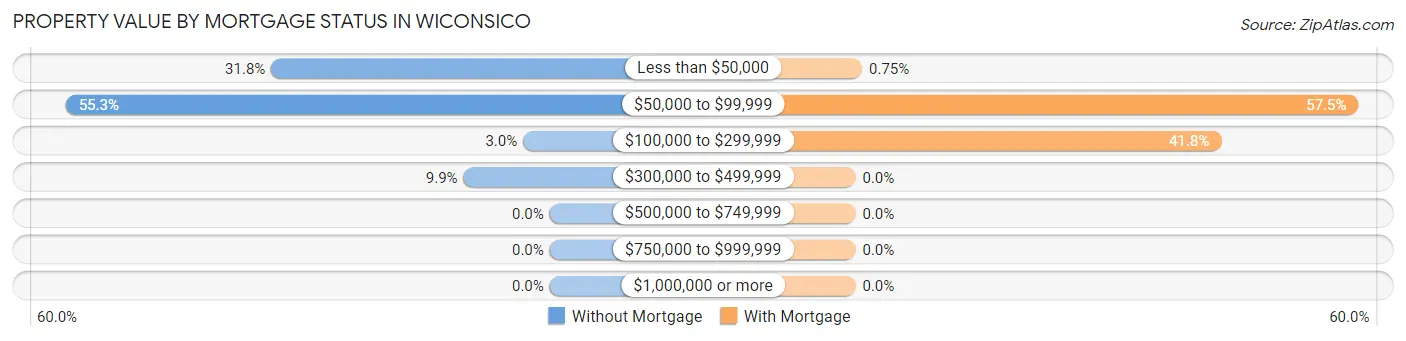
| Property Value | Without Mortgage | With Mortgage |
| Less than $50,000 | 42 (31.8%) | 1 (0.7%) |
| $50,000 to $99,999 | 73 (55.3%) | 77 (57.5%) |
| $100,000 to $299,999 | 4 (3.0%) | 56 (41.8%) |
| $300,000 to $499,999 | 13 (9.9%) | 0 (0.0%) |
| $500,000 to $749,999 | 0 (0.0%) | 0 (0.0%) |
| $750,000 to $999,999 | 0 (0.0%) | 0 (0.0%) |
| $1,000,000 or more | 0 (0.0%) | 0 (0.0%) |
| Total | 132 (100.0%) | 134 (100.0%) |
Household Income by Mortgage Status in Wiconsico
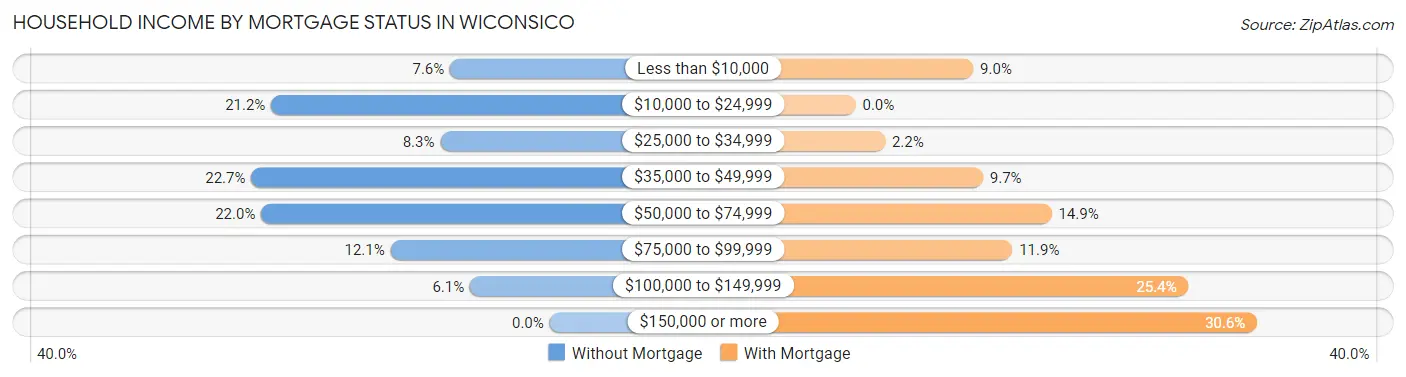
| Household Income | Without Mortgage | With Mortgage |
| Less than $10,000 | 10 (7.6%) | 12 (9.0%) |
| $10,000 to $24,999 | 28 (21.2%) | 0 (0.0%) |
| $25,000 to $34,999 | 11 (8.3%) | 3 (2.2%) |
| $35,000 to $49,999 | 30 (22.7%) | 13 (9.7%) |
| $50,000 to $74,999 | 29 (22.0%) | 20 (14.9%) |
| $75,000 to $99,999 | 16 (12.1%) | 16 (11.9%) |
| $100,000 to $149,999 | 8 (6.1%) | 34 (25.4%) |
| $150,000 or more | 0 (0.0%) | 41 (30.6%) |
| Total | 132 (100.0%) | 134 (100.0%) |
Property Value to Household Income Ratio in Wiconsico
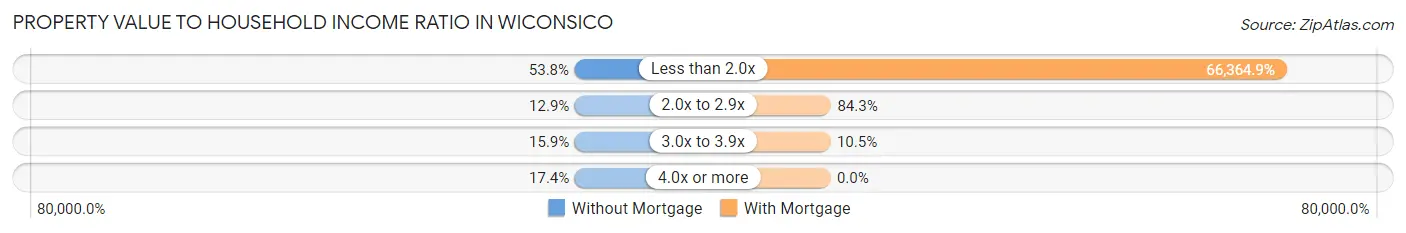
| Value-to-Income Ratio | Without Mortgage | With Mortgage |
| Less than 2.0x | 71 (53.8%) | 88,929 (66,364.9%) |
| 2.0x to 2.9x | 17 (12.9%) | 113 (84.3%) |
| 3.0x to 3.9x | 21 (15.9%) | 14 (10.4%) |
| 4.0x or more | 23 (17.4%) | 0 (0.0%) |
| Total | 132 (100.0%) | 134 (100.0%) |
Real Estate Taxes by Mortgage Status in Wiconsico
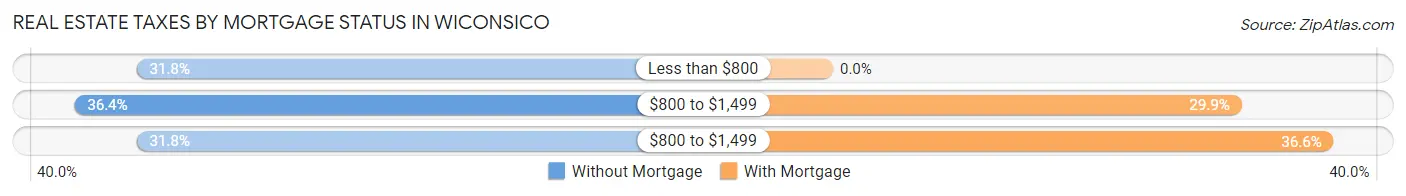
| Property Taxes | Without Mortgage | With Mortgage |
| Less than $800 | 42 (31.8%) | 0 (0.0%) |
| $800 to $1,499 | 48 (36.4%) | 40 (29.8%) |
| $800 to $1,499 | 42 (31.8%) | 49 (36.6%) |
| Total | 132 (100.0%) | 134 (100.0%) |
Health & Disability in Wiconsico
Health Insurance Coverage by Age in Wiconsico
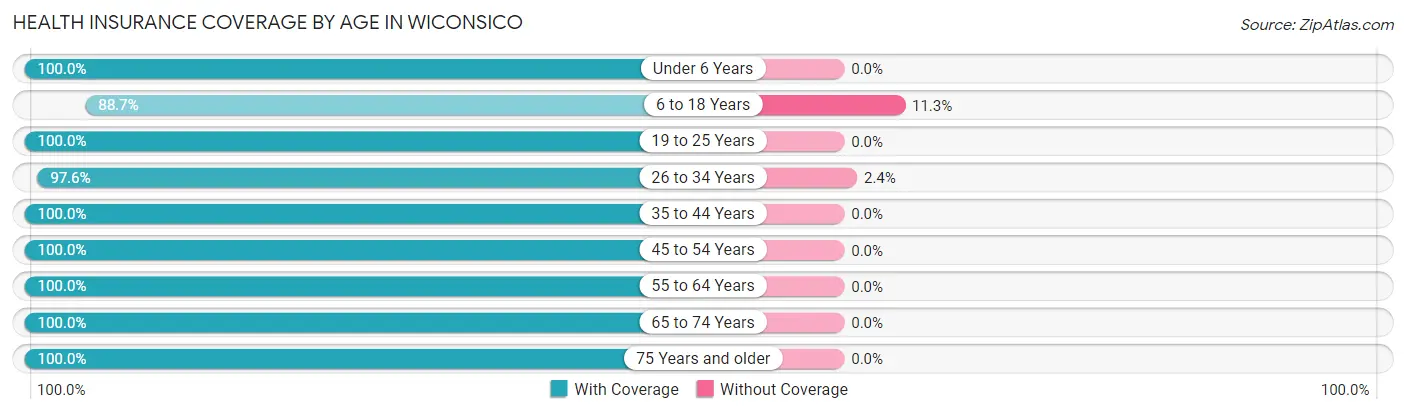
| Age Bracket | With Coverage | Without Coverage |
| Under 6 Years | 81 (100.0%) | 0 (0.0%) |
| 6 to 18 Years | 133 (88.7%) | 17 (11.3%) |
| 19 to 25 Years | 75 (100.0%) | 0 (0.0%) |
| 26 to 34 Years | 82 (97.6%) | 2 (2.4%) |
| 35 to 44 Years | 51 (100.0%) | 0 (0.0%) |
| 45 to 54 Years | 64 (100.0%) | 0 (0.0%) |
| 55 to 64 Years | 136 (100.0%) | 0 (0.0%) |
| 65 to 74 Years | 76 (100.0%) | 0 (0.0%) |
| 75 Years and older | 63 (100.0%) | 0 (0.0%) |
| Total | 761 (97.6%) | 19 (2.4%) |
Health Insurance Coverage by Citizenship Status in Wiconsico
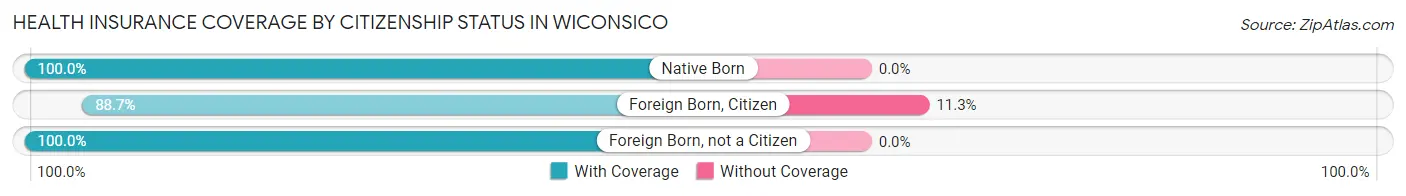
| Citizenship Status | With Coverage | Without Coverage |
| Native Born | 81 (100.0%) | 0 (0.0%) |
| Foreign Born, Citizen | 133 (88.7%) | 17 (11.3%) |
| Foreign Born, not a Citizen | 75 (100.0%) | 0 (0.0%) |
Health Insurance Coverage by Household Income in Wiconsico
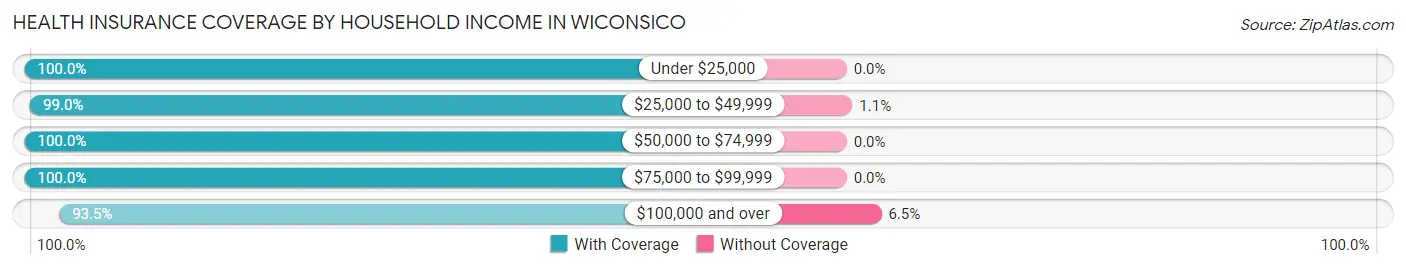
| Household Income | With Coverage | Without Coverage |
| Under $25,000 | 102 (100.0%) | 0 (0.0%) |
| $25,000 to $49,999 | 188 (99.0%) | 2 (1.1%) |
| $50,000 to $74,999 | 85 (100.0%) | 0 (0.0%) |
| $75,000 to $99,999 | 141 (100.0%) | 0 (0.0%) |
| $100,000 and over | 245 (93.5%) | 17 (6.5%) |
Public vs Private Health Insurance Coverage by Age in Wiconsico
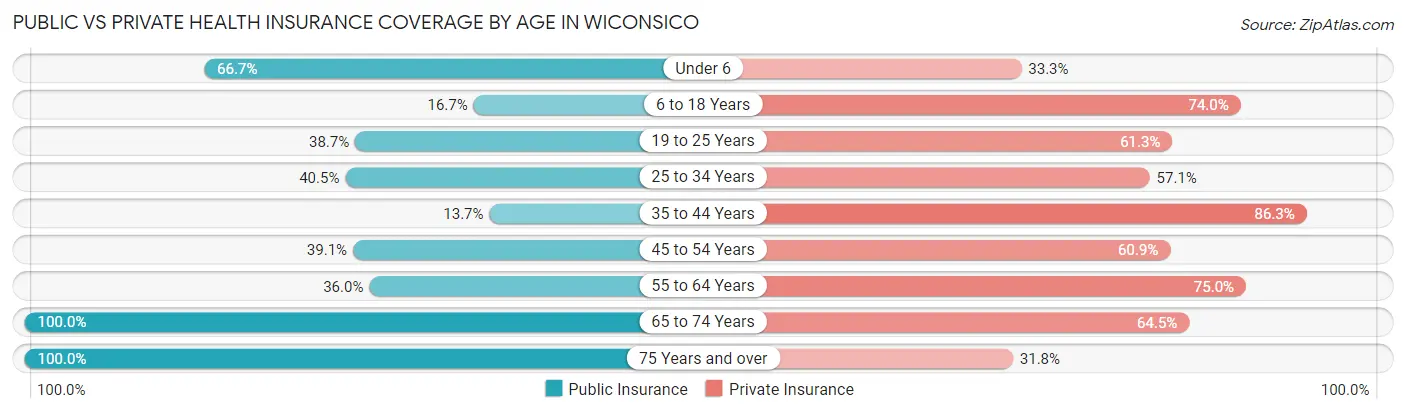
| Age Bracket | Public Insurance | Private Insurance |
| Under 6 | 54 (66.7%) | 27 (33.3%) |
| 6 to 18 Years | 25 (16.7%) | 111 (74.0%) |
| 19 to 25 Years | 29 (38.7%) | 46 (61.3%) |
| 25 to 34 Years | 34 (40.5%) | 48 (57.1%) |
| 35 to 44 Years | 7 (13.7%) | 44 (86.3%) |
| 45 to 54 Years | 25 (39.1%) | 39 (60.9%) |
| 55 to 64 Years | 49 (36.0%) | 102 (75.0%) |
| 65 to 74 Years | 76 (100.0%) | 49 (64.5%) |
| 75 Years and over | 63 (100.0%) | 20 (31.8%) |
| Total | 362 (46.4%) | 486 (62.3%) |
Disability Status by Sex by Age in Wiconsico
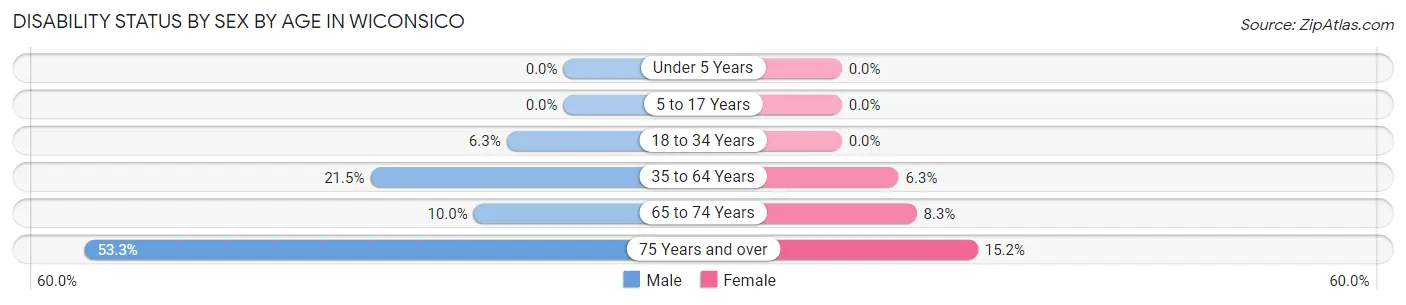
| Age Bracket | Male | Female |
| Under 5 Years | 0 (0.0%) | 0 (0.0%) |
| 5 to 17 Years | 0 (0.0%) | 0 (0.0%) |
| 18 to 34 Years | 5 (6.3%) | 0 (0.0%) |
| 35 to 64 Years | 20 (21.5%) | 10 (6.3%) |
| 65 to 74 Years | 4 (10.0%) | 3 (8.3%) |
| 75 Years and over | 16 (53.3%) | 5 (15.1%) |
Disability Class by Sex by Age in Wiconsico
Disability Class: Hearing Difficulty
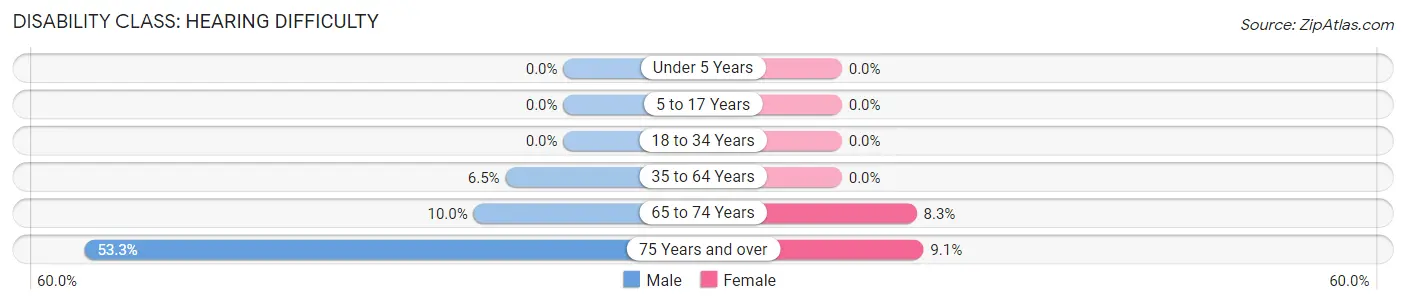
| Age Bracket | Male | Female |
| Under 5 Years | 0 (0.0%) | 0 (0.0%) |
| 5 to 17 Years | 0 (0.0%) | 0 (0.0%) |
| 18 to 34 Years | 0 (0.0%) | 0 (0.0%) |
| 35 to 64 Years | 6 (6.5%) | 0 (0.0%) |
| 65 to 74 Years | 4 (10.0%) | 3 (8.3%) |
| 75 Years and over | 16 (53.3%) | 3 (9.1%) |
Disability Class: Vision Difficulty
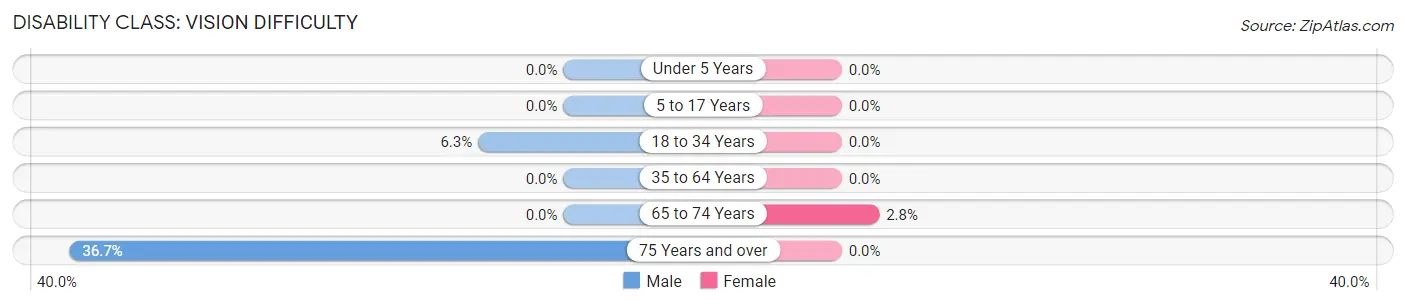
| Age Bracket | Male | Female |
| Under 5 Years | 0 (0.0%) | 0 (0.0%) |
| 5 to 17 Years | 0 (0.0%) | 0 (0.0%) |
| 18 to 34 Years | 5 (6.3%) | 0 (0.0%) |
| 35 to 64 Years | 0 (0.0%) | 0 (0.0%) |
| 65 to 74 Years | 0 (0.0%) | 1 (2.8%) |
| 75 Years and over | 11 (36.7%) | 0 (0.0%) |
Disability Class: Cognitive Difficulty
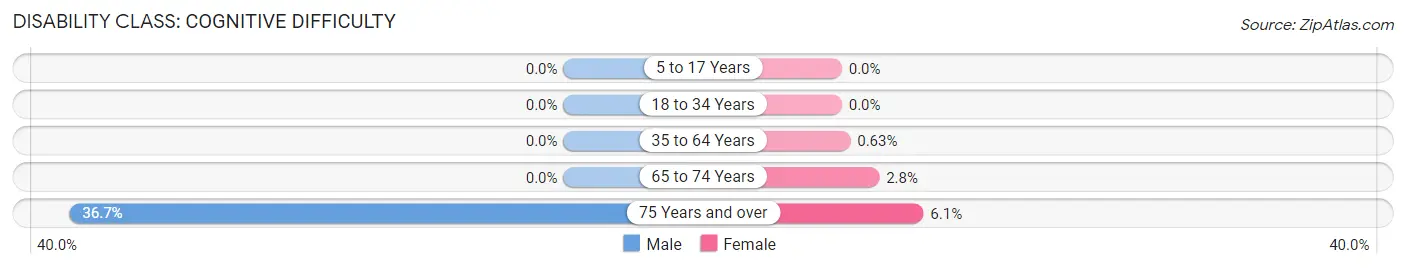
| Age Bracket | Male | Female |
| 5 to 17 Years | 0 (0.0%) | 0 (0.0%) |
| 18 to 34 Years | 0 (0.0%) | 0 (0.0%) |
| 35 to 64 Years | 0 (0.0%) | 1 (0.6%) |
| 65 to 74 Years | 0 (0.0%) | 1 (2.8%) |
| 75 Years and over | 11 (36.7%) | 2 (6.1%) |
Disability Class: Ambulatory Difficulty
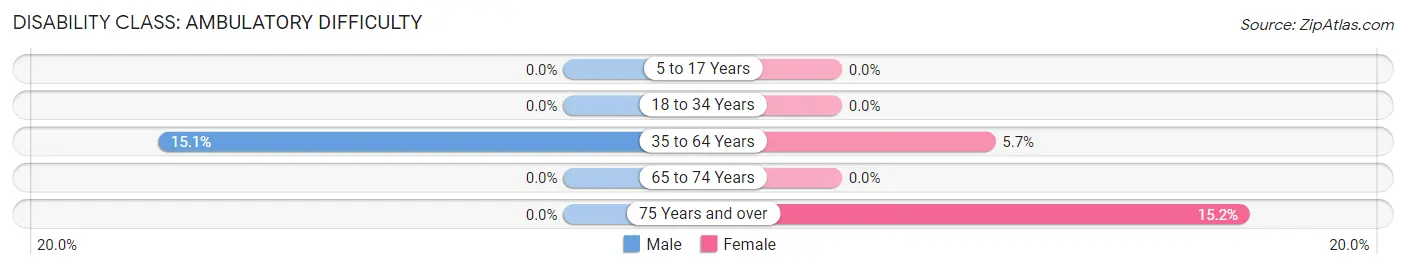
| Age Bracket | Male | Female |
| 5 to 17 Years | 0 (0.0%) | 0 (0.0%) |
| 18 to 34 Years | 0 (0.0%) | 0 (0.0%) |
| 35 to 64 Years | 14 (15.0%) | 9 (5.7%) |
| 65 to 74 Years | 0 (0.0%) | 0 (0.0%) |
| 75 Years and over | 0 (0.0%) | 5 (15.1%) |
Disability Class: Self-Care Difficulty
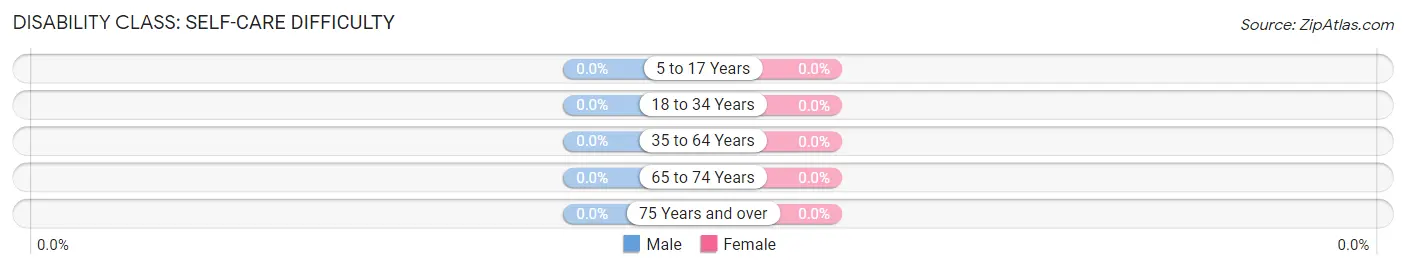
| Age Bracket | Male | Female |
| 5 to 17 Years | 0 (0.0%) | 0 (0.0%) |
| 18 to 34 Years | 0 (0.0%) | 0 (0.0%) |
| 35 to 64 Years | 0 (0.0%) | 0 (0.0%) |
| 65 to 74 Years | 0 (0.0%) | 0 (0.0%) |
| 75 Years and over | 0 (0.0%) | 0 (0.0%) |
Technology Access in Wiconsico
Computing Device Access in Wiconsico
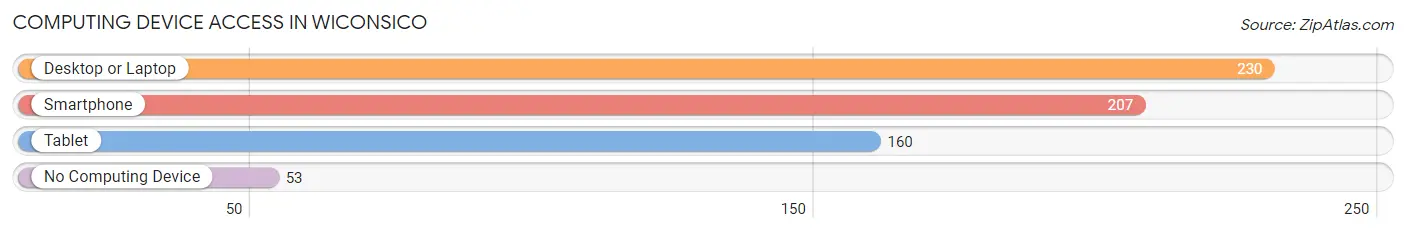
| Device Type | # Households | % Households |
| Desktop or Laptop | 230 | 72.1% |
| Smartphone | 207 | 64.9% |
| Tablet | 160 | 50.2% |
| No Computing Device | 53 | 16.6% |
| Total | 319 | 100.0% |
Internet Access in Wiconsico
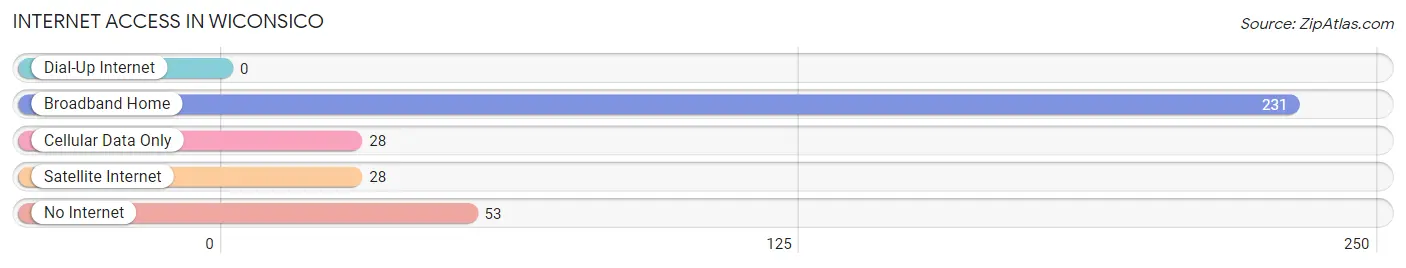
| Internet Type | # Households | % Households |
| Dial-Up Internet | 0 | 0.0% |
| Broadband Home | 231 | 72.4% |
| Cellular Data Only | 28 | 8.8% |
| Satellite Internet | 28 | 8.8% |
| No Internet | 53 | 16.6% |
| Total | 319 | 100.0% |
Wiconsico Summary
Wiconsico, Pennsylvania is a small borough located in the southeastern corner of the state. It is situated in the Susquehanna Valley, approximately 20 miles south of Harrisburg and about 90 miles northwest of Philadelphia. The borough is bordered by the Susquehanna River to the east and the Juniata River to the west. The population of Wiconsico was 1,845 as of the 2010 census.
History
The area that is now Wiconsico was first settled in the late 1700s by German immigrants. The town was originally known as “Wiconsico”, which is derived from the Native American term for “place of many springs”. The town was officially incorporated in 1845.
In the late 1800s, Wiconsico was a thriving industrial center. The town was home to several factories, including a paper mill, a flour mill, and a tannery. The town also had a railroad station, which connected it to the rest of the state.
In the early 1900s, Wiconsico began to decline as the factories closed and the railroad station was abandoned. The town’s population decreased from 2,000 in 1900 to 1,500 in 1950.
Geography
Wiconsico is located in the southeastern corner of Pennsylvania, in the Susquehanna Valley. The borough is bordered by the Susquehanna River to the east and the Juniata River to the west. The town is situated on a plateau, with an elevation of approximately 1,000 feet.
The climate in Wiconsico is humid continental, with hot summers and cold winters. The average annual temperature is around 50 degrees Fahrenheit. The average annual precipitation is around 40 inches.
Economy
The economy of Wiconsico is largely based on agriculture and tourism. The town is home to several farms, which produce a variety of crops, including corn, soybeans, and hay. The town also has several wineries and breweries, which attract tourists from all over the state.
The town also has several small businesses, including restaurants, shops, and a hardware store. The town also has a few manufacturing companies, which produce a variety of products, including furniture and clothing.
Demographics
As of the 2010 census, the population of Wiconsico was 1,845. The racial makeup of the town was 97.3% White, 0.9% African American, 0.2% Native American, 0.3% Asian, and 1.3% from other races. The median household income was $41,250, and the median family income was $50,000.
The town is home to several churches, including the Wiconsico United Methodist Church, the Wiconsico Presbyterian Church, and the Wiconsico Lutheran Church. The town also has a public library, a post office, and a fire department.
Conclusion
Wiconsico, Pennsylvania is a small borough located in the southeastern corner of the state. It is situated in the Susquehanna Valley, approximately 20 miles south of Harrisburg and about 90 miles northwest of Philadelphia. The borough is bordered by the Susquehanna River to the east and the Juniata River to the west. The population of Wiconsico was 1,845 as of the 2010 census. The town’s economy is largely based on agriculture and tourism, and the town is home to several churches, a public library, a post office, and a fire department.
Common Questions
What is Per Capita Income in Wiconsico?
Per Capita income in Wiconsico is $26,024.
What is the Median Family Income in Wiconsico?
Median Family Income in Wiconsico is $78,056.
What is the Median Household income in Wiconsico?
Median Household Income in Wiconsico is $55,938.
What is Income or Wage Gap in Wiconsico?
Income or Wage Gap in Wiconsico is 43.6%.
Women in Wiconsico earn 56.4 cents for every dollar earned by a man.
What is Inequality or Gini Index in Wiconsico?
Inequality or Gini Index in Wiconsico is 0.36.
What is the Total Population of Wiconsico?
Total Population of Wiconsico is 784.
What is the Total Male Population of Wiconsico?
Total Male Population of Wiconsico is 419.
What is the Total Female Population of Wiconsico?
Total Female Population of Wiconsico is 365.
What is the Ratio of Males per 100 Females in Wiconsico?
There are 114.79 Males per 100 Females in Wiconsico.
What is the Ratio of Females per 100 Males in Wiconsico?
There are 87.11 Females per 100 Males in Wiconsico.
What is the Median Population Age in Wiconsico?
Median Population Age in Wiconsico is 35.1 Years.
What is the Average Family Size in Wiconsico
Average Family Size in Wiconsico is 2.8 People.
What is the Average Household Size in Wiconsico
Average Household Size in Wiconsico is 2.5 People.
How Large is the Labor Force in Wiconsico?
There are 347 People in the Labor Forcein in Wiconsico.
What is the Percentage of People in the Labor Force in Wiconsico?
59.0% of People are in the Labor Force in Wiconsico.
What is the Unemployment Rate in Wiconsico?
Unemployment Rate in Wiconsico is 8.2%.