Spring Mills, PA Map & Demographics
Spring Mills Map
Spring Mills Overview
$29,336
PER CAPITA INCOME
$66,198
AVG FAMILY INCOME
$57,639
AVG HOUSEHOLD INCOME
21.5%
WAGE / INCOME GAP [ % ]
78.5¢/ $1
WAGE / INCOME GAP [ $ ]
0.35
INEQUALITY / GINI INDEX
424
TOTAL POPULATION
196
MALE POPULATION
228
FEMALE POPULATION
85.96
MALES / 100 FEMALES
116.33
FEMALES / 100 MALES
48.4
MEDIAN AGE
2.5
AVG FAMILY SIZE
2.1
AVG HOUSEHOLD SIZE
233
LABOR FORCE [ PEOPLE ]
66.6%
PERCENT IN LABOR FORCE
8.6%
UNEMPLOYMENT RATE
Spring Mills Zip Codes
Spring Mills Area Codes
Income in Spring Mills
Income Overview in Spring Mills
Per Capita Income in Spring Mills is $29,336, while median incomes of families and households are $66,198 and $57,639 respectively.
| Characteristic | Number | Measure |
| Per Capita Income | 424 | $29,336 |
| Median Family Income | 139 | $66,198 |
| Mean Family Income | 139 | $72,313 |
| Median Household Income | 203 | $57,639 |
| Mean Household Income | 203 | $63,488 |
| Income Deficit | 139 | $0 |
| Wage / Income Gap (%) | 424 | 21.52% |
| Wage / Income Gap ($) | 424 | 78.48¢ per $1 |
| Gini / Inequality Index | 424 | 0.35 |
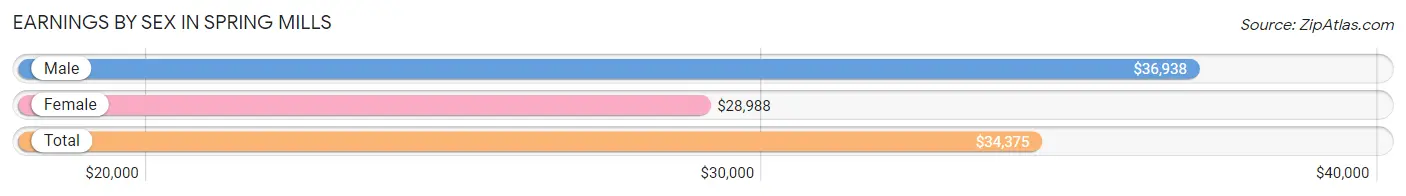
Earnings by Sex in Spring Mills
Average Earnings in Spring Mills are $34,375, $36,938 for men and $28,988 for women, a difference of 21.5%.
| Sex | Number | Average Earnings |
| Male | 115 (47.7%) | $36,938 |
| Female | 126 (52.3%) | $28,988 |
| Total | 241 (100.0%) | $34,375 |
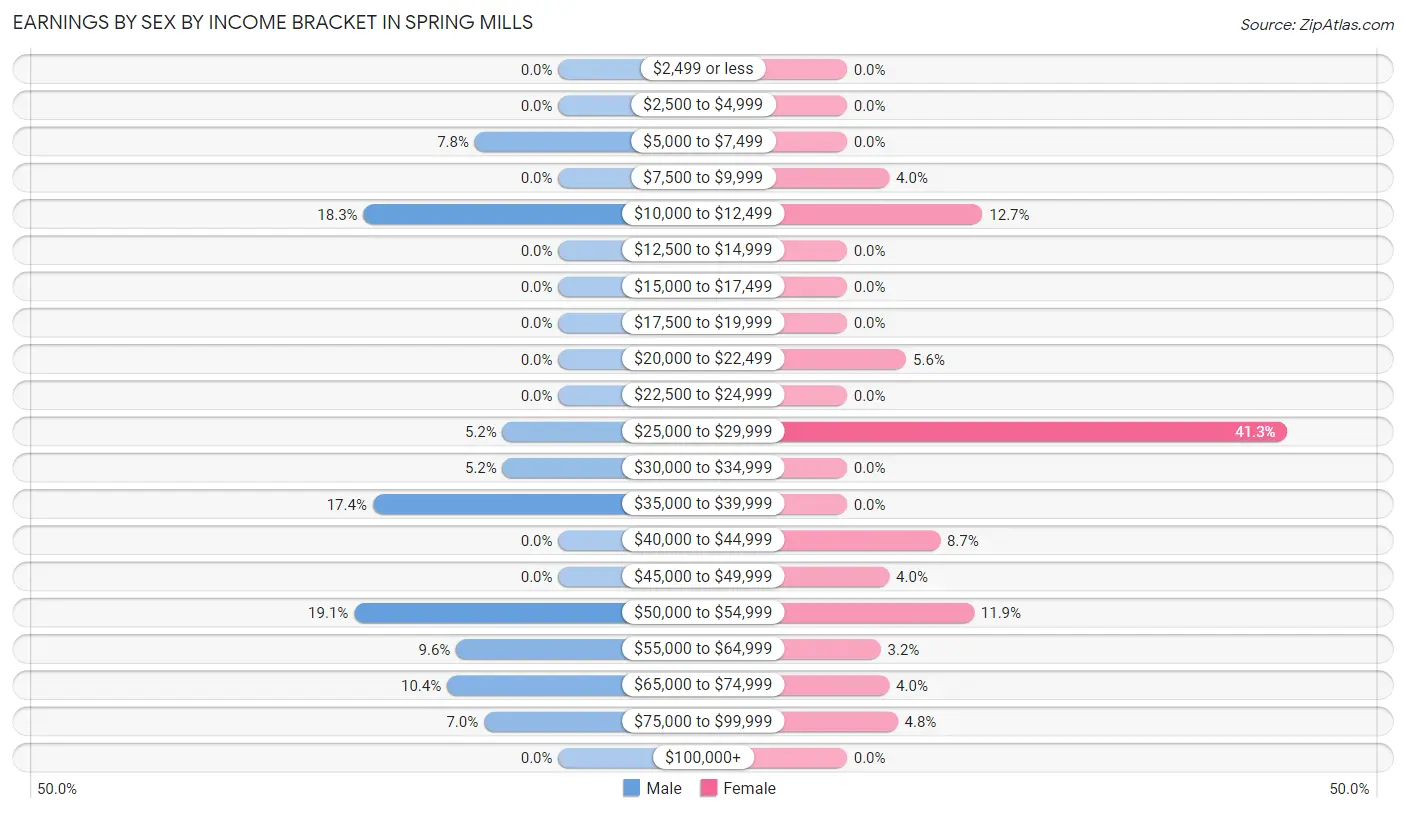
Earnings by Sex by Income Bracket in Spring Mills
The most common earnings brackets in Spring Mills are $50,000 to $54,999 for men (22 | 19.1%) and $25,000 to $29,999 for women (52 | 41.3%).
| Income | Male | Female |
| $2,499 or less | 0 (0.0%) | 0 (0.0%) |
| $2,500 to $4,999 | 0 (0.0%) | 0 (0.0%) |
| $5,000 to $7,499 | 9 (7.8%) | 0 (0.0%) |
| $7,500 to $9,999 | 0 (0.0%) | 5 (4.0%) |
| $10,000 to $12,499 | 21 (18.3%) | 16 (12.7%) |
| $12,500 to $14,999 | 0 (0.0%) | 0 (0.0%) |
| $15,000 to $17,499 | 0 (0.0%) | 0 (0.0%) |
| $17,500 to $19,999 | 0 (0.0%) | 0 (0.0%) |
| $20,000 to $22,499 | 0 (0.0%) | 7 (5.6%) |
| $22,500 to $24,999 | 0 (0.0%) | 0 (0.0%) |
| $25,000 to $29,999 | 6 (5.2%) | 52 (41.3%) |
| $30,000 to $34,999 | 6 (5.2%) | 0 (0.0%) |
| $35,000 to $39,999 | 20 (17.4%) | 0 (0.0%) |
| $40,000 to $44,999 | 0 (0.0%) | 11 (8.7%) |
| $45,000 to $49,999 | 0 (0.0%) | 5 (4.0%) |
| $50,000 to $54,999 | 22 (19.1%) | 15 (11.9%) |
| $55,000 to $64,999 | 11 (9.6%) | 4 (3.2%) |
| $65,000 to $74,999 | 12 (10.4%) | 5 (4.0%) |
| $75,000 to $99,999 | 8 (7.0%) | 6 (4.8%) |
| $100,000+ | 0 (0.0%) | 0 (0.0%) |
| Total | 115 (100.0%) | 126 (100.0%) |
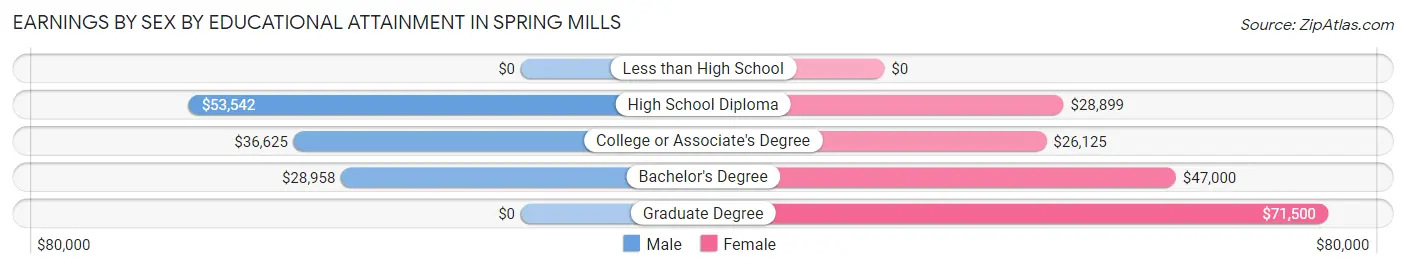
Earnings by Sex by Educational Attainment in Spring Mills
Average earnings in Spring Mills are $37,000 for men and $28,988 for women, a difference of 21.6%. Men with an educational attainment of high school diploma enjoy the highest average annual earnings of $53,542, while those with bachelor's degree education earn the least with $28,958. Women with an educational attainment of graduate degree earn the most with the average annual earnings of $71,500, while those with college or associate's degree education have the smallest earnings of $26,125.
| Educational Attainment | Male Income | Female Income |
| Less than High School | - | - |
| High School Diploma | $53,542 | $28,899 |
| College or Associate's Degree | $36,625 | $26,125 |
| Bachelor's Degree | $28,958 | $47,000 |
| Graduate Degree | - | - |
| Total | $37,000 | $28,988 |
Family Income in Spring Mills
Family Income Brackets in Spring Mills
According to the Spring Mills family income data, there are 37 families falling into the $50,000 to $74,999 income range, which is the most common income bracket and makes up 26.6% of all families.
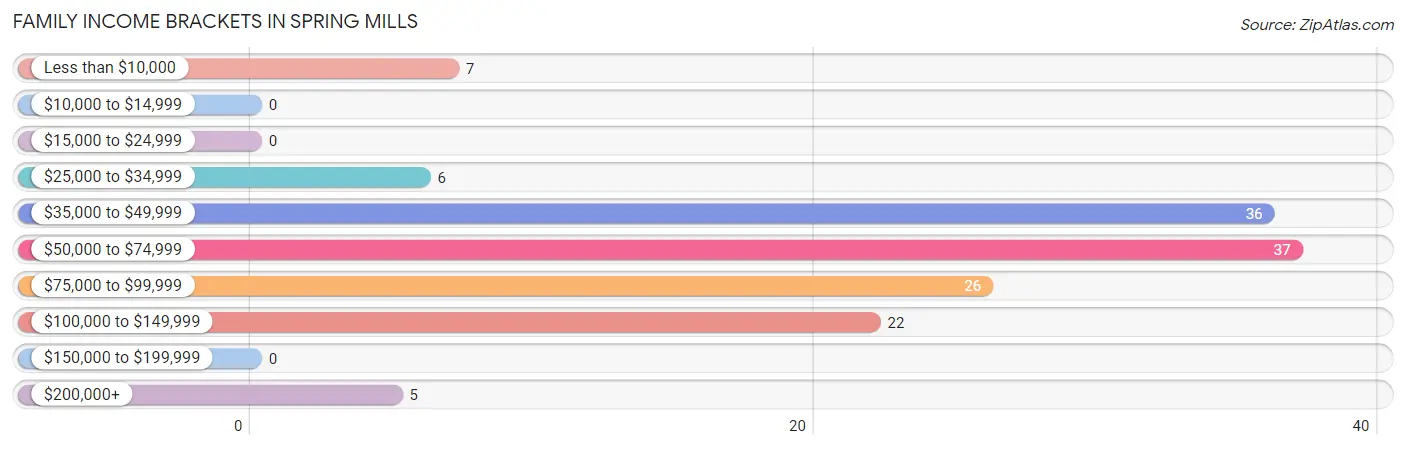
| Income Bracket | # Families | % Families |
| Less than $10,000 | 7 | 5.0% |
| $10,000 to $14,999 | 0 | 0.0% |
| $15,000 to $24,999 | 0 | 0.0% |
| $25,000 to $34,999 | 6 | 4.3% |
| $35,000 to $49,999 | 36 | 25.9% |
| $50,000 to $74,999 | 37 | 26.6% |
| $75,000 to $99,999 | 26 | 18.7% |
| $100,000 to $149,999 | 22 | 15.8% |
| $150,000 to $199,999 | 0 | 0.0% |
| $200,000+ | 5 | 3.6% |
Family Income by Famaliy Size in Spring Mills
2-person families (97 | 69.8%) account for the highest median family income in Spring Mills with $66,823 per family, while 2-person families (97 | 69.8%) have the highest median income of $33,412 per family member.
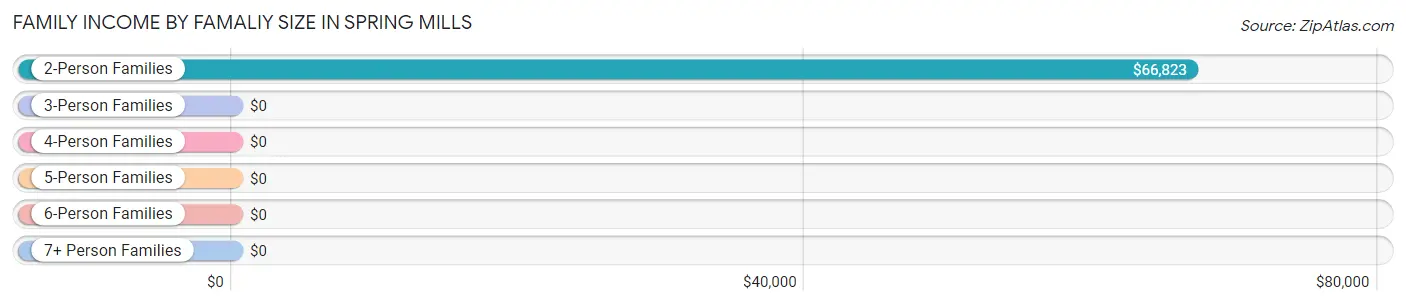
| Income Bracket | # Families | Median Income |
| 2-Person Families | 97 (69.8%) | $66,823 |
| 3-Person Families | 18 (13.0%) | $0 |
| 4-Person Families | 4 (2.9%) | $0 |
| 5-Person Families | 20 (14.4%) | $0 |
| 6-Person Families | 0 (0.0%) | $0 |
| 7+ Person Families | 0 (0.0%) | $0 |
| Total | 139 (100.0%) | $66,198 |
Family Income by Number of Earners in Spring Mills
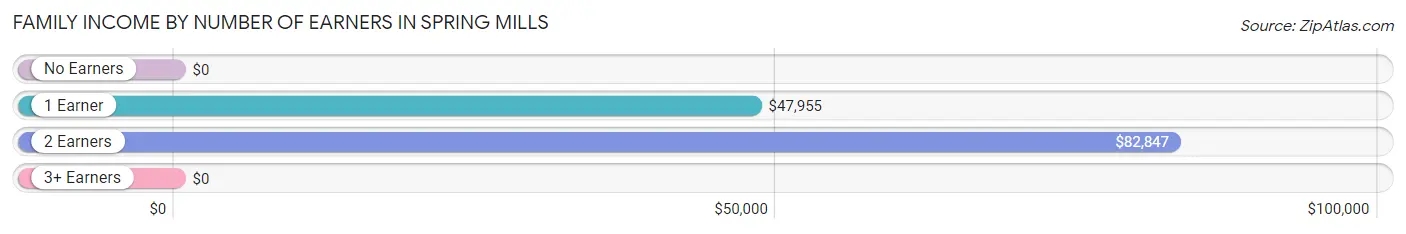
| Number of Earners | # Families | Median Income |
| No Earners | 22 (15.8%) | $0 |
| 1 Earner | 36 (25.9%) | $47,955 |
| 2 Earners | 69 (49.6%) | $82,847 |
| 3+ Earners | 12 (8.6%) | $0 |
| Total | 139 (100.0%) | $66,198 |
Household Income in Spring Mills
Household Income Brackets in Spring Mills
With 46 households falling in the category, the $25,000 to $34,999 income range is the most frequent in Spring Mills, accounting for 22.7% of all households.
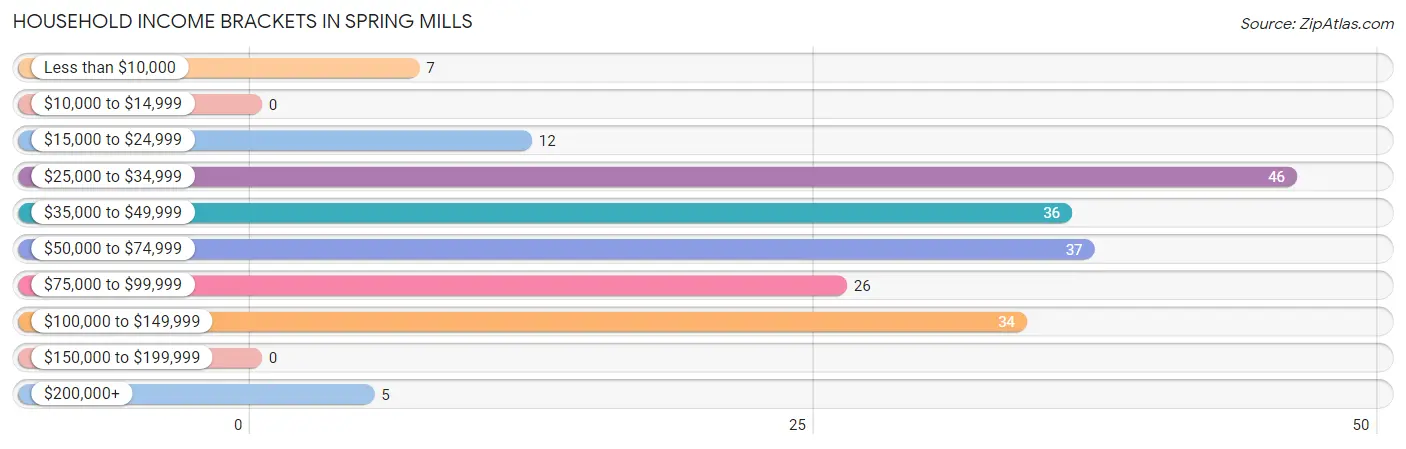
| Income Bracket | # Households | % Households |
| Less than $10,000 | 7 | 3.4% |
| $10,000 to $14,999 | 0 | 0.0% |
| $15,000 to $24,999 | 12 | 5.9% |
| $25,000 to $34,999 | 46 | 22.7% |
| $35,000 to $49,999 | 36 | 17.7% |
| $50,000 to $74,999 | 37 | 18.2% |
| $75,000 to $99,999 | 26 | 12.8% |
| $100,000 to $149,999 | 34 | 16.7% |
| $150,000 to $199,999 | 0 | 0.0% |
| $200,000+ | 5 | 2.5% |
Household Income by Householder Age in Spring Mills
The median household income in Spring Mills is $57,639, with the highest median household income of $66,719 found in the 45 to 64 years age bracket for the primary householder. A total of 93 households (45.8%) fall into this category.
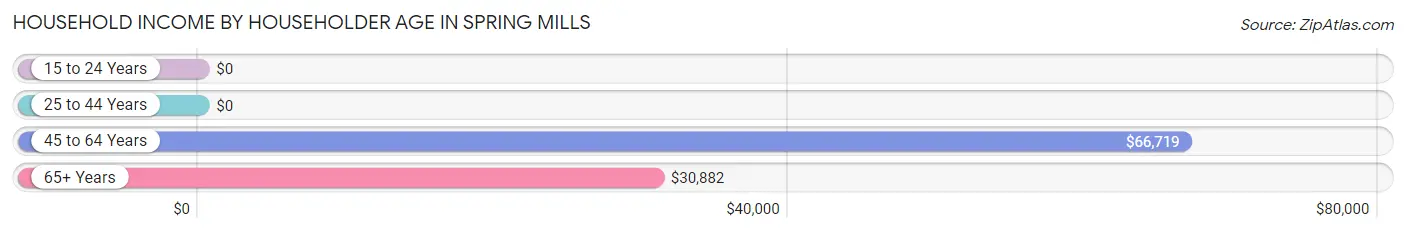
| Income Bracket | # Households | Median Income |
| 15 to 24 Years | 0 (0.0%) | $0 |
| 25 to 44 Years | 38 (18.7%) | $0 |
| 45 to 64 Years | 93 (45.8%) | $66,719 |
| 65+ Years | 72 (35.5%) | $30,882 |
| Total | 203 (100.0%) | $57,639 |
Poverty in Spring Mills
Income Below Poverty by Sex and Age in Spring Mills
With 3.6% poverty level for males and 7.9% for females among the residents of Spring Mills, 15 year old males and 12 to 14 year old females are the most vulnerable to poverty, with 7 males (100.0%) and 6 females (100.0%) in their respective age groups living below the poverty level.
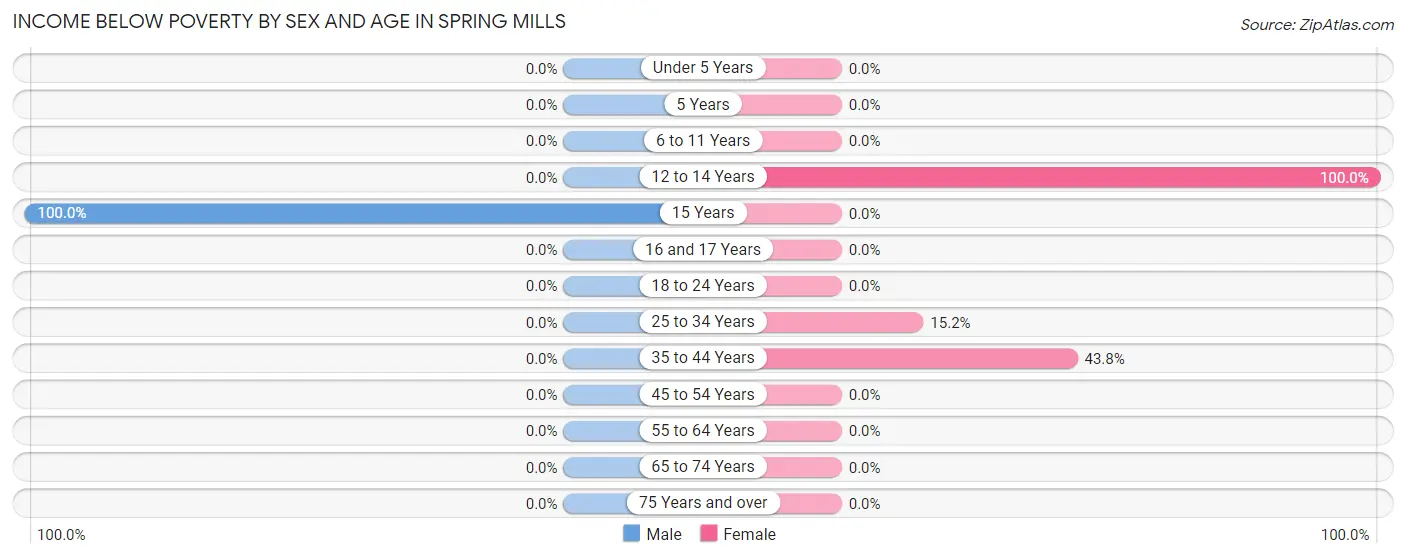
| Age Bracket | Male | Female |
| Under 5 Years | 0 (0.0%) | 0 (0.0%) |
| 5 Years | 0 (0.0%) | 0 (0.0%) |
| 6 to 11 Years | 0 (0.0%) | 0 (0.0%) |
| 12 to 14 Years | 0 (0.0%) | 6 (100.0%) |
| 15 Years | 7 (100.0%) | 0 (0.0%) |
| 16 and 17 Years | 0 (0.0%) | 0 (0.0%) |
| 18 to 24 Years | 0 (0.0%) | 0 (0.0%) |
| 25 to 34 Years | 0 (0.0%) | 5 (15.1%) |
| 35 to 44 Years | 0 (0.0%) | 7 (43.8%) |
| 45 to 54 Years | 0 (0.0%) | 0 (0.0%) |
| 55 to 64 Years | 0 (0.0%) | 0 (0.0%) |
| 65 to 74 Years | 0 (0.0%) | 0 (0.0%) |
| 75 Years and over | 0 (0.0%) | 0 (0.0%) |
| Total | 7 (3.6%) | 18 (7.9%) |
Income Above Poverty by Sex and Age in Spring Mills
According to the poverty statistics in Spring Mills, males aged under 5 years and females aged under 5 years are the age groups that are most secure financially, with 100.0% of males and 100.0% of females in these age groups living above the poverty line.
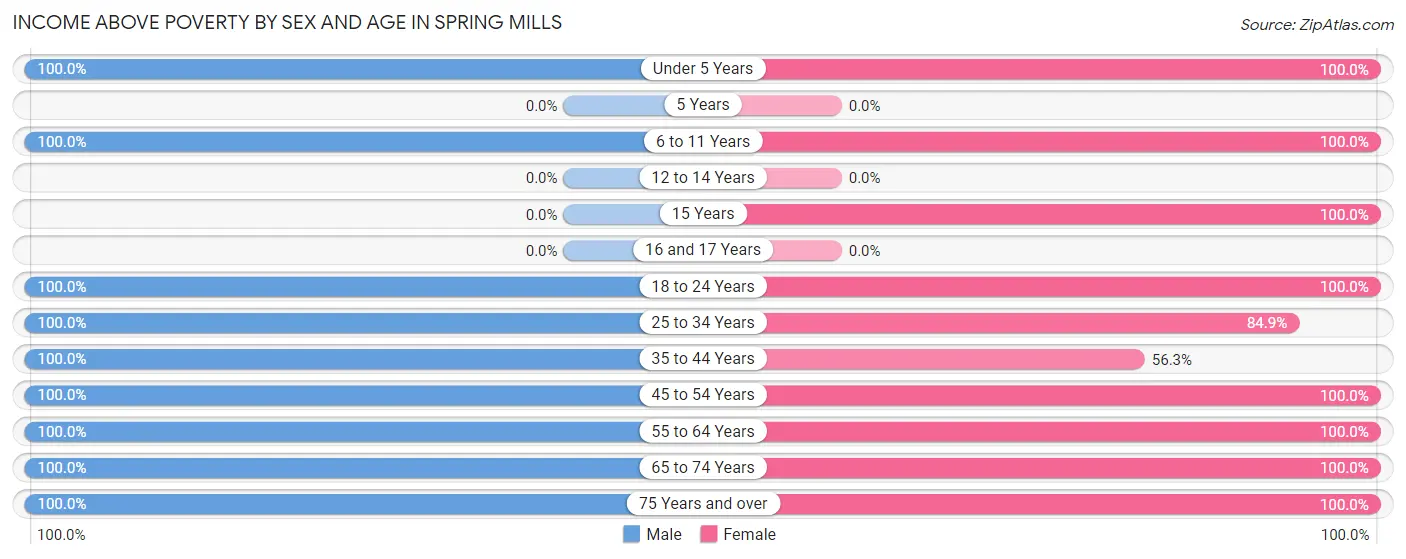
| Age Bracket | Male | Female |
| Under 5 Years | 3 (100.0%) | 13 (100.0%) |
| 5 Years | 0 (0.0%) | 0 (0.0%) |
| 6 to 11 Years | 27 (100.0%) | 9 (100.0%) |
| 12 to 14 Years | 0 (0.0%) | 0 (0.0%) |
| 15 Years | 0 (0.0%) | 9 (100.0%) |
| 16 and 17 Years | 0 (0.0%) | 0 (0.0%) |
| 18 to 24 Years | 1 (100.0%) | 6 (100.0%) |
| 25 to 34 Years | 24 (100.0%) | 28 (84.9%) |
| 35 to 44 Years | 20 (100.0%) | 9 (56.2%) |
| 45 to 54 Years | 14 (100.0%) | 70 (100.0%) |
| 55 to 64 Years | 52 (100.0%) | 18 (100.0%) |
| 65 to 74 Years | 20 (100.0%) | 20 (100.0%) |
| 75 Years and over | 28 (100.0%) | 28 (100.0%) |
| Total | 189 (96.4%) | 210 (92.1%) |
Income Below Poverty Among Married-Couple Families in Spring Mills
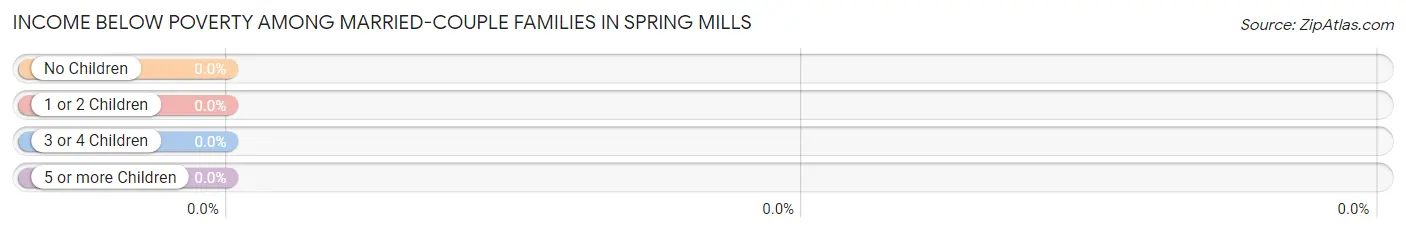
| Children | Above Poverty | Below Poverty |
| No Children | 84 (100.0%) | 0 (0.0%) |
| 1 or 2 Children | 12 (100.0%) | 0 (0.0%) |
| 3 or 4 Children | 0 (0.0%) | 0 (0.0%) |
| 5 or more Children | 0 (0.0%) | 0 (0.0%) |
| Total | 96 (100.0%) | 0 (0.0%) |
Income Below Poverty Among Single-Parent Households in Spring Mills
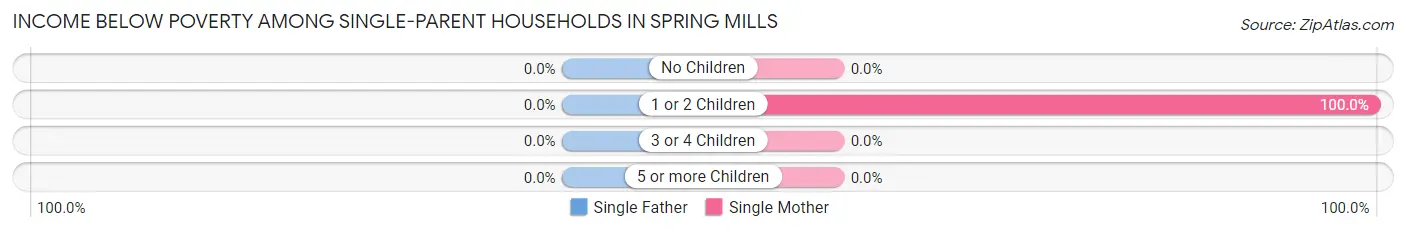
| Children | Single Father | Single Mother |
| No Children | 0 (0.0%) | 0 (0.0%) |
| 1 or 2 Children | 0 (0.0%) | 7 (100.0%) |
| 3 or 4 Children | 0 (0.0%) | 0 (0.0%) |
| 5 or more Children | 0 (0.0%) | 0 (0.0%) |
| Total | 0 (0.0%) | 7 (25.0%) |
Income Below Poverty Among Married-Couple vs Single-Parent Households in Spring Mills
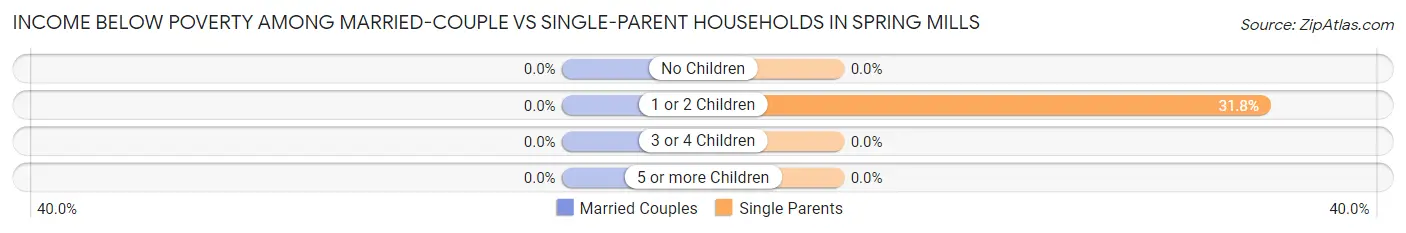
| Children | Married-Couple Families | Single-Parent Households |
| No Children | 0 (0.0%) | 0 (0.0%) |
| 1 or 2 Children | 0 (0.0%) | 7 (31.8%) |
| 3 or 4 Children | 0 (0.0%) | 0 (0.0%) |
| 5 or more Children | 0 (0.0%) | 0 (0.0%) |
| Total | 0 (0.0%) | 7 (16.3%) |
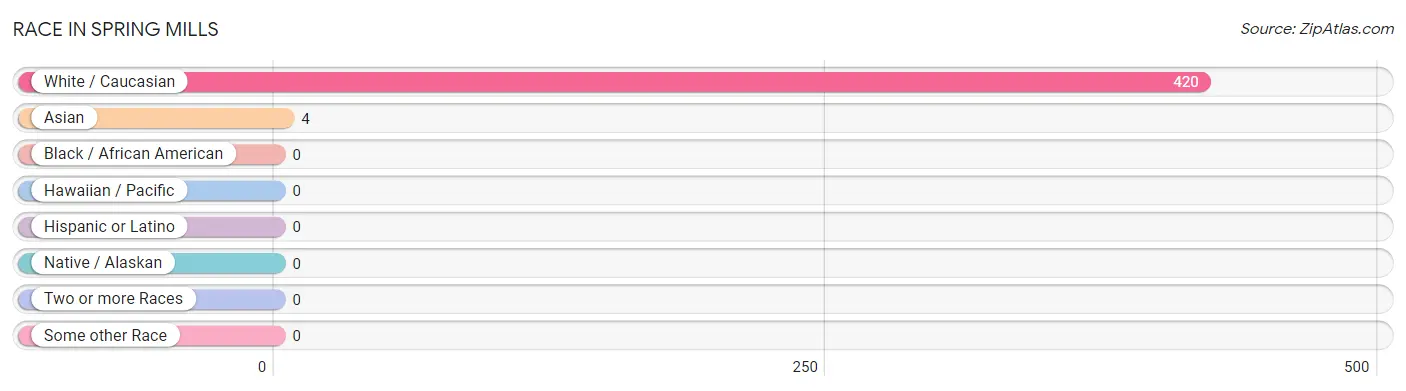
Race in Spring Mills
The most populous races in Spring Mills are White / Caucasian (420 | 99.1%), and Asian (4 | 0.9%).
| Race | # Population | % Population |
| Asian | 4 | 0.9% |
| Black / African American | 0 | 0.0% |
| Hawaiian / Pacific | 0 | 0.0% |
| Hispanic or Latino | 0 | 0.0% |
| Native / Alaskan | 0 | 0.0% |
| White / Caucasian | 420 | 99.1% |
| Two or more Races | 0 | 0.0% |
| Some other Race | 0 | 0.0% |
| Total | 424 | 100.0% |
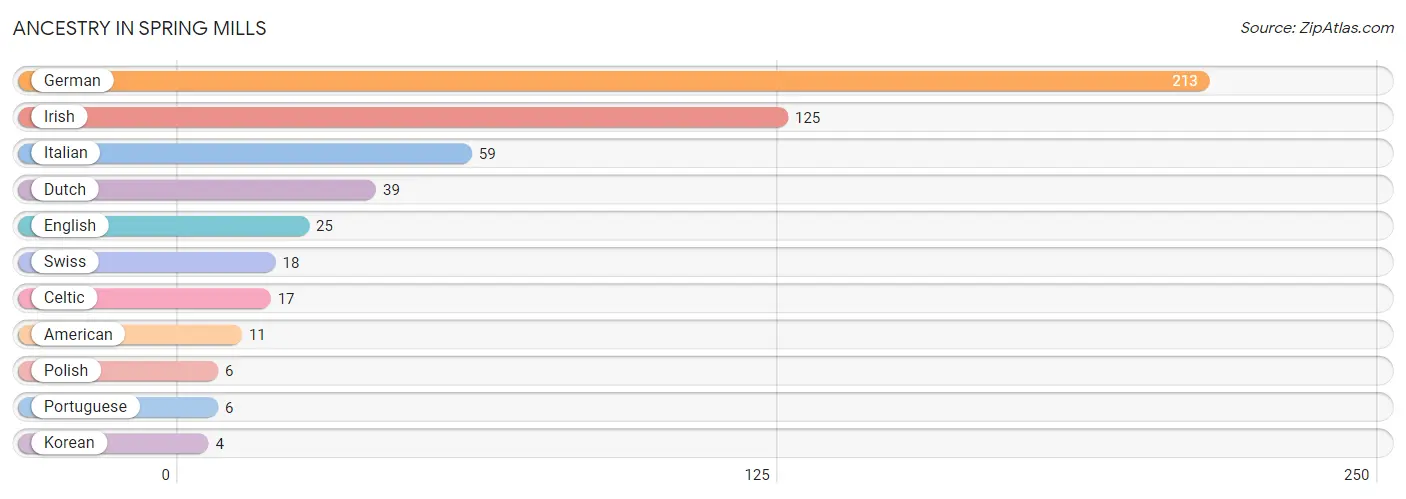
Ancestry in Spring Mills
The most populous ancestries reported in Spring Mills are German (213 | 50.2%), Irish (125 | 29.5%), Italian (59 | 13.9%), Dutch (39 | 9.2%), and English (25 | 5.9%), together accounting for 108.7% of all Spring Mills residents.
| Ancestry | # Population | % Population |
| American | 11 | 2.6% |
| Celtic | 17 | 4.0% |
| Dutch | 39 | 9.2% |
| English | 25 | 5.9% |
| German | 213 | 50.2% |
| Irish | 125 | 29.5% |
| Italian | 59 | 13.9% |
| Korean | 4 | 0.9% |
| Polish | 6 | 1.4% |
| Portuguese | 6 | 1.4% |
| Swiss | 18 | 4.3% | View All 11 Rows |
Immigrants in Spring Mills

| Immigration Origin | # Population | % Population | View All 0 Rows |
Sex and Age in Spring Mills
Sex and Age in Spring Mills
The most populous age groups in Spring Mills are 55 to 59 Years (32 | 16.3%) for men and 45 to 49 Years (55 | 24.1%) for women.
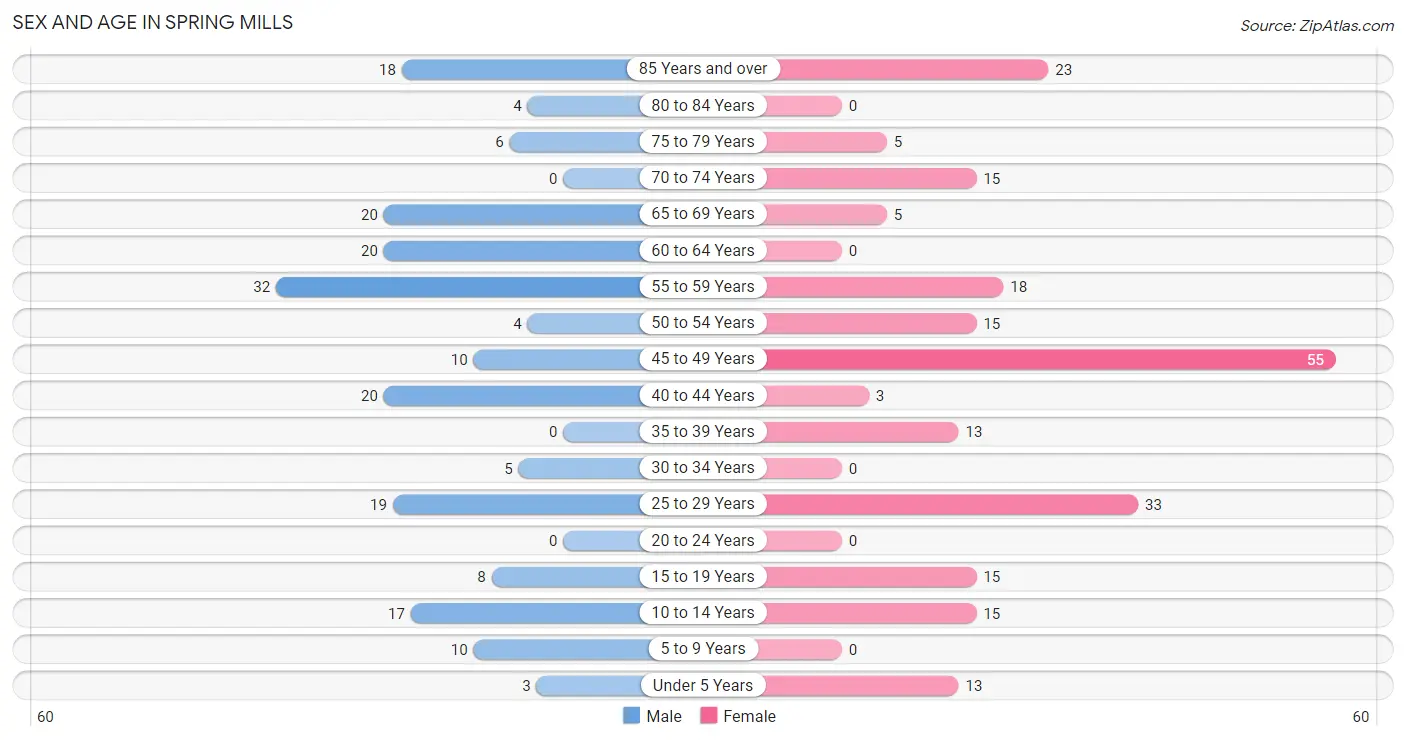
| Age Bracket | Male | Female |
| Under 5 Years | 3 (1.5%) | 13 (5.7%) |
| 5 to 9 Years | 10 (5.1%) | 0 (0.0%) |
| 10 to 14 Years | 17 (8.7%) | 15 (6.6%) |
| 15 to 19 Years | 8 (4.1%) | 15 (6.6%) |
| 20 to 24 Years | 0 (0.0%) | 0 (0.0%) |
| 25 to 29 Years | 19 (9.7%) | 33 (14.5%) |
| 30 to 34 Years | 5 (2.5%) | 0 (0.0%) |
| 35 to 39 Years | 0 (0.0%) | 13 (5.7%) |
| 40 to 44 Years | 20 (10.2%) | 3 (1.3%) |
| 45 to 49 Years | 10 (5.1%) | 55 (24.1%) |
| 50 to 54 Years | 4 (2.0%) | 15 (6.6%) |
| 55 to 59 Years | 32 (16.3%) | 18 (7.9%) |
| 60 to 64 Years | 20 (10.2%) | 0 (0.0%) |
| 65 to 69 Years | 20 (10.2%) | 5 (2.2%) |
| 70 to 74 Years | 0 (0.0%) | 15 (6.6%) |
| 75 to 79 Years | 6 (3.1%) | 5 (2.2%) |
| 80 to 84 Years | 4 (2.0%) | 0 (0.0%) |
| 85 Years and over | 18 (9.2%) | 23 (10.1%) |
| Total | 196 (100.0%) | 228 (100.0%) |
Families and Households in Spring Mills
Median Family Size in Spring Mills
The median family size in Spring Mills is 2.48 persons per family, with single male/father families (15 | 10.8%) accounting for the largest median family size of 4 persons per family. On the other hand, married-couple families (96 | 69.1%) represent the smallest median family size with 2.06 persons per family.
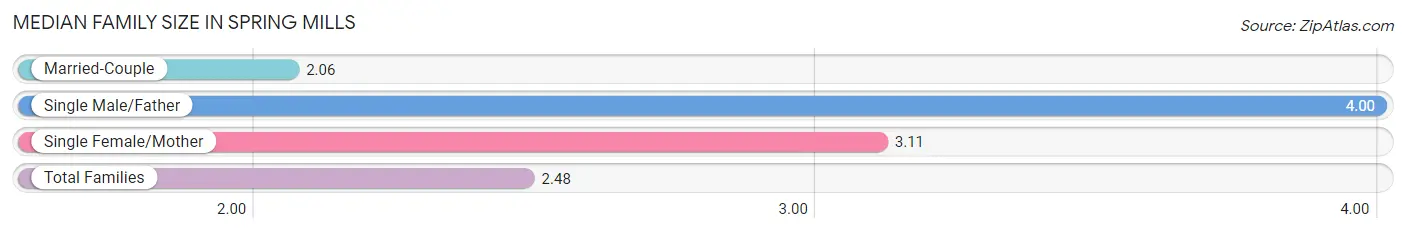
| Family Type | # Families | Family Size |
| Married-Couple | 96 (69.1%) | 2.06 |
| Single Male/Father | 15 (10.8%) | 4.00 |
| Single Female/Mother | 28 (20.1%) | 3.11 |
| Total Families | 139 (100.0%) | 2.48 |
Median Household Size in Spring Mills
The median household size in Spring Mills is 2.09 persons per household, with single male/father households (15 | 7.4%) accounting for the largest median household size of 4 persons per household. non-family households (64 | 31.5%) represent the smallest median household size with 1.23 persons per household.
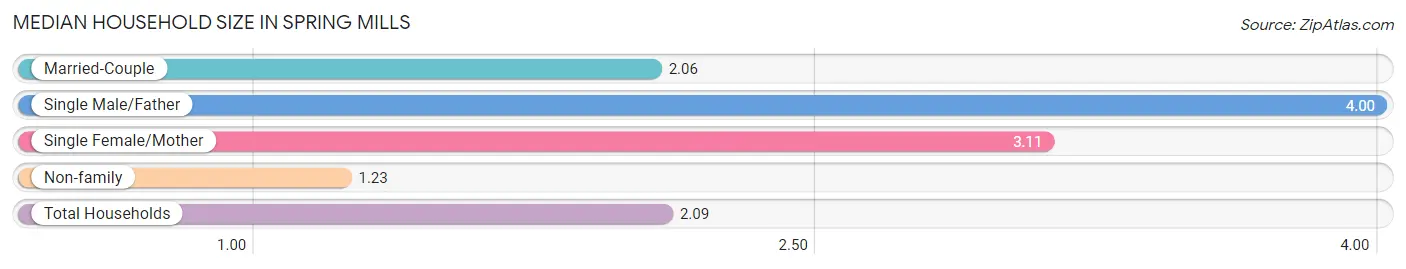
| Household Type | # Households | Household Size |
| Married-Couple | 96 (47.3%) | 2.06 |
| Single Male/Father | 15 (7.4%) | 4.00 |
| Single Female/Mother | 28 (13.8%) | 3.11 |
| Non-family | 64 (31.5%) | 1.23 |
| Total Households | 203 (100.0%) | 2.09 |
Household Size by Marriage Status in Spring Mills
Out of a total of 203 households in Spring Mills, 139 (68.5%) are family households, while 64 (31.5%) are nonfamily households. The most numerous type of family households are 2-person households, comprising 97, and the most common type of nonfamily households are 1-person households, comprising 47.
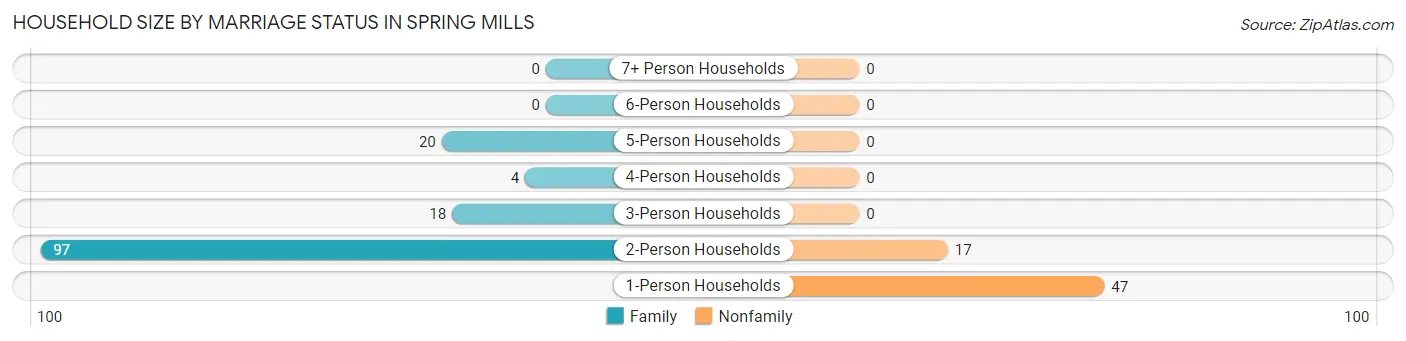
| Household Size | Family Households | Nonfamily Households |
| 1-Person Households | - | 47 (23.2%) |
| 2-Person Households | 97 (47.8%) | 17 (8.4%) |
| 3-Person Households | 18 (8.9%) | 0 (0.0%) |
| 4-Person Households | 4 (2.0%) | 0 (0.0%) |
| 5-Person Households | 20 (9.9%) | 0 (0.0%) |
| 6-Person Households | 0 (0.0%) | 0 (0.0%) |
| 7+ Person Households | 0 (0.0%) | 0 (0.0%) |
| Total | 139 (68.5%) | 64 (31.5%) |
Female Fertility in Spring Mills
Fertility by Age in Spring Mills
| Age Bracket | Women with Births | Births / 1,000 Women |
| 15 to 19 years | 0 (0.0%) | 0.0 |
| 20 to 34 years | 0 (0.0%) | 0.0 |
| 35 to 50 years | 0 (0.0%) | 0.0 |
| Total | 0 (0.0%) | 0.0 |
Fertility by Age by Marriage Status in Spring Mills
| Age Bracket | Married | Unmarried |
| 15 to 19 years | 0 (0.0%) | 0 (0.0%) |
| 20 to 34 years | 0 (0.0%) | 0 (0.0%) |
| 35 to 50 years | 0 (0.0%) | 0 (0.0%) |
| Total | 0 (0.0%) | 0 (0.0%) |
Fertility by Education in Spring Mills
| Educational Attainment | Women with Births | Births / 1,000 Women |
| Less than High School | 0 (0.0%) | 0.0 |
| High School Diploma | 0 (0.0%) | 0.0 |
| College or Associate's Degree | 0 (0.0%) | 0.0 |
| Bachelor's Degree | 0 (0.0%) | 0.0 |
| Graduate Degree | 0 (0.0%) | 0.0 |
| Total | 0 (0.0%) | 0.0 |
Fertility by Education by Marriage Status in Spring Mills
| Educational Attainment | Married | Unmarried |
| Less than High School | 0 (0.0%) | 0 (0.0%) |
| High School Diploma | 0 (0.0%) | 0 (0.0%) |
| College or Associate's Degree | 0 (0.0%) | 0 (0.0%) |
| Bachelor's Degree | 0 (0.0%) | 0 (0.0%) |
| Graduate Degree | 0 (0.0%) | 0 (0.0%) |
| Total | 0 (0.0%) | 0 (0.0%) |
Employment Characteristics in Spring Mills
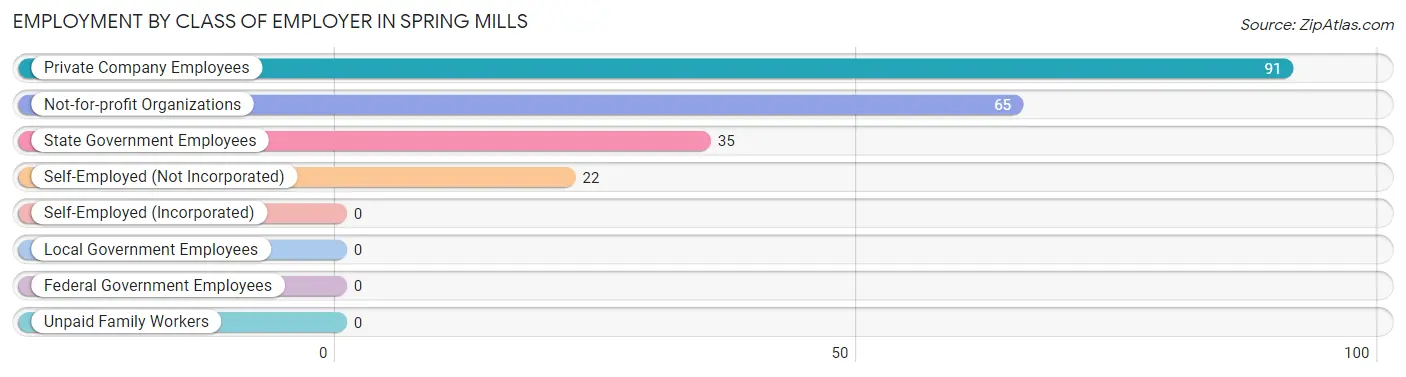
Employment by Class of Employer in Spring Mills
Among the 213 employed individuals in Spring Mills, private company employees (91 | 42.7%), not-for-profit organizations (65 | 30.5%), and state government employees (35 | 16.4%) make up the most common classes of employment.
| Employer Class | # Employees | % Employees |
| Private Company Employees | 91 | 42.7% |
| Self-Employed (Incorporated) | 0 | 0.0% |
| Self-Employed (Not Incorporated) | 22 | 10.3% |
| Not-for-profit Organizations | 65 | 30.5% |
| Local Government Employees | 0 | 0.0% |
| State Government Employees | 35 | 16.4% |
| Federal Government Employees | 0 | 0.0% |
| Unpaid Family Workers | 0 | 0.0% |
| Total | 213 | 100.0% |
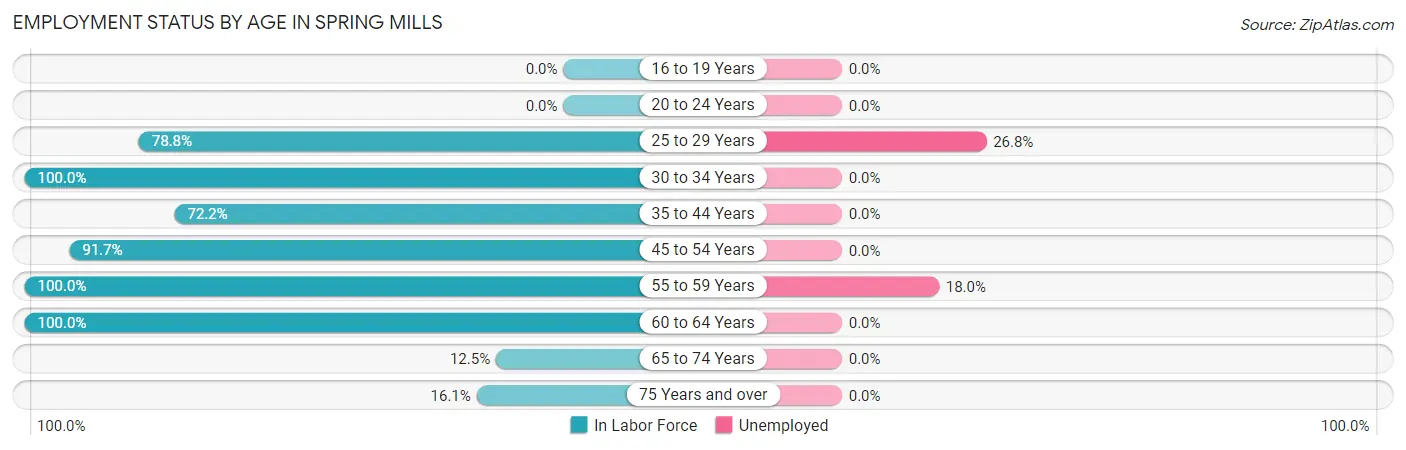
Employment Status by Age in Spring Mills
According to the labor force statistics for Spring Mills, out of the total population over 16 years of age (350), 66.6% or 233 individuals are in the labor force, with 8.6% or 20 of them unemployed. The age group with the highest labor force participation rate is 30 to 34 years, with 100.0% or 5 individuals in the labor force. Within the labor force, the 25 to 29 years age range has the highest percentage of unemployed individuals, with 26.8% or 11 of them being unemployed.
| Age Bracket | In Labor Force | Unemployed |
| 16 to 19 Years | 0 (0.0%) | 0 (0.0%) |
| 20 to 24 Years | 0 (0.0%) | 0 (0.0%) |
| 25 to 29 Years | 41 (78.8%) | 11 (26.8%) |
| 30 to 34 Years | 5 (100.0%) | 0 (0.0%) |
| 35 to 44 Years | 26 (72.2%) | 0 (0.0%) |
| 45 to 54 Years | 77 (91.7%) | 0 (0.0%) |
| 55 to 59 Years | 50 (100.0%) | 9 (18.0%) |
| 60 to 64 Years | 20 (100.0%) | 0 (0.0%) |
| 65 to 74 Years | 5 (12.5%) | 0 (0.0%) |
| 75 Years and over | 9 (16.1%) | 0 (0.0%) |
| Total | 233 (66.6%) | 20 (8.6%) |
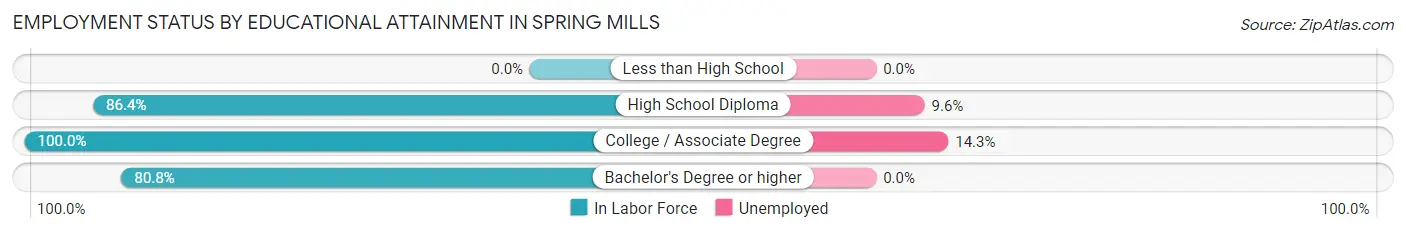
Employment Status by Educational Attainment in Spring Mills
According to labor force statistics for Spring Mills, 88.7% of individuals (219) out of the total population between 25 and 64 years of age (247) are in the labor force, with 9.1% or 20 of them being unemployed. The group with the highest labor force participation rate are those with the educational attainment of college / associate degree, with 100.0% or 63 individuals in the labor force. Within the labor force, individuals with college / associate degree education have the highest percentage of unemployment, with 14.3% or 9 of them being unemployed.
| Educational Attainment | In Labor Force | Unemployed |
| Less than High School | 0 (0.0%) | 0 (0.0%) |
| High School Diploma | 114 (86.4%) | 13 (9.6%) |
| College / Associate Degree | 63 (100.0%) | 9 (14.3%) |
| Bachelor's Degree or higher | 42 (80.8%) | 0 (0.0%) |
| Total | 219 (88.7%) | 22 (9.1%) |
Employment Occupations by Sex in Spring Mills
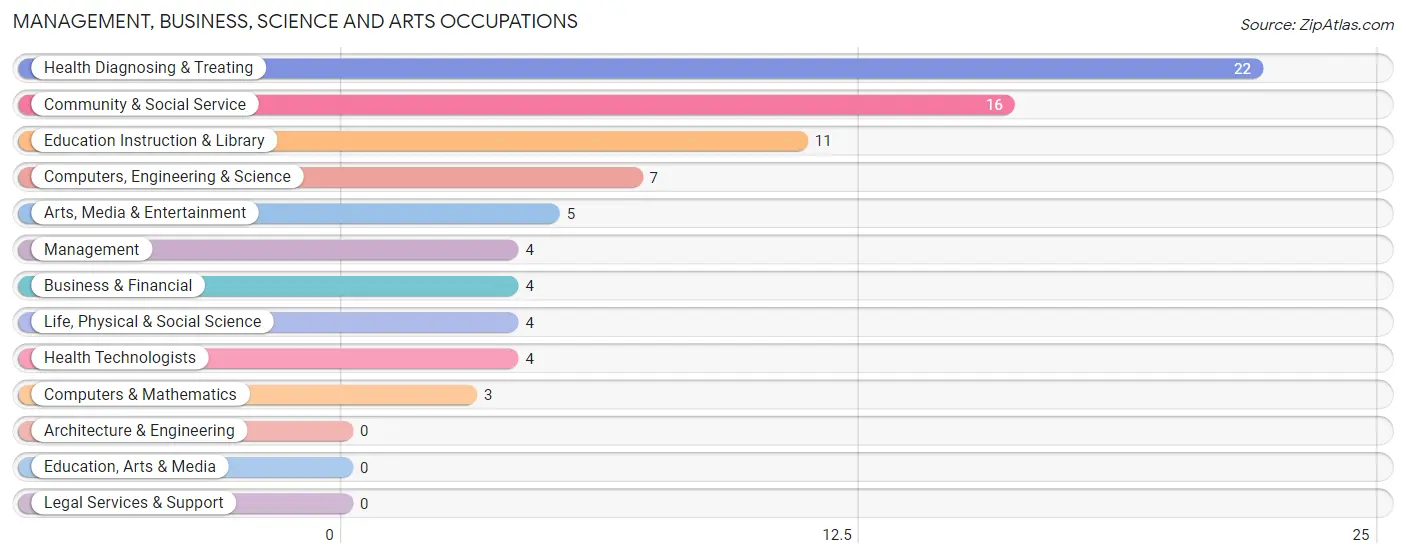
Management, Business, Science and Arts Occupations
The most common Management, Business, Science and Arts occupations in Spring Mills are Health Diagnosing & Treating (22 | 10.3%), Community & Social Service (16 | 7.5%), Education Instruction & Library (11 | 5.2%), Computers, Engineering & Science (7 | 3.3%), and Arts, Media & Entertainment (5 | 2.4%).
Management, Business, Science and Arts Occupations by Sex
Within the Management, Business, Science and Arts occupations in Spring Mills, the most male-oriented occupations are Management (100.0%), Computers, Engineering & Science (100.0%), and Computers & Mathematics (100.0%), while the most female-oriented occupations are Business & Financial (100.0%), Education Instruction & Library (100.0%), and Health Diagnosing & Treating (81.8%).
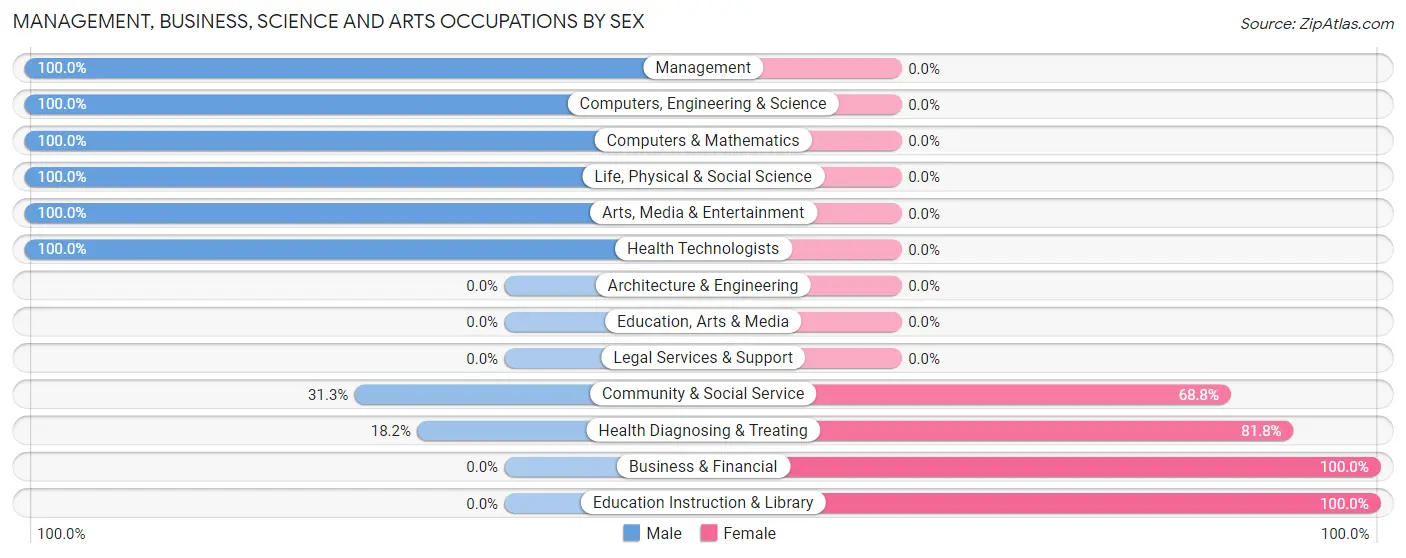
| Occupation | Male | Female |
| Management | 4 (100.0%) | 0 (0.0%) |
| Business & Financial | 0 (0.0%) | 4 (100.0%) |
| Computers, Engineering & Science | 7 (100.0%) | 0 (0.0%) |
| Computers & Mathematics | 3 (100.0%) | 0 (0.0%) |
| Architecture & Engineering | 0 (0.0%) | 0 (0.0%) |
| Life, Physical & Social Science | 4 (100.0%) | 0 (0.0%) |
| Community & Social Service | 5 (31.2%) | 11 (68.8%) |
| Education, Arts & Media | 0 (0.0%) | 0 (0.0%) |
| Legal Services & Support | 0 (0.0%) | 0 (0.0%) |
| Education Instruction & Library | 0 (0.0%) | 11 (100.0%) |
| Arts, Media & Entertainment | 5 (100.0%) | 0 (0.0%) |
| Health Diagnosing & Treating | 4 (18.2%) | 18 (81.8%) |
| Health Technologists | 4 (100.0%) | 0 (0.0%) |
| Total (Category) | 20 (37.7%) | 33 (62.3%) |
| Total (Overall) | 105 (49.3%) | 108 (50.7%) |
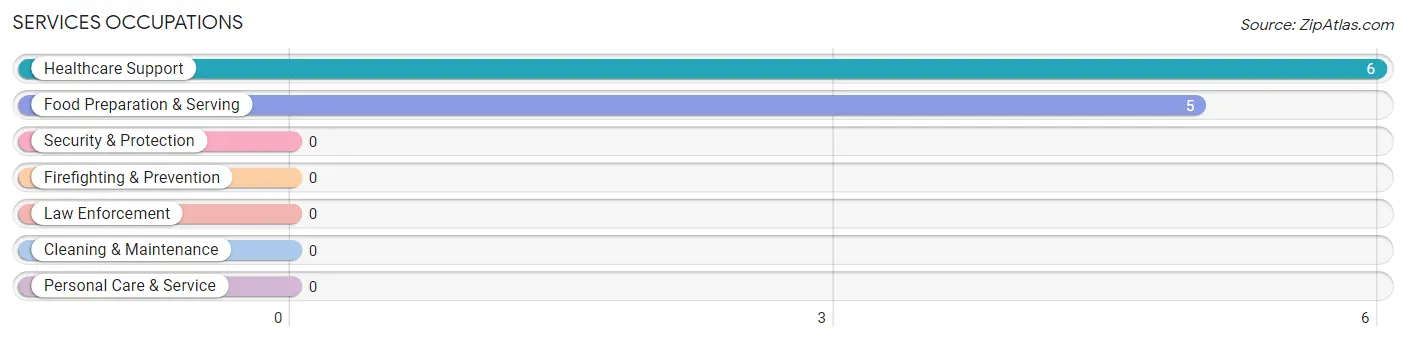
Services Occupations
The most common Services occupations in Spring Mills are Healthcare Support (6 | 2.8%), and Food Preparation & Serving (5 | 2.4%).
Services Occupations by Sex
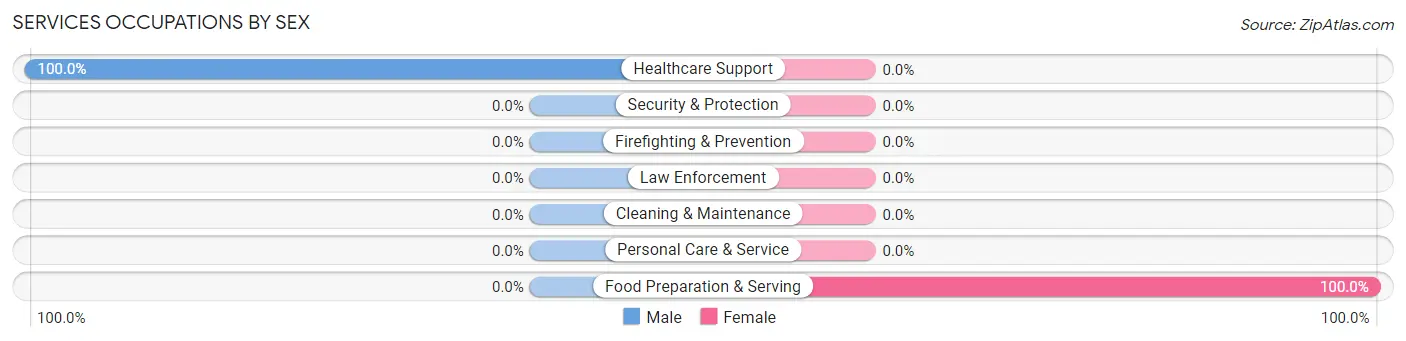
| Occupation | Male | Female |
| Healthcare Support | 6 (100.0%) | 0 (0.0%) |
| Security & Protection | 0 (0.0%) | 0 (0.0%) |
| Firefighting & Prevention | 0 (0.0%) | 0 (0.0%) |
| Law Enforcement | 0 (0.0%) | 0 (0.0%) |
| Food Preparation & Serving | 0 (0.0%) | 5 (100.0%) |
| Cleaning & Maintenance | 0 (0.0%) | 0 (0.0%) |
| Personal Care & Service | 0 (0.0%) | 0 (0.0%) |
| Total (Category) | 6 (54.5%) | 5 (45.5%) |
| Total (Overall) | 105 (49.3%) | 108 (50.7%) |
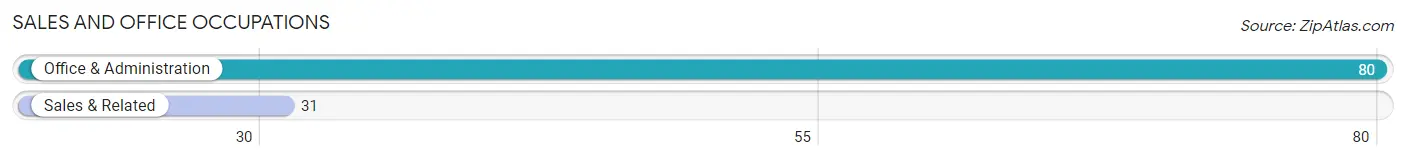
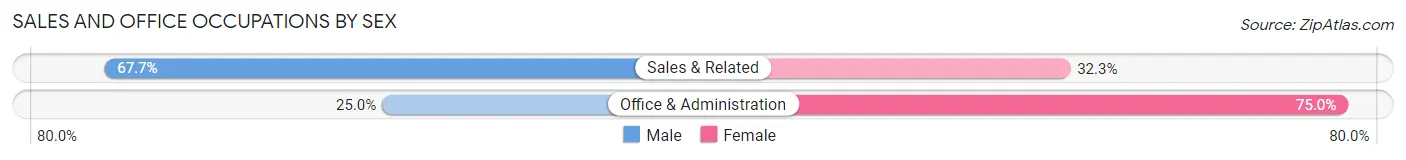
Sales and Office Occupations
The most common Sales and Office occupations in Spring Mills are Office & Administration (80 | 37.6%), and Sales & Related (31 | 14.5%).
Sales and Office Occupations by Sex
| Occupation | Male | Female |
| Sales & Related | 21 (67.7%) | 10 (32.3%) |
| Office & Administration | 20 (25.0%) | 60 (75.0%) |
| Total (Category) | 41 (36.9%) | 70 (63.1%) |
| Total (Overall) | 105 (49.3%) | 108 (50.7%) |
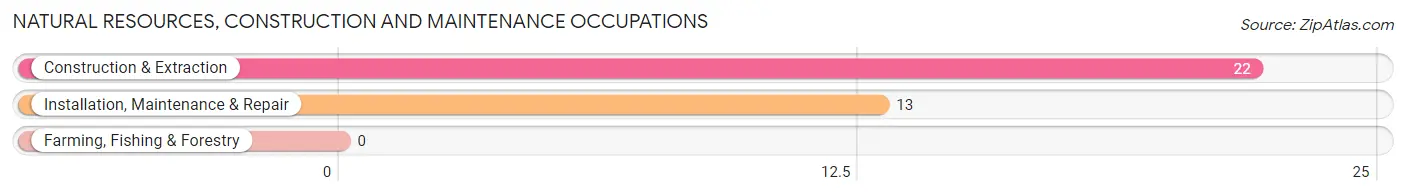
Natural Resources, Construction and Maintenance Occupations
The most common Natural Resources, Construction and Maintenance occupations in Spring Mills are Construction & Extraction (22 | 10.3%), and Installation, Maintenance & Repair (13 | 6.1%).
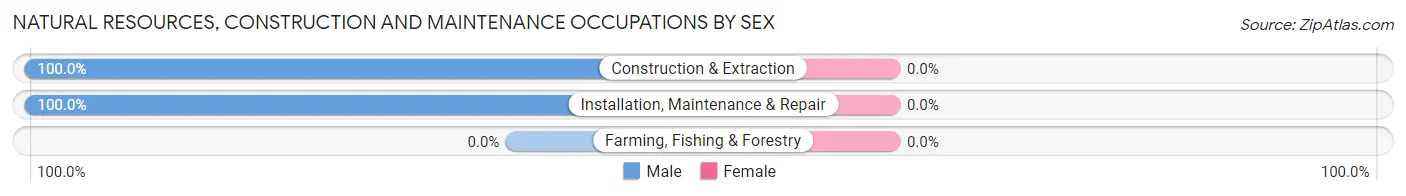
Natural Resources, Construction and Maintenance Occupations by Sex
| Occupation | Male | Female |
| Farming, Fishing & Forestry | 0 (0.0%) | 0 (0.0%) |
| Construction & Extraction | 22 (100.0%) | 0 (0.0%) |
| Installation, Maintenance & Repair | 13 (100.0%) | 0 (0.0%) |
| Total (Category) | 35 (100.0%) | 0 (0.0%) |
| Total (Overall) | 105 (49.3%) | 108 (50.7%) |
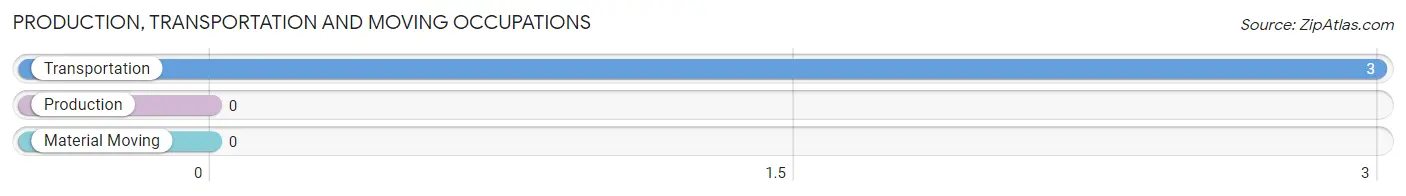
Production, Transportation and Moving Occupations
The most common Production, Transportation and Moving occupations in Spring Mills are , and Transportation (3 | 1.4%).
Production, Transportation and Moving Occupations by Sex
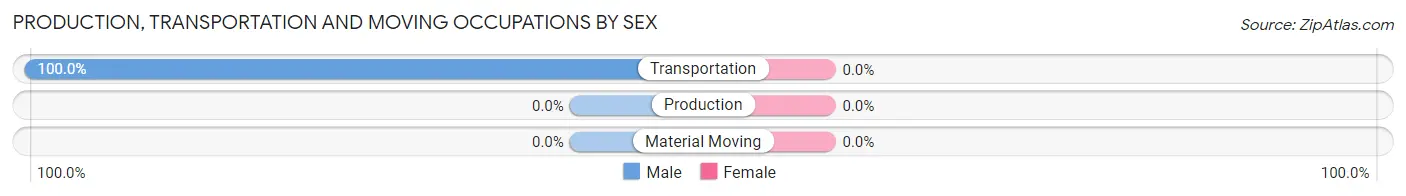
| Occupation | Male | Female |
| Production | 0 (0.0%) | 0 (0.0%) |
| Transportation | 3 (100.0%) | 0 (0.0%) |
| Material Moving | 0 (0.0%) | 0 (0.0%) |
| Total (Category) | 3 (100.0%) | 0 (0.0%) |
| Total (Overall) | 105 (49.3%) | 108 (50.7%) |
Employment Industries by Sex in Spring Mills
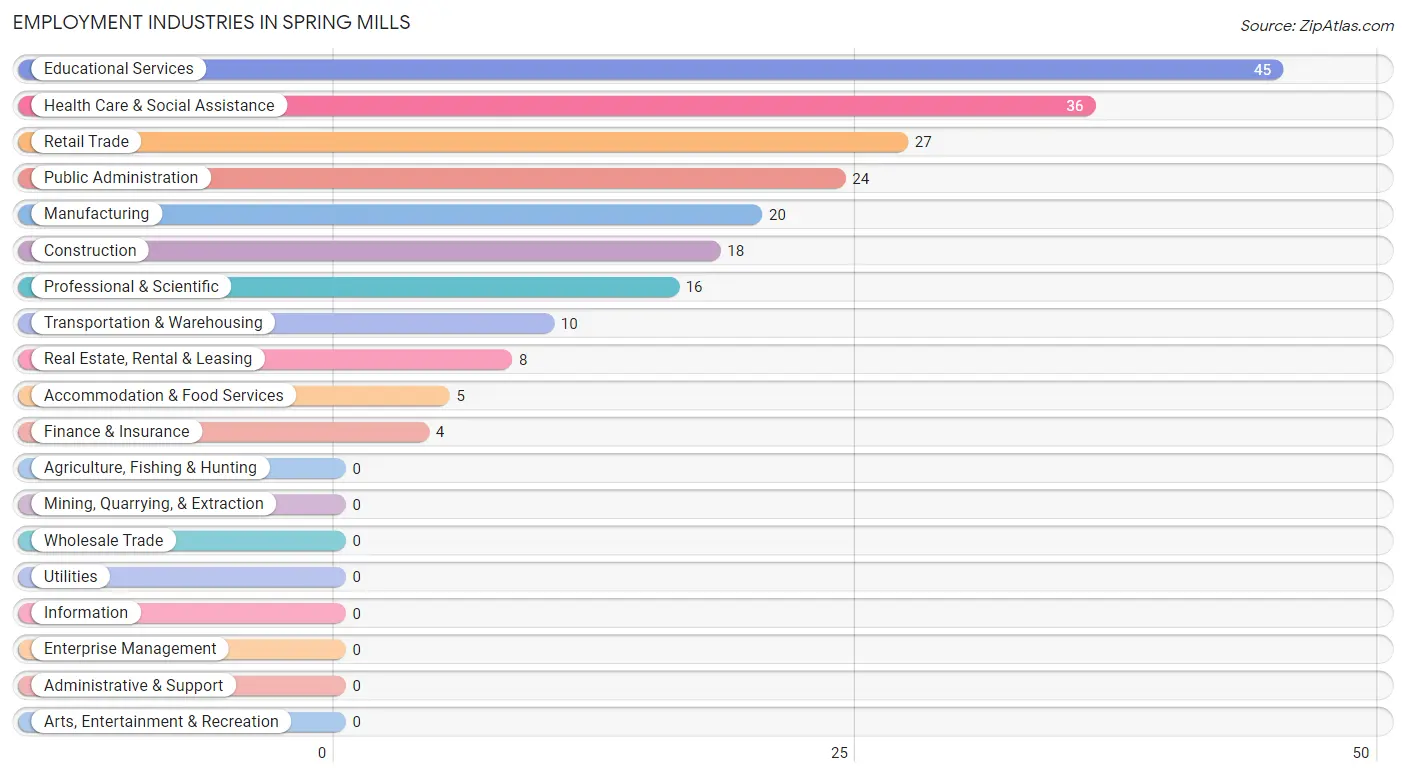
Employment Industries in Spring Mills
The major employment industries in Spring Mills include Educational Services (45 | 21.1%), Health Care & Social Assistance (36 | 16.9%), Retail Trade (27 | 12.7%), Public Administration (24 | 11.3%), and Manufacturing (20 | 9.4%).
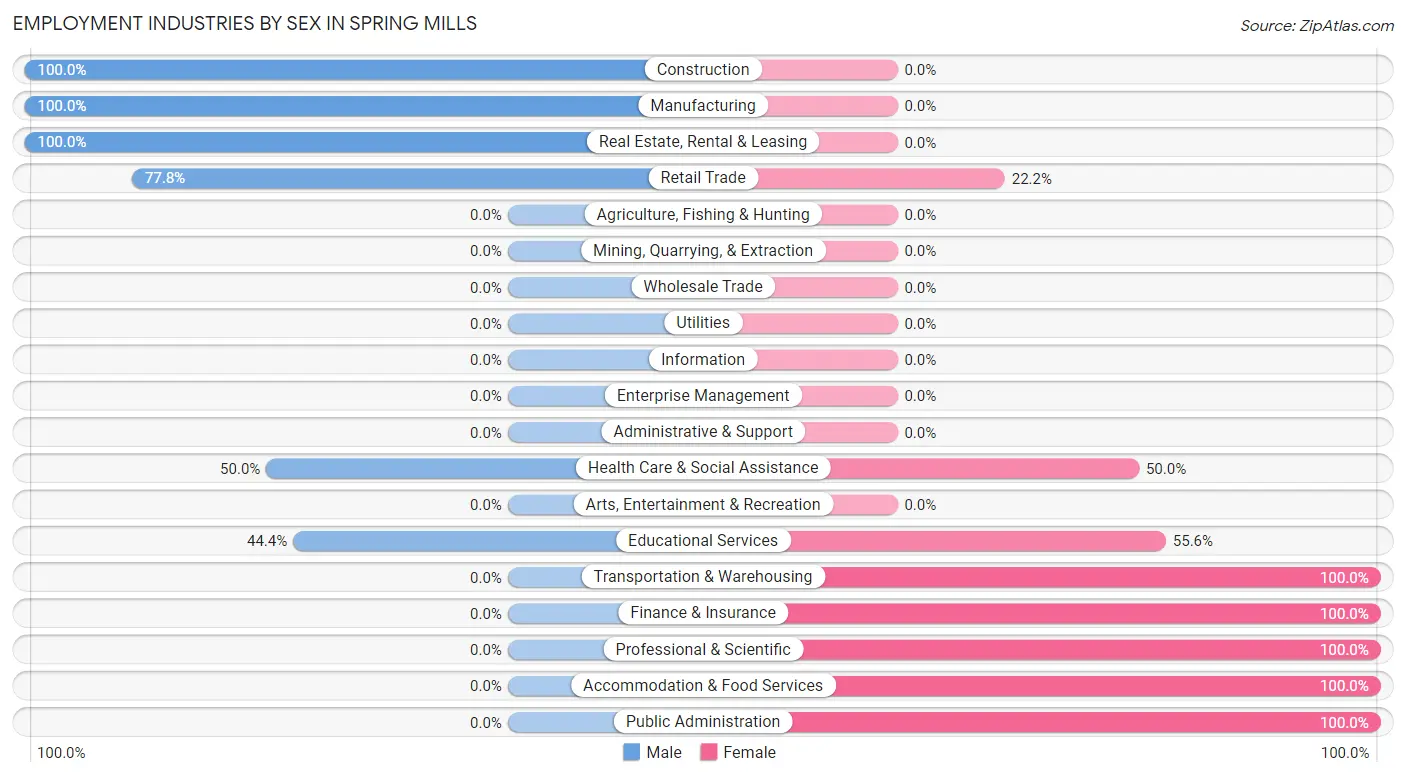
Employment Industries by Sex in Spring Mills
The Spring Mills industries that see more men than women are Construction (100.0%), Manufacturing (100.0%), and Real Estate, Rental & Leasing (100.0%), whereas the industries that tend to have a higher number of women are Transportation & Warehousing (100.0%), Finance & Insurance (100.0%), and Professional & Scientific (100.0%).
| Industry | Male | Female |
| Agriculture, Fishing & Hunting | 0 (0.0%) | 0 (0.0%) |
| Mining, Quarrying, & Extraction | 0 (0.0%) | 0 (0.0%) |
| Construction | 18 (100.0%) | 0 (0.0%) |
| Manufacturing | 20 (100.0%) | 0 (0.0%) |
| Wholesale Trade | 0 (0.0%) | 0 (0.0%) |
| Retail Trade | 21 (77.8%) | 6 (22.2%) |
| Transportation & Warehousing | 0 (0.0%) | 10 (100.0%) |
| Utilities | 0 (0.0%) | 0 (0.0%) |
| Information | 0 (0.0%) | 0 (0.0%) |
| Finance & Insurance | 0 (0.0%) | 4 (100.0%) |
| Real Estate, Rental & Leasing | 8 (100.0%) | 0 (0.0%) |
| Professional & Scientific | 0 (0.0%) | 16 (100.0%) |
| Enterprise Management | 0 (0.0%) | 0 (0.0%) |
| Administrative & Support | 0 (0.0%) | 0 (0.0%) |
| Educational Services | 20 (44.4%) | 25 (55.6%) |
| Health Care & Social Assistance | 18 (50.0%) | 18 (50.0%) |
| Arts, Entertainment & Recreation | 0 (0.0%) | 0 (0.0%) |
| Accommodation & Food Services | 0 (0.0%) | 5 (100.0%) |
| Public Administration | 0 (0.0%) | 24 (100.0%) |
| Total | 105 (49.3%) | 108 (50.7%) |
Education in Spring Mills
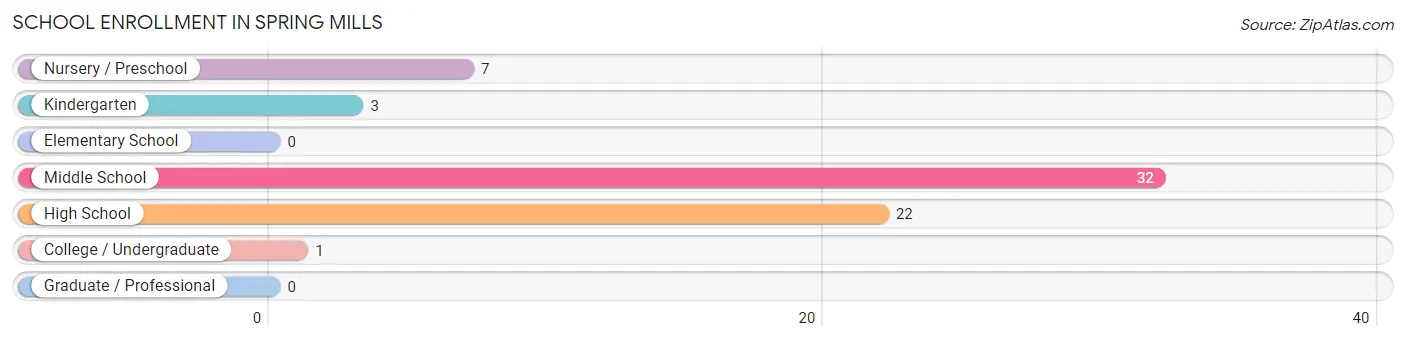
School Enrollment in Spring Mills
The most common levels of schooling among the 65 students in Spring Mills are middle school (32 | 49.2%), high school (22 | 33.9%), and nursery / preschool (7 | 10.8%).
| School Level | # Students | % Students |
| Nursery / Preschool | 7 | 10.8% |
| Kindergarten | 3 | 4.6% |
| Elementary School | 0 | 0.0% |
| Middle School | 32 | 49.2% |
| High School | 22 | 33.9% |
| College / Undergraduate | 1 | 1.5% |
| Graduate / Professional | 0 | 0.0% |
| Total | 65 | 100.0% |
School Enrollment by Age by Funding Source in Spring Mills
Out of a total of 65 students who are enrolled in schools in Spring Mills, 16 (24.6%) attend a private institution, while the remaining 49 (75.4%) are enrolled in public schools. The age group of 3 to 4 year olds has the highest likelihood of being enrolled in private schools, with 7 (100.0% in the age bracket) enrolled. Conversely, the age group of 15 to 17 year olds has the lowest likelihood of being enrolled in a private school, with 16 (100.0% in the age bracket) attending a public institution.
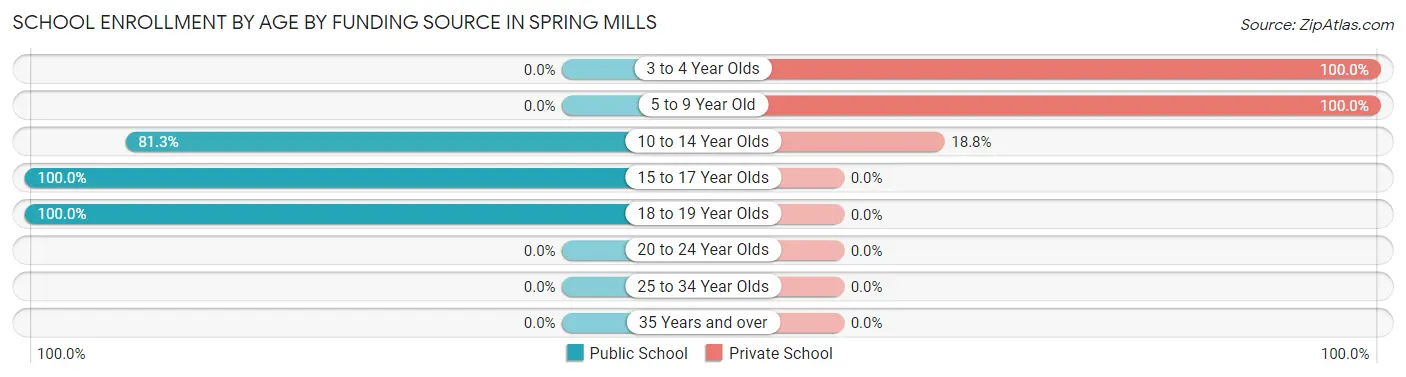
| Age Bracket | Public School | Private School |
| 3 to 4 Year Olds | 0 (0.0%) | 7 (100.0%) |
| 5 to 9 Year Old | 0 (0.0%) | 3 (100.0%) |
| 10 to 14 Year Olds | 26 (81.2%) | 6 (18.8%) |
| 15 to 17 Year Olds | 16 (100.0%) | 0 (0.0%) |
| 18 to 19 Year Olds | 7 (100.0%) | 0 (0.0%) |
| 20 to 24 Year Olds | 0 (0.0%) | 0 (0.0%) |
| 25 to 34 Year Olds | 0 (0.0%) | 0 (0.0%) |
| 35 Years and over | 0 (0.0%) | 0 (0.0%) |
| Total | 49 (75.4%) | 16 (24.6%) |
Educational Attainment by Field of Study in Spring Mills
Business (18 | 21.4%), literature & languages (17 | 20.2%), physical & health sciences (13 | 15.5%), science & technology (13 | 15.5%), and social sciences (6 | 7.1%) are the most common fields of study among 84 individuals in Spring Mills who have obtained a bachelor's degree or higher.
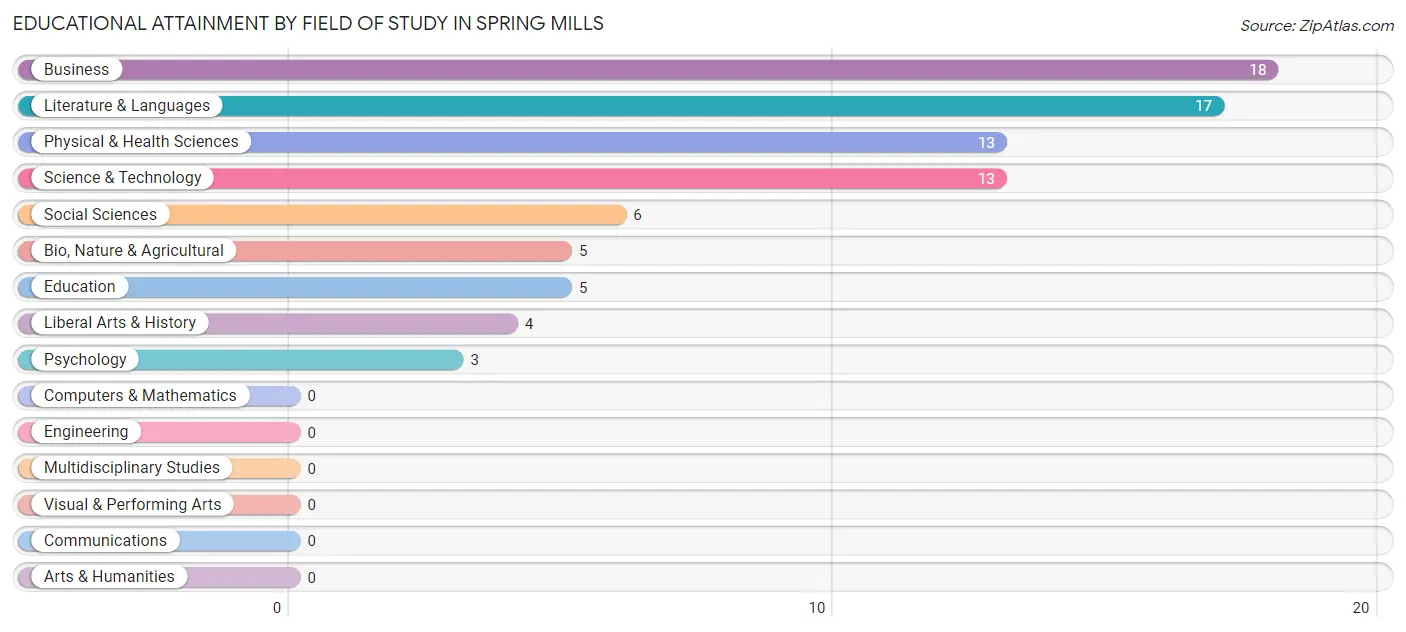
| Field of Study | # Graduates | % Graduates |
| Computers & Mathematics | 0 | 0.0% |
| Bio, Nature & Agricultural | 5 | 5.9% |
| Physical & Health Sciences | 13 | 15.5% |
| Psychology | 3 | 3.6% |
| Social Sciences | 6 | 7.1% |
| Engineering | 0 | 0.0% |
| Multidisciplinary Studies | 0 | 0.0% |
| Science & Technology | 13 | 15.5% |
| Business | 18 | 21.4% |
| Education | 5 | 5.9% |
| Literature & Languages | 17 | 20.2% |
| Liberal Arts & History | 4 | 4.8% |
| Visual & Performing Arts | 0 | 0.0% |
| Communications | 0 | 0.0% |
| Arts & Humanities | 0 | 0.0% |
| Total | 84 | 100.0% |
Transportation & Commute in Spring Mills
Vehicle Availability by Sex in Spring Mills
The most prevalent vehicle ownership categories in Spring Mills are males with 2 vehicles (70, accounting for 66.7%) and females with 2 vehicles (69, making up 64.8%).
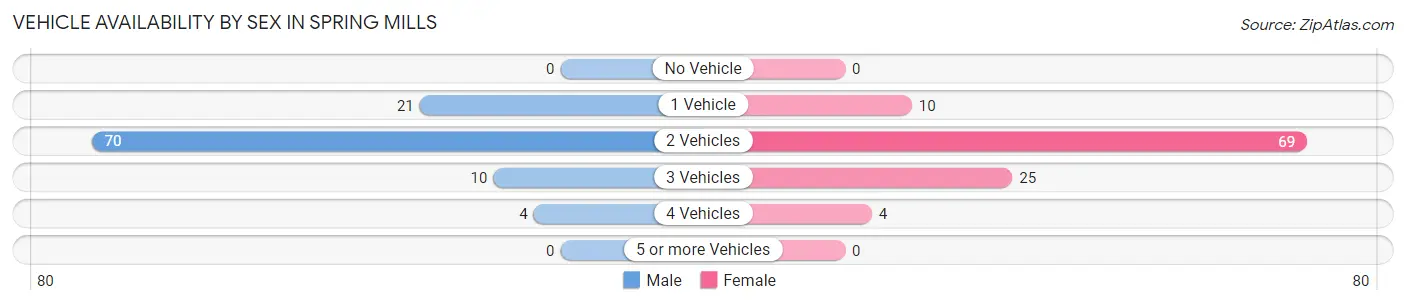
| Vehicles Available | Male | Female |
| No Vehicle | 0 (0.0%) | 0 (0.0%) |
| 1 Vehicle | 21 (20.0%) | 10 (9.3%) |
| 2 Vehicles | 70 (66.7%) | 69 (63.9%) |
| 3 Vehicles | 10 (9.5%) | 25 (23.2%) |
| 4 Vehicles | 4 (3.8%) | 4 (3.7%) |
| 5 or more Vehicles | 0 (0.0%) | 0 (0.0%) |
| Total | 105 (100.0%) | 108 (100.0%) |
Commute Time in Spring Mills
The most frequently occuring commute durations in Spring Mills are 30 to 34 minutes (63 commuters, 31.8%), 25 to 29 minutes (52 commuters, 26.3%), and 20 to 24 minutes (23 commuters, 11.6%).
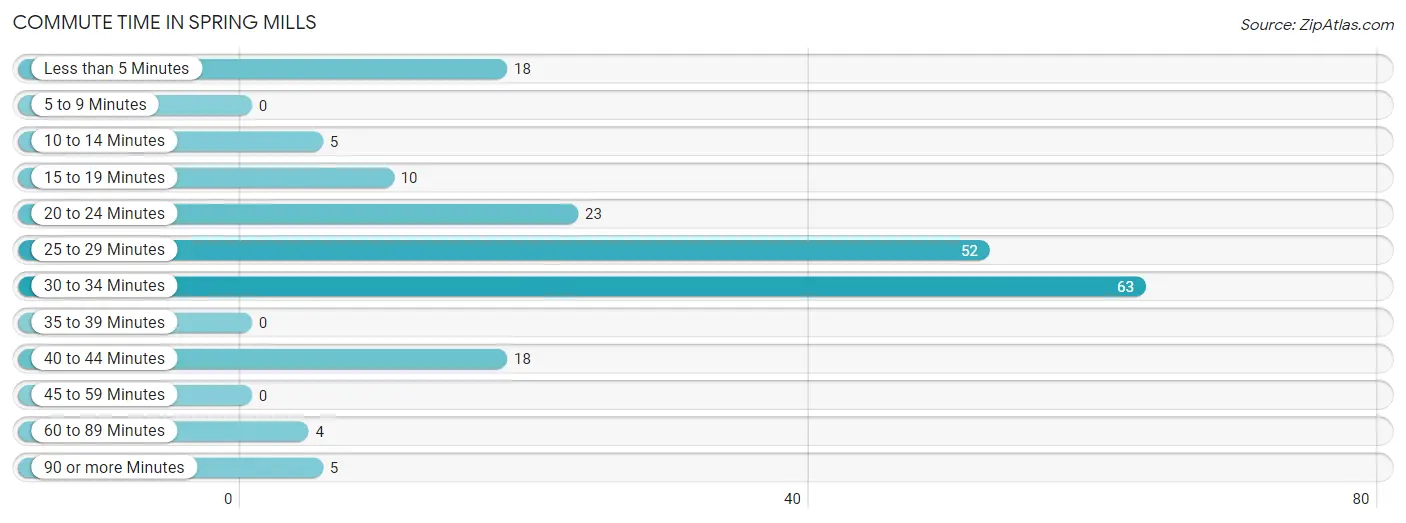
| Commute Time | # Commuters | % Commuters |
| Less than 5 Minutes | 18 | 9.1% |
| 5 to 9 Minutes | 0 | 0.0% |
| 10 to 14 Minutes | 5 | 2.5% |
| 15 to 19 Minutes | 10 | 5.1% |
| 20 to 24 Minutes | 23 | 11.6% |
| 25 to 29 Minutes | 52 | 26.3% |
| 30 to 34 Minutes | 63 | 31.8% |
| 35 to 39 Minutes | 0 | 0.0% |
| 40 to 44 Minutes | 18 | 9.1% |
| 45 to 59 Minutes | 0 | 0.0% |
| 60 to 89 Minutes | 4 | 2.0% |
| 90 or more Minutes | 5 | 2.5% |
Commute Time by Sex in Spring Mills
The most common commute times in Spring Mills are 30 to 34 minutes (50 commuters, 55.6%) for males and 25 to 29 minutes (46 commuters, 42.6%) for females.
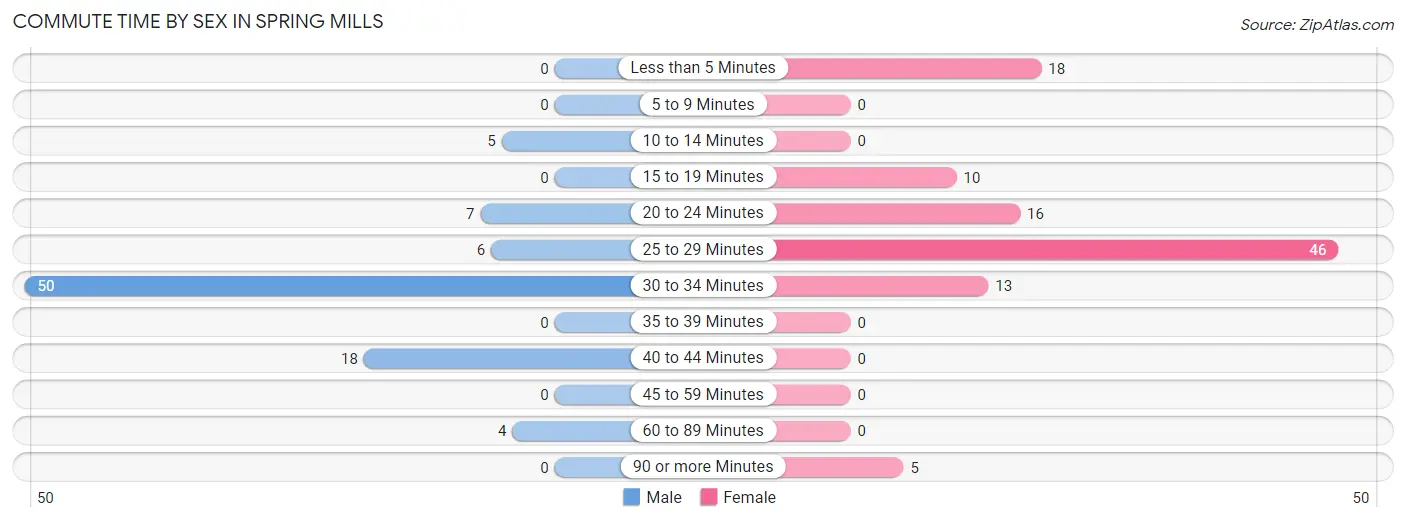
| Commute Time | Male | Female |
| Less than 5 Minutes | 0 (0.0%) | 18 (16.7%) |
| 5 to 9 Minutes | 0 (0.0%) | 0 (0.0%) |
| 10 to 14 Minutes | 5 (5.6%) | 0 (0.0%) |
| 15 to 19 Minutes | 0 (0.0%) | 10 (9.3%) |
| 20 to 24 Minutes | 7 (7.8%) | 16 (14.8%) |
| 25 to 29 Minutes | 6 (6.7%) | 46 (42.6%) |
| 30 to 34 Minutes | 50 (55.6%) | 13 (12.0%) |
| 35 to 39 Minutes | 0 (0.0%) | 0 (0.0%) |
| 40 to 44 Minutes | 18 (20.0%) | 0 (0.0%) |
| 45 to 59 Minutes | 0 (0.0%) | 0 (0.0%) |
| 60 to 89 Minutes | 4 (4.4%) | 0 (0.0%) |
| 90 or more Minutes | 0 (0.0%) | 5 (4.6%) |
Time of Departure to Work by Sex in Spring Mills
The most frequent times of departure to work in Spring Mills are 7:30 AM to 7:59 AM (32, 35.6%) for males and 7:30 AM to 7:59 AM (39, 36.1%) for females.
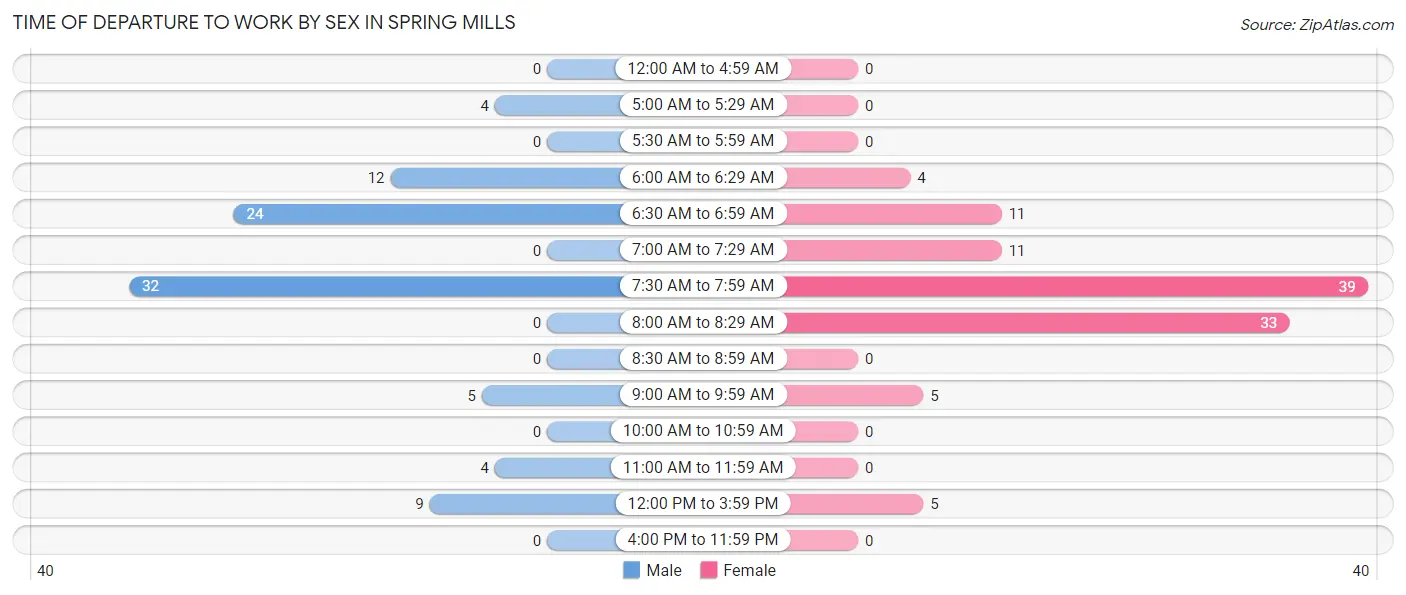
| Time of Departure | Male | Female |
| 12:00 AM to 4:59 AM | 0 (0.0%) | 0 (0.0%) |
| 5:00 AM to 5:29 AM | 4 (4.4%) | 0 (0.0%) |
| 5:30 AM to 5:59 AM | 0 (0.0%) | 0 (0.0%) |
| 6:00 AM to 6:29 AM | 12 (13.3%) | 4 (3.7%) |
| 6:30 AM to 6:59 AM | 24 (26.7%) | 11 (10.2%) |
| 7:00 AM to 7:29 AM | 0 (0.0%) | 11 (10.2%) |
| 7:30 AM to 7:59 AM | 32 (35.6%) | 39 (36.1%) |
| 8:00 AM to 8:29 AM | 0 (0.0%) | 33 (30.6%) |
| 8:30 AM to 8:59 AM | 0 (0.0%) | 0 (0.0%) |
| 9:00 AM to 9:59 AM | 5 (5.6%) | 5 (4.6%) |
| 10:00 AM to 10:59 AM | 0 (0.0%) | 0 (0.0%) |
| 11:00 AM to 11:59 AM | 4 (4.4%) | 0 (0.0%) |
| 12:00 PM to 3:59 PM | 9 (10.0%) | 5 (4.6%) |
| 4:00 PM to 11:59 PM | 0 (0.0%) | 0 (0.0%) |
| Total | 90 (100.0%) | 108 (100.0%) |
Housing Occupancy in Spring Mills
Occupancy by Ownership in Spring Mills
Of the total 203 dwellings in Spring Mills, owner-occupied units account for 143 (70.4%), while renter-occupied units make up 60 (29.6%).
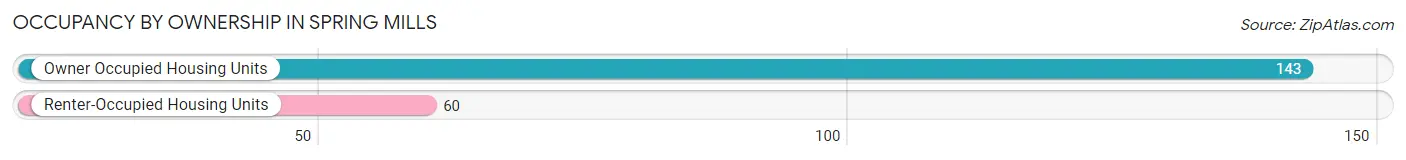
| Occupancy | # Housing Units | % Housing Units |
| Owner Occupied Housing Units | 143 | 70.4% |
| Renter-Occupied Housing Units | 60 | 29.6% |
| Total Occupied Housing Units | 203 | 100.0% |
Occupancy by Household Size in Spring Mills
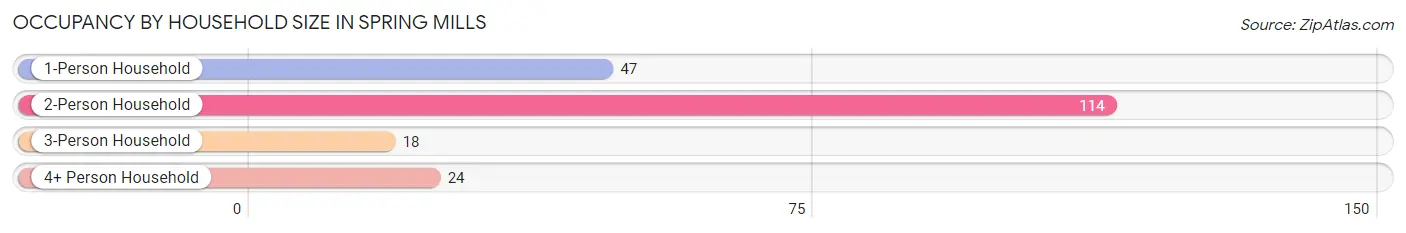
| Household Size | # Housing Units | % Housing Units |
| 1-Person Household | 47 | 23.2% |
| 2-Person Household | 114 | 56.2% |
| 3-Person Household | 18 | 8.9% |
| 4+ Person Household | 24 | 11.8% |
| Total Housing Units | 203 | 100.0% |
Occupancy by Ownership by Household Size in Spring Mills
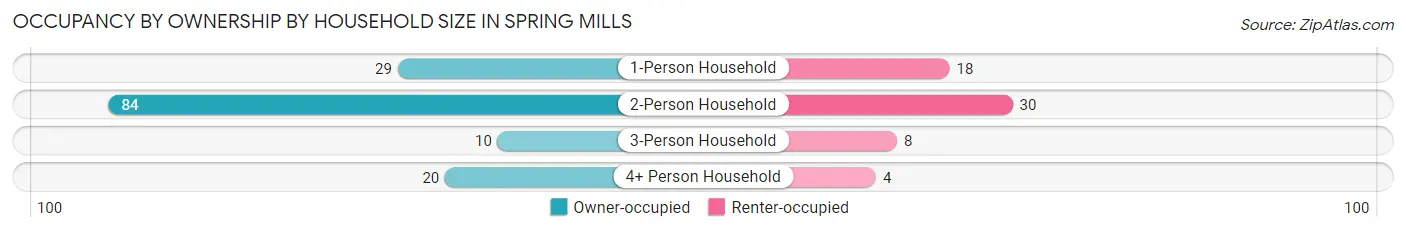
| Household Size | Owner-occupied | Renter-occupied |
| 1-Person Household | 29 (61.7%) | 18 (38.3%) |
| 2-Person Household | 84 (73.7%) | 30 (26.3%) |
| 3-Person Household | 10 (55.6%) | 8 (44.4%) |
| 4+ Person Household | 20 (83.3%) | 4 (16.7%) |
| Total Housing Units | 143 (70.4%) | 60 (29.6%) |
Occupancy by Educational Attainment in Spring Mills
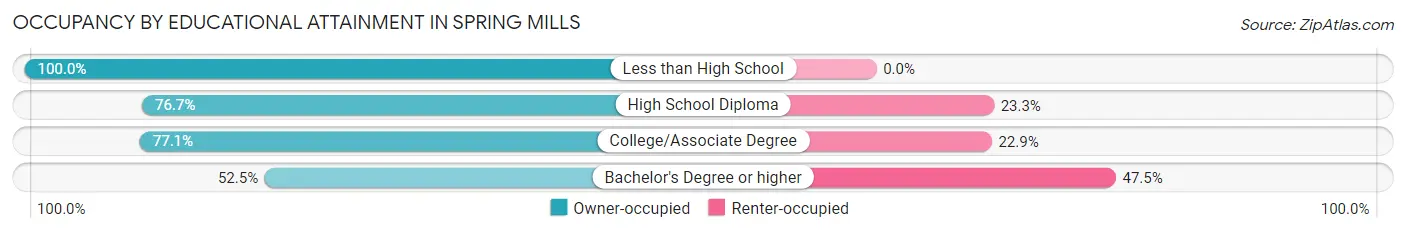
| Household Size | Owner-occupied | Renter-occupied |
| Less than High School | 6 (100.0%) | 0 (0.0%) |
| High School Diploma | 79 (76.7%) | 24 (23.3%) |
| College/Associate Degree | 27 (77.1%) | 8 (22.9%) |
| Bachelor's Degree or higher | 31 (52.5%) | 28 (47.5%) |
Occupancy by Age of Householder in Spring Mills
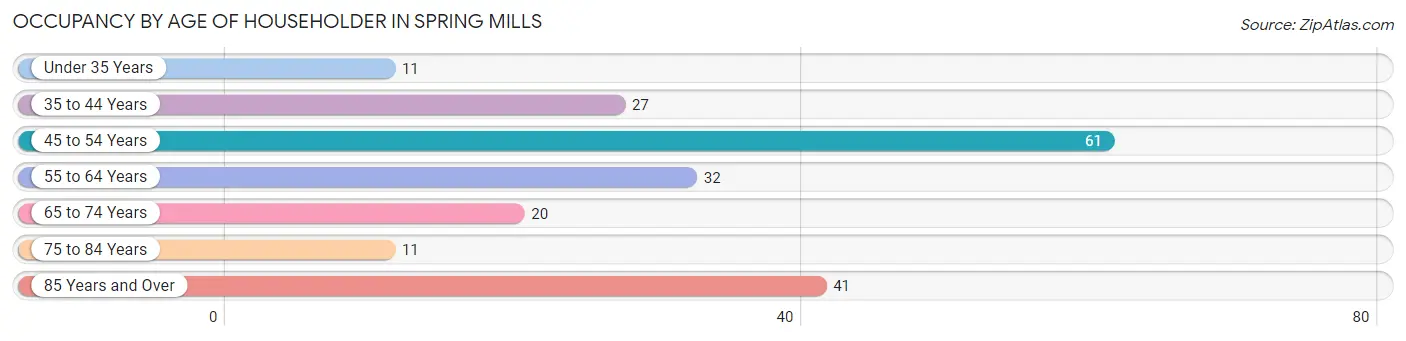
| Age Bracket | # Households | % Households |
| Under 35 Years | 11 | 5.4% |
| 35 to 44 Years | 27 | 13.3% |
| 45 to 54 Years | 61 | 30.0% |
| 55 to 64 Years | 32 | 15.8% |
| 65 to 74 Years | 20 | 9.9% |
| 75 to 84 Years | 11 | 5.4% |
| 85 Years and Over | 41 | 20.2% |
| Total | 203 | 100.0% |
Housing Finances in Spring Mills
Median Income by Occupancy in Spring Mills
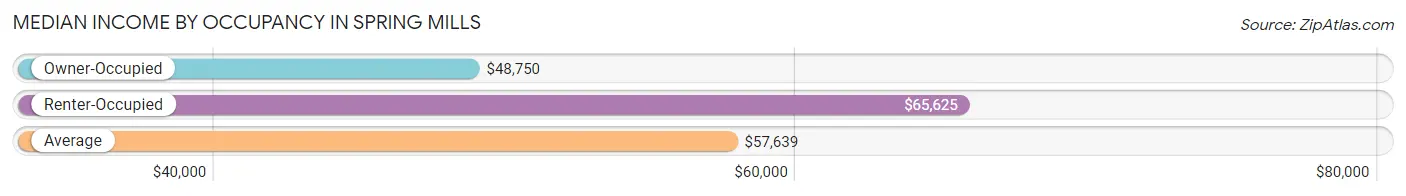
| Occupancy Type | # Households | Median Income |
| Owner-Occupied | 143 (70.4%) | $48,750 |
| Renter-Occupied | 60 (29.6%) | $65,625 |
| Average | 203 (100.0%) | $57,639 |
Occupancy by Householder Income Bracket in Spring Mills
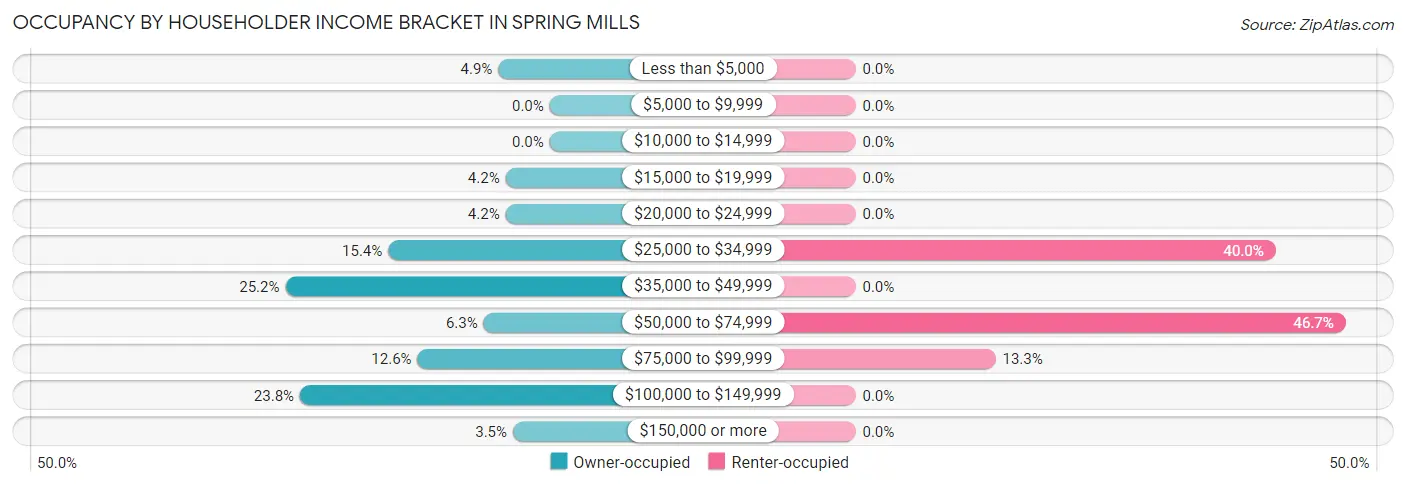
| Income Bracket | Owner-occupied | Renter-occupied |
| Less than $5,000 | 7 (4.9%) | 0 (0.0%) |
| $5,000 to $9,999 | 0 (0.0%) | 0 (0.0%) |
| $10,000 to $14,999 | 0 (0.0%) | 0 (0.0%) |
| $15,000 to $19,999 | 6 (4.2%) | 0 (0.0%) |
| $20,000 to $24,999 | 6 (4.2%) | 0 (0.0%) |
| $25,000 to $34,999 | 22 (15.4%) | 24 (40.0%) |
| $35,000 to $49,999 | 36 (25.2%) | 0 (0.0%) |
| $50,000 to $74,999 | 9 (6.3%) | 28 (46.7%) |
| $75,000 to $99,999 | 18 (12.6%) | 8 (13.3%) |
| $100,000 to $149,999 | 34 (23.8%) | 0 (0.0%) |
| $150,000 or more | 5 (3.5%) | 0 (0.0%) |
| Total | 143 (100.0%) | 60 (100.0%) |
Monthly Housing Cost Tiers in Spring Mills
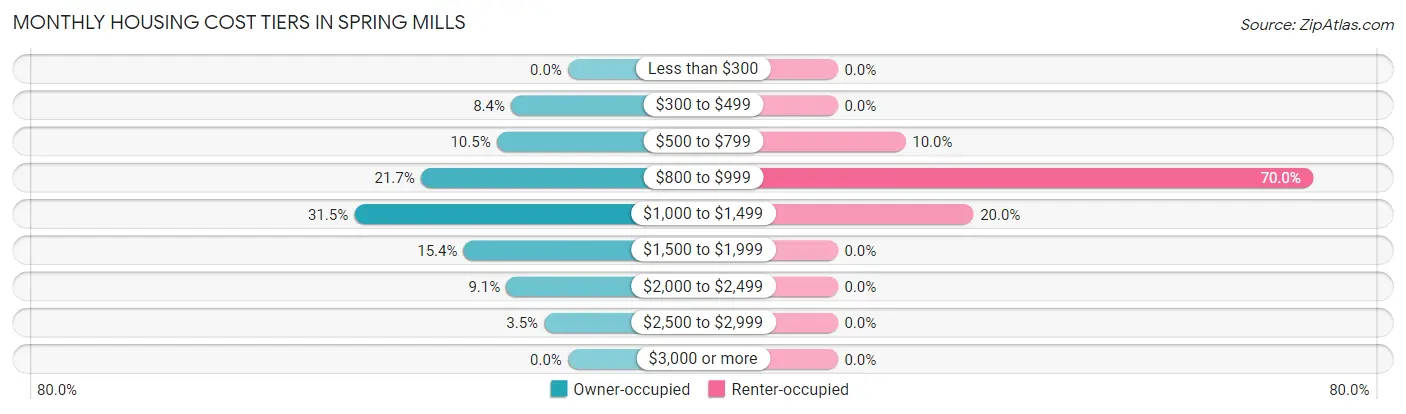
| Monthly Cost | Owner-occupied | Renter-occupied |
| Less than $300 | 0 (0.0%) | 0 (0.0%) |
| $300 to $499 | 12 (8.4%) | 0 (0.0%) |
| $500 to $799 | 15 (10.5%) | 6 (10.0%) |
| $800 to $999 | 31 (21.7%) | 42 (70.0%) |
| $1,000 to $1,499 | 45 (31.5%) | 12 (20.0%) |
| $1,500 to $1,999 | 22 (15.4%) | 0 (0.0%) |
| $2,000 to $2,499 | 13 (9.1%) | 0 (0.0%) |
| $2,500 to $2,999 | 5 (3.5%) | 0 (0.0%) |
| $3,000 or more | 0 (0.0%) | 0 (0.0%) |
| Total | 143 (100.0%) | 60 (100.0%) |
Physical Housing Characteristics in Spring Mills
Housing Structures in Spring Mills
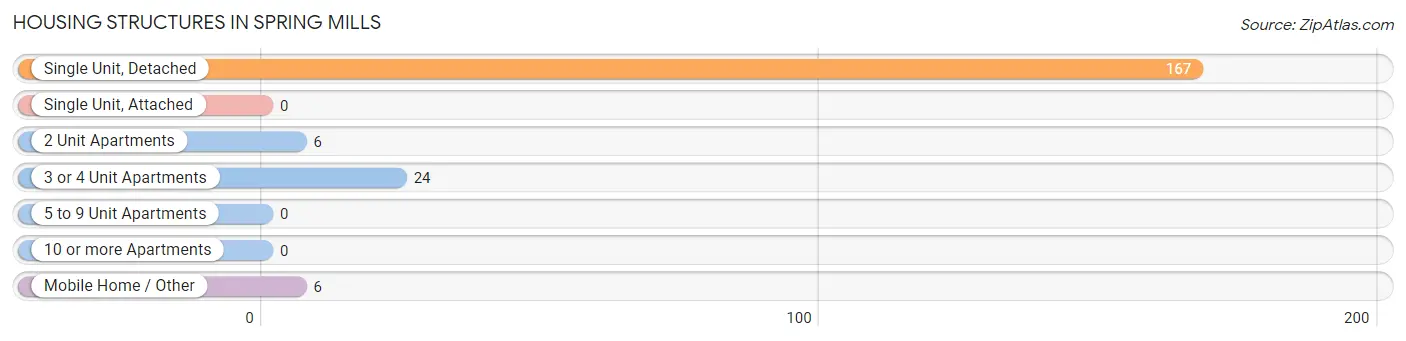
| Structure Type | # Housing Units | % Housing Units |
| Single Unit, Detached | 167 | 82.3% |
| Single Unit, Attached | 0 | 0.0% |
| 2 Unit Apartments | 6 | 3.0% |
| 3 or 4 Unit Apartments | 24 | 11.8% |
| 5 to 9 Unit Apartments | 0 | 0.0% |
| 10 or more Apartments | 0 | 0.0% |
| Mobile Home / Other | 6 | 3.0% |
| Total | 203 | 100.0% |
Housing Structures by Occupancy in Spring Mills
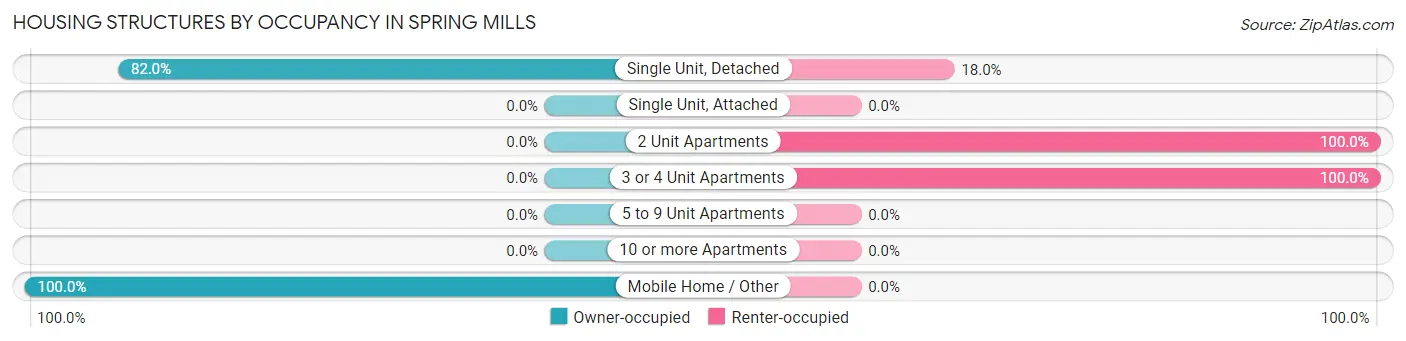
| Structure Type | Owner-occupied | Renter-occupied |
| Single Unit, Detached | 137 (82.0%) | 30 (18.0%) |
| Single Unit, Attached | 0 (0.0%) | 0 (0.0%) |
| 2 Unit Apartments | 0 (0.0%) | 6 (100.0%) |
| 3 or 4 Unit Apartments | 0 (0.0%) | 24 (100.0%) |
| 5 to 9 Unit Apartments | 0 (0.0%) | 0 (0.0%) |
| 10 or more Apartments | 0 (0.0%) | 0 (0.0%) |
| Mobile Home / Other | 6 (100.0%) | 0 (0.0%) |
| Total | 143 (70.4%) | 60 (29.6%) |
Housing Structures by Number of Rooms in Spring Mills
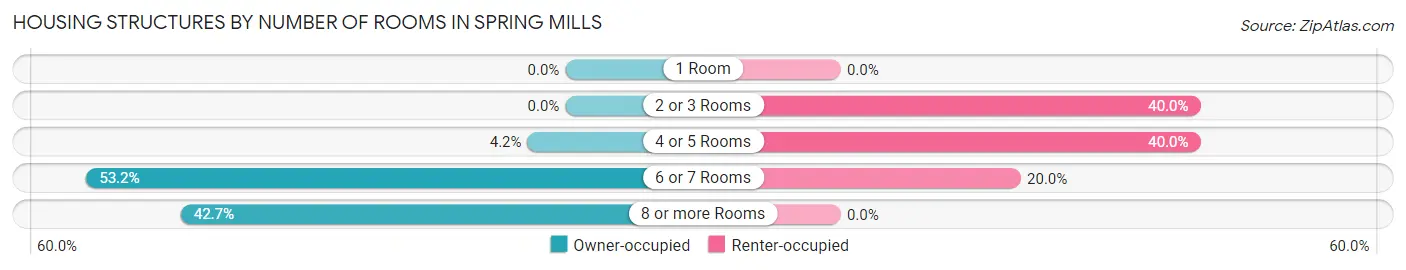
| Number of Rooms | Owner-occupied | Renter-occupied |
| 1 Room | 0 (0.0%) | 0 (0.0%) |
| 2 or 3 Rooms | 0 (0.0%) | 24 (40.0%) |
| 4 or 5 Rooms | 6 (4.2%) | 24 (40.0%) |
| 6 or 7 Rooms | 76 (53.1%) | 12 (20.0%) |
| 8 or more Rooms | 61 (42.7%) | 0 (0.0%) |
| Total | 143 (100.0%) | 60 (100.0%) |
Housing Structure by Heating Type in Spring Mills
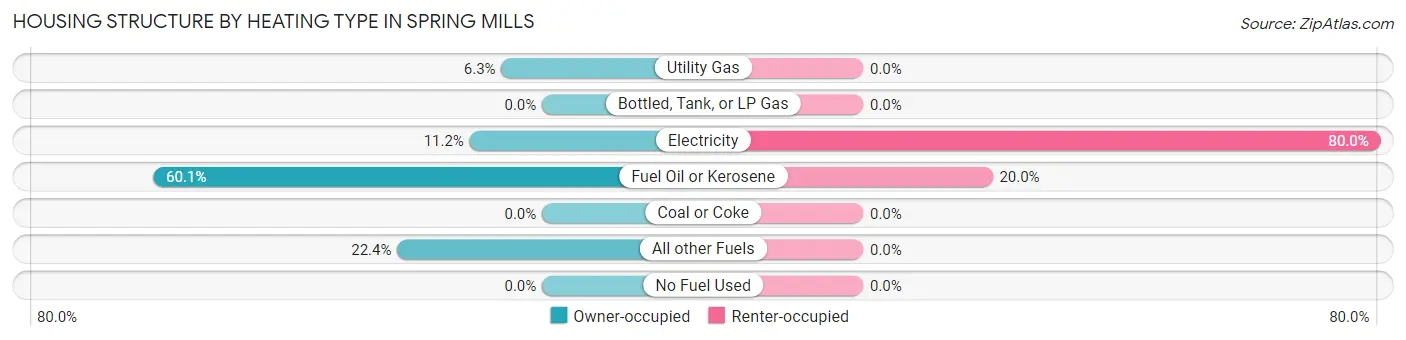
| Heating Type | Owner-occupied | Renter-occupied |
| Utility Gas | 9 (6.3%) | 0 (0.0%) |
| Bottled, Tank, or LP Gas | 0 (0.0%) | 0 (0.0%) |
| Electricity | 16 (11.2%) | 48 (80.0%) |
| Fuel Oil or Kerosene | 86 (60.1%) | 12 (20.0%) |
| Coal or Coke | 0 (0.0%) | 0 (0.0%) |
| All other Fuels | 32 (22.4%) | 0 (0.0%) |
| No Fuel Used | 0 (0.0%) | 0 (0.0%) |
| Total | 143 (100.0%) | 60 (100.0%) |
Household Vehicle Usage in Spring Mills
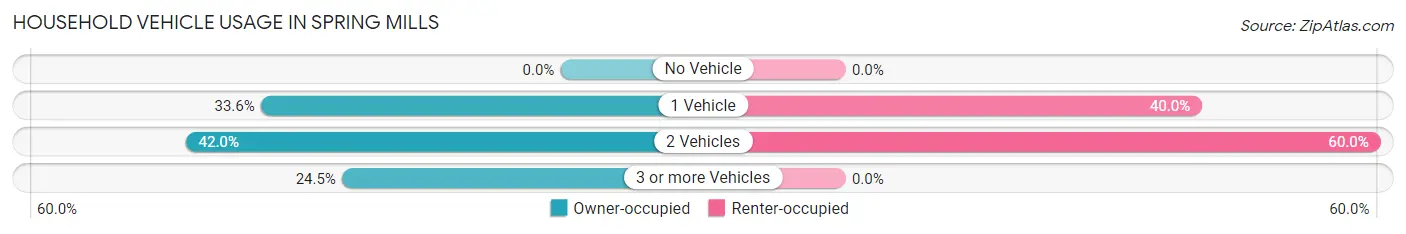
| Vehicles per Household | Owner-occupied | Renter-occupied |
| No Vehicle | 0 (0.0%) | 0 (0.0%) |
| 1 Vehicle | 48 (33.6%) | 24 (40.0%) |
| 2 Vehicles | 60 (42.0%) | 36 (60.0%) |
| 3 or more Vehicles | 35 (24.5%) | 0 (0.0%) |
| Total | 143 (100.0%) | 60 (100.0%) |
Real Estate & Mortgages in Spring Mills
Real Estate and Mortgage Overview in Spring Mills
| Characteristic | Without Mortgage | With Mortgage |
| Housing Units | 52 | 91 |
| Median Property Value | $232,400 | $182,500 |
| Median Household Income | $32,059 | $0 |
| Monthly Housing Costs | $793 | $0 |
| Real Estate Taxes | $1,357 | $0 |
Property Value by Mortgage Status in Spring Mills
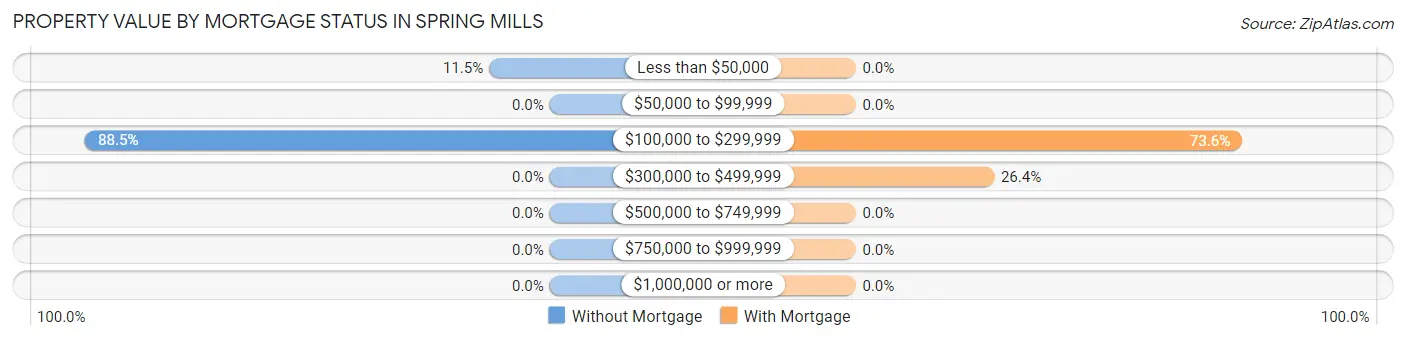
| Property Value | Without Mortgage | With Mortgage |
| Less than $50,000 | 6 (11.5%) | 0 (0.0%) |
| $50,000 to $99,999 | 0 (0.0%) | 0 (0.0%) |
| $100,000 to $299,999 | 46 (88.5%) | 67 (73.6%) |
| $300,000 to $499,999 | 0 (0.0%) | 24 (26.4%) |
| $500,000 to $749,999 | 0 (0.0%) | 0 (0.0%) |
| $750,000 to $999,999 | 0 (0.0%) | 0 (0.0%) |
| $1,000,000 or more | 0 (0.0%) | 0 (0.0%) |
| Total | 52 (100.0%) | 91 (100.0%) |
Household Income by Mortgage Status in Spring Mills
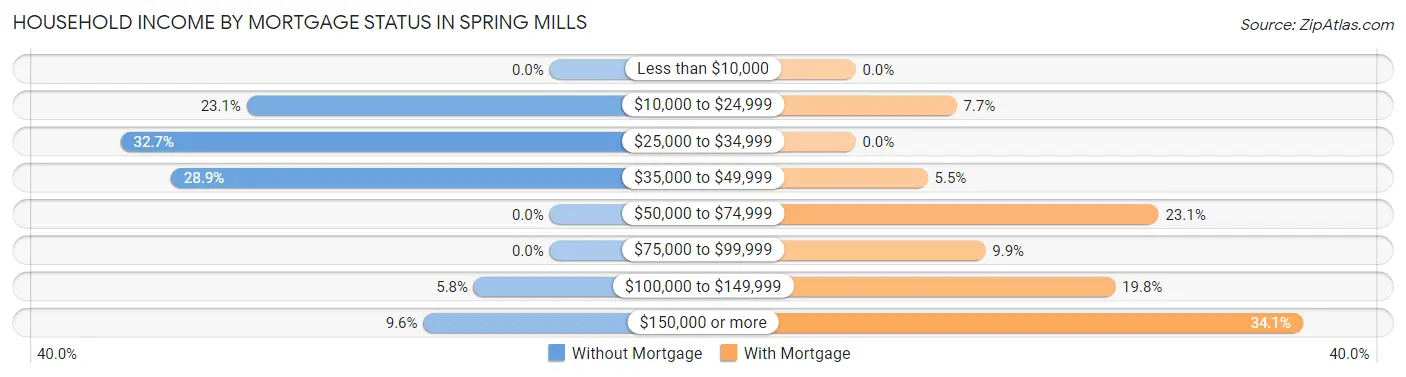
| Household Income | Without Mortgage | With Mortgage |
| Less than $10,000 | 0 (0.0%) | 0 (0.0%) |
| $10,000 to $24,999 | 12 (23.1%) | 7 (7.7%) |
| $25,000 to $34,999 | 17 (32.7%) | 0 (0.0%) |
| $35,000 to $49,999 | 15 (28.8%) | 5 (5.5%) |
| $50,000 to $74,999 | 0 (0.0%) | 21 (23.1%) |
| $75,000 to $99,999 | 0 (0.0%) | 9 (9.9%) |
| $100,000 to $149,999 | 3 (5.8%) | 18 (19.8%) |
| $150,000 or more | 5 (9.6%) | 31 (34.1%) |
| Total | 52 (100.0%) | 91 (100.0%) |
Property Value to Household Income Ratio in Spring Mills
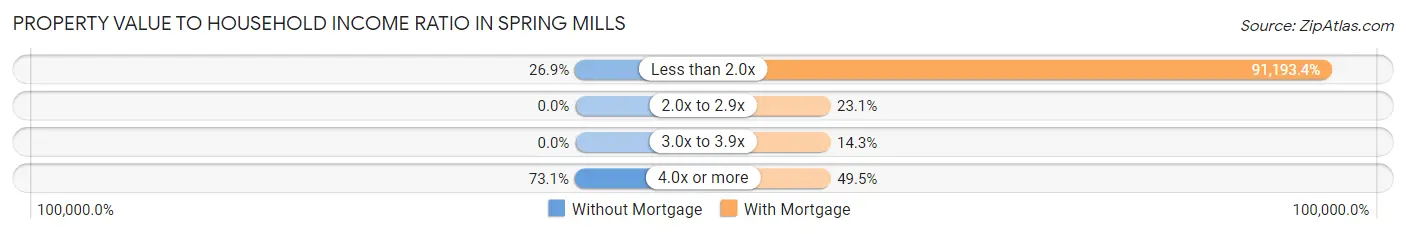
| Value-to-Income Ratio | Without Mortgage | With Mortgage |
| Less than 2.0x | 14 (26.9%) | 82,986 (91,193.4%) |
| 2.0x to 2.9x | 0 (0.0%) | 21 (23.1%) |
| 3.0x to 3.9x | 0 (0.0%) | 13 (14.3%) |
| 4.0x or more | 38 (73.1%) | 45 (49.4%) |
| Total | 52 (100.0%) | 91 (100.0%) |
Real Estate Taxes by Mortgage Status in Spring Mills
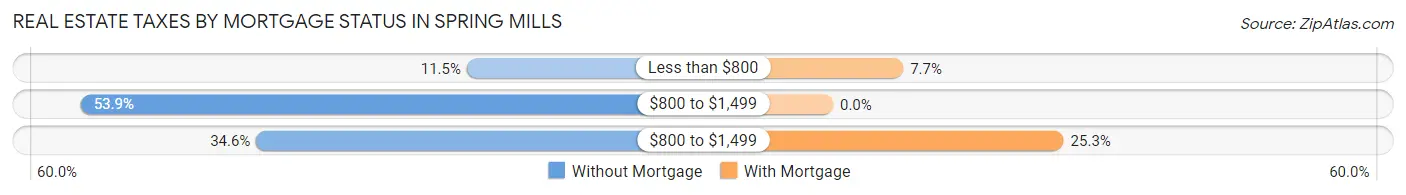
| Property Taxes | Without Mortgage | With Mortgage |
| Less than $800 | 6 (11.5%) | 7 (7.7%) |
| $800 to $1,499 | 28 (53.8%) | 0 (0.0%) |
| $800 to $1,499 | 18 (34.6%) | 23 (25.3%) |
| Total | 52 (100.0%) | 91 (100.0%) |
Health & Disability in Spring Mills
Health Insurance Coverage by Age in Spring Mills
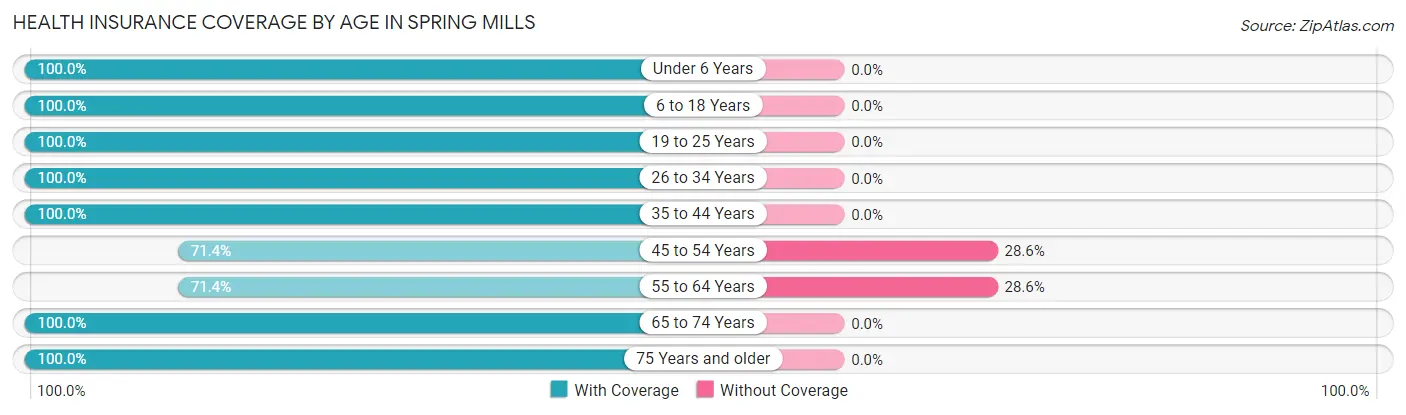
| Age Bracket | With Coverage | Without Coverage |
| Under 6 Years | 16 (100.0%) | 0 (0.0%) |
| 6 to 18 Years | 64 (100.0%) | 0 (0.0%) |
| 19 to 25 Years | 16 (100.0%) | 0 (0.0%) |
| 26 to 34 Years | 42 (100.0%) | 0 (0.0%) |
| 35 to 44 Years | 36 (100.0%) | 0 (0.0%) |
| 45 to 54 Years | 60 (71.4%) | 24 (28.6%) |
| 55 to 64 Years | 50 (71.4%) | 20 (28.6%) |
| 65 to 74 Years | 40 (100.0%) | 0 (0.0%) |
| 75 Years and older | 56 (100.0%) | 0 (0.0%) |
| Total | 380 (89.6%) | 44 (10.4%) |
Health Insurance Coverage by Citizenship Status in Spring Mills
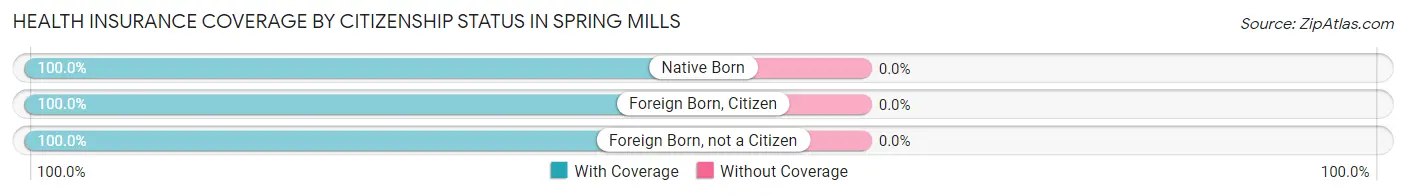
| Citizenship Status | With Coverage | Without Coverage |
| Native Born | 16 (100.0%) | 0 (0.0%) |
| Foreign Born, Citizen | 64 (100.0%) | 0 (0.0%) |
| Foreign Born, not a Citizen | 16 (100.0%) | 0 (0.0%) |
Health Insurance Coverage by Household Income in Spring Mills
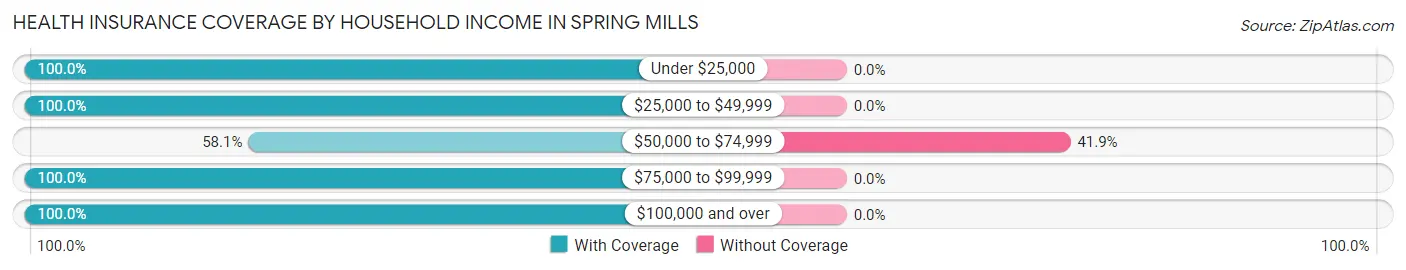
| Household Income | With Coverage | Without Coverage |
| Under $25,000 | 32 (100.0%) | 0 (0.0%) |
| $25,000 to $49,999 | 154 (100.0%) | 0 (0.0%) |
| $50,000 to $74,999 | 61 (58.1%) | 44 (41.9%) |
| $75,000 to $99,999 | 58 (100.0%) | 0 (0.0%) |
| $100,000 and over | 75 (100.0%) | 0 (0.0%) |
Public vs Private Health Insurance Coverage by Age in Spring Mills
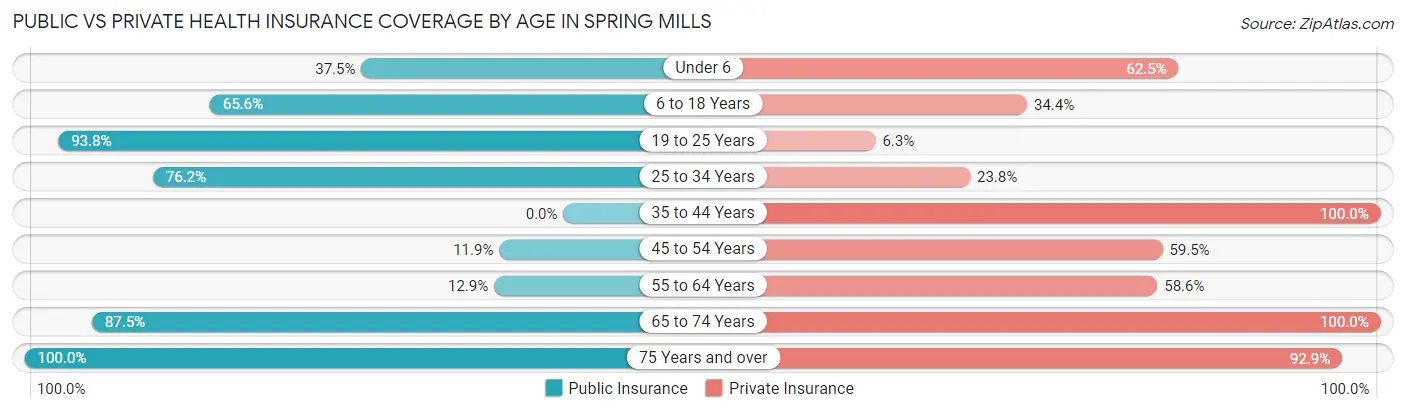
| Age Bracket | Public Insurance | Private Insurance |
| Under 6 | 6 (37.5%) | 10 (62.5%) |
| 6 to 18 Years | 42 (65.6%) | 22 (34.4%) |
| 19 to 25 Years | 15 (93.8%) | 1 (6.2%) |
| 25 to 34 Years | 32 (76.2%) | 10 (23.8%) |
| 35 to 44 Years | 0 (0.0%) | 36 (100.0%) |
| 45 to 54 Years | 10 (11.9%) | 50 (59.5%) |
| 55 to 64 Years | 9 (12.9%) | 41 (58.6%) |
| 65 to 74 Years | 35 (87.5%) | 40 (100.0%) |
| 75 Years and over | 56 (100.0%) | 52 (92.9%) |
| Total | 205 (48.3%) | 262 (61.8%) |
Disability Status by Sex by Age in Spring Mills
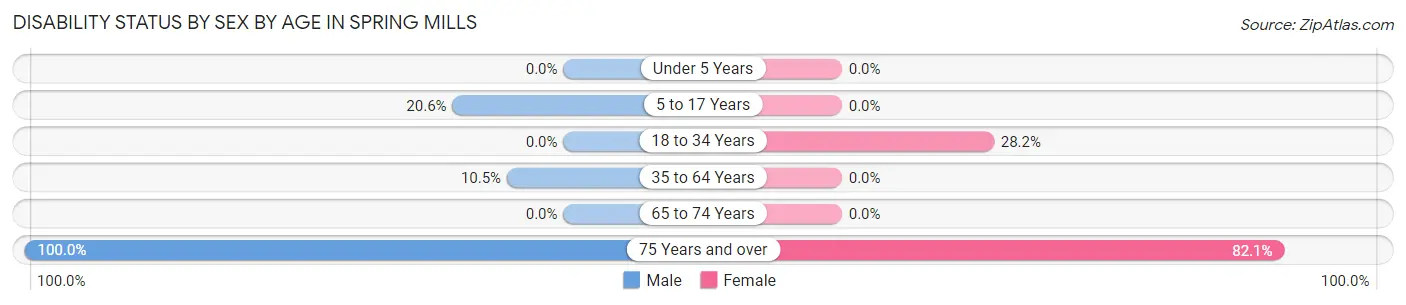
| Age Bracket | Male | Female |
| Under 5 Years | 0 (0.0%) | 0 (0.0%) |
| 5 to 17 Years | 7 (20.6%) | 0 (0.0%) |
| 18 to 34 Years | 0 (0.0%) | 11 (28.2%) |
| 35 to 64 Years | 9 (10.5%) | 0 (0.0%) |
| 65 to 74 Years | 0 (0.0%) | 0 (0.0%) |
| 75 Years and over | 28 (100.0%) | 23 (82.1%) |
Disability Class by Sex by Age in Spring Mills
Disability Class: Hearing Difficulty
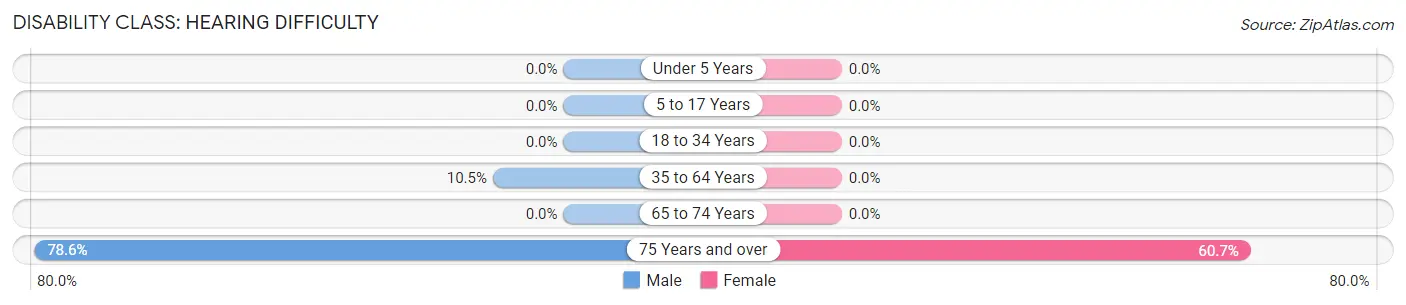
| Age Bracket | Male | Female |
| Under 5 Years | 0 (0.0%) | 0 (0.0%) |
| 5 to 17 Years | 0 (0.0%) | 0 (0.0%) |
| 18 to 34 Years | 0 (0.0%) | 0 (0.0%) |
| 35 to 64 Years | 9 (10.5%) | 0 (0.0%) |
| 65 to 74 Years | 0 (0.0%) | 0 (0.0%) |
| 75 Years and over | 22 (78.6%) | 17 (60.7%) |
Disability Class: Vision Difficulty
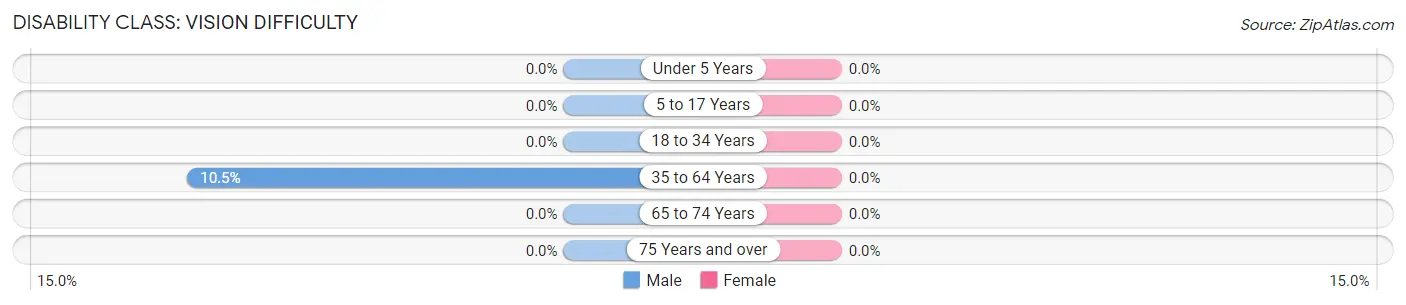
| Age Bracket | Male | Female |
| Under 5 Years | 0 (0.0%) | 0 (0.0%) |
| 5 to 17 Years | 0 (0.0%) | 0 (0.0%) |
| 18 to 34 Years | 0 (0.0%) | 0 (0.0%) |
| 35 to 64 Years | 9 (10.5%) | 0 (0.0%) |
| 65 to 74 Years | 0 (0.0%) | 0 (0.0%) |
| 75 Years and over | 0 (0.0%) | 0 (0.0%) |
Disability Class: Cognitive Difficulty
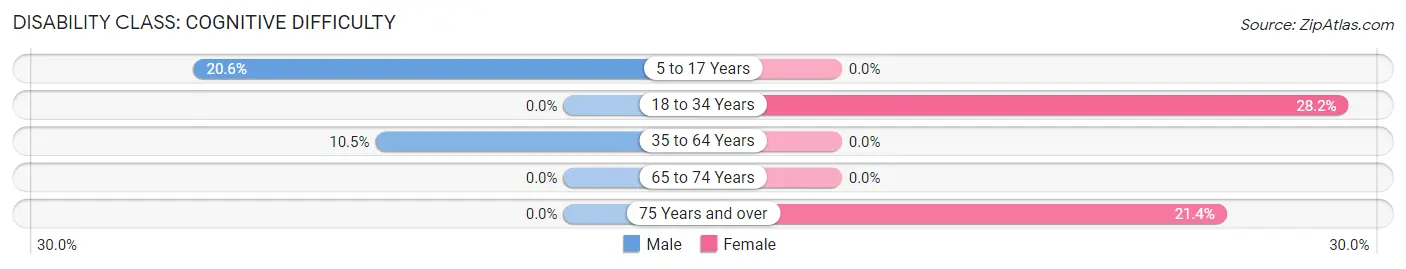
| Age Bracket | Male | Female |
| 5 to 17 Years | 7 (20.6%) | 0 (0.0%) |
| 18 to 34 Years | 0 (0.0%) | 11 (28.2%) |
| 35 to 64 Years | 9 (10.5%) | 0 (0.0%) |
| 65 to 74 Years | 0 (0.0%) | 0 (0.0%) |
| 75 Years and over | 0 (0.0%) | 6 (21.4%) |
Disability Class: Ambulatory Difficulty
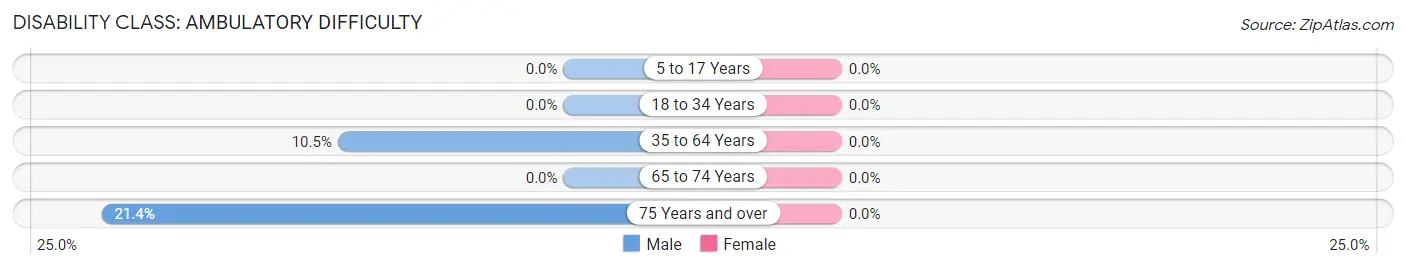
| Age Bracket | Male | Female |
| 5 to 17 Years | 0 (0.0%) | 0 (0.0%) |
| 18 to 34 Years | 0 (0.0%) | 0 (0.0%) |
| 35 to 64 Years | 9 (10.5%) | 0 (0.0%) |
| 65 to 74 Years | 0 (0.0%) | 0 (0.0%) |
| 75 Years and over | 6 (21.4%) | 0 (0.0%) |
Disability Class: Self-Care Difficulty
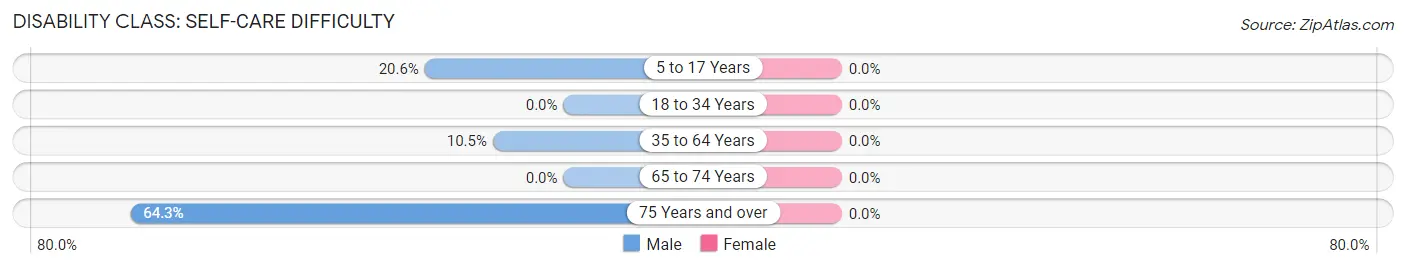
| Age Bracket | Male | Female |
| 5 to 17 Years | 7 (20.6%) | 0 (0.0%) |
| 18 to 34 Years | 0 (0.0%) | 0 (0.0%) |
| 35 to 64 Years | 9 (10.5%) | 0 (0.0%) |
| 65 to 74 Years | 0 (0.0%) | 0 (0.0%) |
| 75 Years and over | 18 (64.3%) | 0 (0.0%) |
Technology Access in Spring Mills
Computing Device Access in Spring Mills
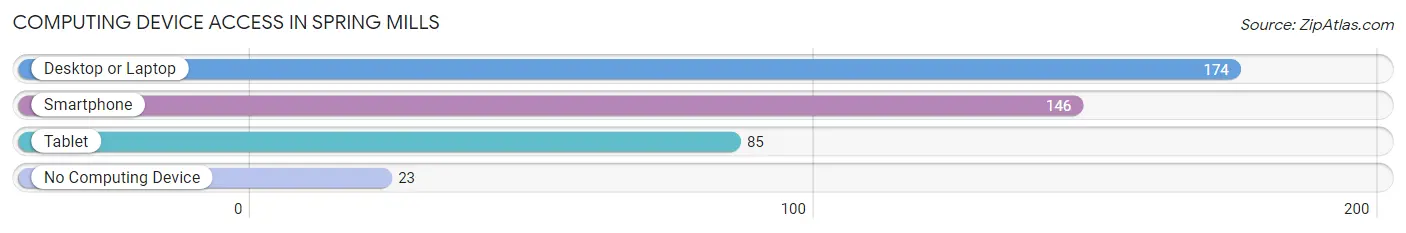
| Device Type | # Households | % Households |
| Desktop or Laptop | 174 | 85.7% |
| Smartphone | 146 | 71.9% |
| Tablet | 85 | 41.9% |
| No Computing Device | 23 | 11.3% |
| Total | 203 | 100.0% |
Internet Access in Spring Mills
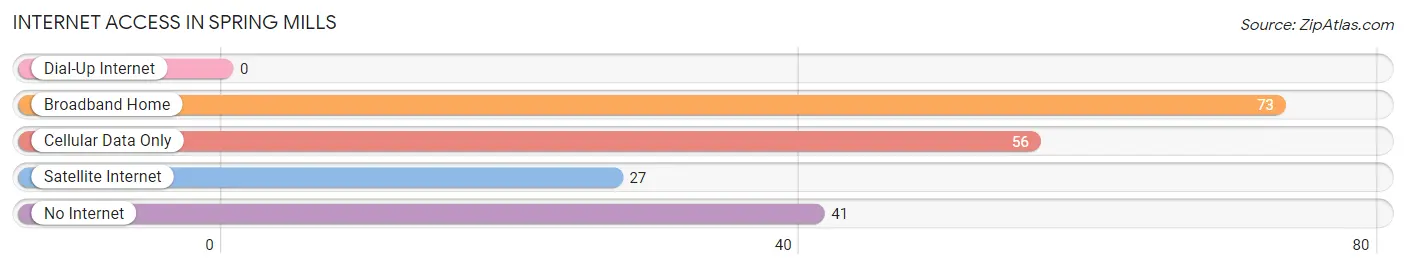
| Internet Type | # Households | % Households |
| Dial-Up Internet | 0 | 0.0% |
| Broadband Home | 73 | 36.0% |
| Cellular Data Only | 56 | 27.6% |
| Satellite Internet | 27 | 13.3% |
| No Internet | 41 | 20.2% |
| Total | 203 | 100.0% |
Spring Mills Summary
Introduction
Spring Mills is a small borough located in Centre County, Pennsylvania. It is situated in the Nittany Valley, which is part of the Ridge and Valley physiographic province of the Appalachian Mountains. The borough is located approximately 10 miles east of State College, the home of Penn State University. Spring Mills is a rural community with a population of 1,845 as of the 2010 census.
History
The area that is now Spring Mills was first settled in the late 1700s by German and Irish immigrants. The first settlers were attracted to the area by the abundance of natural resources, including timber, coal, and limestone. The first permanent settlement was established in 1810 and was known as “Spring Mills” due to the numerous springs in the area.
The town was officially incorporated in 1845 and was named after the nearby limestone springs. The town grew rapidly in the late 1800s and early 1900s due to the abundance of natural resources and the development of the railroad. The railroad allowed for the transportation of coal, timber, and limestone, which were the main industries in the area.
The town experienced a period of decline in the mid-1900s due to the decline of the coal and timber industries. However, the town has experienced a resurgence in recent years due to the growth of the tourism industry. The town is now home to several wineries, breweries, and distilleries, as well as a variety of outdoor activities such as hiking, biking, and fishing.
Geography
Spring Mills is located in the Nittany Valley, which is part of the Ridge and Valley physiographic province of the Appalachian Mountains. The borough is located approximately 10 miles east of State College, the home of Penn State University. The borough is situated at an elevation of 1,000 feet above sea level.
The borough is located in a valley surrounded by mountains. The mountains to the north and east of the borough are part of the Bald Eagle Mountain Range, while the mountains to the south and west are part of the Tussey Mountain Range. The borough is located in a temperate climate zone, with average temperatures ranging from the low 30s in the winter to the mid-80s in the summer.
Economy
The economy of Spring Mills is largely based on tourism and agriculture. The town is home to several wineries, breweries, and distilleries, as well as a variety of outdoor activities such as hiking, biking, and fishing. The town is also home to several small businesses, including restaurants, retail stores, and service providers.
The town is also home to several large employers, including Penn State University, which is located approximately 10 miles away in State College. The university employs a large number of people in the area, including faculty, staff, and students.
Demographics
As of the 2010 census, the population of Spring Mills was 1,845. The population is predominantly white (94.3%), with a small percentage of African Americans (2.2%), Asians (1.2%), and other races (2.3%). The median household income is $45,000, and the median age is 43.
Conclusion
Spring Mills is a small borough located in Centre County, Pennsylvania. It is situated in the Nittany Valley, which is part of the Ridge and Valley physiographic province of the Appalachian Mountains. The borough is located approximately 10 miles east of State College, the home of Penn State University. The economy of Spring Mills is largely based on tourism and agriculture, and the population is predominantly white. The town is home to several wineries, breweries, and distilleries, as well as a variety of outdoor activities such as hiking, biking, and fishing.
Common Questions
What is Per Capita Income in Spring Mills?
Per Capita income in Spring Mills is $29,336.
What is the Median Family Income in Spring Mills?
Median Family Income in Spring Mills is $66,198.
What is the Median Household income in Spring Mills?
Median Household Income in Spring Mills is $57,639.
What is Income or Wage Gap in Spring Mills?
Income or Wage Gap in Spring Mills is 21.5%.
Women in Spring Mills earn 78.5 cents for every dollar earned by a man.
What is Inequality or Gini Index in Spring Mills?
Inequality or Gini Index in Spring Mills is 0.35.
What is the Total Population of Spring Mills?
Total Population of Spring Mills is 424.
What is the Total Male Population of Spring Mills?
Total Male Population of Spring Mills is 196.
What is the Total Female Population of Spring Mills?
Total Female Population of Spring Mills is 228.
What is the Ratio of Males per 100 Females in Spring Mills?
There are 85.96 Males per 100 Females in Spring Mills.
What is the Ratio of Females per 100 Males in Spring Mills?
There are 116.33 Females per 100 Males in Spring Mills.
What is the Median Population Age in Spring Mills?
Median Population Age in Spring Mills is 48.4 Years.
What is the Average Family Size in Spring Mills
Average Family Size in Spring Mills is 2.5 People.
What is the Average Household Size in Spring Mills
Average Household Size in Spring Mills is 2.1 People.
How Large is the Labor Force in Spring Mills?
There are 233 People in the Labor Forcein in Spring Mills.
What is the Percentage of People in the Labor Force in Spring Mills?
66.6% of People are in the Labor Force in Spring Mills.
What is the Unemployment Rate in Spring Mills?
Unemployment Rate in Spring Mills is 8.6%.