South Fork borough, PA Map & Demographics
South Fork borough Overview
$24,671
PER CAPITA INCOME
$43,542
AVG FAMILY INCOME
$32,273
AVG HOUSEHOLD INCOME
15.0%
WAGE / INCOME GAP [ % ]
85.0¢/ $1
WAGE / INCOME GAP [ $ ]
0.49
INEQUALITY / GINI INDEX
864
TOTAL POPULATION
435
MALE POPULATION
429
FEMALE POPULATION
101.40
MALES / 100 FEMALES
98.62
FEMALES / 100 MALES
38.5
MEDIAN AGE
2.7
AVG FAMILY SIZE
2.2
AVG HOUSEHOLD SIZE
387
LABOR FORCE [ PEOPLE ]
57.1%
PERCENT IN LABOR FORCE
3.1%
UNEMPLOYMENT RATE
Income in South Fork borough
Income Overview in South Fork borough
Per Capita Income in South Fork borough is $24,671, while median incomes of families and households are $43,542 and $32,273 respectively.
| Characteristic | Number | Measure |
| Per Capita Income | 864 | $24,671 |
| Median Family Income | 235 | $43,542 |
| Mean Family Income | 235 | $66,361 |
| Median Household Income | 388 | $32,273 |
| Mean Household Income | 388 | $54,417 |
| Income Deficit | 235 | $0 |
| Wage / Income Gap (%) | 864 | 14.97% |
| Wage / Income Gap ($) | 864 | 85.03¢ per $1 |
| Gini / Inequality Index | 864 | 0.49 |
Earnings by Sex in South Fork borough
Average Earnings in South Fork borough are $24,352, $27,679 for men and $23,536 for women, a difference of 15.0%.
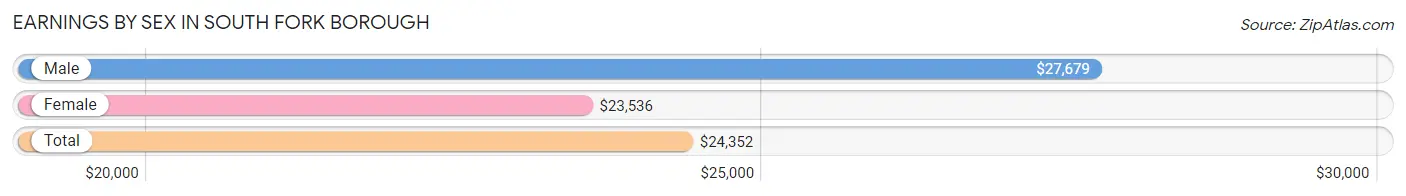
| Sex | Number | Average Earnings |
| Male | 205 (52.0%) | $27,679 |
| Female | 189 (48.0%) | $23,536 |
| Total | 394 (100.0%) | $24,352 |
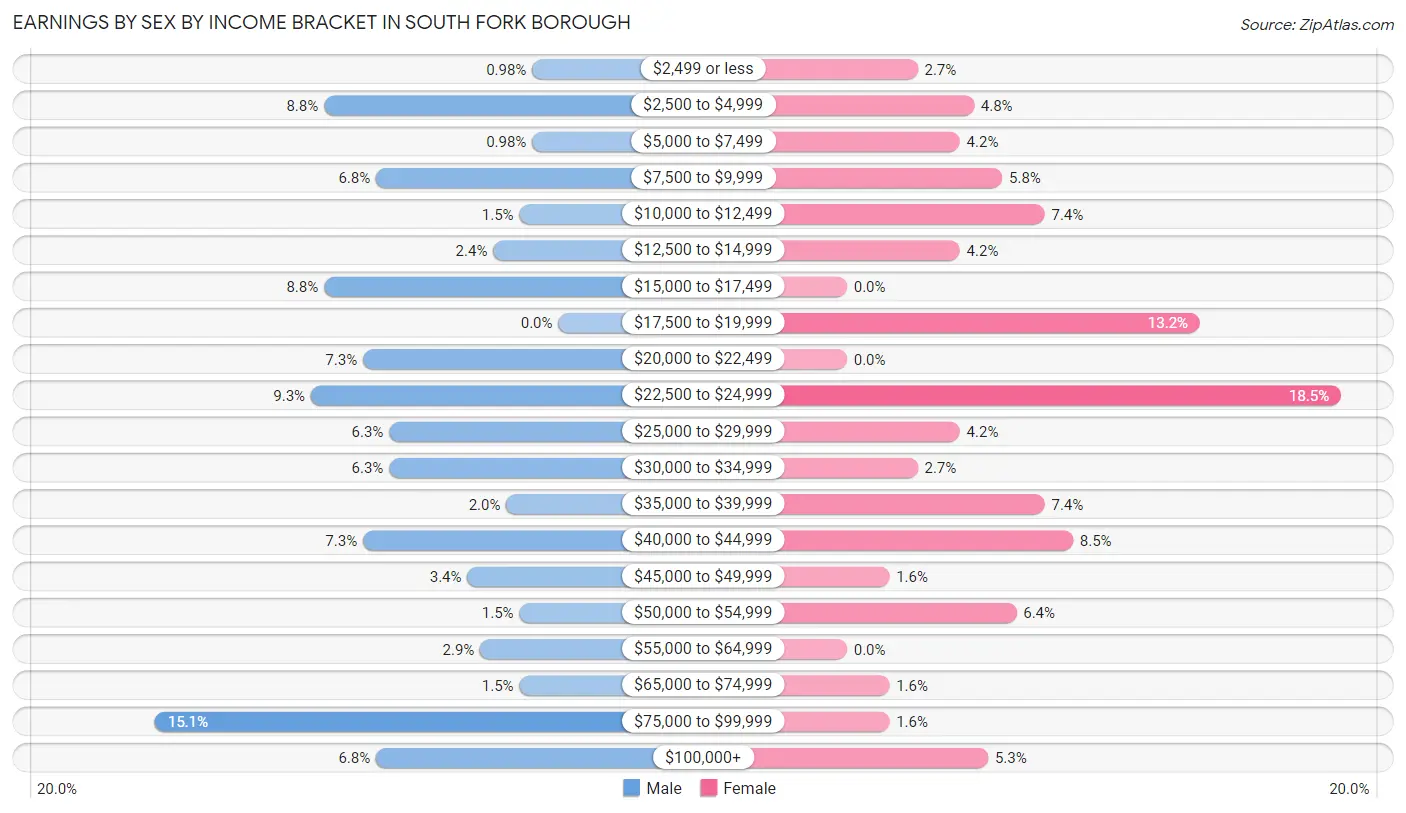
Earnings by Sex by Income Bracket in South Fork borough
The most common earnings brackets in South Fork borough are $75,000 to $99,999 for men (31 | 15.1%) and $22,500 to $24,999 for women (35 | 18.5%).
| Income | Male | Female |
| $2,499 or less | 2 (1.0%) | 5 (2.6%) |
| $2,500 to $4,999 | 18 (8.8%) | 9 (4.8%) |
| $5,000 to $7,499 | 2 (1.0%) | 8 (4.2%) |
| $7,500 to $9,999 | 14 (6.8%) | 11 (5.8%) |
| $10,000 to $12,499 | 3 (1.5%) | 14 (7.4%) |
| $12,500 to $14,999 | 5 (2.4%) | 8 (4.2%) |
| $15,000 to $17,499 | 18 (8.8%) | 0 (0.0%) |
| $17,500 to $19,999 | 0 (0.0%) | 25 (13.2%) |
| $20,000 to $22,499 | 15 (7.3%) | 0 (0.0%) |
| $22,500 to $24,999 | 19 (9.3%) | 35 (18.5%) |
| $25,000 to $29,999 | 13 (6.3%) | 8 (4.2%) |
| $30,000 to $34,999 | 13 (6.3%) | 5 (2.6%) |
| $35,000 to $39,999 | 4 (1.9%) | 14 (7.4%) |
| $40,000 to $44,999 | 15 (7.3%) | 16 (8.5%) |
| $45,000 to $49,999 | 7 (3.4%) | 3 (1.6%) |
| $50,000 to $54,999 | 3 (1.5%) | 12 (6.4%) |
| $55,000 to $64,999 | 6 (2.9%) | 0 (0.0%) |
| $65,000 to $74,999 | 3 (1.5%) | 3 (1.6%) |
| $75,000 to $99,999 | 31 (15.1%) | 3 (1.6%) |
| $100,000+ | 14 (6.8%) | 10 (5.3%) |
| Total | 205 (100.0%) | 189 (100.0%) |
Earnings by Sex by Educational Attainment in South Fork borough
Average earnings in South Fork borough are $25,833 for men and $24,648 for women, a difference of 4.6%. Men with an educational attainment of high school diploma enjoy the highest average annual earnings of $24,545, while those with college or associate's degree education earn the least with $24,531. Women with an educational attainment of college or associate's degree earn the most with the average annual earnings of $24,886, while those with high school diploma education have the smallest earnings of $19,750.
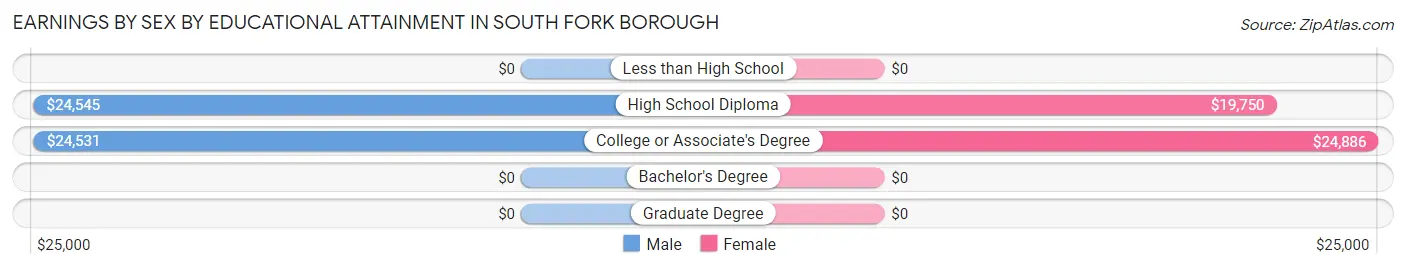
| Educational Attainment | Male Income | Female Income |
| Less than High School | - | - |
| High School Diploma | $24,545 | $19,750 |
| College or Associate's Degree | $24,531 | $24,886 |
| Bachelor's Degree | - | - |
| Graduate Degree | - | - |
| Total | $25,833 | $24,648 |
Family Income in South Fork borough
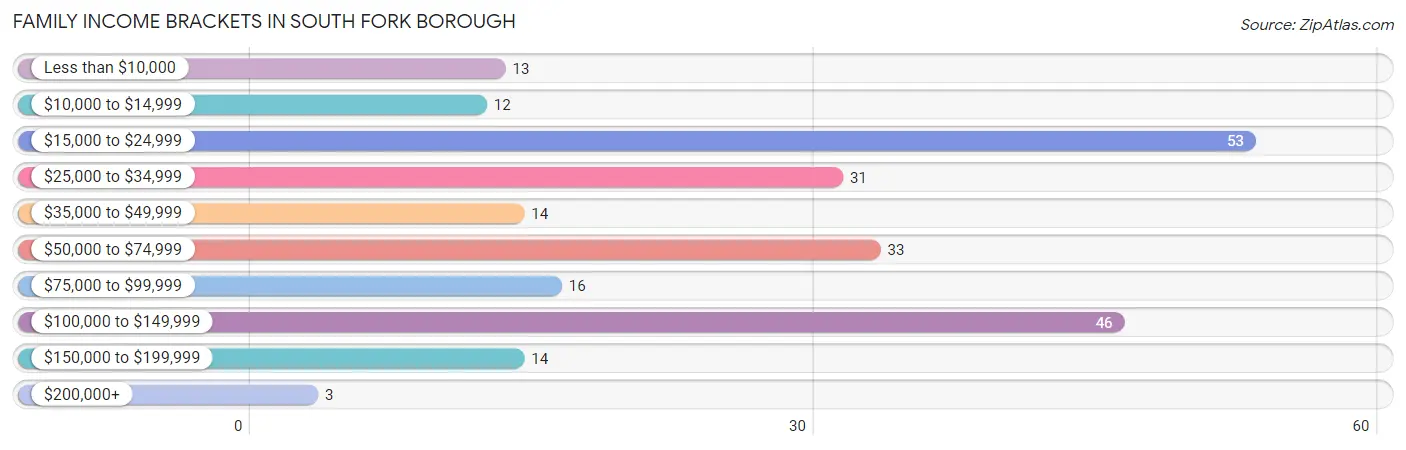
Family Income Brackets in South Fork borough
According to the South Fork borough family income data, there are 53 families falling into the $15,000 to $24,999 income range, which is the most common income bracket and makes up 22.6% of all families. Conversely, the $200,000+ income bracket is the least frequent group with only 3 families (1.3%) belonging to this category.
| Income Bracket | # Families | % Families |
| Less than $10,000 | 13 | 5.5% |
| $10,000 to $14,999 | 12 | 5.1% |
| $15,000 to $24,999 | 53 | 22.6% |
| $25,000 to $34,999 | 31 | 13.2% |
| $35,000 to $49,999 | 14 | 6.0% |
| $50,000 to $74,999 | 33 | 14.0% |
| $75,000 to $99,999 | 16 | 6.8% |
| $100,000 to $149,999 | 46 | 19.6% |
| $150,000 to $199,999 | 14 | 6.0% |
| $200,000+ | 3 | 1.3% |
Family Income by Famaliy Size in South Fork borough
4-person families (33 | 14.0%) account for the highest median family income in South Fork borough with $58,438 per family, while 3-person families (39 | 16.6%) have the highest median income of $18,393 per family member.
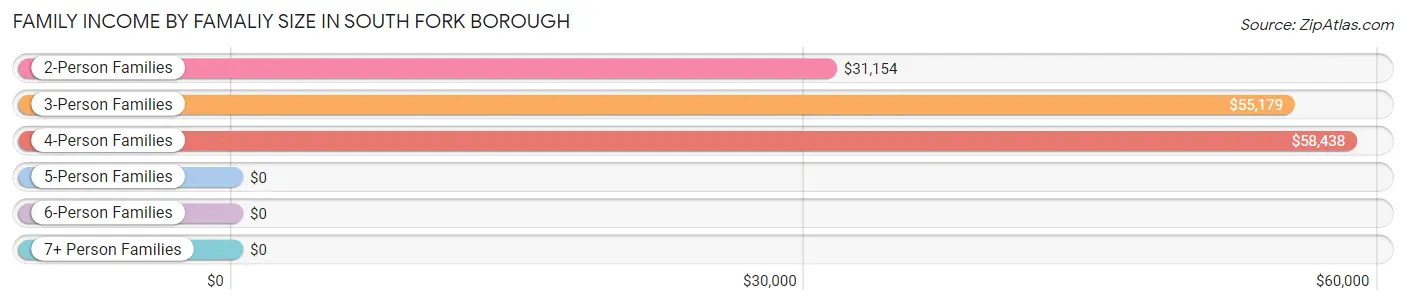
| Income Bracket | # Families | Median Income |
| 2-Person Families | 146 (62.1%) | $31,154 |
| 3-Person Families | 39 (16.6%) | $55,179 |
| 4-Person Families | 33 (14.0%) | $58,438 |
| 5-Person Families | 12 (5.1%) | $0 |
| 6-Person Families | 2 (0.9%) | $0 |
| 7+ Person Families | 3 (1.3%) | $0 |
| Total | 235 (100.0%) | $43,542 |
Family Income by Number of Earners in South Fork borough
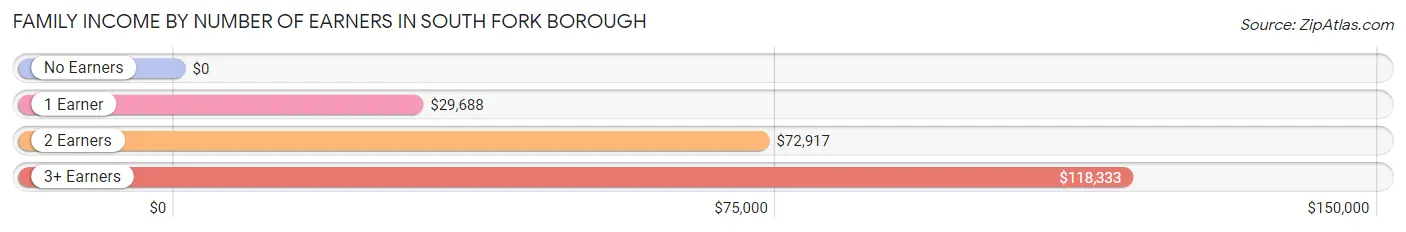
| Number of Earners | # Families | Median Income |
| No Earners | 35 (14.9%) | $0 |
| 1 Earner | 131 (55.7%) | $29,688 |
| 2 Earners | 47 (20.0%) | $72,917 |
| 3+ Earners | 22 (9.4%) | $118,333 |
| Total | 235 (100.0%) | $43,542 |
Household Income in South Fork borough
Household Income Brackets in South Fork borough
With 98 households falling in the category, the $15,000 to $24,999 income range is the most frequent in South Fork borough, accounting for 25.3% of all households. In contrast, only 3 households (0.8%) fall into the $200,000+ income bracket, making it the least populous group.
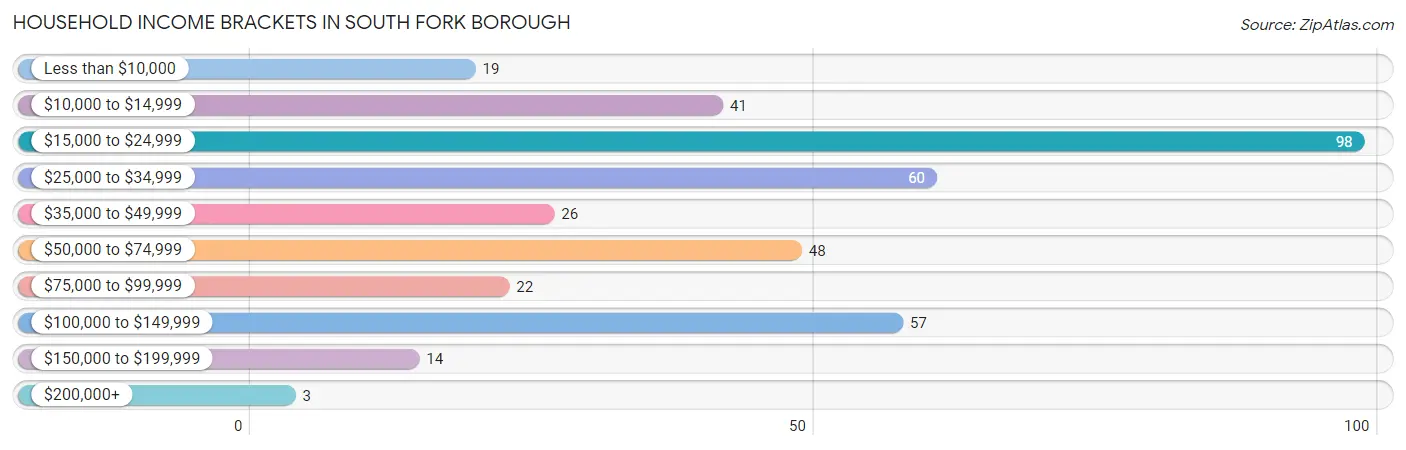
| Income Bracket | # Households | % Households |
| Less than $10,000 | 19 | 4.9% |
| $10,000 to $14,999 | 41 | 10.6% |
| $15,000 to $24,999 | 98 | 25.3% |
| $25,000 to $34,999 | 60 | 15.5% |
| $35,000 to $49,999 | 26 | 6.7% |
| $50,000 to $74,999 | 48 | 12.4% |
| $75,000 to $99,999 | 22 | 5.7% |
| $100,000 to $149,999 | 57 | 14.7% |
| $150,000 to $199,999 | 14 | 3.6% |
| $200,000+ | 3 | 0.8% |
Household Income by Householder Age in South Fork borough
The median household income in South Fork borough is $32,273, with the highest median household income of $41,250 found in the 25 to 44 years age bracket for the primary householder. A total of 134 households (34.5%) fall into this category. Meanwhile, the 15 to 24 years age bracket for the primary householder has the lowest median household income of $0, with 6 households (1.5%) in this group.
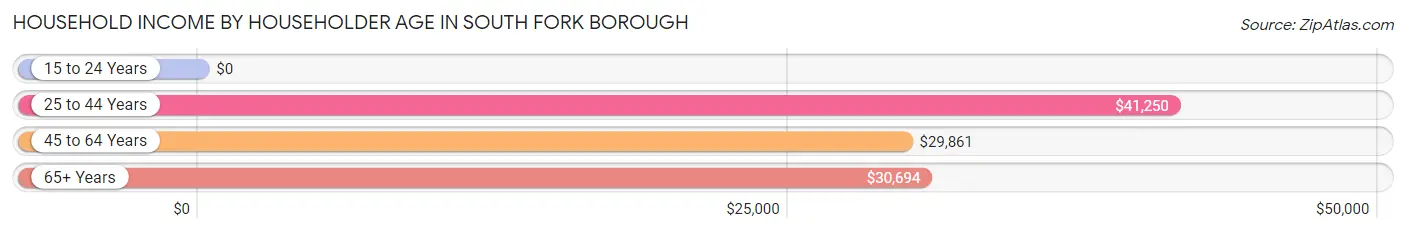
| Income Bracket | # Households | Median Income |
| 15 to 24 Years | 6 (1.5%) | $0 |
| 25 to 44 Years | 134 (34.5%) | $41,250 |
| 45 to 64 Years | 135 (34.8%) | $29,861 |
| 65+ Years | 113 (29.1%) | $30,694 |
| Total | 388 (100.0%) | $32,273 |
Poverty in South Fork borough
Income Below Poverty by Sex and Age in South Fork borough
With 21.6% poverty level for males and 23.8% for females among the residents of South Fork borough, 5 year old males and 6 to 11 year old females are the most vulnerable to poverty, with 8 males (72.7%) and 20 females (37.0%) in their respective age groups living below the poverty level.
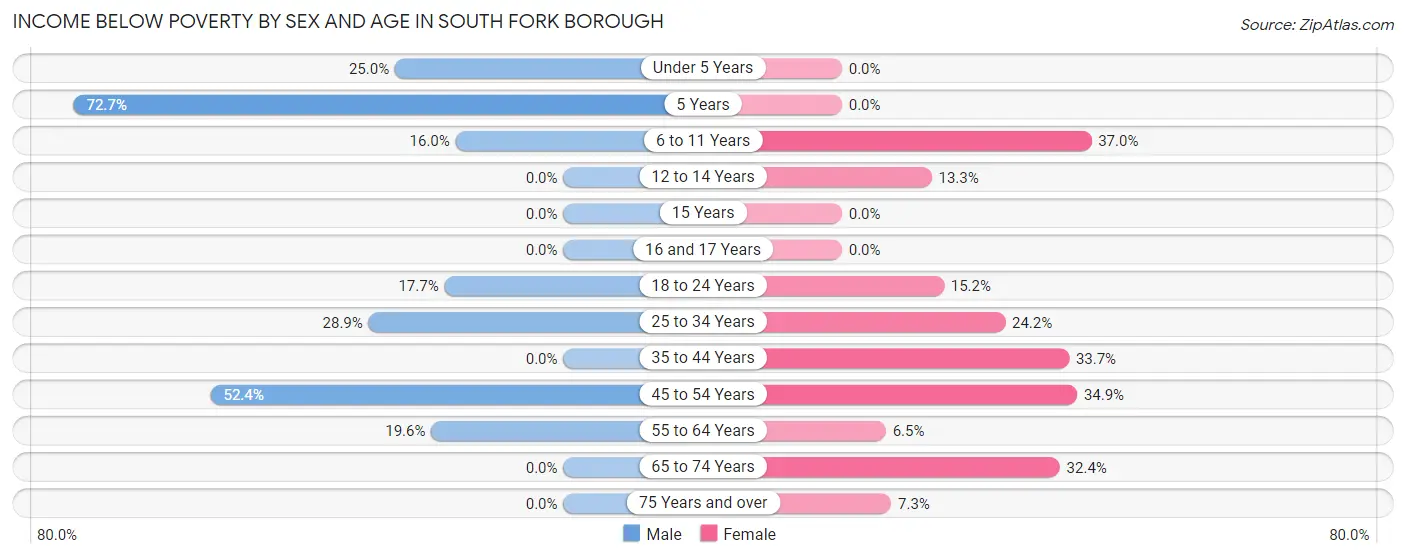
| Age Bracket | Male | Female |
| Under 5 Years | 10 (25.0%) | 0 (0.0%) |
| 5 Years | 8 (72.7%) | 0 (0.0%) |
| 6 to 11 Years | 4 (16.0%) | 20 (37.0%) |
| 12 to 14 Years | 0 (0.0%) | 2 (13.3%) |
| 15 Years | 0 (0.0%) | 0 (0.0%) |
| 16 and 17 Years | 0 (0.0%) | 0 (0.0%) |
| 18 to 24 Years | 3 (17.6%) | 5 (15.1%) |
| 25 to 34 Years | 24 (28.9%) | 8 (24.2%) |
| 35 to 44 Years | 0 (0.0%) | 28 (33.7%) |
| 45 to 54 Years | 33 (52.4%) | 22 (34.9%) |
| 55 to 64 Years | 10 (19.6%) | 3 (6.5%) |
| 65 to 74 Years | 0 (0.0%) | 11 (32.4%) |
| 75 Years and over | 0 (0.0%) | 3 (7.3%) |
| Total | 92 (21.6%) | 102 (23.8%) |
Income Above Poverty by Sex and Age in South Fork borough
According to the poverty statistics in South Fork borough, males aged 12 to 14 years and females aged under 5 years are the age groups that are most secure financially, with 100.0% of males and 100.0% of females in these age groups living above the poverty line.
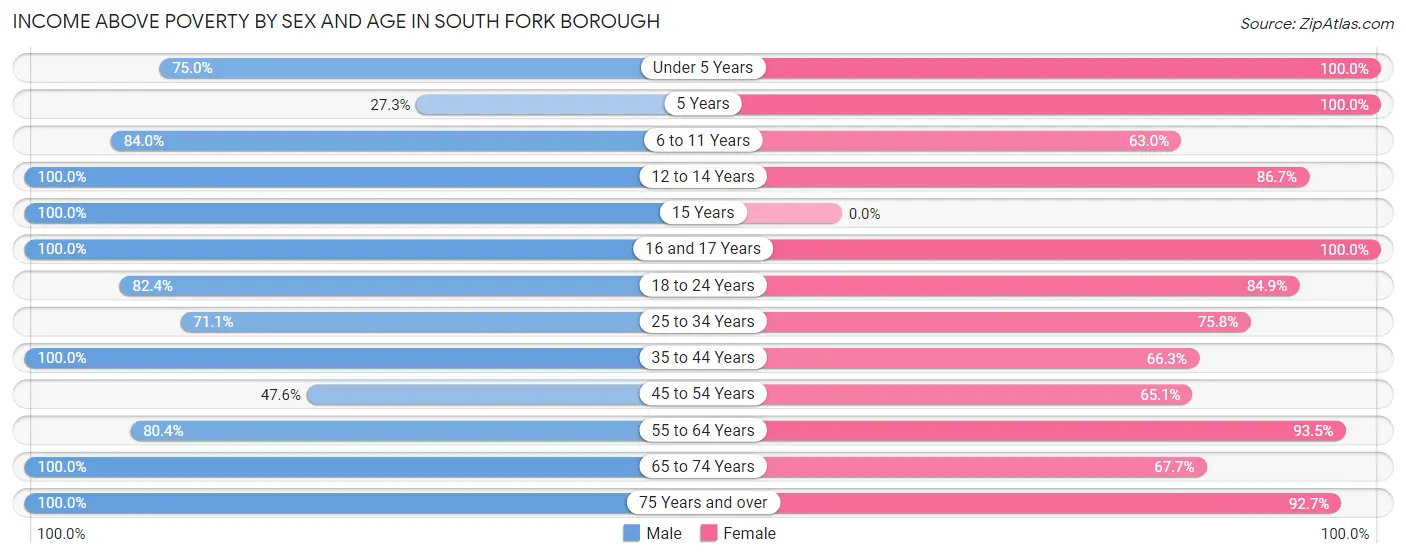
| Age Bracket | Male | Female |
| Under 5 Years | 30 (75.0%) | 16 (100.0%) |
| 5 Years | 3 (27.3%) | 3 (100.0%) |
| 6 to 11 Years | 21 (84.0%) | 34 (63.0%) |
| 12 to 14 Years | 4 (100.0%) | 13 (86.7%) |
| 15 Years | 9 (100.0%) | 0 (0.0%) |
| 16 and 17 Years | 13 (100.0%) | 8 (100.0%) |
| 18 to 24 Years | 14 (82.4%) | 28 (84.9%) |
| 25 to 34 Years | 59 (71.1%) | 25 (75.8%) |
| 35 to 44 Years | 41 (100.0%) | 55 (66.3%) |
| 45 to 54 Years | 30 (47.6%) | 41 (65.1%) |
| 55 to 64 Years | 41 (80.4%) | 43 (93.5%) |
| 65 to 74 Years | 48 (100.0%) | 23 (67.6%) |
| 75 Years and over | 21 (100.0%) | 38 (92.7%) |
| Total | 334 (78.4%) | 327 (76.2%) |
Income Below Poverty Among Married-Couple Families in South Fork borough
The poverty statistics for married-couple families in South Fork borough show that 14.9% or 20 of the total 134 families live below the poverty line. Families with 1 or 2 children have the highest poverty rate of 16.7%, comprising of 4 families. On the other hand, families with 3 or 4 children have the lowest poverty rate of 0.0%, which includes 0 families.
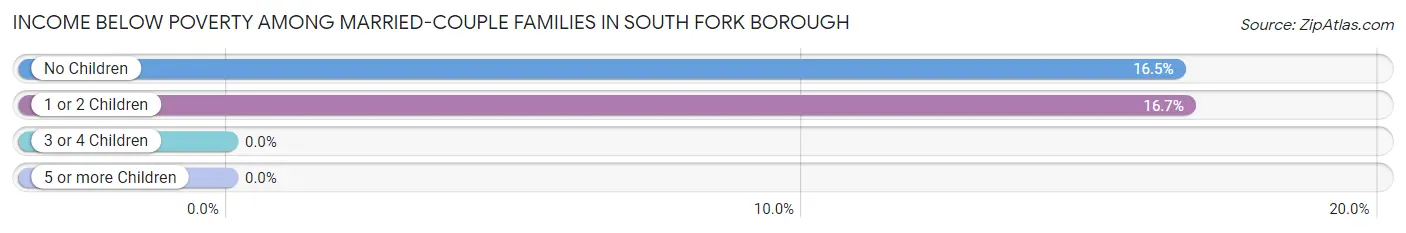
| Children | Above Poverty | Below Poverty |
| No Children | 81 (83.5%) | 16 (16.5%) |
| 1 or 2 Children | 20 (83.3%) | 4 (16.7%) |
| 3 or 4 Children | 10 (100.0%) | 0 (0.0%) |
| 5 or more Children | 3 (100.0%) | 0 (0.0%) |
| Total | 114 (85.1%) | 20 (14.9%) |
Income Below Poverty Among Single-Parent Households in South Fork borough
According to the poverty data in South Fork borough, 45.3% or 24 single-father households and 22.9% or 11 single-mother households are living below the poverty line. Among single-father households, those with 3 or 4 children have the highest poverty rate, with 2 households (100.0%) experiencing poverty. Likewise, among single-mother households, those with 1 or 2 children have the highest poverty rate, with 11 households (35.5%) falling below the poverty line.
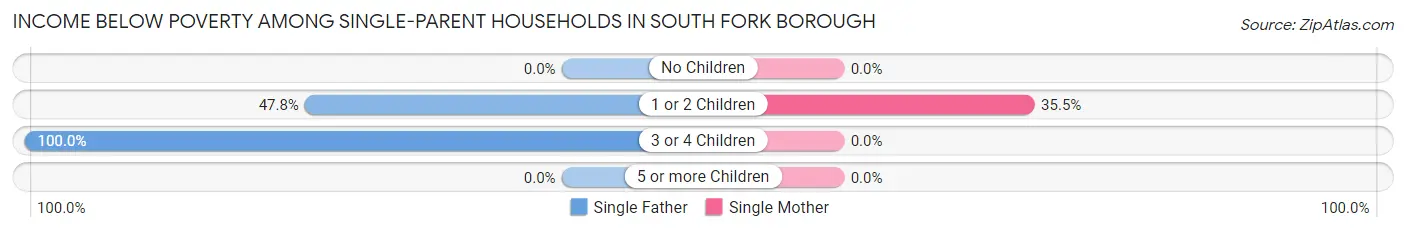
| Children | Single Father | Single Mother |
| No Children | 0 (0.0%) | 0 (0.0%) |
| 1 or 2 Children | 22 (47.8%) | 11 (35.5%) |
| 3 or 4 Children | 2 (100.0%) | 0 (0.0%) |
| 5 or more Children | 0 (0.0%) | 0 (0.0%) |
| Total | 24 (45.3%) | 11 (22.9%) |
Income Below Poverty Among Married-Couple vs Single-Parent Households in South Fork borough
The poverty data for South Fork borough shows that 20 of the married-couple family households (14.9%) and 35 of the single-parent households (34.6%) are living below the poverty level. Within the married-couple family households, those with 1 or 2 children have the highest poverty rate, with 4 households (16.7%) falling below the poverty line. Among the single-parent households, those with 1 or 2 children have the highest poverty rate, with 33 household (42.9%) living below poverty.
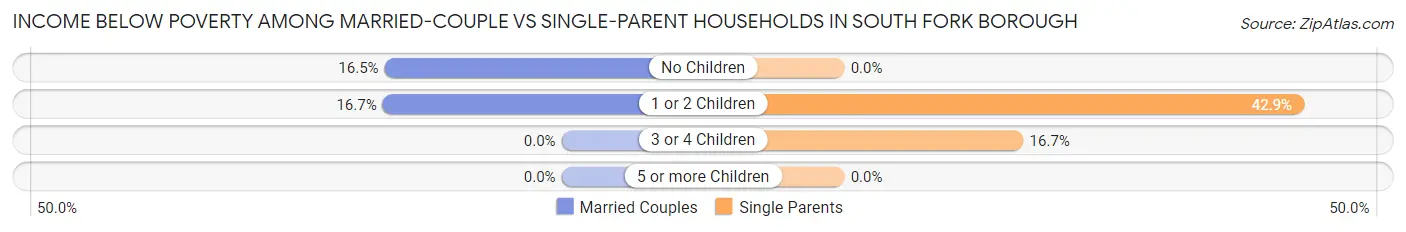
| Children | Married-Couple Families | Single-Parent Households |
| No Children | 16 (16.5%) | 0 (0.0%) |
| 1 or 2 Children | 4 (16.7%) | 33 (42.9%) |
| 3 or 4 Children | 0 (0.0%) | 2 (16.7%) |
| 5 or more Children | 0 (0.0%) | 0 (0.0%) |
| Total | 20 (14.9%) | 35 (34.6%) |
Race in South Fork borough
The most populous races in South Fork borough are White / Caucasian (795 | 92.0%), Two or more Races (62 | 7.2%), and Hispanic or Latino (14 | 1.6%).
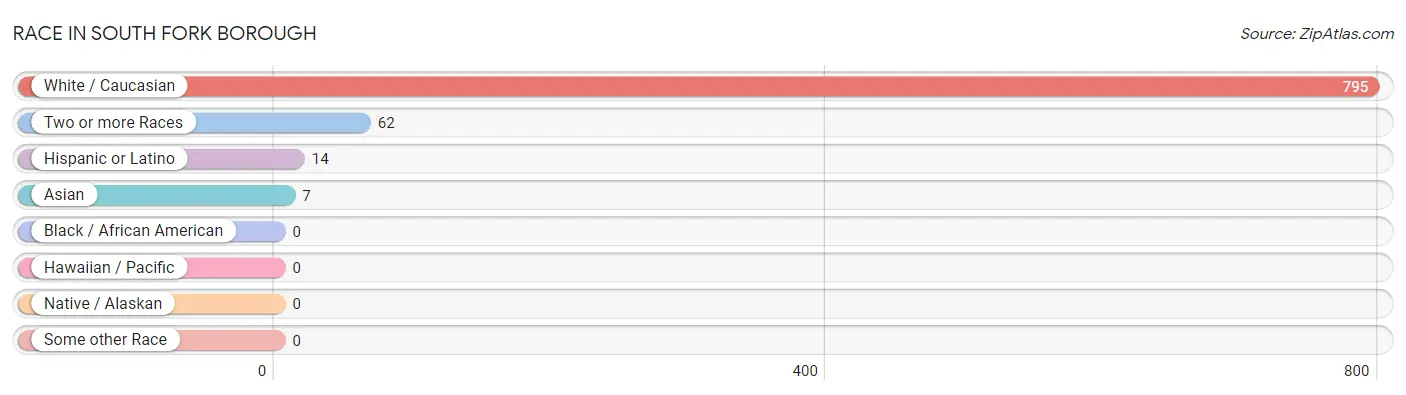
| Race | # Population | % Population |
| Asian | 7 | 0.8% |
| Black / African American | 0 | 0.0% |
| Hawaiian / Pacific | 0 | 0.0% |
| Hispanic or Latino | 14 | 1.6% |
| Native / Alaskan | 0 | 0.0% |
| White / Caucasian | 795 | 92.0% |
| Two or more Races | 62 | 7.2% |
| Some other Race | 0 | 0.0% |
| Total | 864 | 100.0% |
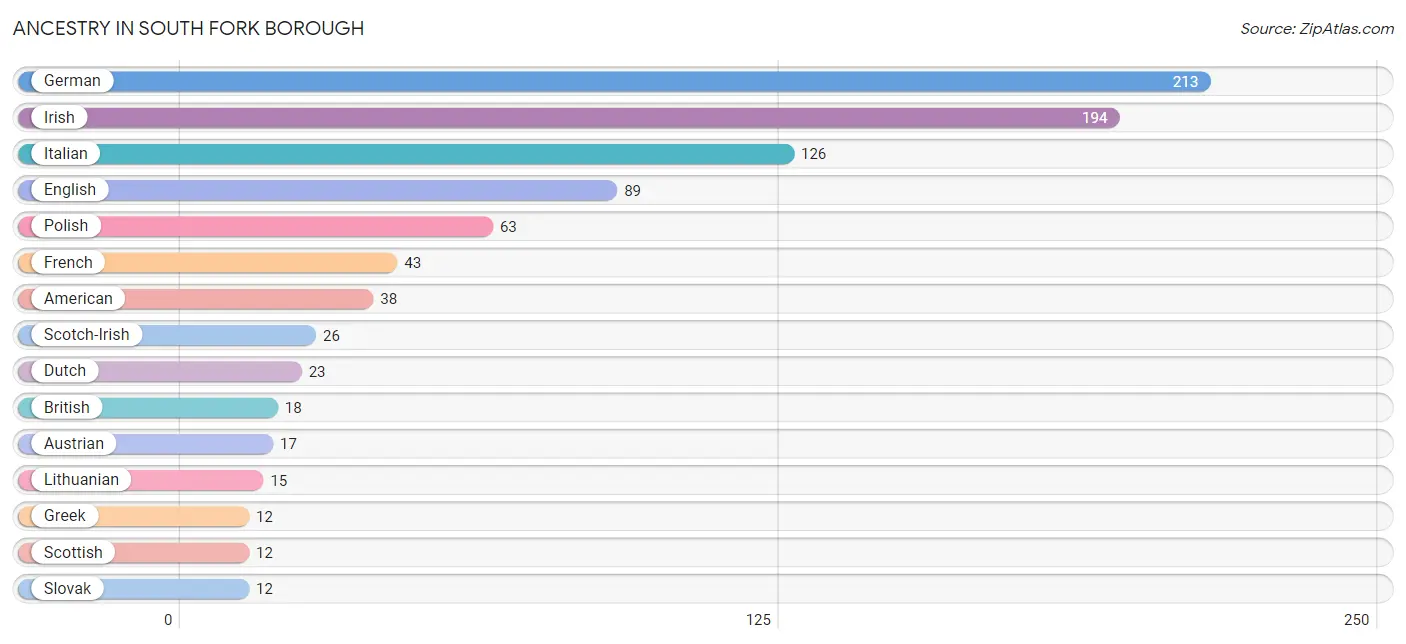
Ancestry in South Fork borough
The most populous ancestries reported in South Fork borough are German (213 | 24.6%), Irish (194 | 22.5%), Italian (126 | 14.6%), English (89 | 10.3%), and Polish (63 | 7.3%), together accounting for 79.3% of all South Fork borough residents.
| Ancestry | # Population | % Population |
| American | 38 | 4.4% |
| Austrian | 17 | 2.0% |
| British | 18 | 2.1% |
| Croatian | 3 | 0.4% |
| Czechoslovakian | 3 | 0.4% |
| Dutch | 23 | 2.7% |
| English | 89 | 10.3% |
| European | 11 | 1.3% |
| French | 43 | 5.0% |
| German | 213 | 24.6% |
| Greek | 12 | 1.4% |
| Hungarian | 9 | 1.0% |
| Irish | 194 | 22.5% |
| Italian | 126 | 14.6% |
| Korean | 7 | 0.8% |
| Lithuanian | 15 | 1.7% |
| Mexican | 4 | 0.5% |
| Pennsylvania German | 6 | 0.7% |
| Polish | 63 | 7.3% |
| Russian | 7 | 0.8% |
| Scotch-Irish | 26 | 3.0% |
| Scottish | 12 | 1.4% |
| Slavic | 3 | 0.4% |
| Slovak | 12 | 1.4% |
| Slovene | 7 | 0.8% |
| Spanish | 10 | 1.2% |
| Welsh | 3 | 0.4% | View All 27 Rows |
Immigrants in South Fork borough
The most numerous immigrant groups reported in South Fork borough came from Asia (7 | 0.8%), Philippines (7 | 0.8%), and South Eastern Asia (7 | 0.8%), together accounting for 2.4% of all South Fork borough residents.
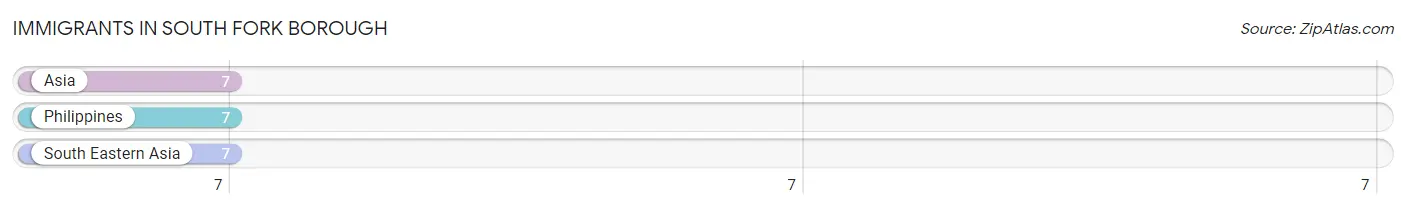
| Immigration Origin | # Population | % Population |
| Asia | 7 | 0.8% |
| Philippines | 7 | 0.8% |
| South Eastern Asia | 7 | 0.8% | View All 3 Rows |
Sex and Age in South Fork borough
Sex and Age in South Fork borough
The most populous age groups in South Fork borough are 25 to 29 Years (56 | 12.9%) for men and 35 to 39 Years (47 | 11.0%) for women.
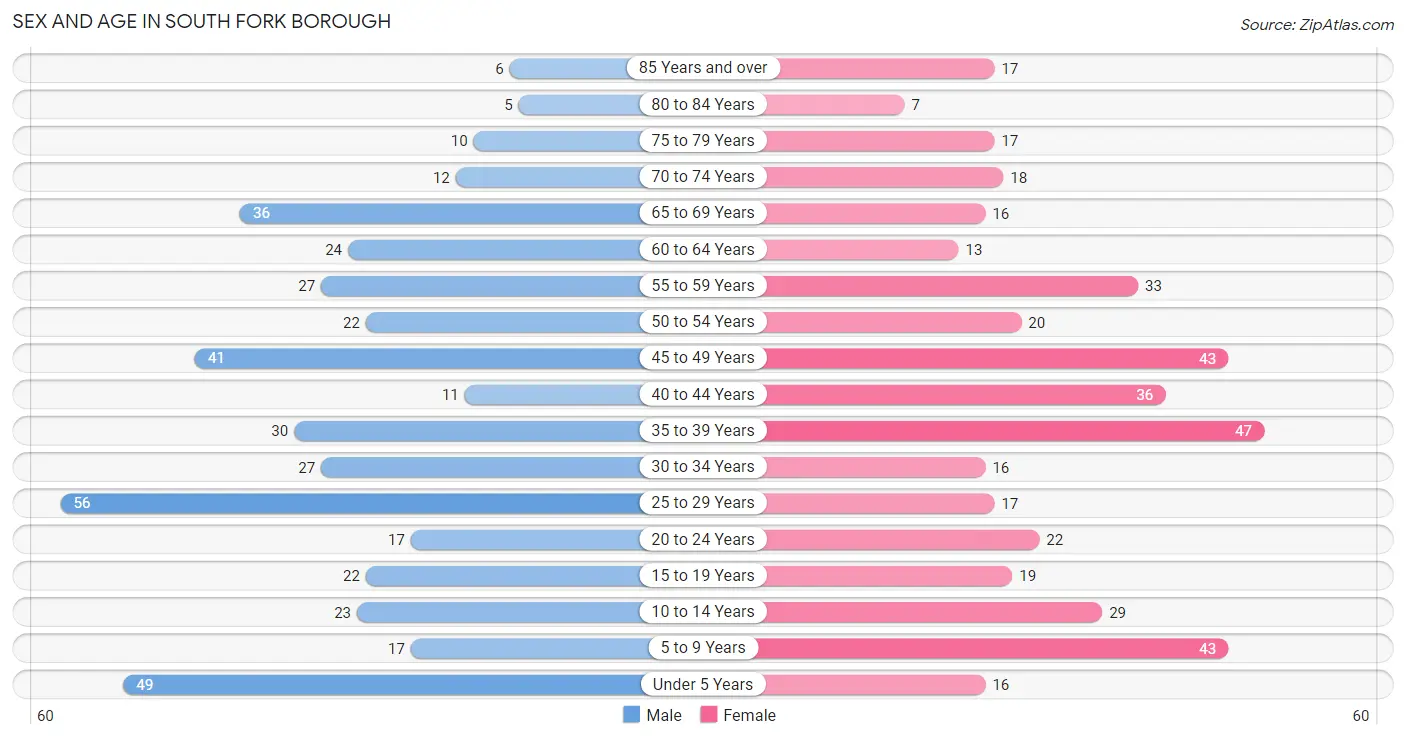
| Age Bracket | Male | Female |
| Under 5 Years | 49 (11.3%) | 16 (3.7%) |
| 5 to 9 Years | 17 (3.9%) | 43 (10.0%) |
| 10 to 14 Years | 23 (5.3%) | 29 (6.8%) |
| 15 to 19 Years | 22 (5.1%) | 19 (4.4%) |
| 20 to 24 Years | 17 (3.9%) | 22 (5.1%) |
| 25 to 29 Years | 56 (12.9%) | 17 (4.0%) |
| 30 to 34 Years | 27 (6.2%) | 16 (3.7%) |
| 35 to 39 Years | 30 (6.9%) | 47 (11.0%) |
| 40 to 44 Years | 11 (2.5%) | 36 (8.4%) |
| 45 to 49 Years | 41 (9.4%) | 43 (10.0%) |
| 50 to 54 Years | 22 (5.1%) | 20 (4.7%) |
| 55 to 59 Years | 27 (6.2%) | 33 (7.7%) |
| 60 to 64 Years | 24 (5.5%) | 13 (3.0%) |
| 65 to 69 Years | 36 (8.3%) | 16 (3.7%) |
| 70 to 74 Years | 12 (2.8%) | 18 (4.2%) |
| 75 to 79 Years | 10 (2.3%) | 17 (4.0%) |
| 80 to 84 Years | 5 (1.1%) | 7 (1.6%) |
| 85 Years and over | 6 (1.4%) | 17 (4.0%) |
| Total | 435 (100.0%) | 429 (100.0%) |
Families and Households in South Fork borough
Median Family Size in South Fork borough
The median family size in South Fork borough is 2.70 persons per family, with married-couple families (134 | 57.0%) accounting for the largest median family size of 2.93 persons per family. On the other hand, single male/father families (53 | 22.6%) represent the smallest median family size with 2.21 persons per family.
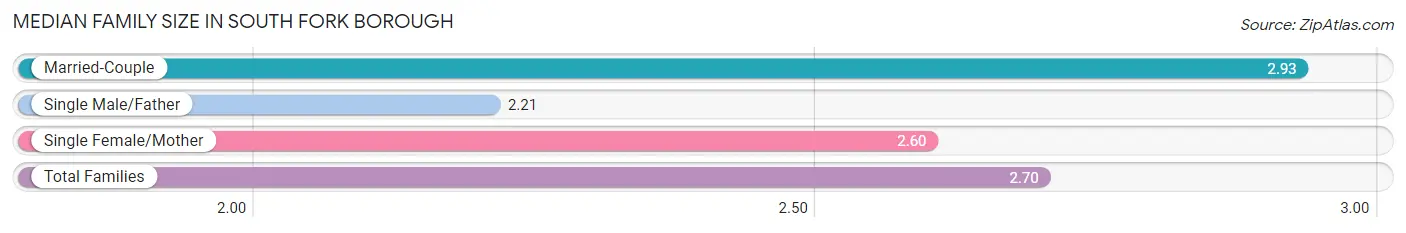
| Family Type | # Families | Family Size |
| Married-Couple | 134 (57.0%) | 2.93 |
| Single Male/Father | 53 (22.6%) | 2.21 |
| Single Female/Mother | 48 (20.4%) | 2.60 |
| Total Families | 235 (100.0%) | 2.70 |
Median Household Size in South Fork borough
The median household size in South Fork borough is 2.23 persons per household, with married-couple households (134 | 34.5%) accounting for the largest median household size of 2.93 persons per household. non-family households (153 | 39.4%) represent the smallest median household size with 1.28 persons per household.
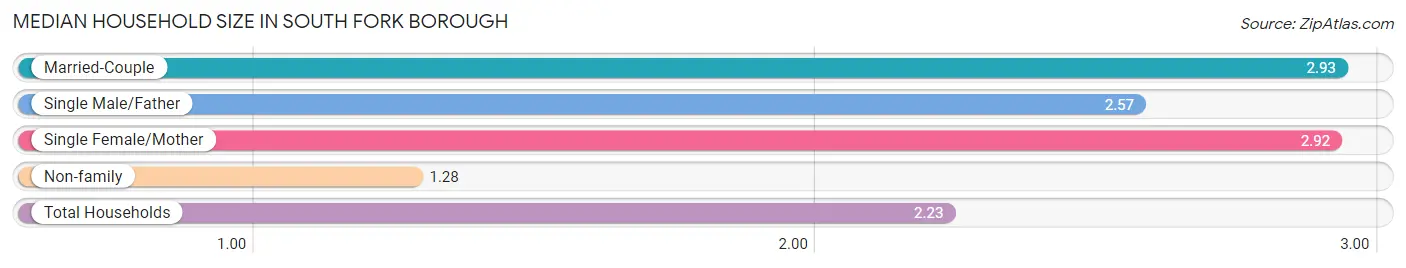
| Household Type | # Households | Household Size |
| Married-Couple | 134 (34.5%) | 2.93 |
| Single Male/Father | 53 (13.7%) | 2.57 |
| Single Female/Mother | 48 (12.4%) | 2.92 |
| Non-family | 153 (39.4%) | 1.28 |
| Total Households | 388 (100.0%) | 2.23 |
Household Size by Marriage Status in South Fork borough
Out of a total of 388 households in South Fork borough, 235 (60.6%) are family households, while 153 (39.4%) are nonfamily households. The most numerous type of family households are 2-person households, comprising 129, and the most common type of nonfamily households are 1-person households, comprising 121.
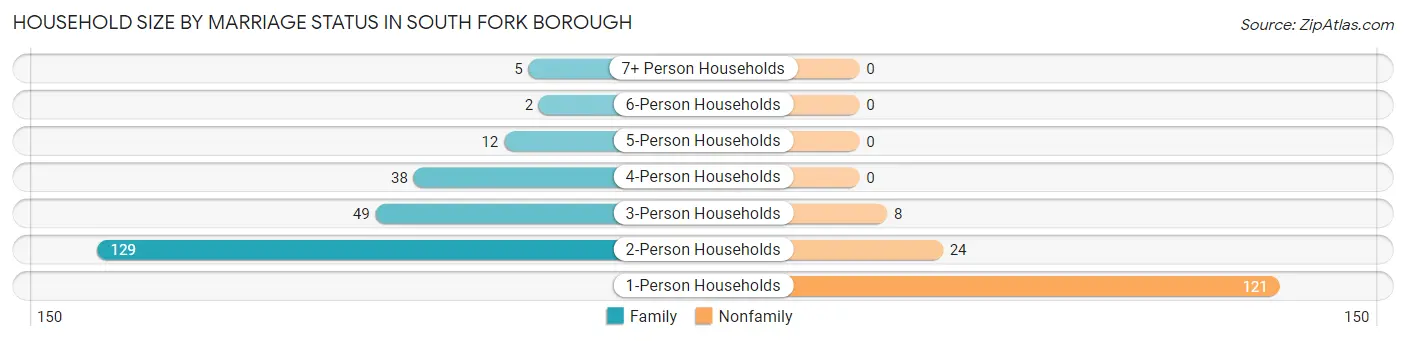
| Household Size | Family Households | Nonfamily Households |
| 1-Person Households | - | 121 (31.2%) |
| 2-Person Households | 129 (33.3%) | 24 (6.2%) |
| 3-Person Households | 49 (12.6%) | 8 (2.1%) |
| 4-Person Households | 38 (9.8%) | 0 (0.0%) |
| 5-Person Households | 12 (3.1%) | 0 (0.0%) |
| 6-Person Households | 2 (0.5%) | 0 (0.0%) |
| 7+ Person Households | 5 (1.3%) | 0 (0.0%) |
| Total | 235 (60.6%) | 153 (39.4%) |
Female Fertility in South Fork borough
Fertility by Age in South Fork borough
Average fertility rate in South Fork borough is 30.0 births per 1,000 women. Women in the age bracket of 15 to 19 years have the highest fertility rate with 105.0 births per 1,000 women. Women in the age bracket of 20 to 34 years acount for 66.7% of all women with births.
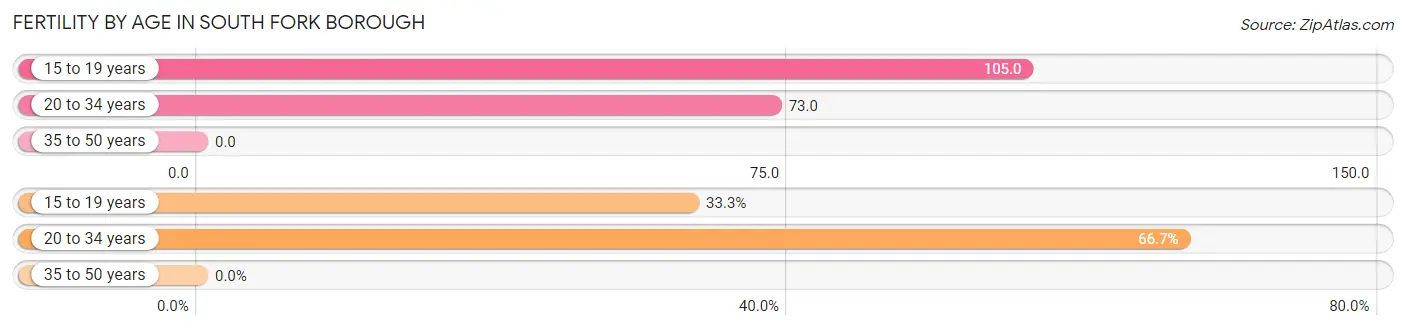
| Age Bracket | Women with Births | Births / 1,000 Women |
| 15 to 19 years | 2 (33.3%) | 105.0 |
| 20 to 34 years | 4 (66.7%) | 73.0 |
| 35 to 50 years | 0 (0.0%) | 0.0 |
| Total | 6 (100.0%) | 30.0 |
Fertility by Age by Marriage Status in South Fork borough
66.7% of women with births (6) in South Fork borough are married. The highest percentage of unmarried women with births falls into 15 to 19 years age bracket with 100.0% of them unmarried at the time of birth, while the lowest percentage of unmarried women with births belong to 20 to 34 years age bracket with 0.0% of them unmarried.
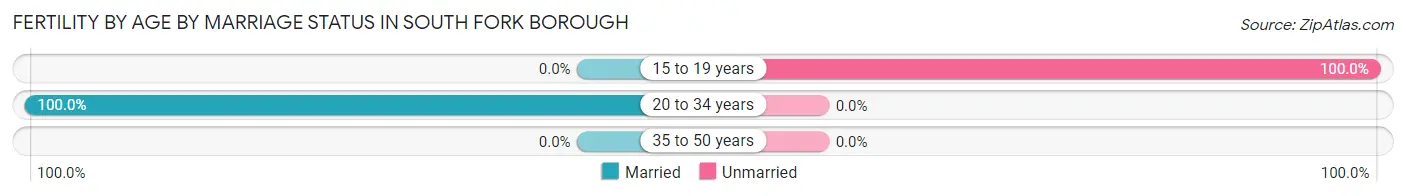
| Age Bracket | Married | Unmarried |
| 15 to 19 years | 0 (0.0%) | 2 (100.0%) |
| 20 to 34 years | 4 (100.0%) | 0 (0.0%) |
| 35 to 50 years | 0 (0.0%) | 0 (0.0%) |
| Total | 4 (66.7%) | 2 (33.3%) |
Fertility by Education in South Fork borough
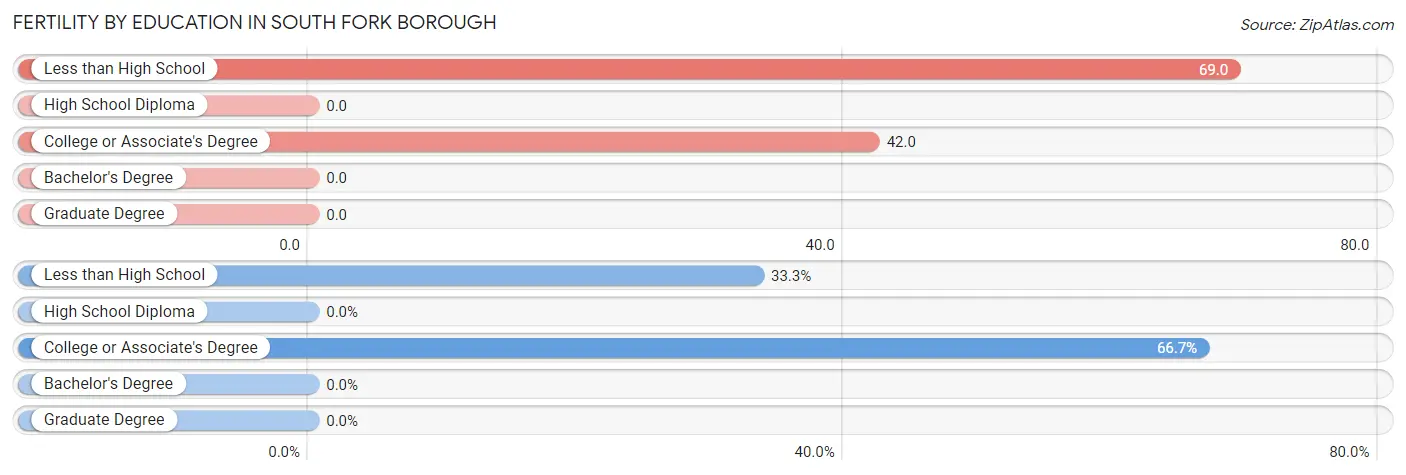
| Educational Attainment | Women with Births | Births / 1,000 Women |
| Less than High School | 2 (33.3%) | 69.0 |
| High School Diploma | 0 (0.0%) | 0.0 |
| College or Associate's Degree | 4 (66.7%) | 42.0 |
| Bachelor's Degree | 0 (0.0%) | 0.0 |
| Graduate Degree | 0 (0.0%) | 0.0 |
| Total | 6 (100.0%) | 30.0 |
Fertility by Education by Marriage Status in South Fork borough
33.3% of women with births in South Fork borough are unmarried. Women with the educational attainment of college or associate's degree are most likely to be married with 100.0% of them married at childbirth, while women with the educational attainment of less than high school are least likely to be married with 100.0% of them unmarried at childbirth.
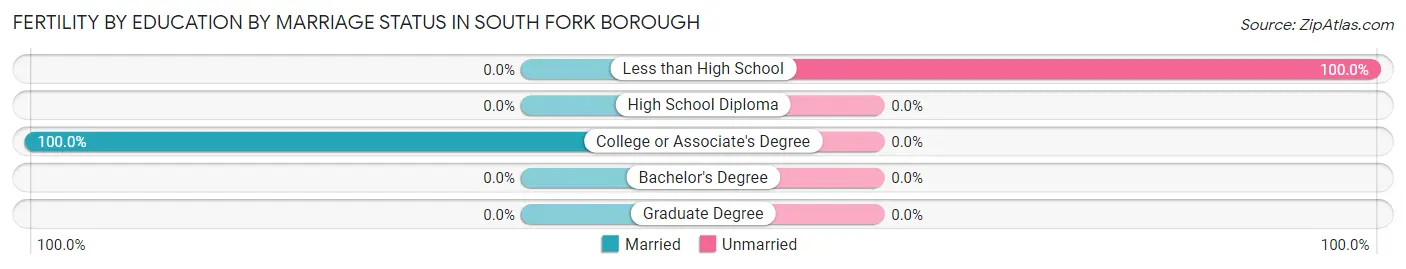
| Educational Attainment | Married | Unmarried |
| Less than High School | 0 (0.0%) | 2 (100.0%) |
| High School Diploma | 0 (0.0%) | 0 (0.0%) |
| College or Associate's Degree | 4 (100.0%) | 0 (0.0%) |
| Bachelor's Degree | 0 (0.0%) | 0 (0.0%) |
| Graduate Degree | 0 (0.0%) | 0 (0.0%) |
| Total | 4 (66.7%) | 2 (33.3%) |
Employment Characteristics in South Fork borough
Employment by Class of Employer in South Fork borough
Among the 375 employed individuals in South Fork borough, private company employees (281 | 74.9%), state government employees (33 | 8.8%), and not-for-profit organizations (30 | 8.0%) make up the most common classes of employment.
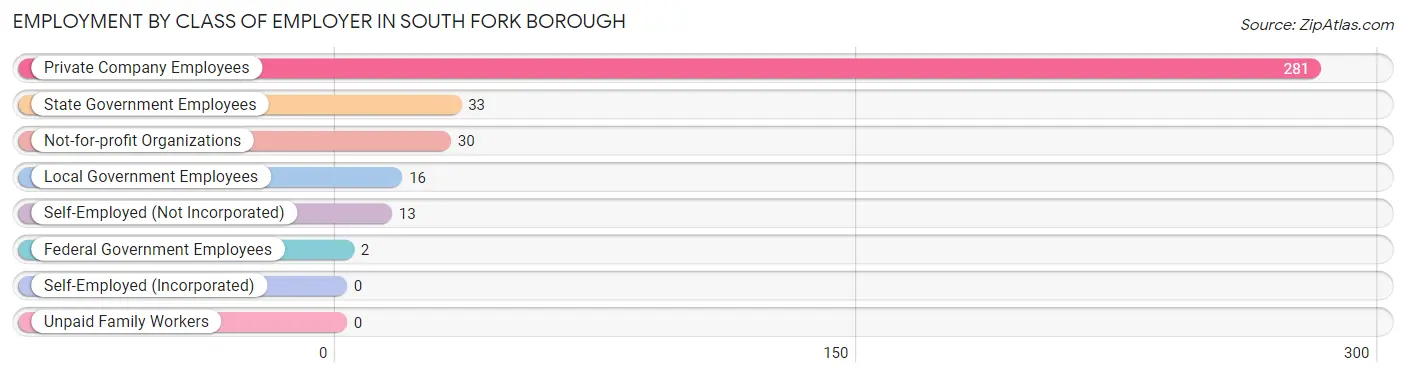
| Employer Class | # Employees | % Employees |
| Private Company Employees | 281 | 74.9% |
| Self-Employed (Incorporated) | 0 | 0.0% |
| Self-Employed (Not Incorporated) | 13 | 3.5% |
| Not-for-profit Organizations | 30 | 8.0% |
| Local Government Employees | 16 | 4.3% |
| State Government Employees | 33 | 8.8% |
| Federal Government Employees | 2 | 0.5% |
| Unpaid Family Workers | 0 | 0.0% |
| Total | 375 | 100.0% |
Employment Status by Age in South Fork borough
According to the labor force statistics for South Fork borough, out of the total population over 16 years of age (678), 57.1% or 387 individuals are in the labor force, with 3.1% or 12 of them unemployed. The age group with the highest labor force participation rate is 30 to 34 years, with 95.3% or 41 individuals in the labor force. Within the labor force, the 16 to 19 years age range has the highest percentage of unemployed individuals, with 15.4% or 2 of them being unemployed.
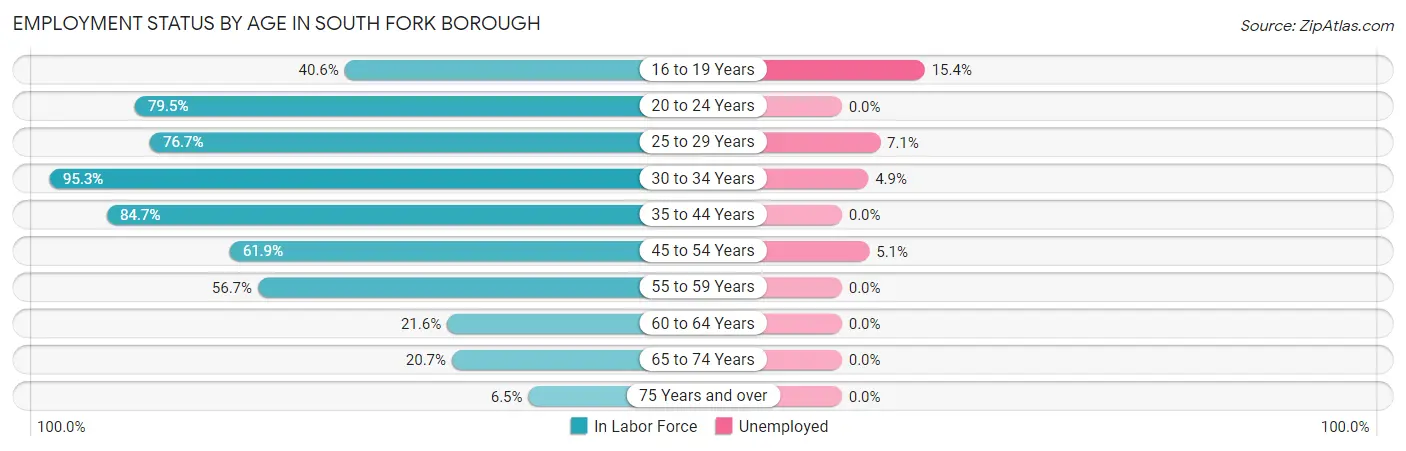
| Age Bracket | In Labor Force | Unemployed |
| 16 to 19 Years | 13 (40.6%) | 2 (15.4%) |
| 20 to 24 Years | 31 (79.5%) | 0 (0.0%) |
| 25 to 29 Years | 56 (76.7%) | 4 (7.1%) |
| 30 to 34 Years | 41 (95.3%) | 2 (4.9%) |
| 35 to 44 Years | 105 (84.7%) | 0 (0.0%) |
| 45 to 54 Years | 78 (61.9%) | 4 (5.1%) |
| 55 to 59 Years | 34 (56.7%) | 0 (0.0%) |
| 60 to 64 Years | 8 (21.6%) | 0 (0.0%) |
| 65 to 74 Years | 17 (20.7%) | 0 (0.0%) |
| 75 Years and over | 4 (6.5%) | 0 (0.0%) |
| Total | 387 (57.1%) | 12 (3.1%) |
Employment Status by Educational Attainment in South Fork borough
According to labor force statistics for South Fork borough, 69.5% of individuals (322) out of the total population between 25 and 64 years of age (463) are in the labor force, with 3.1% or 10 of them being unemployed. The group with the highest labor force participation rate are those with the educational attainment of bachelor's degree or higher, with 90.3% or 28 individuals in the labor force. Within the labor force, individuals with high school diploma education have the highest percentage of unemployment, with 7.2% or 10 of them being unemployed.
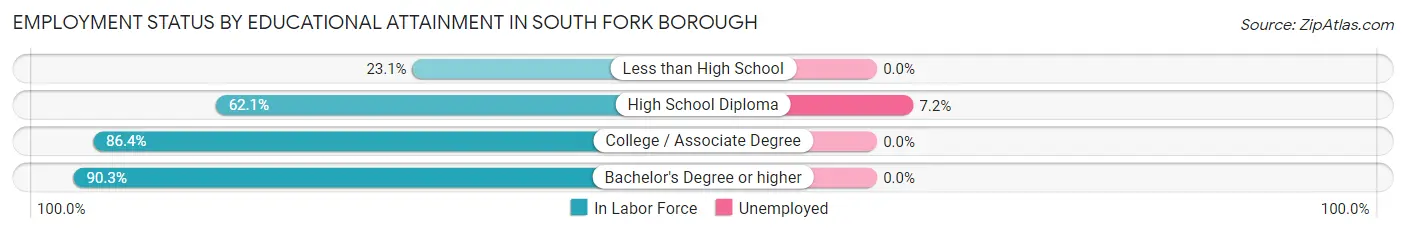
| Educational Attainment | In Labor Force | Unemployed |
| Less than High School | 9 (23.1%) | 0 (0.0%) |
| High School Diploma | 139 (62.1%) | 16 (7.2%) |
| College / Associate Degree | 146 (86.4%) | 0 (0.0%) |
| Bachelor's Degree or higher | 28 (90.3%) | 0 (0.0%) |
| Total | 322 (69.5%) | 14 (3.1%) |
Employment Occupations by Sex in South Fork borough
Management, Business, Science and Arts Occupations
The most common Management, Business, Science and Arts occupations in South Fork borough are Business & Financial (16 | 4.3%), Management (14 | 3.7%), Health Diagnosing & Treating (14 | 3.7%), Community & Social Service (13 | 3.5%), and Education Instruction & Library (13 | 3.5%).
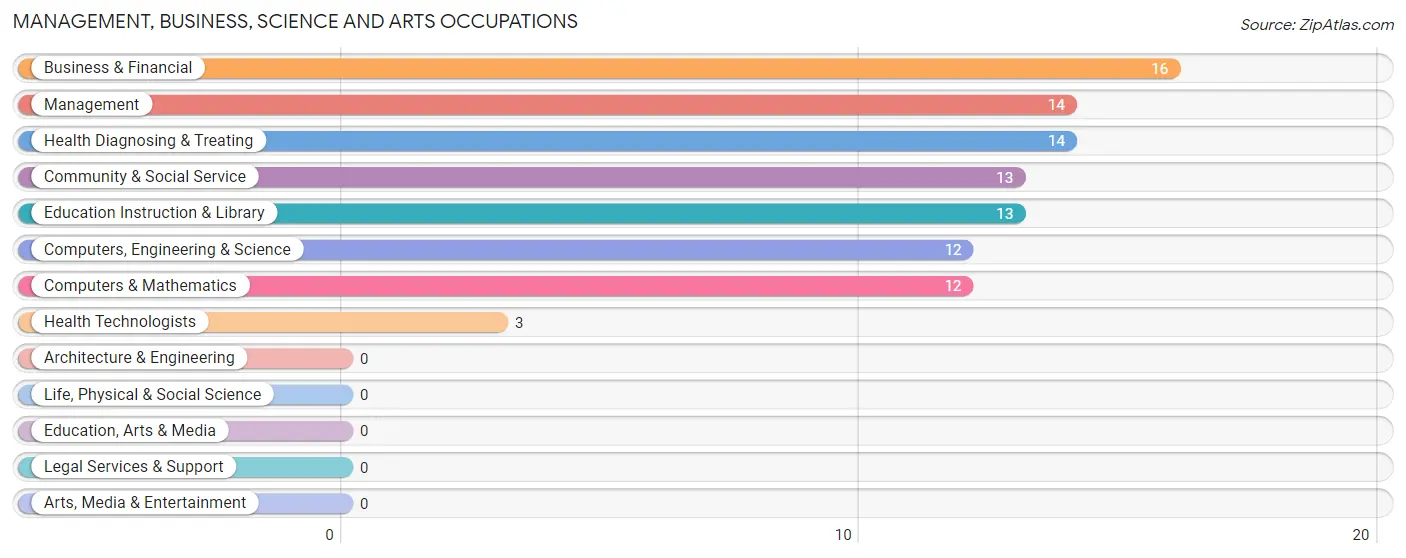
Management, Business, Science and Arts Occupations by Sex
Within the Management, Business, Science and Arts occupations in South Fork borough, the most male-oriented occupations are Management (100.0%), Computers, Engineering & Science (100.0%), and Computers & Mathematics (100.0%), while the most female-oriented occupations are Health Diagnosing & Treating (100.0%), Health Technologists (100.0%), and Business & Financial (56.2%).
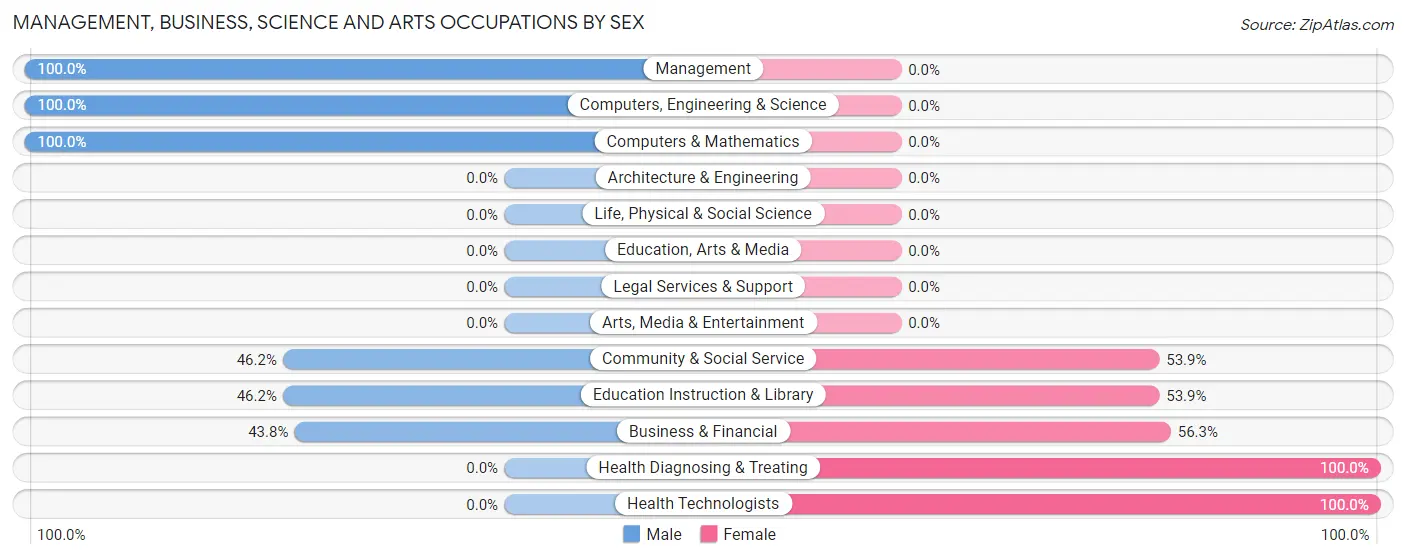
| Occupation | Male | Female |
| Management | 14 (100.0%) | 0 (0.0%) |
| Business & Financial | 7 (43.8%) | 9 (56.2%) |
| Computers, Engineering & Science | 12 (100.0%) | 0 (0.0%) |
| Computers & Mathematics | 12 (100.0%) | 0 (0.0%) |
| Architecture & Engineering | 0 (0.0%) | 0 (0.0%) |
| Life, Physical & Social Science | 0 (0.0%) | 0 (0.0%) |
| Community & Social Service | 6 (46.2%) | 7 (53.8%) |
| Education, Arts & Media | 0 (0.0%) | 0 (0.0%) |
| Legal Services & Support | 0 (0.0%) | 0 (0.0%) |
| Education Instruction & Library | 6 (46.2%) | 7 (53.8%) |
| Arts, Media & Entertainment | 0 (0.0%) | 0 (0.0%) |
| Health Diagnosing & Treating | 0 (0.0%) | 14 (100.0%) |
| Health Technologists | 0 (0.0%) | 3 (100.0%) |
| Total (Category) | 39 (56.5%) | 30 (43.5%) |
| Total (Overall) | 196 (52.3%) | 179 (47.7%) |
Services Occupations
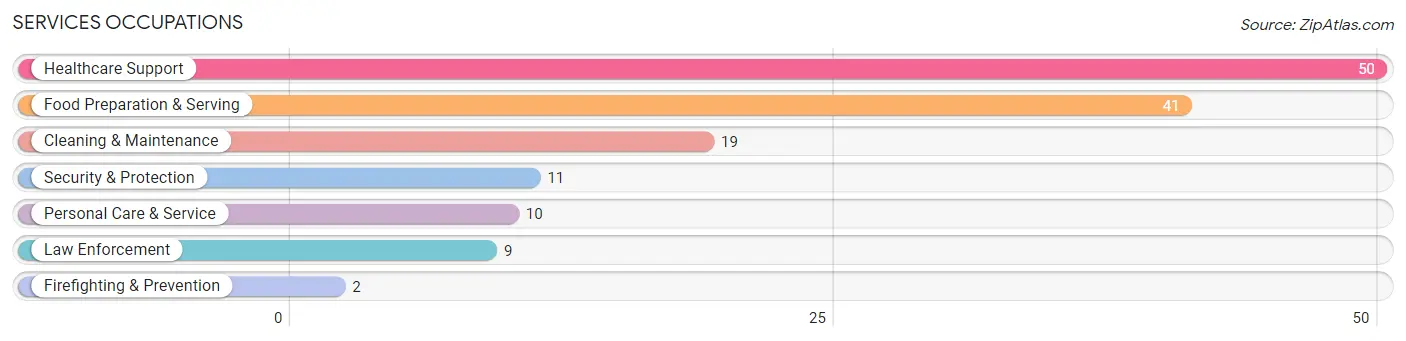
The most common Services occupations in South Fork borough are Healthcare Support (50 | 13.3%), Food Preparation & Serving (41 | 10.9%), Cleaning & Maintenance (19 | 5.1%), Security & Protection (11 | 2.9%), and Personal Care & Service (10 | 2.7%).
Services Occupations by Sex
Within the Services occupations in South Fork borough, the most male-oriented occupations are Security & Protection (100.0%), Firefighting & Prevention (100.0%), and Law Enforcement (100.0%), while the most female-oriented occupations are Personal Care & Service (100.0%), Healthcare Support (88.0%), and Food Preparation & Serving (82.9%).
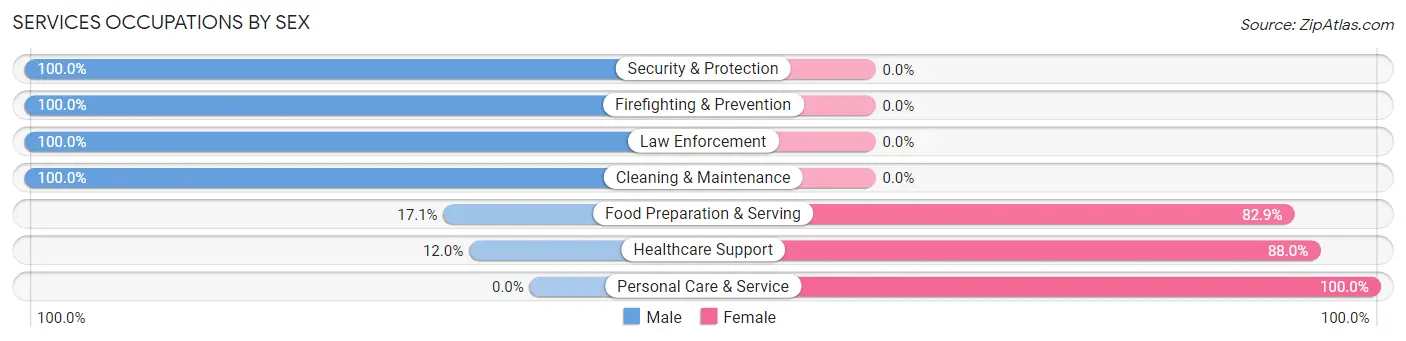
| Occupation | Male | Female |
| Healthcare Support | 6 (12.0%) | 44 (88.0%) |
| Security & Protection | 11 (100.0%) | 0 (0.0%) |
| Firefighting & Prevention | 2 (100.0%) | 0 (0.0%) |
| Law Enforcement | 9 (100.0%) | 0 (0.0%) |
| Food Preparation & Serving | 7 (17.1%) | 34 (82.9%) |
| Cleaning & Maintenance | 19 (100.0%) | 0 (0.0%) |
| Personal Care & Service | 0 (0.0%) | 10 (100.0%) |
| Total (Category) | 43 (32.8%) | 88 (67.2%) |
| Total (Overall) | 196 (52.3%) | 179 (47.7%) |
Sales and Office Occupations
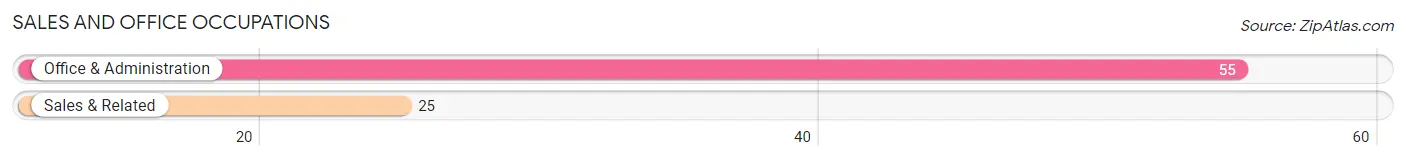
The most common Sales and Office occupations in South Fork borough are Office & Administration (55 | 14.7%), and Sales & Related (25 | 6.7%).
Sales and Office Occupations by Sex

| Occupation | Male | Female |
| Sales & Related | 4 (16.0%) | 21 (84.0%) |
| Office & Administration | 20 (36.4%) | 35 (63.6%) |
| Total (Category) | 24 (30.0%) | 56 (70.0%) |
| Total (Overall) | 196 (52.3%) | 179 (47.7%) |
Natural Resources, Construction and Maintenance Occupations
The most common Natural Resources, Construction and Maintenance occupations in South Fork borough are Installation, Maintenance & Repair (27 | 7.2%), and Construction & Extraction (13 | 3.5%).
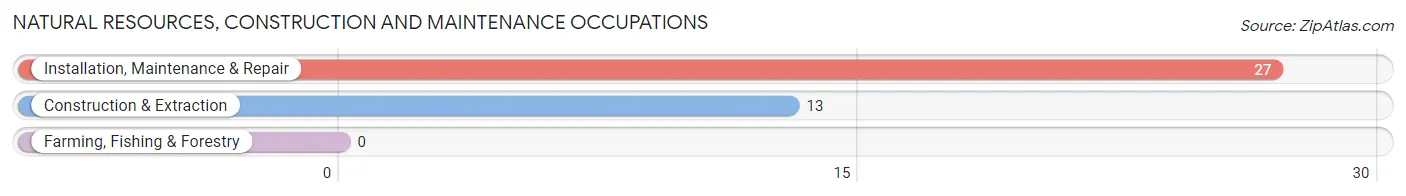
Natural Resources, Construction and Maintenance Occupations by Sex
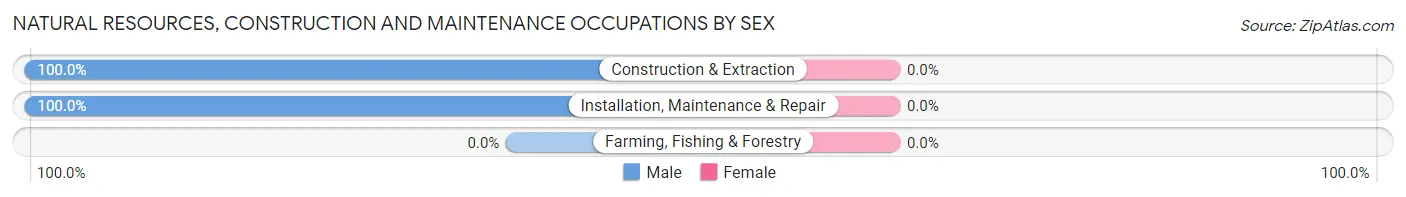
| Occupation | Male | Female |
| Farming, Fishing & Forestry | 0 (0.0%) | 0 (0.0%) |
| Construction & Extraction | 13 (100.0%) | 0 (0.0%) |
| Installation, Maintenance & Repair | 27 (100.0%) | 0 (0.0%) |
| Total (Category) | 40 (100.0%) | 0 (0.0%) |
| Total (Overall) | 196 (52.3%) | 179 (47.7%) |
Production, Transportation and Moving Occupations
The most common Production, Transportation and Moving occupations in South Fork borough are Production (31 | 8.3%), Transportation (16 | 4.3%), and Material Moving (8 | 2.1%).
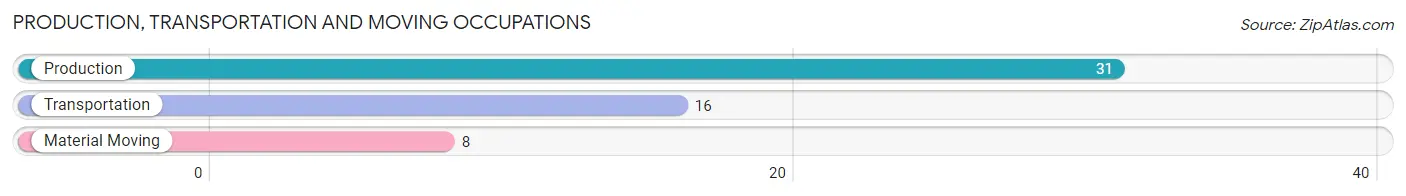
Production, Transportation and Moving Occupations by Sex
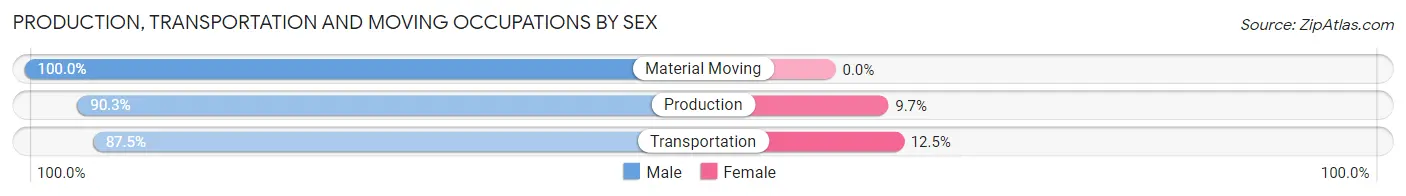
| Occupation | Male | Female |
| Production | 28 (90.3%) | 3 (9.7%) |
| Transportation | 14 (87.5%) | 2 (12.5%) |
| Material Moving | 8 (100.0%) | 0 (0.0%) |
| Total (Category) | 50 (90.9%) | 5 (9.1%) |
| Total (Overall) | 196 (52.3%) | 179 (47.7%) |
Employment Industries by Sex in South Fork borough
Employment Industries in South Fork borough
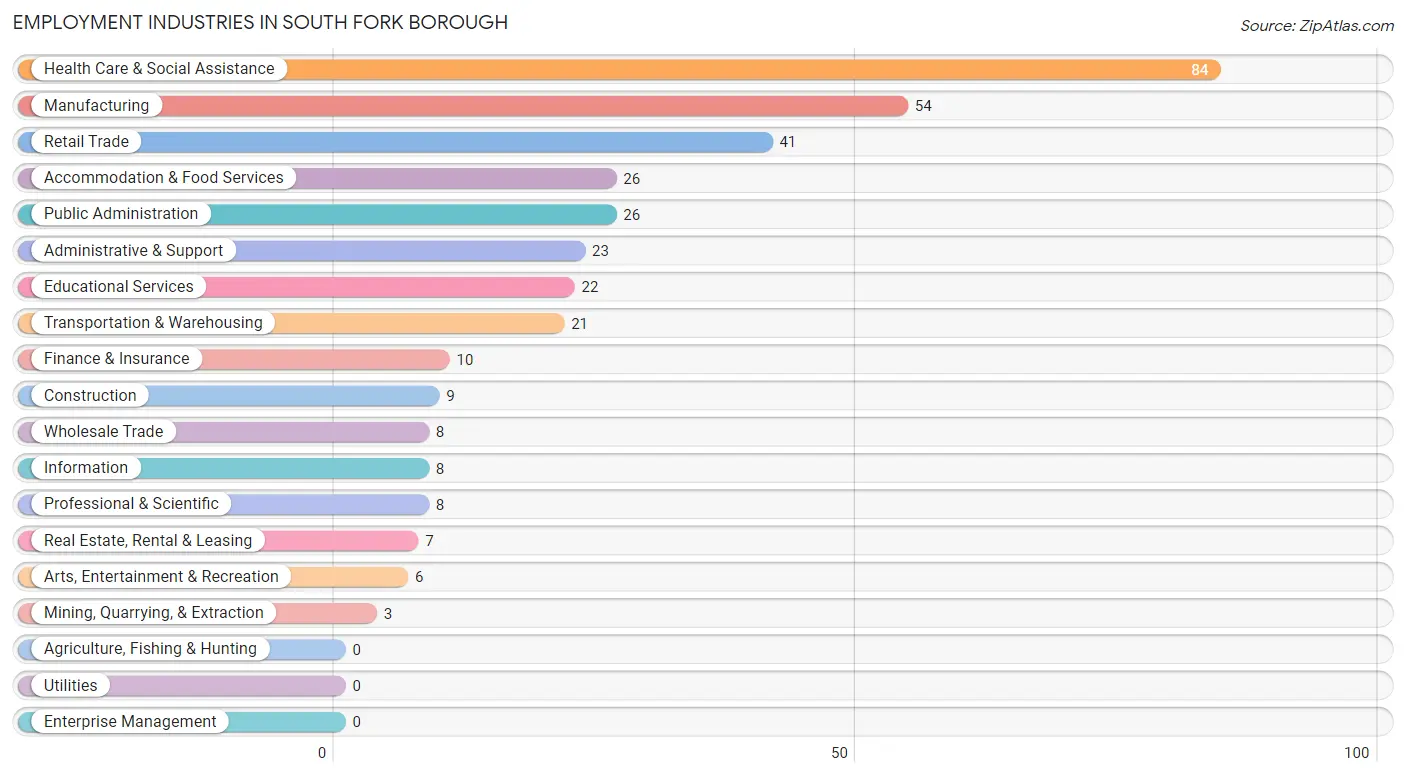
The major employment industries in South Fork borough include Health Care & Social Assistance (84 | 22.4%), Manufacturing (54 | 14.4%), Retail Trade (41 | 10.9%), Accommodation & Food Services (26 | 6.9%), and Public Administration (26 | 6.9%).
Employment Industries by Sex in South Fork borough
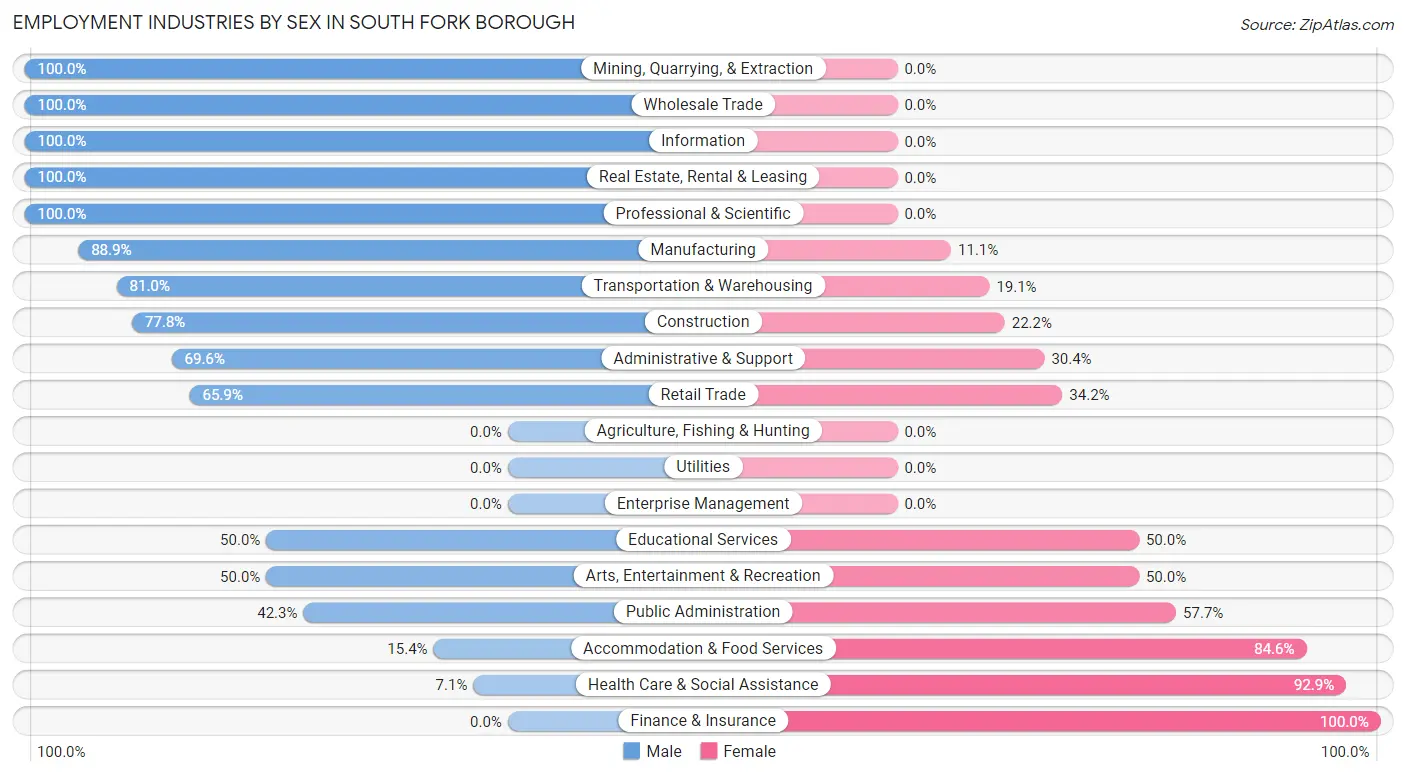
The South Fork borough industries that see more men than women are Mining, Quarrying, & Extraction (100.0%), Wholesale Trade (100.0%), and Information (100.0%), whereas the industries that tend to have a higher number of women are Finance & Insurance (100.0%), Health Care & Social Assistance (92.9%), and Accommodation & Food Services (84.6%).
| Industry | Male | Female |
| Agriculture, Fishing & Hunting | 0 (0.0%) | 0 (0.0%) |
| Mining, Quarrying, & Extraction | 3 (100.0%) | 0 (0.0%) |
| Construction | 7 (77.8%) | 2 (22.2%) |
| Manufacturing | 48 (88.9%) | 6 (11.1%) |
| Wholesale Trade | 8 (100.0%) | 0 (0.0%) |
| Retail Trade | 27 (65.8%) | 14 (34.2%) |
| Transportation & Warehousing | 17 (80.9%) | 4 (19.1%) |
| Utilities | 0 (0.0%) | 0 (0.0%) |
| Information | 8 (100.0%) | 0 (0.0%) |
| Finance & Insurance | 0 (0.0%) | 10 (100.0%) |
| Real Estate, Rental & Leasing | 7 (100.0%) | 0 (0.0%) |
| Professional & Scientific | 8 (100.0%) | 0 (0.0%) |
| Enterprise Management | 0 (0.0%) | 0 (0.0%) |
| Administrative & Support | 16 (69.6%) | 7 (30.4%) |
| Educational Services | 11 (50.0%) | 11 (50.0%) |
| Health Care & Social Assistance | 6 (7.1%) | 78 (92.9%) |
| Arts, Entertainment & Recreation | 3 (50.0%) | 3 (50.0%) |
| Accommodation & Food Services | 4 (15.4%) | 22 (84.6%) |
| Public Administration | 11 (42.3%) | 15 (57.7%) |
| Total | 196 (52.3%) | 179 (47.7%) |
Education in South Fork borough
School Enrollment in South Fork borough
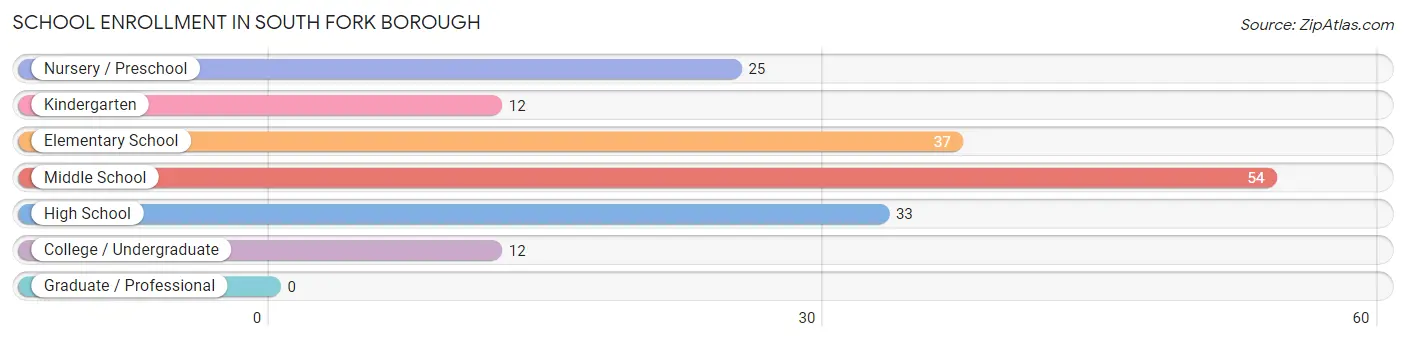
The most common levels of schooling among the 173 students in South Fork borough are middle school (54 | 31.2%), elementary school (37 | 21.4%), and high school (33 | 19.1%).
| School Level | # Students | % Students |
| Nursery / Preschool | 25 | 14.4% |
| Kindergarten | 12 | 6.9% |
| Elementary School | 37 | 21.4% |
| Middle School | 54 | 31.2% |
| High School | 33 | 19.1% |
| College / Undergraduate | 12 | 6.9% |
| Graduate / Professional | 0 | 0.0% |
| Total | 173 | 100.0% |
School Enrollment by Age by Funding Source in South Fork borough
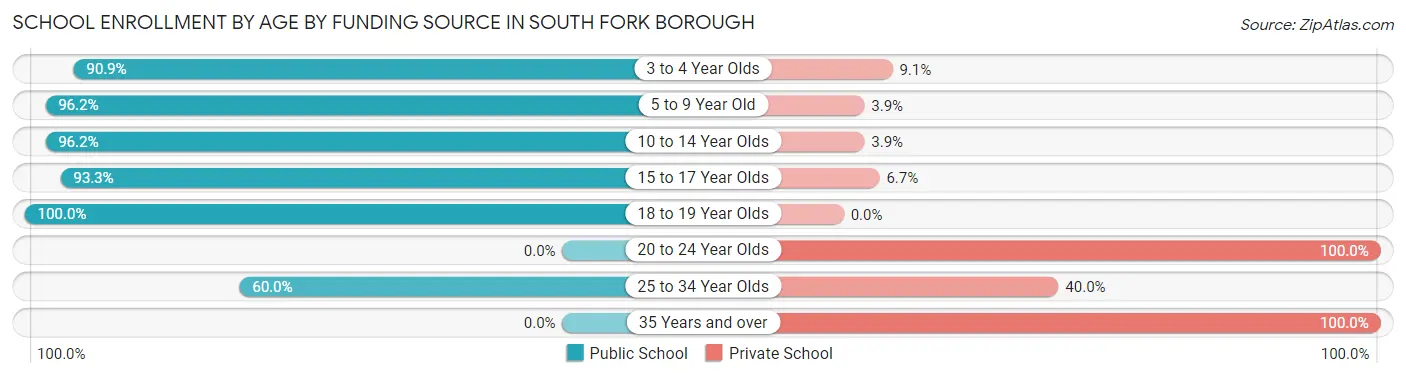
Out of a total of 173 students who are enrolled in schools in South Fork borough, 18 (10.4%) attend a private institution, while the remaining 155 (89.6%) are enrolled in public schools. The age group of 20 to 24 year olds has the highest likelihood of being enrolled in private schools, with 3 (100.0% in the age bracket) enrolled. Conversely, the age group of 18 to 19 year olds has the lowest likelihood of being enrolled in a private school, with 4 (100.0% in the age bracket) attending a public institution.
| Age Bracket | Public School | Private School |
| 3 to 4 Year Olds | 20 (90.9%) | 2 (9.1%) |
| 5 to 9 Year Old | 50 (96.2%) | 2 (3.8%) |
| 10 to 14 Year Olds | 50 (96.2%) | 2 (3.8%) |
| 15 to 17 Year Olds | 28 (93.3%) | 2 (6.7%) |
| 18 to 19 Year Olds | 4 (100.0%) | 0 (0.0%) |
| 20 to 24 Year Olds | 0 (0.0%) | 3 (100.0%) |
| 25 to 34 Year Olds | 3 (60.0%) | 2 (40.0%) |
| 35 Years and over | 0 (0.0%) | 5 (100.0%) |
| Total | 155 (89.6%) | 18 (10.4%) |
Educational Attainment by Field of Study in South Fork borough
Business (17 | 35.4%), psychology (7 | 14.6%), literature & languages (7 | 14.6%), engineering (5 | 10.4%), and computers & mathematics (3 | 6.2%) are the most common fields of study among 48 individuals in South Fork borough who have obtained a bachelor's degree or higher.
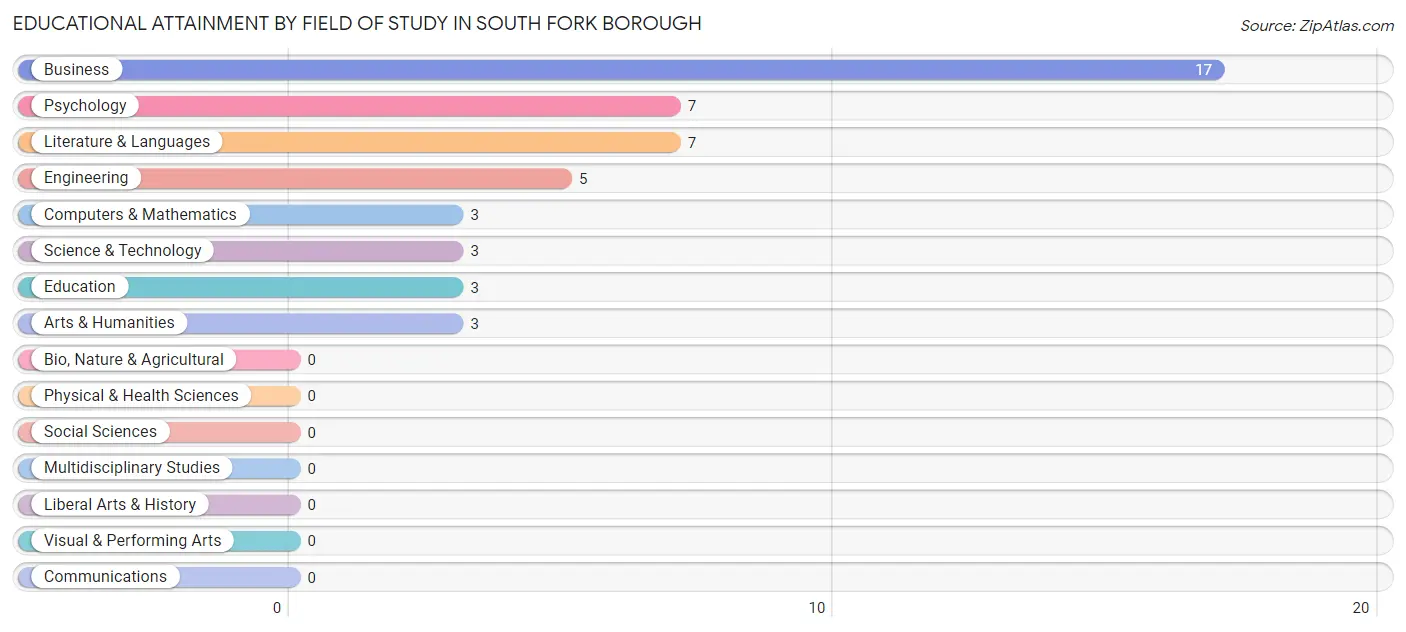
| Field of Study | # Graduates | % Graduates |
| Computers & Mathematics | 3 | 6.2% |
| Bio, Nature & Agricultural | 0 | 0.0% |
| Physical & Health Sciences | 0 | 0.0% |
| Psychology | 7 | 14.6% |
| Social Sciences | 0 | 0.0% |
| Engineering | 5 | 10.4% |
| Multidisciplinary Studies | 0 | 0.0% |
| Science & Technology | 3 | 6.2% |
| Business | 17 | 35.4% |
| Education | 3 | 6.2% |
| Literature & Languages | 7 | 14.6% |
| Liberal Arts & History | 0 | 0.0% |
| Visual & Performing Arts | 0 | 0.0% |
| Communications | 0 | 0.0% |
| Arts & Humanities | 3 | 6.2% |
| Total | 48 | 100.0% |
Transportation & Commute in South Fork borough
Vehicle Availability by Sex in South Fork borough
The most prevalent vehicle ownership categories in South Fork borough are males with 1 vehicle (66, accounting for 33.7%) and females with 1 vehicle (49, making up 36.9%).
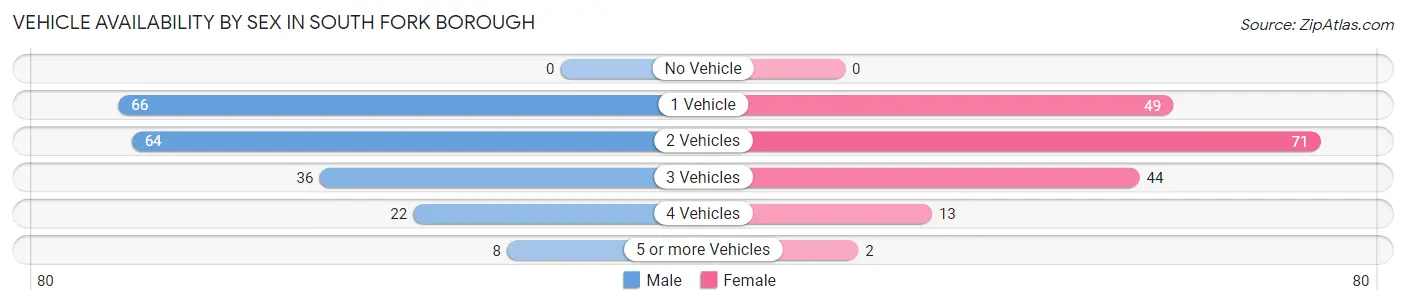
| Vehicles Available | Male | Female |
| No Vehicle | 0 (0.0%) | 0 (0.0%) |
| 1 Vehicle | 66 (33.7%) | 49 (27.4%) |
| 2 Vehicles | 64 (32.7%) | 71 (39.7%) |
| 3 Vehicles | 36 (18.4%) | 44 (24.6%) |
| 4 Vehicles | 22 (11.2%) | 13 (7.3%) |
| 5 or more Vehicles | 8 (4.1%) | 2 (1.1%) |
| Total | 196 (100.0%) | 179 (100.0%) |
Commute Time in South Fork borough
The most frequently occuring commute durations in South Fork borough are 15 to 19 minutes (82 commuters, 23.9%), 20 to 24 minutes (70 commuters, 20.4%), and 5 to 9 minutes (42 commuters, 12.2%).
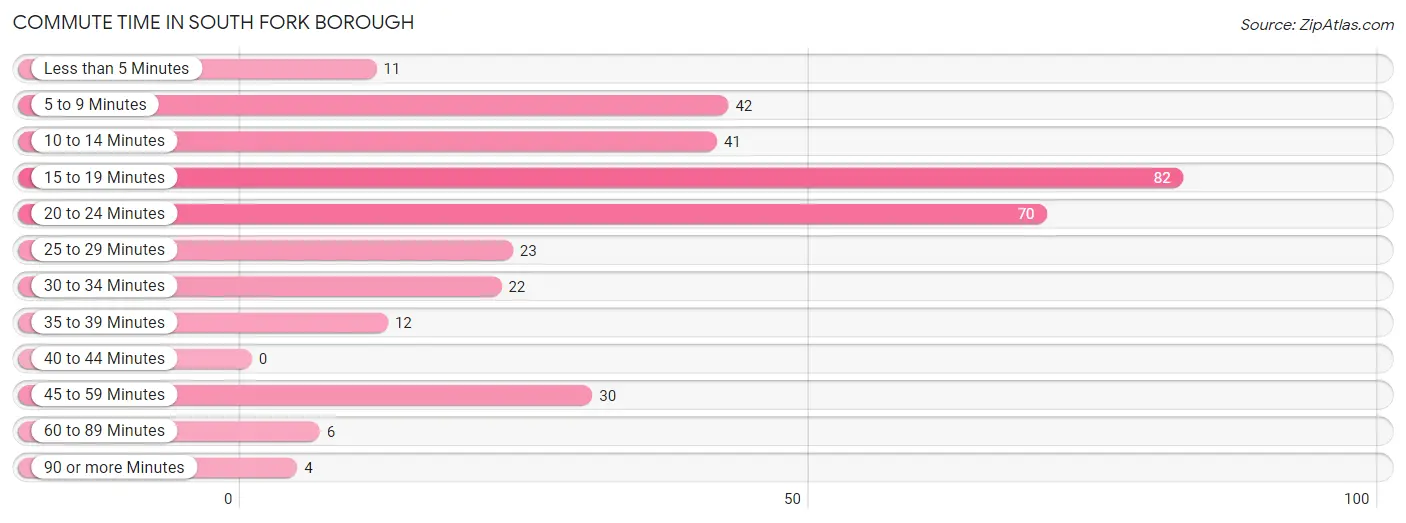
| Commute Time | # Commuters | % Commuters |
| Less than 5 Minutes | 11 | 3.2% |
| 5 to 9 Minutes | 42 | 12.2% |
| 10 to 14 Minutes | 41 | 11.9% |
| 15 to 19 Minutes | 82 | 23.9% |
| 20 to 24 Minutes | 70 | 20.4% |
| 25 to 29 Minutes | 23 | 6.7% |
| 30 to 34 Minutes | 22 | 6.4% |
| 35 to 39 Minutes | 12 | 3.5% |
| 40 to 44 Minutes | 0 | 0.0% |
| 45 to 59 Minutes | 30 | 8.7% |
| 60 to 89 Minutes | 6 | 1.8% |
| 90 or more Minutes | 4 | 1.2% |
Commute Time by Sex in South Fork borough
The most common commute times in South Fork borough are 15 to 19 minutes (47 commuters, 25.5%) for males and 20 to 24 minutes (37 commuters, 23.3%) for females.
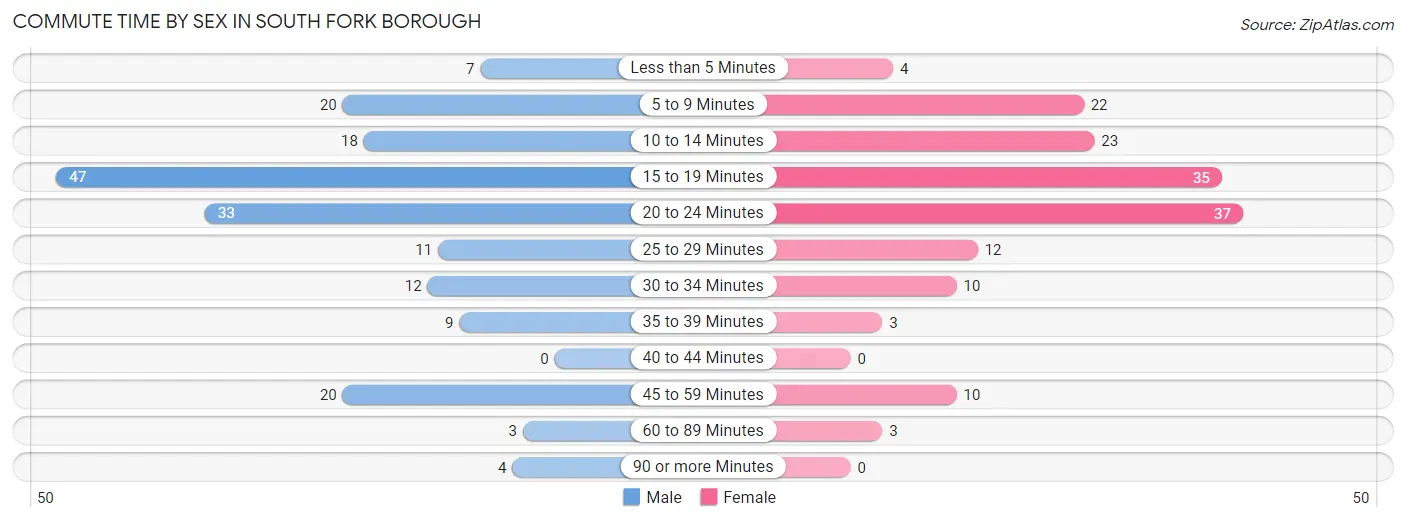
| Commute Time | Male | Female |
| Less than 5 Minutes | 7 (3.8%) | 4 (2.5%) |
| 5 to 9 Minutes | 20 (10.9%) | 22 (13.8%) |
| 10 to 14 Minutes | 18 (9.8%) | 23 (14.5%) |
| 15 to 19 Minutes | 47 (25.5%) | 35 (22.0%) |
| 20 to 24 Minutes | 33 (17.9%) | 37 (23.3%) |
| 25 to 29 Minutes | 11 (6.0%) | 12 (7.5%) |
| 30 to 34 Minutes | 12 (6.5%) | 10 (6.3%) |
| 35 to 39 Minutes | 9 (4.9%) | 3 (1.9%) |
| 40 to 44 Minutes | 0 (0.0%) | 0 (0.0%) |
| 45 to 59 Minutes | 20 (10.9%) | 10 (6.3%) |
| 60 to 89 Minutes | 3 (1.6%) | 3 (1.9%) |
| 90 or more Minutes | 4 (2.2%) | 0 (0.0%) |
Time of Departure to Work by Sex in South Fork borough
The most frequent times of departure to work in South Fork borough are 7:00 AM to 7:29 AM (28, 15.2%) for males and 7:30 AM to 7:59 AM (48, 30.2%) for females.
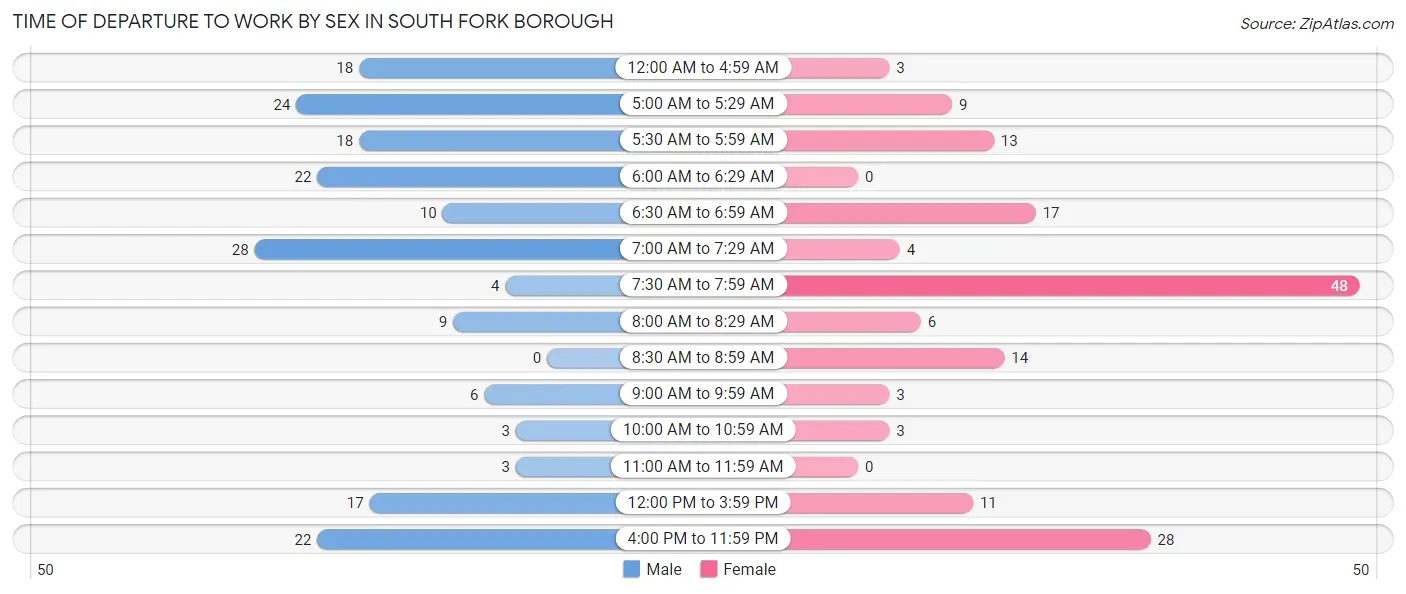
| Time of Departure | Male | Female |
| 12:00 AM to 4:59 AM | 18 (9.8%) | 3 (1.9%) |
| 5:00 AM to 5:29 AM | 24 (13.0%) | 9 (5.7%) |
| 5:30 AM to 5:59 AM | 18 (9.8%) | 13 (8.2%) |
| 6:00 AM to 6:29 AM | 22 (12.0%) | 0 (0.0%) |
| 6:30 AM to 6:59 AM | 10 (5.4%) | 17 (10.7%) |
| 7:00 AM to 7:29 AM | 28 (15.2%) | 4 (2.5%) |
| 7:30 AM to 7:59 AM | 4 (2.2%) | 48 (30.2%) |
| 8:00 AM to 8:29 AM | 9 (4.9%) | 6 (3.8%) |
| 8:30 AM to 8:59 AM | 0 (0.0%) | 14 (8.8%) |
| 9:00 AM to 9:59 AM | 6 (3.3%) | 3 (1.9%) |
| 10:00 AM to 10:59 AM | 3 (1.6%) | 3 (1.9%) |
| 11:00 AM to 11:59 AM | 3 (1.6%) | 0 (0.0%) |
| 12:00 PM to 3:59 PM | 17 (9.2%) | 11 (6.9%) |
| 4:00 PM to 11:59 PM | 22 (12.0%) | 28 (17.6%) |
| Total | 184 (100.0%) | 159 (100.0%) |
Housing Occupancy in South Fork borough
Occupancy by Ownership in South Fork borough
Of the total 388 dwellings in South Fork borough, owner-occupied units account for 264 (68.0%), while renter-occupied units make up 124 (32.0%).
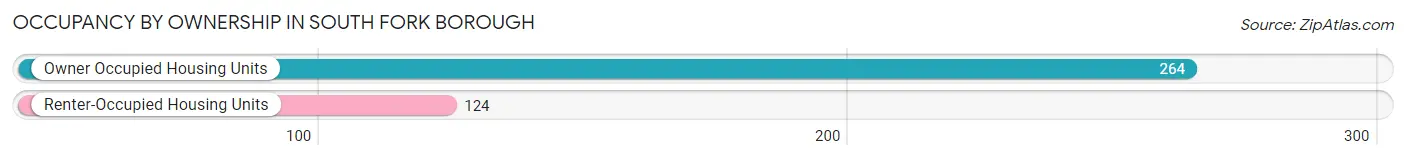
| Occupancy | # Housing Units | % Housing Units |
| Owner Occupied Housing Units | 264 | 68.0% |
| Renter-Occupied Housing Units | 124 | 32.0% |
| Total Occupied Housing Units | 388 | 100.0% |
Occupancy by Household Size in South Fork borough
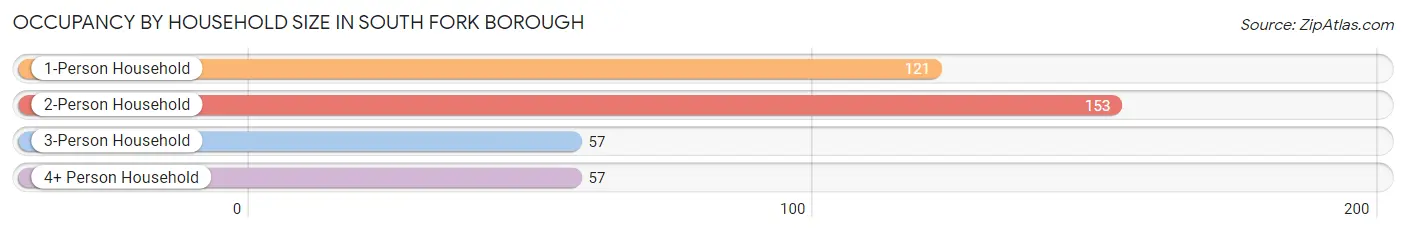
| Household Size | # Housing Units | % Housing Units |
| 1-Person Household | 121 | 31.2% |
| 2-Person Household | 153 | 39.4% |
| 3-Person Household | 57 | 14.7% |
| 4+ Person Household | 57 | 14.7% |
| Total Housing Units | 388 | 100.0% |
Occupancy by Ownership by Household Size in South Fork borough
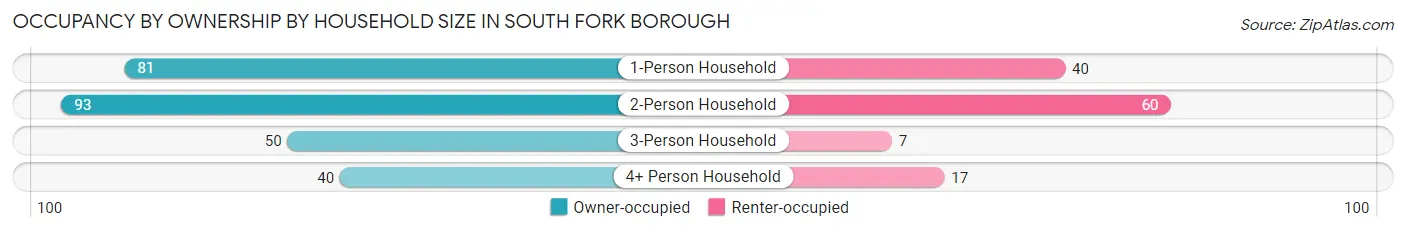
| Household Size | Owner-occupied | Renter-occupied |
| 1-Person Household | 81 (66.9%) | 40 (33.1%) |
| 2-Person Household | 93 (60.8%) | 60 (39.2%) |
| 3-Person Household | 50 (87.7%) | 7 (12.3%) |
| 4+ Person Household | 40 (70.2%) | 17 (29.8%) |
| Total Housing Units | 264 (68.0%) | 124 (32.0%) |
Occupancy by Educational Attainment in South Fork borough
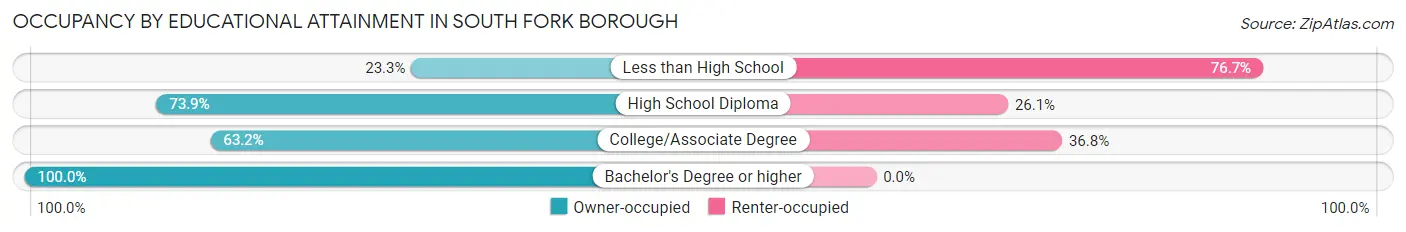
| Household Size | Owner-occupied | Renter-occupied |
| Less than High School | 7 (23.3%) | 23 (76.7%) |
| High School Diploma | 147 (73.9%) | 52 (26.1%) |
| College/Associate Degree | 84 (63.2%) | 49 (36.8%) |
| Bachelor's Degree or higher | 26 (100.0%) | 0 (0.0%) |
Occupancy by Age of Householder in South Fork borough
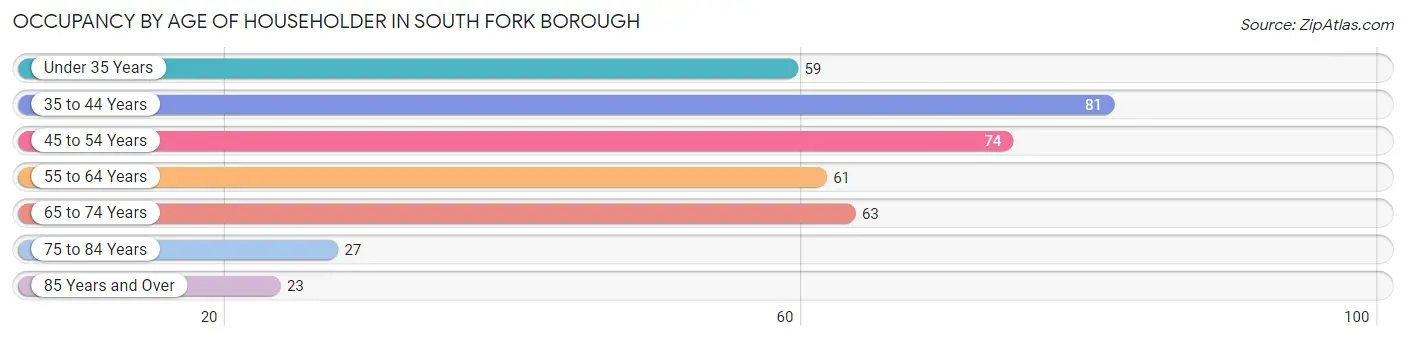
| Age Bracket | # Households | % Households |
| Under 35 Years | 59 | 15.2% |
| 35 to 44 Years | 81 | 20.9% |
| 45 to 54 Years | 74 | 19.1% |
| 55 to 64 Years | 61 | 15.7% |
| 65 to 74 Years | 63 | 16.2% |
| 75 to 84 Years | 27 | 7.0% |
| 85 Years and Over | 23 | 5.9% |
| Total | 388 | 100.0% |
Housing Finances in South Fork borough
Median Income by Occupancy in South Fork borough
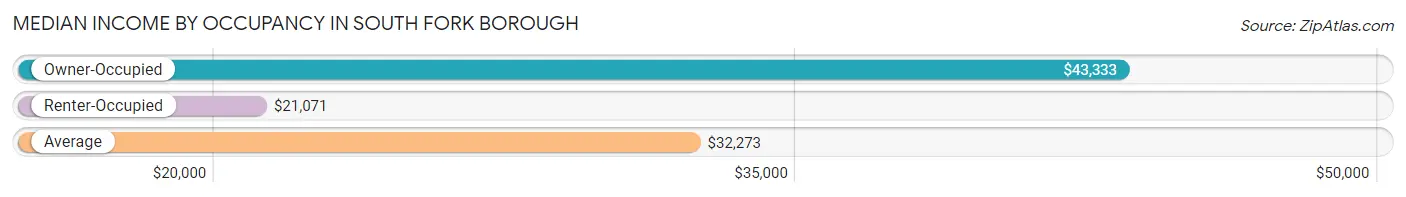
| Occupancy Type | # Households | Median Income |
| Owner-Occupied | 264 (68.0%) | $43,333 |
| Renter-Occupied | 124 (32.0%) | $21,071 |
| Average | 388 (100.0%) | $32,273 |
Occupancy by Householder Income Bracket in South Fork borough
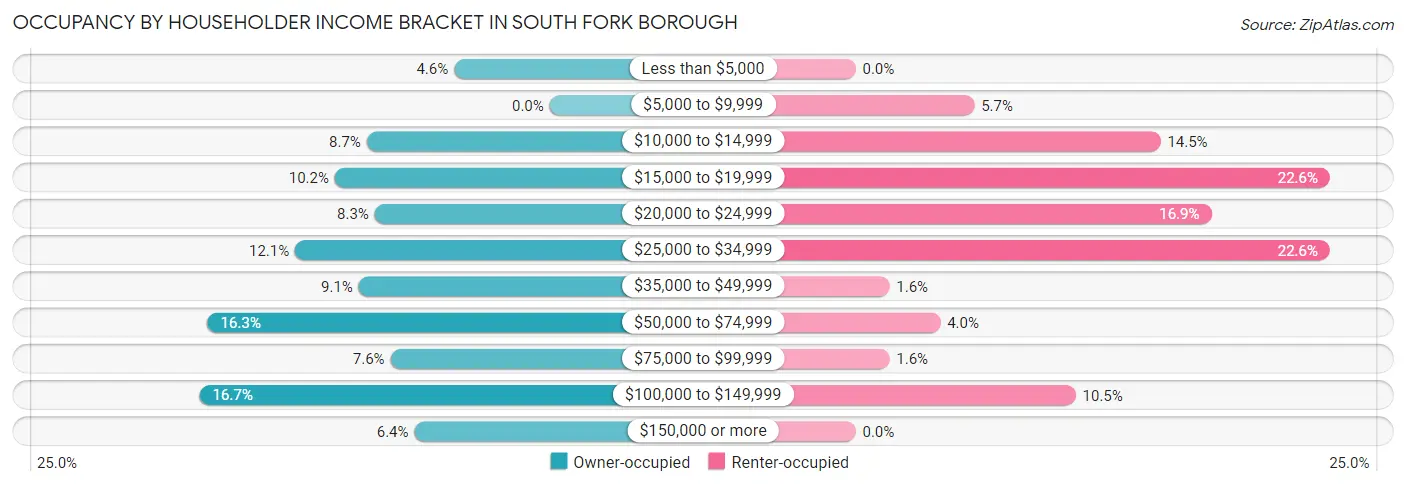
| Income Bracket | Owner-occupied | Renter-occupied |
| Less than $5,000 | 12 (4.5%) | 0 (0.0%) |
| $5,000 to $9,999 | 0 (0.0%) | 7 (5.7%) |
| $10,000 to $14,999 | 23 (8.7%) | 18 (14.5%) |
| $15,000 to $19,999 | 27 (10.2%) | 28 (22.6%) |
| $20,000 to $24,999 | 22 (8.3%) | 21 (16.9%) |
| $25,000 to $34,999 | 32 (12.1%) | 28 (22.6%) |
| $35,000 to $49,999 | 24 (9.1%) | 2 (1.6%) |
| $50,000 to $74,999 | 43 (16.3%) | 5 (4.0%) |
| $75,000 to $99,999 | 20 (7.6%) | 2 (1.6%) |
| $100,000 to $149,999 | 44 (16.7%) | 13 (10.5%) |
| $150,000 or more | 17 (6.4%) | 0 (0.0%) |
| Total | 264 (100.0%) | 124 (100.0%) |
Monthly Housing Cost Tiers in South Fork borough
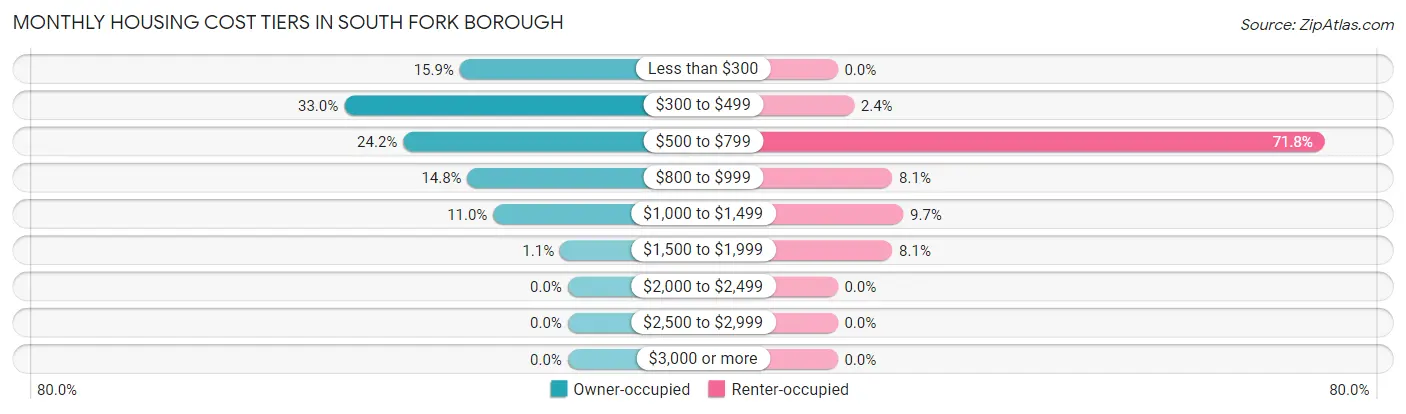
| Monthly Cost | Owner-occupied | Renter-occupied |
| Less than $300 | 42 (15.9%) | 0 (0.0%) |
| $300 to $499 | 87 (33.0%) | 3 (2.4%) |
| $500 to $799 | 64 (24.2%) | 89 (71.8%) |
| $800 to $999 | 39 (14.8%) | 10 (8.1%) |
| $1,000 to $1,499 | 29 (11.0%) | 12 (9.7%) |
| $1,500 to $1,999 | 3 (1.1%) | 10 (8.1%) |
| $2,000 to $2,499 | 0 (0.0%) | 0 (0.0%) |
| $2,500 to $2,999 | 0 (0.0%) | 0 (0.0%) |
| $3,000 or more | 0 (0.0%) | 0 (0.0%) |
| Total | 264 (100.0%) | 124 (100.0%) |
Physical Housing Characteristics in South Fork borough
Housing Structures in South Fork borough
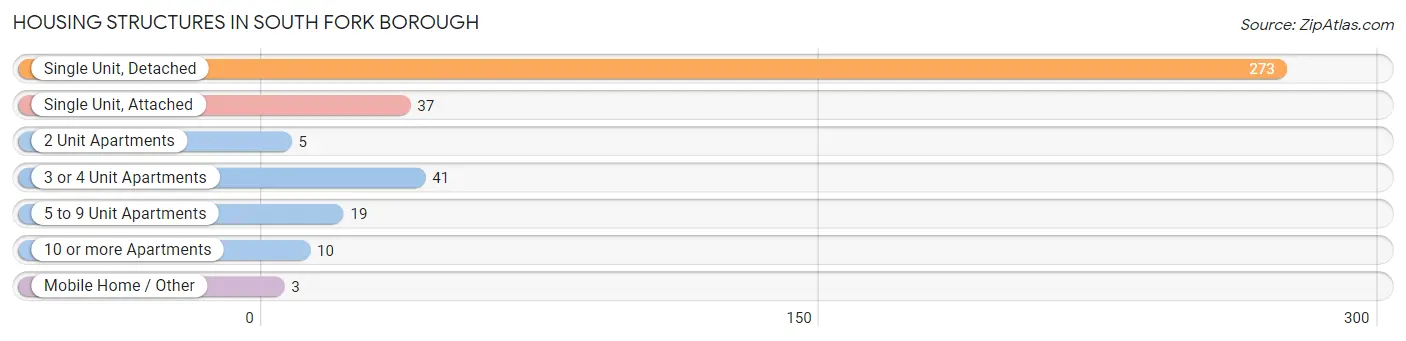
| Structure Type | # Housing Units | % Housing Units |
| Single Unit, Detached | 273 | 70.4% |
| Single Unit, Attached | 37 | 9.5% |
| 2 Unit Apartments | 5 | 1.3% |
| 3 or 4 Unit Apartments | 41 | 10.6% |
| 5 to 9 Unit Apartments | 19 | 4.9% |
| 10 or more Apartments | 10 | 2.6% |
| Mobile Home / Other | 3 | 0.8% |
| Total | 388 | 100.0% |
Housing Structures by Occupancy in South Fork borough
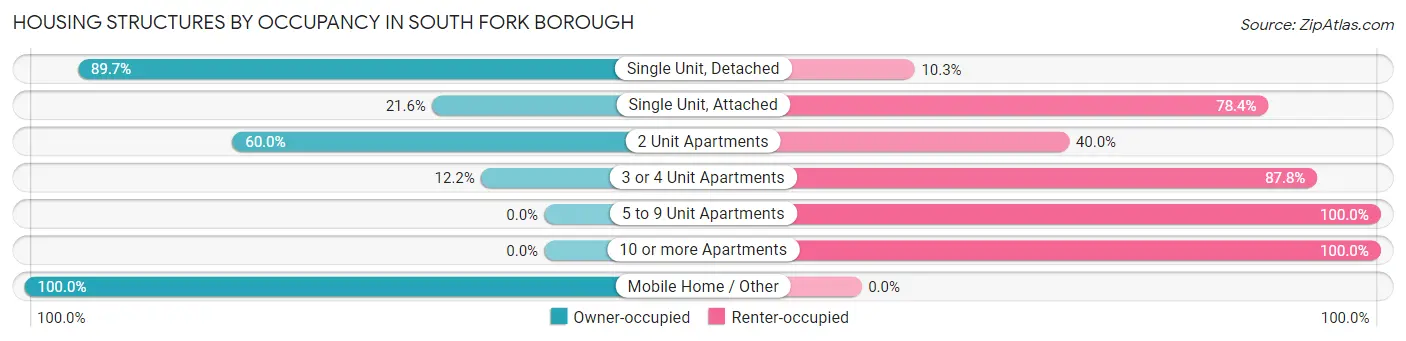
| Structure Type | Owner-occupied | Renter-occupied |
| Single Unit, Detached | 245 (89.7%) | 28 (10.3%) |
| Single Unit, Attached | 8 (21.6%) | 29 (78.4%) |
| 2 Unit Apartments | 3 (60.0%) | 2 (40.0%) |
| 3 or 4 Unit Apartments | 5 (12.2%) | 36 (87.8%) |
| 5 to 9 Unit Apartments | 0 (0.0%) | 19 (100.0%) |
| 10 or more Apartments | 0 (0.0%) | 10 (100.0%) |
| Mobile Home / Other | 3 (100.0%) | 0 (0.0%) |
| Total | 264 (68.0%) | 124 (32.0%) |
Housing Structures by Number of Rooms in South Fork borough
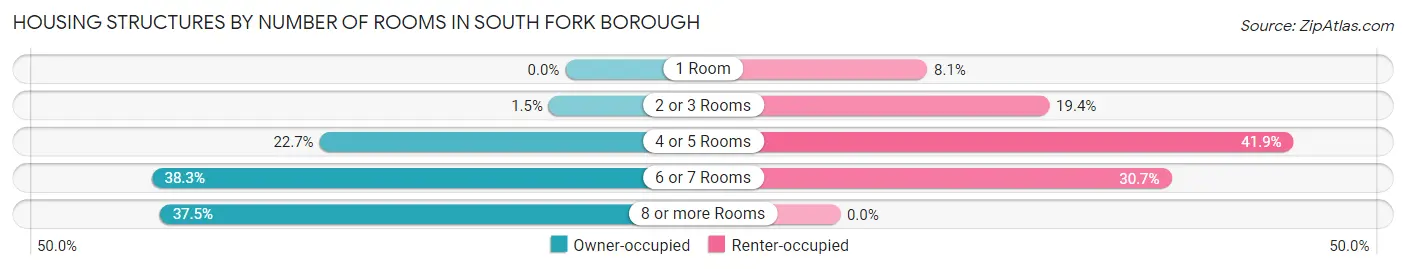
| Number of Rooms | Owner-occupied | Renter-occupied |
| 1 Room | 0 (0.0%) | 10 (8.1%) |
| 2 or 3 Rooms | 4 (1.5%) | 24 (19.4%) |
| 4 or 5 Rooms | 60 (22.7%) | 52 (41.9%) |
| 6 or 7 Rooms | 101 (38.3%) | 38 (30.6%) |
| 8 or more Rooms | 99 (37.5%) | 0 (0.0%) |
| Total | 264 (100.0%) | 124 (100.0%) |
Housing Structure by Heating Type in South Fork borough
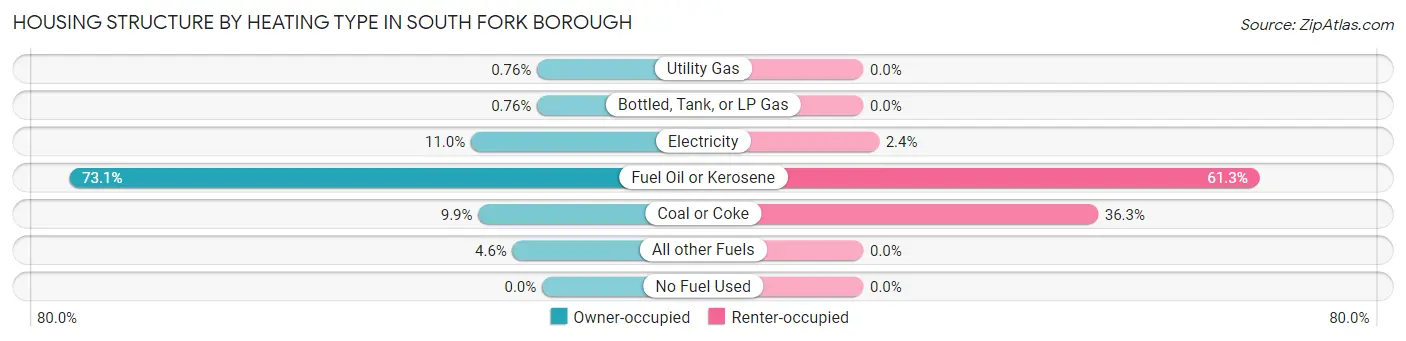
| Heating Type | Owner-occupied | Renter-occupied |
| Utility Gas | 2 (0.8%) | 0 (0.0%) |
| Bottled, Tank, or LP Gas | 2 (0.8%) | 0 (0.0%) |
| Electricity | 29 (11.0%) | 3 (2.4%) |
| Fuel Oil or Kerosene | 193 (73.1%) | 76 (61.3%) |
| Coal or Coke | 26 (9.9%) | 45 (36.3%) |
| All other Fuels | 12 (4.5%) | 0 (0.0%) |
| No Fuel Used | 0 (0.0%) | 0 (0.0%) |
| Total | 264 (100.0%) | 124 (100.0%) |
Household Vehicle Usage in South Fork borough
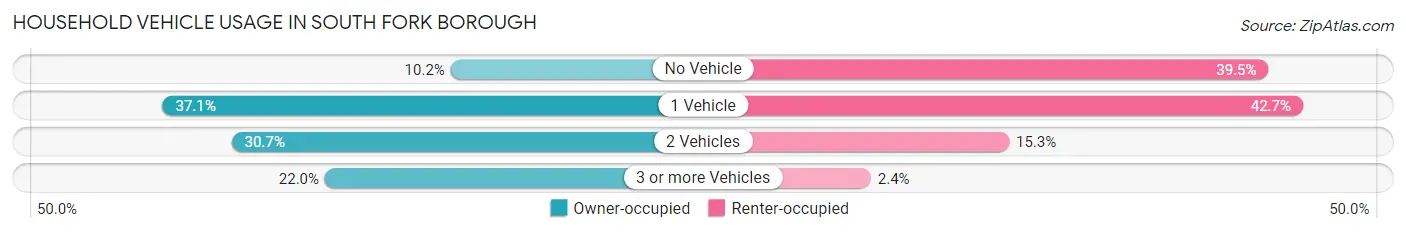
| Vehicles per Household | Owner-occupied | Renter-occupied |
| No Vehicle | 27 (10.2%) | 49 (39.5%) |
| 1 Vehicle | 98 (37.1%) | 53 (42.7%) |
| 2 Vehicles | 81 (30.7%) | 19 (15.3%) |
| 3 or more Vehicles | 58 (22.0%) | 3 (2.4%) |
| Total | 264 (100.0%) | 124 (100.0%) |
Real Estate & Mortgages in South Fork borough
Real Estate and Mortgage Overview in South Fork borough
| Characteristic | Without Mortgage | With Mortgage |
| Housing Units | 166 | 98 |
| Median Property Value | $44,100 | $60,000 |
| Median Household Income | $30,833 | $0 |
| Monthly Housing Costs | $377 | $0 |
| Real Estate Taxes | $665 | $0 |
Property Value by Mortgage Status in South Fork borough
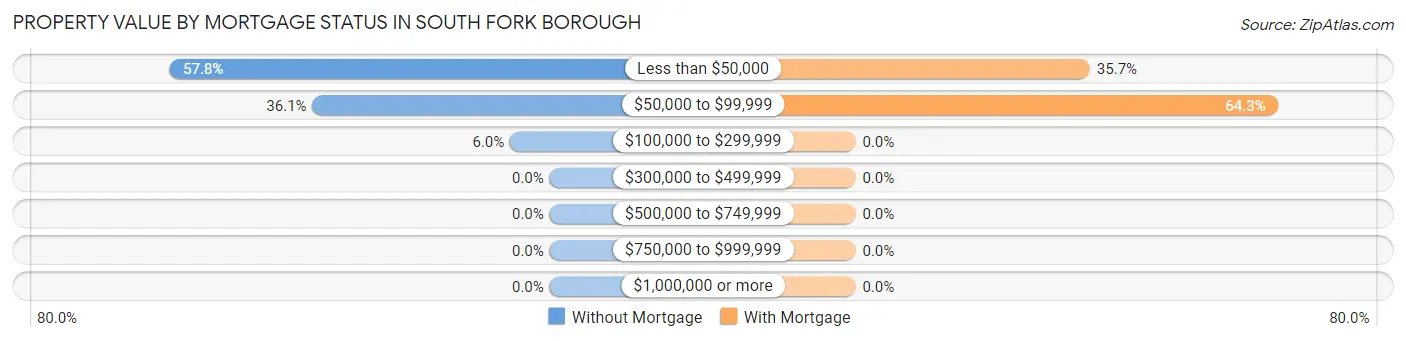
| Property Value | Without Mortgage | With Mortgage |
| Less than $50,000 | 96 (57.8%) | 35 (35.7%) |
| $50,000 to $99,999 | 60 (36.1%) | 63 (64.3%) |
| $100,000 to $299,999 | 10 (6.0%) | 0 (0.0%) |
| $300,000 to $499,999 | 0 (0.0%) | 0 (0.0%) |
| $500,000 to $749,999 | 0 (0.0%) | 0 (0.0%) |
| $750,000 to $999,999 | 0 (0.0%) | 0 (0.0%) |
| $1,000,000 or more | 0 (0.0%) | 0 (0.0%) |
| Total | 166 (100.0%) | 98 (100.0%) |
Household Income by Mortgage Status in South Fork borough
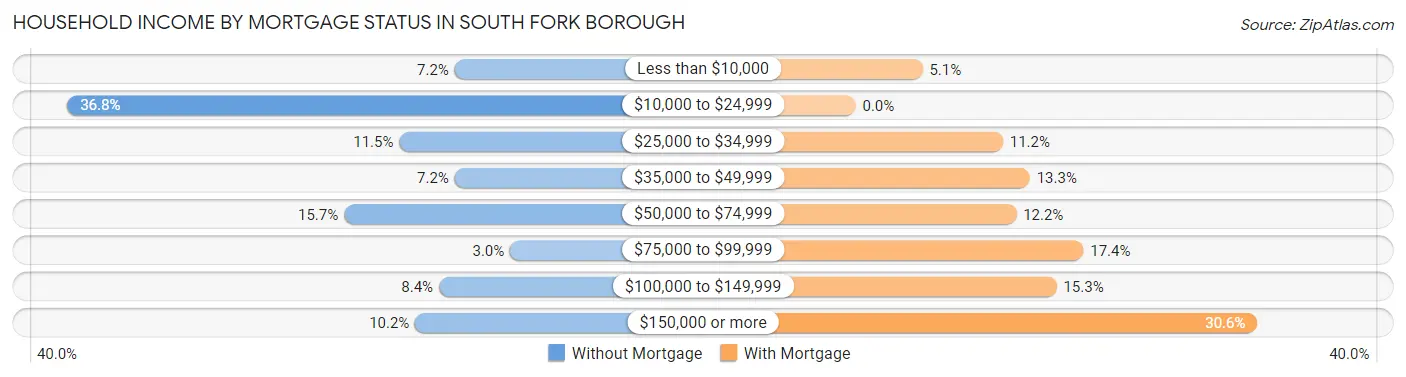
| Household Income | Without Mortgage | With Mortgage |
| Less than $10,000 | 12 (7.2%) | 5 (5.1%) |
| $10,000 to $24,999 | 61 (36.7%) | 0 (0.0%) |
| $25,000 to $34,999 | 19 (11.5%) | 11 (11.2%) |
| $35,000 to $49,999 | 12 (7.2%) | 13 (13.3%) |
| $50,000 to $74,999 | 26 (15.7%) | 12 (12.2%) |
| $75,000 to $99,999 | 5 (3.0%) | 17 (17.3%) |
| $100,000 to $149,999 | 14 (8.4%) | 15 (15.3%) |
| $150,000 or more | 17 (10.2%) | 30 (30.6%) |
| Total | 166 (100.0%) | 98 (100.0%) |
Property Value to Household Income Ratio in South Fork borough
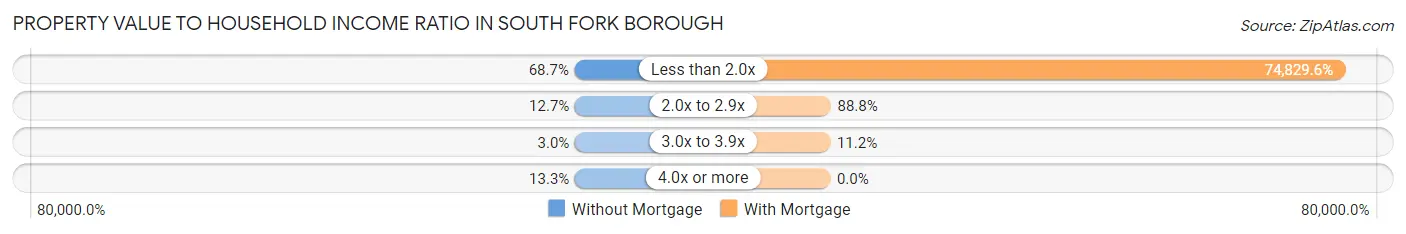
| Value-to-Income Ratio | Without Mortgage | With Mortgage |
| Less than 2.0x | 114 (68.7%) | 73,333 (74,829.6%) |
| 2.0x to 2.9x | 21 (12.7%) | 87 (88.8%) |
| 3.0x to 3.9x | 5 (3.0%) | 11 (11.2%) |
| 4.0x or more | 22 (13.3%) | 0 (0.0%) |
| Total | 166 (100.0%) | 98 (100.0%) |
Real Estate Taxes by Mortgage Status in South Fork borough
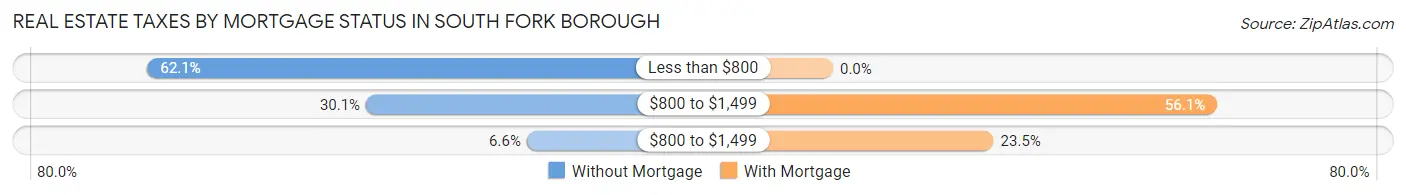
| Property Taxes | Without Mortgage | With Mortgage |
| Less than $800 | 103 (62.1%) | 0 (0.0%) |
| $800 to $1,499 | 50 (30.1%) | 55 (56.1%) |
| $800 to $1,499 | 11 (6.6%) | 23 (23.5%) |
| Total | 166 (100.0%) | 98 (100.0%) |
Health & Disability in South Fork borough
Health Insurance Coverage by Age in South Fork borough
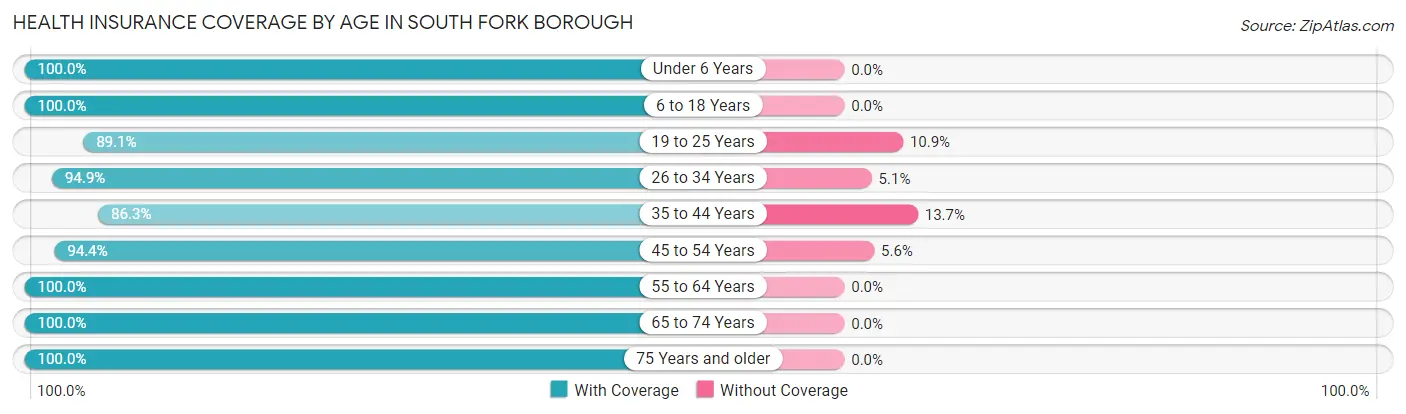
| Age Bracket | With Coverage | Without Coverage |
| Under 6 Years | 79 (100.0%) | 0 (0.0%) |
| 6 to 18 Years | 132 (100.0%) | 0 (0.0%) |
| 19 to 25 Years | 57 (89.1%) | 7 (10.9%) |
| 26 to 34 Years | 93 (94.9%) | 5 (5.1%) |
| 35 to 44 Years | 107 (86.3%) | 17 (13.7%) |
| 45 to 54 Years | 119 (94.4%) | 7 (5.6%) |
| 55 to 64 Years | 97 (100.0%) | 0 (0.0%) |
| 65 to 74 Years | 82 (100.0%) | 0 (0.0%) |
| 75 Years and older | 62 (100.0%) | 0 (0.0%) |
| Total | 828 (95.8%) | 36 (4.2%) |
Health Insurance Coverage by Citizenship Status in South Fork borough
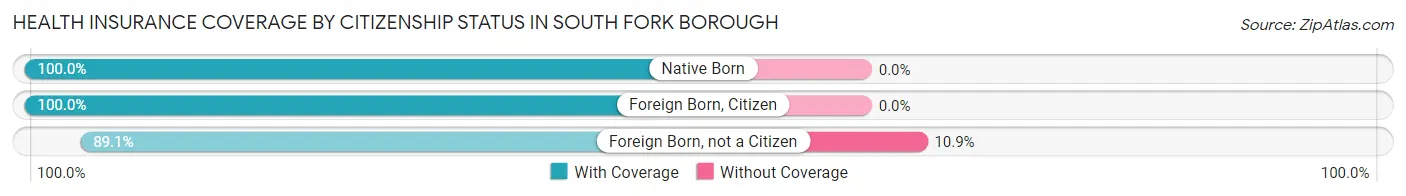
| Citizenship Status | With Coverage | Without Coverage |
| Native Born | 79 (100.0%) | 0 (0.0%) |
| Foreign Born, Citizen | 132 (100.0%) | 0 (0.0%) |
| Foreign Born, not a Citizen | 57 (89.1%) | 7 (10.9%) |
Health Insurance Coverage by Household Income in South Fork borough
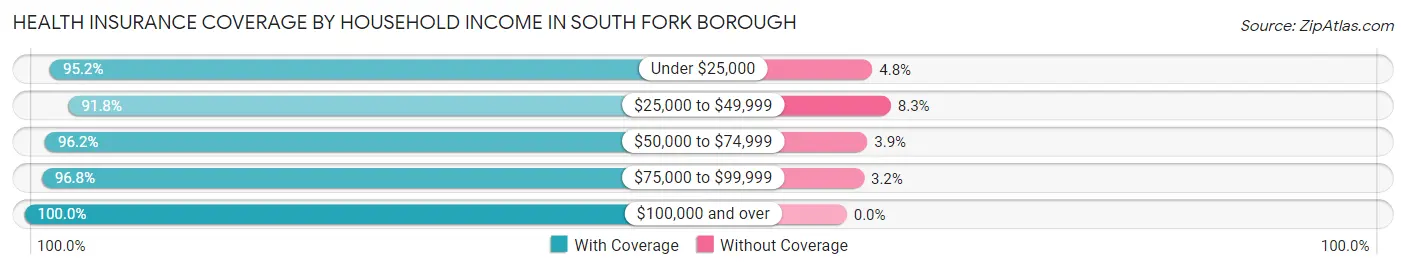
| Household Income | With Coverage | Without Coverage |
| Under $25,000 | 239 (95.2%) | 12 (4.8%) |
| $25,000 to $49,999 | 189 (91.7%) | 17 (8.3%) |
| $50,000 to $74,999 | 125 (96.2%) | 5 (3.8%) |
| $75,000 to $99,999 | 60 (96.8%) | 2 (3.2%) |
| $100,000 and over | 215 (100.0%) | 0 (0.0%) |
Public vs Private Health Insurance Coverage by Age in South Fork borough
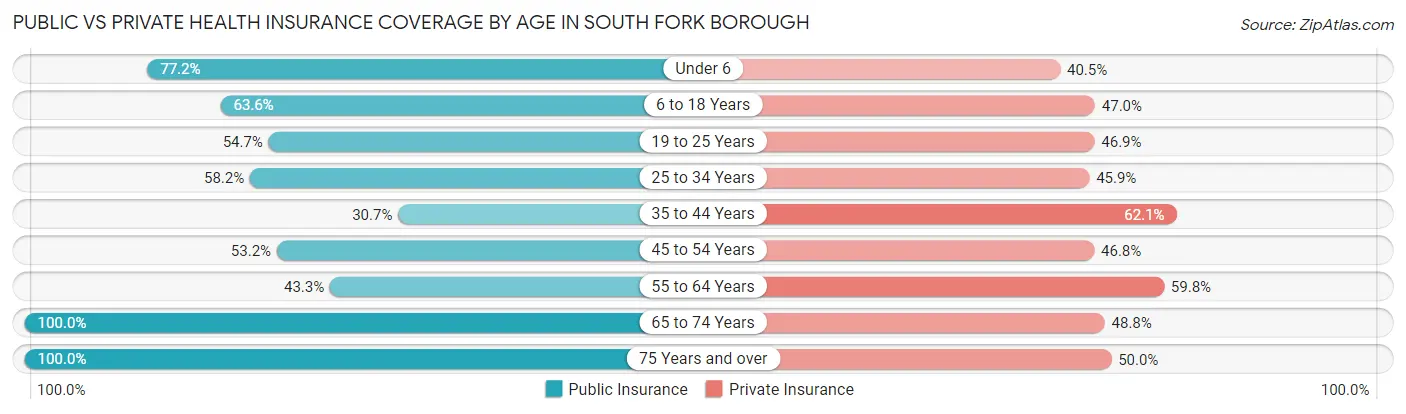
| Age Bracket | Public Insurance | Private Insurance |
| Under 6 | 61 (77.2%) | 32 (40.5%) |
| 6 to 18 Years | 84 (63.6%) | 62 (47.0%) |
| 19 to 25 Years | 35 (54.7%) | 30 (46.9%) |
| 25 to 34 Years | 57 (58.2%) | 45 (45.9%) |
| 35 to 44 Years | 38 (30.6%) | 77 (62.1%) |
| 45 to 54 Years | 67 (53.2%) | 59 (46.8%) |
| 55 to 64 Years | 42 (43.3%) | 58 (59.8%) |
| 65 to 74 Years | 82 (100.0%) | 40 (48.8%) |
| 75 Years and over | 62 (100.0%) | 31 (50.0%) |
| Total | 528 (61.1%) | 434 (50.2%) |
Disability Status by Sex by Age in South Fork borough
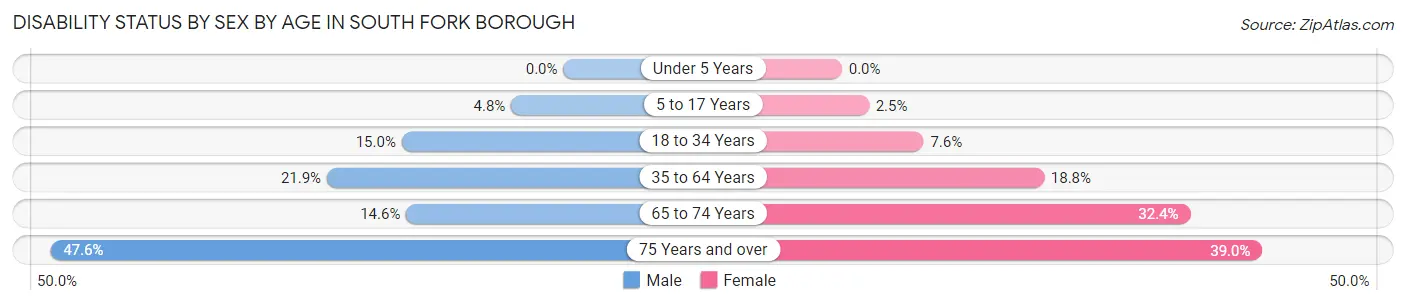
| Age Bracket | Male | Female |
| Under 5 Years | 0 (0.0%) | 0 (0.0%) |
| 5 to 17 Years | 3 (4.8%) | 2 (2.5%) |
| 18 to 34 Years | 15 (15.0%) | 5 (7.6%) |
| 35 to 64 Years | 34 (21.9%) | 36 (18.8%) |
| 65 to 74 Years | 7 (14.6%) | 11 (32.4%) |
| 75 Years and over | 10 (47.6%) | 16 (39.0%) |
Disability Class by Sex by Age in South Fork borough
Disability Class: Hearing Difficulty
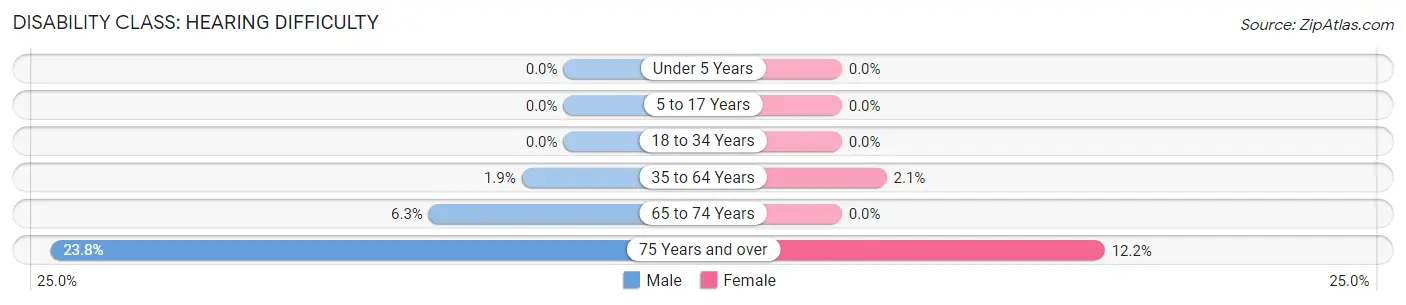
| Age Bracket | Male | Female |
| Under 5 Years | 0 (0.0%) | 0 (0.0%) |
| 5 to 17 Years | 0 (0.0%) | 0 (0.0%) |
| 18 to 34 Years | 0 (0.0%) | 0 (0.0%) |
| 35 to 64 Years | 3 (1.9%) | 4 (2.1%) |
| 65 to 74 Years | 3 (6.2%) | 0 (0.0%) |
| 75 Years and over | 5 (23.8%) | 5 (12.2%) |
Disability Class: Vision Difficulty
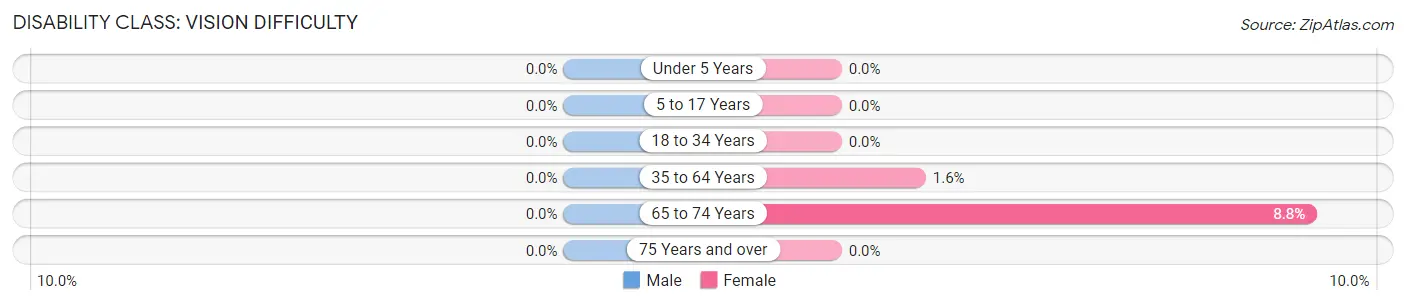
| Age Bracket | Male | Female |
| Under 5 Years | 0 (0.0%) | 0 (0.0%) |
| 5 to 17 Years | 0 (0.0%) | 0 (0.0%) |
| 18 to 34 Years | 0 (0.0%) | 0 (0.0%) |
| 35 to 64 Years | 0 (0.0%) | 3 (1.6%) |
| 65 to 74 Years | 0 (0.0%) | 3 (8.8%) |
| 75 Years and over | 0 (0.0%) | 0 (0.0%) |
Disability Class: Cognitive Difficulty
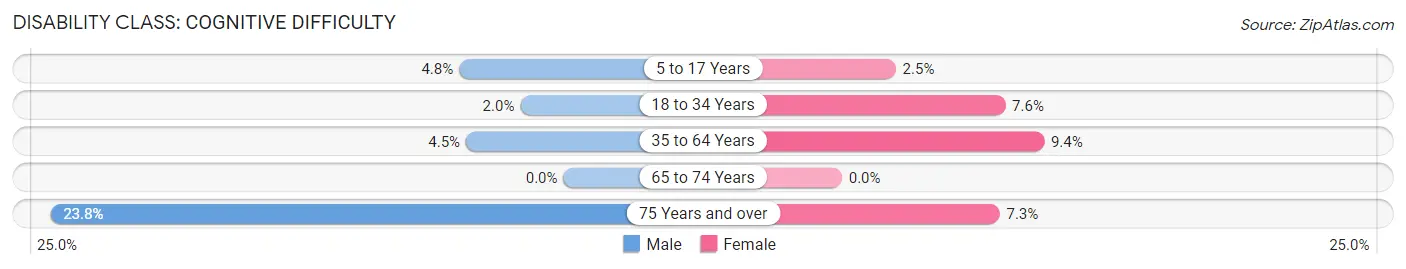
| Age Bracket | Male | Female |
| 5 to 17 Years | 3 (4.8%) | 2 (2.5%) |
| 18 to 34 Years | 2 (2.0%) | 5 (7.6%) |
| 35 to 64 Years | 7 (4.5%) | 18 (9.4%) |
| 65 to 74 Years | 0 (0.0%) | 0 (0.0%) |
| 75 Years and over | 5 (23.8%) | 3 (7.3%) |
Disability Class: Ambulatory Difficulty
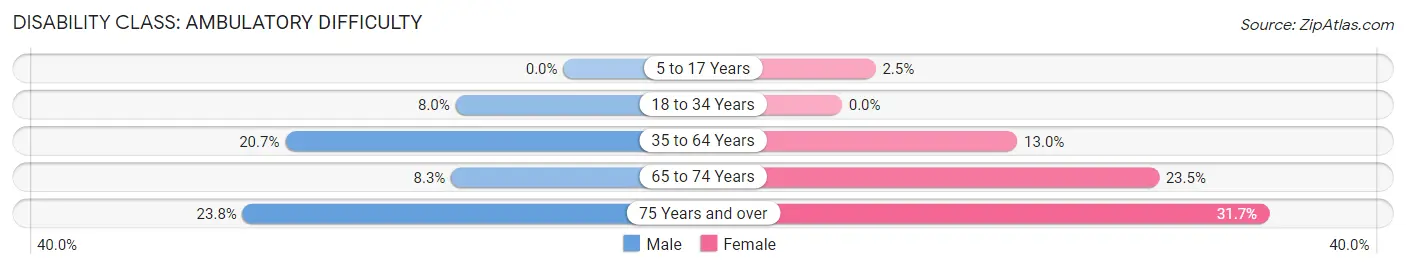
| Age Bracket | Male | Female |
| 5 to 17 Years | 0 (0.0%) | 2 (2.5%) |
| 18 to 34 Years | 8 (8.0%) | 0 (0.0%) |
| 35 to 64 Years | 32 (20.6%) | 25 (13.0%) |
| 65 to 74 Years | 4 (8.3%) | 8 (23.5%) |
| 75 Years and over | 5 (23.8%) | 13 (31.7%) |
Disability Class: Self-Care Difficulty
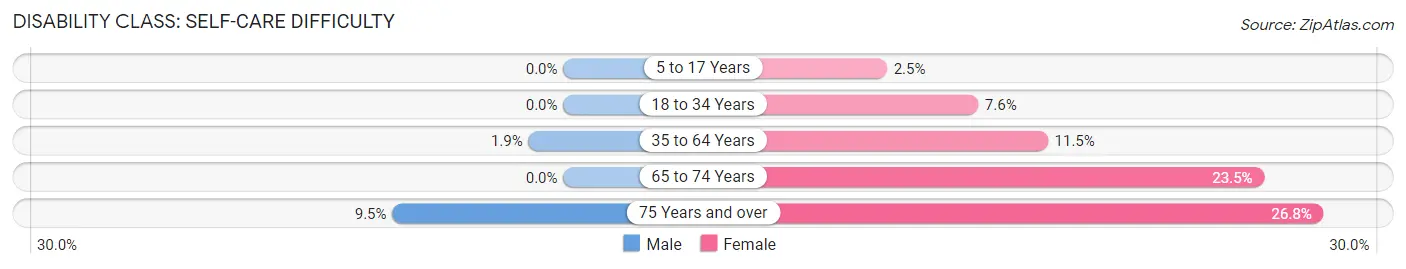
| Age Bracket | Male | Female |
| 5 to 17 Years | 0 (0.0%) | 2 (2.5%) |
| 18 to 34 Years | 0 (0.0%) | 5 (7.6%) |
| 35 to 64 Years | 3 (1.9%) | 22 (11.5%) |
| 65 to 74 Years | 0 (0.0%) | 8 (23.5%) |
| 75 Years and over | 2 (9.5%) | 11 (26.8%) |
Technology Access in South Fork borough
Computing Device Access in South Fork borough
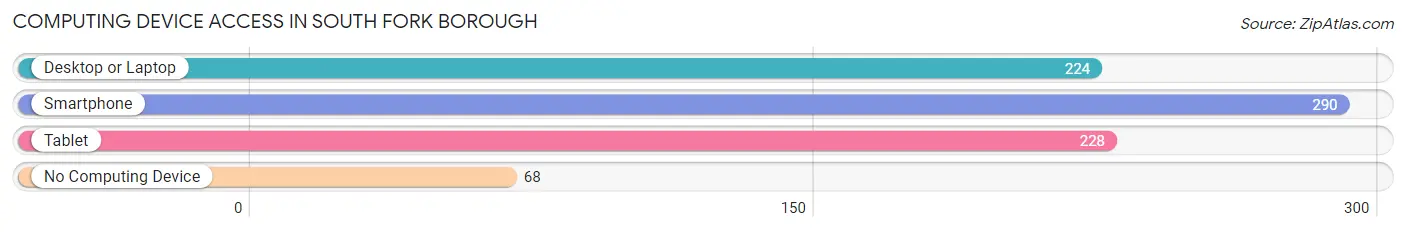
| Device Type | # Households | % Households |
| Desktop or Laptop | 224 | 57.7% |
| Smartphone | 290 | 74.7% |
| Tablet | 228 | 58.8% |
| No Computing Device | 68 | 17.5% |
| Total | 388 | 100.0% |
Internet Access in South Fork borough
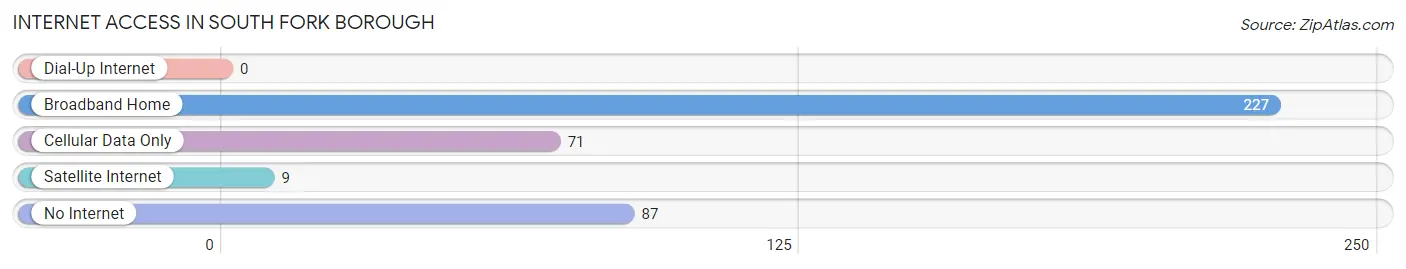
| Internet Type | # Households | % Households |
| Dial-Up Internet | 0 | 0.0% |
| Broadband Home | 227 | 58.5% |
| Cellular Data Only | 71 | 18.3% |
| Satellite Internet | 9 | 2.3% |
| No Internet | 87 | 22.4% |
| Total | 388 | 100.0% |
South Fork borough Summary
South Fork Borough is a small borough located in Cambria County, Pennsylvania. It is situated in the Allegheny Mountains, approximately 10 miles south of Johnstown. The borough was incorporated in 1891 and has a population of 1,845 as of the 2010 census.
History
The area that is now South Fork Borough was originally inhabited by the Native American Susquehannock tribe. The first European settlers arrived in the area in the late 1700s. The area was originally known as “Forktown” due to its location at the fork of two rivers, the Little Conemaugh and the Stonycreek.
In 1891, the area was officially incorporated as South Fork Borough. The borough was named after the South Fork Fishing and Hunting Club, which was established in 1879. The club was a private retreat for wealthy industrialists from Pittsburgh and Philadelphia. The club was the site of the Johnstown Flood of 1889, which killed over 2,200 people.
The borough was home to several coal mines in the late 19th and early 20th centuries. The mines provided employment for many of the residents of the borough. The coal industry declined in the mid-20th century, and the borough’s economy shifted to tourism and recreation.
Geography
South Fork Borough is located in the Allegheny Mountains of Cambria County, Pennsylvania. It is situated at the confluence of the Little Conemaugh and Stonycreek Rivers. The borough has a total area of 1.2 square miles, all of which is land.
The borough is located approximately 10 miles south of Johnstown and is bordered by the boroughs of Stonycreek, Conemaugh, and Scalp Level. The borough is also bordered by the townships of Conemaugh, Quemahoning, and Stonycreek.
Economy
The economy of South Fork Borough is largely based on tourism and recreation. The borough is home to several recreational facilities, including the South Fork Country Club, the South Fork Dam, and the South Fork State Park. The borough is also home to several restaurants, shops, and other businesses.
The borough is also home to several manufacturing companies, including a paper mill and a steel mill. The borough is also home to several coal mines, although the coal industry has declined in recent years.
Demographics
As of the 2010 census, the population of South Fork Borough was 1,845. The racial makeup of the borough was 97.3% White, 0.9% African American, 0.2% Native American, 0.2% Asian, 0.2% from other races, and 1.2% from two or more races. Hispanic or Latino of any race were 0.7% of the population.
The median household income in the borough was $37,917, and the median family income was $45,000. The per capita income for the borough was $18,945. About 11.2% of families and 14.2% of the population were below the poverty line, including 19.2% of those under age 18 and 8.2% of those age 65 or over.
Common Questions
What is Per Capita Income in South Fork borough?
Per Capita income in South Fork borough is $24,671.
What is the Median Family Income in South Fork borough?
Median Family Income in South Fork borough is $43,542.
What is the Median Household income in South Fork borough?
Median Household Income in South Fork borough is $32,273.
What is Income or Wage Gap in South Fork borough?
Income or Wage Gap in South Fork borough is 15.0%.
Women in South Fork borough earn 85.0 cents for every dollar earned by a man.
What is Inequality or Gini Index in South Fork borough?
Inequality or Gini Index in South Fork borough is 0.49.
What is the Total Population of South Fork borough?
Total Population of South Fork borough is 864.
What is the Total Male Population of South Fork borough?
Total Male Population of South Fork borough is 435.
What is the Total Female Population of South Fork borough?
Total Female Population of South Fork borough is 429.
What is the Ratio of Males per 100 Females in South Fork borough?
There are 101.40 Males per 100 Females in South Fork borough.
What is the Ratio of Females per 100 Males in South Fork borough?
There are 98.62 Females per 100 Males in South Fork borough.
What is the Median Population Age in South Fork borough?
Median Population Age in South Fork borough is 38.5 Years.
What is the Average Family Size in South Fork borough
Average Family Size in South Fork borough is 2.7 People.
What is the Average Household Size in South Fork borough
Average Household Size in South Fork borough is 2.2 People.
How Large is the Labor Force in South Fork borough?
There are 387 People in the Labor Forcein in South Fork borough.
What is the Percentage of People in the Labor Force in South Fork borough?
57.1% of People are in the Labor Force in South Fork borough.
What is the Unemployment Rate in South Fork borough?
Unemployment Rate in South Fork borough is 3.1%.