Feasterville, PA Map & Demographics
Feasterville Map
Feasterville Overview
$46,980
PER CAPITA INCOME
$101,638
AVG FAMILY INCOME
$94,293
AVG HOUSEHOLD INCOME
19.9%
WAGE / INCOME GAP [ % ]
80.1¢/ $1
WAGE / INCOME GAP [ $ ]
0.42
INEQUALITY / GINI INDEX
1,975
TOTAL POPULATION
871
MALE POPULATION
1,104
FEMALE POPULATION
78.89
MALES / 100 FEMALES
126.75
FEMALES / 100 MALES
46.8
MEDIAN AGE
2.8
AVG FAMILY SIZE
2.5
AVG HOUSEHOLD SIZE
1,077
LABOR FORCE [ PEOPLE ]
66.0%
PERCENT IN LABOR FORCE
5.4%
UNEMPLOYMENT RATE
Income in Feasterville
Income Overview in Feasterville
Per Capita Income in Feasterville is $46,980, while median incomes of families and households are $101,638 and $94,293 respectively.
| Characteristic | Number | Measure |
| Per Capita Income | 1,975 | $46,980 |
| Median Family Income | 592 | $101,638 |
| Mean Family Income | 592 | $122,708 |
| Median Household Income | 799 | $94,293 |
| Mean Household Income | 799 | $114,605 |
| Income Deficit | 592 | $0 |
| Wage / Income Gap (%) | 1,975 | 19.93% |
| Wage / Income Gap ($) | 1,975 | 80.07¢ per $1 |
| Gini / Inequality Index | 1,975 | 0.42 |
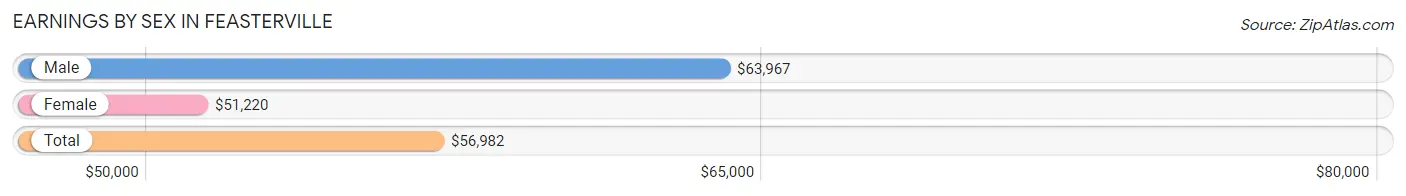
Earnings by Sex in Feasterville
Average Earnings in Feasterville are $56,982, $63,967 for men and $51,220 for women, a difference of 19.9%.
| Sex | Number | Average Earnings |
| Male | 534 (48.1%) | $63,967 |
| Female | 576 (51.9%) | $51,220 |
| Total | 1,110 (100.0%) | $56,982 |
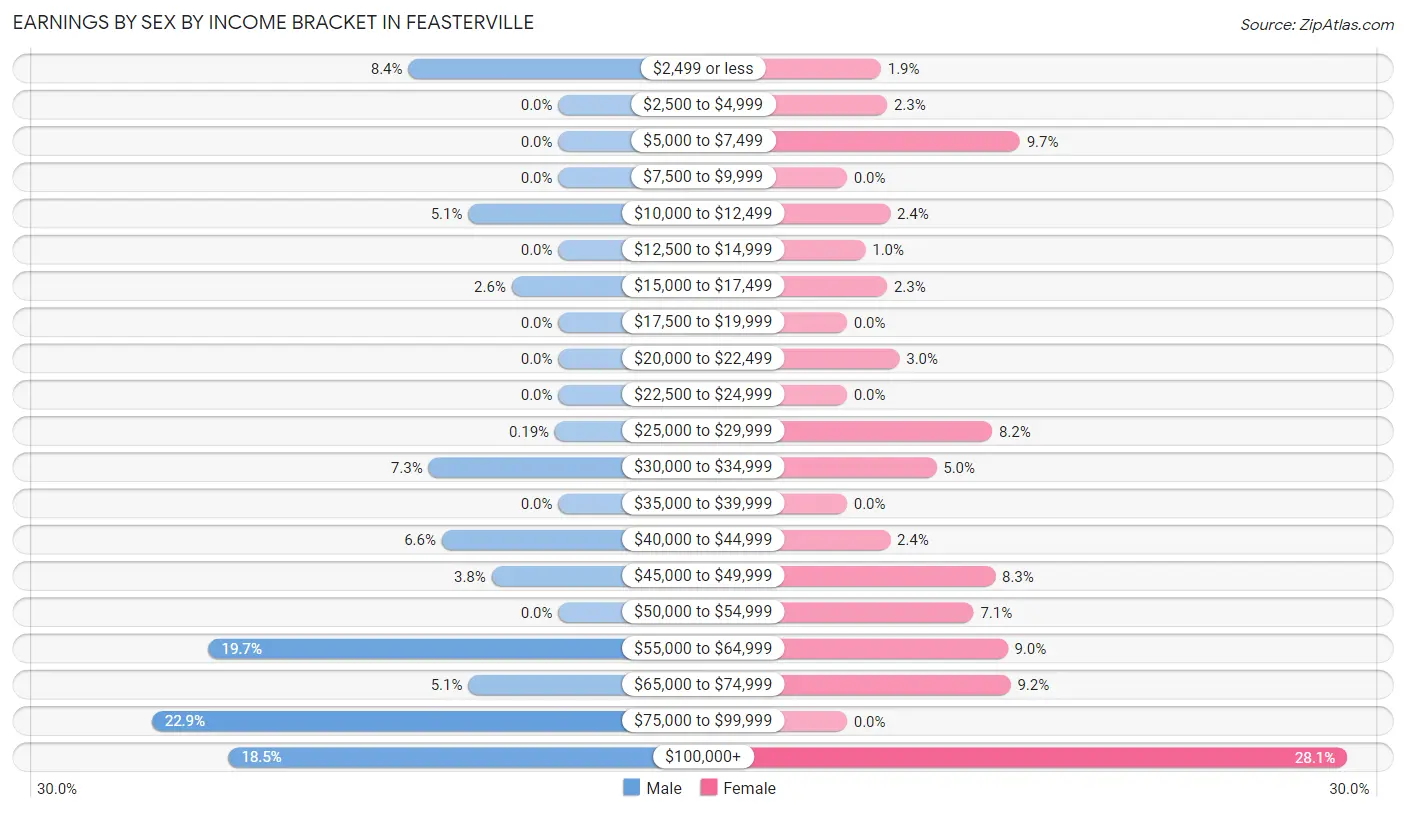
Earnings by Sex by Income Bracket in Feasterville
The most common earnings brackets in Feasterville are $75,000 to $99,999 for men (122 | 22.9%) and $100,000+ for women (162 | 28.1%).
| Income | Male | Female |
| $2,499 or less | 45 (8.4%) | 11 (1.9%) |
| $2,500 to $4,999 | 0 (0.0%) | 13 (2.3%) |
| $5,000 to $7,499 | 0 (0.0%) | 56 (9.7%) |
| $7,500 to $9,999 | 0 (0.0%) | 0 (0.0%) |
| $10,000 to $12,499 | 27 (5.1%) | 14 (2.4%) |
| $12,500 to $14,999 | 0 (0.0%) | 6 (1.0%) |
| $15,000 to $17,499 | 14 (2.6%) | 13 (2.3%) |
| $17,500 to $19,999 | 0 (0.0%) | 0 (0.0%) |
| $20,000 to $22,499 | 0 (0.0%) | 17 (2.9%) |
| $22,500 to $24,999 | 0 (0.0%) | 0 (0.0%) |
| $25,000 to $29,999 | 1 (0.2%) | 47 (8.2%) |
| $30,000 to $34,999 | 39 (7.3%) | 29 (5.0%) |
| $35,000 to $39,999 | 0 (0.0%) | 0 (0.0%) |
| $40,000 to $44,999 | 35 (6.6%) | 14 (2.4%) |
| $45,000 to $49,999 | 20 (3.7%) | 48 (8.3%) |
| $50,000 to $54,999 | 0 (0.0%) | 41 (7.1%) |
| $55,000 to $64,999 | 105 (19.7%) | 52 (9.0%) |
| $65,000 to $74,999 | 27 (5.1%) | 53 (9.2%) |
| $75,000 to $99,999 | 122 (22.9%) | 0 (0.0%) |
| $100,000+ | 99 (18.5%) | 162 (28.1%) |
| Total | 534 (100.0%) | 576 (100.0%) |
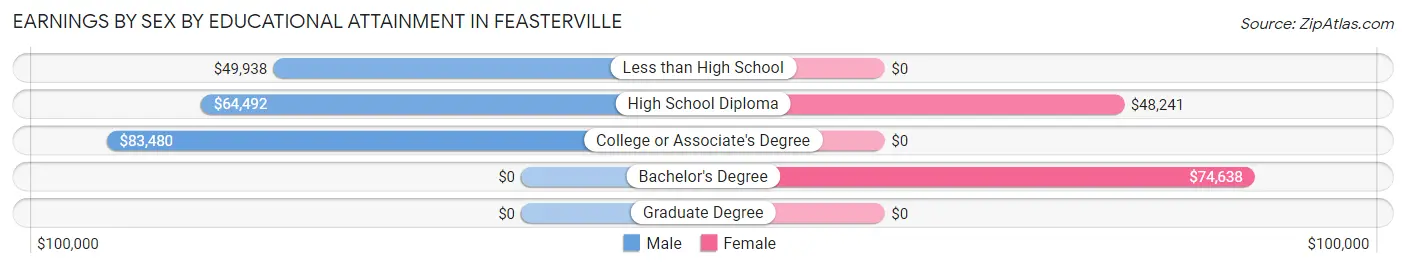
Earnings by Sex by Educational Attainment in Feasterville
Average earnings in Feasterville are $65,625 for men and $51,677 for women, a difference of 21.2%. Men with an educational attainment of college or associate's degree enjoy the highest average annual earnings of $83,480, while those with less than high school education earn the least with $49,938. Women with an educational attainment of bachelor's degree earn the most with the average annual earnings of $74,638, while those with high school diploma education have the smallest earnings of $48,241.
| Educational Attainment | Male Income | Female Income |
| Less than High School | $49,938 | $0 |
| High School Diploma | $64,492 | $48,241 |
| College or Associate's Degree | $83,480 | $0 |
| Bachelor's Degree | - | - |
| Graduate Degree | - | - |
| Total | $65,625 | $51,677 |
Family Income in Feasterville
Family Income Brackets in Feasterville
According to the Feasterville family income data, there are 149 families falling into the $100,000 to $149,999 income range, which is the most common income bracket and makes up 25.2% of all families.
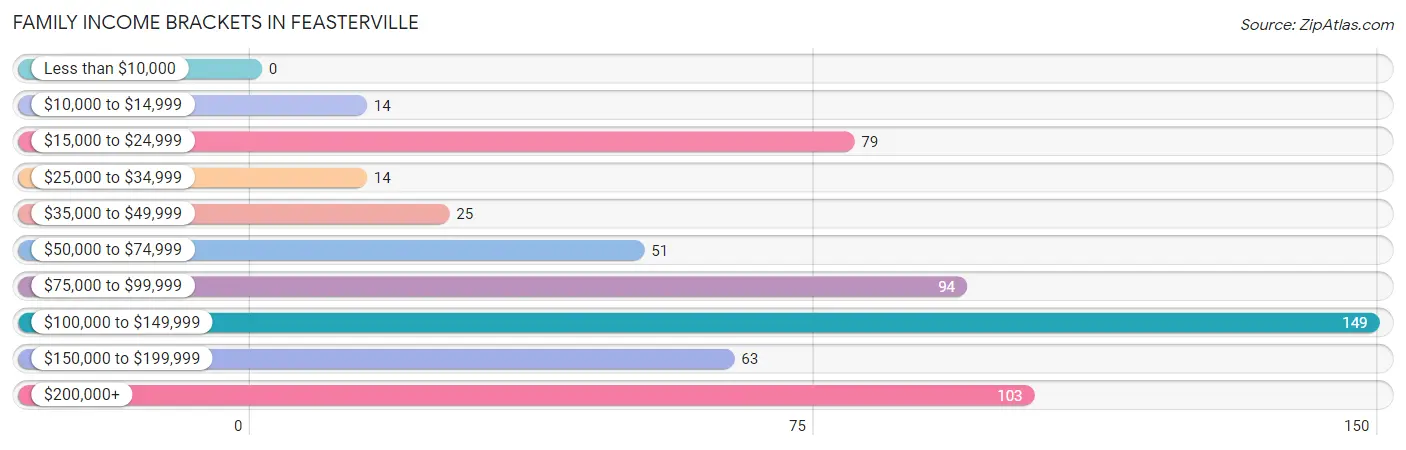
| Income Bracket | # Families | % Families |
| Less than $10,000 | 0 | 0.0% |
| $10,000 to $14,999 | 14 | 2.4% |
| $15,000 to $24,999 | 79 | 13.3% |
| $25,000 to $34,999 | 14 | 2.4% |
| $35,000 to $49,999 | 25 | 4.2% |
| $50,000 to $74,999 | 51 | 8.6% |
| $75,000 to $99,999 | 94 | 15.9% |
| $100,000 to $149,999 | 149 | 25.2% |
| $150,000 to $199,999 | 63 | 10.6% |
| $200,000+ | 103 | 17.4% |
Family Income by Famaliy Size in Feasterville
5-person families (64 | 10.8%) account for the highest median family income in Feasterville with $200,278 per family, while 2-person families (303 | 51.2%) have the highest median income of $43,998 per family member.
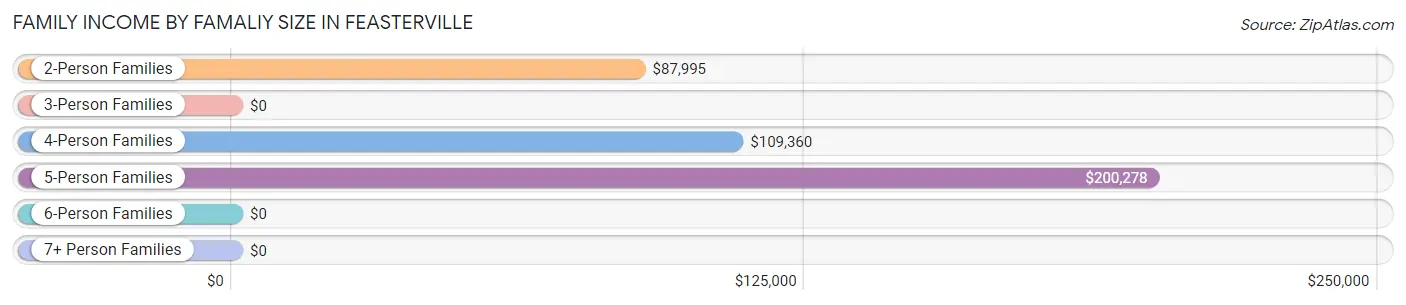
| Income Bracket | # Families | Median Income |
| 2-Person Families | 303 (51.2%) | $87,995 |
| 3-Person Families | 108 (18.2%) | $0 |
| 4-Person Families | 117 (19.8%) | $109,360 |
| 5-Person Families | 64 (10.8%) | $200,278 |
| 6-Person Families | 0 (0.0%) | $0 |
| 7+ Person Families | 0 (0.0%) | $0 |
| Total | 592 (100.0%) | $101,638 |
Family Income by Number of Earners in Feasterville
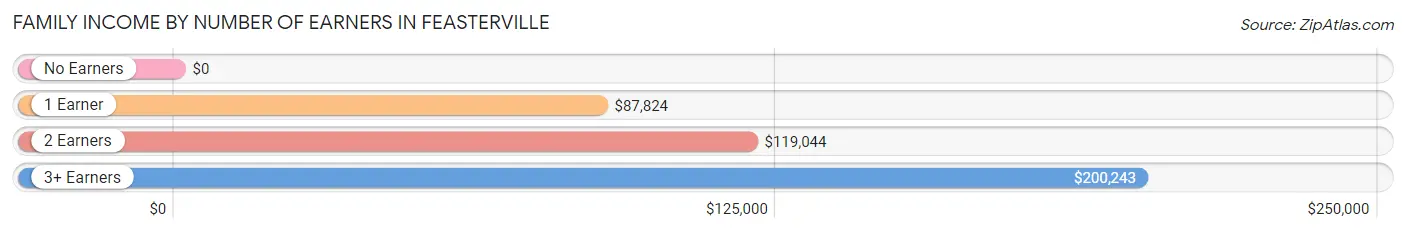
| Number of Earners | # Families | Median Income |
| No Earners | 128 (21.6%) | $0 |
| 1 Earner | 147 (24.8%) | $87,824 |
| 2 Earners | 252 (42.6%) | $119,044 |
| 3+ Earners | 65 (11.0%) | $200,243 |
| Total | 592 (100.0%) | $101,638 |
Household Income in Feasterville
Household Income Brackets in Feasterville
With 177 households falling in the category, the $100,000 to $149,999 income range is the most frequent in Feasterville, accounting for 22.2% of all households. In contrast, only 14 households (1.8%) fall into the $25,000 to $34,999 income bracket, making it the least populous group.
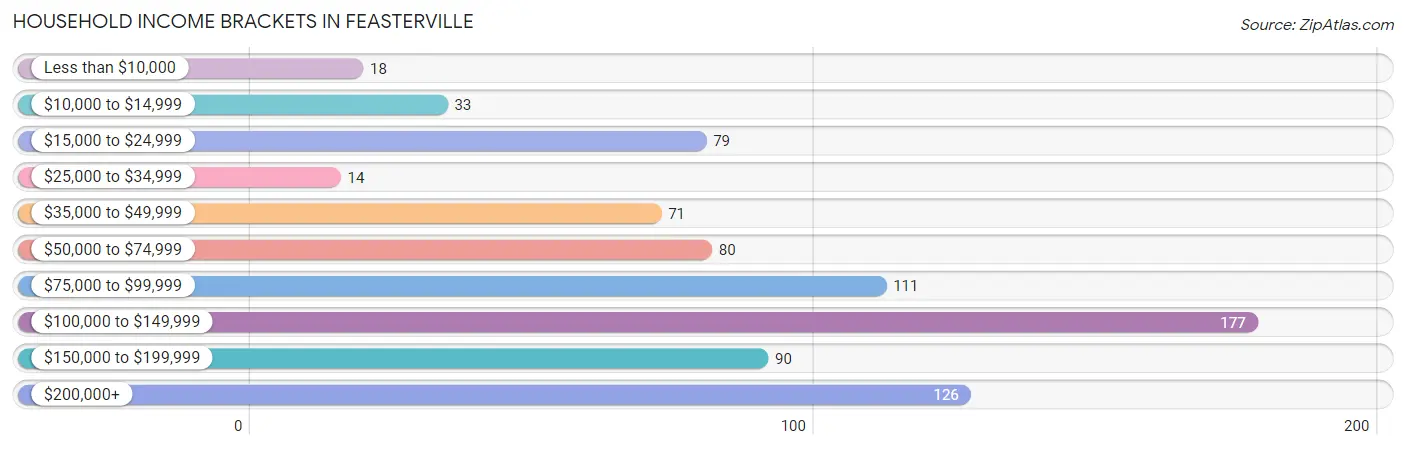
| Income Bracket | # Households | % Households |
| Less than $10,000 | 18 | 2.3% |
| $10,000 to $14,999 | 33 | 4.1% |
| $15,000 to $24,999 | 79 | 9.9% |
| $25,000 to $34,999 | 14 | 1.8% |
| $35,000 to $49,999 | 71 | 8.9% |
| $50,000 to $74,999 | 80 | 10.0% |
| $75,000 to $99,999 | 111 | 13.9% |
| $100,000 to $149,999 | 177 | 22.2% |
| $150,000 to $199,999 | 90 | 11.3% |
| $200,000+ | 126 | 15.8% |
Household Income by Householder Age in Feasterville
The median household income in Feasterville is $94,293, with the highest median household income of $108,304 found in the 25 to 44 years age bracket for the primary householder. A total of 204 households (25.5%) fall into this category.
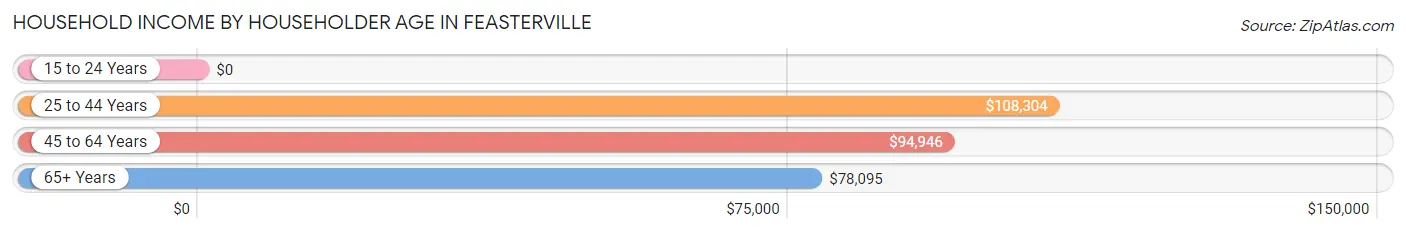
| Income Bracket | # Households | Median Income |
| 15 to 24 Years | 0 (0.0%) | $0 |
| 25 to 44 Years | 204 (25.5%) | $108,304 |
| 45 to 64 Years | 485 (60.7%) | $94,946 |
| 65+ Years | 110 (13.8%) | $78,095 |
| Total | 799 (100.0%) | $94,293 |
Poverty in Feasterville
Income Below Poverty by Sex and Age in Feasterville
With 12.2% poverty level for males and 12.1% for females among the residents of Feasterville, 25 to 34 year old males and 55 to 64 year old females are the most vulnerable to poverty, with 1 males (100.0%) and 114 females (39.0%) in their respective age groups living below the poverty level.
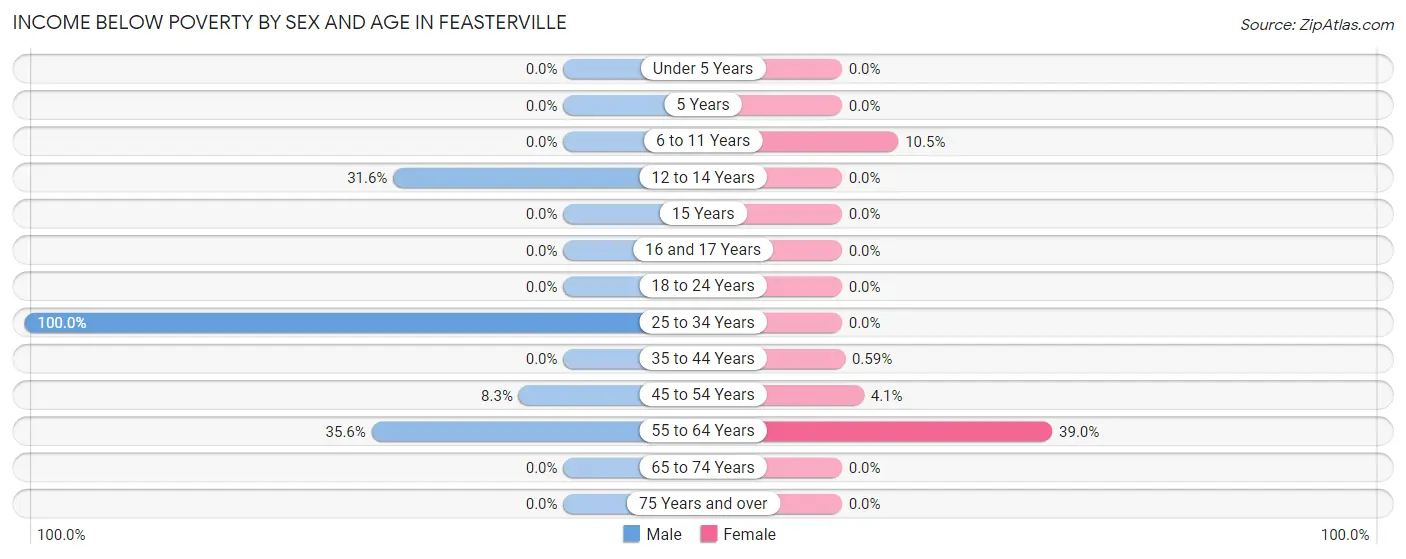
| Age Bracket | Male | Female |
| Under 5 Years | 0 (0.0%) | 0 (0.0%) |
| 5 Years | 0 (0.0%) | 0 (0.0%) |
| 6 to 11 Years | 0 (0.0%) | 13 (10.5%) |
| 12 to 14 Years | 12 (31.6%) | 0 (0.0%) |
| 15 Years | 0 (0.0%) | 0 (0.0%) |
| 16 and 17 Years | 0 (0.0%) | 0 (0.0%) |
| 18 to 24 Years | 0 (0.0%) | 0 (0.0%) |
| 25 to 34 Years | 1 (100.0%) | 0 (0.0%) |
| 35 to 44 Years | 0 (0.0%) | 1 (0.6%) |
| 45 to 54 Years | 14 (8.3%) | 6 (4.1%) |
| 55 to 64 Years | 79 (35.6%) | 114 (39.0%) |
| 65 to 74 Years | 0 (0.0%) | 0 (0.0%) |
| 75 Years and over | 0 (0.0%) | 0 (0.0%) |
| Total | 106 (12.2%) | 134 (12.1%) |
Income Above Poverty by Sex and Age in Feasterville
According to the poverty statistics in Feasterville, males aged 5 years and females aged under 5 years are the age groups that are most secure financially, with 100.0% of males and 100.0% of females in these age groups living above the poverty line.
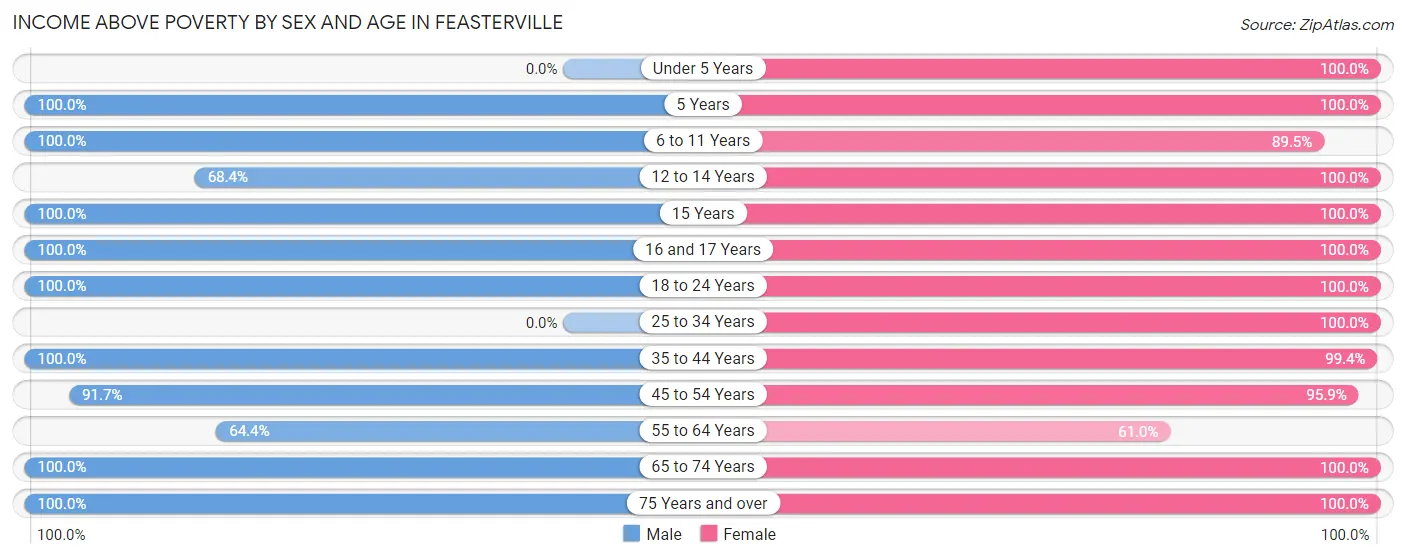
| Age Bracket | Male | Female |
| Under 5 Years | 0 (0.0%) | 13 (100.0%) |
| 5 Years | 11 (100.0%) | 16 (100.0%) |
| 6 to 11 Years | 26 (100.0%) | 111 (89.5%) |
| 12 to 14 Years | 26 (68.4%) | 55 (100.0%) |
| 15 Years | 45 (100.0%) | 15 (100.0%) |
| 16 and 17 Years | 78 (100.0%) | 16 (100.0%) |
| 18 to 24 Years | 39 (100.0%) | 45 (100.0%) |
| 25 to 34 Years | 0 (0.0%) | 84 (100.0%) |
| 35 to 44 Years | 142 (100.0%) | 169 (99.4%) |
| 45 to 54 Years | 155 (91.7%) | 141 (95.9%) |
| 55 to 64 Years | 143 (64.4%) | 178 (61.0%) |
| 65 to 74 Years | 75 (100.0%) | 103 (100.0%) |
| 75 Years and over | 25 (100.0%) | 24 (100.0%) |
| Total | 765 (87.8%) | 970 (87.9%) |
Income Below Poverty Among Married-Couple Families in Feasterville
The poverty statistics for married-couple families in Feasterville show that 18.5% or 79 of the total 426 families live below the poverty line. Families with no children have the highest poverty rate of 29.0%, comprising of 79 families. On the other hand, families with 1 or 2 children have the lowest poverty rate of 0.0%, which includes 0 families.
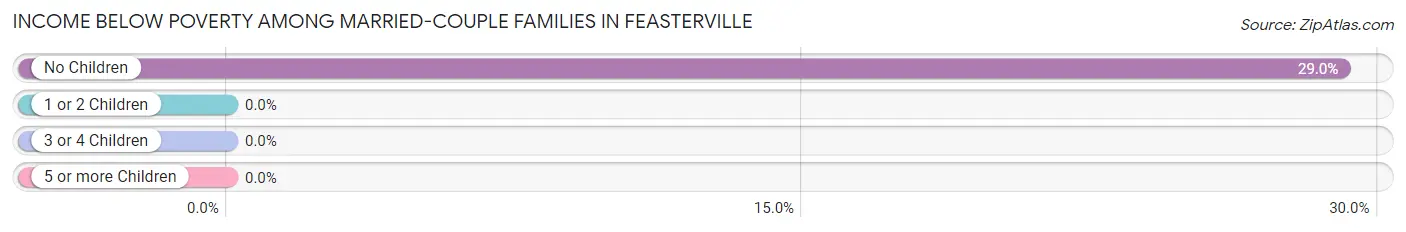
| Children | Above Poverty | Below Poverty |
| No Children | 193 (71.0%) | 79 (29.0%) |
| 1 or 2 Children | 141 (100.0%) | 0 (0.0%) |
| 3 or 4 Children | 13 (100.0%) | 0 (0.0%) |
| 5 or more Children | 0 (0.0%) | 0 (0.0%) |
| Total | 347 (81.5%) | 79 (18.5%) |
Income Below Poverty Among Single-Parent Households in Feasterville
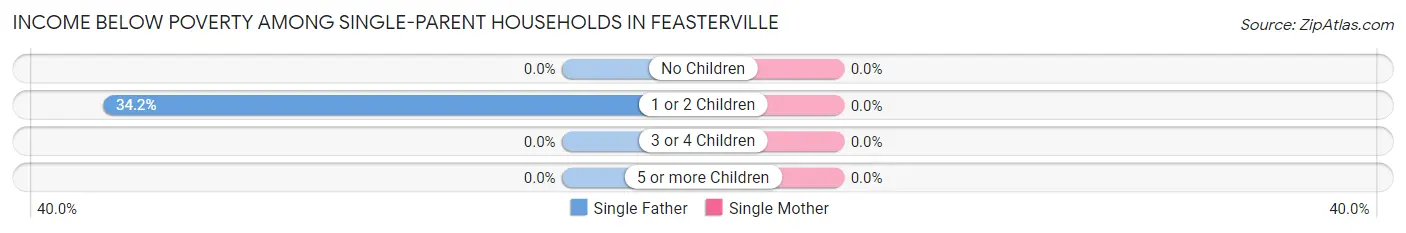
| Children | Single Father | Single Mother |
| No Children | 0 (0.0%) | 0 (0.0%) |
| 1 or 2 Children | 14 (34.2%) | 0 (0.0%) |
| 3 or 4 Children | 0 (0.0%) | 0 (0.0%) |
| 5 or more Children | 0 (0.0%) | 0 (0.0%) |
| Total | 14 (34.2%) | 0 (0.0%) |
Income Below Poverty Among Married-Couple vs Single-Parent Households in Feasterville
The poverty data for Feasterville shows that 79 of the married-couple family households (18.5%) and 14 of the single-parent households (8.4%) are living below the poverty level. Within the married-couple family households, those with no children have the highest poverty rate, with 79 households (29.0%) falling below the poverty line. Among the single-parent households, those with 1 or 2 children have the highest poverty rate, with 14 household (9.8%) living below poverty.
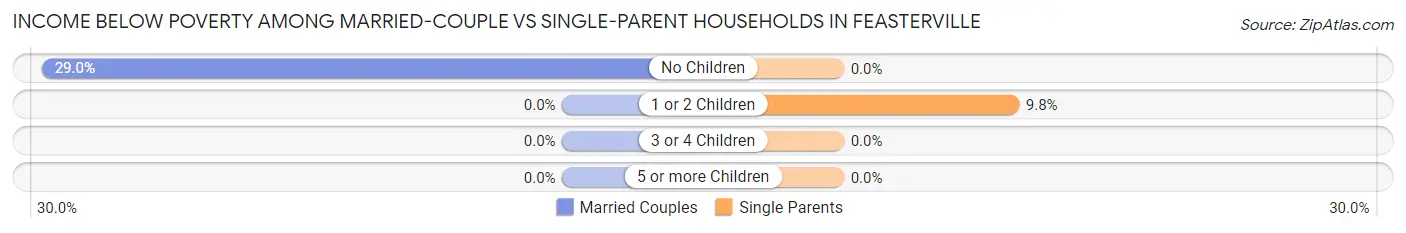
| Children | Married-Couple Families | Single-Parent Households |
| No Children | 79 (29.0%) | 0 (0.0%) |
| 1 or 2 Children | 0 (0.0%) | 14 (9.8%) |
| 3 or 4 Children | 0 (0.0%) | 0 (0.0%) |
| 5 or more Children | 0 (0.0%) | 0 (0.0%) |
| Total | 79 (18.5%) | 14 (8.4%) |
Race in Feasterville
The most populous races in Feasterville are White / Caucasian (1,585 | 80.2%), Two or more Races (252 | 12.8%), and Hispanic or Latino (84 | 4.3%).
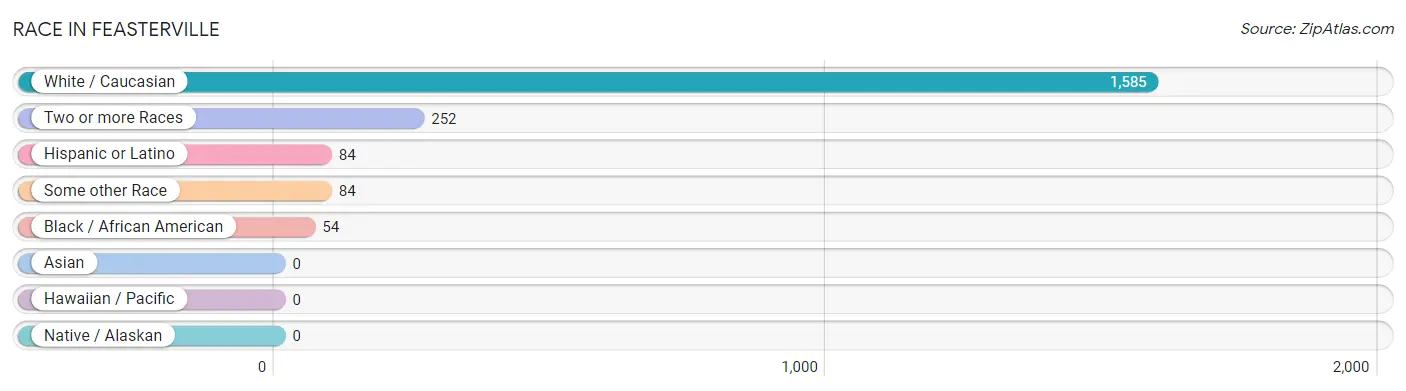
| Race | # Population | % Population |
| Asian | 0 | 0.0% |
| Black / African American | 54 | 2.7% |
| Hawaiian / Pacific | 0 | 0.0% |
| Hispanic or Latino | 84 | 4.3% |
| Native / Alaskan | 0 | 0.0% |
| White / Caucasian | 1,585 | 80.2% |
| Two or more Races | 252 | 12.8% |
| Some other Race | 84 | 4.3% |
| Total | 1,975 | 100.0% |
Ancestry in Feasterville
The most populous ancestries reported in Feasterville are Irish (359 | 18.2%), German (302 | 15.3%), Italian (192 | 9.7%), American (167 | 8.5%), and English (163 | 8.3%), together accounting for 59.9% of all Feasterville residents.
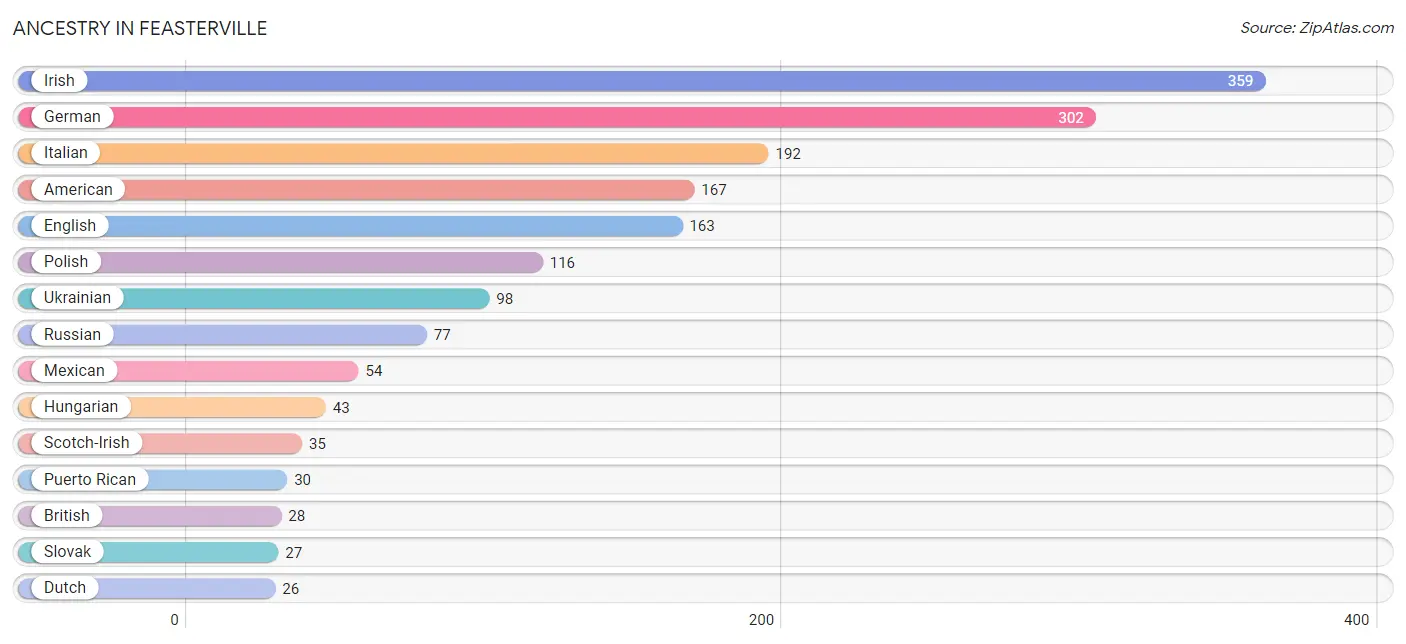
| Ancestry | # Population | % Population |
| African | 8 | 0.4% |
| American | 167 | 8.5% |
| British | 28 | 1.4% |
| Canadian | 14 | 0.7% |
| Dutch | 26 | 1.3% |
| English | 163 | 8.3% |
| European | 21 | 1.1% |
| French | 26 | 1.3% |
| German | 302 | 15.3% |
| Guamanian / Chamorro | 13 | 0.7% |
| Hungarian | 43 | 2.2% |
| Irish | 359 | 18.2% |
| Italian | 192 | 9.7% |
| Mexican | 54 | 2.7% |
| Norwegian | 13 | 0.7% |
| Polish | 116 | 5.9% |
| Puerto Rican | 30 | 1.5% |
| Russian | 77 | 3.9% |
| Scandinavian | 18 | 0.9% |
| Scotch-Irish | 35 | 1.8% |
| Scottish | 14 | 0.7% |
| Slovak | 27 | 1.4% |
| Subsaharan African | 8 | 0.4% |
| Ukrainian | 98 | 5.0% | View All 24 Rows |
Immigrants in Feasterville
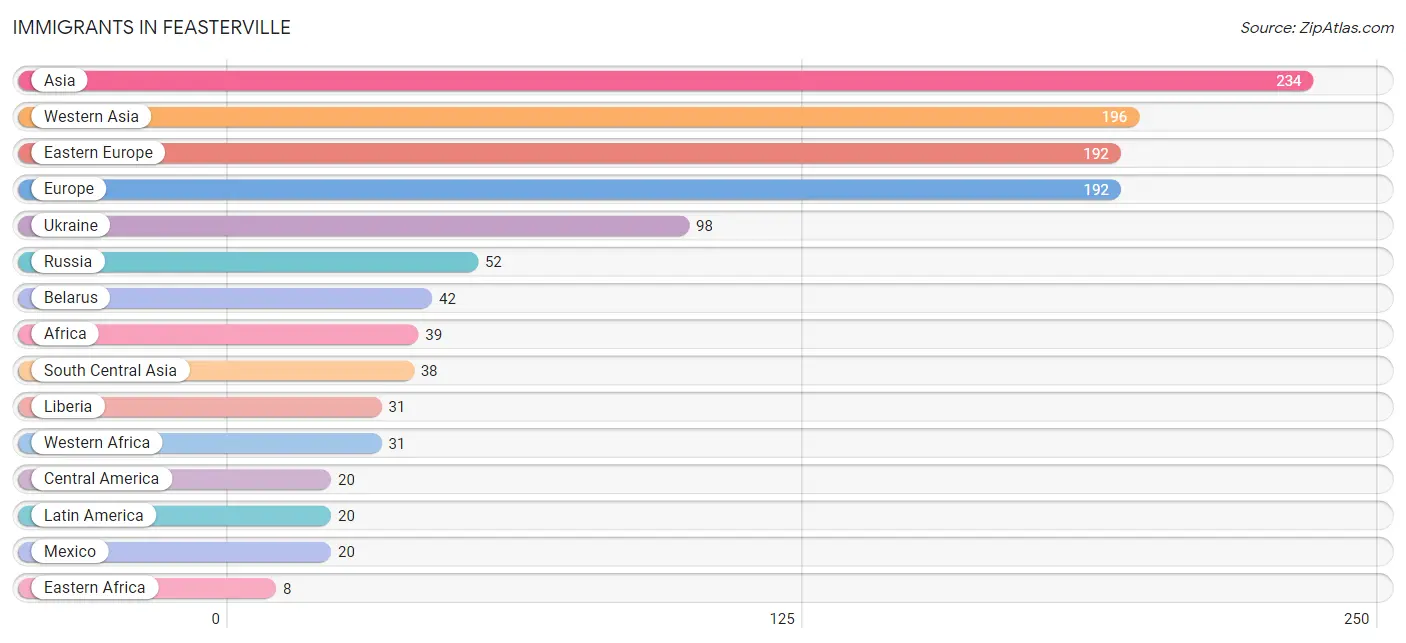
The most numerous immigrant groups reported in Feasterville came from Asia (234 | 11.8%), Western Asia (196 | 9.9%), Eastern Europe (192 | 9.7%), Europe (192 | 9.7%), and Ukraine (98 | 5.0%), together accounting for 46.2% of all Feasterville residents.
| Immigration Origin | # Population | % Population |
| Africa | 39 | 2.0% |
| Asia | 234 | 11.8% |
| Belarus | 42 | 2.1% |
| Central America | 20 | 1.0% |
| Eastern Africa | 8 | 0.4% |
| Eastern Europe | 192 | 9.7% |
| Europe | 192 | 9.7% |
| Latin America | 20 | 1.0% |
| Liberia | 31 | 1.6% |
| Mexico | 20 | 1.0% |
| Russia | 52 | 2.6% |
| South Central Asia | 38 | 1.9% |
| Ukraine | 98 | 5.0% |
| Western Africa | 31 | 1.6% |
| Western Asia | 196 | 9.9% | View All 15 Rows |
Sex and Age in Feasterville
Sex and Age in Feasterville
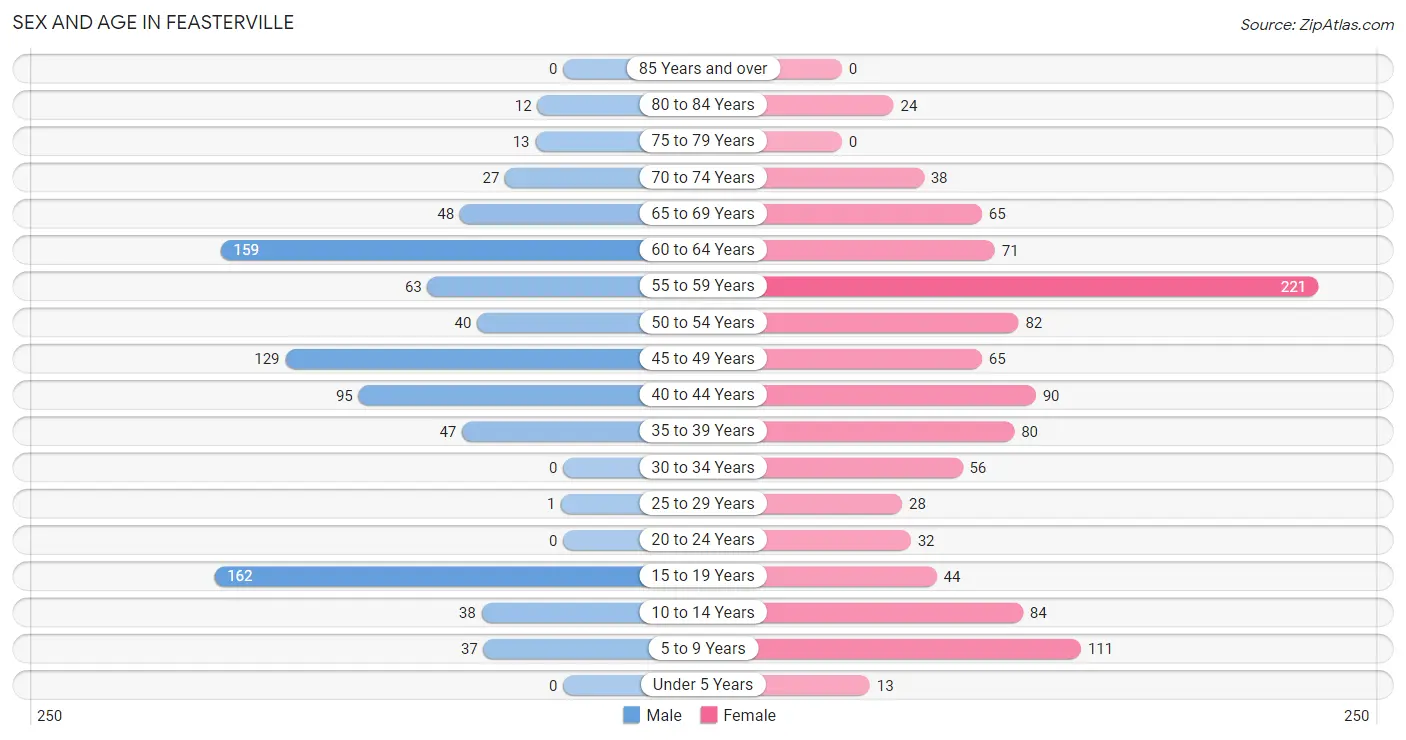
The most populous age groups in Feasterville are 15 to 19 Years (162 | 18.6%) for men and 55 to 59 Years (221 | 20.0%) for women.
| Age Bracket | Male | Female |
| Under 5 Years | 0 (0.0%) | 13 (1.2%) |
| 5 to 9 Years | 37 (4.3%) | 111 (10.1%) |
| 10 to 14 Years | 38 (4.4%) | 84 (7.6%) |
| 15 to 19 Years | 162 (18.6%) | 44 (4.0%) |
| 20 to 24 Years | 0 (0.0%) | 32 (2.9%) |
| 25 to 29 Years | 1 (0.1%) | 28 (2.5%) |
| 30 to 34 Years | 0 (0.0%) | 56 (5.1%) |
| 35 to 39 Years | 47 (5.4%) | 80 (7.2%) |
| 40 to 44 Years | 95 (10.9%) | 90 (8.2%) |
| 45 to 49 Years | 129 (14.8%) | 65 (5.9%) |
| 50 to 54 Years | 40 (4.6%) | 82 (7.4%) |
| 55 to 59 Years | 63 (7.2%) | 221 (20.0%) |
| 60 to 64 Years | 159 (18.2%) | 71 (6.4%) |
| 65 to 69 Years | 48 (5.5%) | 65 (5.9%) |
| 70 to 74 Years | 27 (3.1%) | 38 (3.4%) |
| 75 to 79 Years | 13 (1.5%) | 0 (0.0%) |
| 80 to 84 Years | 12 (1.4%) | 24 (2.2%) |
| 85 Years and over | 0 (0.0%) | 0 (0.0%) |
| Total | 871 (100.0%) | 1,104 (100.0%) |
Families and Households in Feasterville
Median Family Size in Feasterville
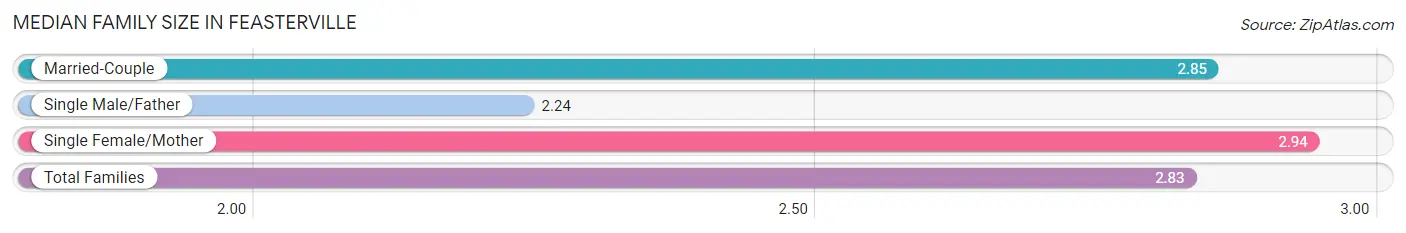
The median family size in Feasterville is 2.83 persons per family, with single female/mother families (125 | 21.1%) accounting for the largest median family size of 2.94 persons per family. On the other hand, single male/father families (41 | 6.9%) represent the smallest median family size with 2.24 persons per family.
| Family Type | # Families | Family Size |
| Married-Couple | 426 (72.0%) | 2.85 |
| Single Male/Father | 41 (6.9%) | 2.24 |
| Single Female/Mother | 125 (21.1%) | 2.94 |
| Total Families | 592 (100.0%) | 2.83 |
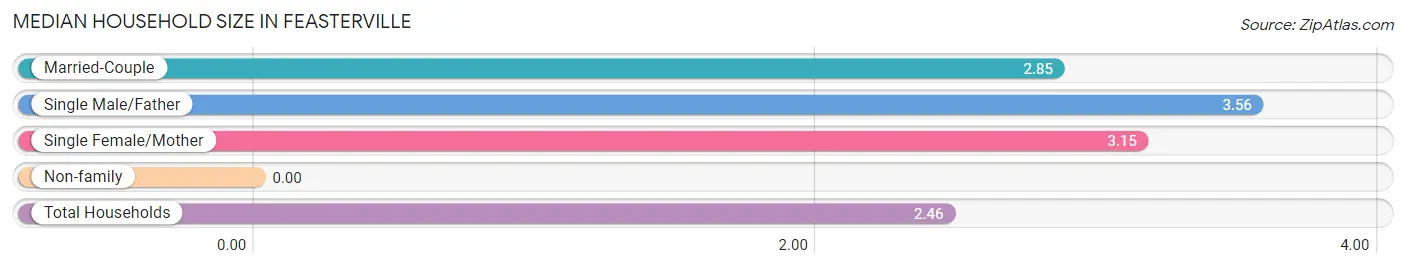
Median Household Size in Feasterville
| Household Type | # Households | Household Size |
| Married-Couple | 426 (53.3%) | 2.85 |
| Single Male/Father | 41 (5.1%) | 3.56 |
| Single Female/Mother | 125 (15.6%) | 3.15 |
| Non-family | 207 (25.9%) | - |
| Total Households | 799 (100.0%) | 2.46 |
Household Size by Marriage Status in Feasterville
Out of a total of 799 households in Feasterville, 592 (74.1%) are family households, while 207 (25.9%) are nonfamily households. The most numerous type of family households are 2-person households, comprising 253, and the most common type of nonfamily households are 1-person households, comprising 207.
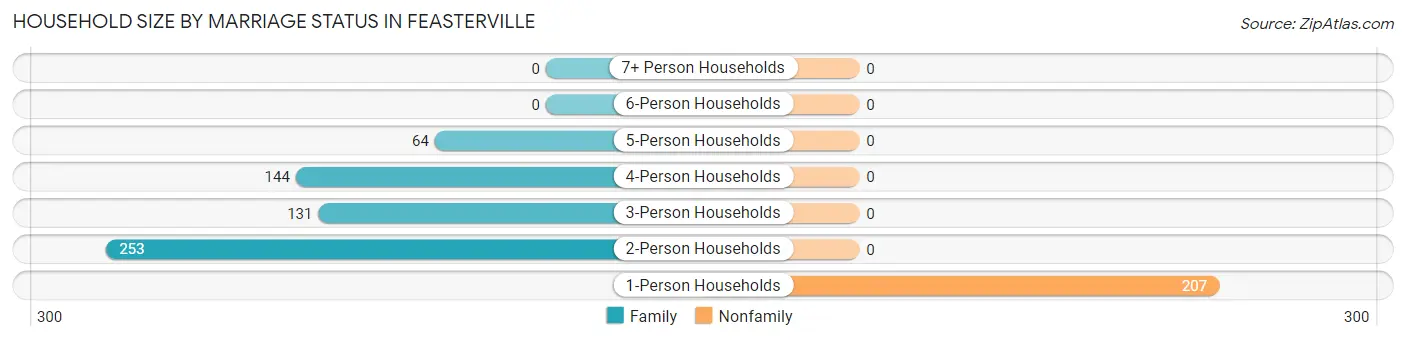
| Household Size | Family Households | Nonfamily Households |
| 1-Person Households | - | 207 (25.9%) |
| 2-Person Households | 253 (31.7%) | 0 (0.0%) |
| 3-Person Households | 131 (16.4%) | 0 (0.0%) |
| 4-Person Households | 144 (18.0%) | 0 (0.0%) |
| 5-Person Households | 64 (8.0%) | 0 (0.0%) |
| 6-Person Households | 0 (0.0%) | 0 (0.0%) |
| 7+ Person Households | 0 (0.0%) | 0 (0.0%) |
| Total | 592 (74.1%) | 207 (25.9%) |
Female Fertility in Feasterville
Fertility by Age in Feasterville
| Age Bracket | Women with Births | Births / 1,000 Women |
| 15 to 19 years | 0 (0.0%) | 0.0 |
| 20 to 34 years | 0 (0.0%) | 0.0 |
| 35 to 50 years | 0 (0.0%) | 0.0 |
| Total | 0 (0.0%) | 0.0 |
Fertility by Age by Marriage Status in Feasterville
| Age Bracket | Married | Unmarried |
| 15 to 19 years | 0 (0.0%) | 0 (0.0%) |
| 20 to 34 years | 0 (0.0%) | 0 (0.0%) |
| 35 to 50 years | 0 (0.0%) | 0 (0.0%) |
| Total | 0 (0.0%) | 0 (0.0%) |
Fertility by Education in Feasterville
| Educational Attainment | Women with Births | Births / 1,000 Women |
| Less than High School | 0 (0.0%) | 0.0 |
| High School Diploma | 0 (0.0%) | 0.0 |
| College or Associate's Degree | 0 (0.0%) | 0.0 |
| Bachelor's Degree | 0 (0.0%) | 0.0 |
| Graduate Degree | 0 (0.0%) | 0.0 |
| Total | 0 (0.0%) | 0.0 |
Fertility by Education by Marriage Status in Feasterville
| Educational Attainment | Married | Unmarried |
| Less than High School | 0 (0.0%) | 0 (0.0%) |
| High School Diploma | 0 (0.0%) | 0 (0.0%) |
| College or Associate's Degree | 0 (0.0%) | 0 (0.0%) |
| Bachelor's Degree | 0 (0.0%) | 0 (0.0%) |
| Graduate Degree | 0 (0.0%) | 0 (0.0%) |
| Total | 0 (0.0%) | 0 (0.0%) |
Employment Characteristics in Feasterville
Employment by Class of Employer in Feasterville
Among the 996 employed individuals in Feasterville, private company employees (698 | 70.1%), local government employees (151 | 15.2%), and not-for-profit organizations (87 | 8.7%) make up the most common classes of employment.
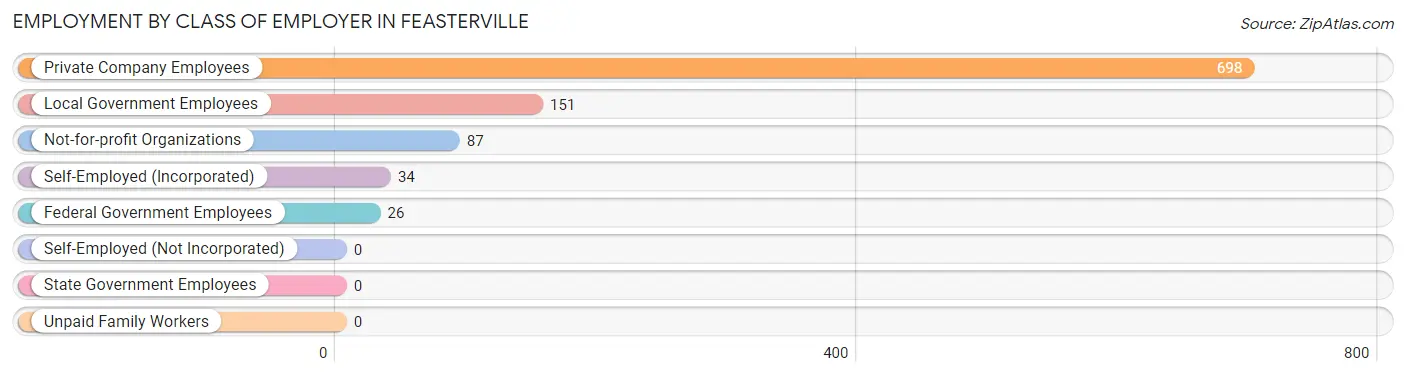
| Employer Class | # Employees | % Employees |
| Private Company Employees | 698 | 70.1% |
| Self-Employed (Incorporated) | 34 | 3.4% |
| Self-Employed (Not Incorporated) | 0 | 0.0% |
| Not-for-profit Organizations | 87 | 8.7% |
| Local Government Employees | 151 | 15.2% |
| State Government Employees | 0 | 0.0% |
| Federal Government Employees | 26 | 2.6% |
| Unpaid Family Workers | 0 | 0.0% |
| Total | 996 | 100.0% |
Employment Status by Age in Feasterville
According to the labor force statistics for Feasterville, out of the total population over 16 years of age (1,632), 66.0% or 1,077 individuals are in the labor force, with 5.4% or 58 of them unemployed. The age group with the highest labor force participation rate is 20 to 24 years, with 100.0% or 32 individuals in the labor force. Within the labor force, the 55 to 59 years age range has the highest percentage of unemployed individuals, with 16.3% or 31 of them being unemployed.
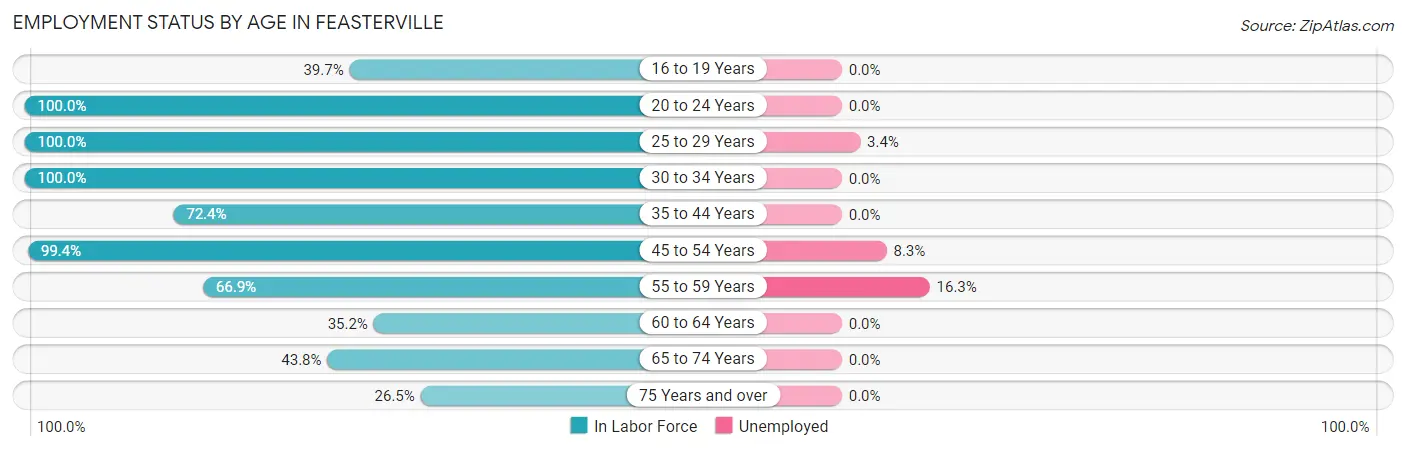
| Age Bracket | In Labor Force | Unemployed |
| 16 to 19 Years | 58 (39.7%) | 0 (0.0%) |
| 20 to 24 Years | 32 (100.0%) | 0 (0.0%) |
| 25 to 29 Years | 29 (100.0%) | 1 (3.4%) |
| 30 to 34 Years | 56 (100.0%) | 0 (0.0%) |
| 35 to 44 Years | 226 (72.4%) | 0 (0.0%) |
| 45 to 54 Years | 314 (99.4%) | 26 (8.3%) |
| 55 to 59 Years | 190 (66.9%) | 31 (16.3%) |
| 60 to 64 Years | 81 (35.2%) | 0 (0.0%) |
| 65 to 74 Years | 78 (43.8%) | 0 (0.0%) |
| 75 Years and over | 13 (26.5%) | 0 (0.0%) |
| Total | 1,077 (66.0%) | 58 (5.4%) |
Employment Status by Educational Attainment in Feasterville
According to labor force statistics for Feasterville, 73.0% of individuals (896) out of the total population between 25 and 64 years of age (1,227) are in the labor force, with 6.5% or 58 of them being unemployed. The group with the highest labor force participation rate are those with the educational attainment of less than high school, with 100.0% or 146 individuals in the labor force. Within the labor force, individuals with less than high school education have the highest percentage of unemployment, with 17.8% or 26 of them being unemployed.
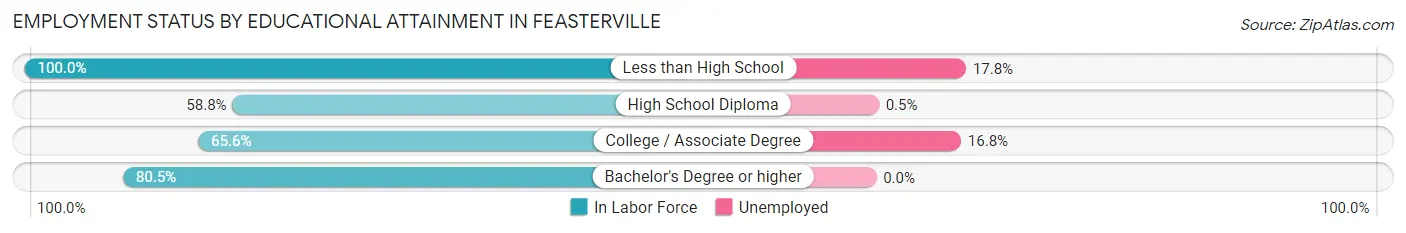
| Educational Attainment | In Labor Force | Unemployed |
| Less than High School | 146 (100.0%) | 26 (17.8%) |
| High School Diploma | 211 (58.8%) | 2 (0.5%) |
| College / Associate Degree | 185 (65.6%) | 47 (16.8%) |
| Bachelor's Degree or higher | 354 (80.5%) | 0 (0.0%) |
| Total | 896 (73.0%) | 80 (6.5%) |
Employment Occupations by Sex in Feasterville
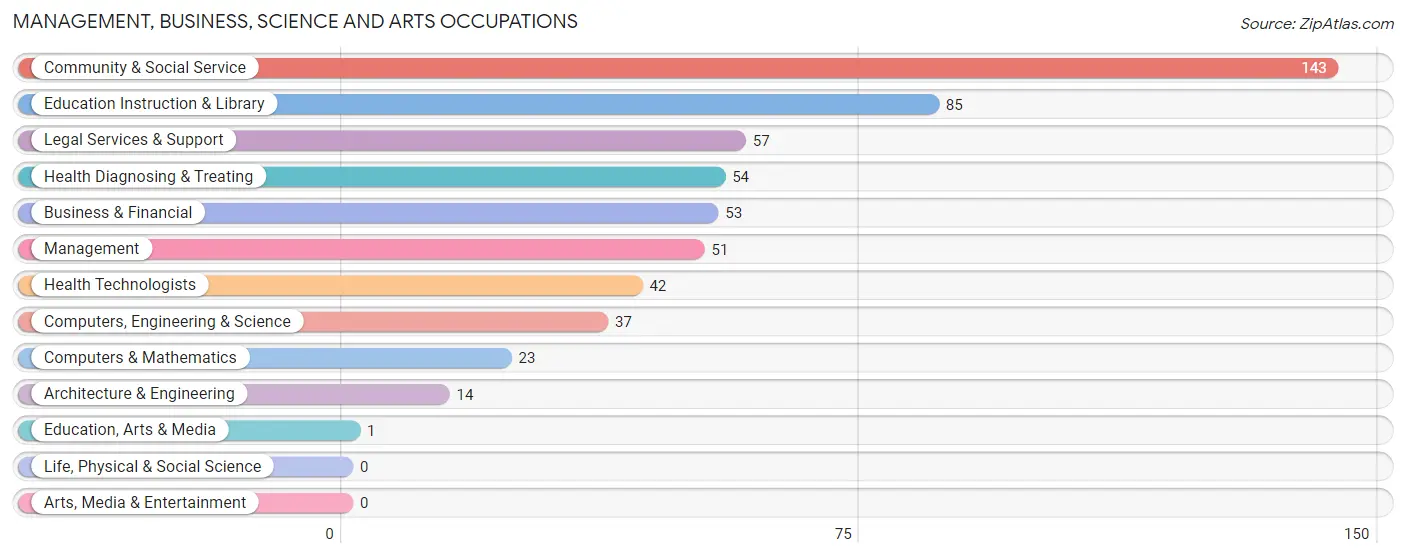
Management, Business, Science and Arts Occupations
The most common Management, Business, Science and Arts occupations in Feasterville are Community & Social Service (143 | 14.0%), Education Instruction & Library (85 | 8.3%), Legal Services & Support (57 | 5.6%), Health Diagnosing & Treating (54 | 5.3%), and Business & Financial (53 | 5.2%).
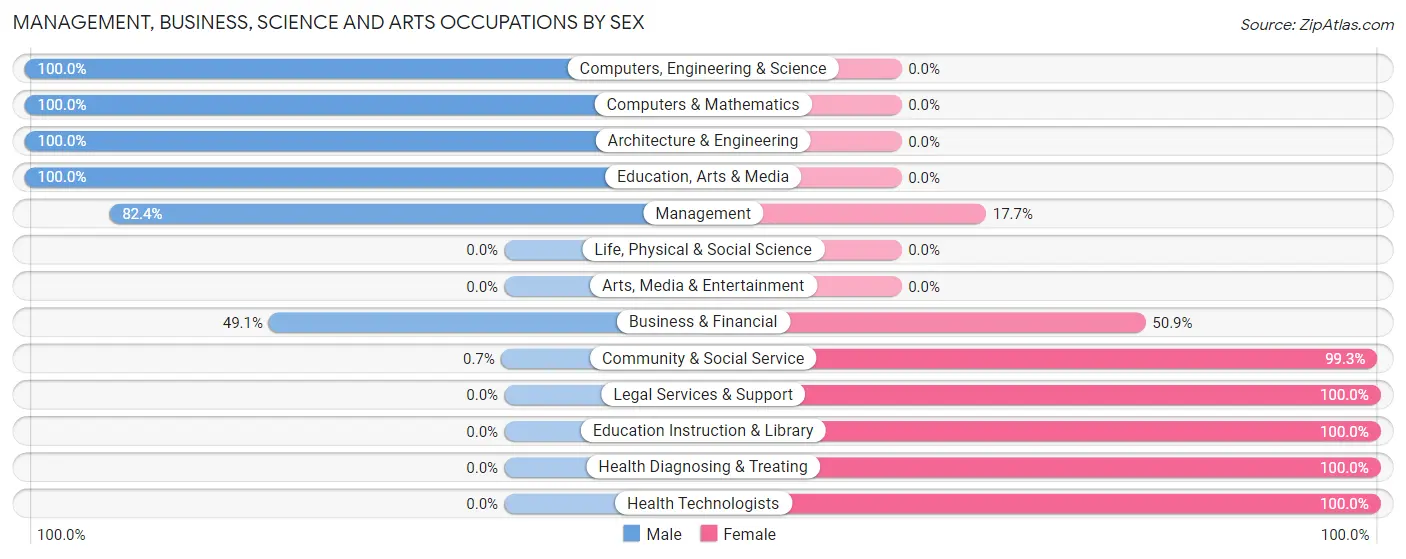
Management, Business, Science and Arts Occupations by Sex
Within the Management, Business, Science and Arts occupations in Feasterville, the most male-oriented occupations are Computers, Engineering & Science (100.0%), Computers & Mathematics (100.0%), and Architecture & Engineering (100.0%), while the most female-oriented occupations are Legal Services & Support (100.0%), Education Instruction & Library (100.0%), and Health Diagnosing & Treating (100.0%).
| Occupation | Male | Female |
| Management | 42 (82.4%) | 9 (17.6%) |
| Business & Financial | 26 (49.1%) | 27 (50.9%) |
| Computers, Engineering & Science | 37 (100.0%) | 0 (0.0%) |
| Computers & Mathematics | 23 (100.0%) | 0 (0.0%) |
| Architecture & Engineering | 14 (100.0%) | 0 (0.0%) |
| Life, Physical & Social Science | 0 (0.0%) | 0 (0.0%) |
| Community & Social Service | 1 (0.7%) | 142 (99.3%) |
| Education, Arts & Media | 1 (100.0%) | 0 (0.0%) |
| Legal Services & Support | 0 (0.0%) | 57 (100.0%) |
| Education Instruction & Library | 0 (0.0%) | 85 (100.0%) |
| Arts, Media & Entertainment | 0 (0.0%) | 0 (0.0%) |
| Health Diagnosing & Treating | 0 (0.0%) | 54 (100.0%) |
| Health Technologists | 0 (0.0%) | 42 (100.0%) |
| Total (Category) | 106 (31.4%) | 232 (68.6%) |
| Total (Overall) | 456 (44.8%) | 563 (55.2%) |
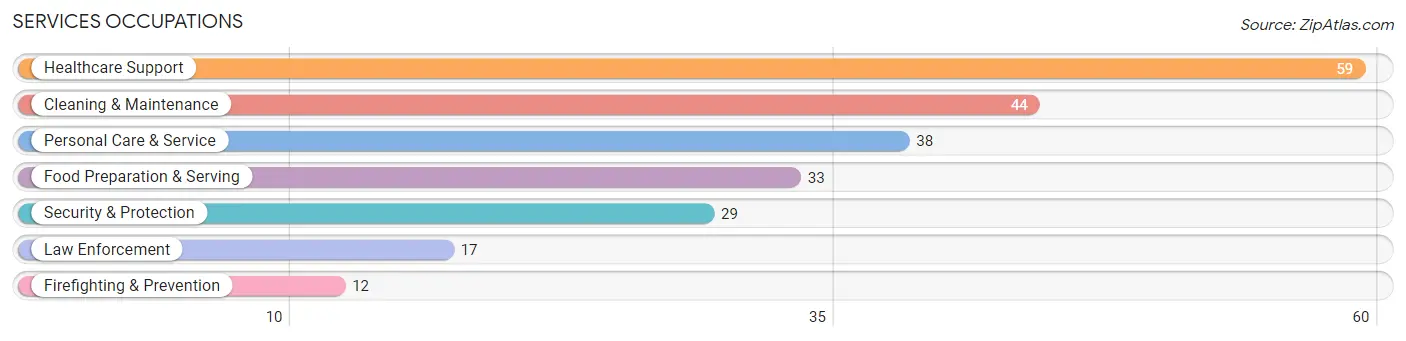
Services Occupations
The most common Services occupations in Feasterville are Healthcare Support (59 | 5.8%), Cleaning & Maintenance (44 | 4.3%), Personal Care & Service (38 | 3.7%), Food Preparation & Serving (33 | 3.2%), and Security & Protection (29 | 2.9%).
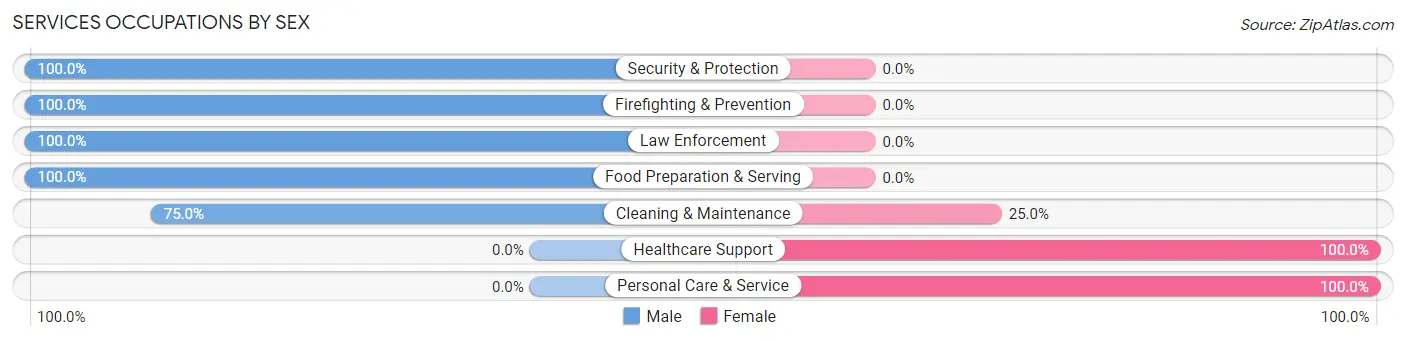
Services Occupations by Sex
Within the Services occupations in Feasterville, the most male-oriented occupations are Security & Protection (100.0%), Firefighting & Prevention (100.0%), and Law Enforcement (100.0%), while the most female-oriented occupations are Healthcare Support (100.0%), Personal Care & Service (100.0%), and Cleaning & Maintenance (25.0%).
| Occupation | Male | Female |
| Healthcare Support | 0 (0.0%) | 59 (100.0%) |
| Security & Protection | 29 (100.0%) | 0 (0.0%) |
| Firefighting & Prevention | 12 (100.0%) | 0 (0.0%) |
| Law Enforcement | 17 (100.0%) | 0 (0.0%) |
| Food Preparation & Serving | 33 (100.0%) | 0 (0.0%) |
| Cleaning & Maintenance | 33 (75.0%) | 11 (25.0%) |
| Personal Care & Service | 0 (0.0%) | 38 (100.0%) |
| Total (Category) | 95 (46.8%) | 108 (53.2%) |
| Total (Overall) | 456 (44.8%) | 563 (55.2%) |
Sales and Office Occupations
The most common Sales and Office occupations in Feasterville are Office & Administration (157 | 15.4%), and Sales & Related (125 | 12.3%).
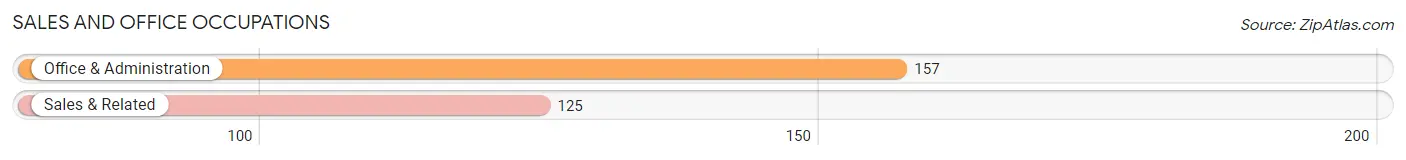
Sales and Office Occupations by Sex
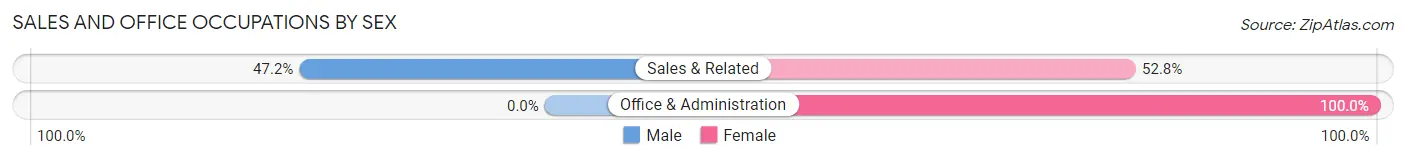
| Occupation | Male | Female |
| Sales & Related | 59 (47.2%) | 66 (52.8%) |
| Office & Administration | 0 (0.0%) | 157 (100.0%) |
| Total (Category) | 59 (20.9%) | 223 (79.1%) |
| Total (Overall) | 456 (44.8%) | 563 (55.2%) |
Natural Resources, Construction and Maintenance Occupations
The most common Natural Resources, Construction and Maintenance occupations in Feasterville are Construction & Extraction (127 | 12.5%), and Installation, Maintenance & Repair (14 | 1.4%).
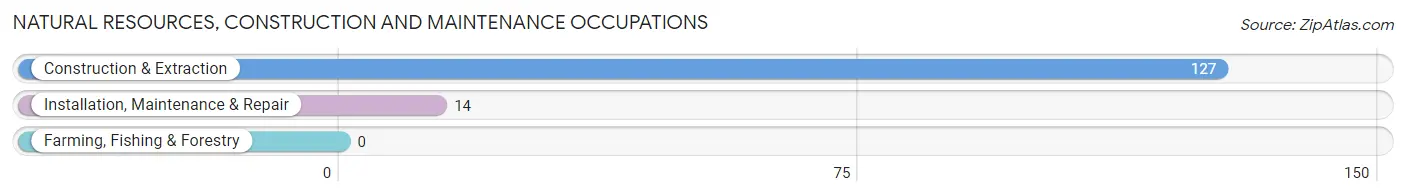
Natural Resources, Construction and Maintenance Occupations by Sex
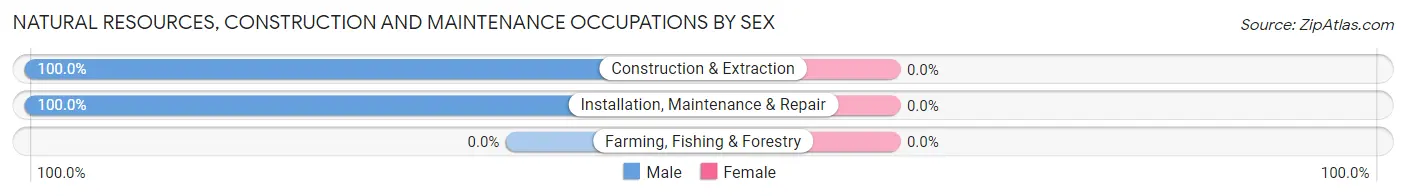
| Occupation | Male | Female |
| Farming, Fishing & Forestry | 0 (0.0%) | 0 (0.0%) |
| Construction & Extraction | 127 (100.0%) | 0 (0.0%) |
| Installation, Maintenance & Repair | 14 (100.0%) | 0 (0.0%) |
| Total (Category) | 141 (100.0%) | 0 (0.0%) |
| Total (Overall) | 456 (44.8%) | 563 (55.2%) |
Production, Transportation and Moving Occupations
The most common Production, Transportation and Moving occupations in Feasterville are , and Transportation (55 | 5.4%).
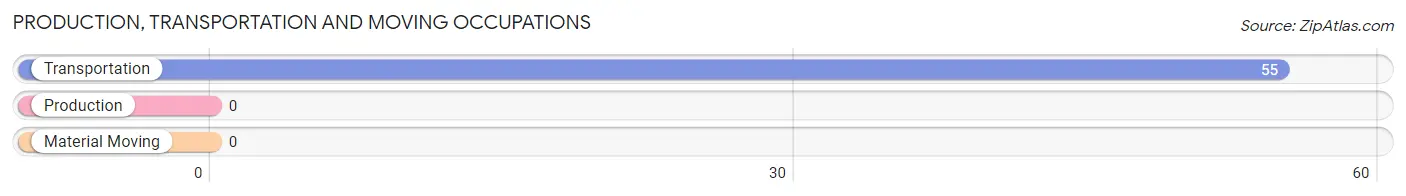
Production, Transportation and Moving Occupations by Sex
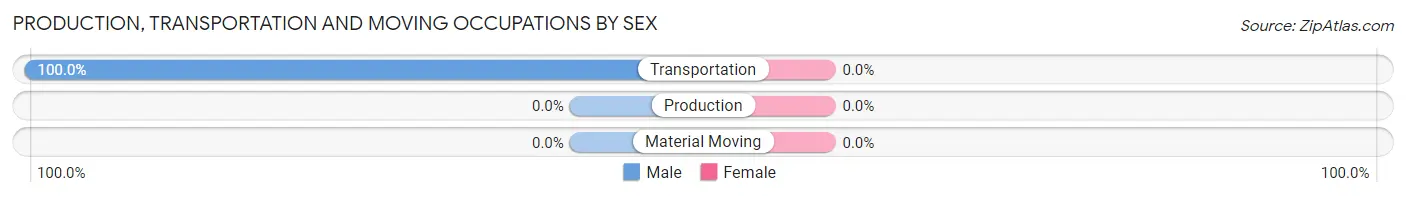
| Occupation | Male | Female |
| Production | 0 (0.0%) | 0 (0.0%) |
| Transportation | 55 (100.0%) | 0 (0.0%) |
| Material Moving | 0 (0.0%) | 0 (0.0%) |
| Total (Category) | 55 (100.0%) | 0 (0.0%) |
| Total (Overall) | 456 (44.8%) | 563 (55.2%) |
Employment Industries by Sex in Feasterville
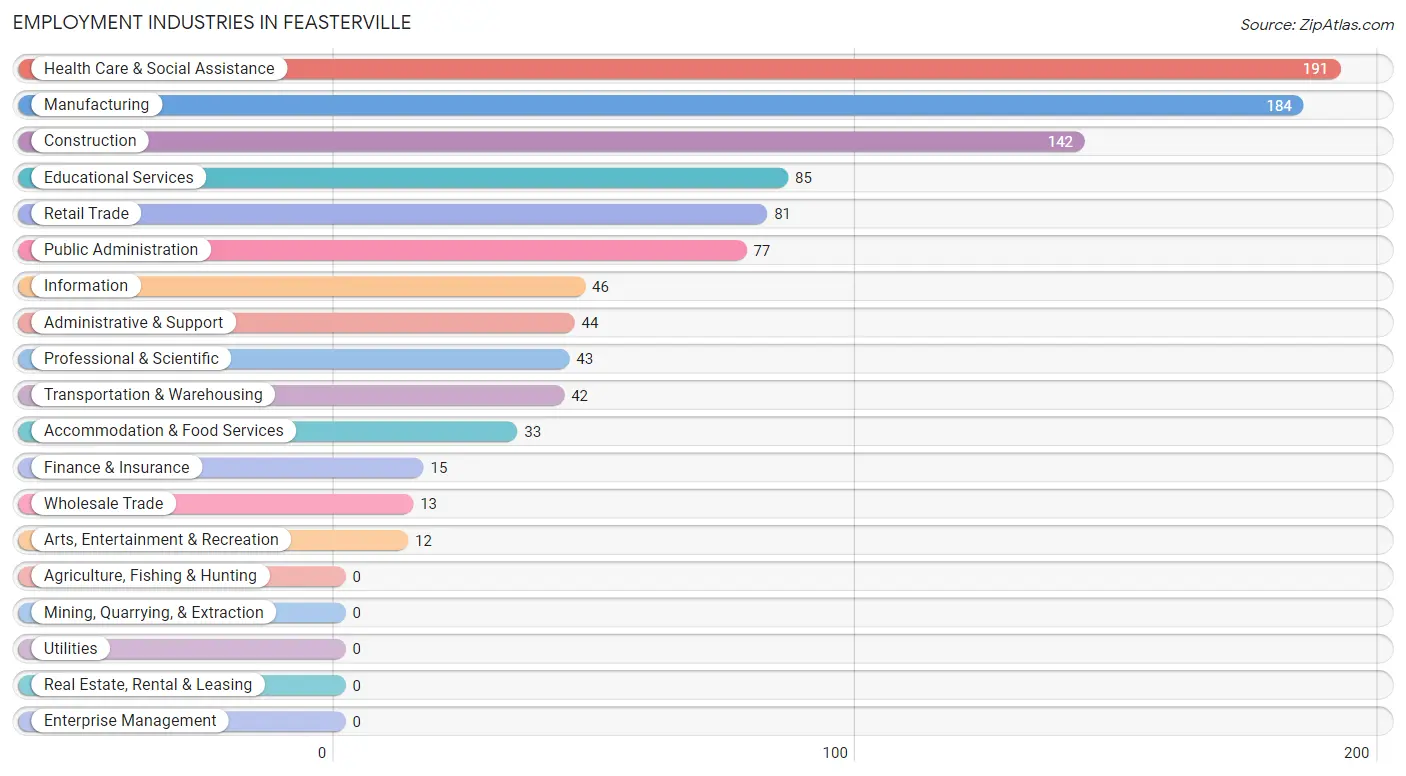
Employment Industries in Feasterville
The major employment industries in Feasterville include Health Care & Social Assistance (191 | 18.7%), Manufacturing (184 | 18.1%), Construction (142 | 13.9%), Educational Services (85 | 8.3%), and Retail Trade (81 | 8.0%).
Employment Industries by Sex in Feasterville
The Feasterville industries that see more men than women are Transportation & Warehousing (100.0%), Arts, Entertainment & Recreation (100.0%), and Accommodation & Food Services (100.0%), whereas the industries that tend to have a higher number of women are Wholesale Trade (100.0%), Finance & Insurance (100.0%), and Professional & Scientific (100.0%).
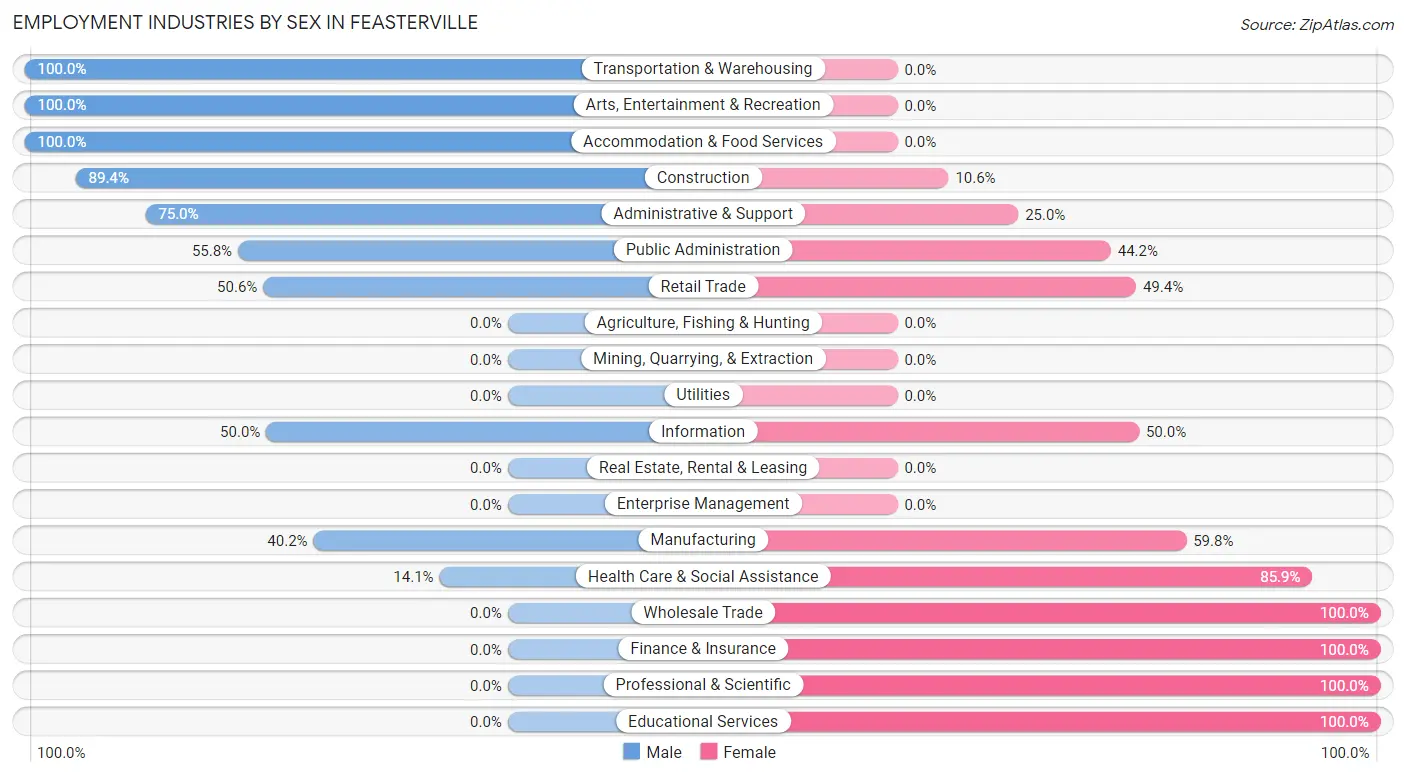
| Industry | Male | Female |
| Agriculture, Fishing & Hunting | 0 (0.0%) | 0 (0.0%) |
| Mining, Quarrying, & Extraction | 0 (0.0%) | 0 (0.0%) |
| Construction | 127 (89.4%) | 15 (10.6%) |
| Manufacturing | 74 (40.2%) | 110 (59.8%) |
| Wholesale Trade | 0 (0.0%) | 13 (100.0%) |
| Retail Trade | 41 (50.6%) | 40 (49.4%) |
| Transportation & Warehousing | 42 (100.0%) | 0 (0.0%) |
| Utilities | 0 (0.0%) | 0 (0.0%) |
| Information | 23 (50.0%) | 23 (50.0%) |
| Finance & Insurance | 0 (0.0%) | 15 (100.0%) |
| Real Estate, Rental & Leasing | 0 (0.0%) | 0 (0.0%) |
| Professional & Scientific | 0 (0.0%) | 43 (100.0%) |
| Enterprise Management | 0 (0.0%) | 0 (0.0%) |
| Administrative & Support | 33 (75.0%) | 11 (25.0%) |
| Educational Services | 0 (0.0%) | 85 (100.0%) |
| Health Care & Social Assistance | 27 (14.1%) | 164 (85.9%) |
| Arts, Entertainment & Recreation | 12 (100.0%) | 0 (0.0%) |
| Accommodation & Food Services | 33 (100.0%) | 0 (0.0%) |
| Public Administration | 43 (55.8%) | 34 (44.2%) |
| Total | 456 (44.8%) | 563 (55.2%) |
Education in Feasterville
School Enrollment in Feasterville
The most common levels of schooling among the 537 students in Feasterville are high school (206 | 38.4%), middle school (122 | 22.7%), and elementary school (79 | 14.7%).
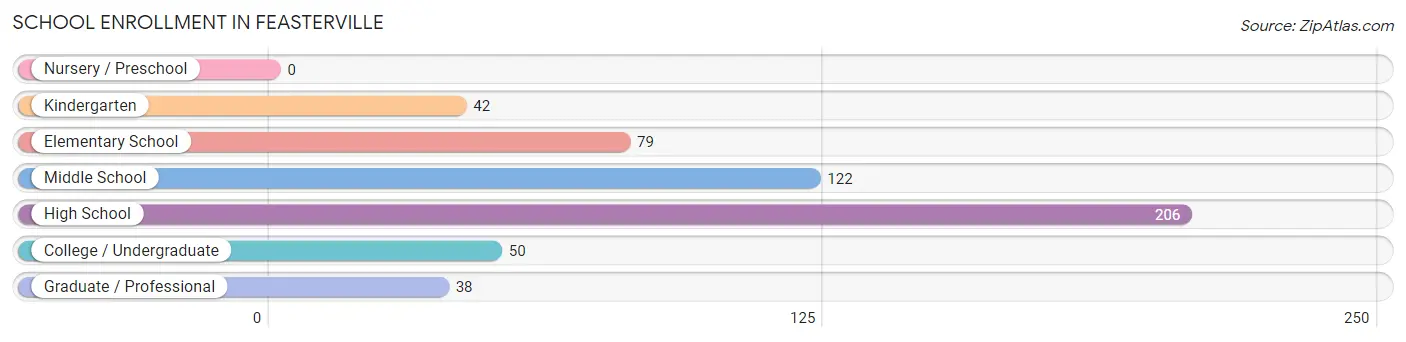
| School Level | # Students | % Students |
| Nursery / Preschool | 0 | 0.0% |
| Kindergarten | 42 | 7.8% |
| Elementary School | 79 | 14.7% |
| Middle School | 122 | 22.7% |
| High School | 206 | 38.4% |
| College / Undergraduate | 50 | 9.3% |
| Graduate / Professional | 38 | 7.1% |
| Total | 537 | 100.0% |
School Enrollment by Age by Funding Source in Feasterville
Out of a total of 537 students who are enrolled in schools in Feasterville, 118 (22.0%) attend a private institution, while the remaining 419 (78.0%) are enrolled in public schools. The age group of 35 years and over has the highest likelihood of being enrolled in private schools, with 58 (81.7% in the age bracket) enrolled. Conversely, the age group of 5 to 9 year old has the lowest likelihood of being enrolled in a private school, with 121 (100.0% in the age bracket) attending a public institution.
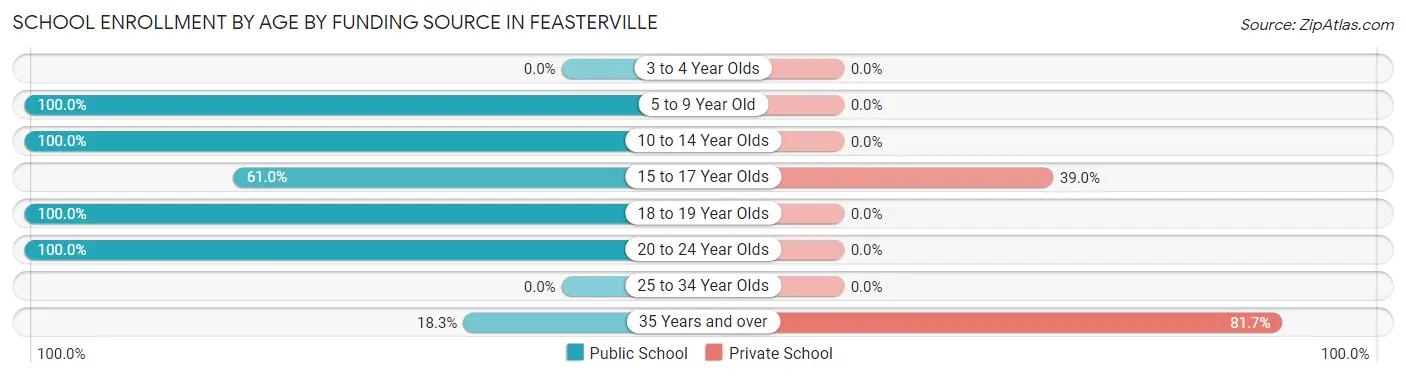
| Age Bracket | Public School | Private School |
| 3 to 4 Year Olds | 0 (0.0%) | 0 (0.0%) |
| 5 to 9 Year Old | 121 (100.0%) | 0 (0.0%) |
| 10 to 14 Year Olds | 122 (100.0%) | 0 (0.0%) |
| 15 to 17 Year Olds | 94 (61.0%) | 60 (39.0%) |
| 18 to 19 Year Olds | 52 (100.0%) | 0 (0.0%) |
| 20 to 24 Year Olds | 17 (100.0%) | 0 (0.0%) |
| 25 to 34 Year Olds | 0 (0.0%) | 0 (0.0%) |
| 35 Years and over | 13 (18.3%) | 58 (81.7%) |
| Total | 419 (78.0%) | 118 (22.0%) |
Educational Attainment by Field of Study in Feasterville
Business (136 | 25.6%), education (87 | 16.4%), engineering (78 | 14.7%), bio, nature & agricultural (46 | 8.6%), and science & technology (39 | 7.3%) are the most common fields of study among 532 individuals in Feasterville who have obtained a bachelor's degree or higher.
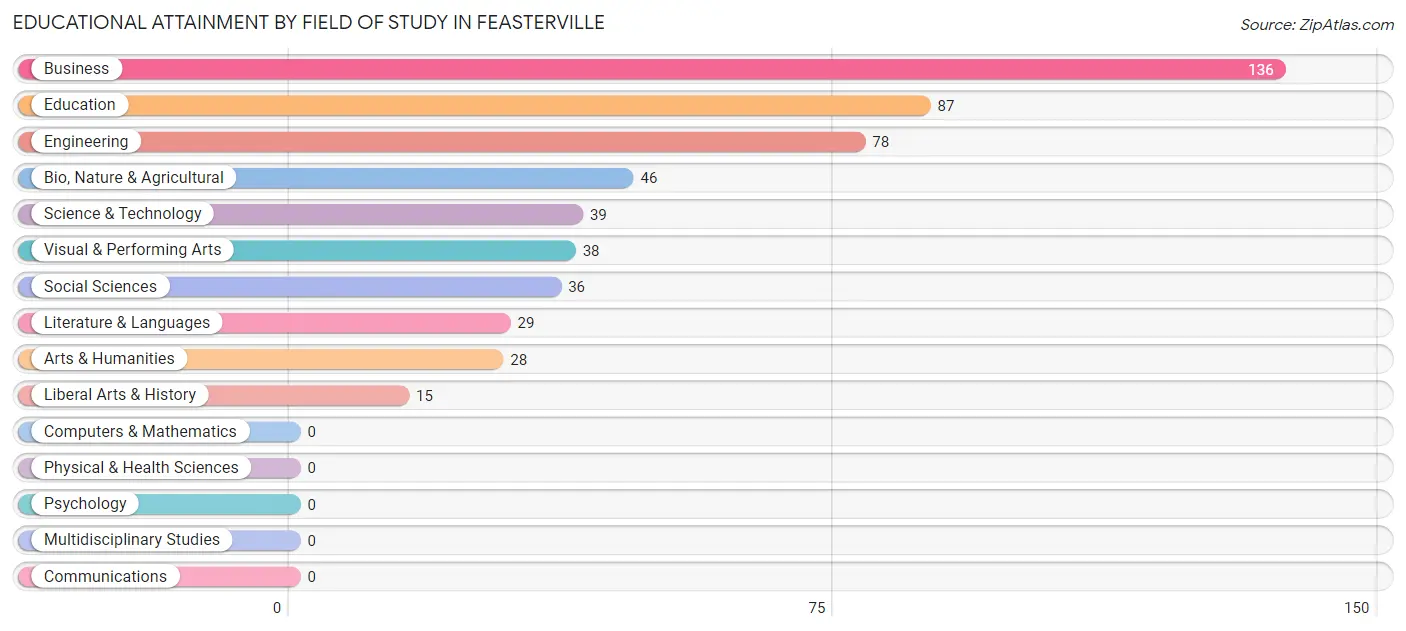
| Field of Study | # Graduates | % Graduates |
| Computers & Mathematics | 0 | 0.0% |
| Bio, Nature & Agricultural | 46 | 8.6% |
| Physical & Health Sciences | 0 | 0.0% |
| Psychology | 0 | 0.0% |
| Social Sciences | 36 | 6.8% |
| Engineering | 78 | 14.7% |
| Multidisciplinary Studies | 0 | 0.0% |
| Science & Technology | 39 | 7.3% |
| Business | 136 | 25.6% |
| Education | 87 | 16.4% |
| Literature & Languages | 29 | 5.4% |
| Liberal Arts & History | 15 | 2.8% |
| Visual & Performing Arts | 38 | 7.1% |
| Communications | 0 | 0.0% |
| Arts & Humanities | 28 | 5.3% |
| Total | 532 | 100.0% |
Transportation & Commute in Feasterville
Vehicle Availability by Sex in Feasterville
The most prevalent vehicle ownership categories in Feasterville are males with 3 vehicles (201, accounting for 44.2%) and females with 3 vehicles (233, making up 37.6%).
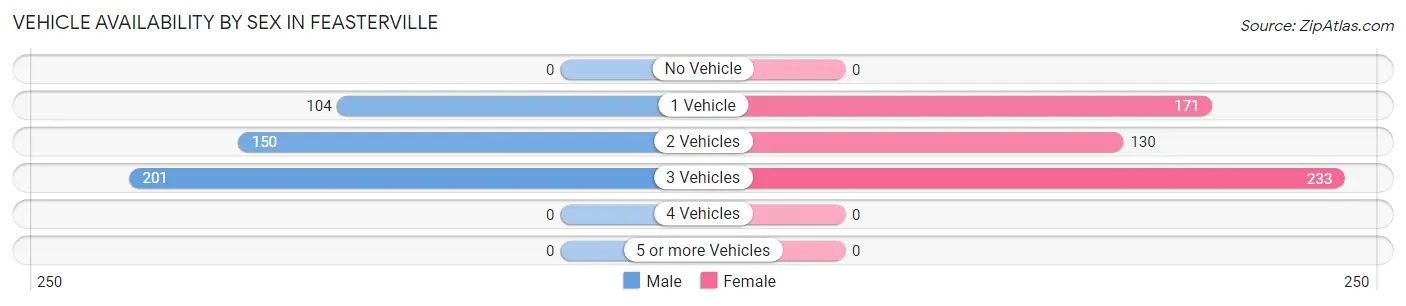
| Vehicles Available | Male | Female |
| No Vehicle | 0 (0.0%) | 0 (0.0%) |
| 1 Vehicle | 104 (22.9%) | 171 (32.0%) |
| 2 Vehicles | 150 (33.0%) | 130 (24.3%) |
| 3 Vehicles | 201 (44.2%) | 233 (43.6%) |
| 4 Vehicles | 0 (0.0%) | 0 (0.0%) |
| 5 or more Vehicles | 0 (0.0%) | 0 (0.0%) |
| Total | 455 (100.0%) | 534 (100.0%) |
Commute Time in Feasterville
The most frequently occuring commute durations in Feasterville are 15 to 19 minutes (264 commuters, 26.5%), 20 to 24 minutes (168 commuters, 16.9%), and 90 or more minutes (130 commuters, 13.1%).
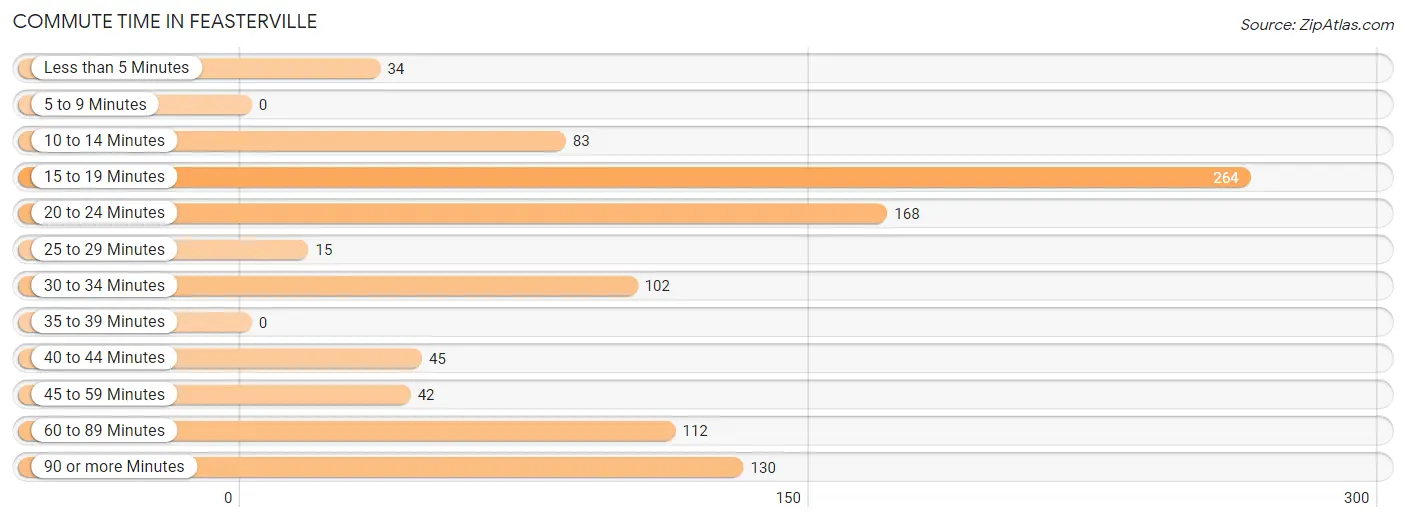
| Commute Time | # Commuters | % Commuters |
| Less than 5 Minutes | 34 | 3.4% |
| 5 to 9 Minutes | 0 | 0.0% |
| 10 to 14 Minutes | 83 | 8.3% |
| 15 to 19 Minutes | 264 | 26.5% |
| 20 to 24 Minutes | 168 | 16.9% |
| 25 to 29 Minutes | 15 | 1.5% |
| 30 to 34 Minutes | 102 | 10.2% |
| 35 to 39 Minutes | 0 | 0.0% |
| 40 to 44 Minutes | 45 | 4.5% |
| 45 to 59 Minutes | 42 | 4.2% |
| 60 to 89 Minutes | 112 | 11.3% |
| 90 or more Minutes | 130 | 13.1% |
Commute Time by Sex in Feasterville
The most common commute times in Feasterville are 15 to 19 minutes (141 commuters, 31.0%) for males and 15 to 19 minutes (123 commuters, 22.8%) for females.
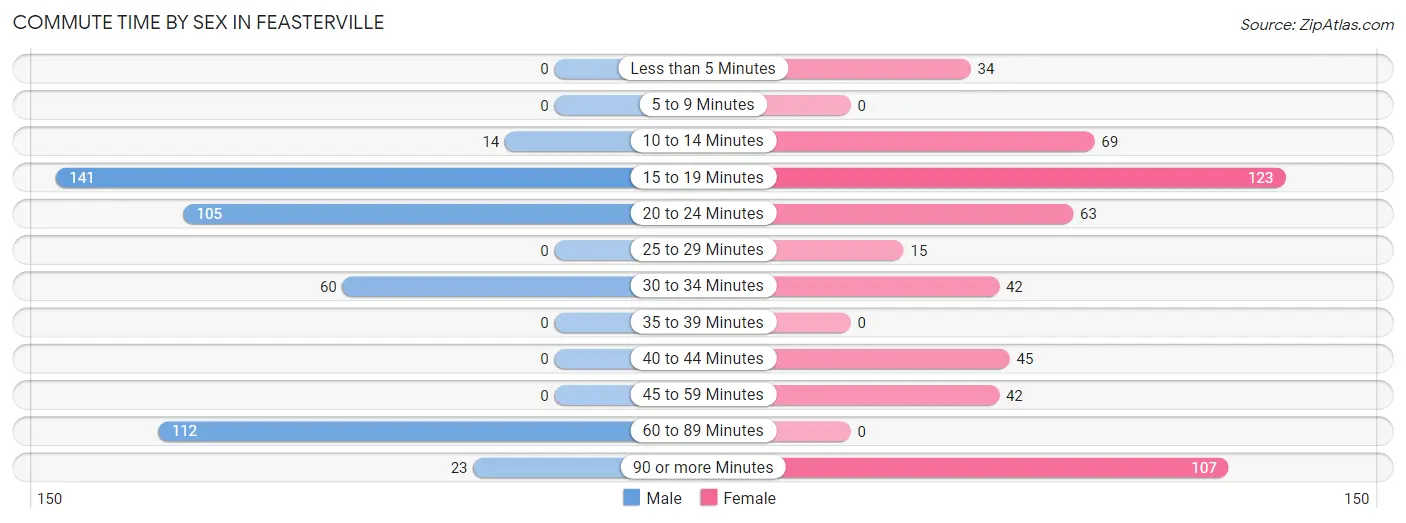
| Commute Time | Male | Female |
| Less than 5 Minutes | 0 (0.0%) | 34 (6.3%) |
| 5 to 9 Minutes | 0 (0.0%) | 0 (0.0%) |
| 10 to 14 Minutes | 14 (3.1%) | 69 (12.8%) |
| 15 to 19 Minutes | 141 (31.0%) | 123 (22.8%) |
| 20 to 24 Minutes | 105 (23.1%) | 63 (11.7%) |
| 25 to 29 Minutes | 0 (0.0%) | 15 (2.8%) |
| 30 to 34 Minutes | 60 (13.2%) | 42 (7.8%) |
| 35 to 39 Minutes | 0 (0.0%) | 0 (0.0%) |
| 40 to 44 Minutes | 0 (0.0%) | 45 (8.3%) |
| 45 to 59 Minutes | 0 (0.0%) | 42 (7.8%) |
| 60 to 89 Minutes | 112 (24.6%) | 0 (0.0%) |
| 90 or more Minutes | 23 (5.1%) | 107 (19.8%) |
Time of Departure to Work by Sex in Feasterville
The most frequent times of departure to work in Feasterville are 7:00 AM to 7:29 AM (128, 28.1%) for males and 8:00 AM to 8:29 AM (98, 18.1%) for females.
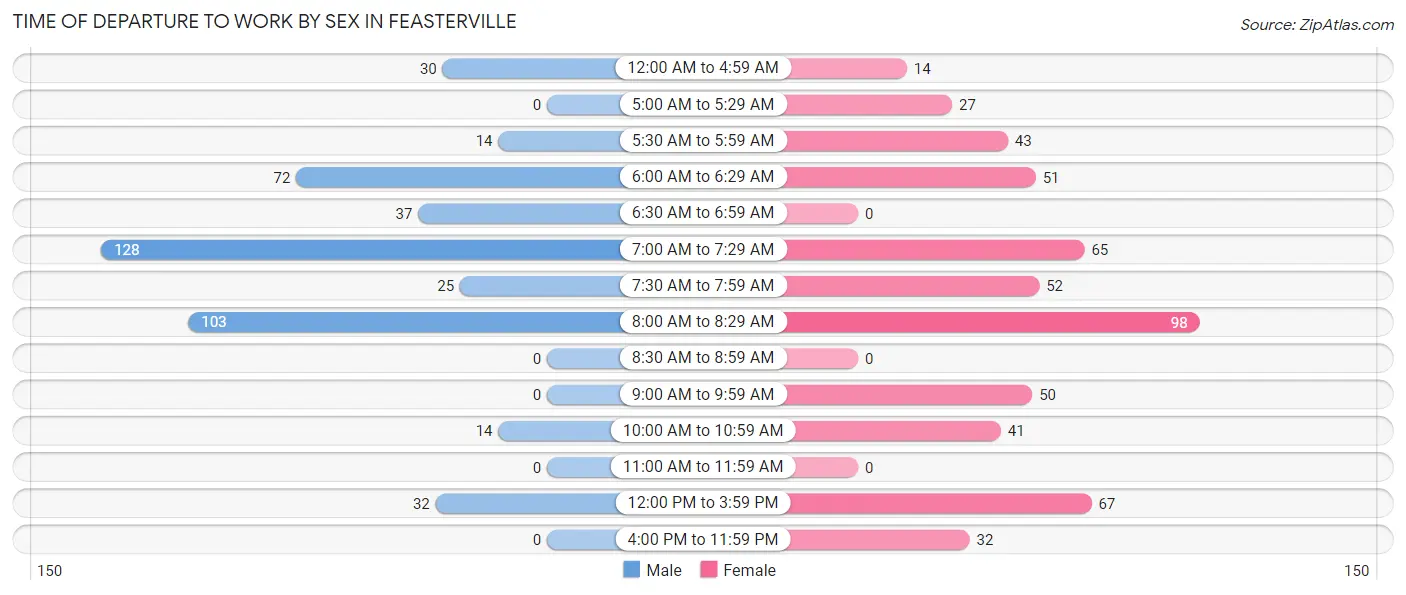
| Time of Departure | Male | Female |
| 12:00 AM to 4:59 AM | 30 (6.6%) | 14 (2.6%) |
| 5:00 AM to 5:29 AM | 0 (0.0%) | 27 (5.0%) |
| 5:30 AM to 5:59 AM | 14 (3.1%) | 43 (8.0%) |
| 6:00 AM to 6:29 AM | 72 (15.8%) | 51 (9.4%) |
| 6:30 AM to 6:59 AM | 37 (8.1%) | 0 (0.0%) |
| 7:00 AM to 7:29 AM | 128 (28.1%) | 65 (12.0%) |
| 7:30 AM to 7:59 AM | 25 (5.5%) | 52 (9.6%) |
| 8:00 AM to 8:29 AM | 103 (22.6%) | 98 (18.1%) |
| 8:30 AM to 8:59 AM | 0 (0.0%) | 0 (0.0%) |
| 9:00 AM to 9:59 AM | 0 (0.0%) | 50 (9.3%) |
| 10:00 AM to 10:59 AM | 14 (3.1%) | 41 (7.6%) |
| 11:00 AM to 11:59 AM | 0 (0.0%) | 0 (0.0%) |
| 12:00 PM to 3:59 PM | 32 (7.0%) | 67 (12.4%) |
| 4:00 PM to 11:59 PM | 0 (0.0%) | 32 (5.9%) |
| Total | 455 (100.0%) | 540 (100.0%) |
Housing Occupancy in Feasterville
Occupancy by Ownership in Feasterville
Of the total 799 dwellings in Feasterville, owner-occupied units account for 406 (50.8%), while renter-occupied units make up 393 (49.2%).
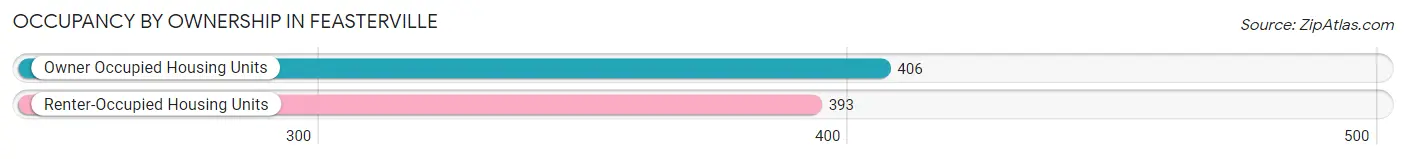
| Occupancy | # Housing Units | % Housing Units |
| Owner Occupied Housing Units | 406 | 50.8% |
| Renter-Occupied Housing Units | 393 | 49.2% |
| Total Occupied Housing Units | 799 | 100.0% |
Occupancy by Household Size in Feasterville
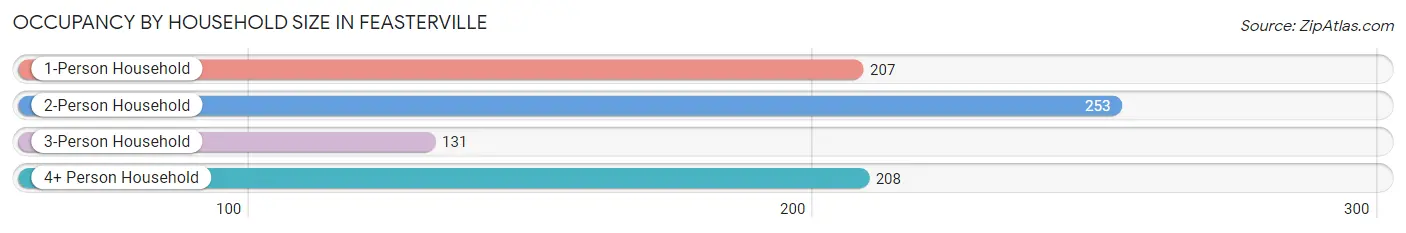
| Household Size | # Housing Units | % Housing Units |
| 1-Person Household | 207 | 25.9% |
| 2-Person Household | 253 | 31.7% |
| 3-Person Household | 131 | 16.4% |
| 4+ Person Household | 208 | 26.0% |
| Total Housing Units | 799 | 100.0% |
Occupancy by Ownership by Household Size in Feasterville
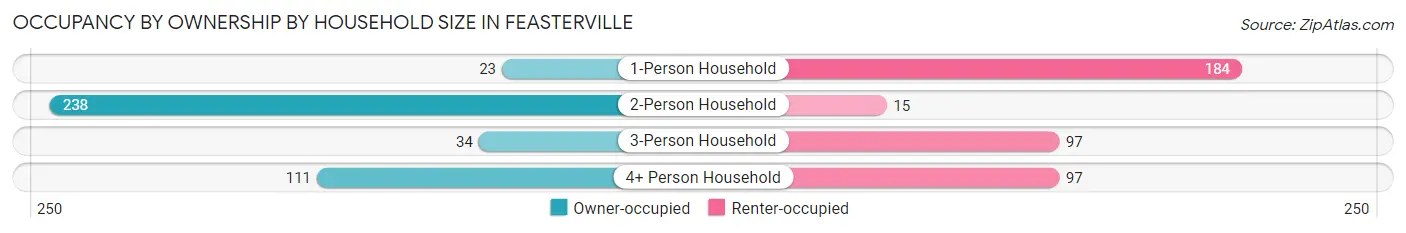
| Household Size | Owner-occupied | Renter-occupied |
| 1-Person Household | 23 (11.1%) | 184 (88.9%) |
| 2-Person Household | 238 (94.1%) | 15 (5.9%) |
| 3-Person Household | 34 (26.0%) | 97 (74.1%) |
| 4+ Person Household | 111 (53.4%) | 97 (46.6%) |
| Total Housing Units | 406 (50.8%) | 393 (49.2%) |
Occupancy by Educational Attainment in Feasterville
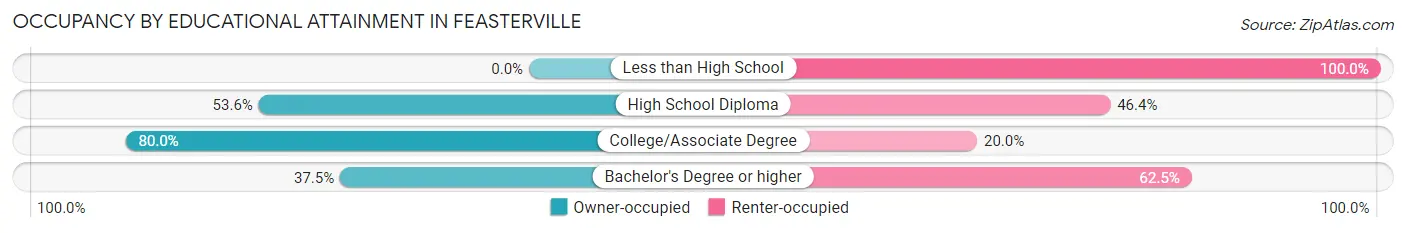
| Household Size | Owner-occupied | Renter-occupied |
| Less than High School | 0 (0.0%) | 55 (100.0%) |
| High School Diploma | 112 (53.6%) | 97 (46.4%) |
| College/Associate Degree | 176 (80.0%) | 44 (20.0%) |
| Bachelor's Degree or higher | 118 (37.5%) | 197 (62.5%) |
Occupancy by Age of Householder in Feasterville
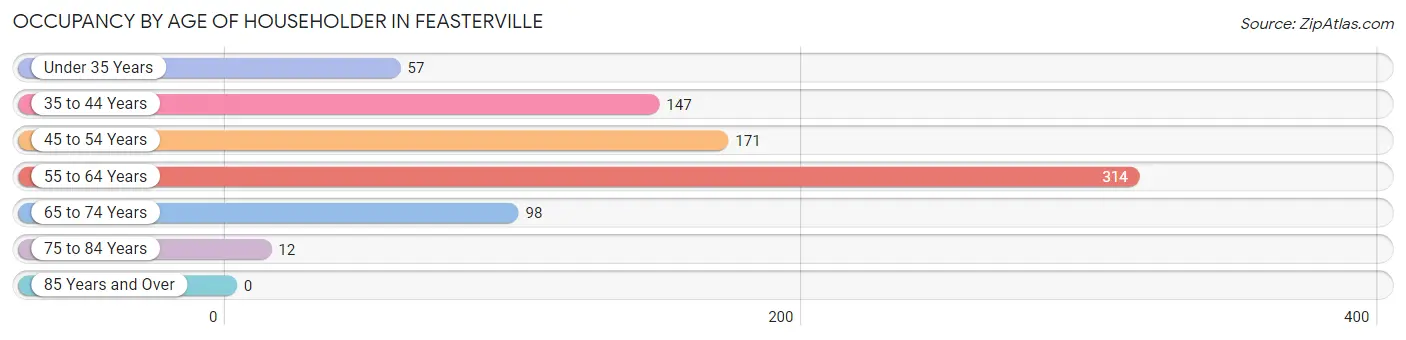
| Age Bracket | # Households | % Households |
| Under 35 Years | 57 | 7.1% |
| 35 to 44 Years | 147 | 18.4% |
| 45 to 54 Years | 171 | 21.4% |
| 55 to 64 Years | 314 | 39.3% |
| 65 to 74 Years | 98 | 12.3% |
| 75 to 84 Years | 12 | 1.5% |
| 85 Years and Over | 0 | 0.0% |
| Total | 799 | 100.0% |
Housing Finances in Feasterville
Median Income by Occupancy in Feasterville
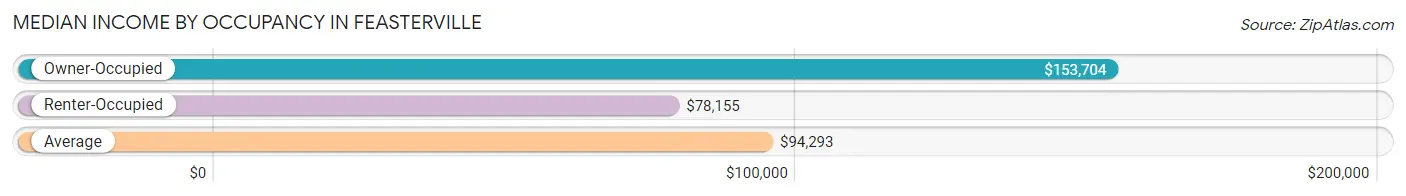
| Occupancy Type | # Households | Median Income |
| Owner-Occupied | 406 (50.8%) | $153,704 |
| Renter-Occupied | 393 (49.2%) | $78,155 |
| Average | 799 (100.0%) | $94,293 |
Occupancy by Householder Income Bracket in Feasterville
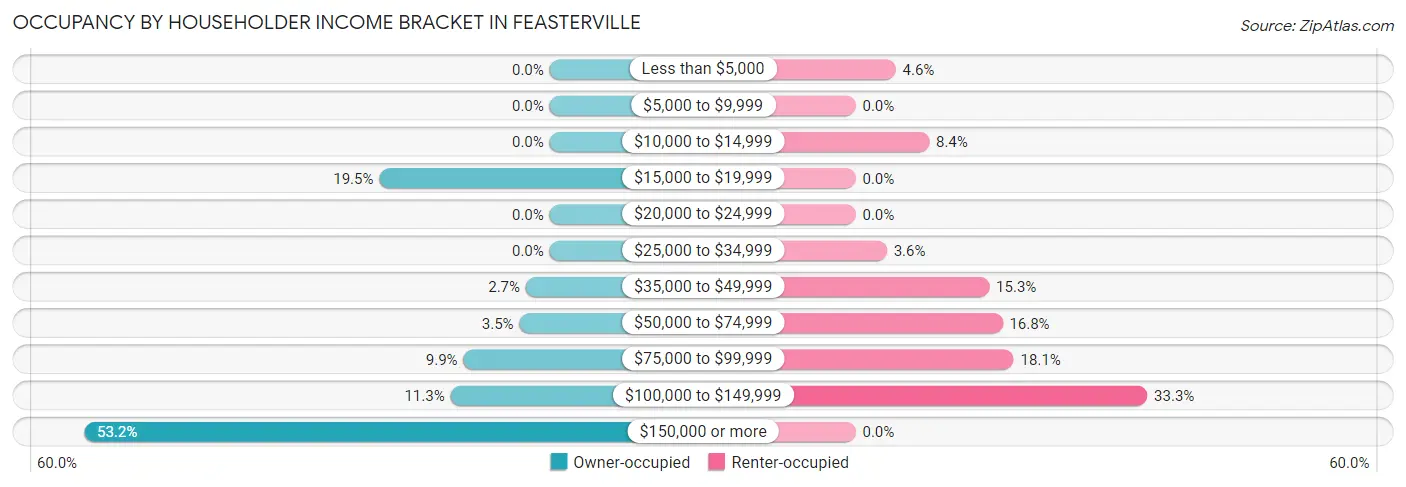
| Income Bracket | Owner-occupied | Renter-occupied |
| Less than $5,000 | 0 (0.0%) | 18 (4.6%) |
| $5,000 to $9,999 | 0 (0.0%) | 0 (0.0%) |
| $10,000 to $14,999 | 0 (0.0%) | 33 (8.4%) |
| $15,000 to $19,999 | 79 (19.5%) | 0 (0.0%) |
| $20,000 to $24,999 | 0 (0.0%) | 0 (0.0%) |
| $25,000 to $34,999 | 0 (0.0%) | 14 (3.6%) |
| $35,000 to $49,999 | 11 (2.7%) | 60 (15.3%) |
| $50,000 to $74,999 | 14 (3.5%) | 66 (16.8%) |
| $75,000 to $99,999 | 40 (9.9%) | 71 (18.1%) |
| $100,000 to $149,999 | 46 (11.3%) | 131 (33.3%) |
| $150,000 or more | 216 (53.2%) | 0 (0.0%) |
| Total | 406 (100.0%) | 393 (100.0%) |
Monthly Housing Cost Tiers in Feasterville
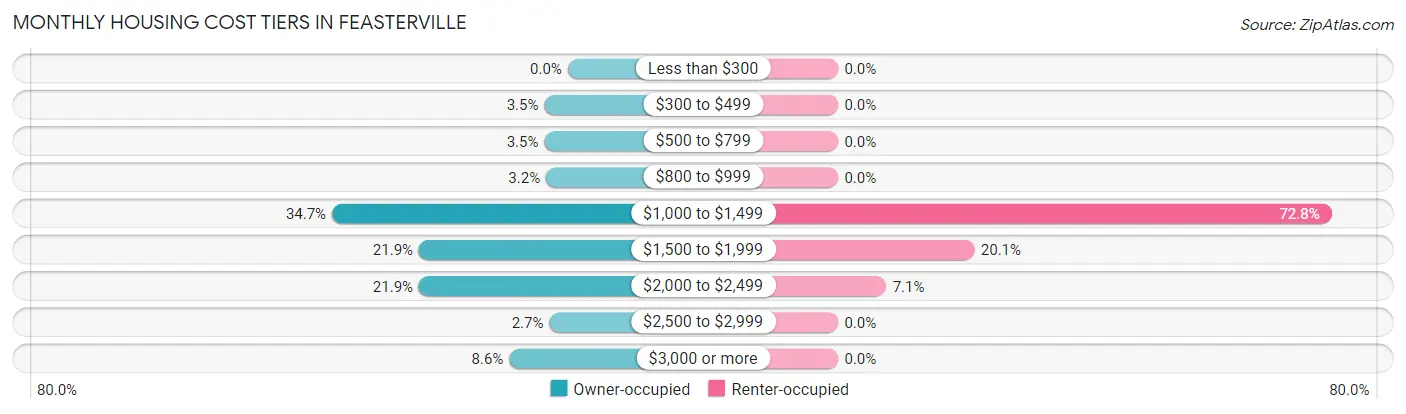
| Monthly Cost | Owner-occupied | Renter-occupied |
| Less than $300 | 0 (0.0%) | 0 (0.0%) |
| $300 to $499 | 14 (3.5%) | 0 (0.0%) |
| $500 to $799 | 14 (3.5%) | 0 (0.0%) |
| $800 to $999 | 13 (3.2%) | 0 (0.0%) |
| $1,000 to $1,499 | 141 (34.7%) | 286 (72.8%) |
| $1,500 to $1,999 | 89 (21.9%) | 79 (20.1%) |
| $2,000 to $2,499 | 89 (21.9%) | 28 (7.1%) |
| $2,500 to $2,999 | 11 (2.7%) | 0 (0.0%) |
| $3,000 or more | 35 (8.6%) | 0 (0.0%) |
| Total | 406 (100.0%) | 393 (100.0%) |
Physical Housing Characteristics in Feasterville
Housing Structures in Feasterville
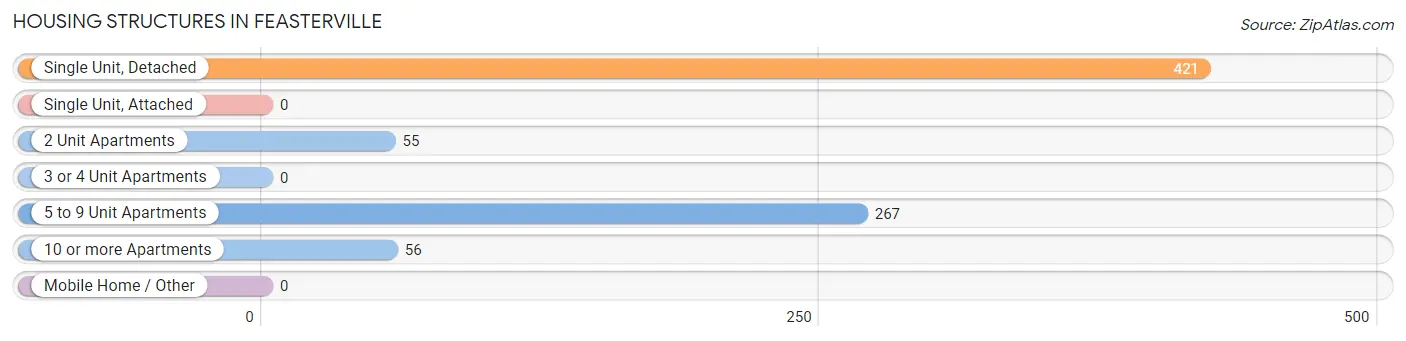
| Structure Type | # Housing Units | % Housing Units |
| Single Unit, Detached | 421 | 52.7% |
| Single Unit, Attached | 0 | 0.0% |
| 2 Unit Apartments | 55 | 6.9% |
| 3 or 4 Unit Apartments | 0 | 0.0% |
| 5 to 9 Unit Apartments | 267 | 33.4% |
| 10 or more Apartments | 56 | 7.0% |
| Mobile Home / Other | 0 | 0.0% |
| Total | 799 | 100.0% |
Housing Structures by Occupancy in Feasterville
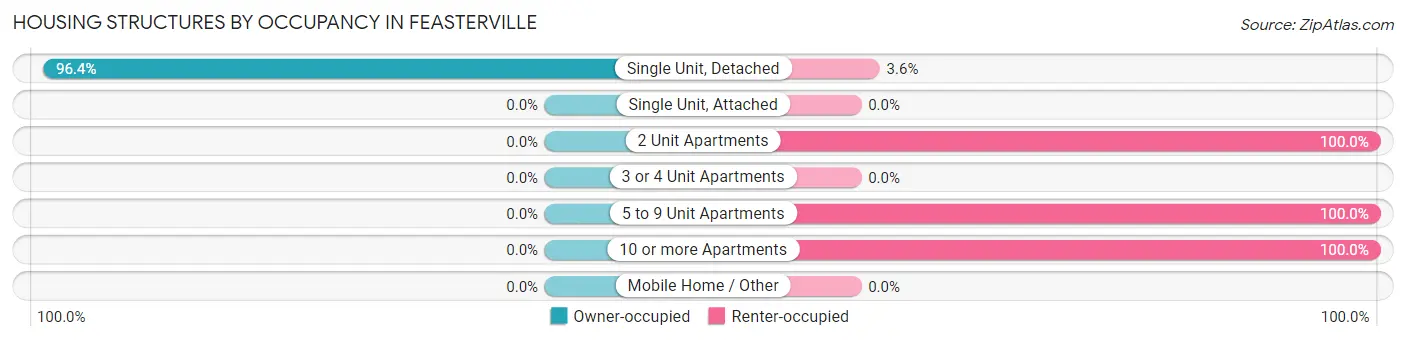
| Structure Type | Owner-occupied | Renter-occupied |
| Single Unit, Detached | 406 (96.4%) | 15 (3.6%) |
| Single Unit, Attached | 0 (0.0%) | 0 (0.0%) |
| 2 Unit Apartments | 0 (0.0%) | 55 (100.0%) |
| 3 or 4 Unit Apartments | 0 (0.0%) | 0 (0.0%) |
| 5 to 9 Unit Apartments | 0 (0.0%) | 267 (100.0%) |
| 10 or more Apartments | 0 (0.0%) | 56 (100.0%) |
| Mobile Home / Other | 0 (0.0%) | 0 (0.0%) |
| Total | 406 (50.8%) | 393 (49.2%) |
Housing Structures by Number of Rooms in Feasterville
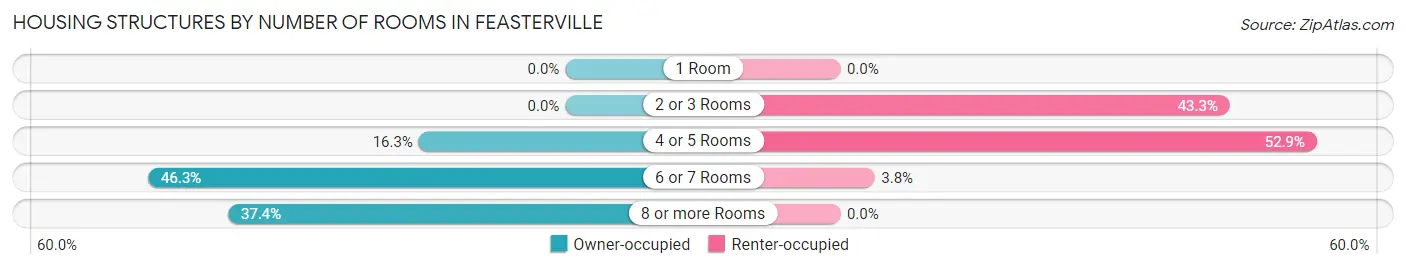
| Number of Rooms | Owner-occupied | Renter-occupied |
| 1 Room | 0 (0.0%) | 0 (0.0%) |
| 2 or 3 Rooms | 0 (0.0%) | 170 (43.3%) |
| 4 or 5 Rooms | 66 (16.3%) | 208 (52.9%) |
| 6 or 7 Rooms | 188 (46.3%) | 15 (3.8%) |
| 8 or more Rooms | 152 (37.4%) | 0 (0.0%) |
| Total | 406 (100.0%) | 393 (100.0%) |
Housing Structure by Heating Type in Feasterville
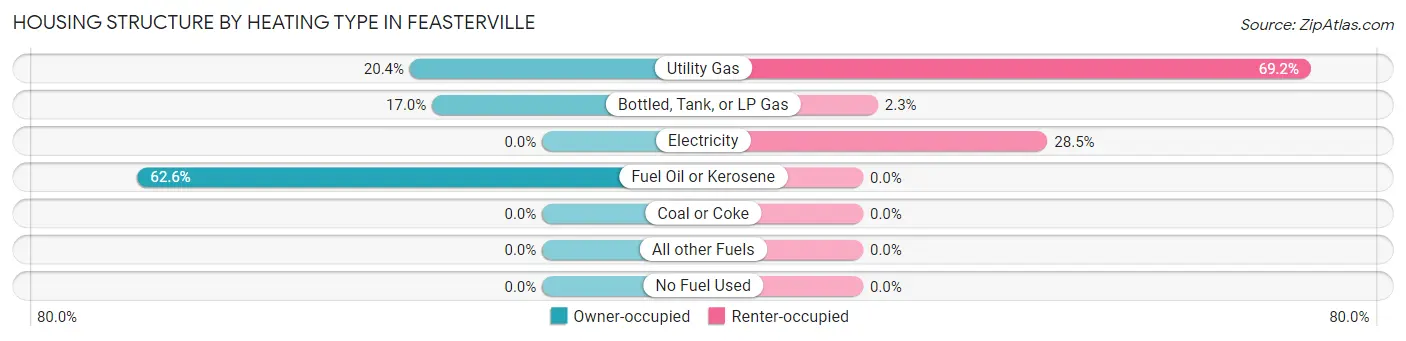
| Heating Type | Owner-occupied | Renter-occupied |
| Utility Gas | 83 (20.4%) | 272 (69.2%) |
| Bottled, Tank, or LP Gas | 69 (17.0%) | 9 (2.3%) |
| Electricity | 0 (0.0%) | 112 (28.5%) |
| Fuel Oil or Kerosene | 254 (62.6%) | 0 (0.0%) |
| Coal or Coke | 0 (0.0%) | 0 (0.0%) |
| All other Fuels | 0 (0.0%) | 0 (0.0%) |
| No Fuel Used | 0 (0.0%) | 0 (0.0%) |
| Total | 406 (100.0%) | 393 (100.0%) |
Household Vehicle Usage in Feasterville
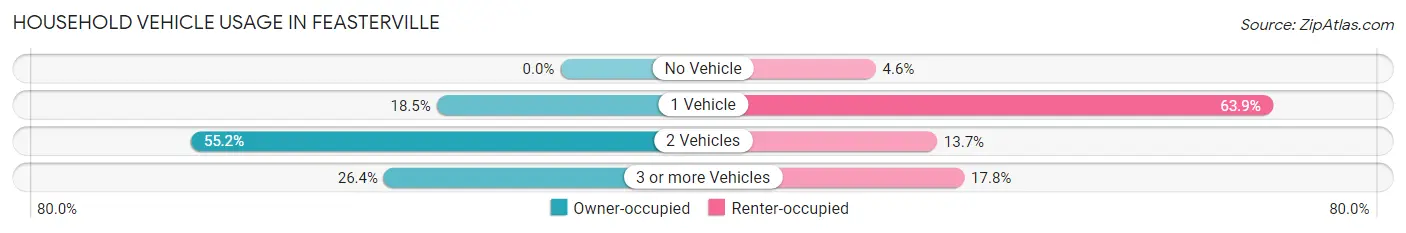
| Vehicles per Household | Owner-occupied | Renter-occupied |
| No Vehicle | 0 (0.0%) | 18 (4.6%) |
| 1 Vehicle | 75 (18.5%) | 251 (63.9%) |
| 2 Vehicles | 224 (55.2%) | 54 (13.7%) |
| 3 or more Vehicles | 107 (26.4%) | 70 (17.8%) |
| Total | 406 (100.0%) | 393 (100.0%) |
Real Estate & Mortgages in Feasterville
Real Estate and Mortgage Overview in Feasterville
| Characteristic | Without Mortgage | With Mortgage |
| Housing Units | 55 | 351 |
| Median Property Value | $448,200 | $335,700 |
| Median Household Income | $250,001 | $175 |
| Monthly Housing Costs | $1,402 | $35 |
| Real Estate Taxes | - | - |
Property Value by Mortgage Status in Feasterville
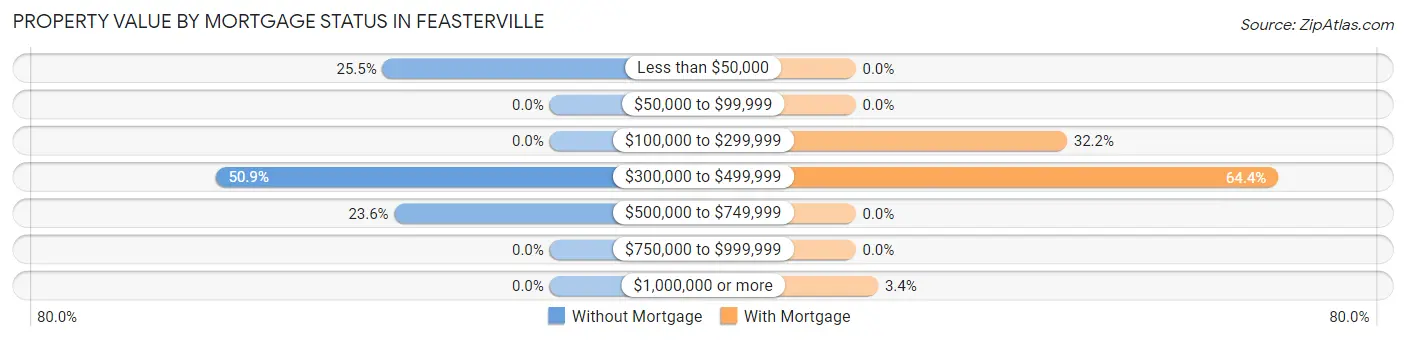
| Property Value | Without Mortgage | With Mortgage |
| Less than $50,000 | 14 (25.5%) | 0 (0.0%) |
| $50,000 to $99,999 | 0 (0.0%) | 0 (0.0%) |
| $100,000 to $299,999 | 0 (0.0%) | 113 (32.2%) |
| $300,000 to $499,999 | 28 (50.9%) | 226 (64.4%) |
| $500,000 to $749,999 | 13 (23.6%) | 0 (0.0%) |
| $750,000 to $999,999 | 0 (0.0%) | 0 (0.0%) |
| $1,000,000 or more | 0 (0.0%) | 12 (3.4%) |
| Total | 55 (100.0%) | 351 (100.0%) |
Household Income by Mortgage Status in Feasterville
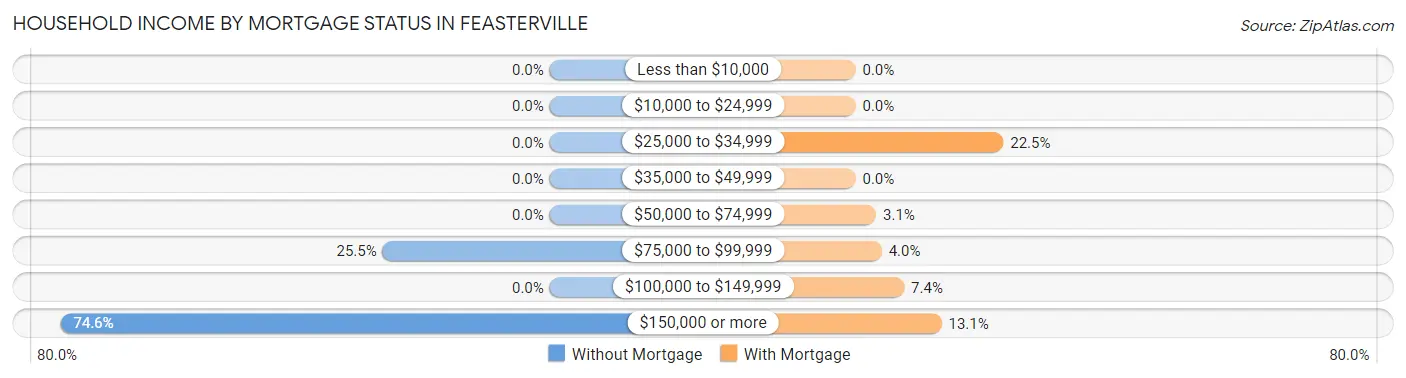
| Household Income | Without Mortgage | With Mortgage |
| Less than $10,000 | 0 (0.0%) | 0 (0.0%) |
| $10,000 to $24,999 | 0 (0.0%) | 0 (0.0%) |
| $25,000 to $34,999 | 0 (0.0%) | 79 (22.5%) |
| $35,000 to $49,999 | 0 (0.0%) | 0 (0.0%) |
| $50,000 to $74,999 | 0 (0.0%) | 11 (3.1%) |
| $75,000 to $99,999 | 14 (25.5%) | 14 (4.0%) |
| $100,000 to $149,999 | 0 (0.0%) | 26 (7.4%) |
| $150,000 or more | 41 (74.6%) | 46 (13.1%) |
| Total | 55 (100.0%) | 351 (100.0%) |
Property Value to Household Income Ratio in Feasterville
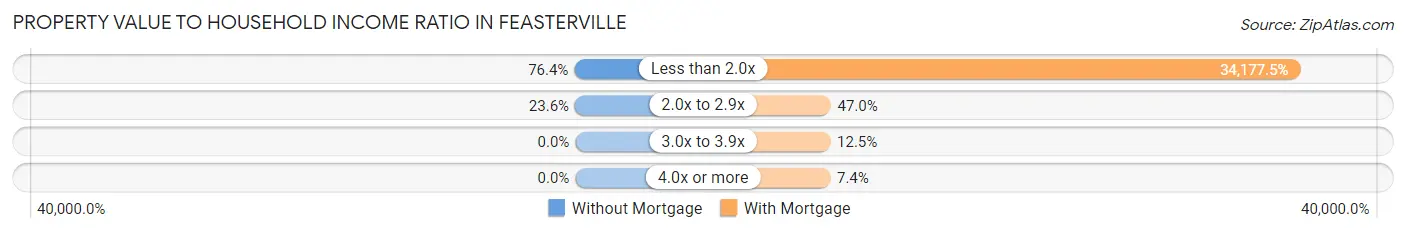
| Value-to-Income Ratio | Without Mortgage | With Mortgage |
| Less than 2.0x | 42 (76.4%) | 119,963 (34,177.5%) |
| 2.0x to 2.9x | 13 (23.6%) | 165 (47.0%) |
| 3.0x to 3.9x | 0 (0.0%) | 44 (12.5%) |
| 4.0x or more | 0 (0.0%) | 26 (7.4%) |
| Total | 55 (100.0%) | 351 (100.0%) |
Real Estate Taxes by Mortgage Status in Feasterville
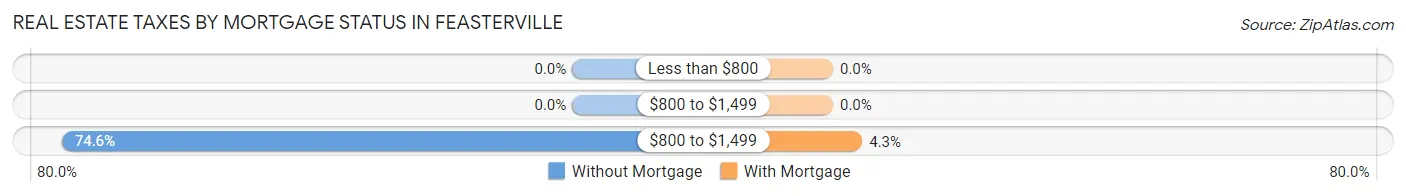
| Property Taxes | Without Mortgage | With Mortgage |
| Less than $800 | 0 (0.0%) | 0 (0.0%) |
| $800 to $1,499 | 0 (0.0%) | 0 (0.0%) |
| $800 to $1,499 | 41 (74.6%) | 15 (4.3%) |
| Total | 55 (100.0%) | 351 (100.0%) |
Health & Disability in Feasterville
Health Insurance Coverage by Age in Feasterville
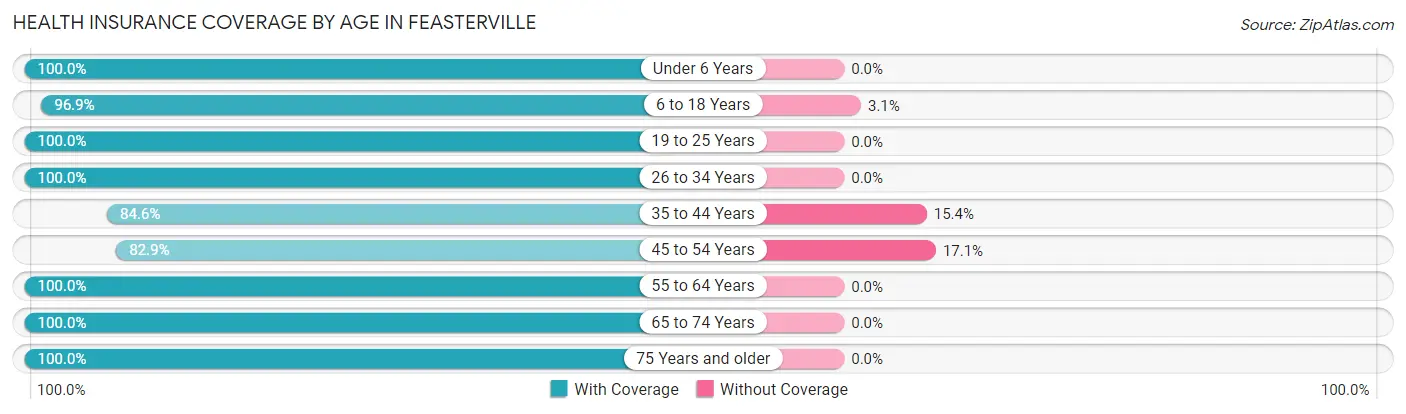
| Age Bracket | With Coverage | Without Coverage |
| Under 6 Years | 40 (100.0%) | 0 (0.0%) |
| 6 to 18 Years | 435 (96.9%) | 14 (3.1%) |
| 19 to 25 Years | 32 (100.0%) | 0 (0.0%) |
| 26 to 34 Years | 85 (100.0%) | 0 (0.0%) |
| 35 to 44 Years | 264 (84.6%) | 48 (15.4%) |
| 45 to 54 Years | 262 (82.9%) | 54 (17.1%) |
| 55 to 64 Years | 514 (100.0%) | 0 (0.0%) |
| 65 to 74 Years | 178 (100.0%) | 0 (0.0%) |
| 75 Years and older | 49 (100.0%) | 0 (0.0%) |
| Total | 1,859 (94.1%) | 116 (5.9%) |
Health Insurance Coverage by Citizenship Status in Feasterville
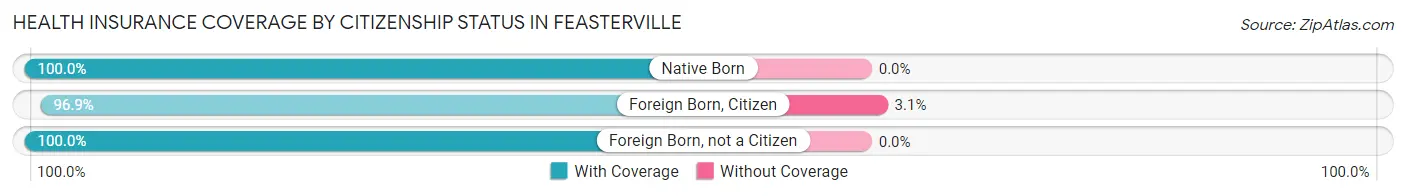
| Citizenship Status | With Coverage | Without Coverage |
| Native Born | 40 (100.0%) | 0 (0.0%) |
| Foreign Born, Citizen | 435 (96.9%) | 14 (3.1%) |
| Foreign Born, not a Citizen | 32 (100.0%) | 0 (0.0%) |
Health Insurance Coverage by Household Income in Feasterville
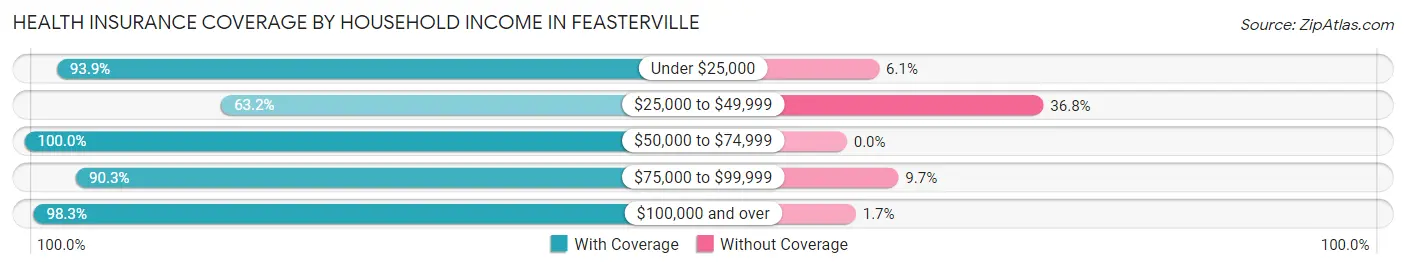
| Household Income | With Coverage | Without Coverage |
| Under $25,000 | 217 (93.9%) | 14 (6.1%) |
| $25,000 to $49,999 | 96 (63.2%) | 56 (36.8%) |
| $50,000 to $74,999 | 129 (100.0%) | 0 (0.0%) |
| $75,000 to $99,999 | 243 (90.3%) | 26 (9.7%) |
| $100,000 and over | 1,162 (98.3%) | 20 (1.7%) |
Public vs Private Health Insurance Coverage by Age in Feasterville
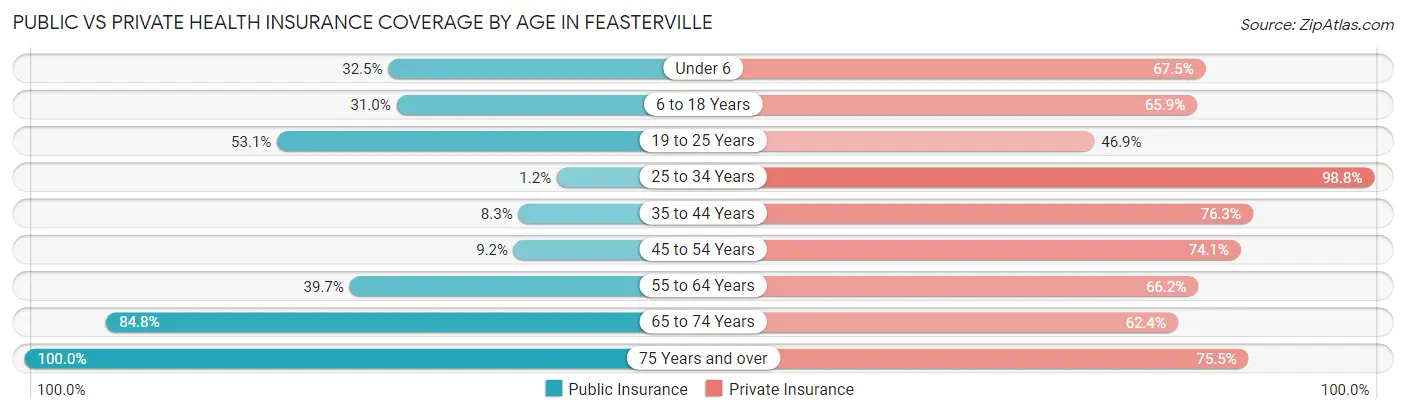
| Age Bracket | Public Insurance | Private Insurance |
| Under 6 | 13 (32.5%) | 27 (67.5%) |
| 6 to 18 Years | 139 (31.0%) | 296 (65.9%) |
| 19 to 25 Years | 17 (53.1%) | 15 (46.9%) |
| 25 to 34 Years | 1 (1.2%) | 84 (98.8%) |
| 35 to 44 Years | 26 (8.3%) | 238 (76.3%) |
| 45 to 54 Years | 29 (9.2%) | 234 (74.1%) |
| 55 to 64 Years | 204 (39.7%) | 340 (66.1%) |
| 65 to 74 Years | 151 (84.8%) | 111 (62.4%) |
| 75 Years and over | 49 (100.0%) | 37 (75.5%) |
| Total | 629 (31.9%) | 1,382 (70.0%) |
Disability Status by Sex by Age in Feasterville
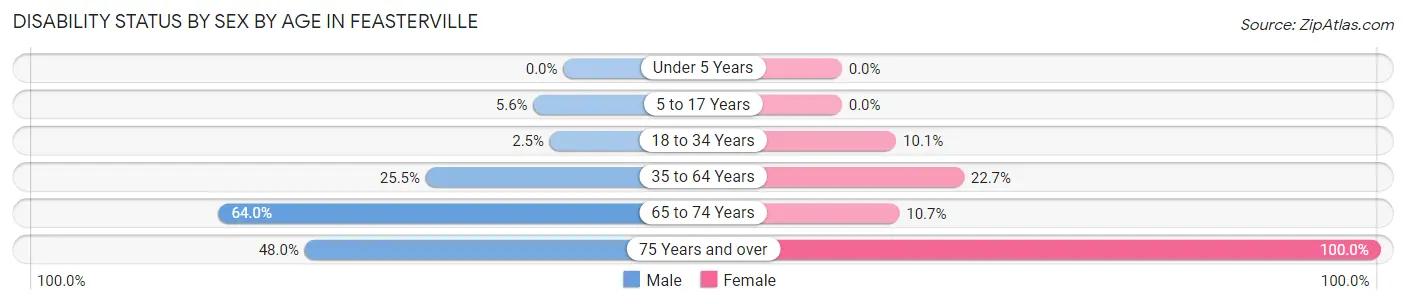
| Age Bracket | Male | Female |
| Under 5 Years | 0 (0.0%) | 0 (0.0%) |
| 5 to 17 Years | 11 (5.6%) | 0 (0.0%) |
| 18 to 34 Years | 1 (2.5%) | 13 (10.1%) |
| 35 to 64 Years | 136 (25.5%) | 138 (22.7%) |
| 65 to 74 Years | 48 (64.0%) | 11 (10.7%) |
| 75 Years and over | 12 (48.0%) | 24 (100.0%) |
Disability Class by Sex by Age in Feasterville
Disability Class: Hearing Difficulty
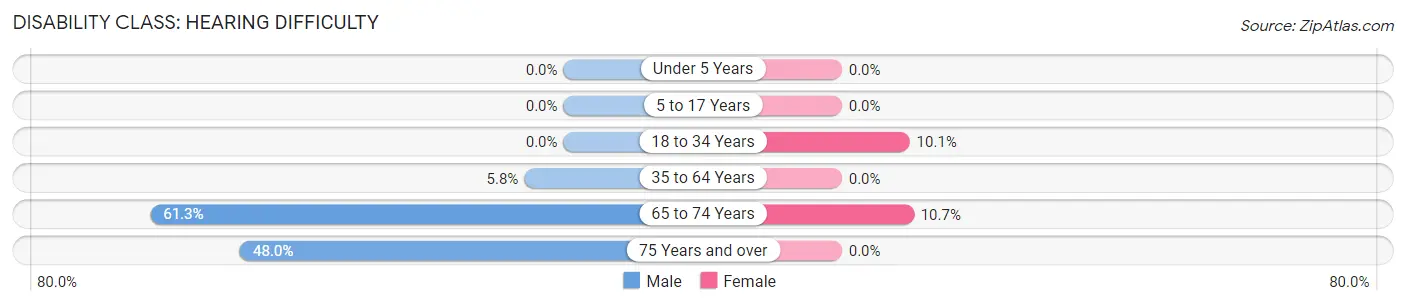
| Age Bracket | Male | Female |
| Under 5 Years | 0 (0.0%) | 0 (0.0%) |
| 5 to 17 Years | 0 (0.0%) | 0 (0.0%) |
| 18 to 34 Years | 0 (0.0%) | 13 (10.1%) |
| 35 to 64 Years | 31 (5.8%) | 0 (0.0%) |
| 65 to 74 Years | 46 (61.3%) | 11 (10.7%) |
| 75 Years and over | 12 (48.0%) | 0 (0.0%) |
Disability Class: Vision Difficulty
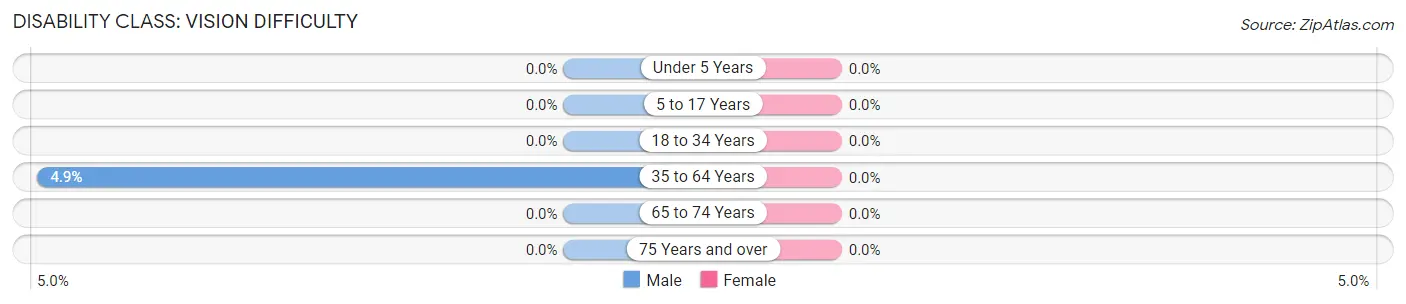
| Age Bracket | Male | Female |
| Under 5 Years | 0 (0.0%) | 0 (0.0%) |
| 5 to 17 Years | 0 (0.0%) | 0 (0.0%) |
| 18 to 34 Years | 0 (0.0%) | 0 (0.0%) |
| 35 to 64 Years | 26 (4.9%) | 0 (0.0%) |
| 65 to 74 Years | 0 (0.0%) | 0 (0.0%) |
| 75 Years and over | 0 (0.0%) | 0 (0.0%) |
Disability Class: Cognitive Difficulty
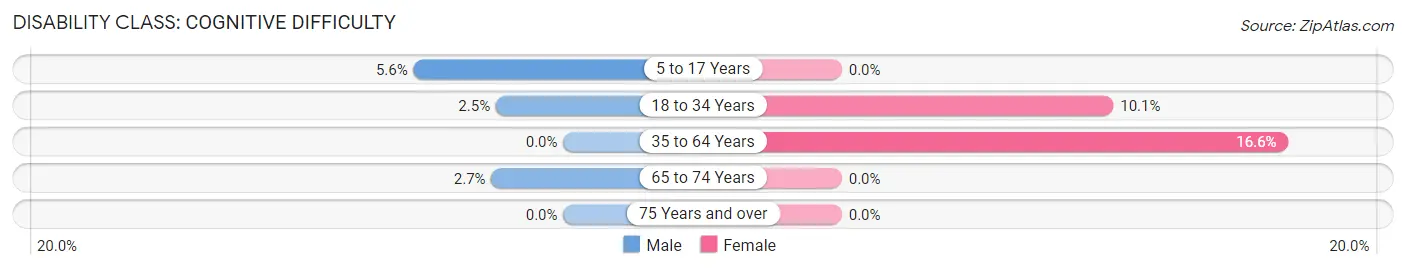
| Age Bracket | Male | Female |
| 5 to 17 Years | 11 (5.6%) | 0 (0.0%) |
| 18 to 34 Years | 1 (2.5%) | 13 (10.1%) |
| 35 to 64 Years | 0 (0.0%) | 101 (16.6%) |
| 65 to 74 Years | 2 (2.7%) | 0 (0.0%) |
| 75 Years and over | 0 (0.0%) | 0 (0.0%) |
Disability Class: Ambulatory Difficulty
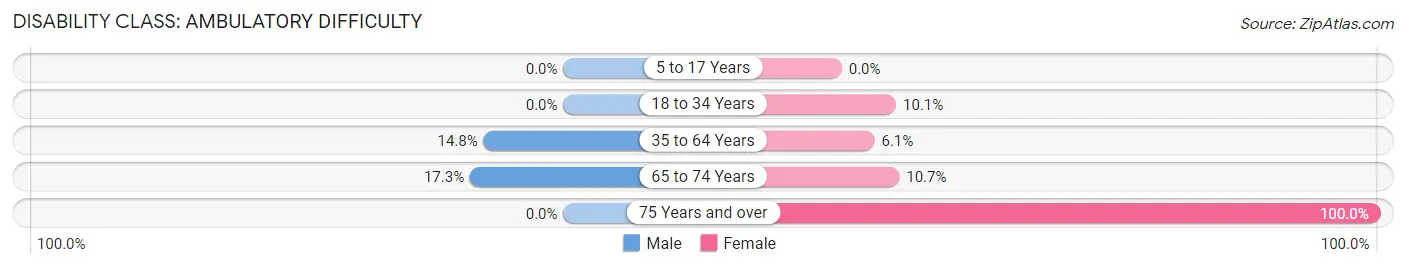
| Age Bracket | Male | Female |
| 5 to 17 Years | 0 (0.0%) | 0 (0.0%) |
| 18 to 34 Years | 0 (0.0%) | 13 (10.1%) |
| 35 to 64 Years | 79 (14.8%) | 37 (6.1%) |
| 65 to 74 Years | 13 (17.3%) | 11 (10.7%) |
| 75 Years and over | 0 (0.0%) | 24 (100.0%) |
Disability Class: Self-Care Difficulty
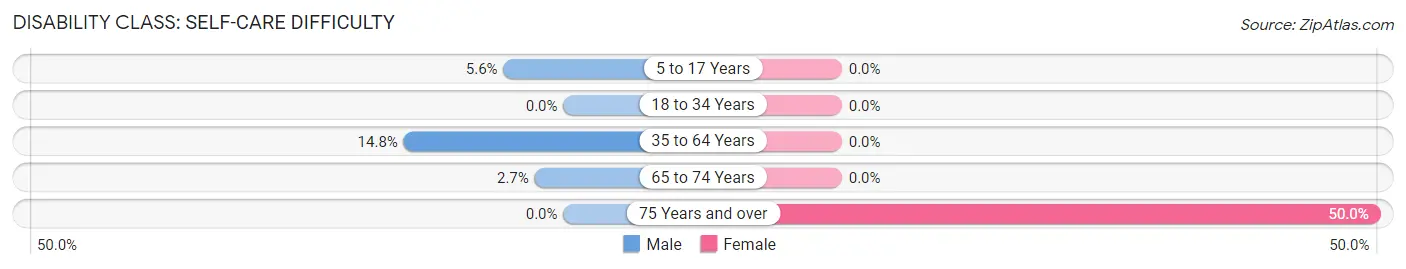
| Age Bracket | Male | Female |
| 5 to 17 Years | 11 (5.6%) | 0 (0.0%) |
| 18 to 34 Years | 0 (0.0%) | 0 (0.0%) |
| 35 to 64 Years | 79 (14.8%) | 0 (0.0%) |
| 65 to 74 Years | 2 (2.7%) | 0 (0.0%) |
| 75 Years and over | 0 (0.0%) | 12 (50.0%) |
Technology Access in Feasterville
Computing Device Access in Feasterville
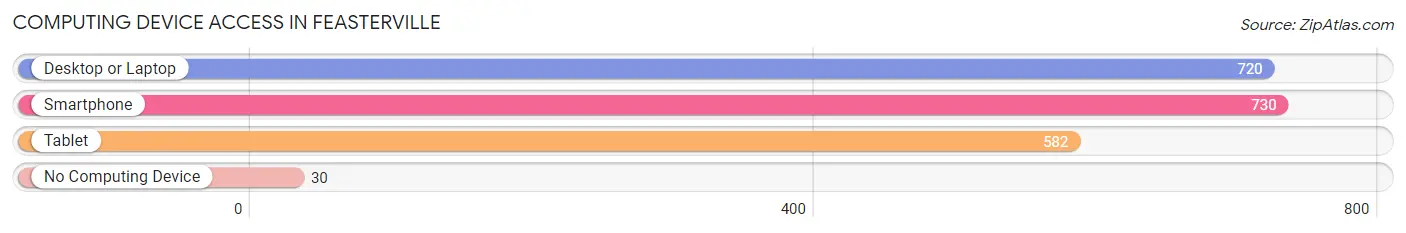
| Device Type | # Households | % Households |
| Desktop or Laptop | 720 | 90.1% |
| Smartphone | 730 | 91.4% |
| Tablet | 582 | 72.8% |
| No Computing Device | 30 | 3.7% |
| Total | 799 | 100.0% |
Internet Access in Feasterville
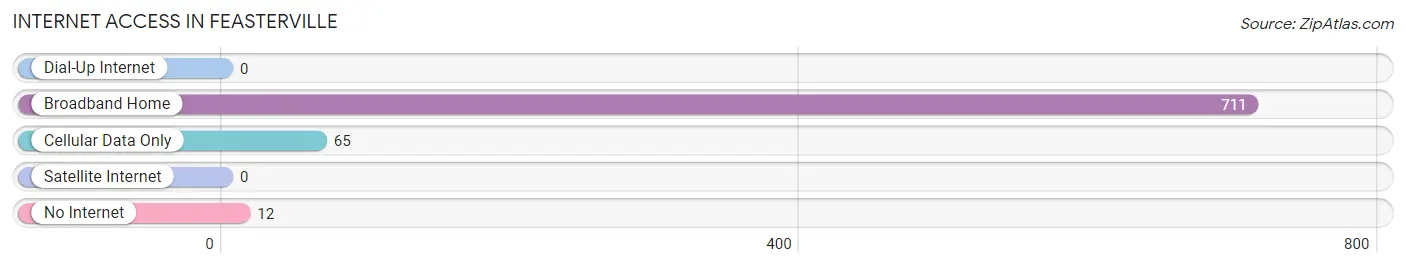
| Internet Type | # Households | % Households |
| Dial-Up Internet | 0 | 0.0% |
| Broadband Home | 711 | 89.0% |
| Cellular Data Only | 65 | 8.1% |
| Satellite Internet | 0 | 0.0% |
| No Internet | 12 | 1.5% |
| Total | 799 | 100.0% |
Feasterville Summary
Feasterville, Pennsylvania is a small unincorporated community located in Bucks County, Pennsylvania. It is located approximately 20 miles northeast of Philadelphia and is part of the greater Philadelphia metropolitan area. The population of Feasterville was estimated to be 2,845 in 2019.
History
Feasterville was first settled in 1720 by a group of Quakers from England. The town was named after the Feaster family, who were among the first settlers. The Feaster family owned a large tract of land in the area, which was used for farming and other agricultural activities.
The town was officially incorporated in 1876. During the late 19th century, Feasterville was a popular destination for summer vacationers from Philadelphia. The town was known for its picturesque scenery and its proximity to the Delaware River.
In the early 20th century, Feasterville began to experience rapid growth due to its proximity to Philadelphia. The town was home to several factories, including a paper mill, a brickyard, and a canning factory. The town also had a thriving agricultural industry, with many farms in the area.
Geography
Feasterville is located in Bucks County, Pennsylvania. It is situated in the Delaware Valley, approximately 20 miles northeast of Philadelphia. The town is bordered by the towns of Warminster, Warrington, and Hulmeville.
The terrain of Feasterville is mostly flat, with some rolling hills. The town is located in the Piedmont region of Pennsylvania, which is characterized by rolling hills and valleys. The town is located near the Delaware River, which provides a scenic backdrop for the town.
Economy
Feasterville’s economy is largely based on the service industry. The town is home to several restaurants, retail stores, and other businesses. The town is also home to a number of small manufacturing companies, including a paper mill, a brickyard, and a canning factory.
The town is also home to a number of farms, which produce a variety of crops, including corn, soybeans, and wheat. The town is also home to a number of wineries, which produce a variety of wines.
Demographics
As of 2019, the population of Feasterville was estimated to be 2,845. The town has a median age of 44.7 years, with a gender ratio of 50.3% male and 49.7% female. The town is predominantly white, with a population that is 94.2% white, 2.2% Hispanic or Latino, 1.2% Asian, and 0.7% African American.
The median household income in Feasterville is $68,945, and the median home value is $269,400. The town has a poverty rate of 5.3%, which is lower than the national average.
Conclusion
Feasterville, Pennsylvania is a small unincorporated community located in Bucks County, Pennsylvania. It is located approximately 20 miles northeast of Philadelphia and is part of the greater Philadelphia metropolitan area. The town has a population of 2,845 and is predominantly white. The town’s economy is largely based on the service industry, with a number of restaurants, retail stores, and other businesses. The town is also home to a number of farms, which produce a variety of crops. The median household income in Feasterville is $68,945, and the median home value is $269,400.
Common Questions
What is Per Capita Income in Feasterville?
Per Capita income in Feasterville is $46,980.
What is the Median Family Income in Feasterville?
Median Family Income in Feasterville is $101,638.
What is the Median Household income in Feasterville?
Median Household Income in Feasterville is $94,293.
What is Income or Wage Gap in Feasterville?
Income or Wage Gap in Feasterville is 19.9%.
Women in Feasterville earn 80.1 cents for every dollar earned by a man.
What is Inequality or Gini Index in Feasterville?
Inequality or Gini Index in Feasterville is 0.42.
What is the Total Population of Feasterville?
Total Population of Feasterville is 1,975.
What is the Total Male Population of Feasterville?
Total Male Population of Feasterville is 871.
What is the Total Female Population of Feasterville?
Total Female Population of Feasterville is 1,104.
What is the Ratio of Males per 100 Females in Feasterville?
There are 78.89 Males per 100 Females in Feasterville.
What is the Ratio of Females per 100 Males in Feasterville?
There are 126.75 Females per 100 Males in Feasterville.
What is the Median Population Age in Feasterville?
Median Population Age in Feasterville is 46.8 Years.
What is the Average Family Size in Feasterville
Average Family Size in Feasterville is 2.8 People.
What is the Average Household Size in Feasterville
Average Household Size in Feasterville is 2.5 People.
How Large is the Labor Force in Feasterville?
There are 1,077 People in the Labor Forcein in Feasterville.
What is the Percentage of People in the Labor Force in Feasterville?
66.0% of People are in the Labor Force in Feasterville.
What is the Unemployment Rate in Feasterville?
Unemployment Rate in Feasterville is 5.4%.