Sanatoga, PA Map & Demographics
Sanatoga Map
Sanatoga Overview
$37,108
PER CAPITA INCOME
$100,246
AVG FAMILY INCOME
$82,806
AVG HOUSEHOLD INCOME
39.0%
WAGE / INCOME GAP [ % ]
61.0¢/ $1
WAGE / INCOME GAP [ $ ]
$18,469
FAMILY INCOME DEFICIT
0.41
INEQUALITY / GINI INDEX
8,829
TOTAL POPULATION
4,528
MALE POPULATION
4,301
FEMALE POPULATION
105.28
MALES / 100 FEMALES
94.99
FEMALES / 100 MALES
38.5
MEDIAN AGE
3.4
AVG FAMILY SIZE
2.8
AVG HOUSEHOLD SIZE
4,448
LABOR FORCE [ PEOPLE ]
66.1%
PERCENT IN LABOR FORCE
5.2%
UNEMPLOYMENT RATE
Income in Sanatoga
Income Overview in Sanatoga
Per Capita Income in Sanatoga is $37,108, while median incomes of families and households are $100,246 and $82,806 respectively.
| Characteristic | Number | Measure |
| Per Capita Income | 8,829 | $37,108 |
| Median Family Income | 2,126 | $100,246 |
| Mean Family Income | 2,126 | $113,704 |
| Median Household Income | 3,118 | $82,806 |
| Mean Household Income | 3,118 | $102,117 |
| Income Deficit | 2,126 | $18,469 |
| Wage / Income Gap (%) | 8,829 | 39.01% |
| Wage / Income Gap ($) | 8,829 | 60.99¢ per $1 |
| Gini / Inequality Index | 8,829 | 0.41 |
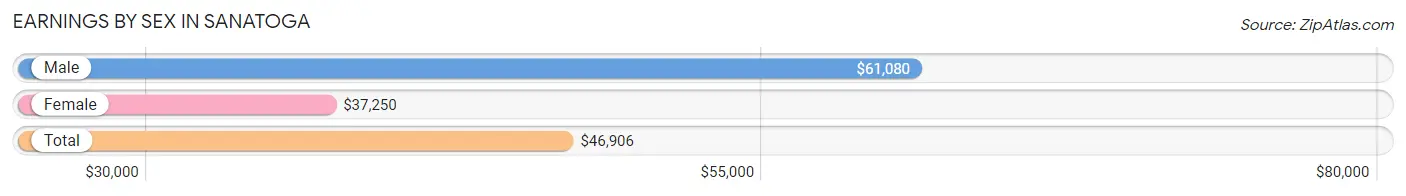
Earnings by Sex in Sanatoga
Average Earnings in Sanatoga are $46,906, $61,080 for men and $37,250 for women, a difference of 39.0%.
| Sex | Number | Average Earnings |
| Male | 2,320 (52.2%) | $61,080 |
| Female | 2,121 (47.8%) | $37,250 |
| Total | 4,441 (100.0%) | $46,906 |
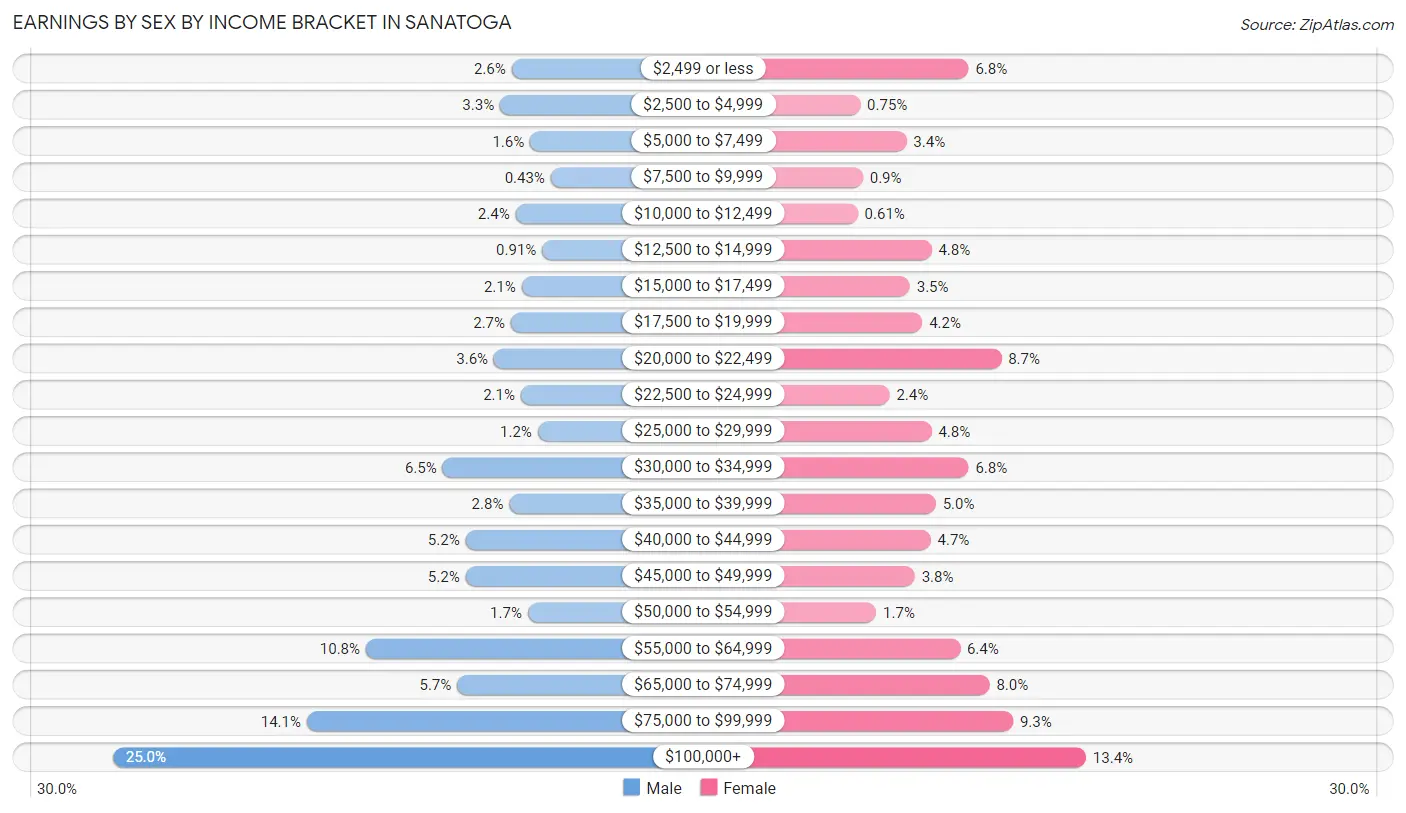
Earnings by Sex by Income Bracket in Sanatoga
The most common earnings brackets in Sanatoga are $100,000+ for men (581 | 25.0%) and $100,000+ for women (285 | 13.4%).
| Income | Male | Female |
| $2,499 or less | 61 (2.6%) | 145 (6.8%) |
| $2,500 to $4,999 | 76 (3.3%) | 16 (0.7%) |
| $5,000 to $7,499 | 37 (1.6%) | 71 (3.4%) |
| $7,500 to $9,999 | 10 (0.4%) | 19 (0.9%) |
| $10,000 to $12,499 | 56 (2.4%) | 13 (0.6%) |
| $12,500 to $14,999 | 21 (0.9%) | 101 (4.8%) |
| $15,000 to $17,499 | 48 (2.1%) | 75 (3.5%) |
| $17,500 to $19,999 | 62 (2.7%) | 90 (4.2%) |
| $20,000 to $22,499 | 84 (3.6%) | 184 (8.7%) |
| $22,500 to $24,999 | 49 (2.1%) | 51 (2.4%) |
| $25,000 to $29,999 | 27 (1.2%) | 101 (4.8%) |
| $30,000 to $34,999 | 151 (6.5%) | 145 (6.8%) |
| $35,000 to $39,999 | 64 (2.8%) | 106 (5.0%) |
| $40,000 to $44,999 | 121 (5.2%) | 100 (4.7%) |
| $45,000 to $49,999 | 121 (5.2%) | 81 (3.8%) |
| $50,000 to $54,999 | 40 (1.7%) | 35 (1.7%) |
| $55,000 to $64,999 | 251 (10.8%) | 135 (6.4%) |
| $65,000 to $74,999 | 132 (5.7%) | 170 (8.0%) |
| $75,000 to $99,999 | 328 (14.1%) | 198 (9.3%) |
| $100,000+ | 581 (25.0%) | 285 (13.4%) |
| Total | 2,320 (100.0%) | 2,121 (100.0%) |
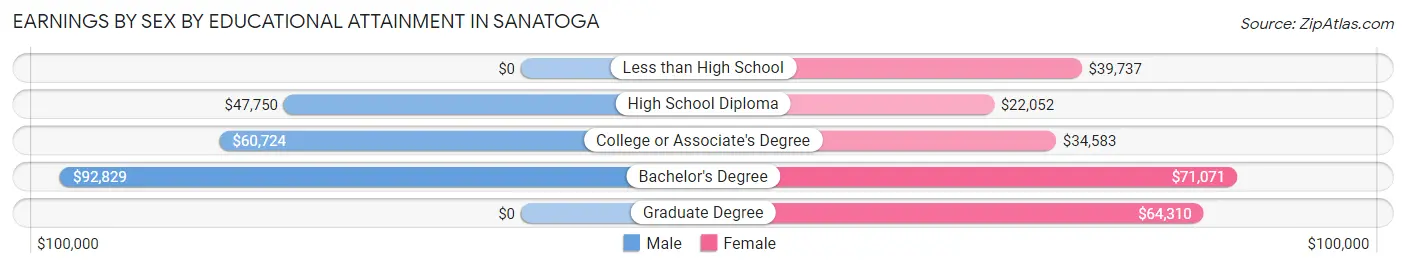
Earnings by Sex by Educational Attainment in Sanatoga
Average earnings in Sanatoga are $65,552 for men and $40,550 for women, a difference of 38.1%. Men with an educational attainment of bachelor's degree enjoy the highest average annual earnings of $92,829, while those with high school diploma education earn the least with $47,750. Women with an educational attainment of bachelor's degree earn the most with the average annual earnings of $71,071, while those with high school diploma education have the smallest earnings of $22,052.
| Educational Attainment | Male Income | Female Income |
| Less than High School | - | - |
| High School Diploma | $47,750 | $22,052 |
| College or Associate's Degree | $60,724 | $34,583 |
| Bachelor's Degree | $92,829 | $71,071 |
| Graduate Degree | - | - |
| Total | $65,552 | $40,550 |
Family Income in Sanatoga
Family Income Brackets in Sanatoga
According to the Sanatoga family income data, there are 417 families falling into the $100,000 to $149,999 income range, which is the most common income bracket and makes up 19.6% of all families. Conversely, the $10,000 to $14,999 income bracket is the least frequent group with only 30 families (1.4%) belonging to this category.
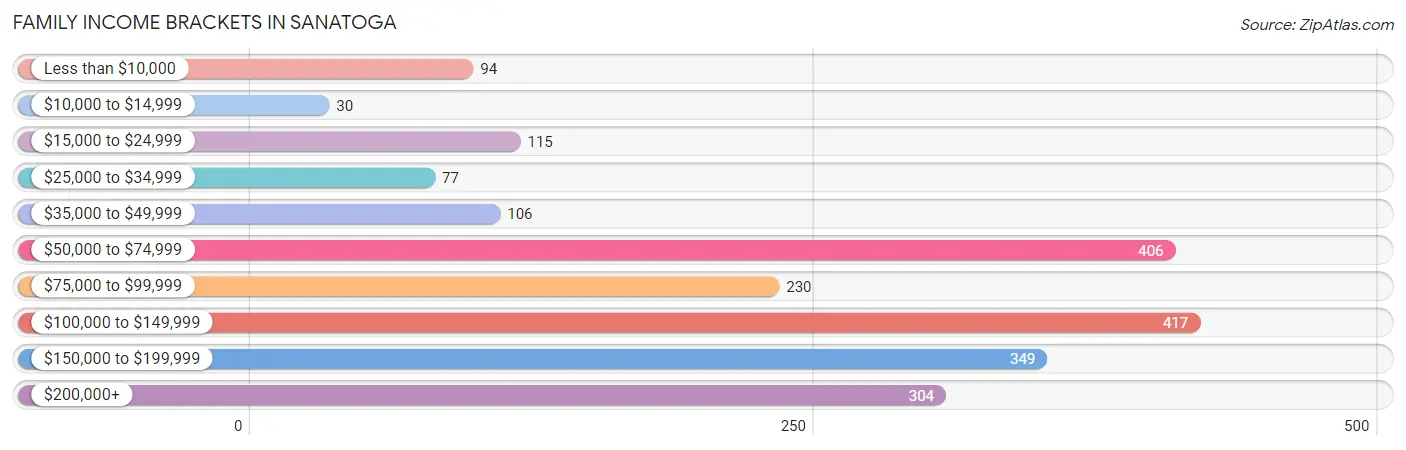
| Income Bracket | # Families | % Families |
| Less than $10,000 | 94 | 4.4% |
| $10,000 to $14,999 | 30 | 1.4% |
| $15,000 to $24,999 | 115 | 5.4% |
| $25,000 to $34,999 | 77 | 3.6% |
| $35,000 to $49,999 | 106 | 5.0% |
| $50,000 to $74,999 | 406 | 19.1% |
| $75,000 to $99,999 | 230 | 10.8% |
| $100,000 to $149,999 | 417 | 19.6% |
| $150,000 to $199,999 | 349 | 16.4% |
| $200,000+ | 304 | 14.3% |
Family Income by Famaliy Size in Sanatoga
3-person families (492 | 23.1%) account for the highest median family income in Sanatoga with $130,750 per family, while 3-person families (492 | 23.1%) have the highest median income of $43,583 per family member.
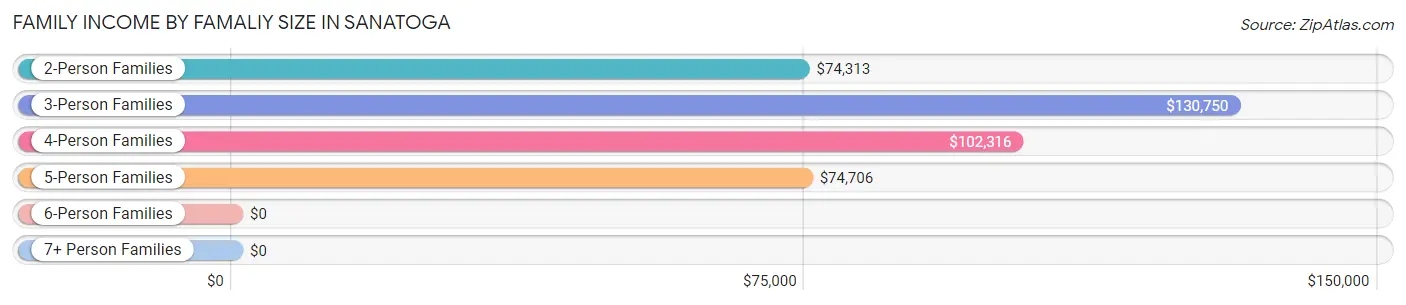
| Income Bracket | # Families | Median Income |
| 2-Person Families | 708 (33.3%) | $74,313 |
| 3-Person Families | 492 (23.1%) | $130,750 |
| 4-Person Families | 577 (27.1%) | $102,316 |
| 5-Person Families | 252 (11.8%) | $74,706 |
| 6-Person Families | 80 (3.8%) | $0 |
| 7+ Person Families | 17 (0.8%) | $0 |
| Total | 2,126 (100.0%) | $100,246 |
Family Income by Number of Earners in Sanatoga
The median family income in Sanatoga is $100,246, with families comprising 3+ earners (299) having the highest median family income of $173,125, while families with no earners (325) have the lowest median family income of $46,964, accounting for 14.1% and 15.3% of families, respectively.
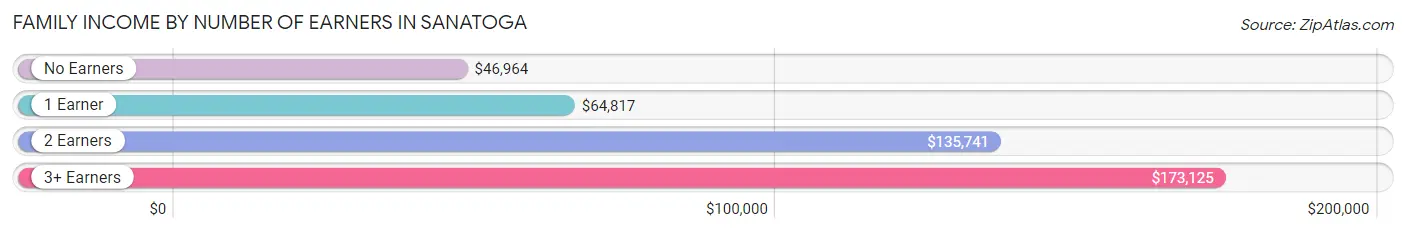
| Number of Earners | # Families | Median Income |
| No Earners | 325 (15.3%) | $46,964 |
| 1 Earner | 666 (31.3%) | $64,817 |
| 2 Earners | 836 (39.3%) | $135,741 |
| 3+ Earners | 299 (14.1%) | $173,125 |
| Total | 2,126 (100.0%) | $100,246 |
Household Income in Sanatoga
Household Income Brackets in Sanatoga
With 521 households falling in the category, the $100,000 to $149,999 income range is the most frequent in Sanatoga, accounting for 16.7% of all households. In contrast, only 53 households (1.7%) fall into the less than $10,000 income bracket, making it the least populous group.
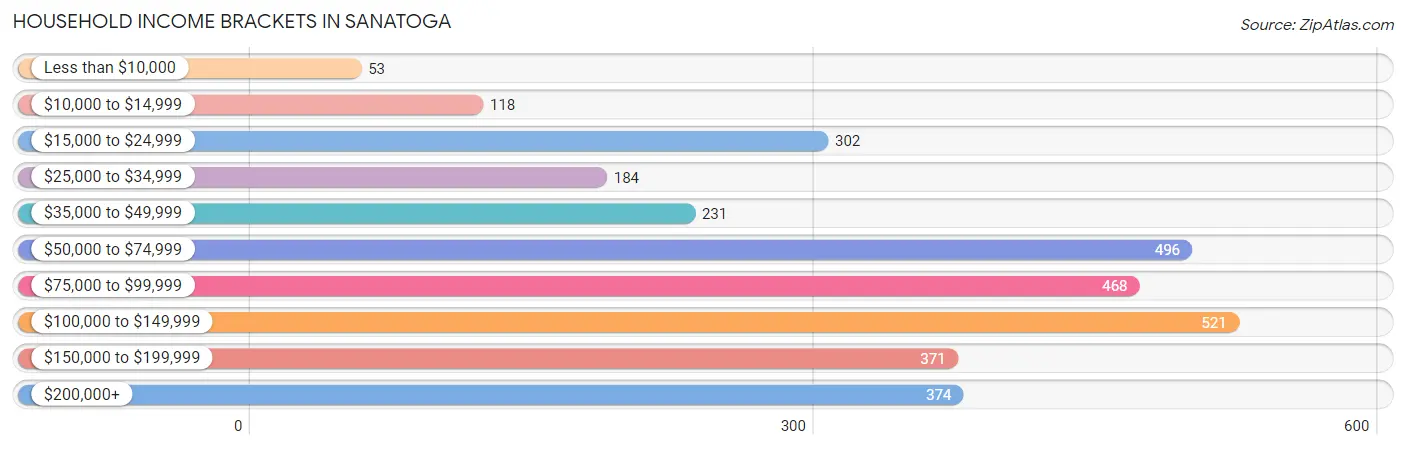
| Income Bracket | # Households | % Households |
| Less than $10,000 | 53 | 1.7% |
| $10,000 to $14,999 | 118 | 3.8% |
| $15,000 to $24,999 | 302 | 9.7% |
| $25,000 to $34,999 | 184 | 5.9% |
| $35,000 to $49,999 | 231 | 7.4% |
| $50,000 to $74,999 | 496 | 15.9% |
| $75,000 to $99,999 | 468 | 15.0% |
| $100,000 to $149,999 | 521 | 16.7% |
| $150,000 to $199,999 | 371 | 11.9% |
| $200,000+ | 374 | 12.0% |
Household Income by Householder Age in Sanatoga
The median household income in Sanatoga is $82,806, with the highest median household income of $128,869 found in the 45 to 64 years age bracket for the primary householder. A total of 1,175 households (37.7%) fall into this category. Meanwhile, the 65+ years age bracket for the primary householder has the lowest median household income of $48,095, with 850 households (27.3%) in this group.
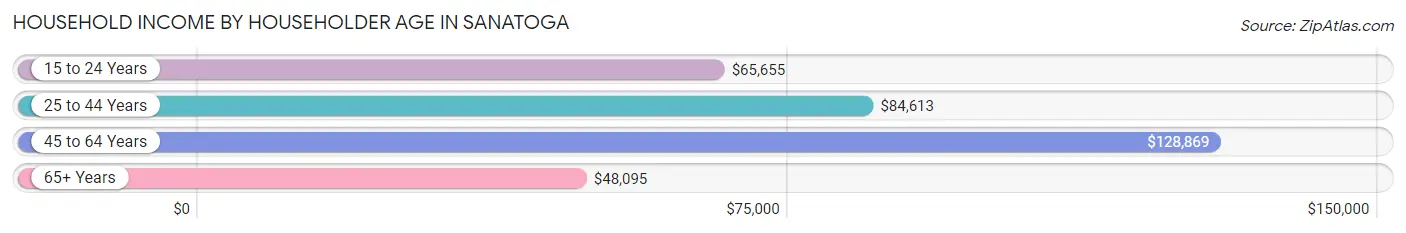
| Income Bracket | # Households | Median Income |
| 15 to 24 Years | 53 (1.7%) | $65,655 |
| 25 to 44 Years | 1,040 (33.4%) | $84,613 |
| 45 to 64 Years | 1,175 (37.7%) | $128,869 |
| 65+ Years | 850 (27.3%) | $48,095 |
| Total | 3,118 (100.0%) | $82,806 |
Poverty in Sanatoga
Income Below Poverty by Sex and Age in Sanatoga
With 12.7% poverty level for males and 12.9% for females among the residents of Sanatoga, 15 year old males and under 5 year old females are the most vulnerable to poverty, with 64 males (68.1%) and 73 females (31.6%) in their respective age groups living below the poverty level.
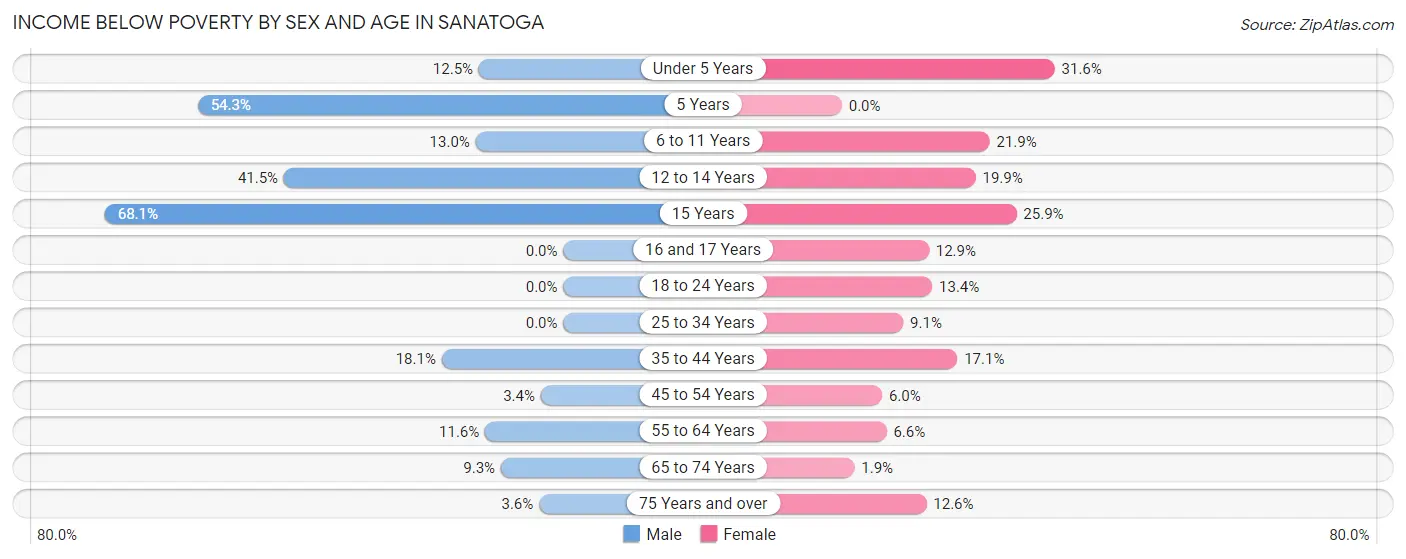
| Age Bracket | Male | Female |
| Under 5 Years | 40 (12.5%) | 73 (31.6%) |
| 5 Years | 38 (54.3%) | 0 (0.0%) |
| 6 to 11 Years | 59 (13.0%) | 79 (21.9%) |
| 12 to 14 Years | 117 (41.5%) | 29 (19.9%) |
| 15 Years | 64 (68.1%) | 28 (25.9%) |
| 16 and 17 Years | 0 (0.0%) | 23 (12.9%) |
| 18 to 24 Years | 0 (0.0%) | 22 (13.4%) |
| 25 to 34 Years | 0 (0.0%) | 45 (9.1%) |
| 35 to 44 Years | 125 (18.1%) | 127 (17.1%) |
| 45 to 54 Years | 20 (3.4%) | 36 (6.0%) |
| 55 to 64 Years | 61 (11.6%) | 26 (6.6%) |
| 65 to 74 Years | 29 (9.3%) | 7 (1.9%) |
| 75 Years and over | 8 (3.6%) | 51 (12.6%) |
| Total | 561 (12.7%) | 546 (12.9%) |
Income Above Poverty by Sex and Age in Sanatoga
According to the poverty statistics in Sanatoga, males aged 16 and 17 years and females aged 5 years are the age groups that are most secure financially, with 100.0% of males and 100.0% of females in these age groups living above the poverty line.
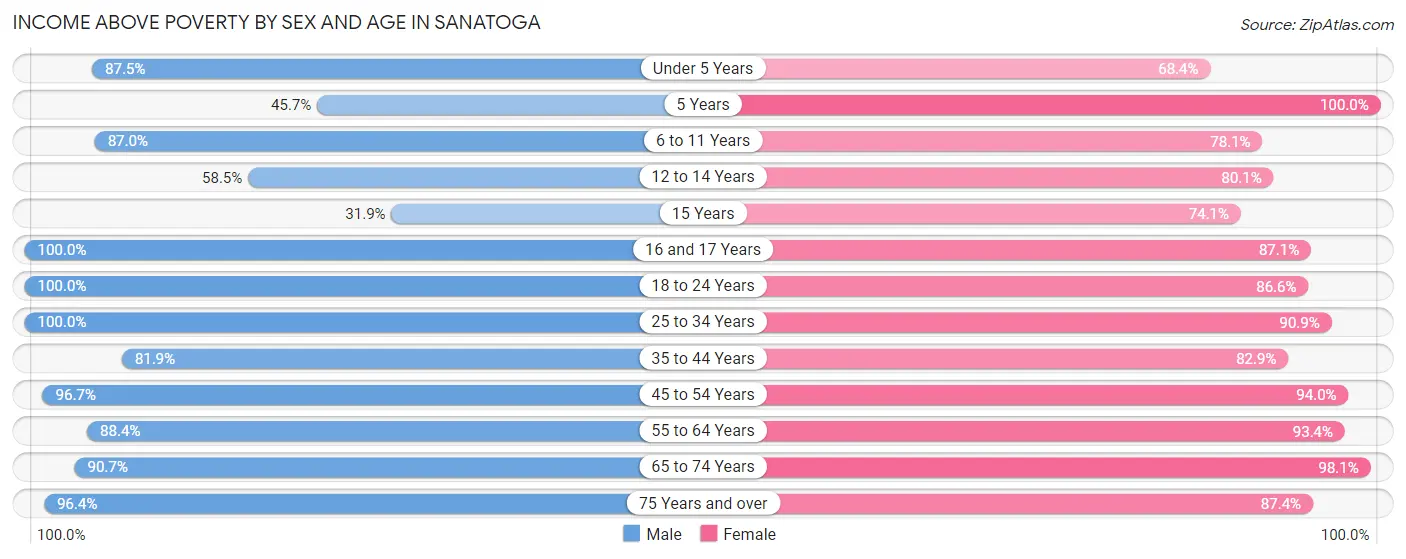
| Age Bracket | Male | Female |
| Under 5 Years | 279 (87.5%) | 158 (68.4%) |
| 5 Years | 32 (45.7%) | 20 (100.0%) |
| 6 to 11 Years | 394 (87.0%) | 281 (78.1%) |
| 12 to 14 Years | 165 (58.5%) | 117 (80.1%) |
| 15 Years | 30 (31.9%) | 80 (74.1%) |
| 16 and 17 Years | 140 (100.0%) | 155 (87.1%) |
| 18 to 24 Years | 366 (100.0%) | 142 (86.6%) |
| 25 to 34 Years | 348 (100.0%) | 449 (90.9%) |
| 35 to 44 Years | 567 (81.9%) | 614 (82.9%) |
| 45 to 54 Years | 577 (96.7%) | 567 (94.0%) |
| 55 to 64 Years | 464 (88.4%) | 366 (93.4%) |
| 65 to 74 Years | 284 (90.7%) | 369 (98.1%) |
| 75 Years and over | 214 (96.4%) | 355 (87.4%) |
| Total | 3,860 (87.3%) | 3,673 (87.1%) |
Income Below Poverty Among Married-Couple Families in Sanatoga
The poverty statistics for married-couple families in Sanatoga show that 6.2% or 95 of the total 1,537 families live below the poverty line. Families with 3 or 4 children have the highest poverty rate of 43.6%, comprising of 88 families. On the other hand, families with 1 or 2 children have the lowest poverty rate of 0.0%, which includes 0 families.
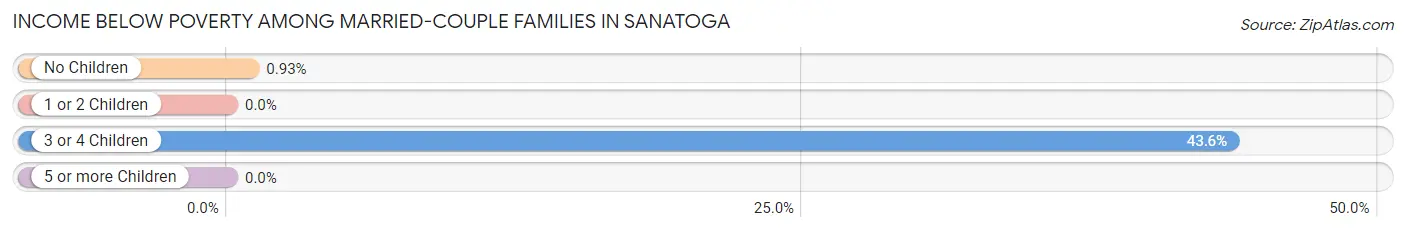
| Children | Above Poverty | Below Poverty |
| No Children | 749 (99.1%) | 7 (0.9%) |
| 1 or 2 Children | 579 (100.0%) | 0 (0.0%) |
| 3 or 4 Children | 114 (56.4%) | 88 (43.6%) |
| 5 or more Children | 0 (0.0%) | 0 (0.0%) |
| Total | 1,442 (93.8%) | 95 (6.2%) |
Income Below Poverty Among Single-Parent Households in Sanatoga
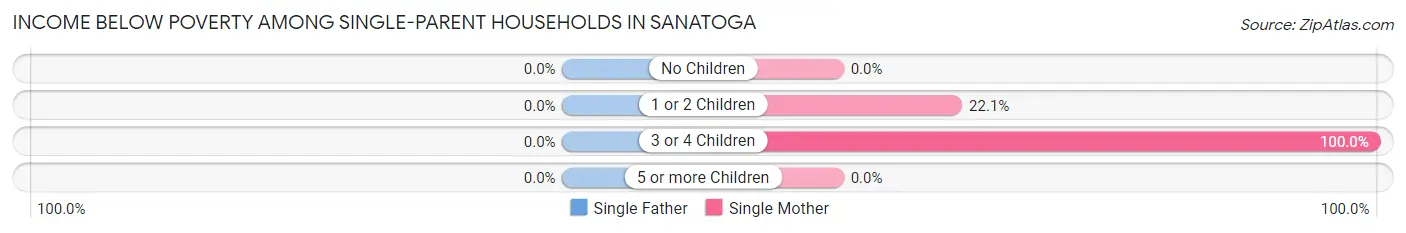
| Children | Single Father | Single Mother |
| No Children | 0 (0.0%) | 0 (0.0%) |
| 1 or 2 Children | 0 (0.0%) | 49 (22.1%) |
| 3 or 4 Children | 0 (0.0%) | 68 (100.0%) |
| 5 or more Children | 0 (0.0%) | 0 (0.0%) |
| Total | 0 (0.0%) | 117 (29.9%) |
Income Below Poverty Among Married-Couple vs Single-Parent Households in Sanatoga
The poverty data for Sanatoga shows that 95 of the married-couple family households (6.2%) and 117 of the single-parent households (19.9%) are living below the poverty level. Within the married-couple family households, those with 3 or 4 children have the highest poverty rate, with 88 households (43.6%) falling below the poverty line. Among the single-parent households, those with 3 or 4 children have the highest poverty rate, with 68 household (36.4%) living below poverty.
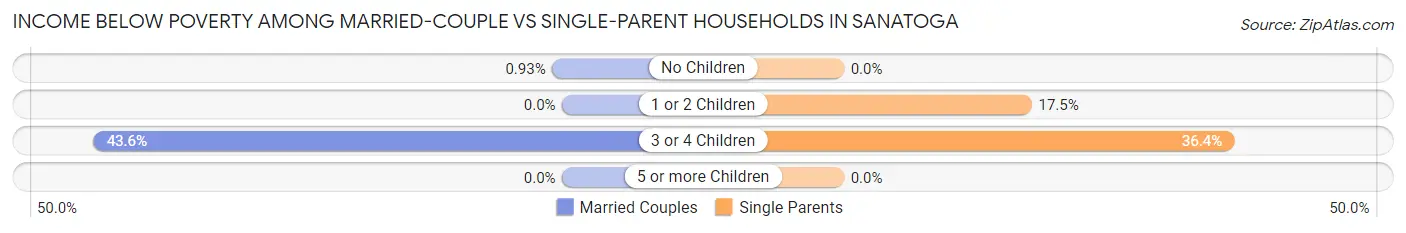
| Children | Married-Couple Families | Single-Parent Households |
| No Children | 7 (0.9%) | 0 (0.0%) |
| 1 or 2 Children | 0 (0.0%) | 49 (17.5%) |
| 3 or 4 Children | 88 (43.6%) | 68 (36.4%) |
| 5 or more Children | 0 (0.0%) | 0 (0.0%) |
| Total | 95 (6.2%) | 117 (19.9%) |
Race in Sanatoga
The most populous races in Sanatoga are White / Caucasian (6,879 | 77.9%), Black / African American (1,160 | 13.1%), and Hispanic or Latino (605 | 6.9%).
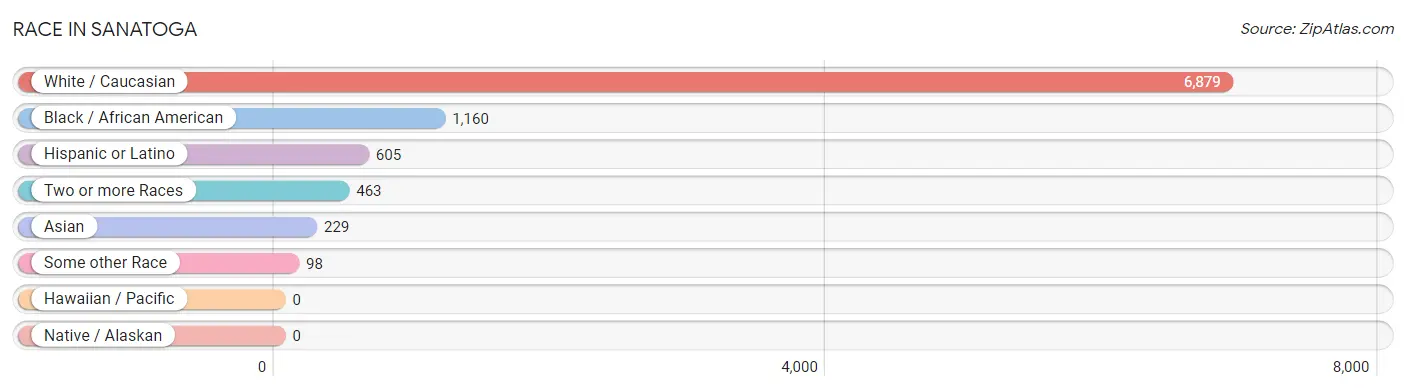
| Race | # Population | % Population |
| Asian | 229 | 2.6% |
| Black / African American | 1,160 | 13.1% |
| Hawaiian / Pacific | 0 | 0.0% |
| Hispanic or Latino | 605 | 6.9% |
| Native / Alaskan | 0 | 0.0% |
| White / Caucasian | 6,879 | 77.9% |
| Two or more Races | 463 | 5.2% |
| Some other Race | 98 | 1.1% |
| Total | 8,829 | 100.0% |
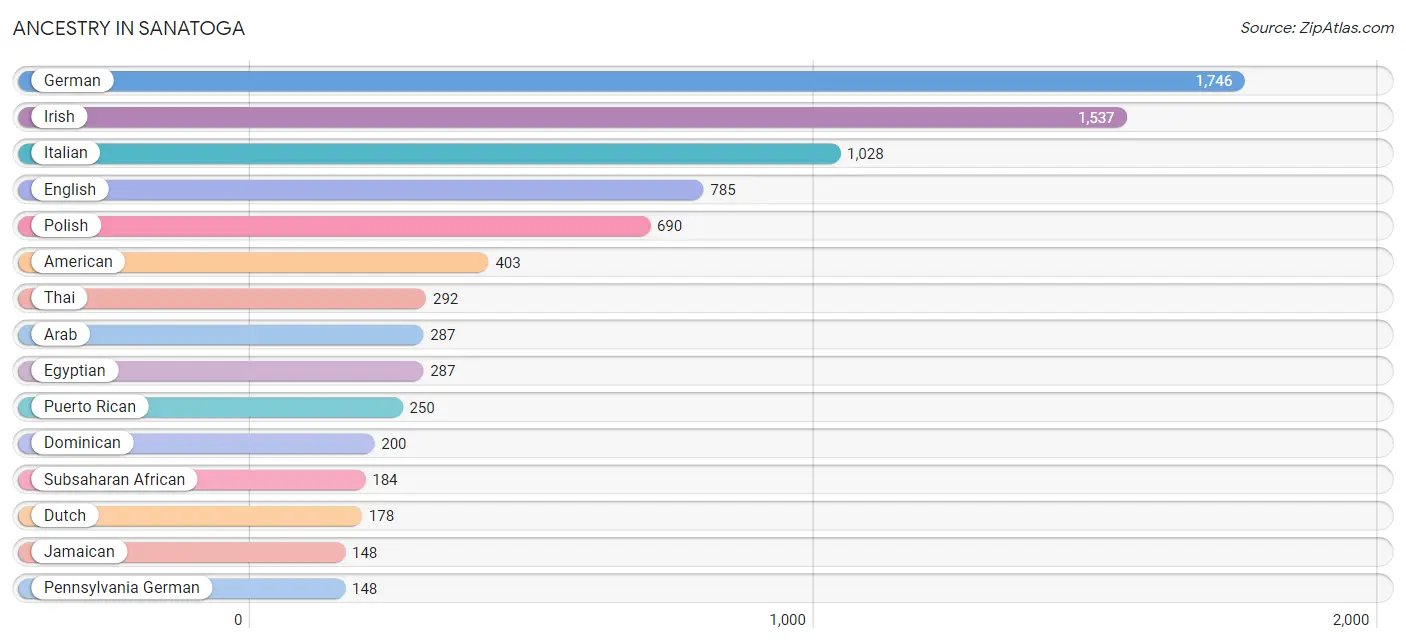
Ancestry in Sanatoga
The most populous ancestries reported in Sanatoga are German (1,746 | 19.8%), Irish (1,537 | 17.4%), Italian (1,028 | 11.6%), English (785 | 8.9%), and Polish (690 | 7.8%), together accounting for 65.5% of all Sanatoga residents.
| Ancestry | # Population | % Population |
| African | 20 | 0.2% |
| American | 403 | 4.6% |
| Arab | 287 | 3.3% |
| Bhutanese | 10 | 0.1% |
| Blackfeet | 26 | 0.3% |
| British | 39 | 0.4% |
| Burmese | 23 | 0.3% |
| Celtic | 25 | 0.3% |
| Central American | 19 | 0.2% |
| Central American Indian | 16 | 0.2% |
| Croatian | 7 | 0.1% |
| Cuban | 108 | 1.2% |
| Czech | 9 | 0.1% |
| Dominican | 200 | 2.3% |
| Dutch | 178 | 2.0% |
| Eastern European | 26 | 0.3% |
| Ecuadorian | 19 | 0.2% |
| Egyptian | 287 | 3.3% |
| English | 785 | 8.9% |
| Ethiopian | 13 | 0.2% |
| European | 48 | 0.5% |
| French | 97 | 1.1% |
| French Canadian | 48 | 0.5% |
| German | 1,746 | 19.8% |
| Ghanaian | 131 | 1.5% |
| Guatemalan | 19 | 0.2% |
| Haitian | 45 | 0.5% |
| Hungarian | 67 | 0.8% |
| Indian (Asian) | 6 | 0.1% |
| Irish | 1,537 | 17.4% |
| Italian | 1,028 | 11.6% |
| Jamaican | 148 | 1.7% |
| Korean | 23 | 0.3% |
| Lithuanian | 9 | 0.1% |
| Mexican | 9 | 0.1% |
| Nigerian | 13 | 0.2% |
| Pennsylvania German | 148 | 1.7% |
| Polish | 690 | 7.8% |
| Puerto Rican | 250 | 2.8% |
| Russian | 108 | 1.2% |
| Scandinavian | 18 | 0.2% |
| Scotch-Irish | 53 | 0.6% |
| Scottish | 135 | 1.5% |
| Slavic | 8 | 0.1% |
| Slovak | 148 | 1.7% |
| South American | 19 | 0.2% |
| Subsaharan African | 184 | 2.1% |
| Swedish | 27 | 0.3% |
| Swiss | 20 | 0.2% |
| Thai | 292 | 3.3% |
| Ukrainian | 91 | 1.0% |
| Welsh | 47 | 0.5% | View All 52 Rows |
Immigrants in Sanatoga
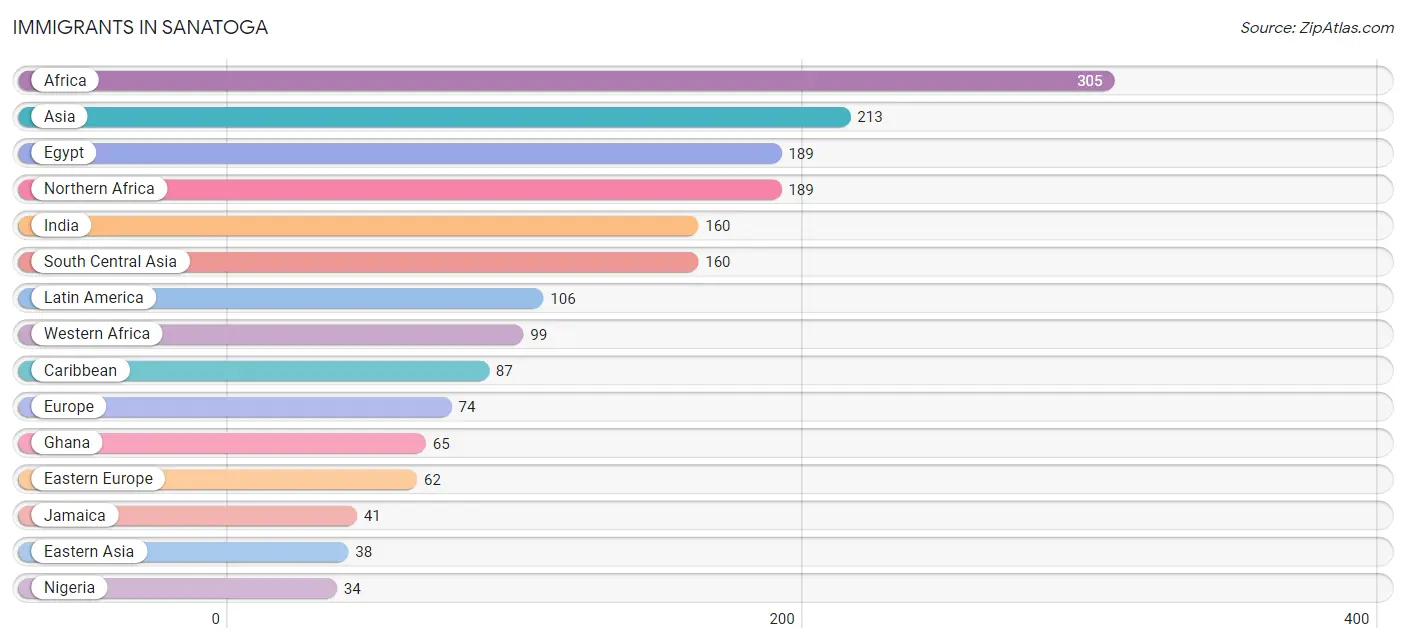
The most numerous immigrant groups reported in Sanatoga came from Africa (305 | 3.5%), Asia (213 | 2.4%), Egypt (189 | 2.1%), Northern Africa (189 | 2.1%), and India (160 | 1.8%), together accounting for 12.0% of all Sanatoga residents.
| Immigration Origin | # Population | % Population |
| Africa | 305 | 3.5% |
| Asia | 213 | 2.4% |
| Bahamas | 14 | 0.2% |
| Caribbean | 87 | 1.0% |
| China | 6 | 0.1% |
| Eastern Africa | 17 | 0.2% |
| Eastern Asia | 38 | 0.4% |
| Eastern Europe | 62 | 0.7% |
| Ecuador | 19 | 0.2% |
| Egypt | 189 | 2.1% |
| Ethiopia | 10 | 0.1% |
| Europe | 74 | 0.8% |
| Germany | 5 | 0.1% |
| Ghana | 65 | 0.7% |
| Haiti | 32 | 0.4% |
| India | 160 | 1.8% |
| Ireland | 7 | 0.1% |
| Jamaica | 41 | 0.5% |
| Japan | 9 | 0.1% |
| Korea | 23 | 0.3% |
| Latin America | 106 | 1.2% |
| Nigeria | 34 | 0.4% |
| Northern Africa | 189 | 2.1% |
| Northern Europe | 7 | 0.1% |
| Philippines | 8 | 0.1% |
| Poland | 27 | 0.3% |
| Romania | 9 | 0.1% |
| Russia | 11 | 0.1% |
| South America | 19 | 0.2% |
| South Central Asia | 160 | 1.8% |
| South Eastern Asia | 15 | 0.2% |
| Ukraine | 15 | 0.2% |
| Vietnam | 7 | 0.1% |
| Western Africa | 99 | 1.1% |
| Western Europe | 5 | 0.1% | View All 35 Rows |
Sex and Age in Sanatoga
Sex and Age in Sanatoga
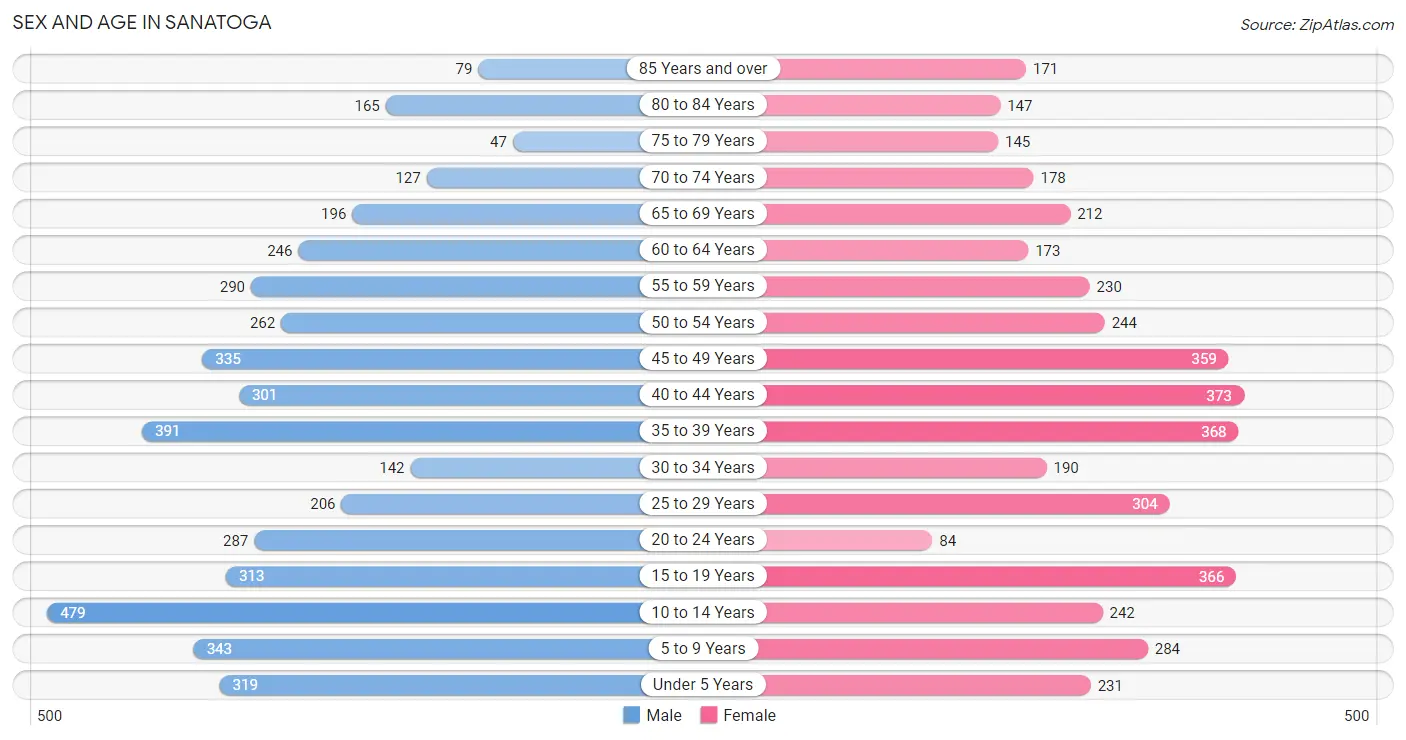
The most populous age groups in Sanatoga are 10 to 14 Years (479 | 10.6%) for men and 40 to 44 Years (373 | 8.7%) for women.
| Age Bracket | Male | Female |
| Under 5 Years | 319 (7.0%) | 231 (5.4%) |
| 5 to 9 Years | 343 (7.6%) | 284 (6.6%) |
| 10 to 14 Years | 479 (10.6%) | 242 (5.6%) |
| 15 to 19 Years | 313 (6.9%) | 366 (8.5%) |
| 20 to 24 Years | 287 (6.3%) | 84 (1.9%) |
| 25 to 29 Years | 206 (4.5%) | 304 (7.1%) |
| 30 to 34 Years | 142 (3.1%) | 190 (4.4%) |
| 35 to 39 Years | 391 (8.6%) | 368 (8.6%) |
| 40 to 44 Years | 301 (6.7%) | 373 (8.7%) |
| 45 to 49 Years | 335 (7.4%) | 359 (8.4%) |
| 50 to 54 Years | 262 (5.8%) | 244 (5.7%) |
| 55 to 59 Years | 290 (6.4%) | 230 (5.3%) |
| 60 to 64 Years | 246 (5.4%) | 173 (4.0%) |
| 65 to 69 Years | 196 (4.3%) | 212 (4.9%) |
| 70 to 74 Years | 127 (2.8%) | 178 (4.1%) |
| 75 to 79 Years | 47 (1.0%) | 145 (3.4%) |
| 80 to 84 Years | 165 (3.6%) | 147 (3.4%) |
| 85 Years and over | 79 (1.7%) | 171 (4.0%) |
| Total | 4,528 (100.0%) | 4,301 (100.0%) |
Families and Households in Sanatoga
Median Family Size in Sanatoga
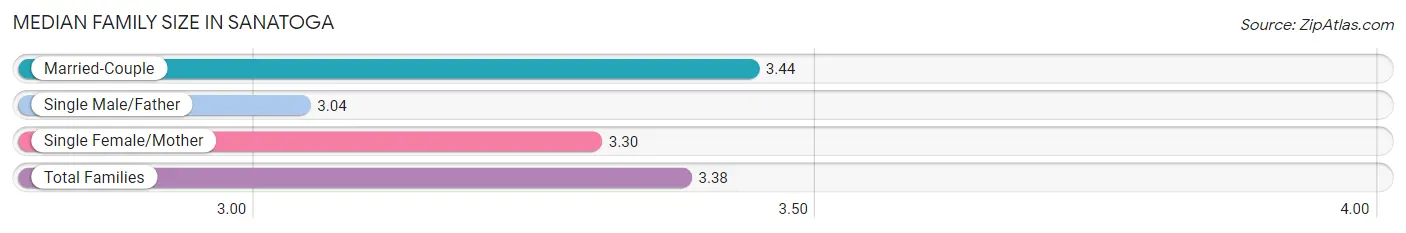
The median family size in Sanatoga is 3.38 persons per family, with married-couple families (1,537 | 72.3%) accounting for the largest median family size of 3.44 persons per family. On the other hand, single male/father families (198 | 9.3%) represent the smallest median family size with 3.04 persons per family.
| Family Type | # Families | Family Size |
| Married-Couple | 1,537 (72.3%) | 3.44 |
| Single Male/Father | 198 (9.3%) | 3.04 |
| Single Female/Mother | 391 (18.4%) | 3.30 |
| Total Families | 2,126 (100.0%) | 3.38 |
Median Household Size in Sanatoga
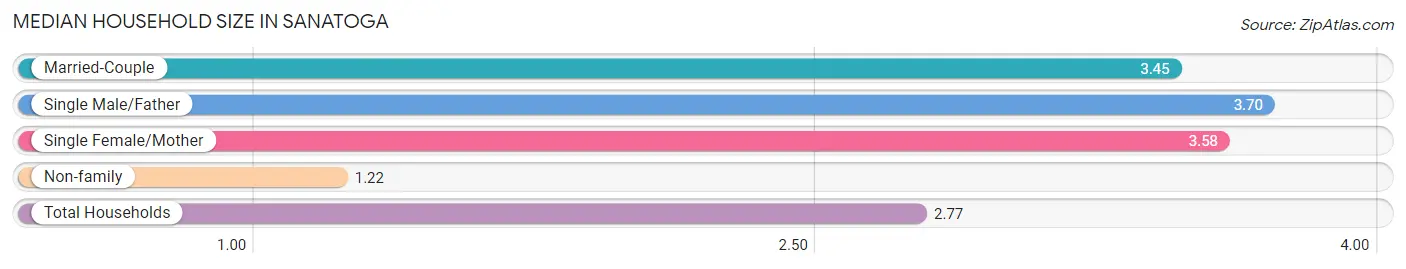
The median household size in Sanatoga is 2.77 persons per household, with single male/father households (198 | 6.4%) accounting for the largest median household size of 3.7 persons per household. non-family households (992 | 31.8%) represent the smallest median household size with 1.22 persons per household.
| Household Type | # Households | Household Size |
| Married-Couple | 1,537 (49.3%) | 3.45 |
| Single Male/Father | 198 (6.4%) | 3.70 |
| Single Female/Mother | 391 (12.5%) | 3.58 |
| Non-family | 992 (31.8%) | 1.22 |
| Total Households | 3,118 (100.0%) | 2.77 |
Household Size by Marriage Status in Sanatoga
Out of a total of 3,118 households in Sanatoga, 2,126 (68.2%) are family households, while 992 (31.8%) are nonfamily households. The most numerous type of family households are 2-person households, comprising 631, and the most common type of nonfamily households are 1-person households, comprising 817.
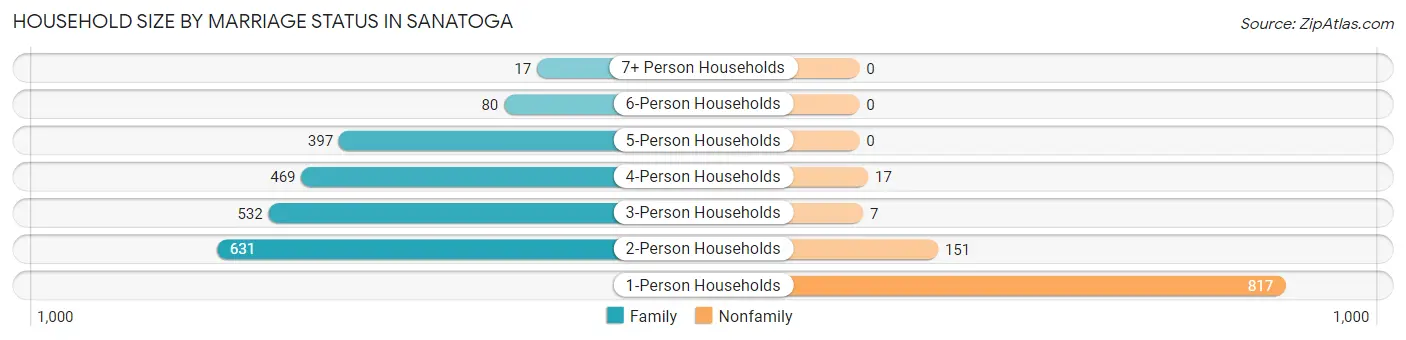
| Household Size | Family Households | Nonfamily Households |
| 1-Person Households | - | 817 (26.2%) |
| 2-Person Households | 631 (20.2%) | 151 (4.8%) |
| 3-Person Households | 532 (17.1%) | 7 (0.2%) |
| 4-Person Households | 469 (15.0%) | 17 (0.5%) |
| 5-Person Households | 397 (12.7%) | 0 (0.0%) |
| 6-Person Households | 80 (2.6%) | 0 (0.0%) |
| 7+ Person Households | 17 (0.5%) | 0 (0.0%) |
| Total | 2,126 (68.2%) | 992 (31.8%) |
Female Fertility in Sanatoga
Fertility by Age in Sanatoga
Average fertility rate in Sanatoga is 69.0 births per 1,000 women. Women in the age bracket of 20 to 34 years have the highest fertility rate with 190.0 births per 1,000 women. Women in the age bracket of 20 to 34 years acount for 75.3% of all women with births.
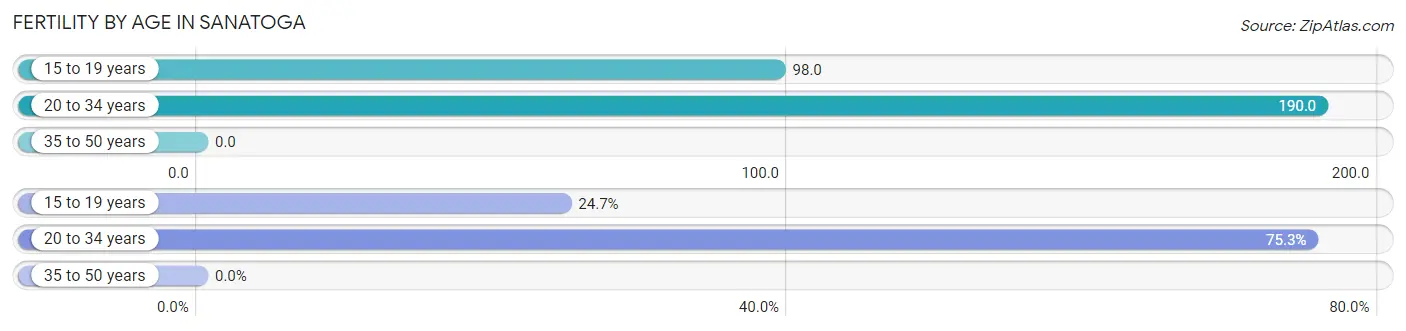
| Age Bracket | Women with Births | Births / 1,000 Women |
| 15 to 19 years | 36 (24.7%) | 98.0 |
| 20 to 34 years | 110 (75.3%) | 190.0 |
| 35 to 50 years | 0 (0.0%) | 0.0 |
| Total | 146 (100.0%) | 69.0 |
Fertility by Age by Marriage Status in Sanatoga
22.6% of women with births (146) in Sanatoga are married. The highest percentage of unmarried women with births falls into 15 to 19 years age bracket with 100.0% of them unmarried at the time of birth, while the lowest percentage of unmarried women with births belong to 20 to 34 years age bracket with 70.0% of them unmarried.
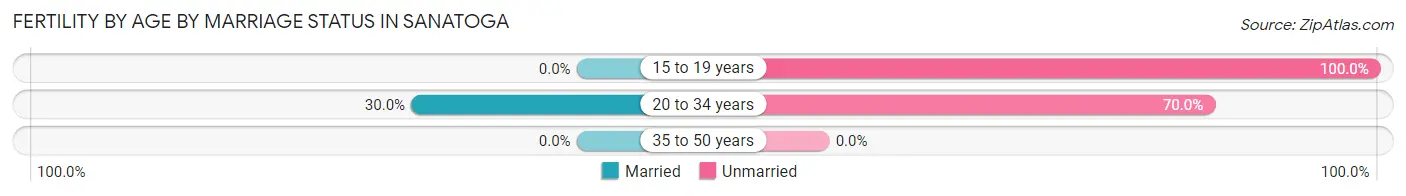
| Age Bracket | Married | Unmarried |
| 15 to 19 years | 0 (0.0%) | 36 (100.0%) |
| 20 to 34 years | 33 (30.0%) | 77 (70.0%) |
| 35 to 50 years | 0 (0.0%) | 0 (0.0%) |
| Total | 33 (22.6%) | 113 (77.4%) |
Fertility by Education in Sanatoga
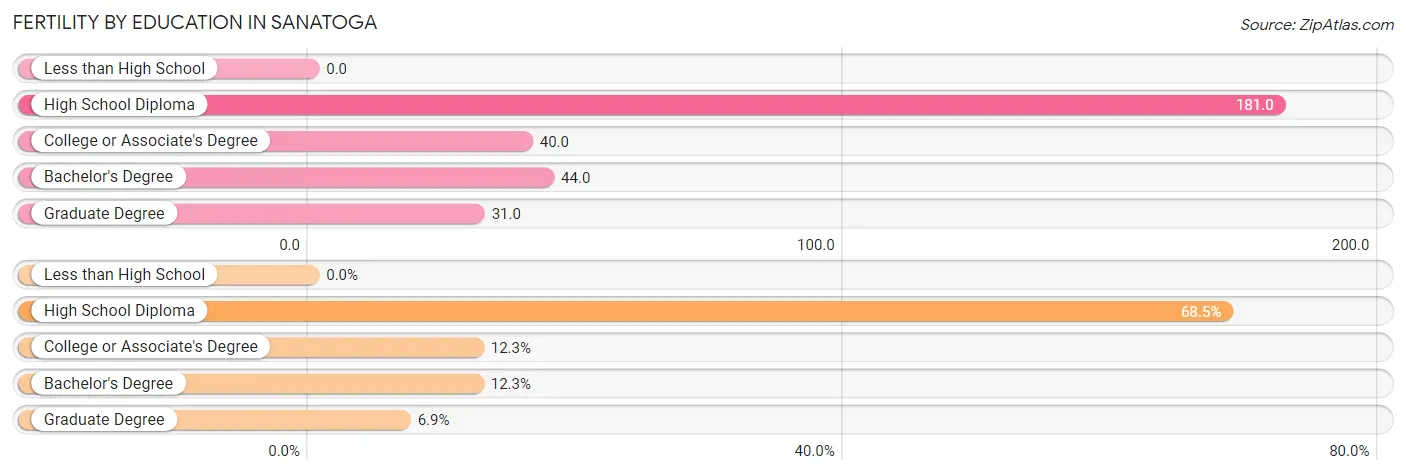
| Educational Attainment | Women with Births | Births / 1,000 Women |
| Less than High School | 0 (0.0%) | 0.0 |
| High School Diploma | 100 (68.5%) | 181.0 |
| College or Associate's Degree | 18 (12.3%) | 40.0 |
| Bachelor's Degree | 18 (12.3%) | 44.0 |
| Graduate Degree | 10 (6.9%) | 31.0 |
| Total | 146 (100.0%) | 69.0 |
Fertility by Education by Marriage Status in Sanatoga
77.4% of women with births in Sanatoga are unmarried. Women with the educational attainment of graduate degree are most likely to be married with 100.0% of them married at childbirth, while women with the educational attainment of college or associate's degree are least likely to be married with 100.0% of them unmarried at childbirth.
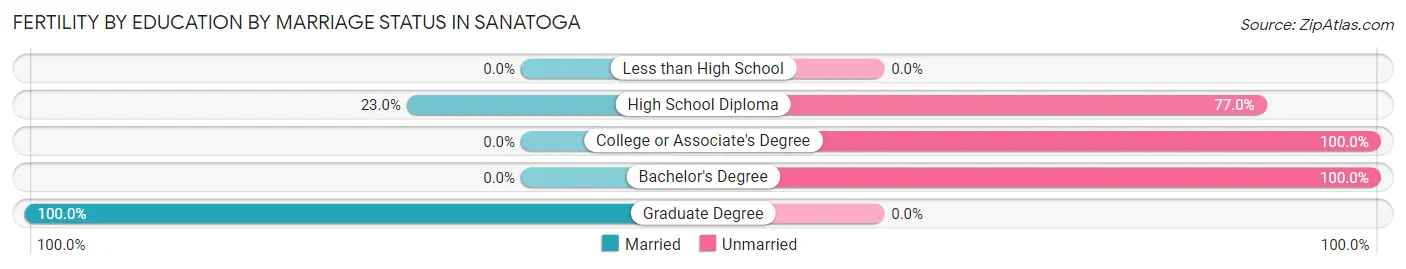
| Educational Attainment | Married | Unmarried |
| Less than High School | 0 (0.0%) | 0 (0.0%) |
| High School Diploma | 23 (23.0%) | 77 (77.0%) |
| College or Associate's Degree | 0 (0.0%) | 18 (100.0%) |
| Bachelor's Degree | 0 (0.0%) | 18 (100.0%) |
| Graduate Degree | 10 (100.0%) | 0 (0.0%) |
| Total | 33 (22.6%) | 113 (77.4%) |
Employment Characteristics in Sanatoga
Employment by Class of Employer in Sanatoga
Among the 4,160 employed individuals in Sanatoga, private company employees (2,991 | 71.9%), not-for-profit organizations (408 | 9.8%), and local government employees (295 | 7.1%) make up the most common classes of employment.
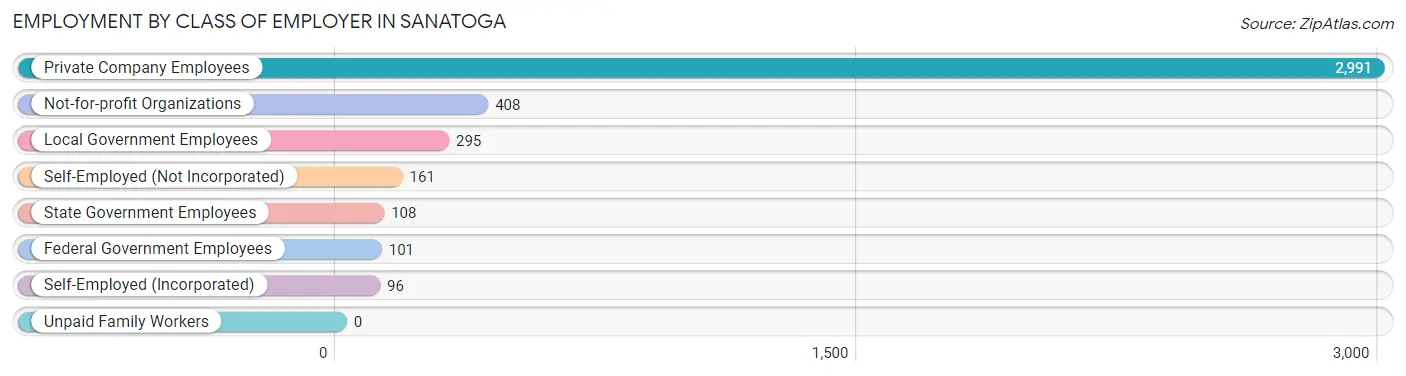
| Employer Class | # Employees | % Employees |
| Private Company Employees | 2,991 | 71.9% |
| Self-Employed (Incorporated) | 96 | 2.3% |
| Self-Employed (Not Incorporated) | 161 | 3.9% |
| Not-for-profit Organizations | 408 | 9.8% |
| Local Government Employees | 295 | 7.1% |
| State Government Employees | 108 | 2.6% |
| Federal Government Employees | 101 | 2.4% |
| Unpaid Family Workers | 0 | 0.0% |
| Total | 4,160 | 100.0% |
Employment Status by Age in Sanatoga
According to the labor force statistics for Sanatoga, out of the total population over 16 years of age (6,729), 66.1% or 4,448 individuals are in the labor force, with 5.2% or 231 of them unemployed. The age group with the highest labor force participation rate is 45 to 54 years, with 95.1% or 1,141 individuals in the labor force. Within the labor force, the 16 to 19 years age range has the highest percentage of unemployed individuals, with 21.7% or 18 of them being unemployed.
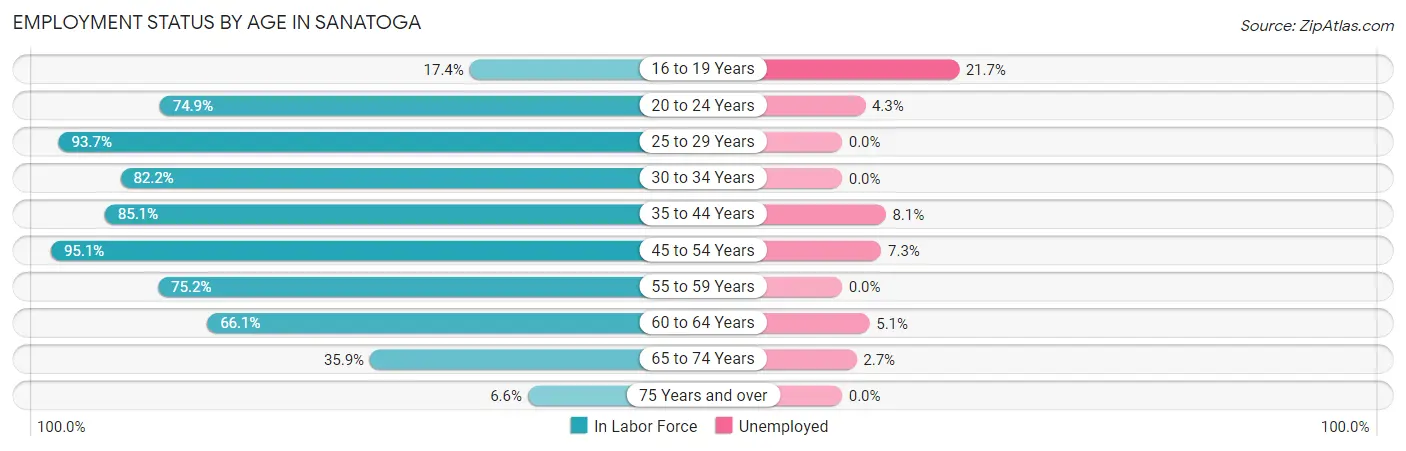
| Age Bracket | In Labor Force | Unemployed |
| 16 to 19 Years | 83 (17.4%) | 18 (21.7%) |
| 20 to 24 Years | 278 (74.9%) | 12 (4.3%) |
| 25 to 29 Years | 478 (93.7%) | 0 (0.0%) |
| 30 to 34 Years | 273 (82.2%) | 0 (0.0%) |
| 35 to 44 Years | 1,219 (85.1%) | 99 (8.1%) |
| 45 to 54 Years | 1,141 (95.1%) | 83 (7.3%) |
| 55 to 59 Years | 391 (75.2%) | 0 (0.0%) |
| 60 to 64 Years | 277 (66.1%) | 14 (5.1%) |
| 65 to 74 Years | 256 (35.9%) | 7 (2.7%) |
| 75 Years and over | 50 (6.6%) | 0 (0.0%) |
| Total | 4,448 (66.1%) | 231 (5.2%) |
Employment Status by Educational Attainment in Sanatoga
According to labor force statistics for Sanatoga, 85.6% of individuals (3,778) out of the total population between 25 and 64 years of age (4,414) are in the labor force, with 5.2% or 196 of them being unemployed. The group with the highest labor force participation rate are those with the educational attainment of bachelor's degree or higher, with 95.8% or 1,561 individuals in the labor force. Within the labor force, individuals with college / associate degree education have the highest percentage of unemployment, with 6.6% or 68 of them being unemployed.
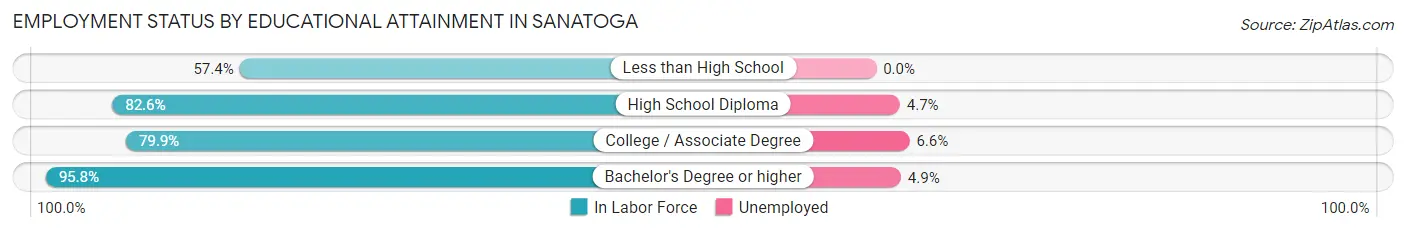
| Educational Attainment | In Labor Force | Unemployed |
| Less than High School | 108 (57.4%) | 0 (0.0%) |
| High School Diploma | 1,079 (82.6%) | 61 (4.7%) |
| College / Associate Degree | 1,032 (79.9%) | 85 (6.6%) |
| Bachelor's Degree or higher | 1,561 (95.8%) | 80 (4.9%) |
| Total | 3,778 (85.6%) | 230 (5.2%) |
Employment Occupations by Sex in Sanatoga
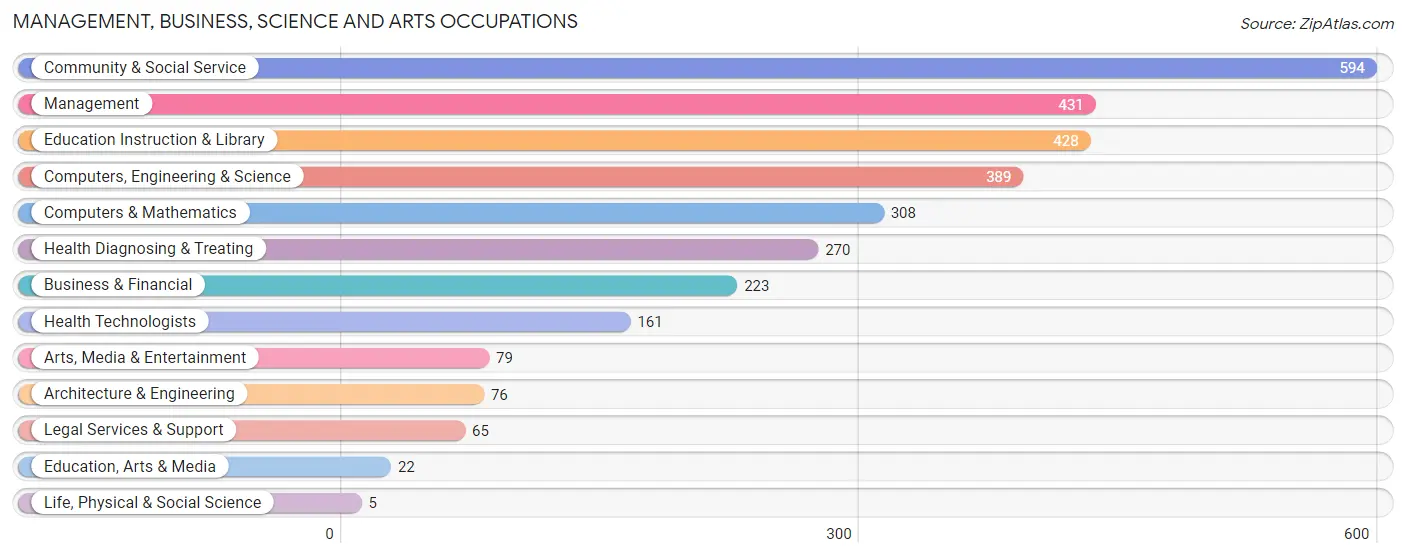
Management, Business, Science and Arts Occupations
The most common Management, Business, Science and Arts occupations in Sanatoga are Community & Social Service (594 | 14.1%), Management (431 | 10.2%), Education Instruction & Library (428 | 10.2%), Computers, Engineering & Science (389 | 9.2%), and Computers & Mathematics (308 | 7.3%).
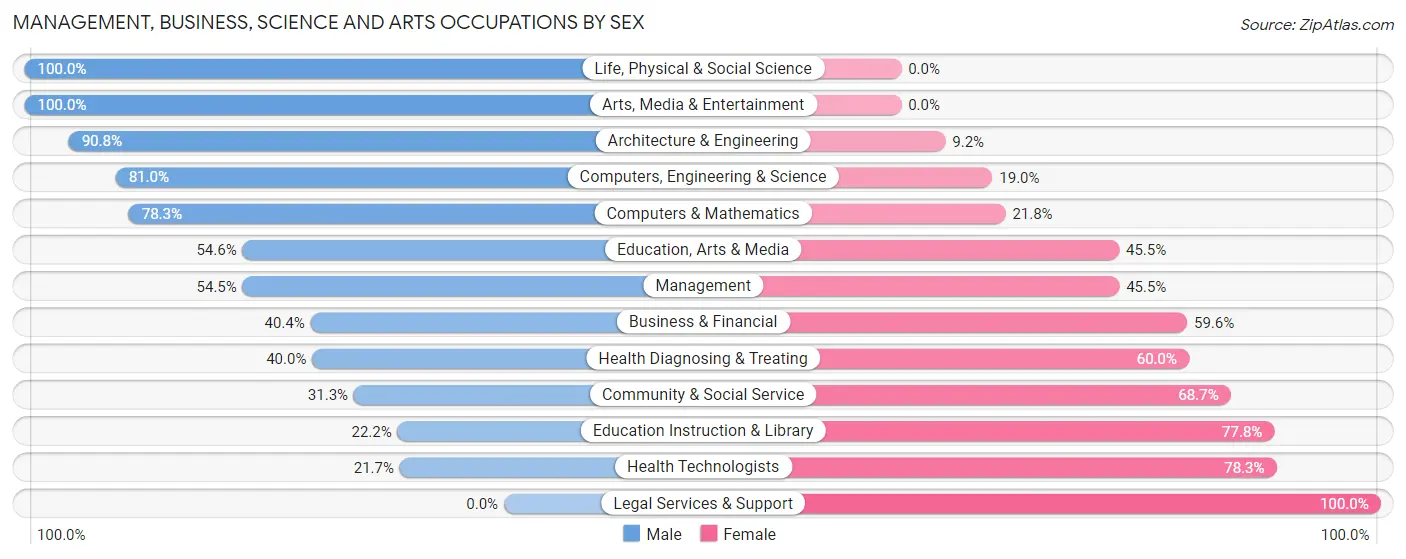
Management, Business, Science and Arts Occupations by Sex
Within the Management, Business, Science and Arts occupations in Sanatoga, the most male-oriented occupations are Life, Physical & Social Science (100.0%), Arts, Media & Entertainment (100.0%), and Architecture & Engineering (90.8%), while the most female-oriented occupations are Legal Services & Support (100.0%), Health Technologists (78.3%), and Education Instruction & Library (77.8%).
| Occupation | Male | Female |
| Management | 235 (54.5%) | 196 (45.5%) |
| Business & Financial | 90 (40.4%) | 133 (59.6%) |
| Computers, Engineering & Science | 315 (81.0%) | 74 (19.0%) |
| Computers & Mathematics | 241 (78.2%) | 67 (21.7%) |
| Architecture & Engineering | 69 (90.8%) | 7 (9.2%) |
| Life, Physical & Social Science | 5 (100.0%) | 0 (0.0%) |
| Community & Social Service | 186 (31.3%) | 408 (68.7%) |
| Education, Arts & Media | 12 (54.5%) | 10 (45.5%) |
| Legal Services & Support | 0 (0.0%) | 65 (100.0%) |
| Education Instruction & Library | 95 (22.2%) | 333 (77.8%) |
| Arts, Media & Entertainment | 79 (100.0%) | 0 (0.0%) |
| Health Diagnosing & Treating | 108 (40.0%) | 162 (60.0%) |
| Health Technologists | 35 (21.7%) | 126 (78.3%) |
| Total (Category) | 934 (49.0%) | 973 (51.0%) |
| Total (Overall) | 2,207 (52.4%) | 2,007 (47.6%) |
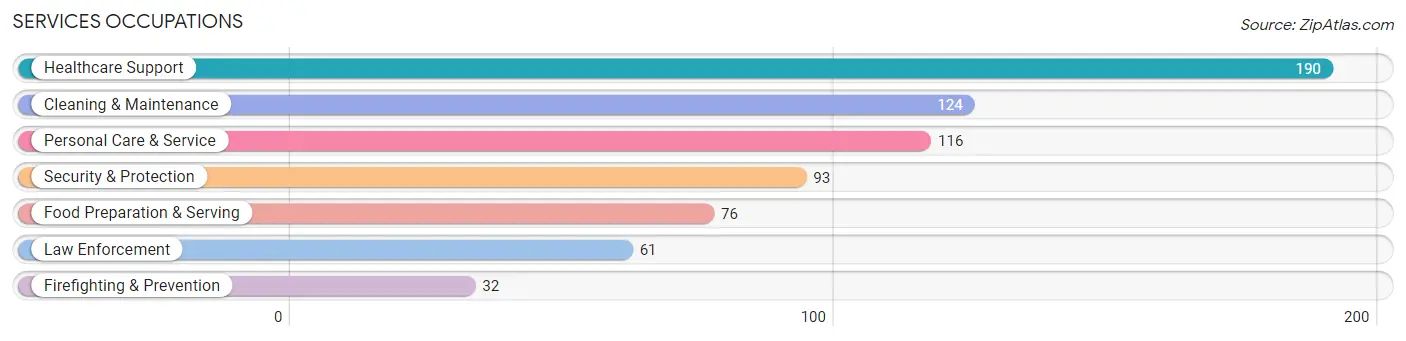
Services Occupations
The most common Services occupations in Sanatoga are Healthcare Support (190 | 4.5%), Cleaning & Maintenance (124 | 2.9%), Personal Care & Service (116 | 2.8%), Security & Protection (93 | 2.2%), and Food Preparation & Serving (76 | 1.8%).
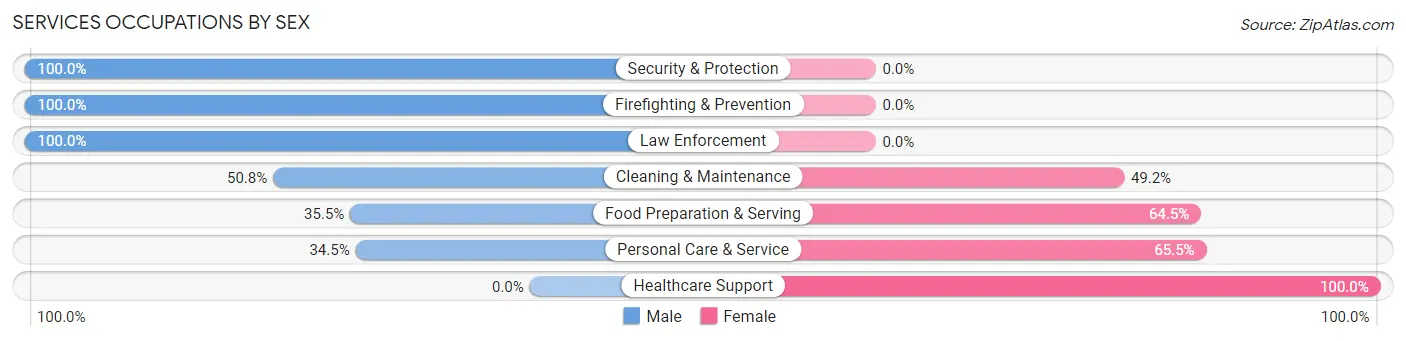
Services Occupations by Sex
Within the Services occupations in Sanatoga, the most male-oriented occupations are Security & Protection (100.0%), Firefighting & Prevention (100.0%), and Law Enforcement (100.0%), while the most female-oriented occupations are Healthcare Support (100.0%), Personal Care & Service (65.5%), and Food Preparation & Serving (64.5%).
| Occupation | Male | Female |
| Healthcare Support | 0 (0.0%) | 190 (100.0%) |
| Security & Protection | 93 (100.0%) | 0 (0.0%) |
| Firefighting & Prevention | 32 (100.0%) | 0 (0.0%) |
| Law Enforcement | 61 (100.0%) | 0 (0.0%) |
| Food Preparation & Serving | 27 (35.5%) | 49 (64.5%) |
| Cleaning & Maintenance | 63 (50.8%) | 61 (49.2%) |
| Personal Care & Service | 40 (34.5%) | 76 (65.5%) |
| Total (Category) | 223 (37.2%) | 376 (62.8%) |
| Total (Overall) | 2,207 (52.4%) | 2,007 (47.6%) |
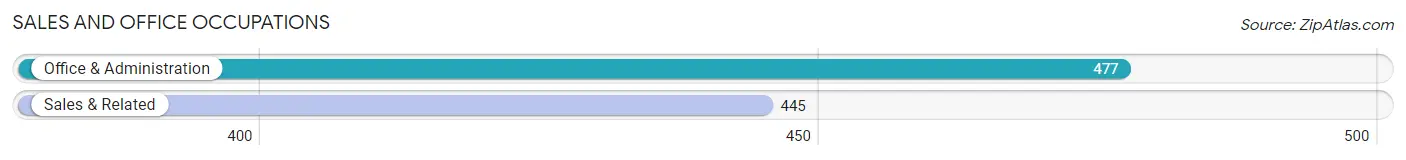
Sales and Office Occupations
The most common Sales and Office occupations in Sanatoga are Office & Administration (477 | 11.3%), and Sales & Related (445 | 10.6%).
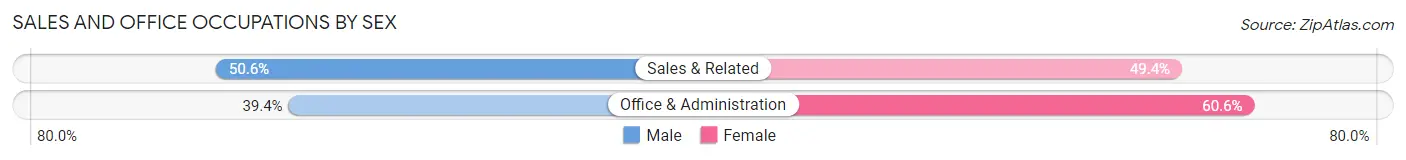
Sales and Office Occupations by Sex
| Occupation | Male | Female |
| Sales & Related | 225 (50.6%) | 220 (49.4%) |
| Office & Administration | 188 (39.4%) | 289 (60.6%) |
| Total (Category) | 413 (44.8%) | 509 (55.2%) |
| Total (Overall) | 2,207 (52.4%) | 2,007 (47.6%) |
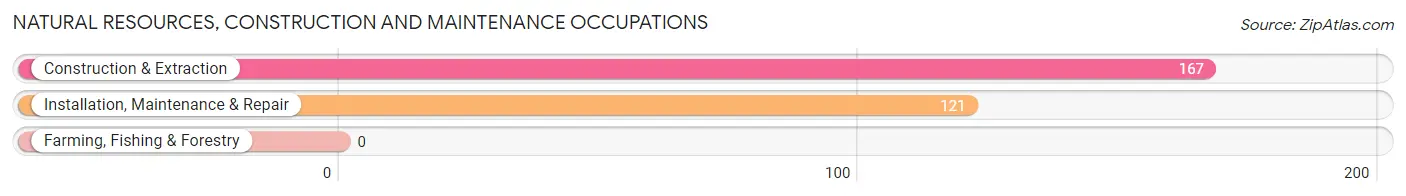
Natural Resources, Construction and Maintenance Occupations
The most common Natural Resources, Construction and Maintenance occupations in Sanatoga are Construction & Extraction (167 | 4.0%), and Installation, Maintenance & Repair (121 | 2.9%).
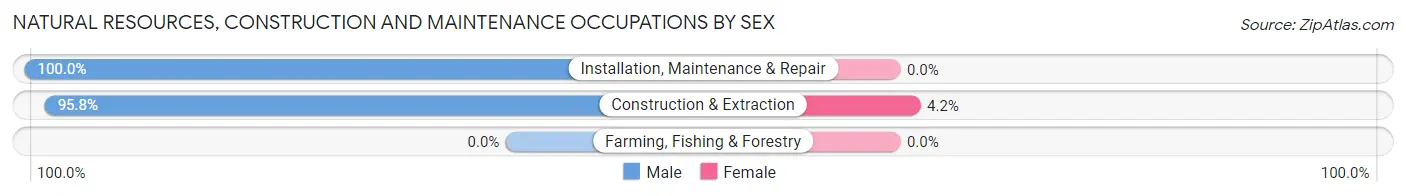
Natural Resources, Construction and Maintenance Occupations by Sex
| Occupation | Male | Female |
| Farming, Fishing & Forestry | 0 (0.0%) | 0 (0.0%) |
| Construction & Extraction | 160 (95.8%) | 7 (4.2%) |
| Installation, Maintenance & Repair | 121 (100.0%) | 0 (0.0%) |
| Total (Category) | 281 (97.6%) | 7 (2.4%) |
| Total (Overall) | 2,207 (52.4%) | 2,007 (47.6%) |
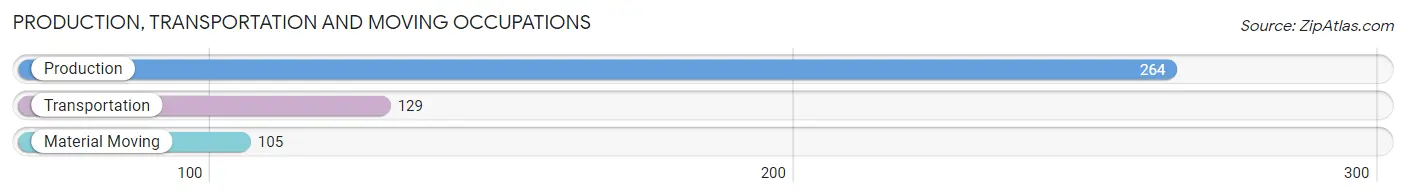
Production, Transportation and Moving Occupations
The most common Production, Transportation and Moving occupations in Sanatoga are Production (264 | 6.3%), Transportation (129 | 3.1%), and Material Moving (105 | 2.5%).
Production, Transportation and Moving Occupations by Sex
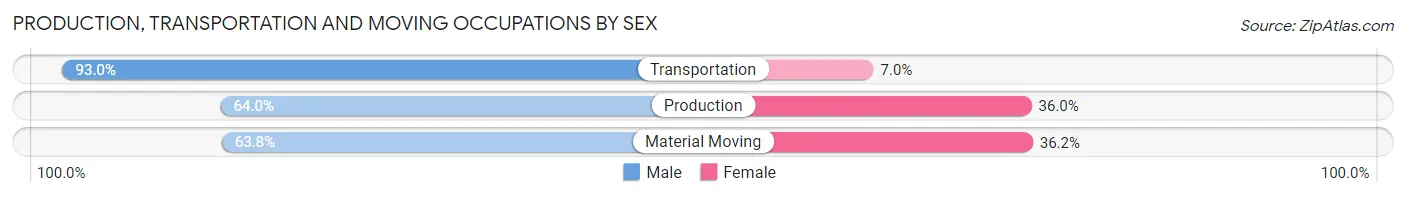
| Occupation | Male | Female |
| Production | 169 (64.0%) | 95 (36.0%) |
| Transportation | 120 (93.0%) | 9 (7.0%) |
| Material Moving | 67 (63.8%) | 38 (36.2%) |
| Total (Category) | 356 (71.5%) | 142 (28.5%) |
| Total (Overall) | 2,207 (52.4%) | 2,007 (47.6%) |
Employment Industries by Sex in Sanatoga
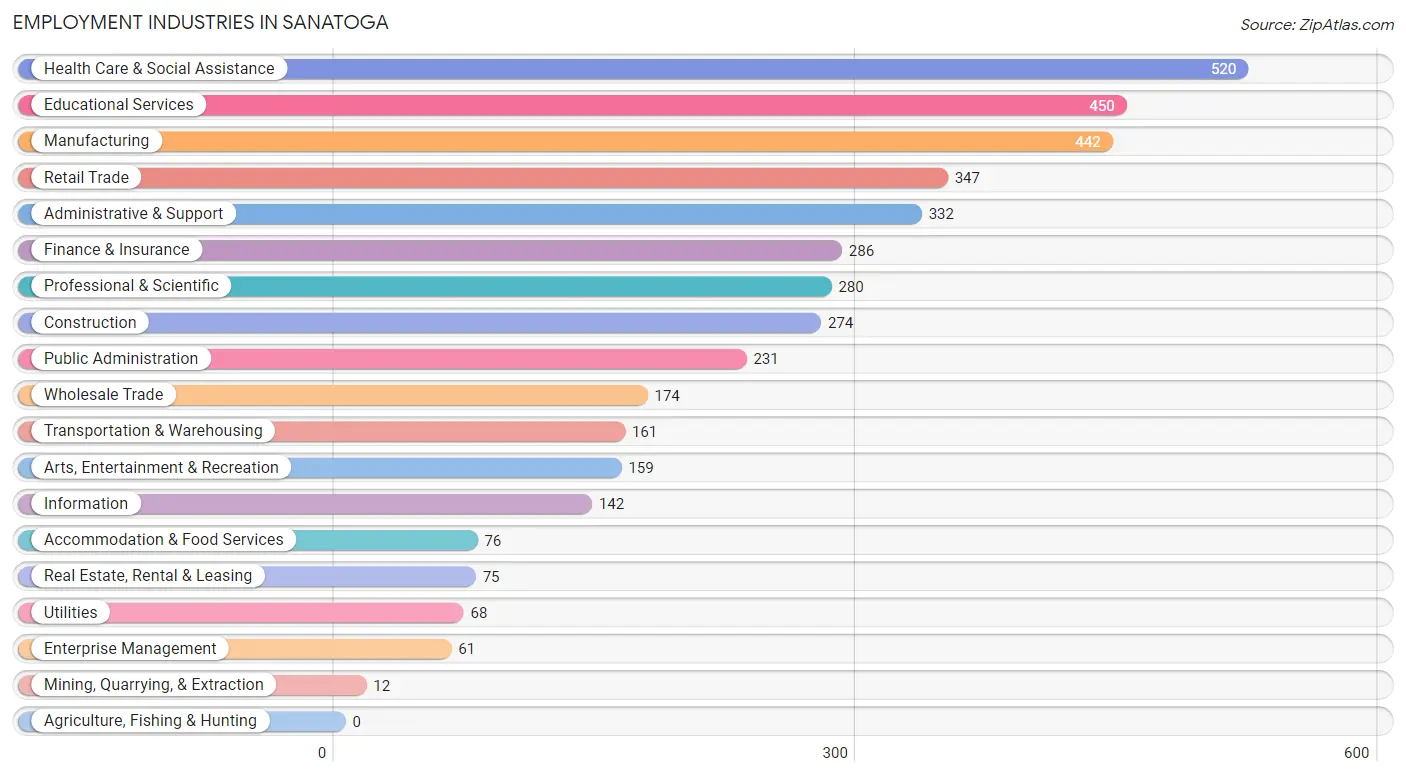
Employment Industries in Sanatoga
The major employment industries in Sanatoga include Health Care & Social Assistance (520 | 12.3%), Educational Services (450 | 10.7%), Manufacturing (442 | 10.5%), Retail Trade (347 | 8.2%), and Administrative & Support (332 | 7.9%).
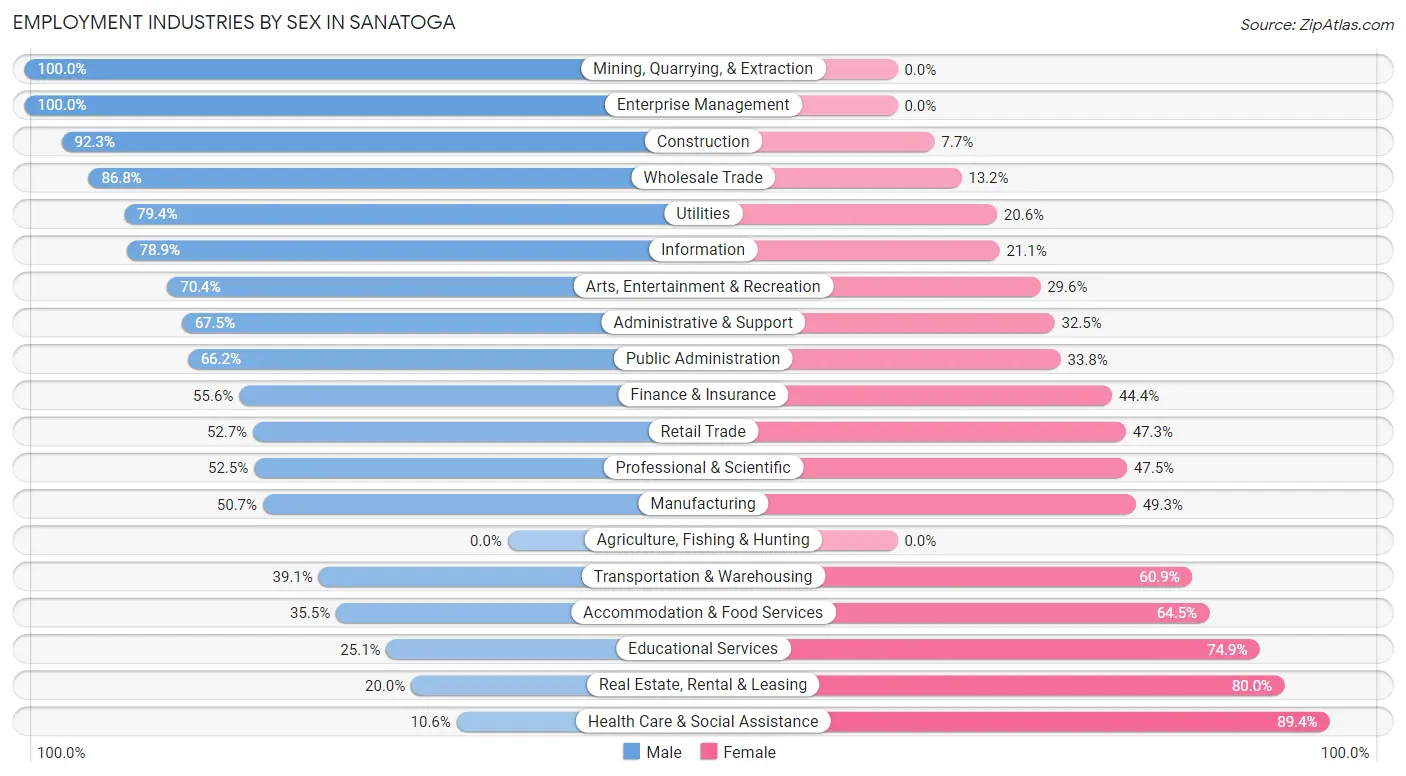
Employment Industries by Sex in Sanatoga
The Sanatoga industries that see more men than women are Mining, Quarrying, & Extraction (100.0%), Enterprise Management (100.0%), and Construction (92.3%), whereas the industries that tend to have a higher number of women are Health Care & Social Assistance (89.4%), Real Estate, Rental & Leasing (80.0%), and Educational Services (74.9%).
| Industry | Male | Female |
| Agriculture, Fishing & Hunting | 0 (0.0%) | 0 (0.0%) |
| Mining, Quarrying, & Extraction | 12 (100.0%) | 0 (0.0%) |
| Construction | 253 (92.3%) | 21 (7.7%) |
| Manufacturing | 224 (50.7%) | 218 (49.3%) |
| Wholesale Trade | 151 (86.8%) | 23 (13.2%) |
| Retail Trade | 183 (52.7%) | 164 (47.3%) |
| Transportation & Warehousing | 63 (39.1%) | 98 (60.9%) |
| Utilities | 54 (79.4%) | 14 (20.6%) |
| Information | 112 (78.9%) | 30 (21.1%) |
| Finance & Insurance | 159 (55.6%) | 127 (44.4%) |
| Real Estate, Rental & Leasing | 15 (20.0%) | 60 (80.0%) |
| Professional & Scientific | 147 (52.5%) | 133 (47.5%) |
| Enterprise Management | 61 (100.0%) | 0 (0.0%) |
| Administrative & Support | 224 (67.5%) | 108 (32.5%) |
| Educational Services | 113 (25.1%) | 337 (74.9%) |
| Health Care & Social Assistance | 55 (10.6%) | 465 (89.4%) |
| Arts, Entertainment & Recreation | 112 (70.4%) | 47 (29.6%) |
| Accommodation & Food Services | 27 (35.5%) | 49 (64.5%) |
| Public Administration | 153 (66.2%) | 78 (33.8%) |
| Total | 2,207 (52.4%) | 2,007 (47.6%) |
Education in Sanatoga
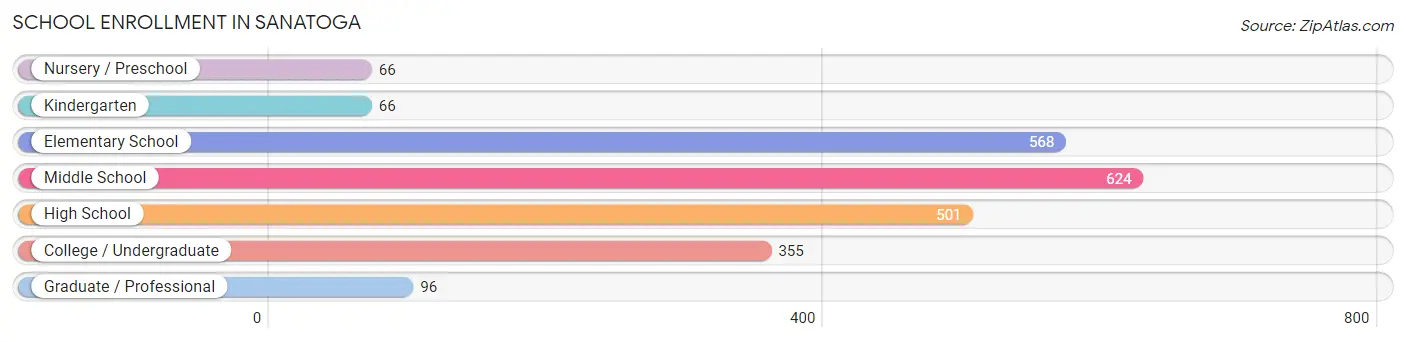
School Enrollment in Sanatoga
The most common levels of schooling among the 2,276 students in Sanatoga are middle school (624 | 27.4%), elementary school (568 | 25.0%), and high school (501 | 22.0%).
| School Level | # Students | % Students |
| Nursery / Preschool | 66 | 2.9% |
| Kindergarten | 66 | 2.9% |
| Elementary School | 568 | 25.0% |
| Middle School | 624 | 27.4% |
| High School | 501 | 22.0% |
| College / Undergraduate | 355 | 15.6% |
| Graduate / Professional | 96 | 4.2% |
| Total | 2,276 | 100.0% |
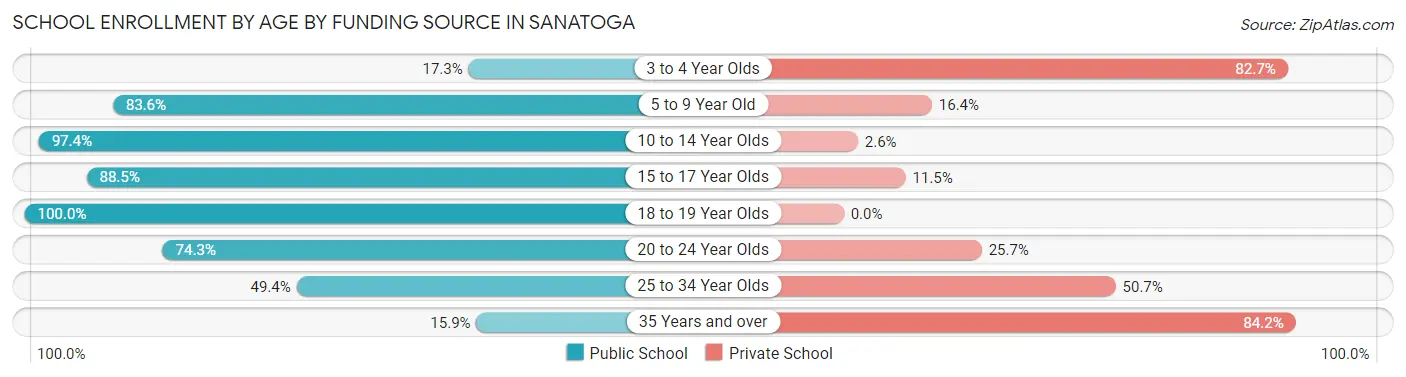
School Enrollment by Age by Funding Source in Sanatoga
Out of a total of 2,276 students who are enrolled in schools in Sanatoga, 410 (18.0%) attend a private institution, while the remaining 1,866 (82.0%) are enrolled in public schools. The age group of 35 years and over has the highest likelihood of being enrolled in private schools, with 69 (84.2% in the age bracket) enrolled. Conversely, the age group of 18 to 19 year olds has the lowest likelihood of being enrolled in a private school, with 112 (100.0% in the age bracket) attending a public institution.
| Age Bracket | Public School | Private School |
| 3 to 4 Year Olds | 9 (17.3%) | 43 (82.7%) |
| 5 to 9 Year Old | 473 (83.6%) | 93 (16.4%) |
| 10 to 14 Year Olds | 702 (97.4%) | 19 (2.6%) |
| 15 to 17 Year Olds | 391 (88.5%) | 51 (11.5%) |
| 18 to 19 Year Olds | 112 (100.0%) | 0 (0.0%) |
| 20 to 24 Year Olds | 52 (74.3%) | 18 (25.7%) |
| 25 to 34 Year Olds | 114 (49.3%) | 117 (50.6%) |
| 35 Years and over | 13 (15.9%) | 69 (84.2%) |
| Total | 1,866 (82.0%) | 410 (18.0%) |
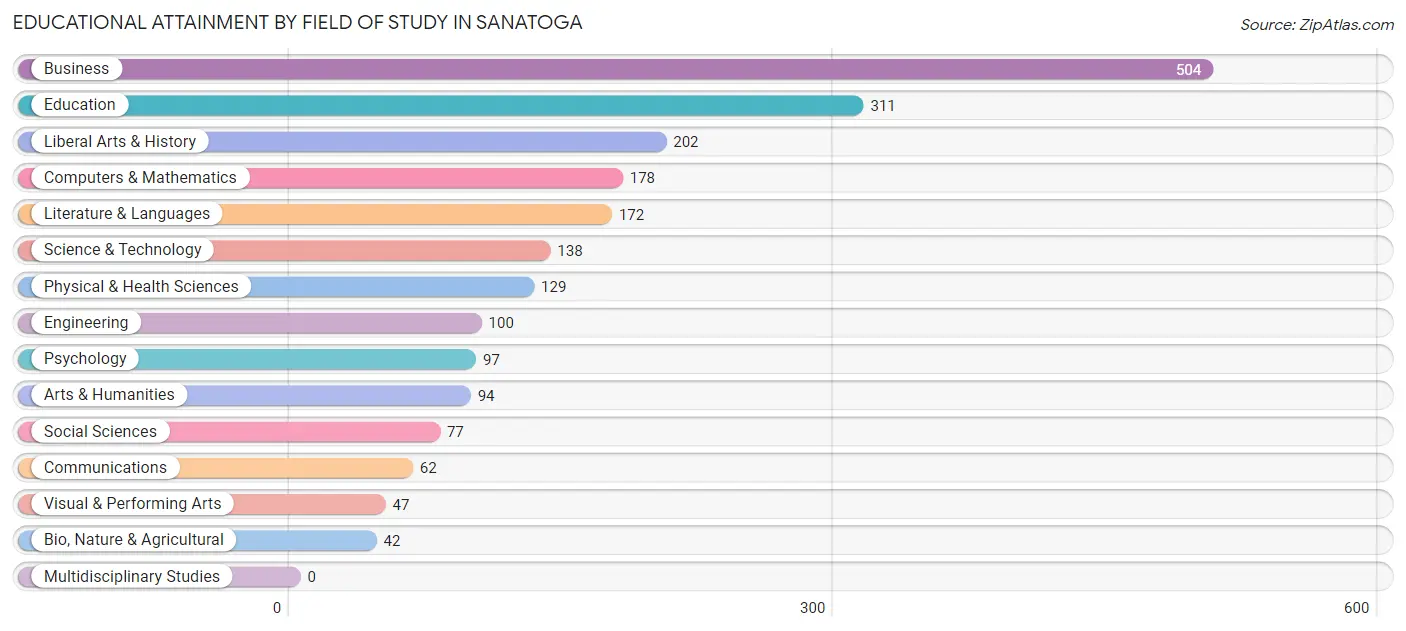
Educational Attainment by Field of Study in Sanatoga
Business (504 | 23.4%), education (311 | 14.4%), liberal arts & history (202 | 9.4%), computers & mathematics (178 | 8.3%), and literature & languages (172 | 8.0%) are the most common fields of study among 2,153 individuals in Sanatoga who have obtained a bachelor's degree or higher.
| Field of Study | # Graduates | % Graduates |
| Computers & Mathematics | 178 | 8.3% |
| Bio, Nature & Agricultural | 42 | 1.9% |
| Physical & Health Sciences | 129 | 6.0% |
| Psychology | 97 | 4.5% |
| Social Sciences | 77 | 3.6% |
| Engineering | 100 | 4.6% |
| Multidisciplinary Studies | 0 | 0.0% |
| Science & Technology | 138 | 6.4% |
| Business | 504 | 23.4% |
| Education | 311 | 14.4% |
| Literature & Languages | 172 | 8.0% |
| Liberal Arts & History | 202 | 9.4% |
| Visual & Performing Arts | 47 | 2.2% |
| Communications | 62 | 2.9% |
| Arts & Humanities | 94 | 4.4% |
| Total | 2,153 | 100.0% |
Transportation & Commute in Sanatoga
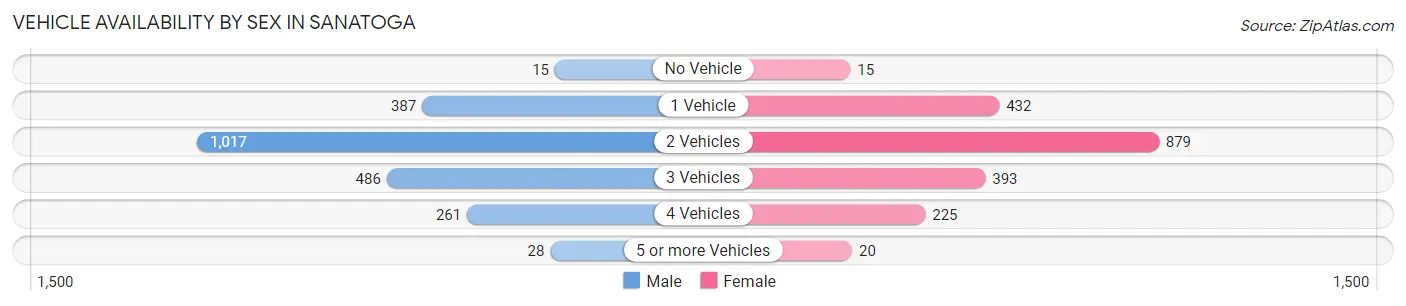
Vehicle Availability by Sex in Sanatoga
The most prevalent vehicle ownership categories in Sanatoga are males with 2 vehicles (1,017, accounting for 46.4%) and females with 2 vehicles (879, making up 51.8%).
| Vehicles Available | Male | Female |
| No Vehicle | 15 (0.7%) | 15 (0.8%) |
| 1 Vehicle | 387 (17.6%) | 432 (22.0%) |
| 2 Vehicles | 1,017 (46.4%) | 879 (44.8%) |
| 3 Vehicles | 486 (22.2%) | 393 (20.0%) |
| 4 Vehicles | 261 (11.9%) | 225 (11.5%) |
| 5 or more Vehicles | 28 (1.3%) | 20 (1.0%) |
| Total | 2,194 (100.0%) | 1,964 (100.0%) |
Commute Time in Sanatoga
The most frequently occuring commute durations in Sanatoga are 15 to 19 minutes (603 commuters, 16.5%), 10 to 14 minutes (525 commuters, 14.3%), and 30 to 34 minutes (403 commuters, 11.0%).
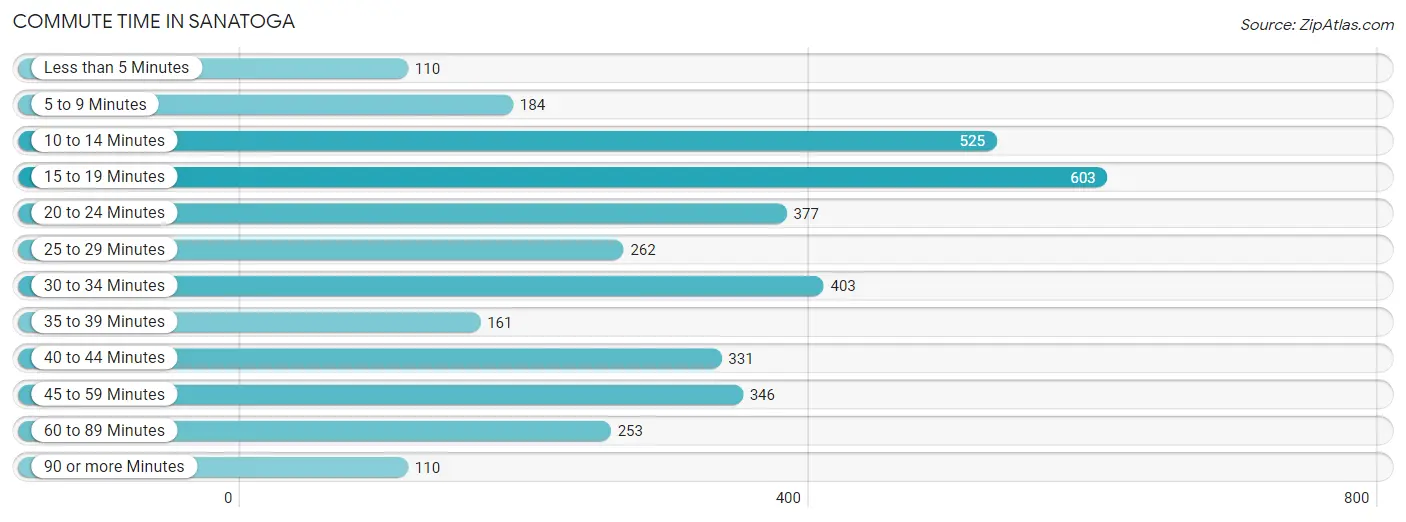
| Commute Time | # Commuters | % Commuters |
| Less than 5 Minutes | 110 | 3.0% |
| 5 to 9 Minutes | 184 | 5.0% |
| 10 to 14 Minutes | 525 | 14.3% |
| 15 to 19 Minutes | 603 | 16.5% |
| 20 to 24 Minutes | 377 | 10.3% |
| 25 to 29 Minutes | 262 | 7.1% |
| 30 to 34 Minutes | 403 | 11.0% |
| 35 to 39 Minutes | 161 | 4.4% |
| 40 to 44 Minutes | 331 | 9.0% |
| 45 to 59 Minutes | 346 | 9.4% |
| 60 to 89 Minutes | 253 | 6.9% |
| 90 or more Minutes | 110 | 3.0% |
Commute Time by Sex in Sanatoga
The most common commute times in Sanatoga are 10 to 14 minutes (356 commuters, 18.4%) for males and 15 to 19 minutes (321 commuters, 18.5%) for females.
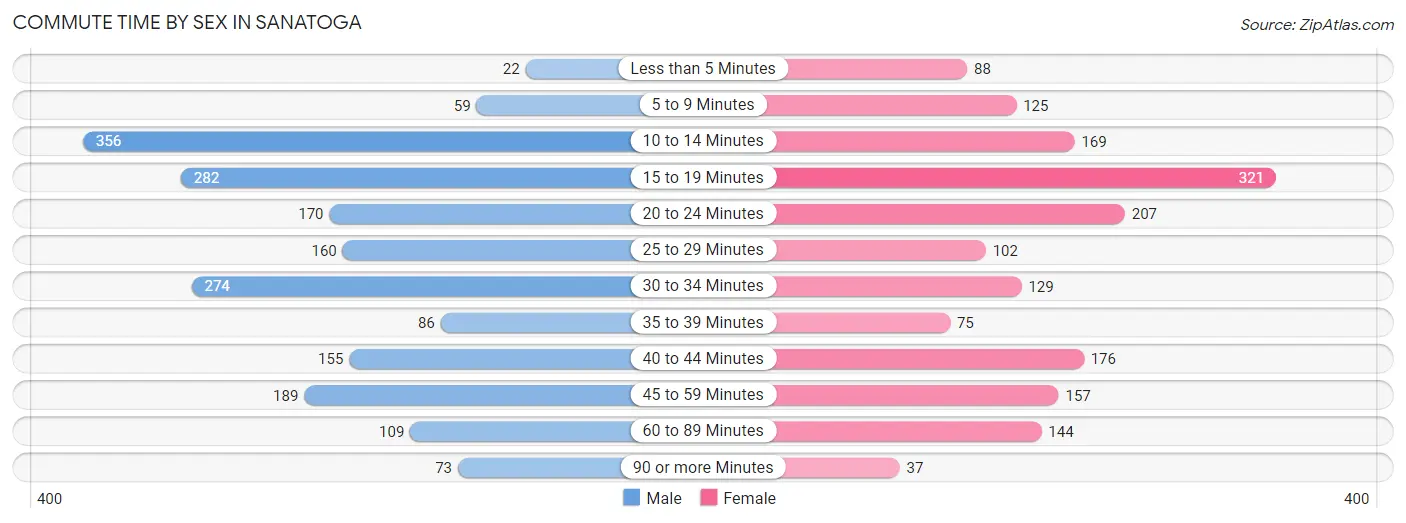
| Commute Time | Male | Female |
| Less than 5 Minutes | 22 (1.1%) | 88 (5.1%) |
| 5 to 9 Minutes | 59 (3.0%) | 125 (7.2%) |
| 10 to 14 Minutes | 356 (18.4%) | 169 (9.8%) |
| 15 to 19 Minutes | 282 (14.6%) | 321 (18.5%) |
| 20 to 24 Minutes | 170 (8.8%) | 207 (12.0%) |
| 25 to 29 Minutes | 160 (8.3%) | 102 (5.9%) |
| 30 to 34 Minutes | 274 (14.2%) | 129 (7.5%) |
| 35 to 39 Minutes | 86 (4.4%) | 75 (4.3%) |
| 40 to 44 Minutes | 155 (8.0%) | 176 (10.2%) |
| 45 to 59 Minutes | 189 (9.8%) | 157 (9.1%) |
| 60 to 89 Minutes | 109 (5.6%) | 144 (8.3%) |
| 90 or more Minutes | 73 (3.8%) | 37 (2.1%) |
Time of Departure to Work by Sex in Sanatoga
The most frequent times of departure to work in Sanatoga are 7:30 AM to 7:59 AM (298, 15.4%) for males and 7:30 AM to 7:59 AM (388, 22.4%) for females.
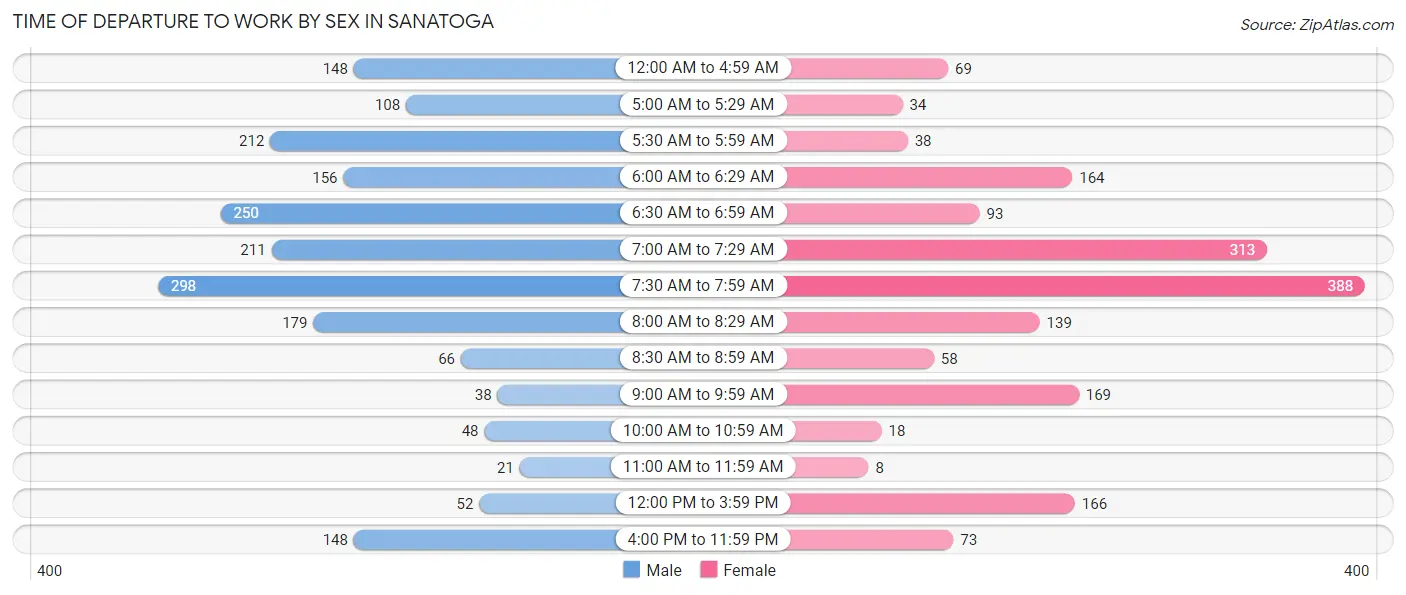
| Time of Departure | Male | Female |
| 12:00 AM to 4:59 AM | 148 (7.6%) | 69 (4.0%) |
| 5:00 AM to 5:29 AM | 108 (5.6%) | 34 (2.0%) |
| 5:30 AM to 5:59 AM | 212 (11.0%) | 38 (2.2%) |
| 6:00 AM to 6:29 AM | 156 (8.1%) | 164 (9.5%) |
| 6:30 AM to 6:59 AM | 250 (12.9%) | 93 (5.4%) |
| 7:00 AM to 7:29 AM | 211 (10.9%) | 313 (18.1%) |
| 7:30 AM to 7:59 AM | 298 (15.4%) | 388 (22.4%) |
| 8:00 AM to 8:29 AM | 179 (9.2%) | 139 (8.0%) |
| 8:30 AM to 8:59 AM | 66 (3.4%) | 58 (3.4%) |
| 9:00 AM to 9:59 AM | 38 (2.0%) | 169 (9.8%) |
| 10:00 AM to 10:59 AM | 48 (2.5%) | 18 (1.0%) |
| 11:00 AM to 11:59 AM | 21 (1.1%) | 8 (0.5%) |
| 12:00 PM to 3:59 PM | 52 (2.7%) | 166 (9.6%) |
| 4:00 PM to 11:59 PM | 148 (7.6%) | 73 (4.2%) |
| Total | 1,935 (100.0%) | 1,730 (100.0%) |
Housing Occupancy in Sanatoga
Occupancy by Ownership in Sanatoga
Of the total 3,118 dwellings in Sanatoga, owner-occupied units account for 2,185 (70.1%), while renter-occupied units make up 933 (29.9%).
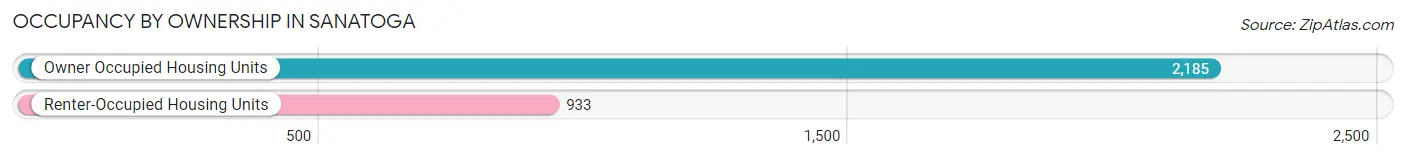
| Occupancy | # Housing Units | % Housing Units |
| Owner Occupied Housing Units | 2,185 | 70.1% |
| Renter-Occupied Housing Units | 933 | 29.9% |
| Total Occupied Housing Units | 3,118 | 100.0% |
Occupancy by Household Size in Sanatoga
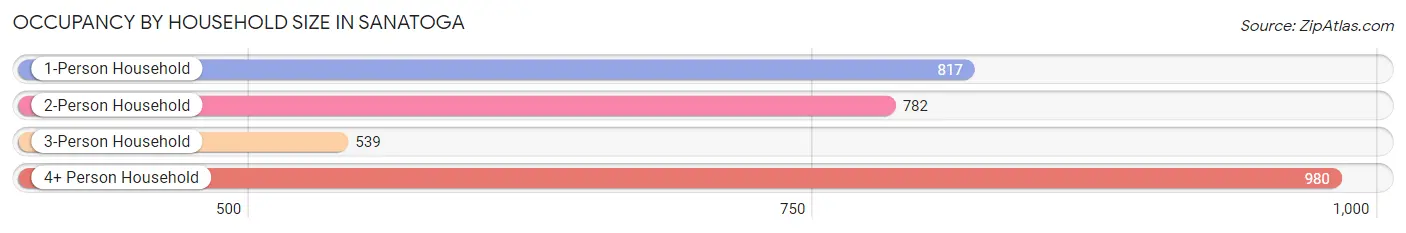
| Household Size | # Housing Units | % Housing Units |
| 1-Person Household | 817 | 26.2% |
| 2-Person Household | 782 | 25.1% |
| 3-Person Household | 539 | 17.3% |
| 4+ Person Household | 980 | 31.4% |
| Total Housing Units | 3,118 | 100.0% |
Occupancy by Ownership by Household Size in Sanatoga
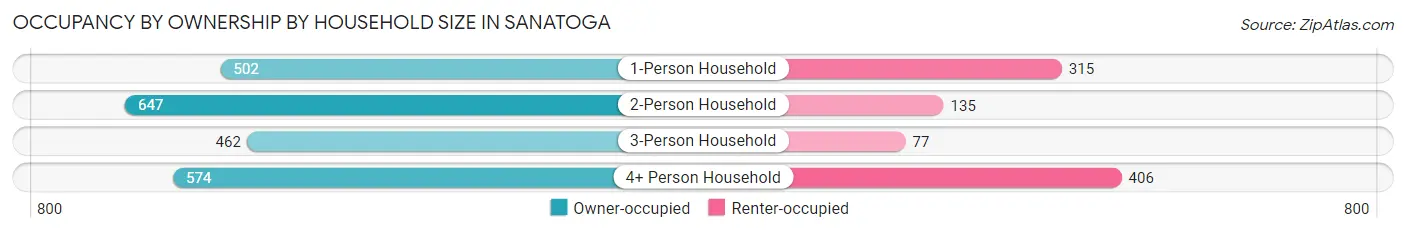
| Household Size | Owner-occupied | Renter-occupied |
| 1-Person Household | 502 (61.4%) | 315 (38.6%) |
| 2-Person Household | 647 (82.7%) | 135 (17.3%) |
| 3-Person Household | 462 (85.7%) | 77 (14.3%) |
| 4+ Person Household | 574 (58.6%) | 406 (41.4%) |
| Total Housing Units | 2,185 (70.1%) | 933 (29.9%) |
Occupancy by Educational Attainment in Sanatoga
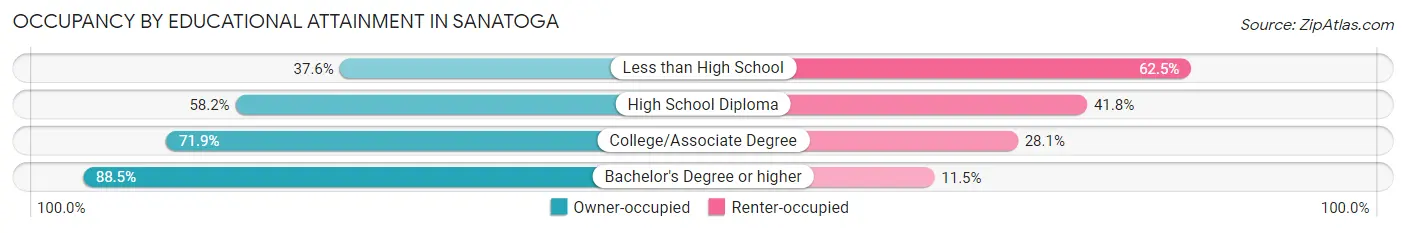
| Household Size | Owner-occupied | Renter-occupied |
| Less than High School | 92 (37.6%) | 153 (62.5%) |
| High School Diploma | 635 (58.2%) | 456 (41.8%) |
| College/Associate Degree | 515 (71.9%) | 201 (28.1%) |
| Bachelor's Degree or higher | 943 (88.5%) | 123 (11.5%) |
Occupancy by Age of Householder in Sanatoga
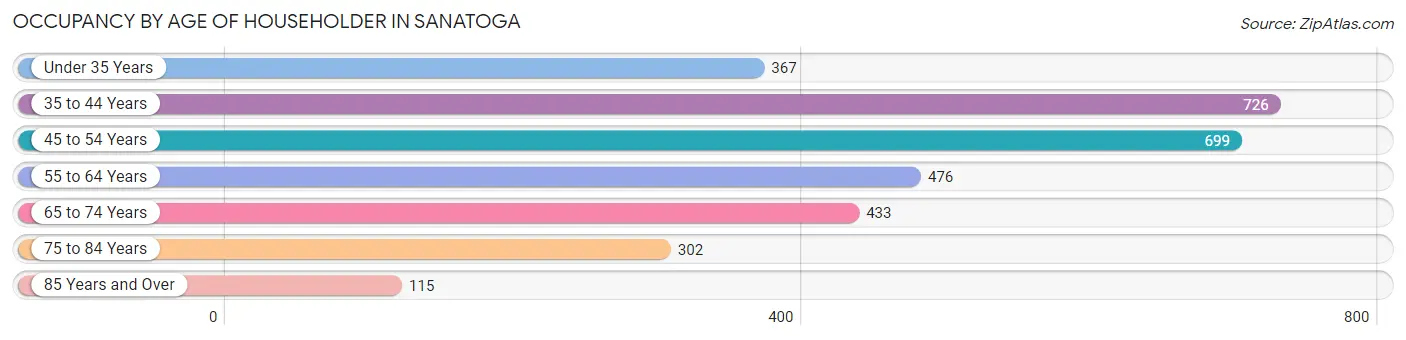
| Age Bracket | # Households | % Households |
| Under 35 Years | 367 | 11.8% |
| 35 to 44 Years | 726 | 23.3% |
| 45 to 54 Years | 699 | 22.4% |
| 55 to 64 Years | 476 | 15.3% |
| 65 to 74 Years | 433 | 13.9% |
| 75 to 84 Years | 302 | 9.7% |
| 85 Years and Over | 115 | 3.7% |
| Total | 3,118 | 100.0% |
Housing Finances in Sanatoga
Median Income by Occupancy in Sanatoga
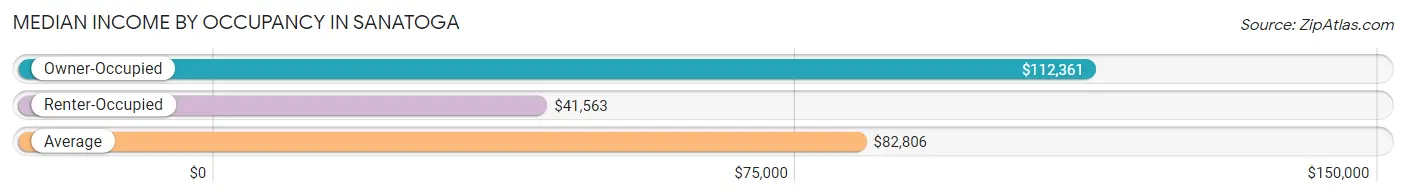
| Occupancy Type | # Households | Median Income |
| Owner-Occupied | 2,185 (70.1%) | $112,361 |
| Renter-Occupied | 933 (29.9%) | $41,563 |
| Average | 3,118 (100.0%) | $82,806 |
Occupancy by Householder Income Bracket in Sanatoga
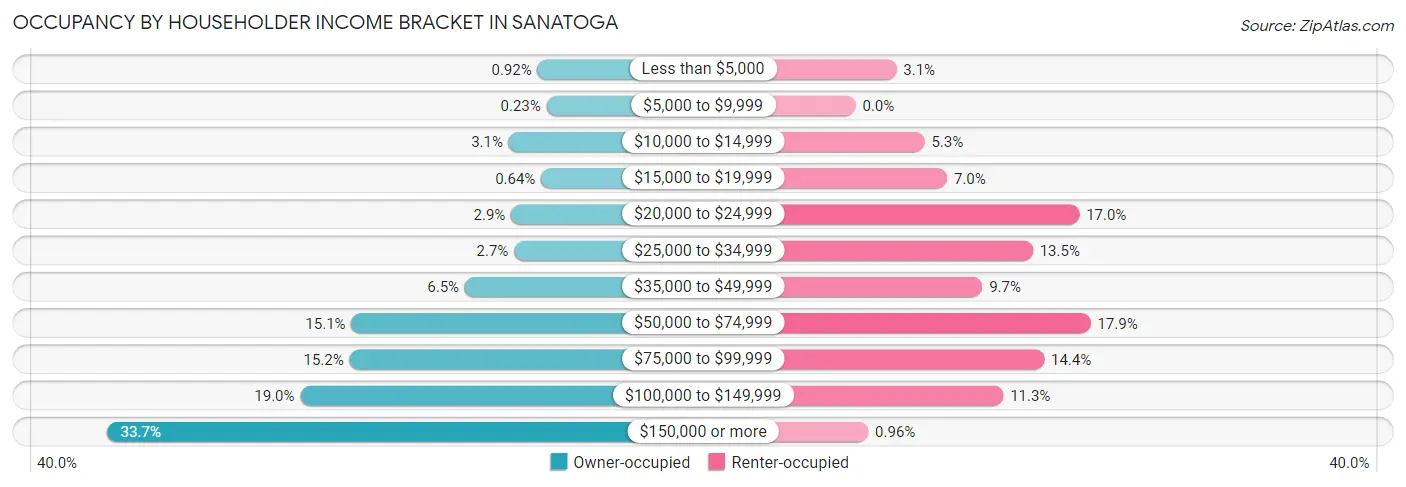
| Income Bracket | Owner-occupied | Renter-occupied |
| Less than $5,000 | 20 (0.9%) | 29 (3.1%) |
| $5,000 to $9,999 | 5 (0.2%) | 0 (0.0%) |
| $10,000 to $14,999 | 68 (3.1%) | 49 (5.2%) |
| $15,000 to $19,999 | 14 (0.6%) | 65 (7.0%) |
| $20,000 to $24,999 | 64 (2.9%) | 159 (17.0%) |
| $25,000 to $34,999 | 59 (2.7%) | 126 (13.5%) |
| $35,000 to $49,999 | 141 (6.5%) | 90 (9.7%) |
| $50,000 to $74,999 | 330 (15.1%) | 167 (17.9%) |
| $75,000 to $99,999 | 333 (15.2%) | 134 (14.4%) |
| $100,000 to $149,999 | 415 (19.0%) | 105 (11.3%) |
| $150,000 or more | 736 (33.7%) | 9 (1.0%) |
| Total | 2,185 (100.0%) | 933 (100.0%) |
Monthly Housing Cost Tiers in Sanatoga
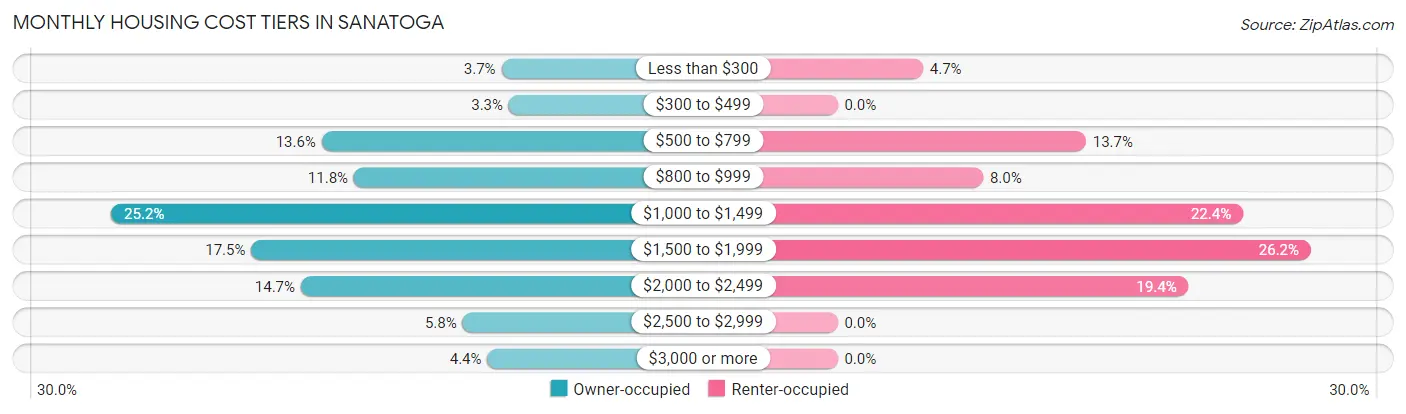
| Monthly Cost | Owner-occupied | Renter-occupied |
| Less than $300 | 80 (3.7%) | 44 (4.7%) |
| $300 to $499 | 71 (3.3%) | 0 (0.0%) |
| $500 to $799 | 297 (13.6%) | 128 (13.7%) |
| $800 to $999 | 258 (11.8%) | 75 (8.0%) |
| $1,000 to $1,499 | 551 (25.2%) | 209 (22.4%) |
| $1,500 to $1,999 | 382 (17.5%) | 244 (26.2%) |
| $2,000 to $2,499 | 322 (14.7%) | 181 (19.4%) |
| $2,500 to $2,999 | 127 (5.8%) | 0 (0.0%) |
| $3,000 or more | 97 (4.4%) | 0 (0.0%) |
| Total | 2,185 (100.0%) | 933 (100.0%) |
Physical Housing Characteristics in Sanatoga
Housing Structures in Sanatoga
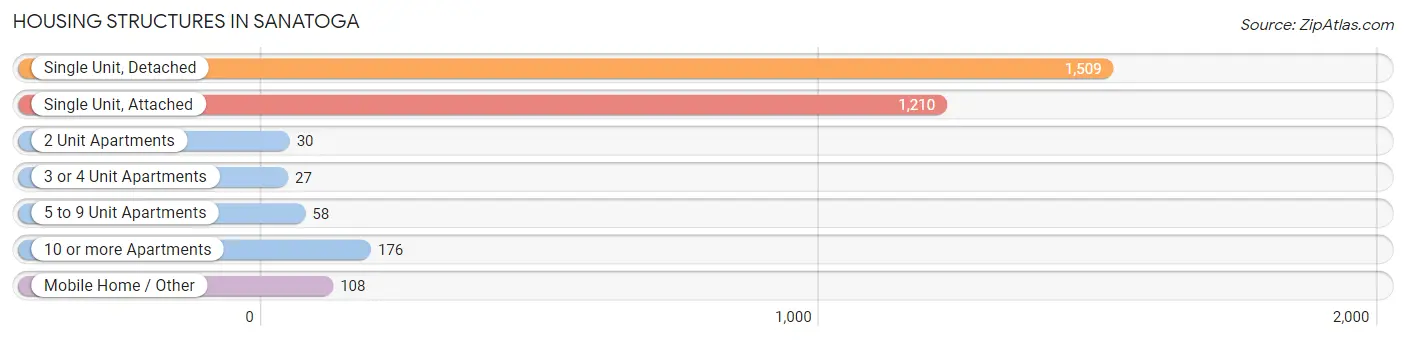
| Structure Type | # Housing Units | % Housing Units |
| Single Unit, Detached | 1,509 | 48.4% |
| Single Unit, Attached | 1,210 | 38.8% |
| 2 Unit Apartments | 30 | 1.0% |
| 3 or 4 Unit Apartments | 27 | 0.9% |
| 5 to 9 Unit Apartments | 58 | 1.9% |
| 10 or more Apartments | 176 | 5.6% |
| Mobile Home / Other | 108 | 3.5% |
| Total | 3,118 | 100.0% |
Housing Structures by Occupancy in Sanatoga
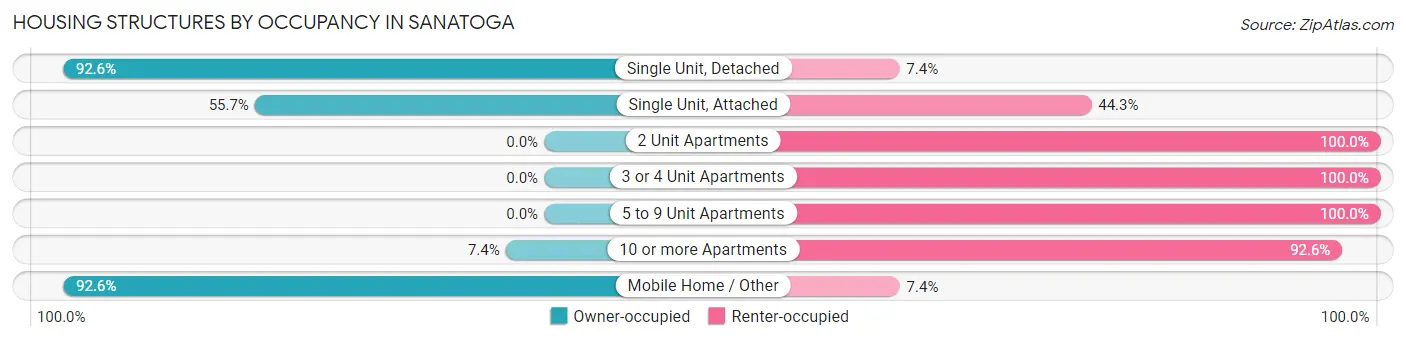
| Structure Type | Owner-occupied | Renter-occupied |
| Single Unit, Detached | 1,398 (92.6%) | 111 (7.4%) |
| Single Unit, Attached | 674 (55.7%) | 536 (44.3%) |
| 2 Unit Apartments | 0 (0.0%) | 30 (100.0%) |
| 3 or 4 Unit Apartments | 0 (0.0%) | 27 (100.0%) |
| 5 to 9 Unit Apartments | 0 (0.0%) | 58 (100.0%) |
| 10 or more Apartments | 13 (7.4%) | 163 (92.6%) |
| Mobile Home / Other | 100 (92.6%) | 8 (7.4%) |
| Total | 2,185 (70.1%) | 933 (29.9%) |
Housing Structures by Number of Rooms in Sanatoga
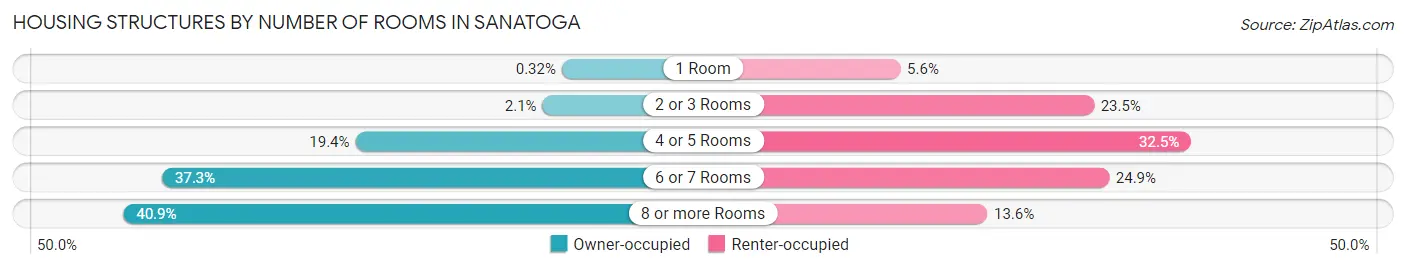
| Number of Rooms | Owner-occupied | Renter-occupied |
| 1 Room | 7 (0.3%) | 52 (5.6%) |
| 2 or 3 Rooms | 46 (2.1%) | 219 (23.5%) |
| 4 or 5 Rooms | 424 (19.4%) | 303 (32.5%) |
| 6 or 7 Rooms | 815 (37.3%) | 232 (24.9%) |
| 8 or more Rooms | 893 (40.9%) | 127 (13.6%) |
| Total | 2,185 (100.0%) | 933 (100.0%) |
Housing Structure by Heating Type in Sanatoga
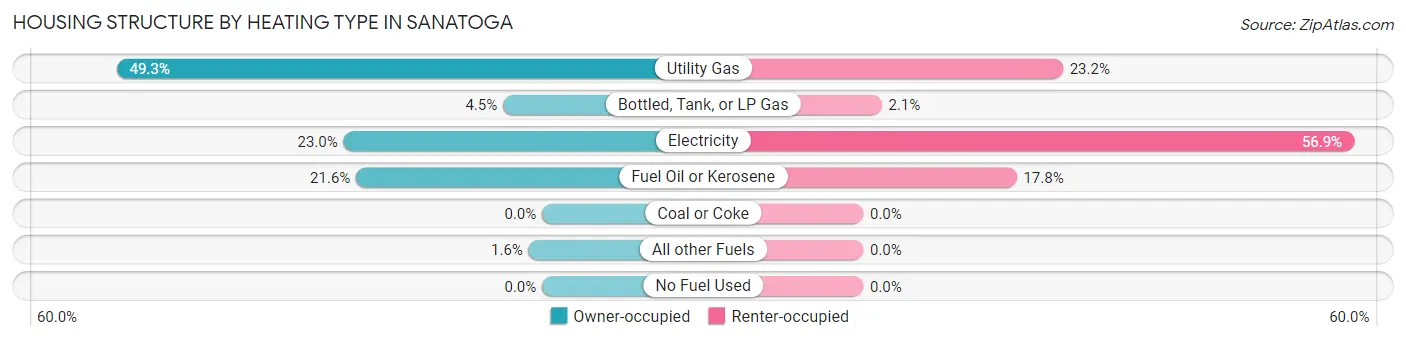
| Heating Type | Owner-occupied | Renter-occupied |
| Utility Gas | 1,078 (49.3%) | 216 (23.2%) |
| Bottled, Tank, or LP Gas | 99 (4.5%) | 20 (2.1%) |
| Electricity | 503 (23.0%) | 531 (56.9%) |
| Fuel Oil or Kerosene | 471 (21.6%) | 166 (17.8%) |
| Coal or Coke | 0 (0.0%) | 0 (0.0%) |
| All other Fuels | 34 (1.6%) | 0 (0.0%) |
| No Fuel Used | 0 (0.0%) | 0 (0.0%) |
| Total | 2,185 (100.0%) | 933 (100.0%) |
Household Vehicle Usage in Sanatoga
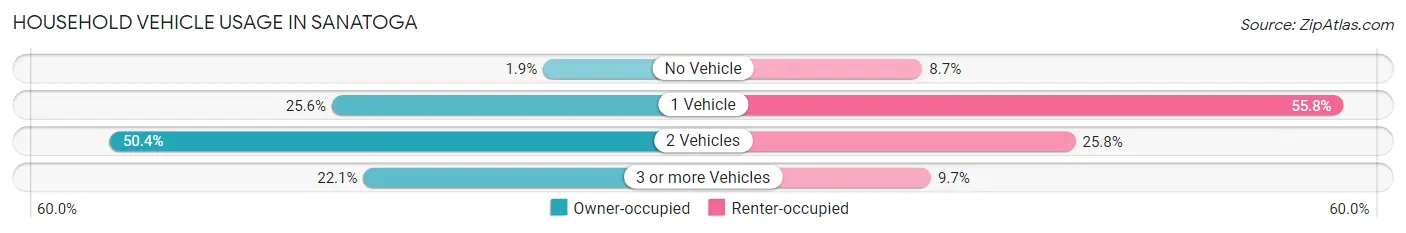
| Vehicles per Household | Owner-occupied | Renter-occupied |
| No Vehicle | 42 (1.9%) | 81 (8.7%) |
| 1 Vehicle | 559 (25.6%) | 521 (55.8%) |
| 2 Vehicles | 1,102 (50.4%) | 241 (25.8%) |
| 3 or more Vehicles | 482 (22.1%) | 90 (9.7%) |
| Total | 2,185 (100.0%) | 933 (100.0%) |
Real Estate & Mortgages in Sanatoga
Real Estate and Mortgage Overview in Sanatoga
| Characteristic | Without Mortgage | With Mortgage |
| Housing Units | 796 | 1,389 |
| Median Property Value | $240,500 | $249,000 |
| Median Household Income | $80,313 | $516 |
| Monthly Housing Costs | $793 | $90 |
| Real Estate Taxes | $5,367 | $43 |
Property Value by Mortgage Status in Sanatoga
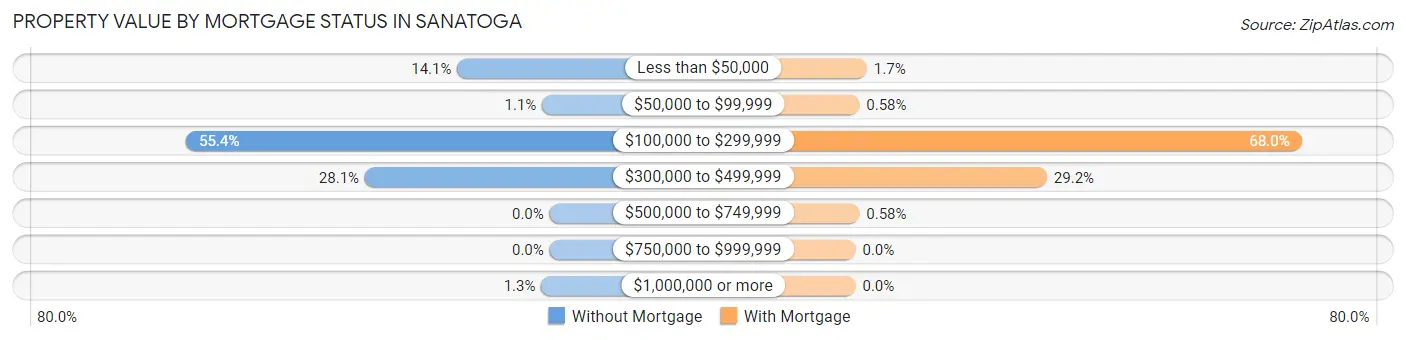
| Property Value | Without Mortgage | With Mortgage |
| Less than $50,000 | 112 (14.1%) | 24 (1.7%) |
| $50,000 to $99,999 | 9 (1.1%) | 8 (0.6%) |
| $100,000 to $299,999 | 441 (55.4%) | 944 (68.0%) |
| $300,000 to $499,999 | 224 (28.1%) | 405 (29.2%) |
| $500,000 to $749,999 | 0 (0.0%) | 8 (0.6%) |
| $750,000 to $999,999 | 0 (0.0%) | 0 (0.0%) |
| $1,000,000 or more | 10 (1.3%) | 0 (0.0%) |
| Total | 796 (100.0%) | 1,389 (100.0%) |
Household Income by Mortgage Status in Sanatoga
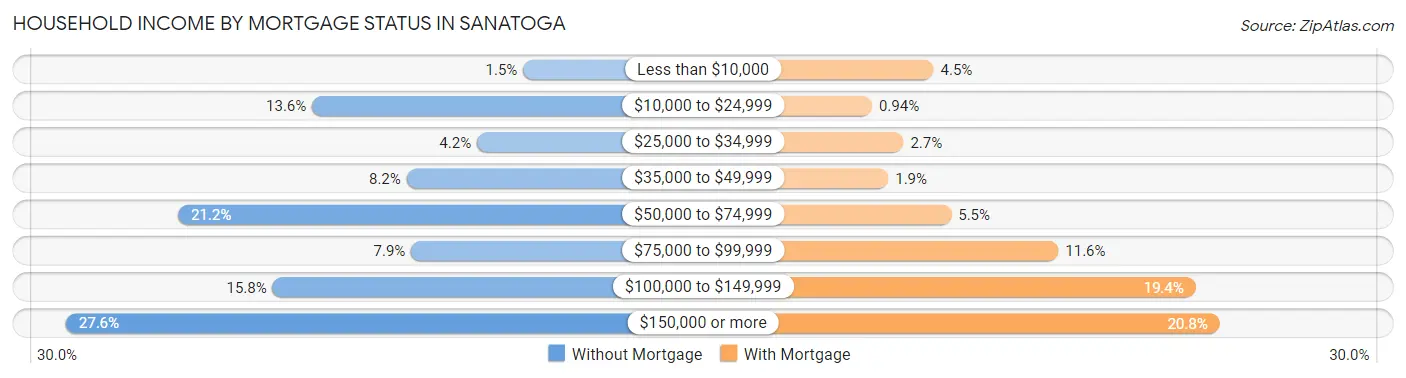
| Household Income | Without Mortgage | With Mortgage |
| Less than $10,000 | 12 (1.5%) | 62 (4.5%) |
| $10,000 to $24,999 | 108 (13.6%) | 13 (0.9%) |
| $25,000 to $34,999 | 33 (4.2%) | 38 (2.7%) |
| $35,000 to $49,999 | 65 (8.2%) | 26 (1.9%) |
| $50,000 to $74,999 | 169 (21.2%) | 76 (5.5%) |
| $75,000 to $99,999 | 63 (7.9%) | 161 (11.6%) |
| $100,000 to $149,999 | 126 (15.8%) | 270 (19.4%) |
| $150,000 or more | 220 (27.6%) | 289 (20.8%) |
| Total | 796 (100.0%) | 1,389 (100.0%) |
Property Value to Household Income Ratio in Sanatoga
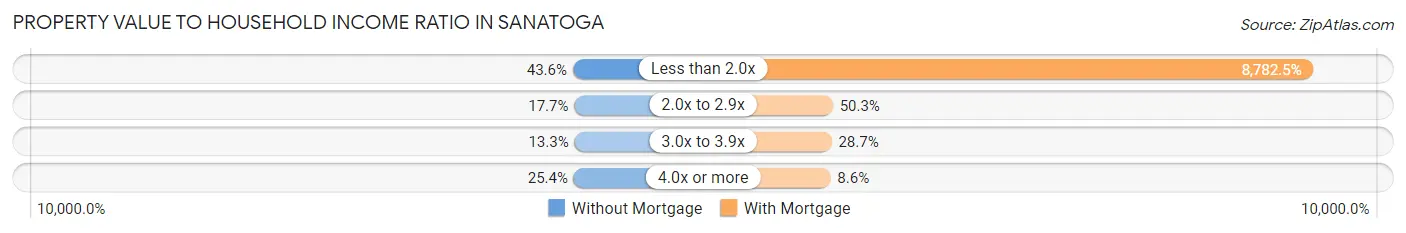
| Value-to-Income Ratio | Without Mortgage | With Mortgage |
| Less than 2.0x | 347 (43.6%) | 121,989 (8,782.5%) |
| 2.0x to 2.9x | 141 (17.7%) | 698 (50.2%) |
| 3.0x to 3.9x | 106 (13.3%) | 399 (28.7%) |
| 4.0x or more | 202 (25.4%) | 119 (8.6%) |
| Total | 796 (100.0%) | 1,389 (100.0%) |
Real Estate Taxes by Mortgage Status in Sanatoga
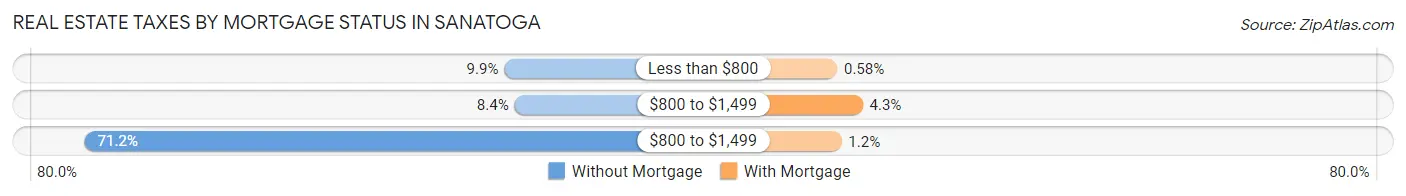
| Property Taxes | Without Mortgage | With Mortgage |
| Less than $800 | 79 (9.9%) | 8 (0.6%) |
| $800 to $1,499 | 67 (8.4%) | 60 (4.3%) |
| $800 to $1,499 | 567 (71.2%) | 17 (1.2%) |
| Total | 796 (100.0%) | 1,389 (100.0%) |
Health & Disability in Sanatoga
Health Insurance Coverage by Age in Sanatoga
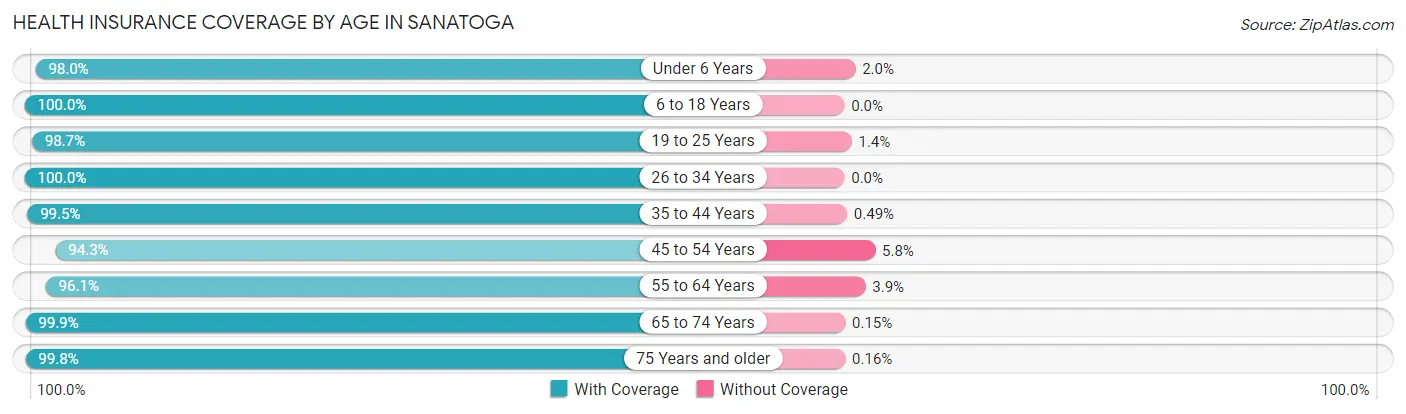
| Age Bracket | With Coverage | Without Coverage |
| Under 6 Years | 627 (98.0%) | 13 (2.0%) |
| 6 to 18 Years | 1,858 (100.0%) | 0 (0.0%) |
| 19 to 25 Years | 584 (98.7%) | 8 (1.3%) |
| 26 to 34 Years | 700 (100.0%) | 0 (0.0%) |
| 35 to 44 Years | 1,426 (99.5%) | 7 (0.5%) |
| 45 to 54 Years | 1,131 (94.3%) | 69 (5.8%) |
| 55 to 64 Years | 881 (96.1%) | 36 (3.9%) |
| 65 to 74 Years | 688 (99.9%) | 1 (0.2%) |
| 75 Years and older | 627 (99.8%) | 1 (0.2%) |
| Total | 8,522 (98.4%) | 135 (1.6%) |
Health Insurance Coverage by Citizenship Status in Sanatoga
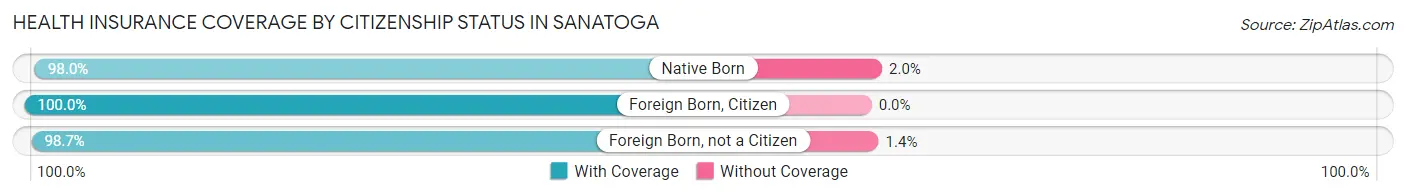
| Citizenship Status | With Coverage | Without Coverage |
| Native Born | 627 (98.0%) | 13 (2.0%) |
| Foreign Born, Citizen | 1,858 (100.0%) | 0 (0.0%) |
| Foreign Born, not a Citizen | 584 (98.7%) | 8 (1.3%) |
Health Insurance Coverage by Household Income in Sanatoga
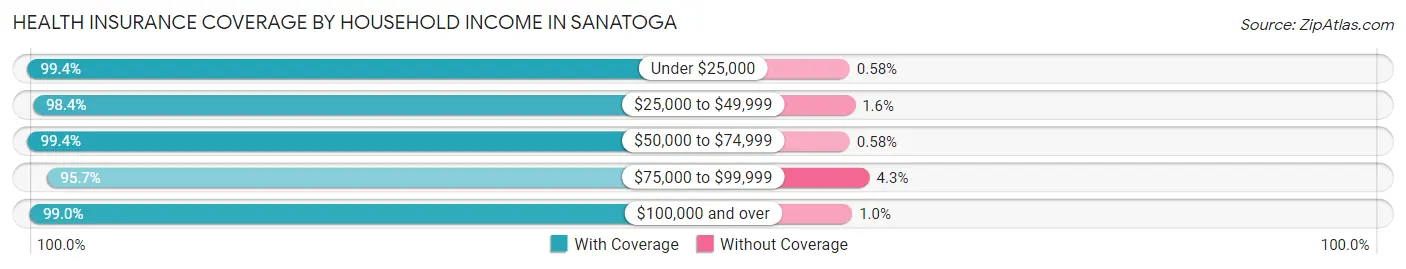
| Household Income | With Coverage | Without Coverage |
| Under $25,000 | 1,036 (99.4%) | 6 (0.6%) |
| $25,000 to $49,999 | 684 (98.4%) | 11 (1.6%) |
| $50,000 to $74,999 | 1,198 (99.4%) | 7 (0.6%) |
| $75,000 to $99,999 | 1,521 (95.7%) | 68 (4.3%) |
| $100,000 and over | 4,073 (99.0%) | 42 (1.0%) |
Public vs Private Health Insurance Coverage by Age in Sanatoga
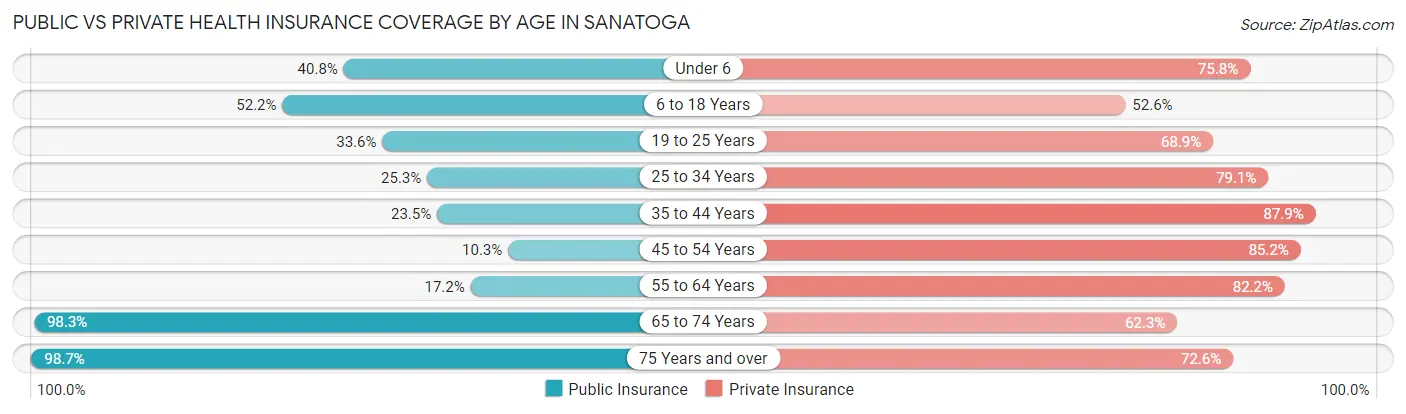
| Age Bracket | Public Insurance | Private Insurance |
| Under 6 | 261 (40.8%) | 485 (75.8%) |
| 6 to 18 Years | 969 (52.1%) | 978 (52.6%) |
| 19 to 25 Years | 199 (33.6%) | 408 (68.9%) |
| 25 to 34 Years | 177 (25.3%) | 554 (79.1%) |
| 35 to 44 Years | 336 (23.4%) | 1,260 (87.9%) |
| 45 to 54 Years | 123 (10.2%) | 1,022 (85.2%) |
| 55 to 64 Years | 158 (17.2%) | 754 (82.2%) |
| 65 to 74 Years | 677 (98.3%) | 429 (62.3%) |
| 75 Years and over | 620 (98.7%) | 456 (72.6%) |
| Total | 3,520 (40.7%) | 6,346 (73.3%) |
Disability Status by Sex by Age in Sanatoga
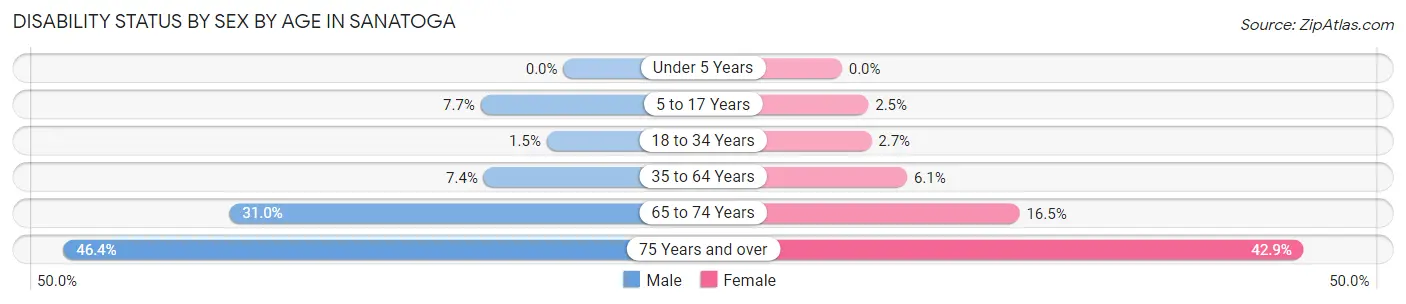
| Age Bracket | Male | Female |
| Under 5 Years | 0 (0.0%) | 0 (0.0%) |
| 5 to 17 Years | 81 (7.7%) | 20 (2.5%) |
| 18 to 34 Years | 11 (1.5%) | 18 (2.7%) |
| 35 to 64 Years | 134 (7.4%) | 105 (6.0%) |
| 65 to 74 Years | 97 (31.0%) | 62 (16.5%) |
| 75 Years and over | 103 (46.4%) | 174 (42.9%) |
Disability Class by Sex by Age in Sanatoga
Disability Class: Hearing Difficulty
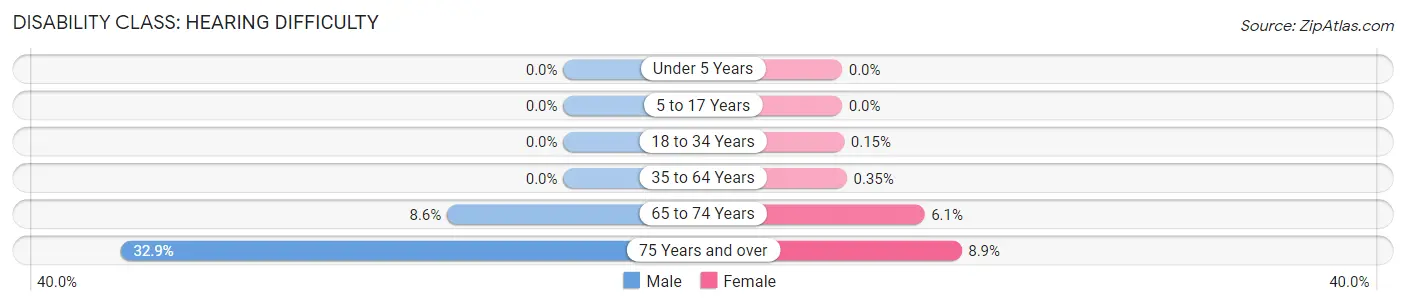
| Age Bracket | Male | Female |
| Under 5 Years | 0 (0.0%) | 0 (0.0%) |
| 5 to 17 Years | 0 (0.0%) | 0 (0.0%) |
| 18 to 34 Years | 0 (0.0%) | 1 (0.2%) |
| 35 to 64 Years | 0 (0.0%) | 6 (0.4%) |
| 65 to 74 Years | 27 (8.6%) | 23 (6.1%) |
| 75 Years and over | 73 (32.9%) | 36 (8.9%) |
Disability Class: Vision Difficulty
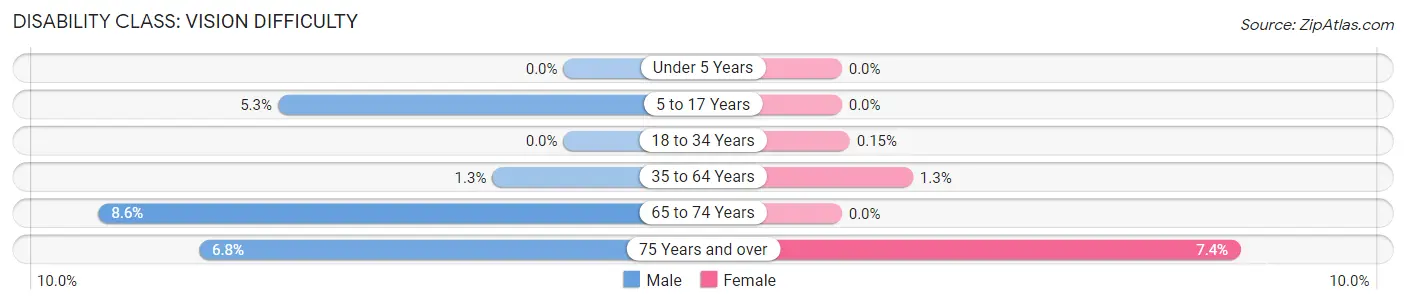
| Age Bracket | Male | Female |
| Under 5 Years | 0 (0.0%) | 0 (0.0%) |
| 5 to 17 Years | 56 (5.3%) | 0 (0.0%) |
| 18 to 34 Years | 0 (0.0%) | 1 (0.2%) |
| 35 to 64 Years | 24 (1.3%) | 23 (1.3%) |
| 65 to 74 Years | 27 (8.6%) | 0 (0.0%) |
| 75 Years and over | 15 (6.8%) | 30 (7.4%) |
Disability Class: Cognitive Difficulty
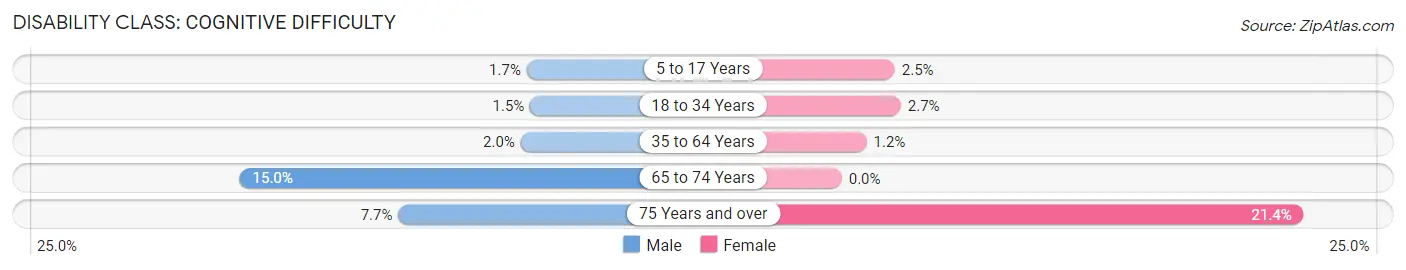
| Age Bracket | Male | Female |
| 5 to 17 Years | 18 (1.7%) | 20 (2.5%) |
| 18 to 34 Years | 11 (1.5%) | 18 (2.7%) |
| 35 to 64 Years | 36 (2.0%) | 20 (1.1%) |
| 65 to 74 Years | 47 (15.0%) | 0 (0.0%) |
| 75 Years and over | 17 (7.7%) | 87 (21.4%) |
Disability Class: Ambulatory Difficulty
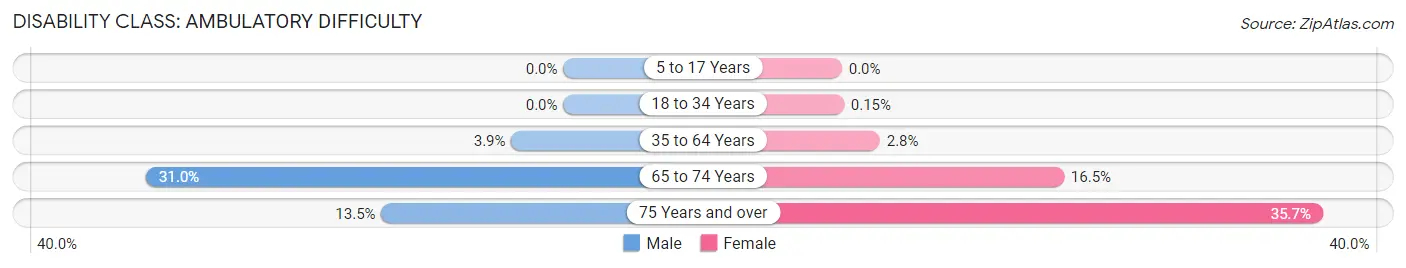
| Age Bracket | Male | Female |
| 5 to 17 Years | 0 (0.0%) | 0 (0.0%) |
| 18 to 34 Years | 0 (0.0%) | 1 (0.2%) |
| 35 to 64 Years | 70 (3.9%) | 49 (2.8%) |
| 65 to 74 Years | 97 (31.0%) | 62 (16.5%) |
| 75 Years and over | 30 (13.5%) | 145 (35.7%) |
Disability Class: Self-Care Difficulty
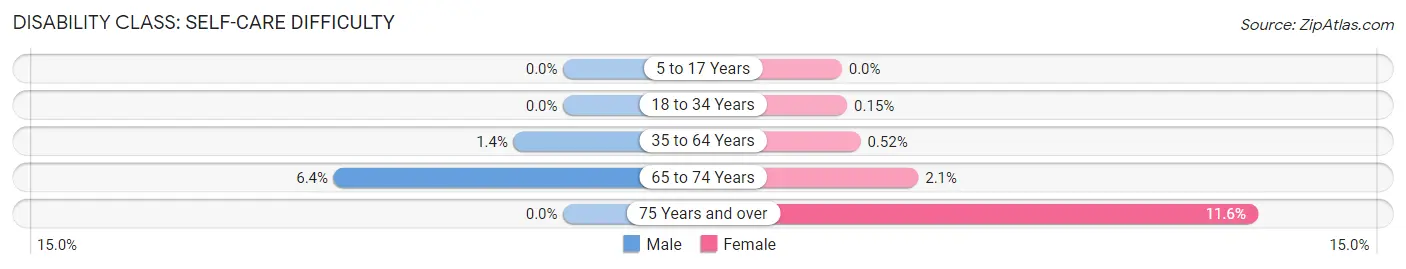
| Age Bracket | Male | Female |
| 5 to 17 Years | 0 (0.0%) | 0 (0.0%) |
| 18 to 34 Years | 0 (0.0%) | 1 (0.2%) |
| 35 to 64 Years | 25 (1.4%) | 9 (0.5%) |
| 65 to 74 Years | 20 (6.4%) | 8 (2.1%) |
| 75 Years and over | 0 (0.0%) | 47 (11.6%) |
Technology Access in Sanatoga
Computing Device Access in Sanatoga
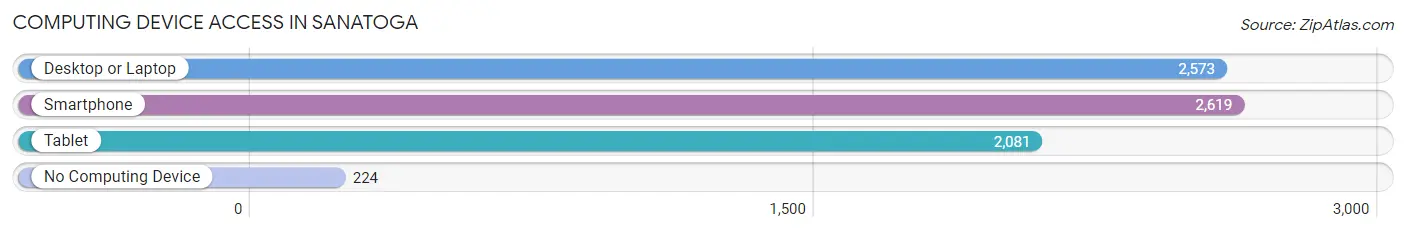
| Device Type | # Households | % Households |
| Desktop or Laptop | 2,573 | 82.5% |
| Smartphone | 2,619 | 84.0% |
| Tablet | 2,081 | 66.7% |
| No Computing Device | 224 | 7.2% |
| Total | 3,118 | 100.0% |
Internet Access in Sanatoga
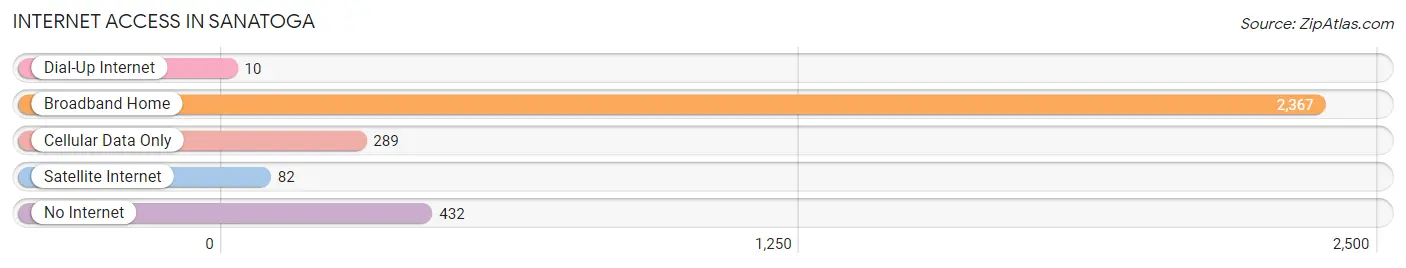
| Internet Type | # Households | % Households |
| Dial-Up Internet | 10 | 0.3% |
| Broadband Home | 2,367 | 75.9% |
| Cellular Data Only | 289 | 9.3% |
| Satellite Internet | 82 | 2.6% |
| No Internet | 432 | 13.9% |
| Total | 3,118 | 100.0% |
Sanatoga Summary
Sanatoga is a small borough located in Montgomery County, Pennsylvania. It is situated in the southeastern corner of the county, approximately 20 miles northwest of Philadelphia. The population of Sanatoga was 2,042 at the 2010 census.
Geography
Sanatoga is located at 40°13'17" North, 75°33'45" West (40.2214, -75.5625). According to the United States Census Bureau, the borough has a total area of 0.7 square miles (1.8 km2), all of it land.
Sanatoga is bordered by Lower Pottsgrove Township to the north, Limerick Township to the east, Pottstown to the south, and Upper Pottsgrove Township to the west.
History
Sanatoga was first settled in 1720 by a group of German immigrants. The name of the town is derived from the Native American word for "meeting place". The town was officially incorporated in 1851.
Sanatoga was an important stop on the Reading Railroad, which ran through the town from 1842 to 1976. The railroad was a major factor in the growth of the town, as it provided easy access to Philadelphia and other cities.
Economy
Sanatoga is primarily a residential community, with most of its residents commuting to nearby cities for work. The town does have a few small businesses, including a grocery store, a hardware store, and a few restaurants.
The largest employer in the area is the Sanatoga Water Treatment Plant, which provides drinking water to the surrounding communities. The plant employs over 100 people.
Demographics
As of the 2010 census, there were 2,042 people, 845 households, and 590 families residing in the borough. The population density was 2,945.3 people per square mile (1,139.2/km2). There were 890 housing units at an average density of 1,269.3 per square mile (489.2/km2). The racial makeup of the borough was 94.2% White, 1.7% African American, 0.2% Native American, 1.2% Asian, 0.7% from other races, and 2.0% from two or more races. Hispanic or Latino of any race were 2.7% of the population.
There were 845 households, out of which 28.2% had children under the age of 18 living with them, 54.2% were married couples living together, 10.2% had a female householder with no husband present, and 30.7% were non-families. 25.2% of all households were made up of individuals, and 11.2% had someone living alone who was 65 years of age or older. The average household size was 2.41 and the average family size was 2.88.
In the borough, the population was spread out, with 22.2% under the age of 18, 6.2% from 18 to 24, 28.2% from 25 to 44, 27.2% from 45 to 64, and 16.2% who were 65 years of age or older. The median age was 40 years. For every 100 females, there were 93.2 males. For every 100 females age 18 and over, there were 91.2 males.
The median income for a household in the borough was $54,917, and the median income for a family was $63,958. Males had a median income of $45,000 versus $32,500 for females. The per capita income for the borough was $25,945. About 4.2% of families and 5.2% of the population were below the poverty line, including 6.2% of those under age 18 and 4.2% of those age 65 or over.
Common Questions
What is Per Capita Income in Sanatoga?
Per Capita income in Sanatoga is $37,108.
What is the Median Family Income in Sanatoga?
Median Family Income in Sanatoga is $100,246.
What is the Median Household income in Sanatoga?
Median Household Income in Sanatoga is $82,806.
What is Income or Wage Gap in Sanatoga?
Income or Wage Gap in Sanatoga is 39.0%.
Women in Sanatoga earn 61.0 cents for every dollar earned by a man.
What is Family Income Deficit in Sanatoga?
Family Income Deficit in Sanatoga is $18,469.
Families that are below poverty line in Sanatoga earn $18,469 less on average than the poverty threshold level.
What is Inequality or Gini Index in Sanatoga?
Inequality or Gini Index in Sanatoga is 0.41.
What is the Total Population of Sanatoga?
Total Population of Sanatoga is 8,829.
What is the Total Male Population of Sanatoga?
Total Male Population of Sanatoga is 4,528.
What is the Total Female Population of Sanatoga?
Total Female Population of Sanatoga is 4,301.
What is the Ratio of Males per 100 Females in Sanatoga?
There are 105.28 Males per 100 Females in Sanatoga.
What is the Ratio of Females per 100 Males in Sanatoga?
There are 94.99 Females per 100 Males in Sanatoga.
What is the Median Population Age in Sanatoga?
Median Population Age in Sanatoga is 38.5 Years.
What is the Average Family Size in Sanatoga
Average Family Size in Sanatoga is 3.4 People.
What is the Average Household Size in Sanatoga
Average Household Size in Sanatoga is 2.8 People.
How Large is the Labor Force in Sanatoga?
There are 4,448 People in the Labor Forcein in Sanatoga.
What is the Percentage of People in the Labor Force in Sanatoga?
66.1% of People are in the Labor Force in Sanatoga.
What is the Unemployment Rate in Sanatoga?
Unemployment Rate in Sanatoga is 5.2%.