Glendon borough, PA Map & Demographics
Glendon borough Overview
$43,265
PER CAPITA INCOME
$105,208
AVG FAMILY INCOME
$91,250
AVG HOUSEHOLD INCOME
30.6%
WAGE / INCOME GAP [ % ]
69.4¢/ $1
WAGE / INCOME GAP [ $ ]
0.42
INEQUALITY / GINI INDEX
384
TOTAL POPULATION
179
MALE POPULATION
205
FEMALE POPULATION
87.32
MALES / 100 FEMALES
114.53
FEMALES / 100 MALES
53.6
MEDIAN AGE
2.9
AVG FAMILY SIZE
2.6
AVG HOUSEHOLD SIZE
219
LABOR FORCE [ PEOPLE ]
63.8%
PERCENT IN LABOR FORCE
5.5%
UNEMPLOYMENT RATE
Income in Glendon borough
Income Overview in Glendon borough
Per Capita Income in Glendon borough is $43,265, while median incomes of families and households are $105,208 and $91,250 respectively.
| Characteristic | Number | Measure |
| Per Capita Income | 384 | $43,265 |
| Median Family Income | 95 | $105,208 |
| Mean Family Income | 95 | $136,488 |
| Median Household Income | 149 | $91,250 |
| Mean Household Income | 149 | $114,570 |
| Income Deficit | 95 | $0 |
| Wage / Income Gap (%) | 384 | 30.58% |
| Wage / Income Gap ($) | 384 | 69.42¢ per $1 |
| Gini / Inequality Index | 384 | 0.42 |
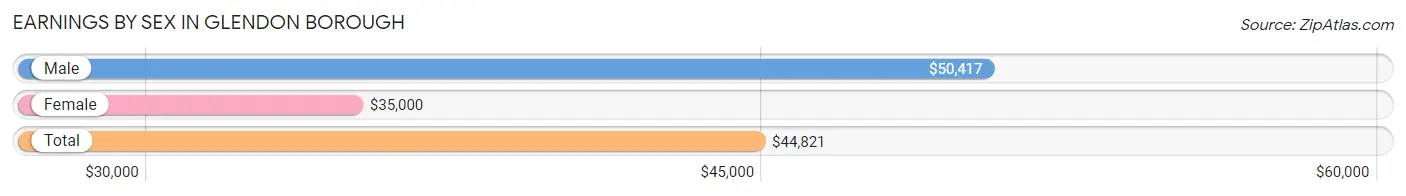
Earnings by Sex in Glendon borough
Average Earnings in Glendon borough are $44,821, $50,417 for men and $35,000 for women, a difference of 30.6%.
| Sex | Number | Average Earnings |
| Male | 111 (49.3%) | $50,417 |
| Female | 114 (50.7%) | $35,000 |
| Total | 225 (100.0%) | $44,821 |
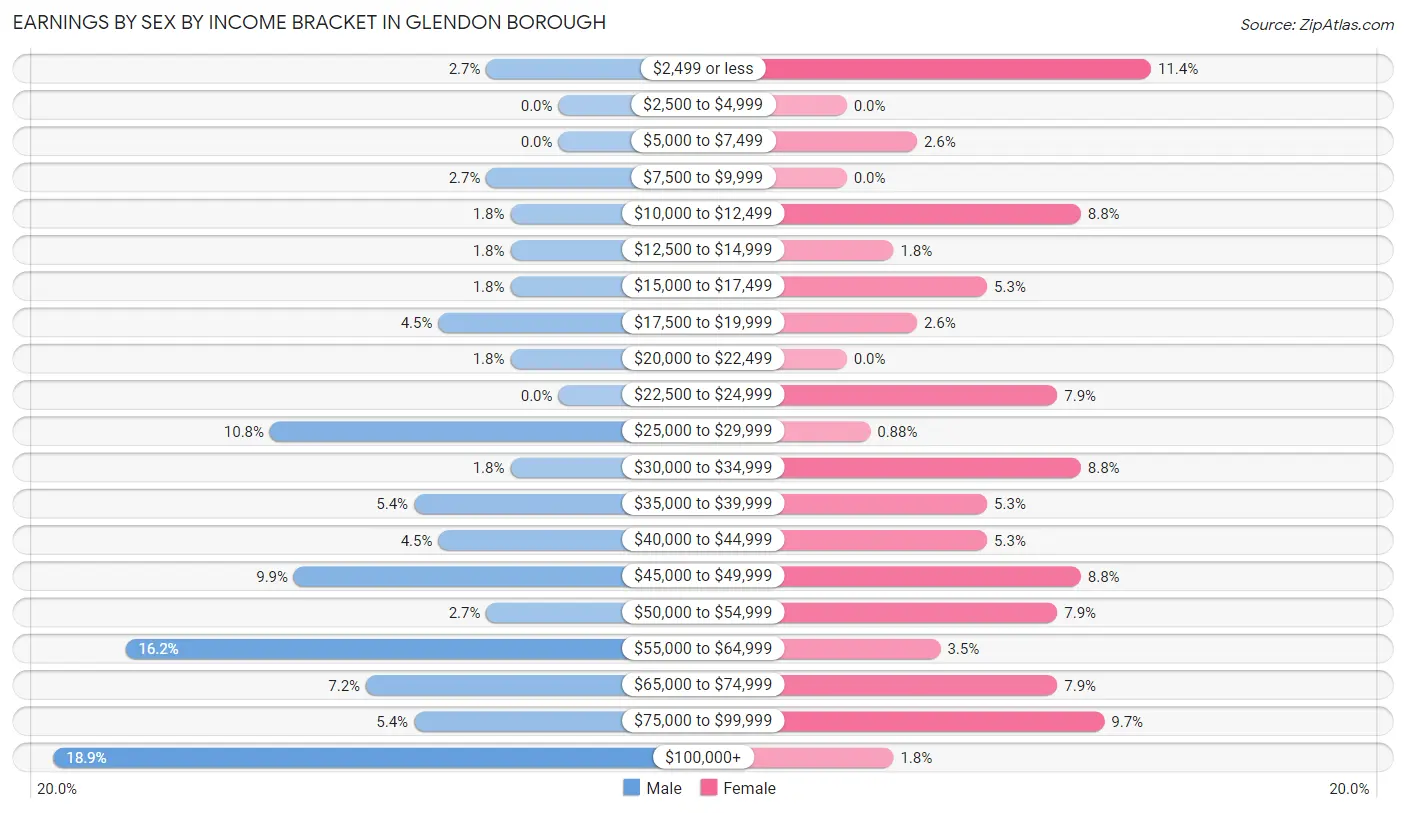
Earnings by Sex by Income Bracket in Glendon borough
The most common earnings brackets in Glendon borough are $100,000+ for men (21 | 18.9%) and $2,499 or less for women (13 | 11.4%).
| Income | Male | Female |
| $2,499 or less | 3 (2.7%) | 13 (11.4%) |
| $2,500 to $4,999 | 0 (0.0%) | 0 (0.0%) |
| $5,000 to $7,499 | 0 (0.0%) | 3 (2.6%) |
| $7,500 to $9,999 | 3 (2.7%) | 0 (0.0%) |
| $10,000 to $12,499 | 2 (1.8%) | 10 (8.8%) |
| $12,500 to $14,999 | 2 (1.8%) | 2 (1.8%) |
| $15,000 to $17,499 | 2 (1.8%) | 6 (5.3%) |
| $17,500 to $19,999 | 5 (4.5%) | 3 (2.6%) |
| $20,000 to $22,499 | 2 (1.8%) | 0 (0.0%) |
| $22,500 to $24,999 | 0 (0.0%) | 9 (7.9%) |
| $25,000 to $29,999 | 12 (10.8%) | 1 (0.9%) |
| $30,000 to $34,999 | 2 (1.8%) | 10 (8.8%) |
| $35,000 to $39,999 | 6 (5.4%) | 6 (5.3%) |
| $40,000 to $44,999 | 5 (4.5%) | 6 (5.3%) |
| $45,000 to $49,999 | 11 (9.9%) | 10 (8.8%) |
| $50,000 to $54,999 | 3 (2.7%) | 9 (7.9%) |
| $55,000 to $64,999 | 18 (16.2%) | 4 (3.5%) |
| $65,000 to $74,999 | 8 (7.2%) | 9 (7.9%) |
| $75,000 to $99,999 | 6 (5.4%) | 11 (9.7%) |
| $100,000+ | 21 (18.9%) | 2 (1.8%) |
| Total | 111 (100.0%) | 114 (100.0%) |
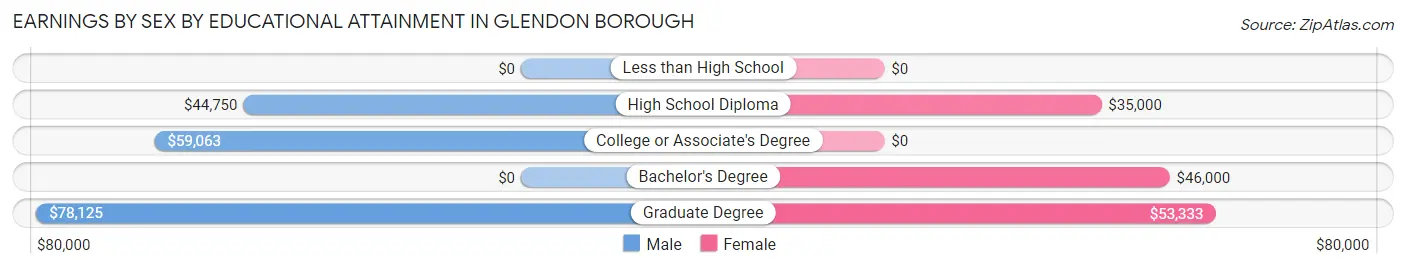
Earnings by Sex by Educational Attainment in Glendon borough
Average earnings in Glendon borough are $52,083 for men and $39,750 for women, a difference of 23.7%. Men with an educational attainment of graduate degree enjoy the highest average annual earnings of $78,125, while those with high school diploma education earn the least with $44,750. Women with an educational attainment of graduate degree earn the most with the average annual earnings of $53,333, while those with high school diploma education have the smallest earnings of $35,000.
| Educational Attainment | Male Income | Female Income |
| Less than High School | - | - |
| High School Diploma | $44,750 | $35,000 |
| College or Associate's Degree | $59,063 | $0 |
| Bachelor's Degree | - | - |
| Graduate Degree | $78,125 | $53,333 |
| Total | $52,083 | $39,750 |
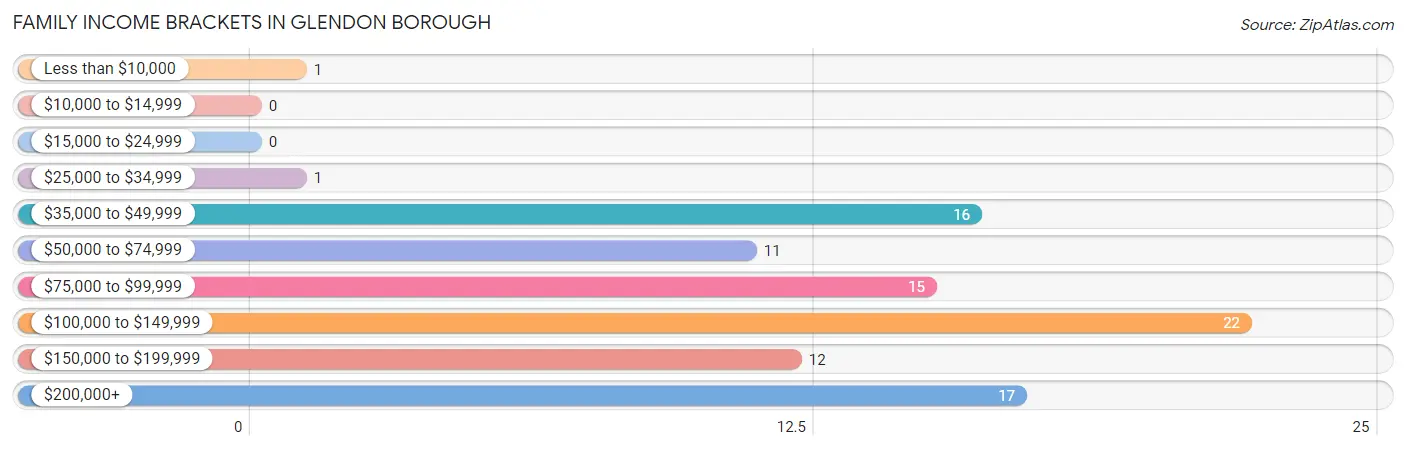
Family Income in Glendon borough
Family Income Brackets in Glendon borough
According to the Glendon borough family income data, there are 22 families falling into the $100,000 to $149,999 income range, which is the most common income bracket and makes up 23.2% of all families.
| Income Bracket | # Families | % Families |
| Less than $10,000 | 1 | 1.1% |
| $10,000 to $14,999 | 0 | 0.0% |
| $15,000 to $24,999 | 0 | 0.0% |
| $25,000 to $34,999 | 1 | 1.1% |
| $35,000 to $49,999 | 16 | 16.8% |
| $50,000 to $74,999 | 11 | 11.6% |
| $75,000 to $99,999 | 15 | 15.8% |
| $100,000 to $149,999 | 22 | 23.2% |
| $150,000 to $199,999 | 12 | 12.6% |
| $200,000+ | 17 | 17.9% |
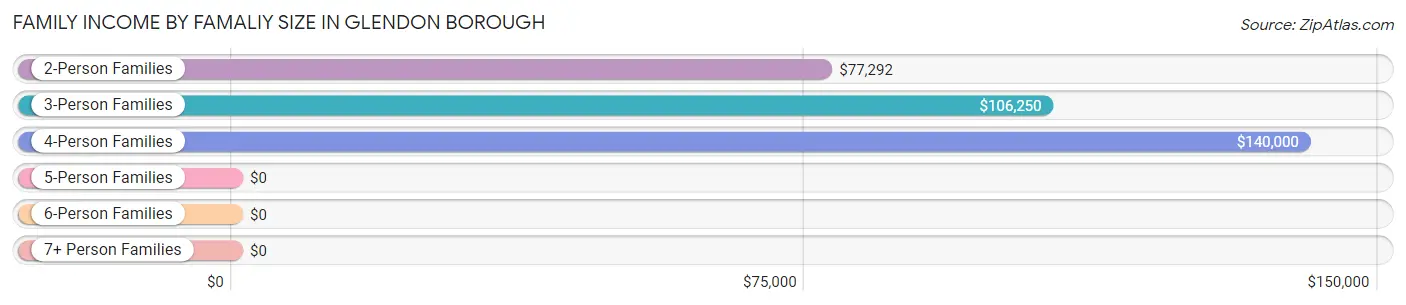
Family Income by Famaliy Size in Glendon borough
4-person families (16 | 16.8%) account for the highest median family income in Glendon borough with $140,000 per family, while 2-person families (41 | 43.2%) have the highest median income of $38,646 per family member.
| Income Bracket | # Families | Median Income |
| 2-Person Families | 41 (43.2%) | $77,292 |
| 3-Person Families | 30 (31.6%) | $106,250 |
| 4-Person Families | 16 (16.8%) | $140,000 |
| 5-Person Families | 6 (6.3%) | $0 |
| 6-Person Families | 2 (2.1%) | $0 |
| 7+ Person Families | 0 (0.0%) | $0 |
| Total | 95 (100.0%) | $105,208 |
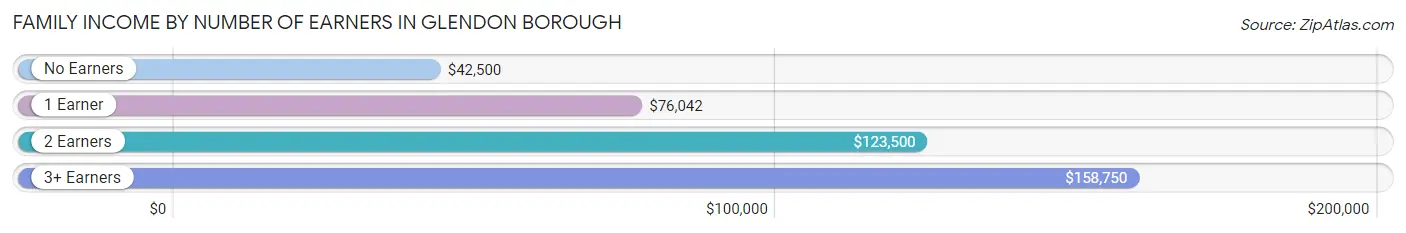
Family Income by Number of Earners in Glendon borough
The median family income in Glendon borough is $105,208, with families comprising 3+ earners (22) having the highest median family income of $158,750, while families with no earners (18) have the lowest median family income of $42,500, accounting for 23.2% and 19.0% of families, respectively.
| Number of Earners | # Families | Median Income |
| No Earners | 18 (19.0%) | $42,500 |
| 1 Earner | 21 (22.1%) | $76,042 |
| 2 Earners | 34 (35.8%) | $123,500 |
| 3+ Earners | 22 (23.2%) | $158,750 |
| Total | 95 (100.0%) | $105,208 |
Household Income in Glendon borough
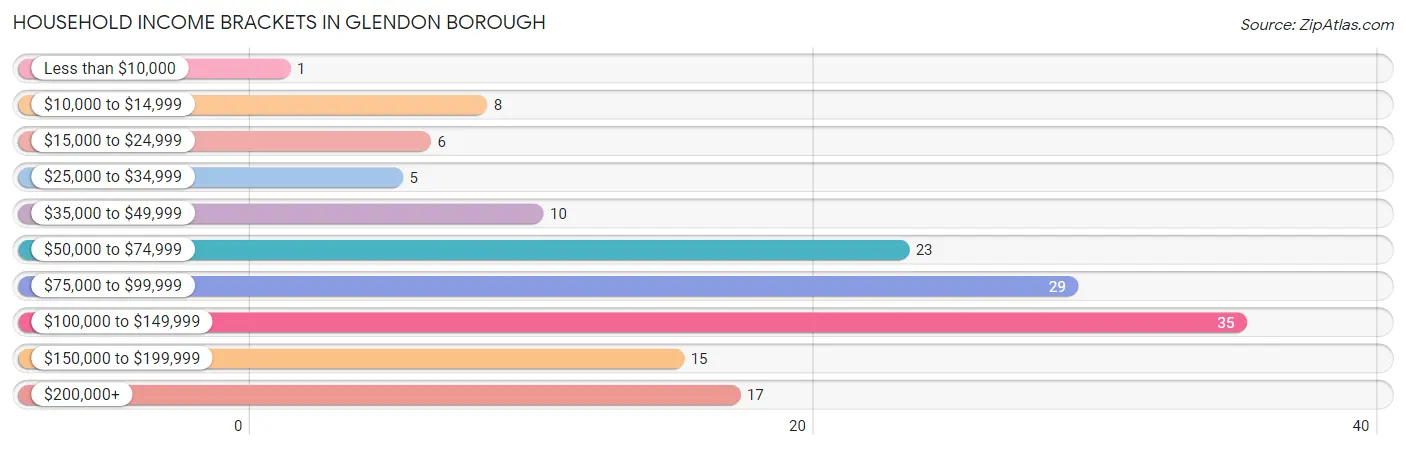
Household Income Brackets in Glendon borough
With 35 households falling in the category, the $100,000 to $149,999 income range is the most frequent in Glendon borough, accounting for 23.5% of all households. In contrast, only 1 households (0.7%) fall into the less than $10,000 income bracket, making it the least populous group.
| Income Bracket | # Households | % Households |
| Less than $10,000 | 1 | 0.7% |
| $10,000 to $14,999 | 8 | 5.4% |
| $15,000 to $24,999 | 6 | 4.0% |
| $25,000 to $34,999 | 5 | 3.4% |
| $35,000 to $49,999 | 10 | 6.7% |
| $50,000 to $74,999 | 23 | 15.4% |
| $75,000 to $99,999 | 29 | 19.5% |
| $100,000 to $149,999 | 35 | 23.5% |
| $150,000 to $199,999 | 15 | 10.1% |
| $200,000+ | 17 | 11.4% |
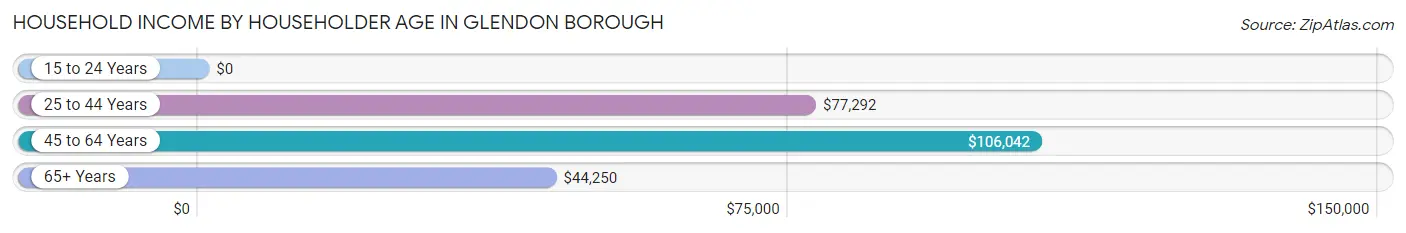
Household Income by Householder Age in Glendon borough
The median household income in Glendon borough is $91,250, with the highest median household income of $106,042 found in the 45 to 64 years age bracket for the primary householder. A total of 65 households (43.6%) fall into this category. Meanwhile, the 15 to 24 years age bracket for the primary householder has the lowest median household income of $0, with 2 households (1.3%) in this group.
| Income Bracket | # Households | Median Income |
| 15 to 24 Years | 2 (1.3%) | $0 |
| 25 to 44 Years | 41 (27.5%) | $77,292 |
| 45 to 64 Years | 65 (43.6%) | $106,042 |
| 65+ Years | 41 (27.5%) | $44,250 |
| Total | 149 (100.0%) | $91,250 |
Poverty in Glendon borough
Income Below Poverty by Sex and Age in Glendon borough
With 9.5% poverty level for males and 7.8% for females among the residents of Glendon borough, 65 to 74 year old males and 16 and 17 year old females are the most vulnerable to poverty, with 7 males (22.6%) and 2 females (100.0%) in their respective age groups living below the poverty level.
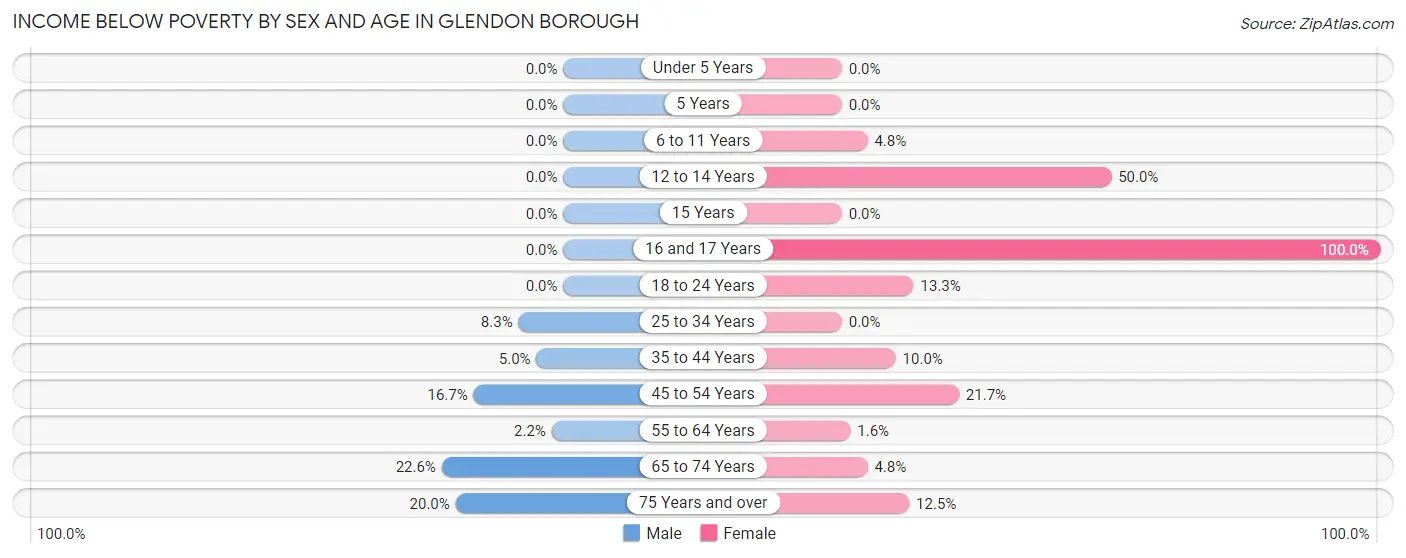
| Age Bracket | Male | Female |
| Under 5 Years | 0 (0.0%) | 0 (0.0%) |
| 5 Years | 0 (0.0%) | 0 (0.0%) |
| 6 to 11 Years | 0 (0.0%) | 1 (4.8%) |
| 12 to 14 Years | 0 (0.0%) | 1 (50.0%) |
| 15 Years | 0 (0.0%) | 0 (0.0%) |
| 16 and 17 Years | 0 (0.0%) | 2 (100.0%) |
| 18 to 24 Years | 0 (0.0%) | 2 (13.3%) |
| 25 to 34 Years | 2 (8.3%) | 0 (0.0%) |
| 35 to 44 Years | 1 (5.0%) | 2 (10.0%) |
| 45 to 54 Years | 2 (16.7%) | 5 (21.7%) |
| 55 to 64 Years | 1 (2.2%) | 1 (1.6%) |
| 65 to 74 Years | 7 (22.6%) | 1 (4.8%) |
| 75 Years and over | 4 (20.0%) | 1 (12.5%) |
| Total | 17 (9.5%) | 16 (7.8%) |
Income Above Poverty by Sex and Age in Glendon borough
According to the poverty statistics in Glendon borough, males aged under 5 years and females aged 15 years are the age groups that are most secure financially, with 100.0% of males and 100.0% of females in these age groups living above the poverty line.
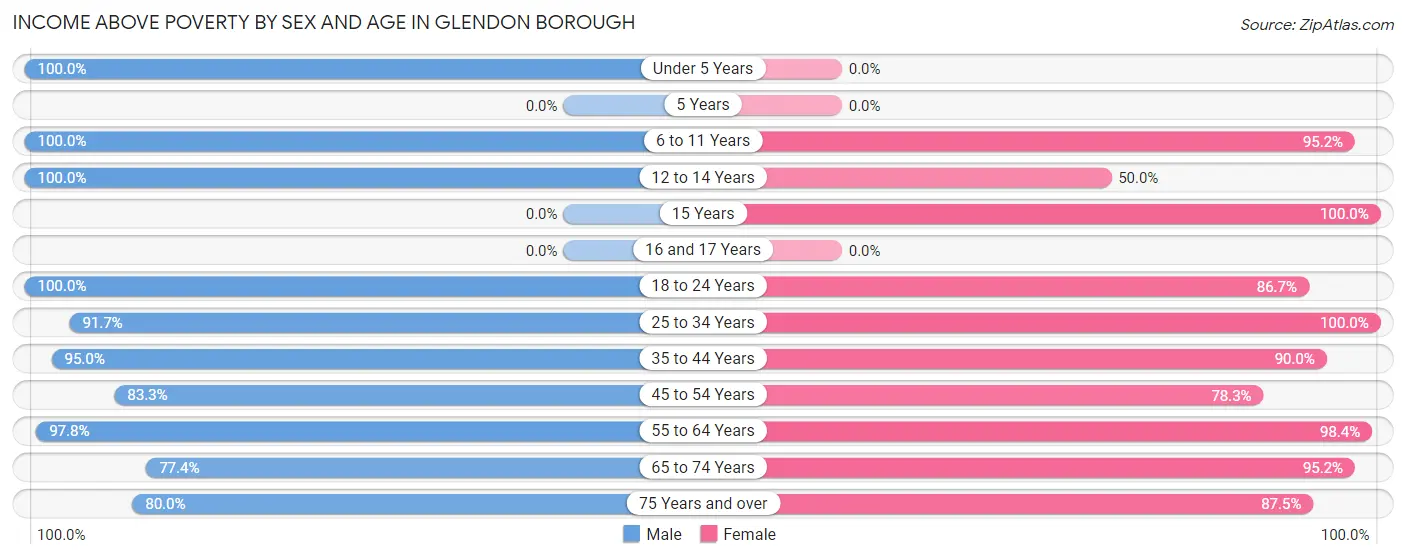
| Age Bracket | Male | Female |
| Under 5 Years | 2 (100.0%) | 0 (0.0%) |
| 5 Years | 0 (0.0%) | 0 (0.0%) |
| 6 to 11 Years | 10 (100.0%) | 20 (95.2%) |
| 12 to 14 Years | 2 (100.0%) | 1 (50.0%) |
| 15 Years | 0 (0.0%) | 4 (100.0%) |
| 16 and 17 Years | 0 (0.0%) | 0 (0.0%) |
| 18 to 24 Years | 12 (100.0%) | 13 (86.7%) |
| 25 to 34 Years | 22 (91.7%) | 26 (100.0%) |
| 35 to 44 Years | 19 (95.0%) | 18 (90.0%) |
| 45 to 54 Years | 10 (83.3%) | 18 (78.3%) |
| 55 to 64 Years | 45 (97.8%) | 62 (98.4%) |
| 65 to 74 Years | 24 (77.4%) | 20 (95.2%) |
| 75 Years and over | 16 (80.0%) | 7 (87.5%) |
| Total | 162 (90.5%) | 189 (92.2%) |
Income Below Poverty Among Married-Couple Families in Glendon borough
The poverty statistics for married-couple families in Glendon borough show that 2.9% or 2 of the total 70 families live below the poverty line. Families with 3 or 4 children have the highest poverty rate of 50.0%, comprising of 1 families. On the other hand, families with 1 or 2 children have the lowest poverty rate of 0.0%, which includes 0 families.
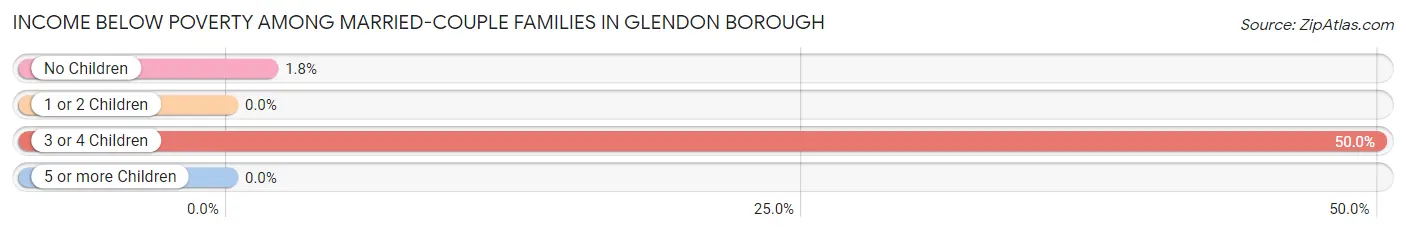
| Children | Above Poverty | Below Poverty |
| No Children | 56 (98.3%) | 1 (1.8%) |
| 1 or 2 Children | 11 (100.0%) | 0 (0.0%) |
| 3 or 4 Children | 1 (50.0%) | 1 (50.0%) |
| 5 or more Children | 0 (0.0%) | 0 (0.0%) |
| Total | 68 (97.1%) | 2 (2.9%) |
Income Below Poverty Among Single-Parent Households in Glendon borough
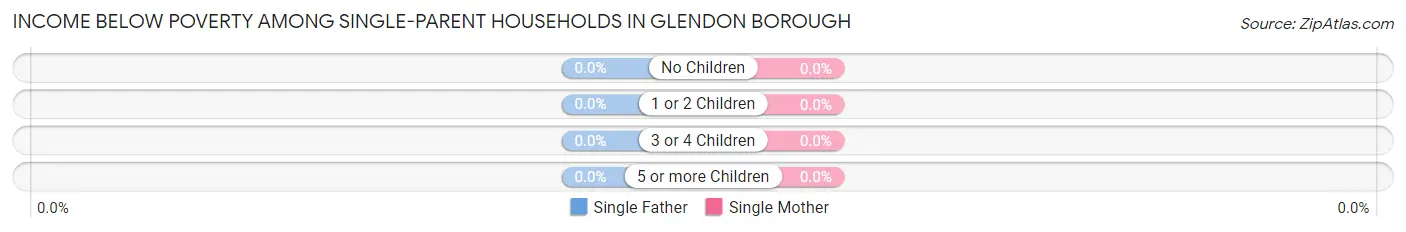
| Children | Single Father | Single Mother |
| No Children | 0 (0.0%) | 0 (0.0%) |
| 1 or 2 Children | 0 (0.0%) | 0 (0.0%) |
| 3 or 4 Children | 0 (0.0%) | 0 (0.0%) |
| 5 or more Children | 0 (0.0%) | 0 (0.0%) |
| Total | 0 (0.0%) | 0 (0.0%) |
Income Below Poverty Among Married-Couple vs Single-Parent Households in Glendon borough
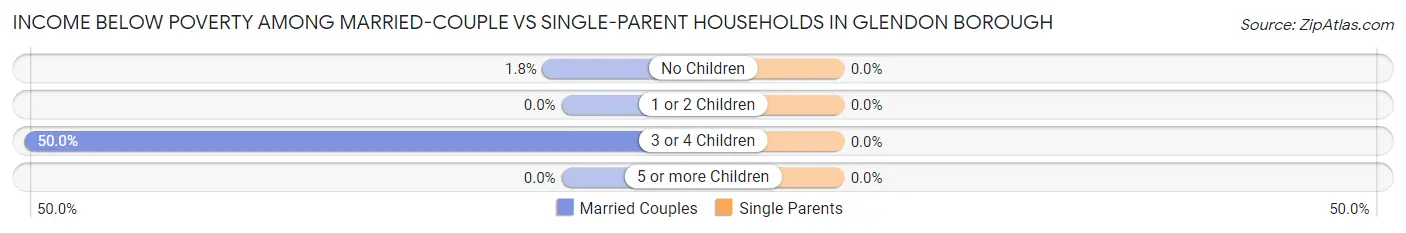
| Children | Married-Couple Families | Single-Parent Households |
| No Children | 1 (1.8%) | 0 (0.0%) |
| 1 or 2 Children | 0 (0.0%) | 0 (0.0%) |
| 3 or 4 Children | 1 (50.0%) | 0 (0.0%) |
| 5 or more Children | 0 (0.0%) | 0 (0.0%) |
| Total | 2 (2.9%) | 0 (0.0%) |
Race in Glendon borough
The most populous races in Glendon borough are White / Caucasian (303 | 78.9%), Black / African American (56 | 14.6%), and Two or more Races (22 | 5.7%).
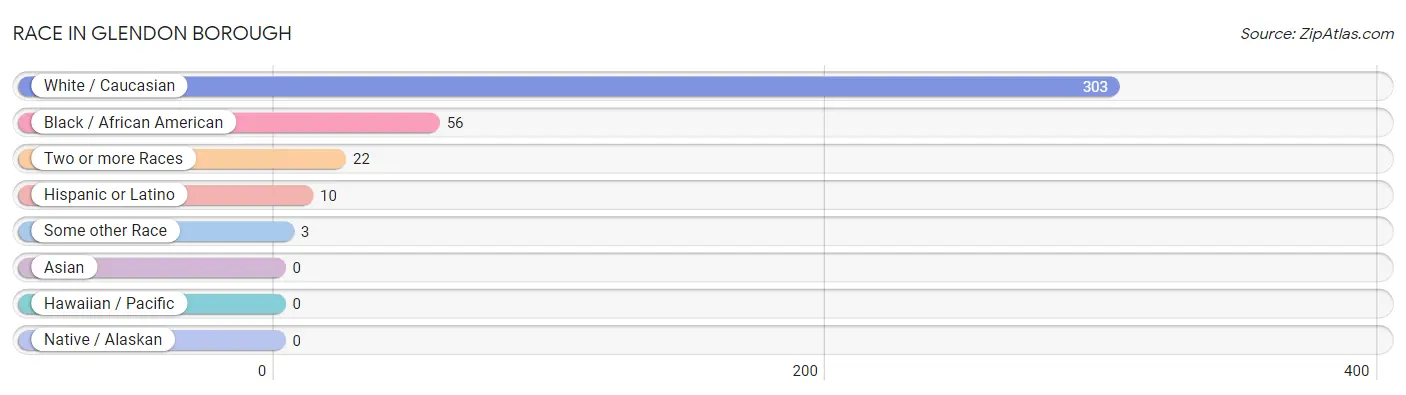
| Race | # Population | % Population |
| Asian | 0 | 0.0% |
| Black / African American | 56 | 14.6% |
| Hawaiian / Pacific | 0 | 0.0% |
| Hispanic or Latino | 10 | 2.6% |
| Native / Alaskan | 0 | 0.0% |
| White / Caucasian | 303 | 78.9% |
| Two or more Races | 22 | 5.7% |
| Some other Race | 3 | 0.8% |
| Total | 384 | 100.0% |
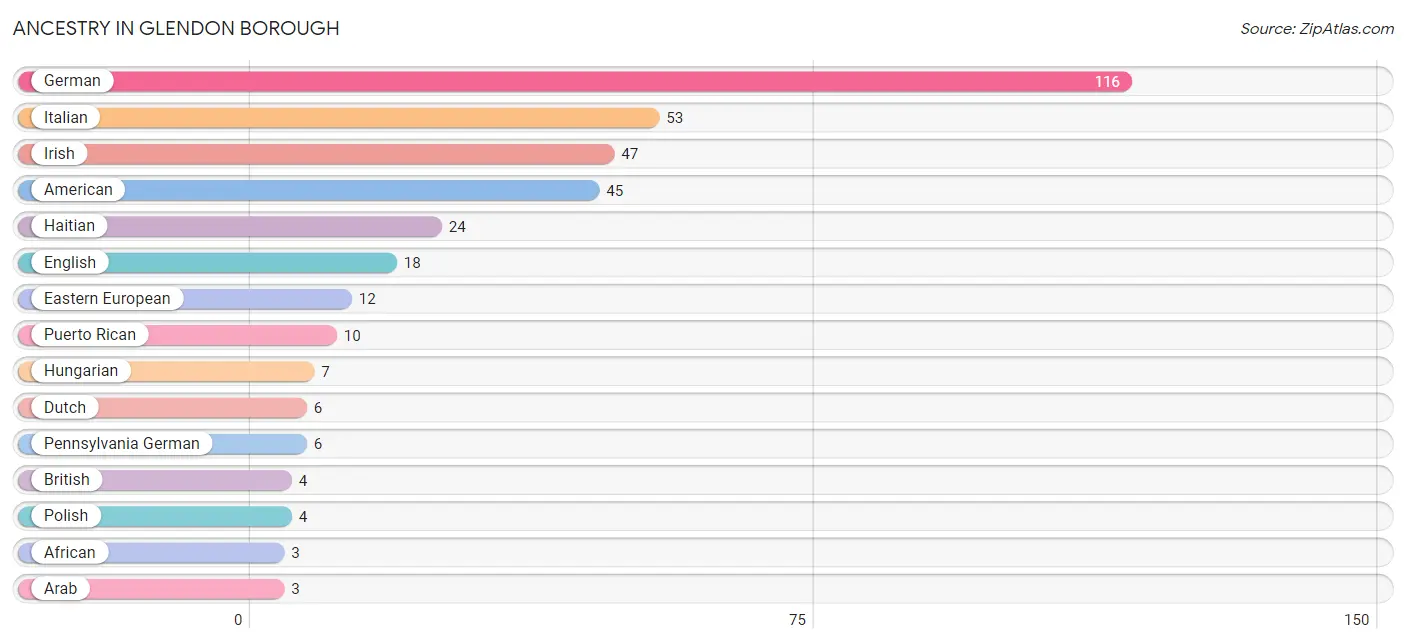
Ancestry in Glendon borough
The most populous ancestries reported in Glendon borough are German (116 | 30.2%), Italian (53 | 13.8%), Irish (47 | 12.2%), American (45 | 11.7%), and Haitian (24 | 6.2%), together accounting for 74.2% of all Glendon borough residents.
| Ancestry | # Population | % Population |
| African | 3 | 0.8% |
| American | 45 | 11.7% |
| Arab | 3 | 0.8% |
| British | 4 | 1.0% |
| Cherokee | 2 | 0.5% |
| Dutch | 6 | 1.6% |
| Eastern European | 12 | 3.1% |
| English | 18 | 4.7% |
| French | 1 | 0.3% |
| French Canadian | 1 | 0.3% |
| German | 116 | 30.2% |
| Haitian | 24 | 6.2% |
| Hungarian | 7 | 1.8% |
| Irish | 47 | 12.2% |
| Italian | 53 | 13.8% |
| Lebanese | 3 | 0.8% |
| Pennsylvania German | 6 | 1.6% |
| Polish | 4 | 1.0% |
| Puerto Rican | 10 | 2.6% |
| Russian | 2 | 0.5% |
| Scottish | 1 | 0.3% |
| Slovak | 2 | 0.5% |
| Subsaharan African | 3 | 0.8% |
| Ukrainian | 2 | 0.5% |
| Welsh | 3 | 0.8% | View All 25 Rows |
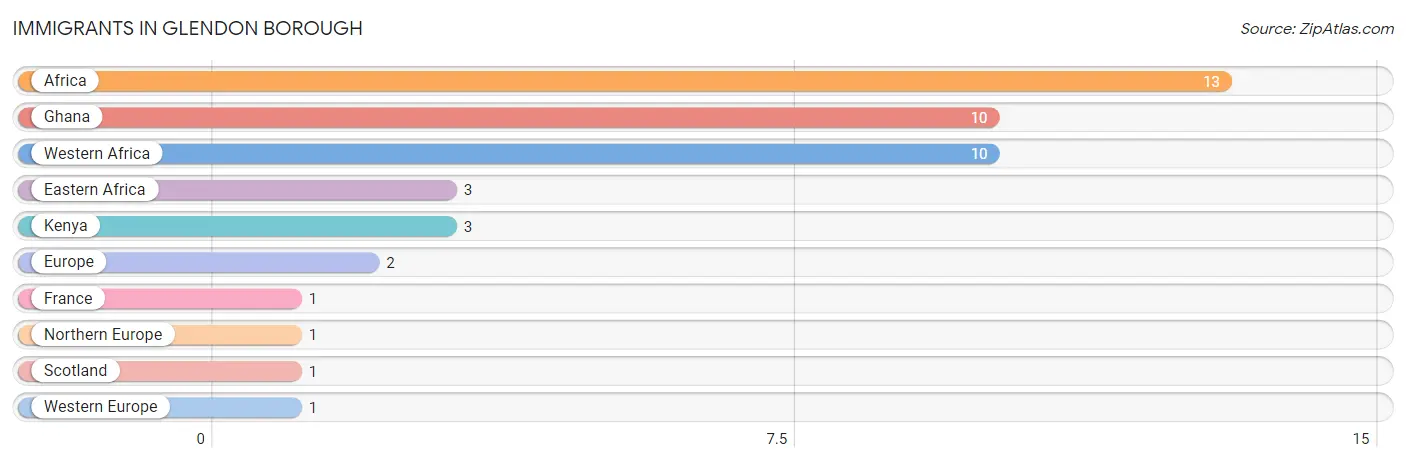
Immigrants in Glendon borough
The most numerous immigrant groups reported in Glendon borough came from Africa (13 | 3.4%), Ghana (10 | 2.6%), Western Africa (10 | 2.6%), Eastern Africa (3 | 0.8%), and Kenya (3 | 0.8%), together accounting for 10.1% of all Glendon borough residents.
| Immigration Origin | # Population | % Population |
| Africa | 13 | 3.4% |
| Eastern Africa | 3 | 0.8% |
| Europe | 2 | 0.5% |
| France | 1 | 0.3% |
| Ghana | 10 | 2.6% |
| Kenya | 3 | 0.8% |
| Northern Europe | 1 | 0.3% |
| Scotland | 1 | 0.3% |
| Western Africa | 10 | 2.6% |
| Western Europe | 1 | 0.3% | View All 10 Rows |
Sex and Age in Glendon borough
Sex and Age in Glendon borough
The most populous age groups in Glendon borough are 55 to 59 Years (33 | 18.4%) for men and 60 to 64 Years (32 | 15.6%) for women.
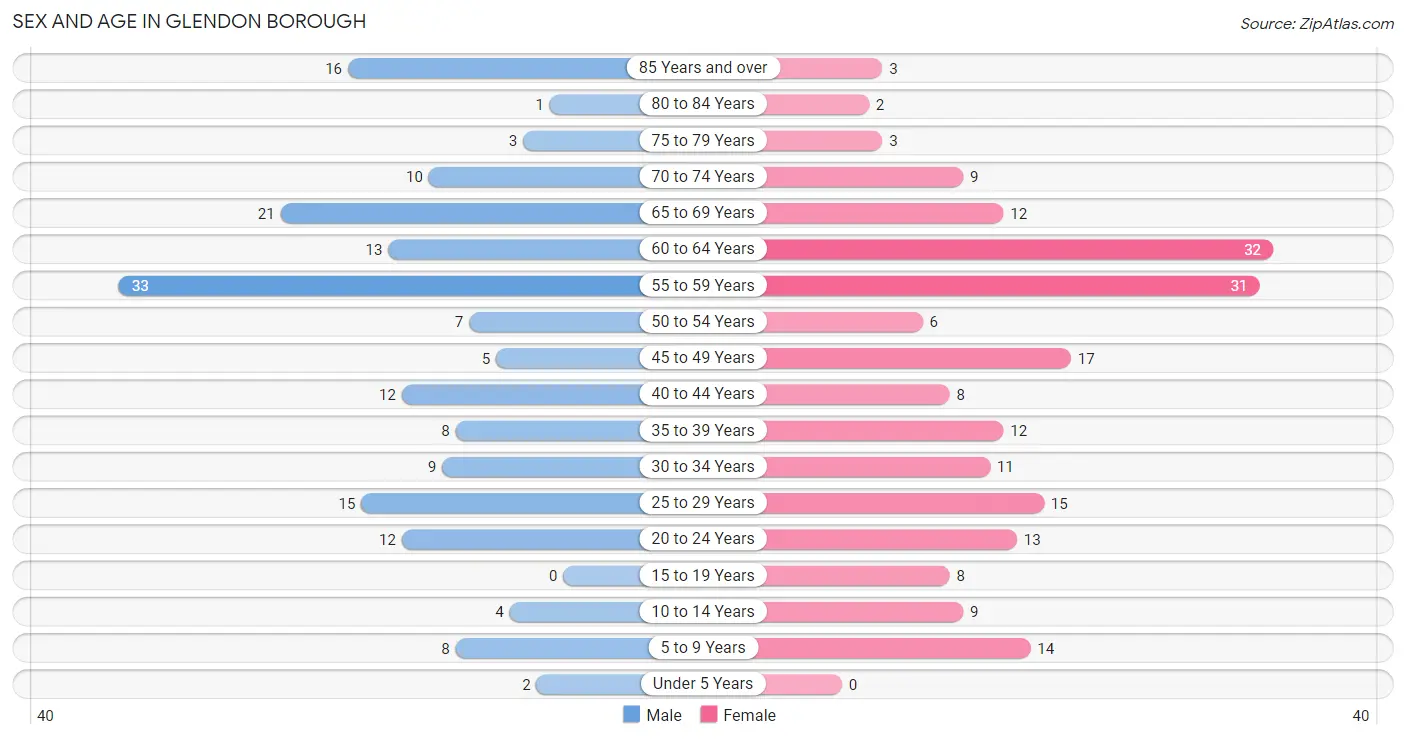
| Age Bracket | Male | Female |
| Under 5 Years | 2 (1.1%) | 0 (0.0%) |
| 5 to 9 Years | 8 (4.5%) | 14 (6.8%) |
| 10 to 14 Years | 4 (2.2%) | 9 (4.4%) |
| 15 to 19 Years | 0 (0.0%) | 8 (3.9%) |
| 20 to 24 Years | 12 (6.7%) | 13 (6.3%) |
| 25 to 29 Years | 15 (8.4%) | 15 (7.3%) |
| 30 to 34 Years | 9 (5.0%) | 11 (5.4%) |
| 35 to 39 Years | 8 (4.5%) | 12 (5.9%) |
| 40 to 44 Years | 12 (6.7%) | 8 (3.9%) |
| 45 to 49 Years | 5 (2.8%) | 17 (8.3%) |
| 50 to 54 Years | 7 (3.9%) | 6 (2.9%) |
| 55 to 59 Years | 33 (18.4%) | 31 (15.1%) |
| 60 to 64 Years | 13 (7.3%) | 32 (15.6%) |
| 65 to 69 Years | 21 (11.7%) | 12 (5.9%) |
| 70 to 74 Years | 10 (5.6%) | 9 (4.4%) |
| 75 to 79 Years | 3 (1.7%) | 3 (1.5%) |
| 80 to 84 Years | 1 (0.6%) | 2 (1.0%) |
| 85 Years and over | 16 (8.9%) | 3 (1.5%) |
| Total | 179 (100.0%) | 205 (100.0%) |
Families and Households in Glendon borough
Median Family Size in Glendon borough
The median family size in Glendon borough is 2.93 persons per family, with single female/mother families (19 | 20.0%) accounting for the largest median family size of 3.42 persons per family. On the other hand, single male/father families (6 | 6.3%) represent the smallest median family size with 2.17 persons per family.
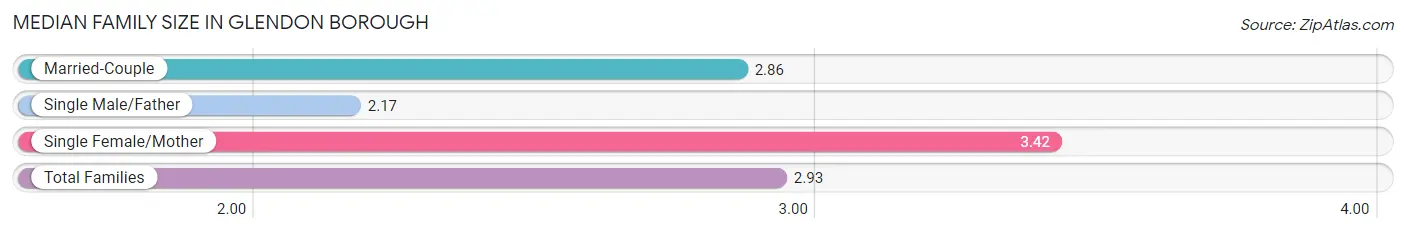
| Family Type | # Families | Family Size |
| Married-Couple | 70 (73.7%) | 2.86 |
| Single Male/Father | 6 (6.3%) | 2.17 |
| Single Female/Mother | 19 (20.0%) | 3.42 |
| Total Families | 95 (100.0%) | 2.93 |
Median Household Size in Glendon borough
The median household size in Glendon borough is 2.58 persons per household, with single female/mother households (19 | 12.8%) accounting for the largest median household size of 3.74 persons per household. non-family households (54 | 36.2%) represent the smallest median household size with 1.54 persons per household.
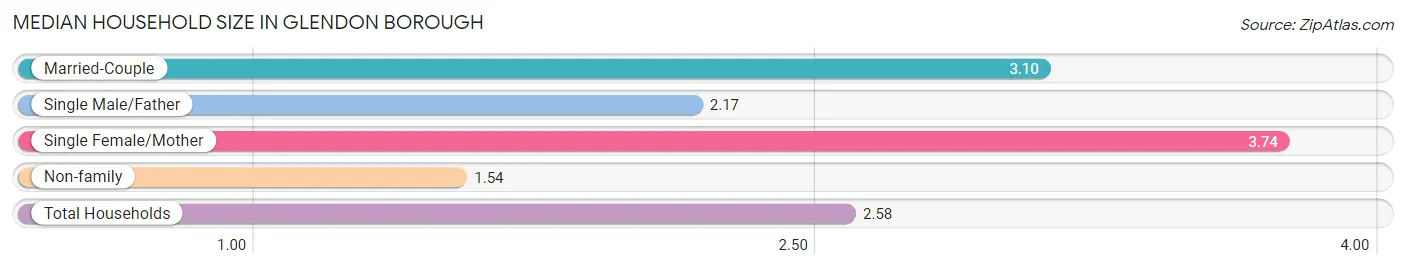
| Household Type | # Households | Household Size |
| Married-Couple | 70 (47.0%) | 3.10 |
| Single Male/Father | 6 (4.0%) | 2.17 |
| Single Female/Mother | 19 (12.8%) | 3.74 |
| Non-family | 54 (36.2%) | 1.54 |
| Total Households | 149 (100.0%) | 2.58 |
Household Size by Marriage Status in Glendon borough
Out of a total of 149 households in Glendon borough, 95 (63.8%) are family households, while 54 (36.2%) are nonfamily households. The most numerous type of family households are 2-person households, comprising 41, and the most common type of nonfamily households are 1-person households, comprising 33.
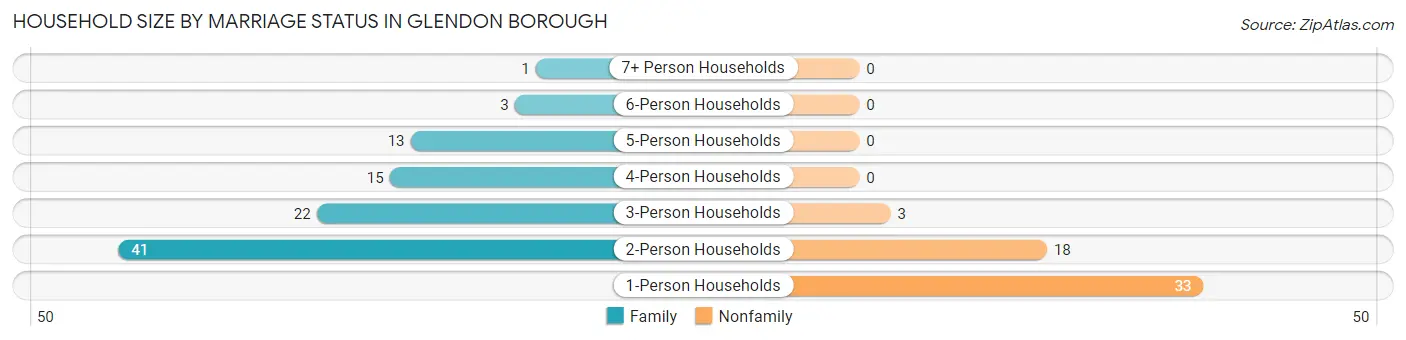
| Household Size | Family Households | Nonfamily Households |
| 1-Person Households | - | 33 (22.2%) |
| 2-Person Households | 41 (27.5%) | 18 (12.1%) |
| 3-Person Households | 22 (14.8%) | 3 (2.0%) |
| 4-Person Households | 15 (10.1%) | 0 (0.0%) |
| 5-Person Households | 13 (8.7%) | 0 (0.0%) |
| 6-Person Households | 3 (2.0%) | 0 (0.0%) |
| 7+ Person Households | 1 (0.7%) | 0 (0.0%) |
| Total | 95 (63.8%) | 54 (36.2%) |
Female Fertility in Glendon borough
Fertility by Age in Glendon borough
Average fertility rate in Glendon borough is 24.0 births per 1,000 women. Women in the age bracket of 20 to 34 years have the highest fertility rate with 51.0 births per 1,000 women. Women in the age bracket of 20 to 34 years acount for 100.0% of all women with births.
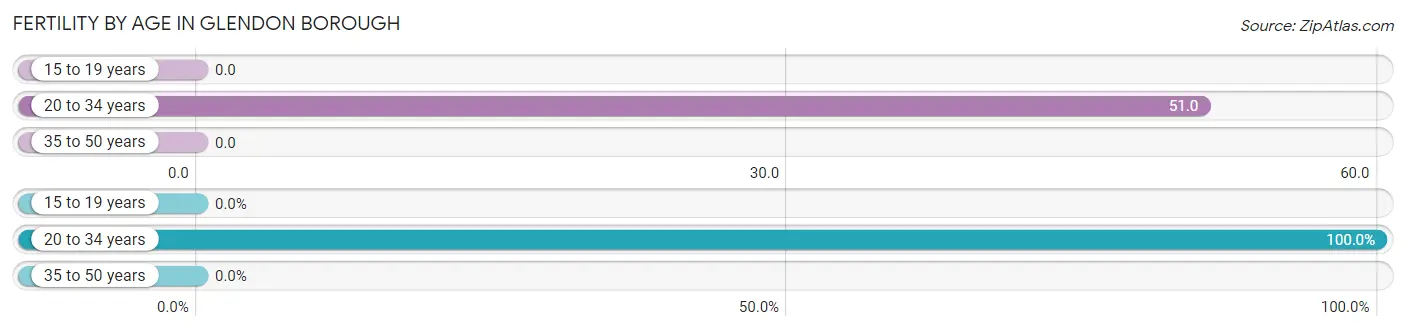
| Age Bracket | Women with Births | Births / 1,000 Women |
| 15 to 19 years | 0 (0.0%) | 0.0 |
| 20 to 34 years | 2 (100.0%) | 51.0 |
| 35 to 50 years | 0 (0.0%) | 0.0 |
| Total | 2 (100.0%) | 24.0 |
Fertility by Age by Marriage Status in Glendon borough
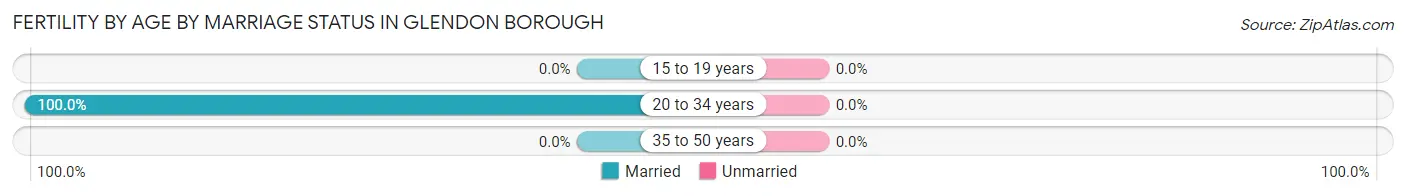
| Age Bracket | Married | Unmarried |
| 15 to 19 years | 0 (0.0%) | 0 (0.0%) |
| 20 to 34 years | 2 (100.0%) | 0 (0.0%) |
| 35 to 50 years | 0 (0.0%) | 0 (0.0%) |
| Total | 2 (100.0%) | 0 (0.0%) |
Fertility by Education in Glendon borough
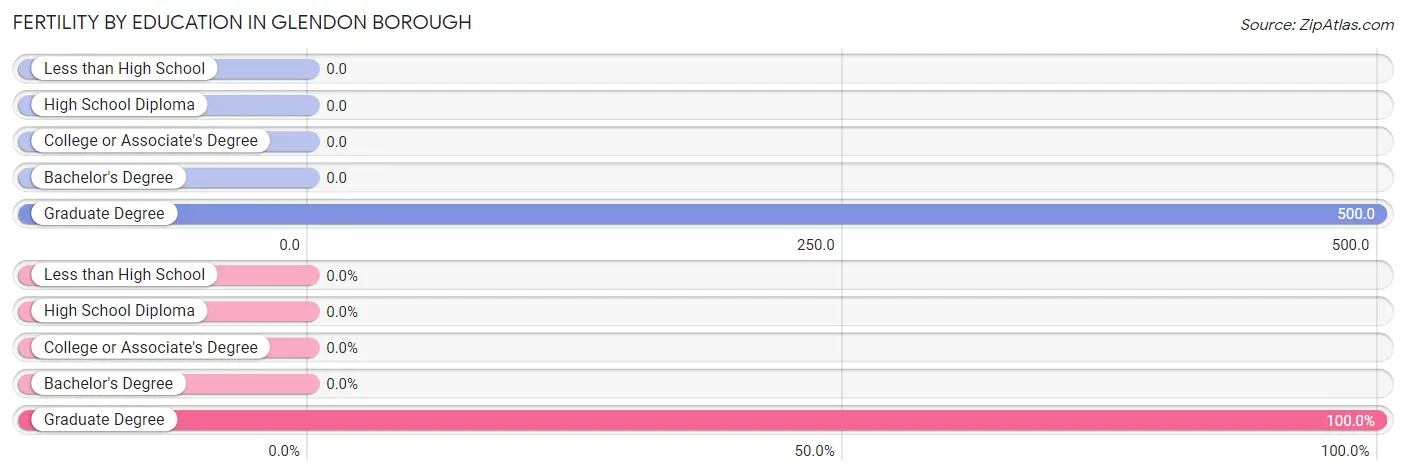
| Educational Attainment | Women with Births | Births / 1,000 Women |
| Less than High School | 0 (0.0%) | 0.0 |
| High School Diploma | 0 (0.0%) | 0.0 |
| College or Associate's Degree | 0 (0.0%) | 0.0 |
| Bachelor's Degree | 0 (0.0%) | 0.0 |
| Graduate Degree | 2 (100.0%) | 500.0 |
| Total | 2 (100.0%) | 24.0 |
Fertility by Education by Marriage Status in Glendon borough
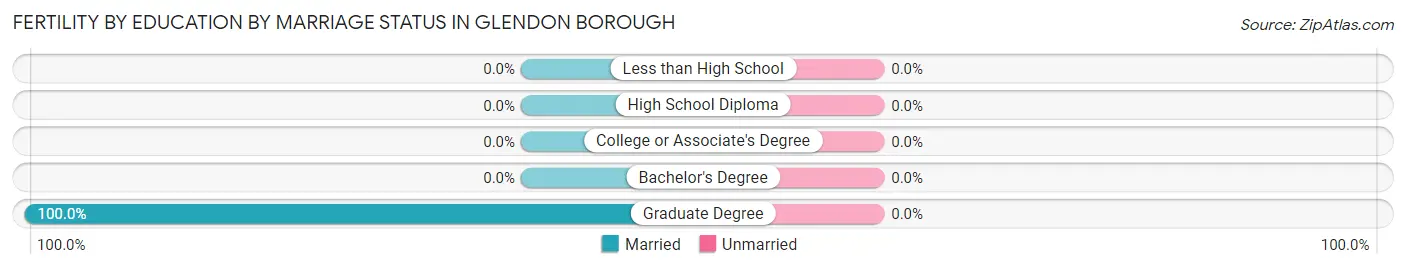
| Educational Attainment | Married | Unmarried |
| Less than High School | 0 (0.0%) | 0 (0.0%) |
| High School Diploma | 0 (0.0%) | 0 (0.0%) |
| College or Associate's Degree | 0 (0.0%) | 0 (0.0%) |
| Bachelor's Degree | 0 (0.0%) | 0 (0.0%) |
| Graduate Degree | 2 (100.0%) | 0 (0.0%) |
| Total | 2 (100.0%) | 0 (0.0%) |
Employment Characteristics in Glendon borough
Employment by Class of Employer in Glendon borough
Among the 207 employed individuals in Glendon borough, private company employees (168 | 81.2%), local government employees (11 | 5.3%), and self-employed (incorporated) (7 | 3.4%) make up the most common classes of employment.
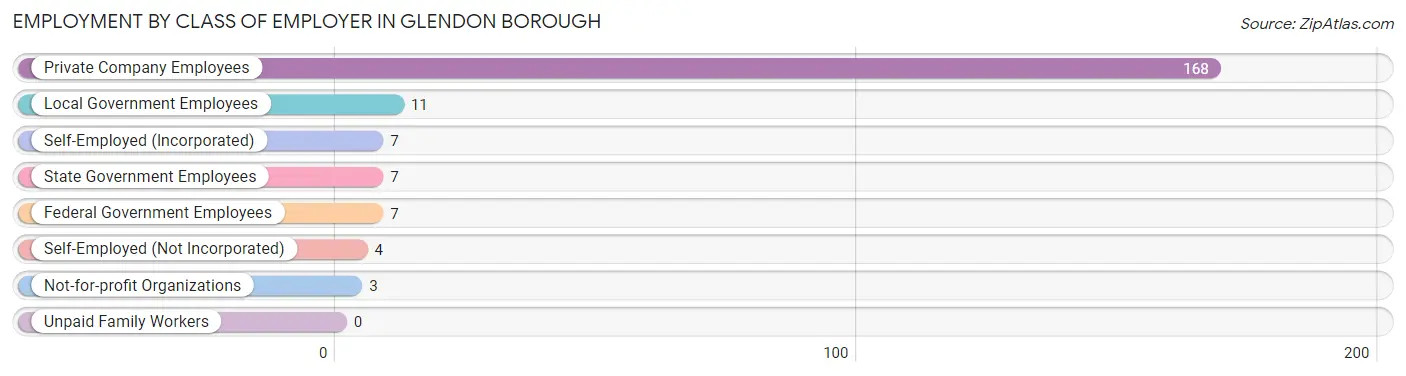
| Employer Class | # Employees | % Employees |
| Private Company Employees | 168 | 81.2% |
| Self-Employed (Incorporated) | 7 | 3.4% |
| Self-Employed (Not Incorporated) | 4 | 1.9% |
| Not-for-profit Organizations | 3 | 1.5% |
| Local Government Employees | 11 | 5.3% |
| State Government Employees | 7 | 3.4% |
| Federal Government Employees | 7 | 3.4% |
| Unpaid Family Workers | 0 | 0.0% |
| Total | 207 | 100.0% |
Employment Status by Age in Glendon borough
According to the labor force statistics for Glendon borough, out of the total population over 16 years of age (343), 63.8% or 219 individuals are in the labor force, with 5.5% or 12 of them unemployed. The age group with the highest labor force participation rate is 25 to 29 years, with 100.0% or 30 individuals in the labor force. Within the labor force, the 75 years and over age range has the highest percentage of unemployed individuals, with 50.0% or 2 of them being unemployed.
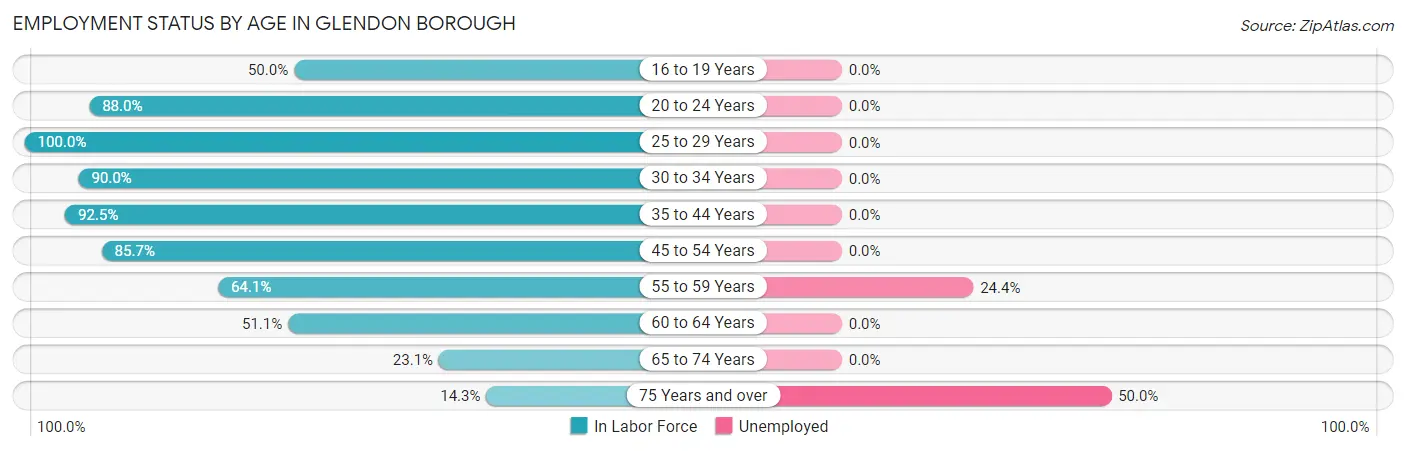
| Age Bracket | In Labor Force | Unemployed |
| 16 to 19 Years | 2 (50.0%) | 0 (0.0%) |
| 20 to 24 Years | 22 (88.0%) | 0 (0.0%) |
| 25 to 29 Years | 30 (100.0%) | 0 (0.0%) |
| 30 to 34 Years | 18 (90.0%) | 0 (0.0%) |
| 35 to 44 Years | 37 (92.5%) | 0 (0.0%) |
| 45 to 54 Years | 30 (85.7%) | 0 (0.0%) |
| 55 to 59 Years | 41 (64.1%) | 10 (24.4%) |
| 60 to 64 Years | 23 (51.1%) | 0 (0.0%) |
| 65 to 74 Years | 12 (23.1%) | 0 (0.0%) |
| 75 Years and over | 4 (14.3%) | 2 (50.0%) |
| Total | 219 (63.8%) | 12 (5.5%) |
Employment Status by Educational Attainment in Glendon borough
According to labor force statistics for Glendon borough, 76.5% of individuals (179) out of the total population between 25 and 64 years of age (234) are in the labor force, with 5.6% or 10 of them being unemployed. The group with the highest labor force participation rate are those with the educational attainment of college / associate degree, with 97.8% or 44 individuals in the labor force. Within the labor force, individuals with college / associate degree education have the highest percentage of unemployment, with 22.7% or 10 of them being unemployed.
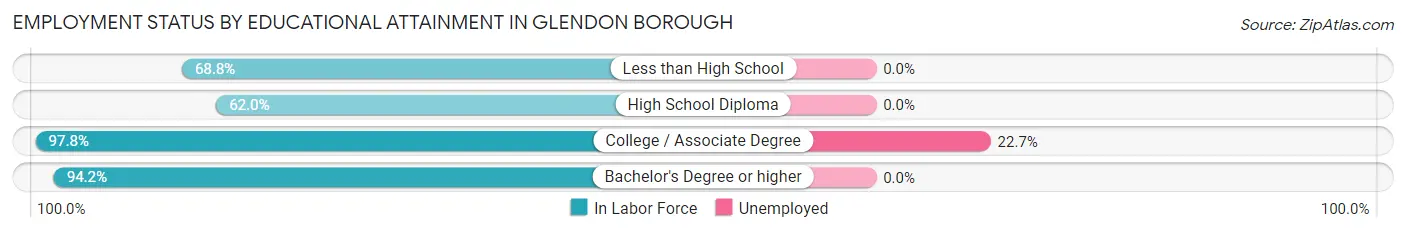
| Educational Attainment | In Labor Force | Unemployed |
| Less than High School | 11 (68.8%) | 0 (0.0%) |
| High School Diploma | 75 (62.0%) | 0 (0.0%) |
| College / Associate Degree | 44 (97.8%) | 10 (22.7%) |
| Bachelor's Degree or higher | 49 (94.2%) | 0 (0.0%) |
| Total | 179 (76.5%) | 13 (5.6%) |
Employment Occupations by Sex in Glendon borough
Management, Business, Science and Arts Occupations
The most common Management, Business, Science and Arts occupations in Glendon borough are Community & Social Service (18 | 8.7%), Management (16 | 7.7%), Education Instruction & Library (16 | 7.7%), Health Diagnosing & Treating (12 | 5.8%), and Computers, Engineering & Science (9 | 4.3%).
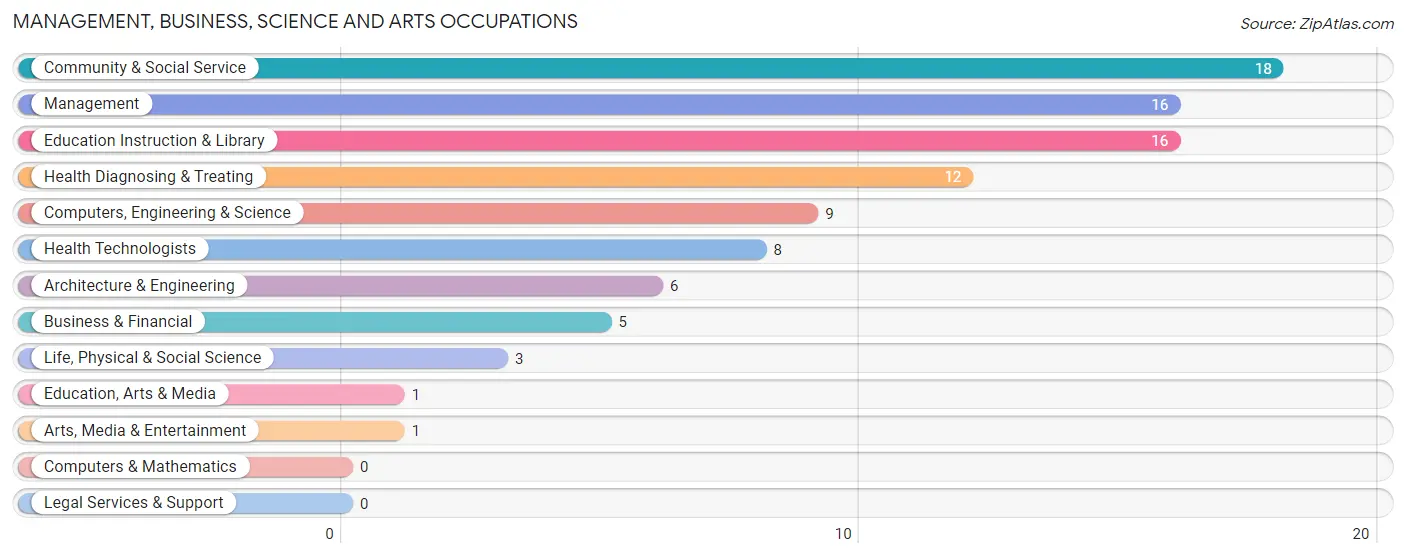
Management, Business, Science and Arts Occupations by Sex
Within the Management, Business, Science and Arts occupations in Glendon borough, the most male-oriented occupations are Life, Physical & Social Science (100.0%), Arts, Media & Entertainment (100.0%), and Computers, Engineering & Science (77.8%), while the most female-oriented occupations are Education, Arts & Media (100.0%), Health Technologists (100.0%), and Education Instruction & Library (87.5%).
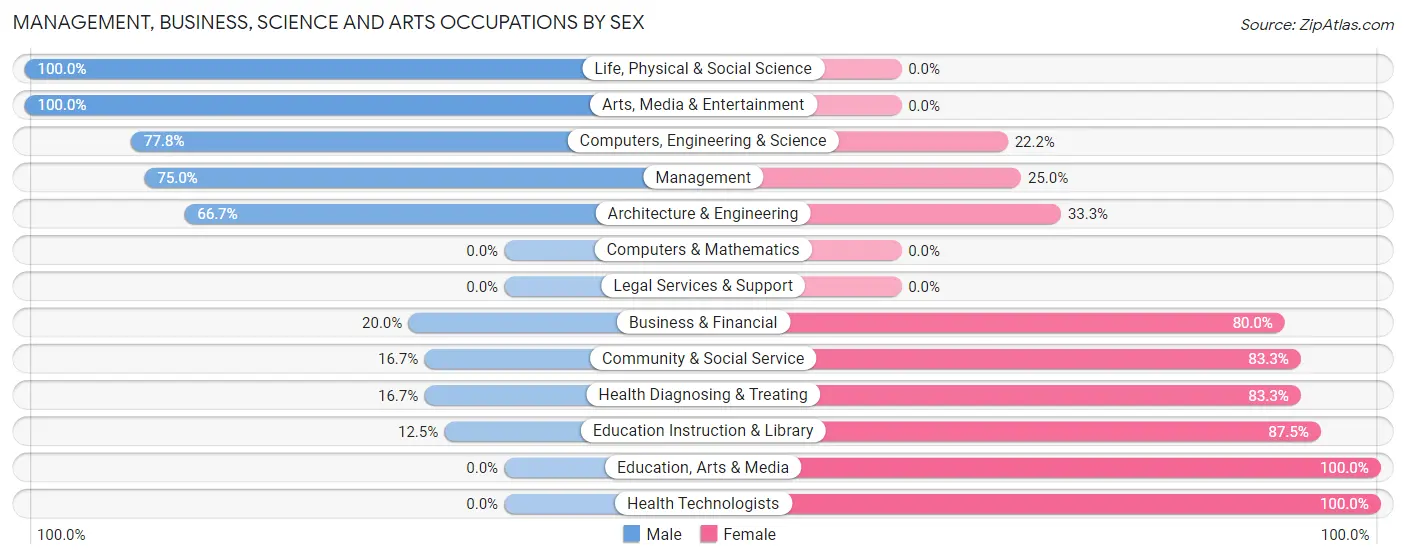
| Occupation | Male | Female |
| Management | 12 (75.0%) | 4 (25.0%) |
| Business & Financial | 1 (20.0%) | 4 (80.0%) |
| Computers, Engineering & Science | 7 (77.8%) | 2 (22.2%) |
| Computers & Mathematics | 0 (0.0%) | 0 (0.0%) |
| Architecture & Engineering | 4 (66.7%) | 2 (33.3%) |
| Life, Physical & Social Science | 3 (100.0%) | 0 (0.0%) |
| Community & Social Service | 3 (16.7%) | 15 (83.3%) |
| Education, Arts & Media | 0 (0.0%) | 1 (100.0%) |
| Legal Services & Support | 0 (0.0%) | 0 (0.0%) |
| Education Instruction & Library | 2 (12.5%) | 14 (87.5%) |
| Arts, Media & Entertainment | 1 (100.0%) | 0 (0.0%) |
| Health Diagnosing & Treating | 2 (16.7%) | 10 (83.3%) |
| Health Technologists | 0 (0.0%) | 8 (100.0%) |
| Total (Category) | 25 (41.7%) | 35 (58.3%) |
| Total (Overall) | 107 (51.7%) | 100 (48.3%) |
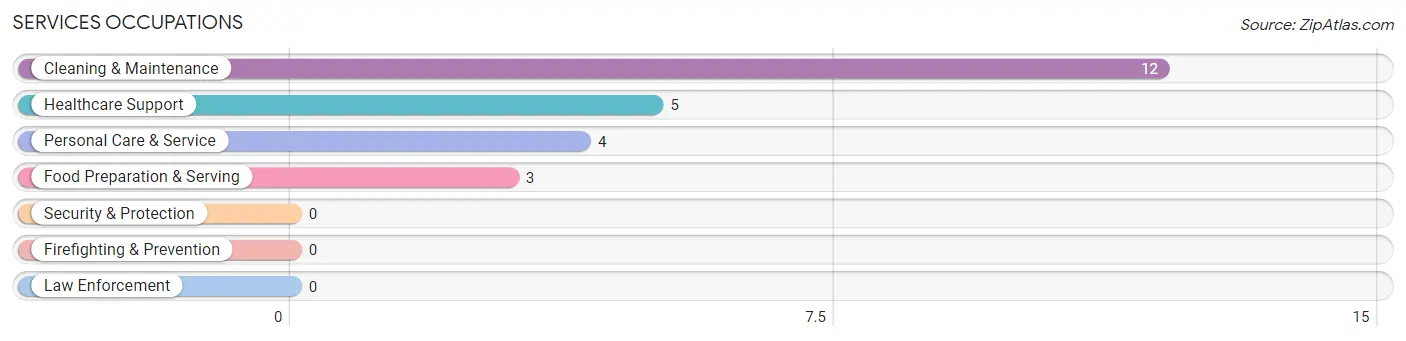
Services Occupations
The most common Services occupations in Glendon borough are Cleaning & Maintenance (12 | 5.8%), Healthcare Support (5 | 2.4%), Personal Care & Service (4 | 1.9%), and Food Preparation & Serving (3 | 1.5%).
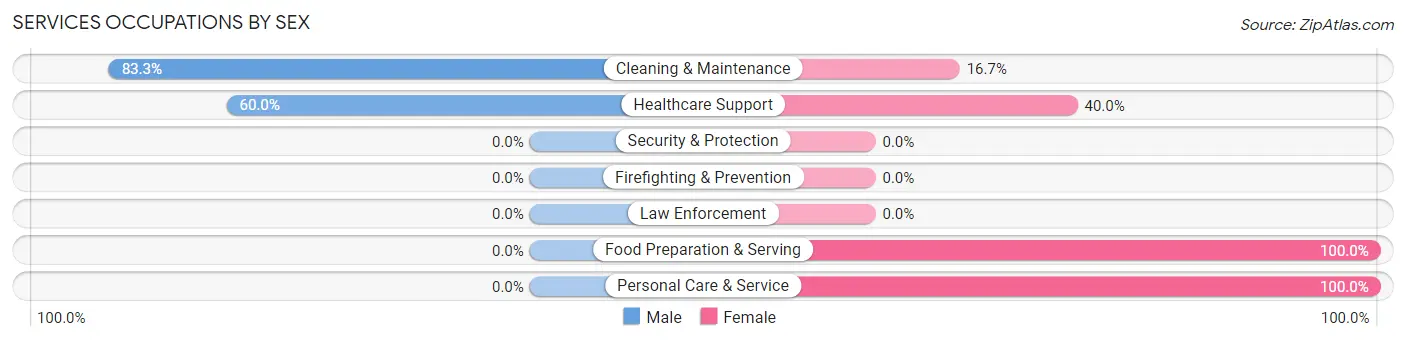
Services Occupations by Sex
Within the Services occupations in Glendon borough, the most male-oriented occupations are Cleaning & Maintenance (83.3%), and Healthcare Support (60.0%), while the most female-oriented occupations are Food Preparation & Serving (100.0%), Personal Care & Service (100.0%), and Healthcare Support (40.0%).
| Occupation | Male | Female |
| Healthcare Support | 3 (60.0%) | 2 (40.0%) |
| Security & Protection | 0 (0.0%) | 0 (0.0%) |
| Firefighting & Prevention | 0 (0.0%) | 0 (0.0%) |
| Law Enforcement | 0 (0.0%) | 0 (0.0%) |
| Food Preparation & Serving | 0 (0.0%) | 3 (100.0%) |
| Cleaning & Maintenance | 10 (83.3%) | 2 (16.7%) |
| Personal Care & Service | 0 (0.0%) | 4 (100.0%) |
| Total (Category) | 13 (54.2%) | 11 (45.8%) |
| Total (Overall) | 107 (51.7%) | 100 (48.3%) |
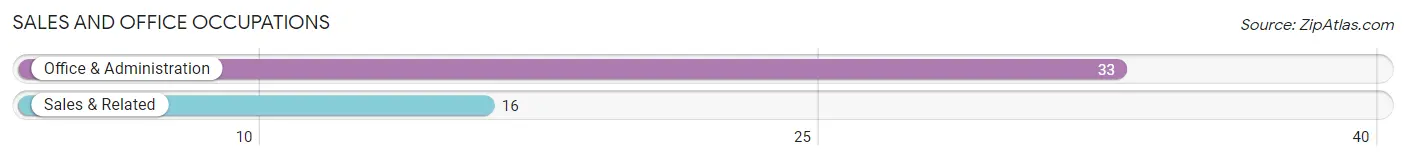
Sales and Office Occupations
The most common Sales and Office occupations in Glendon borough are Office & Administration (33 | 15.9%), and Sales & Related (16 | 7.7%).
Sales and Office Occupations by Sex
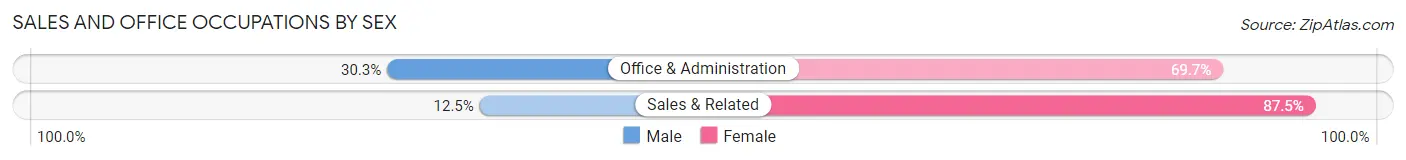
| Occupation | Male | Female |
| Sales & Related | 2 (12.5%) | 14 (87.5%) |
| Office & Administration | 10 (30.3%) | 23 (69.7%) |
| Total (Category) | 12 (24.5%) | 37 (75.5%) |
| Total (Overall) | 107 (51.7%) | 100 (48.3%) |
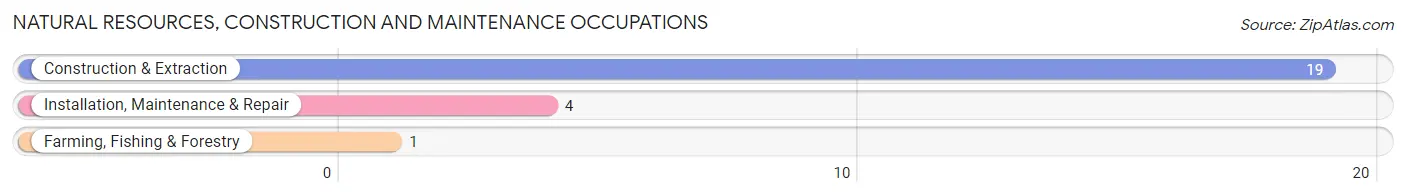
Natural Resources, Construction and Maintenance Occupations
The most common Natural Resources, Construction and Maintenance occupations in Glendon borough are Construction & Extraction (19 | 9.2%), Installation, Maintenance & Repair (4 | 1.9%), and Farming, Fishing & Forestry (1 | 0.5%).
Natural Resources, Construction and Maintenance Occupations by Sex
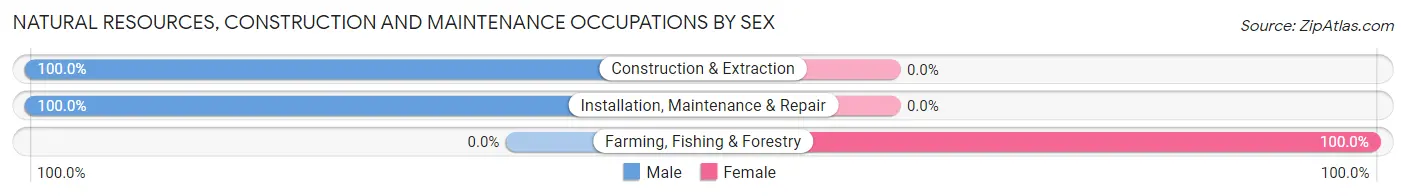
| Occupation | Male | Female |
| Farming, Fishing & Forestry | 0 (0.0%) | 1 (100.0%) |
| Construction & Extraction | 19 (100.0%) | 0 (0.0%) |
| Installation, Maintenance & Repair | 4 (100.0%) | 0 (0.0%) |
| Total (Category) | 23 (95.8%) | 1 (4.2%) |
| Total (Overall) | 107 (51.7%) | 100 (48.3%) |
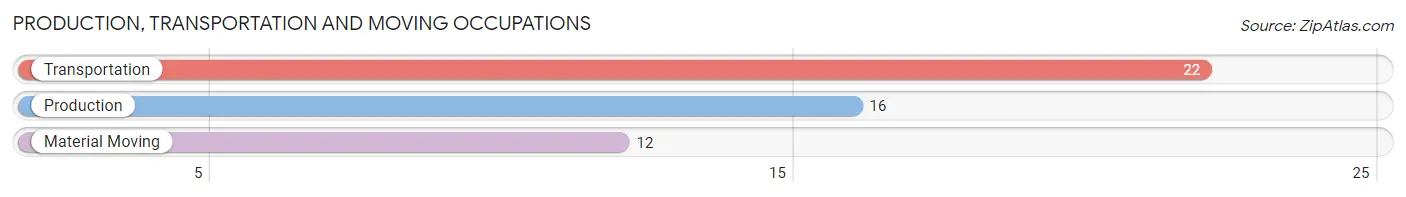
Production, Transportation and Moving Occupations
The most common Production, Transportation and Moving occupations in Glendon borough are Transportation (22 | 10.6%), Production (16 | 7.7%), and Material Moving (12 | 5.8%).
Production, Transportation and Moving Occupations by Sex
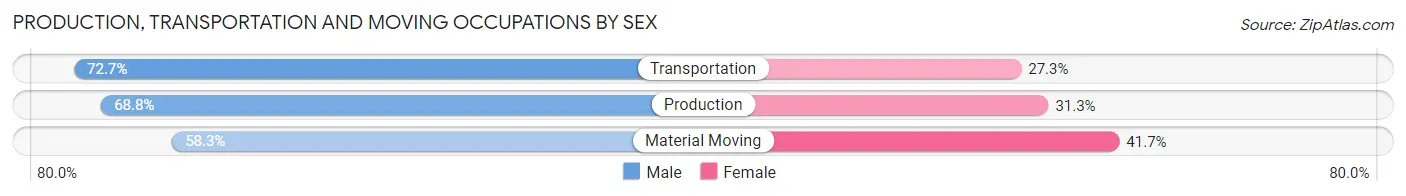
| Occupation | Male | Female |
| Production | 11 (68.8%) | 5 (31.2%) |
| Transportation | 16 (72.7%) | 6 (27.3%) |
| Material Moving | 7 (58.3%) | 5 (41.7%) |
| Total (Category) | 34 (68.0%) | 16 (32.0%) |
| Total (Overall) | 107 (51.7%) | 100 (48.3%) |
Employment Industries by Sex in Glendon borough
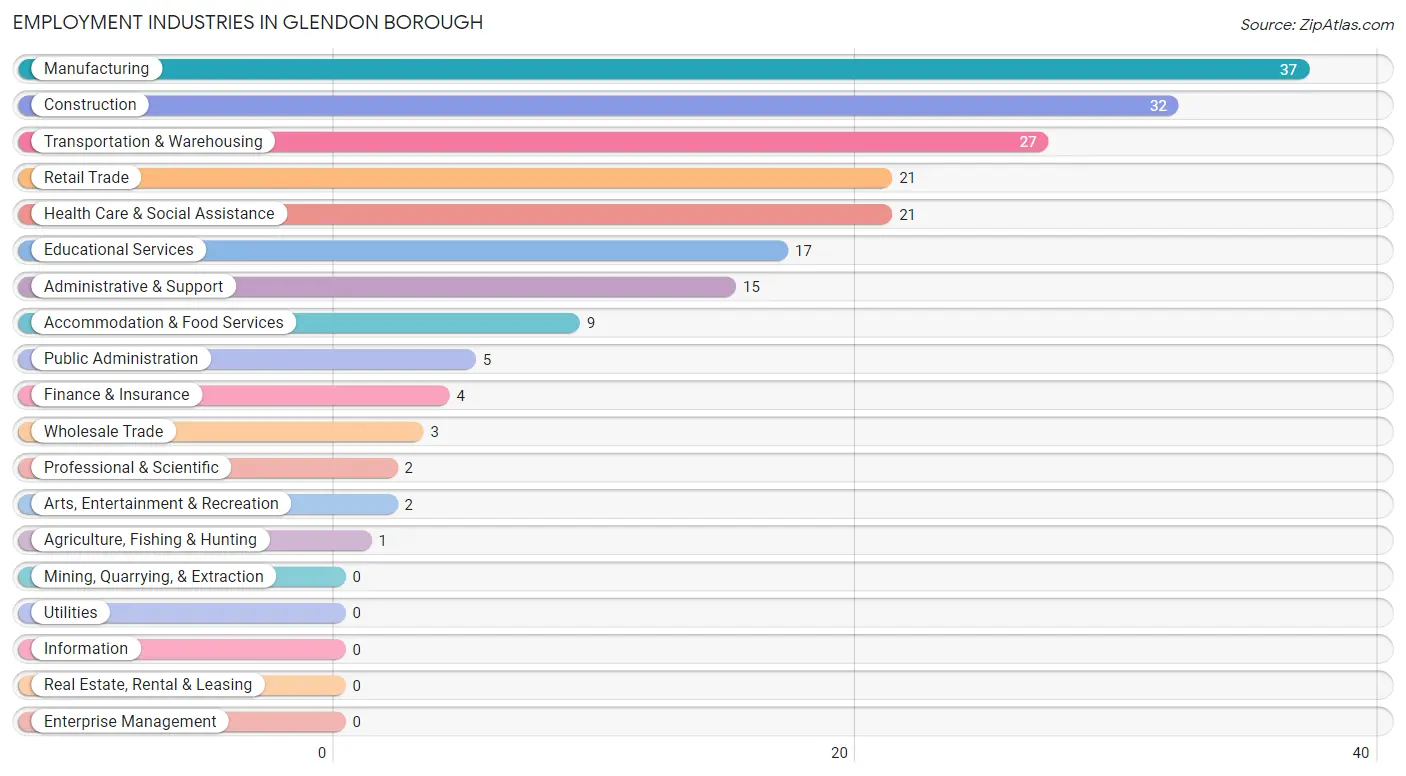
Employment Industries in Glendon borough
The major employment industries in Glendon borough include Manufacturing (37 | 17.9%), Construction (32 | 15.5%), Transportation & Warehousing (27 | 13.0%), Retail Trade (21 | 10.1%), and Health Care & Social Assistance (21 | 10.1%).
Employment Industries by Sex in Glendon borough
The Glendon borough industries that see more men than women are Public Administration (100.0%), Construction (87.5%), and Manufacturing (70.3%), whereas the industries that tend to have a higher number of women are Agriculture, Fishing & Hunting (100.0%), Arts, Entertainment & Recreation (100.0%), and Health Care & Social Assistance (85.7%).
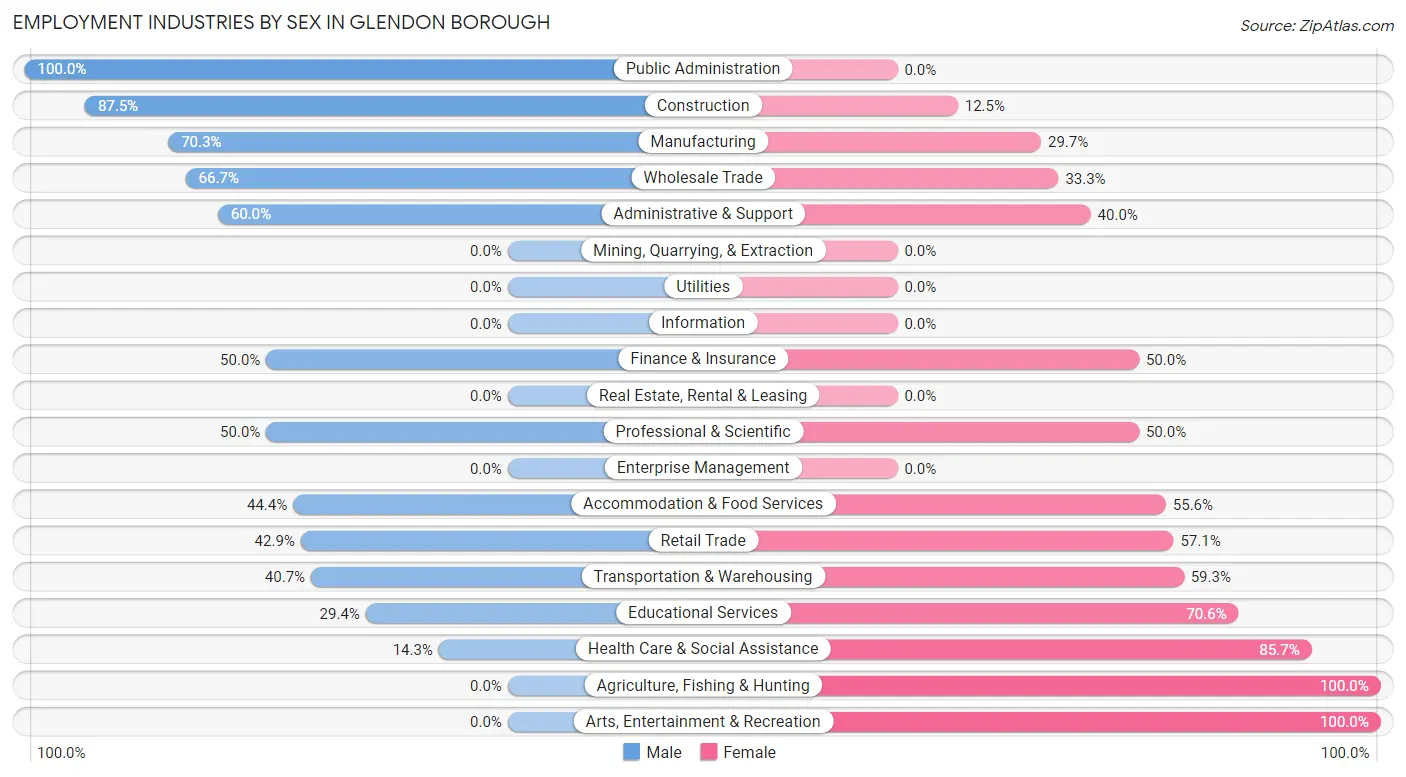
| Industry | Male | Female |
| Agriculture, Fishing & Hunting | 0 (0.0%) | 1 (100.0%) |
| Mining, Quarrying, & Extraction | 0 (0.0%) | 0 (0.0%) |
| Construction | 28 (87.5%) | 4 (12.5%) |
| Manufacturing | 26 (70.3%) | 11 (29.7%) |
| Wholesale Trade | 2 (66.7%) | 1 (33.3%) |
| Retail Trade | 9 (42.9%) | 12 (57.1%) |
| Transportation & Warehousing | 11 (40.7%) | 16 (59.3%) |
| Utilities | 0 (0.0%) | 0 (0.0%) |
| Information | 0 (0.0%) | 0 (0.0%) |
| Finance & Insurance | 2 (50.0%) | 2 (50.0%) |
| Real Estate, Rental & Leasing | 0 (0.0%) | 0 (0.0%) |
| Professional & Scientific | 1 (50.0%) | 1 (50.0%) |
| Enterprise Management | 0 (0.0%) | 0 (0.0%) |
| Administrative & Support | 9 (60.0%) | 6 (40.0%) |
| Educational Services | 5 (29.4%) | 12 (70.6%) |
| Health Care & Social Assistance | 3 (14.3%) | 18 (85.7%) |
| Arts, Entertainment & Recreation | 0 (0.0%) | 2 (100.0%) |
| Accommodation & Food Services | 4 (44.4%) | 5 (55.6%) |
| Public Administration | 5 (100.0%) | 0 (0.0%) |
| Total | 107 (51.7%) | 100 (48.3%) |
Education in Glendon borough
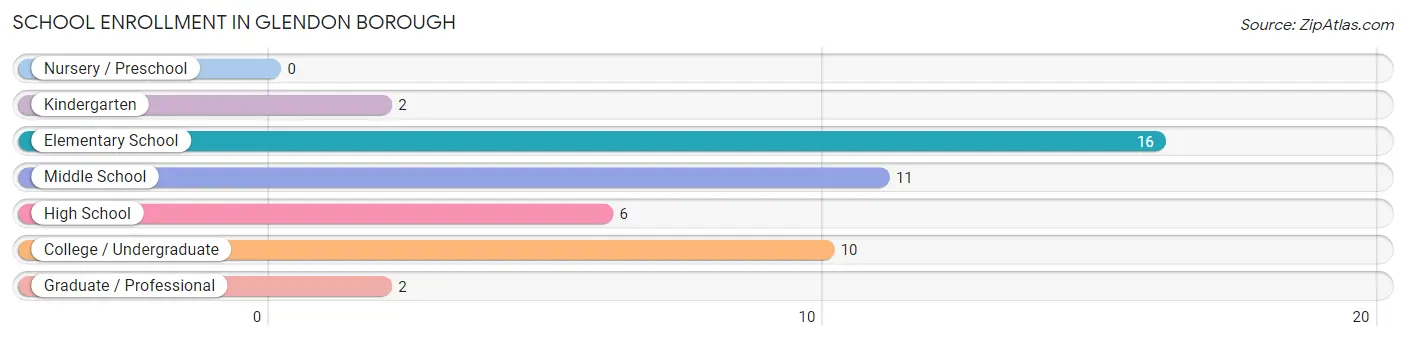
School Enrollment in Glendon borough
The most common levels of schooling among the 47 students in Glendon borough are elementary school (16 | 34.0%), middle school (11 | 23.4%), and college / undergraduate (10 | 21.3%).
| School Level | # Students | % Students |
| Nursery / Preschool | 0 | 0.0% |
| Kindergarten | 2 | 4.3% |
| Elementary School | 16 | 34.0% |
| Middle School | 11 | 23.4% |
| High School | 6 | 12.8% |
| College / Undergraduate | 10 | 21.3% |
| Graduate / Professional | 2 | 4.3% |
| Total | 47 | 100.0% |
School Enrollment by Age by Funding Source in Glendon borough
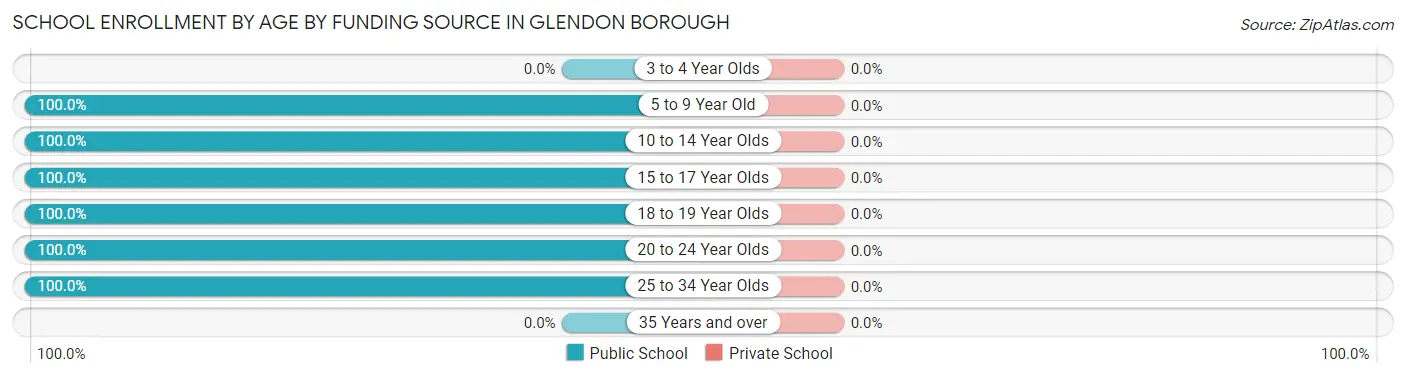
| Age Bracket | Public School | Private School |
| 3 to 4 Year Olds | 0 (0.0%) | 0 (0.0%) |
| 5 to 9 Year Old | 16 (100.0%) | 0 (0.0%) |
| 10 to 14 Year Olds | 13 (100.0%) | 0 (0.0%) |
| 15 to 17 Year Olds | 6 (100.0%) | 0 (0.0%) |
| 18 to 19 Year Olds | 2 (100.0%) | 0 (0.0%) |
| 20 to 24 Year Olds | 8 (100.0%) | 0 (0.0%) |
| 25 to 34 Year Olds | 2 (100.0%) | 0 (0.0%) |
| 35 Years and over | 0 (0.0%) | 0 (0.0%) |
| Total | 47 (100.0%) | 0 (0.0%) |
Educational Attainment by Field of Study in Glendon borough
Bio, nature & agricultural (14 | 19.2%), education (13 | 17.8%), science & technology (10 | 13.7%), business (10 | 13.7%), and psychology (8 | 11.0%) are the most common fields of study among 73 individuals in Glendon borough who have obtained a bachelor's degree or higher.
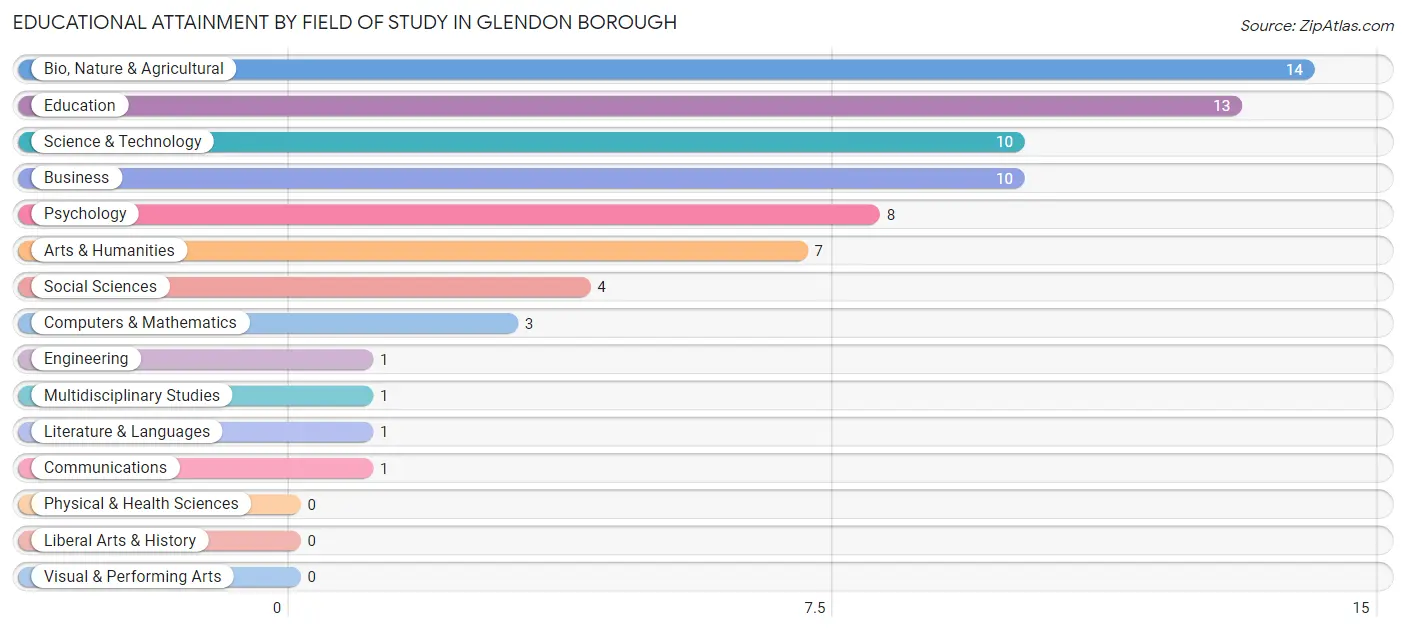
| Field of Study | # Graduates | % Graduates |
| Computers & Mathematics | 3 | 4.1% |
| Bio, Nature & Agricultural | 14 | 19.2% |
| Physical & Health Sciences | 0 | 0.0% |
| Psychology | 8 | 11.0% |
| Social Sciences | 4 | 5.5% |
| Engineering | 1 | 1.4% |
| Multidisciplinary Studies | 1 | 1.4% |
| Science & Technology | 10 | 13.7% |
| Business | 10 | 13.7% |
| Education | 13 | 17.8% |
| Literature & Languages | 1 | 1.4% |
| Liberal Arts & History | 0 | 0.0% |
| Visual & Performing Arts | 0 | 0.0% |
| Communications | 1 | 1.4% |
| Arts & Humanities | 7 | 9.6% |
| Total | 73 | 100.0% |
Transportation & Commute in Glendon borough
Vehicle Availability by Sex in Glendon borough
The most prevalent vehicle ownership categories in Glendon borough are males with 3 vehicles (40, accounting for 37.4%) and females with 3 vehicles (31, making up 40.0%).
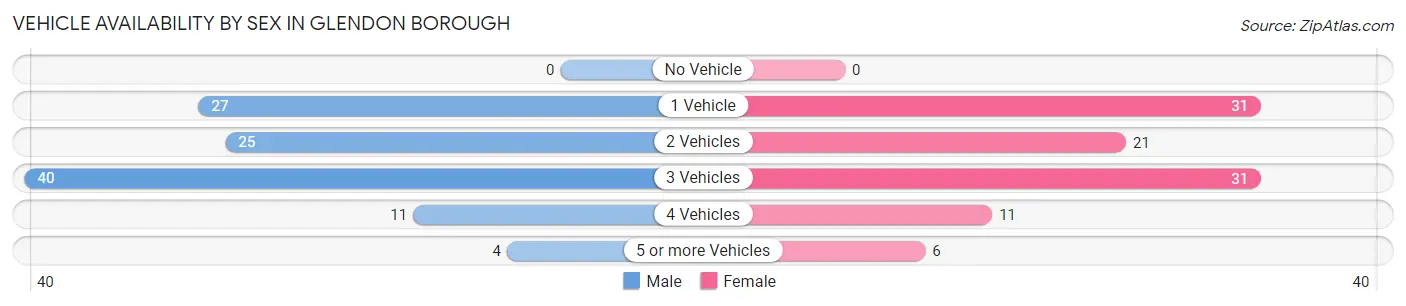
| Vehicles Available | Male | Female |
| No Vehicle | 0 (0.0%) | 0 (0.0%) |
| 1 Vehicle | 27 (25.2%) | 31 (31.0%) |
| 2 Vehicles | 25 (23.4%) | 21 (21.0%) |
| 3 Vehicles | 40 (37.4%) | 31 (31.0%) |
| 4 Vehicles | 11 (10.3%) | 11 (11.0%) |
| 5 or more Vehicles | 4 (3.7%) | 6 (6.0%) |
| Total | 107 (100.0%) | 100 (100.0%) |
Commute Time in Glendon borough
The most frequently occuring commute durations in Glendon borough are 20 to 24 minutes (44 commuters, 21.4%), 5 to 9 minutes (35 commuters, 17.0%), and 10 to 14 minutes (33 commuters, 16.0%).
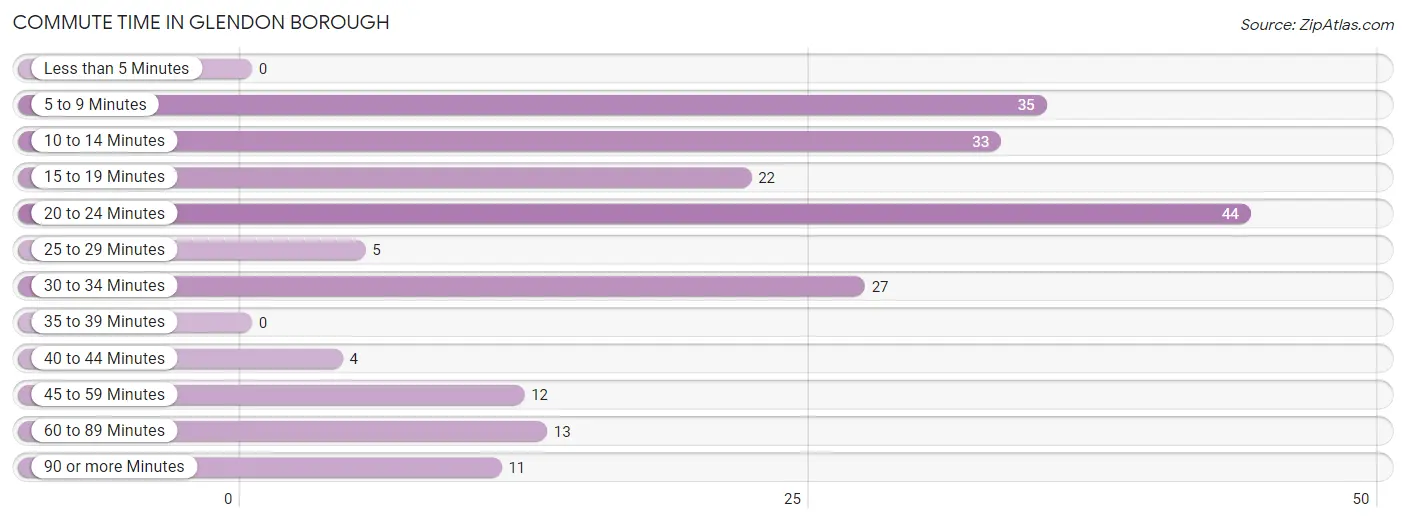
| Commute Time | # Commuters | % Commuters |
| Less than 5 Minutes | 0 | 0.0% |
| 5 to 9 Minutes | 35 | 17.0% |
| 10 to 14 Minutes | 33 | 16.0% |
| 15 to 19 Minutes | 22 | 10.7% |
| 20 to 24 Minutes | 44 | 21.4% |
| 25 to 29 Minutes | 5 | 2.4% |
| 30 to 34 Minutes | 27 | 13.1% |
| 35 to 39 Minutes | 0 | 0.0% |
| 40 to 44 Minutes | 4 | 1.9% |
| 45 to 59 Minutes | 12 | 5.8% |
| 60 to 89 Minutes | 13 | 6.3% |
| 90 or more Minutes | 11 | 5.3% |
Commute Time by Sex in Glendon borough
The most common commute times in Glendon borough are 20 to 24 minutes (24 commuters, 22.6%) for males and 20 to 24 minutes (20 commuters, 20.0%) for females.
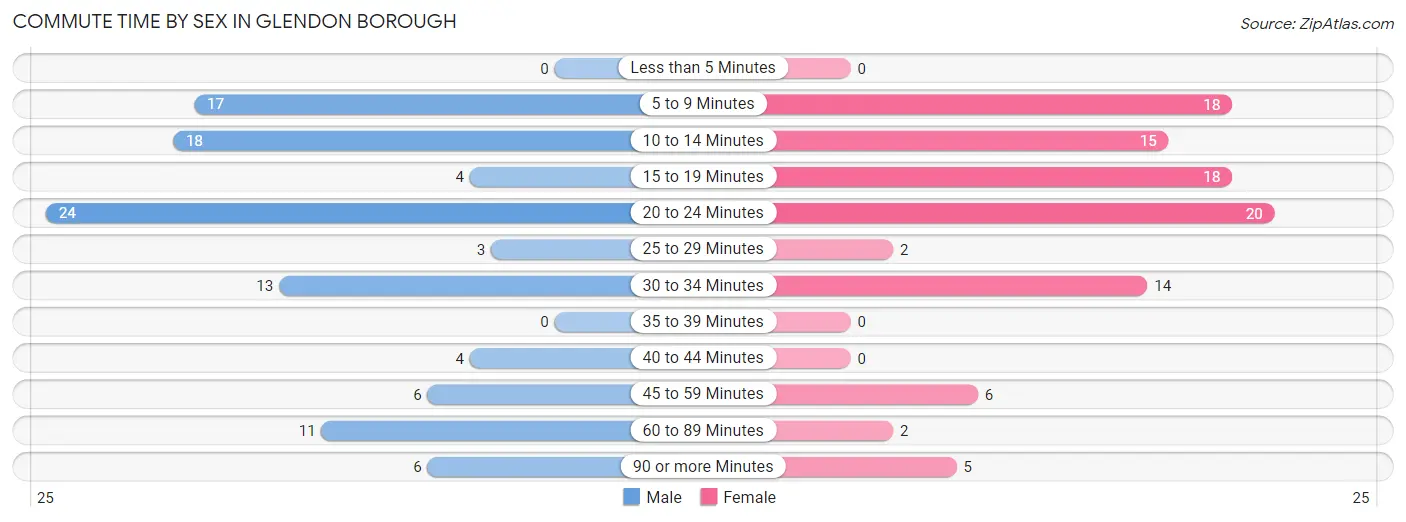
| Commute Time | Male | Female |
| Less than 5 Minutes | 0 (0.0%) | 0 (0.0%) |
| 5 to 9 Minutes | 17 (16.0%) | 18 (18.0%) |
| 10 to 14 Minutes | 18 (17.0%) | 15 (15.0%) |
| 15 to 19 Minutes | 4 (3.8%) | 18 (18.0%) |
| 20 to 24 Minutes | 24 (22.6%) | 20 (20.0%) |
| 25 to 29 Minutes | 3 (2.8%) | 2 (2.0%) |
| 30 to 34 Minutes | 13 (12.3%) | 14 (14.0%) |
| 35 to 39 Minutes | 0 (0.0%) | 0 (0.0%) |
| 40 to 44 Minutes | 4 (3.8%) | 0 (0.0%) |
| 45 to 59 Minutes | 6 (5.7%) | 6 (6.0%) |
| 60 to 89 Minutes | 11 (10.4%) | 2 (2.0%) |
| 90 or more Minutes | 6 (5.7%) | 5 (5.0%) |
Time of Departure to Work by Sex in Glendon borough
The most frequent times of departure to work in Glendon borough are 7:00 AM to 7:29 AM (22, 20.7%) for males and 7:00 AM to 7:29 AM (20, 20.0%) for females.
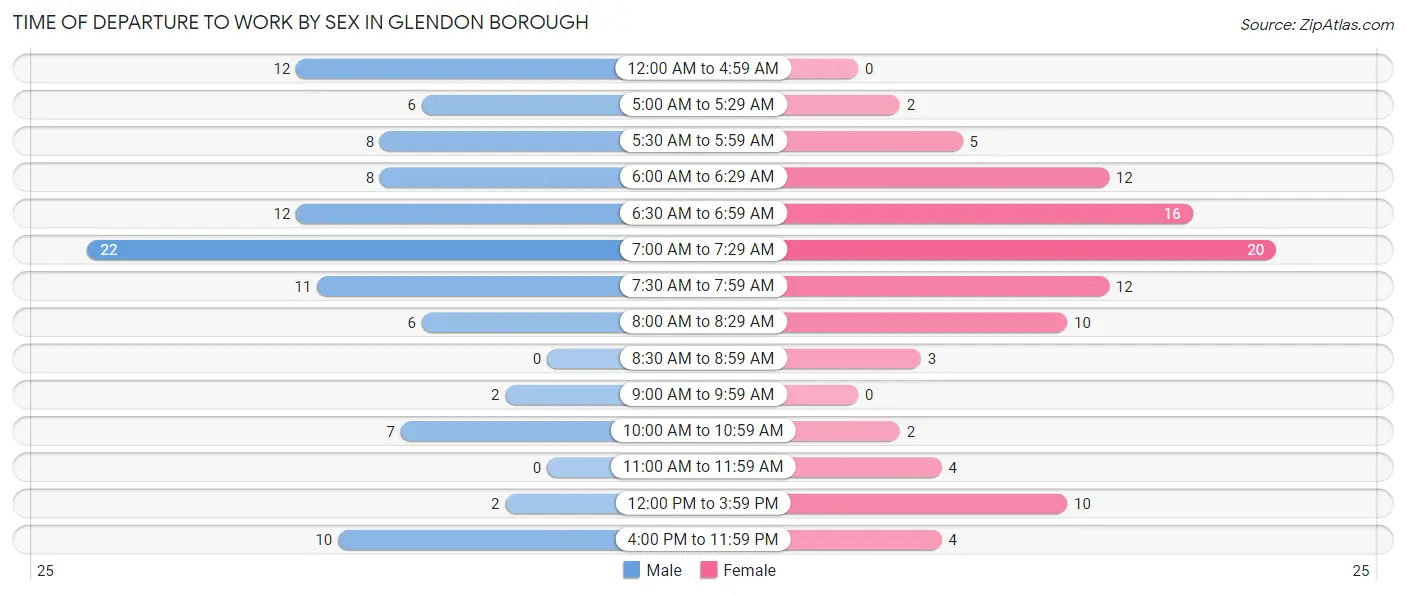
| Time of Departure | Male | Female |
| 12:00 AM to 4:59 AM | 12 (11.3%) | 0 (0.0%) |
| 5:00 AM to 5:29 AM | 6 (5.7%) | 2 (2.0%) |
| 5:30 AM to 5:59 AM | 8 (7.5%) | 5 (5.0%) |
| 6:00 AM to 6:29 AM | 8 (7.5%) | 12 (12.0%) |
| 6:30 AM to 6:59 AM | 12 (11.3%) | 16 (16.0%) |
| 7:00 AM to 7:29 AM | 22 (20.7%) | 20 (20.0%) |
| 7:30 AM to 7:59 AM | 11 (10.4%) | 12 (12.0%) |
| 8:00 AM to 8:29 AM | 6 (5.7%) | 10 (10.0%) |
| 8:30 AM to 8:59 AM | 0 (0.0%) | 3 (3.0%) |
| 9:00 AM to 9:59 AM | 2 (1.9%) | 0 (0.0%) |
| 10:00 AM to 10:59 AM | 7 (6.6%) | 2 (2.0%) |
| 11:00 AM to 11:59 AM | 0 (0.0%) | 4 (4.0%) |
| 12:00 PM to 3:59 PM | 2 (1.9%) | 10 (10.0%) |
| 4:00 PM to 11:59 PM | 10 (9.4%) | 4 (4.0%) |
| Total | 106 (100.0%) | 100 (100.0%) |
Housing Occupancy in Glendon borough
Occupancy by Ownership in Glendon borough
Of the total 149 dwellings in Glendon borough, owner-occupied units account for 118 (79.2%), while renter-occupied units make up 31 (20.8%).
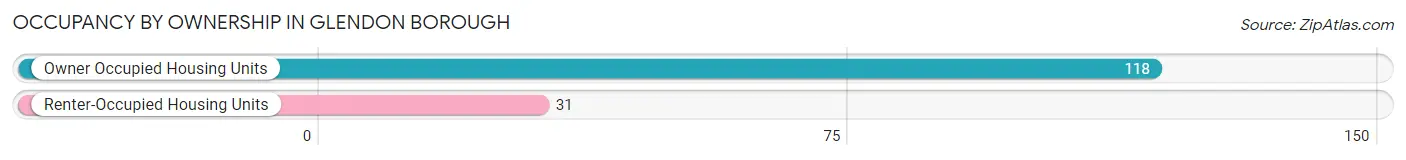
| Occupancy | # Housing Units | % Housing Units |
| Owner Occupied Housing Units | 118 | 79.2% |
| Renter-Occupied Housing Units | 31 | 20.8% |
| Total Occupied Housing Units | 149 | 100.0% |
Occupancy by Household Size in Glendon borough
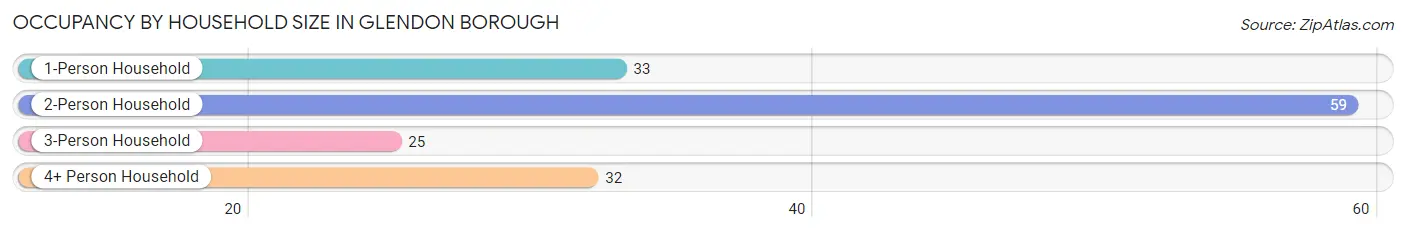
| Household Size | # Housing Units | % Housing Units |
| 1-Person Household | 33 | 22.2% |
| 2-Person Household | 59 | 39.6% |
| 3-Person Household | 25 | 16.8% |
| 4+ Person Household | 32 | 21.5% |
| Total Housing Units | 149 | 100.0% |
Occupancy by Ownership by Household Size in Glendon borough
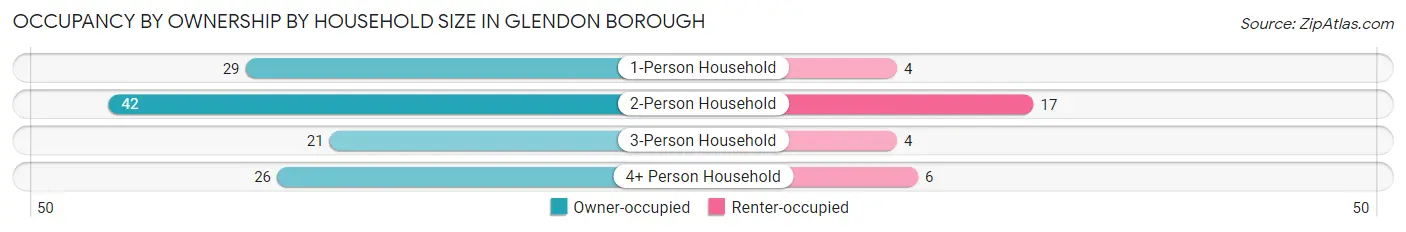
| Household Size | Owner-occupied | Renter-occupied |
| 1-Person Household | 29 (87.9%) | 4 (12.1%) |
| 2-Person Household | 42 (71.2%) | 17 (28.8%) |
| 3-Person Household | 21 (84.0%) | 4 (16.0%) |
| 4+ Person Household | 26 (81.2%) | 6 (18.8%) |
| Total Housing Units | 118 (79.2%) | 31 (20.8%) |
Occupancy by Educational Attainment in Glendon borough
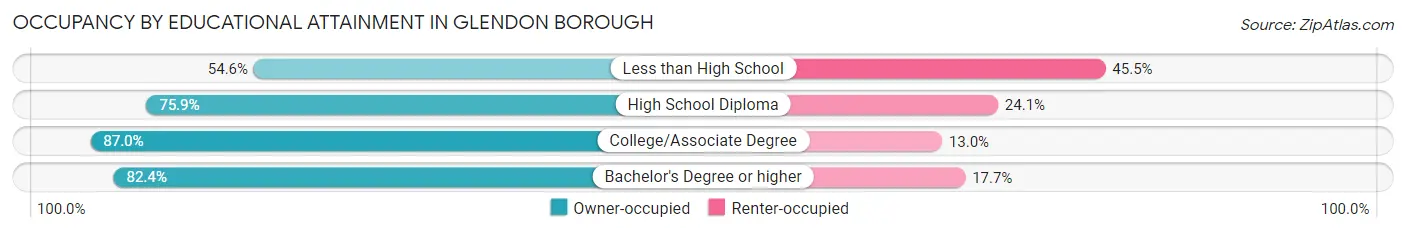
| Household Size | Owner-occupied | Renter-occupied |
| Less than High School | 6 (54.5%) | 5 (45.5%) |
| High School Diploma | 44 (75.9%) | 14 (24.1%) |
| College/Associate Degree | 40 (87.0%) | 6 (13.0%) |
| Bachelor's Degree or higher | 28 (82.4%) | 6 (17.6%) |
Occupancy by Age of Householder in Glendon borough
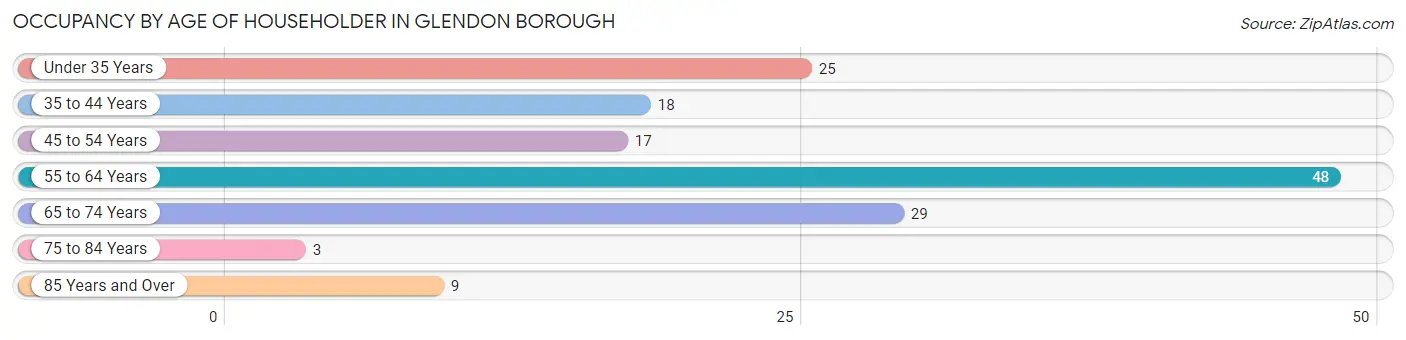
| Age Bracket | # Households | % Households |
| Under 35 Years | 25 | 16.8% |
| 35 to 44 Years | 18 | 12.1% |
| 45 to 54 Years | 17 | 11.4% |
| 55 to 64 Years | 48 | 32.2% |
| 65 to 74 Years | 29 | 19.5% |
| 75 to 84 Years | 3 | 2.0% |
| 85 Years and Over | 9 | 6.0% |
| Total | 149 | 100.0% |
Housing Finances in Glendon borough
Median Income by Occupancy in Glendon borough
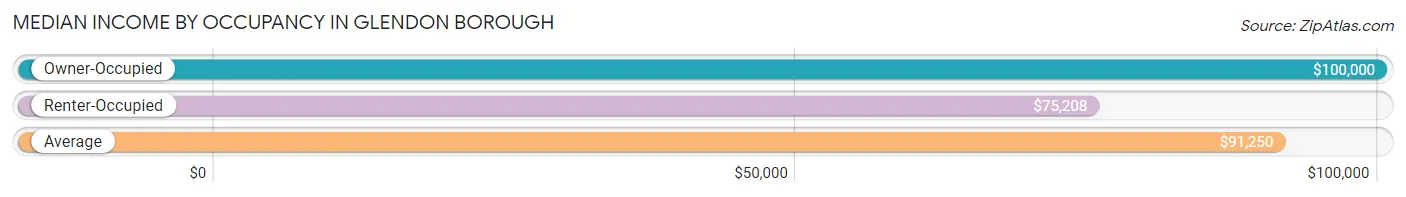
| Occupancy Type | # Households | Median Income |
| Owner-Occupied | 118 (79.2%) | $100,000 |
| Renter-Occupied | 31 (20.8%) | $75,208 |
| Average | 149 (100.0%) | $91,250 |
Occupancy by Householder Income Bracket in Glendon borough
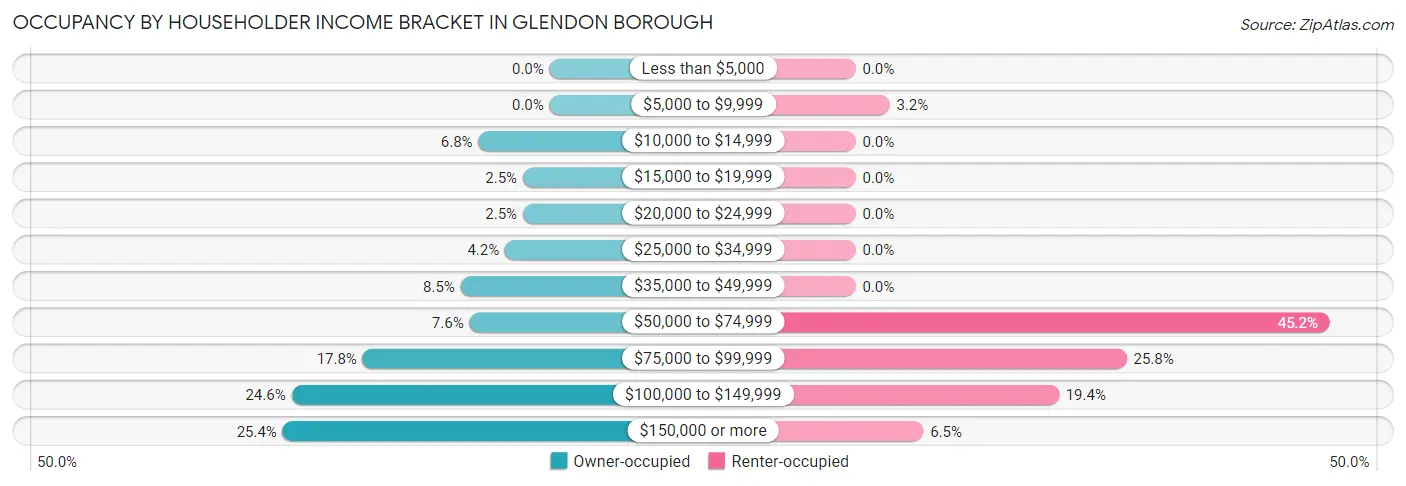
| Income Bracket | Owner-occupied | Renter-occupied |
| Less than $5,000 | 0 (0.0%) | 0 (0.0%) |
| $5,000 to $9,999 | 0 (0.0%) | 1 (3.2%) |
| $10,000 to $14,999 | 8 (6.8%) | 0 (0.0%) |
| $15,000 to $19,999 | 3 (2.5%) | 0 (0.0%) |
| $20,000 to $24,999 | 3 (2.5%) | 0 (0.0%) |
| $25,000 to $34,999 | 5 (4.2%) | 0 (0.0%) |
| $35,000 to $49,999 | 10 (8.5%) | 0 (0.0%) |
| $50,000 to $74,999 | 9 (7.6%) | 14 (45.2%) |
| $75,000 to $99,999 | 21 (17.8%) | 8 (25.8%) |
| $100,000 to $149,999 | 29 (24.6%) | 6 (19.4%) |
| $150,000 or more | 30 (25.4%) | 2 (6.5%) |
| Total | 118 (100.0%) | 31 (100.0%) |
Monthly Housing Cost Tiers in Glendon borough
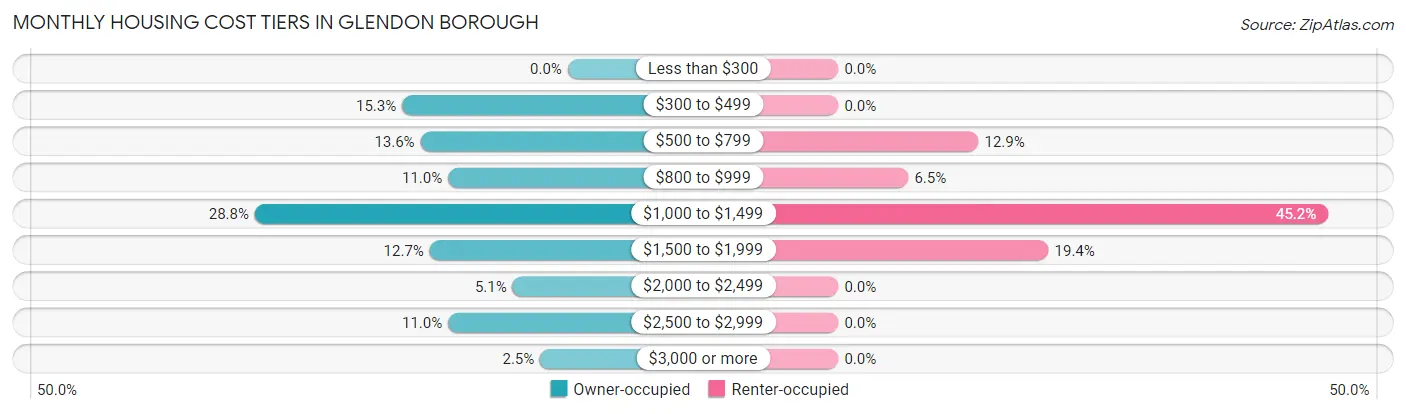
| Monthly Cost | Owner-occupied | Renter-occupied |
| Less than $300 | 0 (0.0%) | 0 (0.0%) |
| $300 to $499 | 18 (15.2%) | 0 (0.0%) |
| $500 to $799 | 16 (13.6%) | 4 (12.9%) |
| $800 to $999 | 13 (11.0%) | 2 (6.5%) |
| $1,000 to $1,499 | 34 (28.8%) | 14 (45.2%) |
| $1,500 to $1,999 | 15 (12.7%) | 6 (19.4%) |
| $2,000 to $2,499 | 6 (5.1%) | 0 (0.0%) |
| $2,500 to $2,999 | 13 (11.0%) | 0 (0.0%) |
| $3,000 or more | 3 (2.5%) | 0 (0.0%) |
| Total | 118 (100.0%) | 31 (100.0%) |
Physical Housing Characteristics in Glendon borough
Housing Structures in Glendon borough
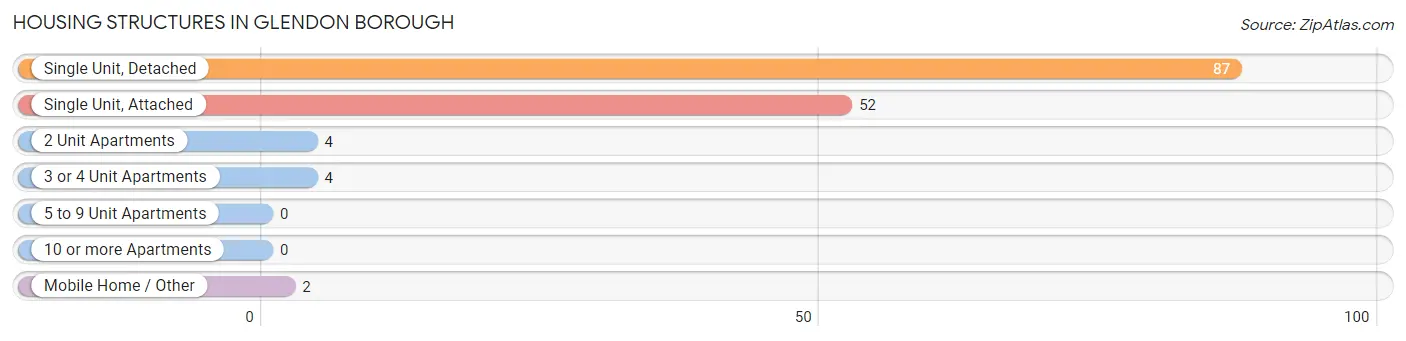
| Structure Type | # Housing Units | % Housing Units |
| Single Unit, Detached | 87 | 58.4% |
| Single Unit, Attached | 52 | 34.9% |
| 2 Unit Apartments | 4 | 2.7% |
| 3 or 4 Unit Apartments | 4 | 2.7% |
| 5 to 9 Unit Apartments | 0 | 0.0% |
| 10 or more Apartments | 0 | 0.0% |
| Mobile Home / Other | 2 | 1.3% |
| Total | 149 | 100.0% |
Housing Structures by Occupancy in Glendon borough
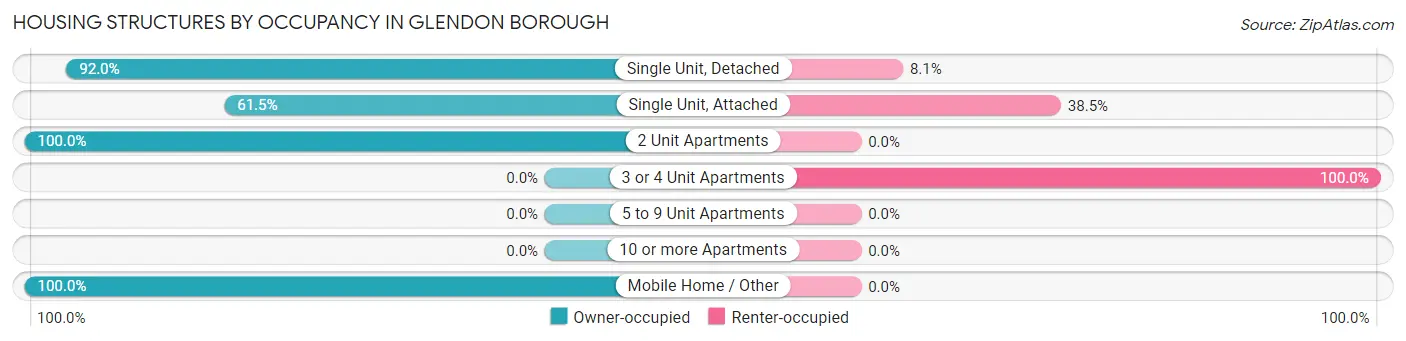
| Structure Type | Owner-occupied | Renter-occupied |
| Single Unit, Detached | 80 (91.9%) | 7 (8.1%) |
| Single Unit, Attached | 32 (61.5%) | 20 (38.5%) |
| 2 Unit Apartments | 4 (100.0%) | 0 (0.0%) |
| 3 or 4 Unit Apartments | 0 (0.0%) | 4 (100.0%) |
| 5 to 9 Unit Apartments | 0 (0.0%) | 0 (0.0%) |
| 10 or more Apartments | 0 (0.0%) | 0 (0.0%) |
| Mobile Home / Other | 2 (100.0%) | 0 (0.0%) |
| Total | 118 (79.2%) | 31 (20.8%) |
Housing Structures by Number of Rooms in Glendon borough
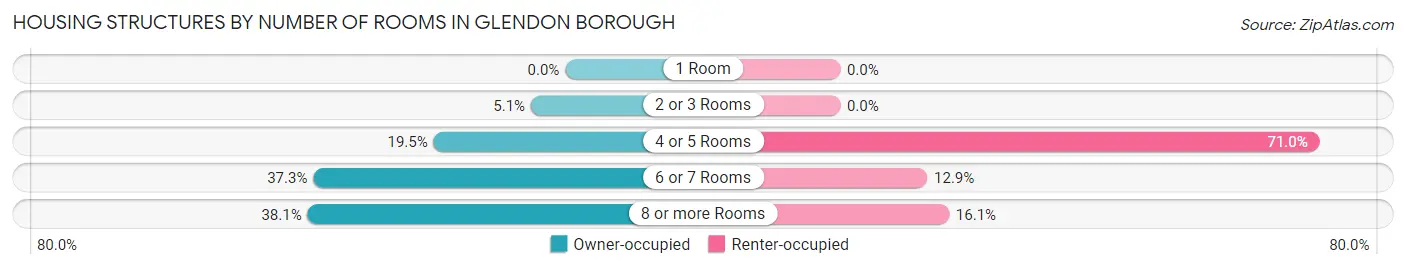
| Number of Rooms | Owner-occupied | Renter-occupied |
| 1 Room | 0 (0.0%) | 0 (0.0%) |
| 2 or 3 Rooms | 6 (5.1%) | 0 (0.0%) |
| 4 or 5 Rooms | 23 (19.5%) | 22 (71.0%) |
| 6 or 7 Rooms | 44 (37.3%) | 4 (12.9%) |
| 8 or more Rooms | 45 (38.1%) | 5 (16.1%) |
| Total | 118 (100.0%) | 31 (100.0%) |
Housing Structure by Heating Type in Glendon borough
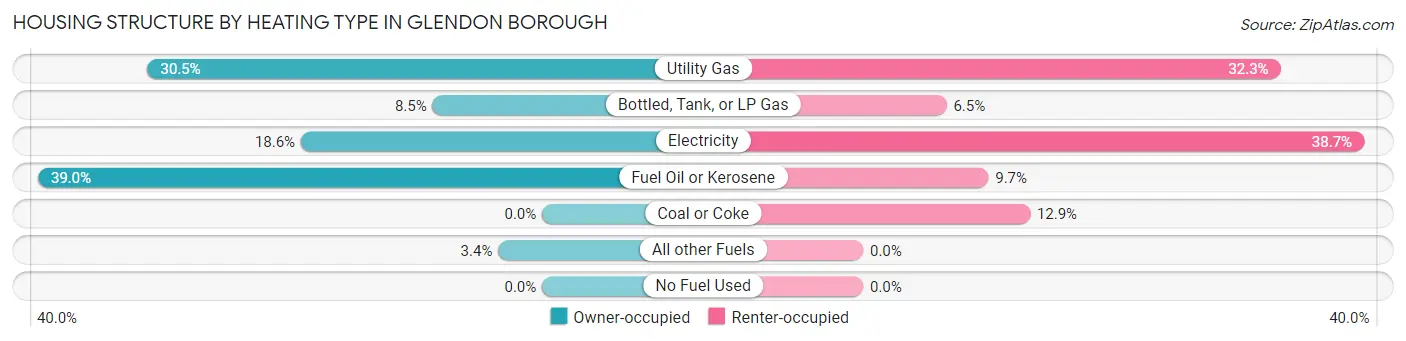
| Heating Type | Owner-occupied | Renter-occupied |
| Utility Gas | 36 (30.5%) | 10 (32.3%) |
| Bottled, Tank, or LP Gas | 10 (8.5%) | 2 (6.5%) |
| Electricity | 22 (18.6%) | 12 (38.7%) |
| Fuel Oil or Kerosene | 46 (39.0%) | 3 (9.7%) |
| Coal or Coke | 0 (0.0%) | 4 (12.9%) |
| All other Fuels | 4 (3.4%) | 0 (0.0%) |
| No Fuel Used | 0 (0.0%) | 0 (0.0%) |
| Total | 118 (100.0%) | 31 (100.0%) |
Household Vehicle Usage in Glendon borough
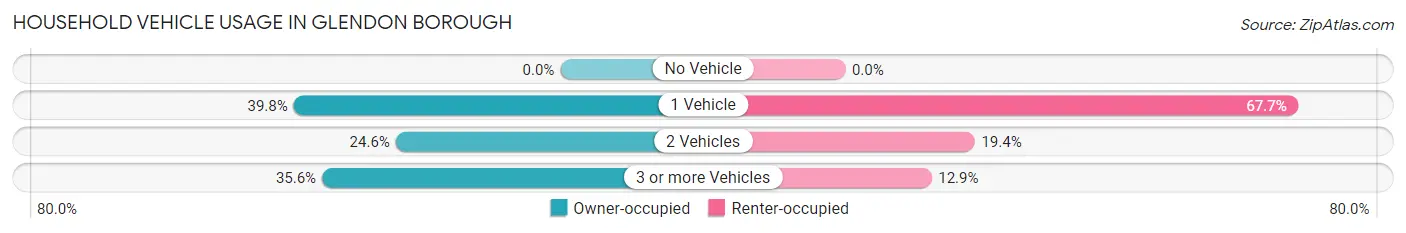
| Vehicles per Household | Owner-occupied | Renter-occupied |
| No Vehicle | 0 (0.0%) | 0 (0.0%) |
| 1 Vehicle | 47 (39.8%) | 21 (67.7%) |
| 2 Vehicles | 29 (24.6%) | 6 (19.4%) |
| 3 or more Vehicles | 42 (35.6%) | 4 (12.9%) |
| Total | 118 (100.0%) | 31 (100.0%) |
Real Estate & Mortgages in Glendon borough
Real Estate and Mortgage Overview in Glendon borough
| Characteristic | Without Mortgage | With Mortgage |
| Housing Units | 59 | 59 |
| Median Property Value | $184,400 | $174,000 |
| Median Household Income | $94,063 | $17 |
| Monthly Housing Costs | $725 | $0 |
| Real Estate Taxes | $3,300 | $0 |
Property Value by Mortgage Status in Glendon borough
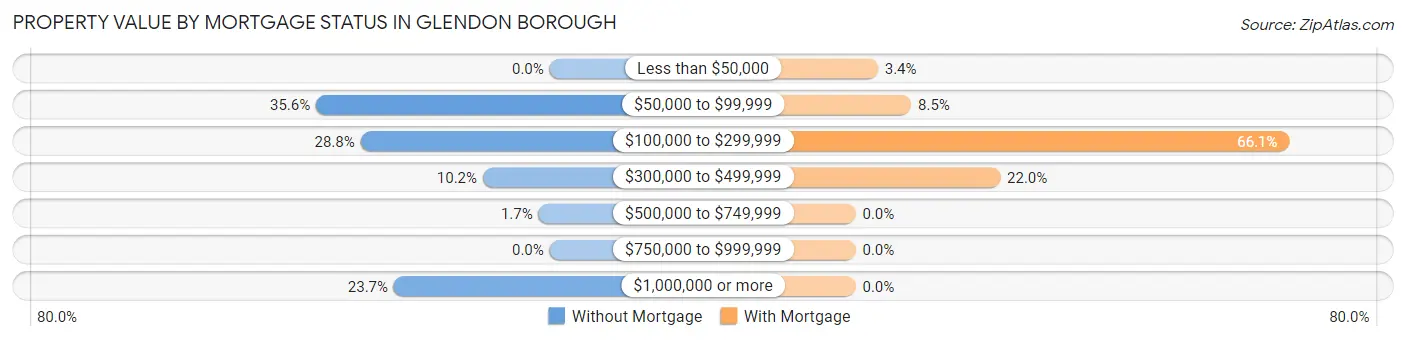
| Property Value | Without Mortgage | With Mortgage |
| Less than $50,000 | 0 (0.0%) | 2 (3.4%) |
| $50,000 to $99,999 | 21 (35.6%) | 5 (8.5%) |
| $100,000 to $299,999 | 17 (28.8%) | 39 (66.1%) |
| $300,000 to $499,999 | 6 (10.2%) | 13 (22.0%) |
| $500,000 to $749,999 | 1 (1.7%) | 0 (0.0%) |
| $750,000 to $999,999 | 0 (0.0%) | 0 (0.0%) |
| $1,000,000 or more | 14 (23.7%) | 0 (0.0%) |
| Total | 59 (100.0%) | 59 (100.0%) |
Household Income by Mortgage Status in Glendon borough
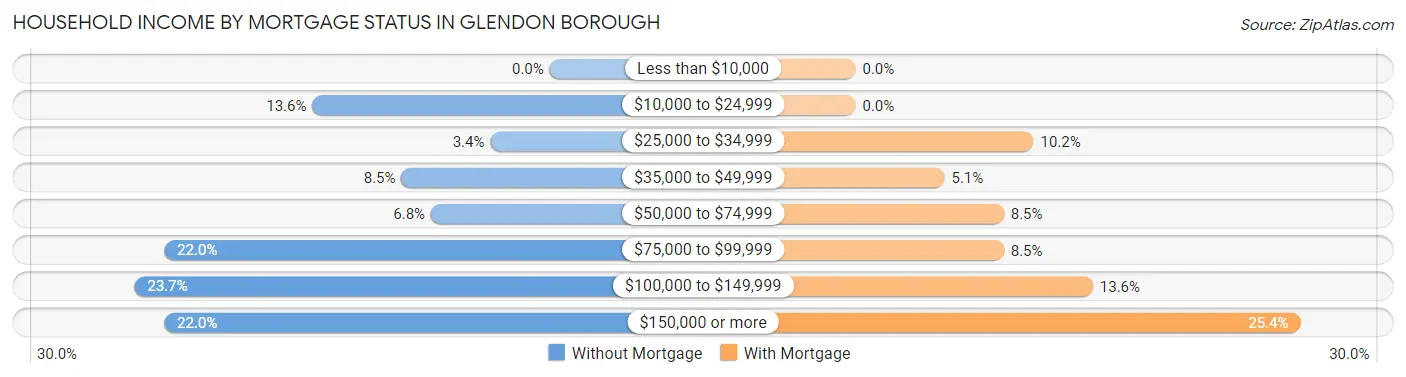
| Household Income | Without Mortgage | With Mortgage |
| Less than $10,000 | 0 (0.0%) | 0 (0.0%) |
| $10,000 to $24,999 | 8 (13.6%) | 0 (0.0%) |
| $25,000 to $34,999 | 2 (3.4%) | 6 (10.2%) |
| $35,000 to $49,999 | 5 (8.5%) | 3 (5.1%) |
| $50,000 to $74,999 | 4 (6.8%) | 5 (8.5%) |
| $75,000 to $99,999 | 13 (22.0%) | 5 (8.5%) |
| $100,000 to $149,999 | 14 (23.7%) | 8 (13.6%) |
| $150,000 or more | 13 (22.0%) | 15 (25.4%) |
| Total | 59 (100.0%) | 59 (100.0%) |
Property Value to Household Income Ratio in Glendon borough
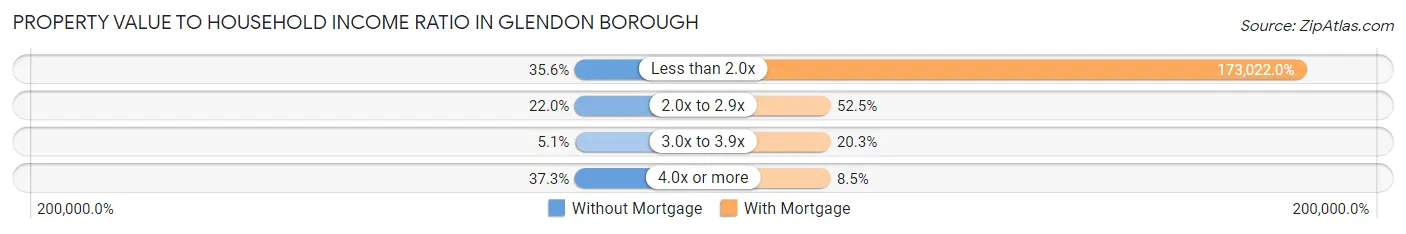
| Value-to-Income Ratio | Without Mortgage | With Mortgage |
| Less than 2.0x | 21 (35.6%) | 102,083 (173,022.0%) |
| 2.0x to 2.9x | 13 (22.0%) | 31 (52.5%) |
| 3.0x to 3.9x | 3 (5.1%) | 12 (20.3%) |
| 4.0x or more | 22 (37.3%) | 5 (8.5%) |
| Total | 59 (100.0%) | 59 (100.0%) |
Real Estate Taxes by Mortgage Status in Glendon borough
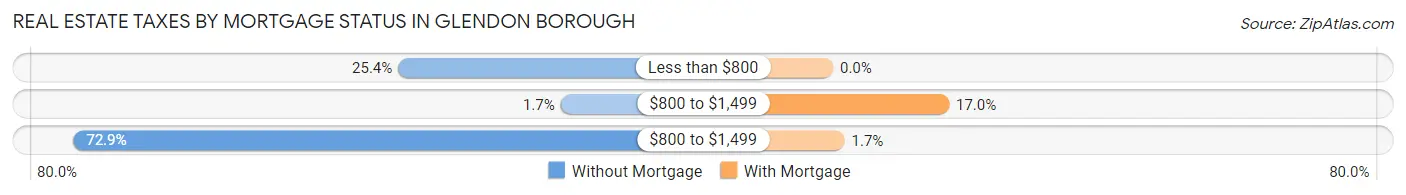
| Property Taxes | Without Mortgage | With Mortgage |
| Less than $800 | 15 (25.4%) | 0 (0.0%) |
| $800 to $1,499 | 1 (1.7%) | 10 (17.0%) |
| $800 to $1,499 | 43 (72.9%) | 1 (1.7%) |
| Total | 59 (100.0%) | 59 (100.0%) |
Health & Disability in Glendon borough
Health Insurance Coverage by Age in Glendon borough
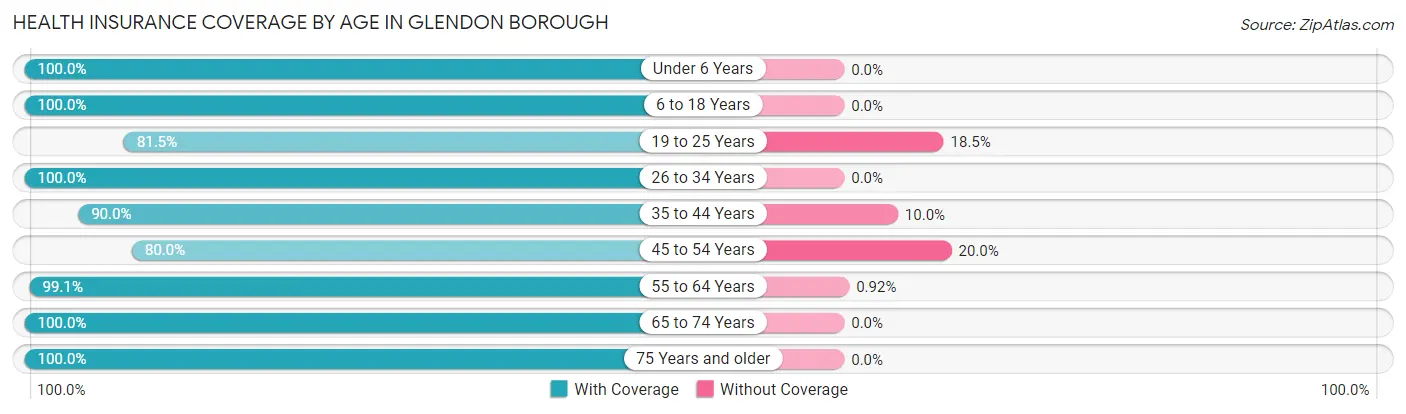
| Age Bracket | With Coverage | Without Coverage |
| Under 6 Years | 2 (100.0%) | 0 (0.0%) |
| 6 to 18 Years | 41 (100.0%) | 0 (0.0%) |
| 19 to 25 Years | 22 (81.5%) | 5 (18.5%) |
| 26 to 34 Years | 50 (100.0%) | 0 (0.0%) |
| 35 to 44 Years | 36 (90.0%) | 4 (10.0%) |
| 45 to 54 Years | 28 (80.0%) | 7 (20.0%) |
| 55 to 64 Years | 108 (99.1%) | 1 (0.9%) |
| 65 to 74 Years | 52 (100.0%) | 0 (0.0%) |
| 75 Years and older | 28 (100.0%) | 0 (0.0%) |
| Total | 367 (95.6%) | 17 (4.4%) |
Health Insurance Coverage by Citizenship Status in Glendon borough
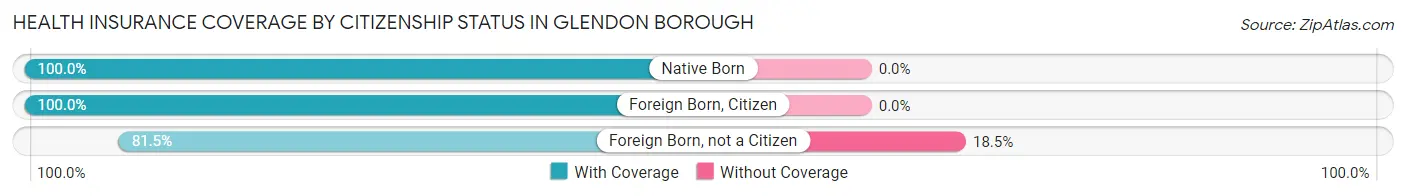
| Citizenship Status | With Coverage | Without Coverage |
| Native Born | 2 (100.0%) | 0 (0.0%) |
| Foreign Born, Citizen | 41 (100.0%) | 0 (0.0%) |
| Foreign Born, not a Citizen | 22 (81.5%) | 5 (18.5%) |
Health Insurance Coverage by Household Income in Glendon borough
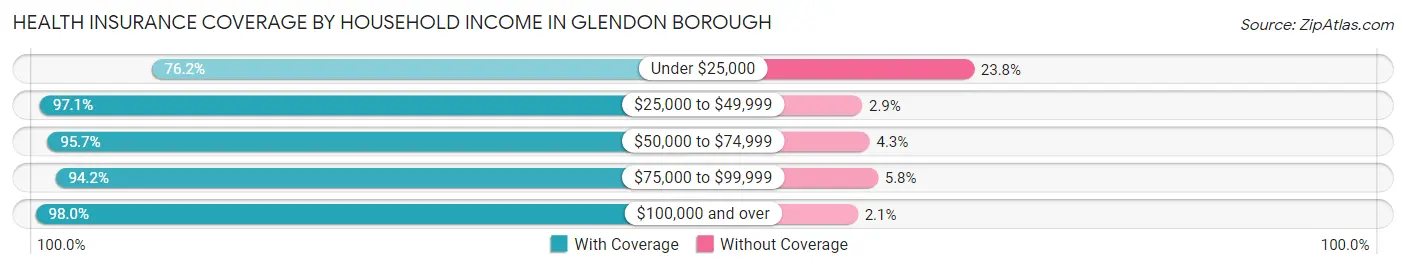
| Household Income | With Coverage | Without Coverage |
| Under $25,000 | 16 (76.2%) | 5 (23.8%) |
| $25,000 to $49,999 | 34 (97.1%) | 1 (2.9%) |
| $50,000 to $74,999 | 45 (95.7%) | 2 (4.3%) |
| $75,000 to $99,999 | 81 (94.2%) | 5 (5.8%) |
| $100,000 and over | 191 (98.0%) | 4 (2.1%) |
Public vs Private Health Insurance Coverage by Age in Glendon borough
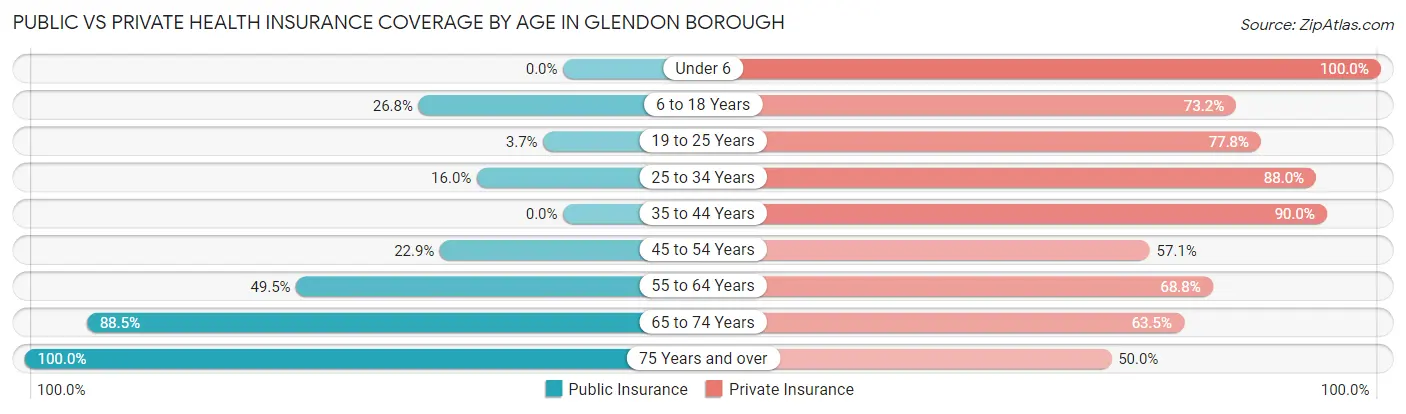
| Age Bracket | Public Insurance | Private Insurance |
| Under 6 | 0 (0.0%) | 2 (100.0%) |
| 6 to 18 Years | 11 (26.8%) | 30 (73.2%) |
| 19 to 25 Years | 1 (3.7%) | 21 (77.8%) |
| 25 to 34 Years | 8 (16.0%) | 44 (88.0%) |
| 35 to 44 Years | 0 (0.0%) | 36 (90.0%) |
| 45 to 54 Years | 8 (22.9%) | 20 (57.1%) |
| 55 to 64 Years | 54 (49.5%) | 75 (68.8%) |
| 65 to 74 Years | 46 (88.5%) | 33 (63.5%) |
| 75 Years and over | 28 (100.0%) | 14 (50.0%) |
| Total | 156 (40.6%) | 275 (71.6%) |
Disability Status by Sex by Age in Glendon borough
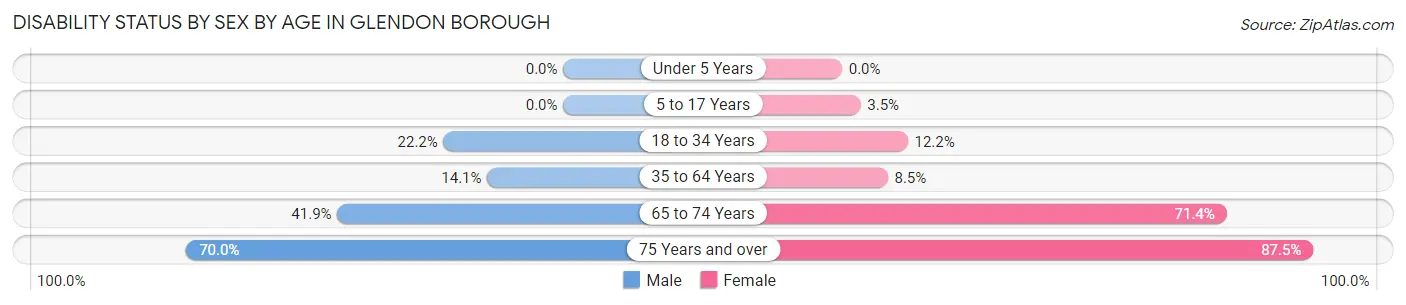
| Age Bracket | Male | Female |
| Under 5 Years | 0 (0.0%) | 0 (0.0%) |
| 5 to 17 Years | 0 (0.0%) | 1 (3.5%) |
| 18 to 34 Years | 8 (22.2%) | 5 (12.2%) |
| 35 to 64 Years | 11 (14.1%) | 9 (8.5%) |
| 65 to 74 Years | 13 (41.9%) | 15 (71.4%) |
| 75 Years and over | 14 (70.0%) | 7 (87.5%) |
Disability Class by Sex by Age in Glendon borough
Disability Class: Hearing Difficulty
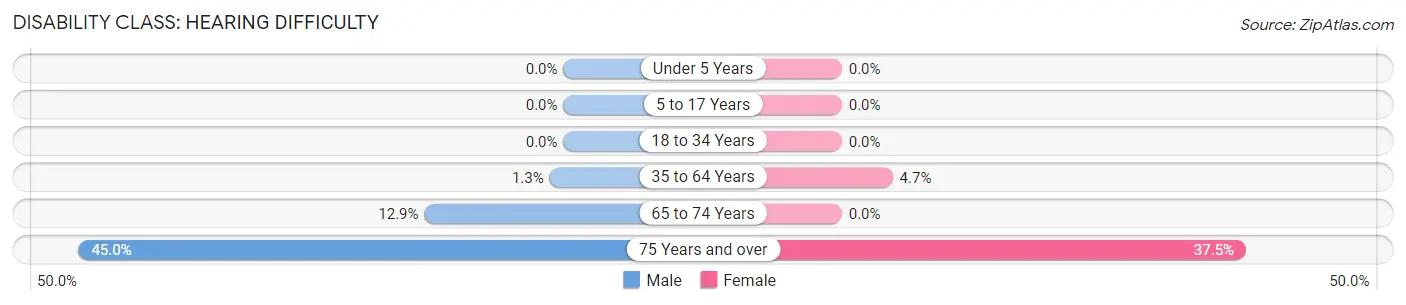
| Age Bracket | Male | Female |
| Under 5 Years | 0 (0.0%) | 0 (0.0%) |
| 5 to 17 Years | 0 (0.0%) | 0 (0.0%) |
| 18 to 34 Years | 0 (0.0%) | 0 (0.0%) |
| 35 to 64 Years | 1 (1.3%) | 5 (4.7%) |
| 65 to 74 Years | 4 (12.9%) | 0 (0.0%) |
| 75 Years and over | 9 (45.0%) | 3 (37.5%) |
Disability Class: Vision Difficulty
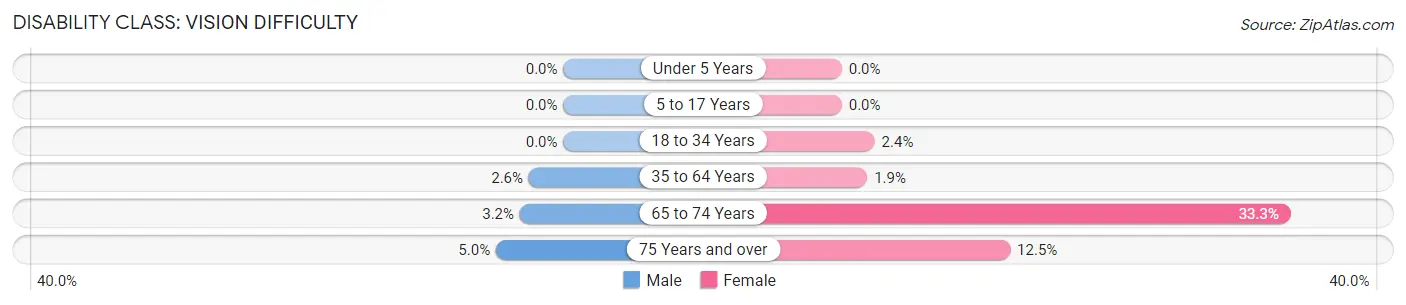
| Age Bracket | Male | Female |
| Under 5 Years | 0 (0.0%) | 0 (0.0%) |
| 5 to 17 Years | 0 (0.0%) | 0 (0.0%) |
| 18 to 34 Years | 0 (0.0%) | 1 (2.4%) |
| 35 to 64 Years | 2 (2.6%) | 2 (1.9%) |
| 65 to 74 Years | 1 (3.2%) | 7 (33.3%) |
| 75 Years and over | 1 (5.0%) | 1 (12.5%) |
Disability Class: Cognitive Difficulty
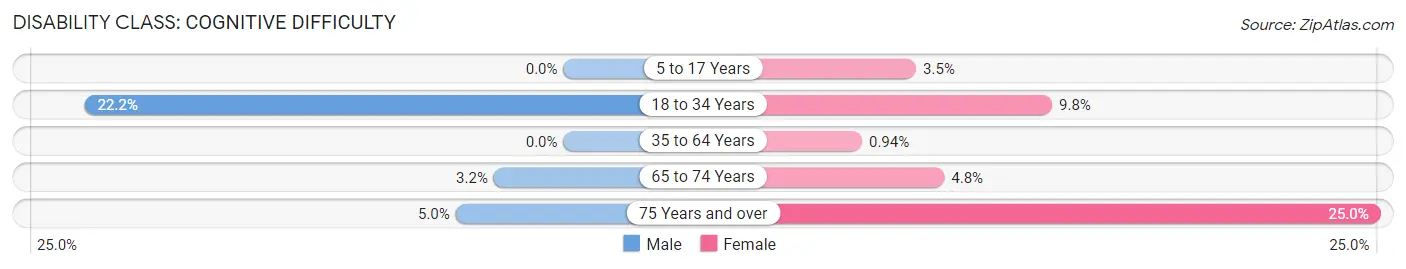
| Age Bracket | Male | Female |
| 5 to 17 Years | 0 (0.0%) | 1 (3.5%) |
| 18 to 34 Years | 8 (22.2%) | 4 (9.8%) |
| 35 to 64 Years | 0 (0.0%) | 1 (0.9%) |
| 65 to 74 Years | 1 (3.2%) | 1 (4.8%) |
| 75 Years and over | 1 (5.0%) | 2 (25.0%) |
Disability Class: Ambulatory Difficulty
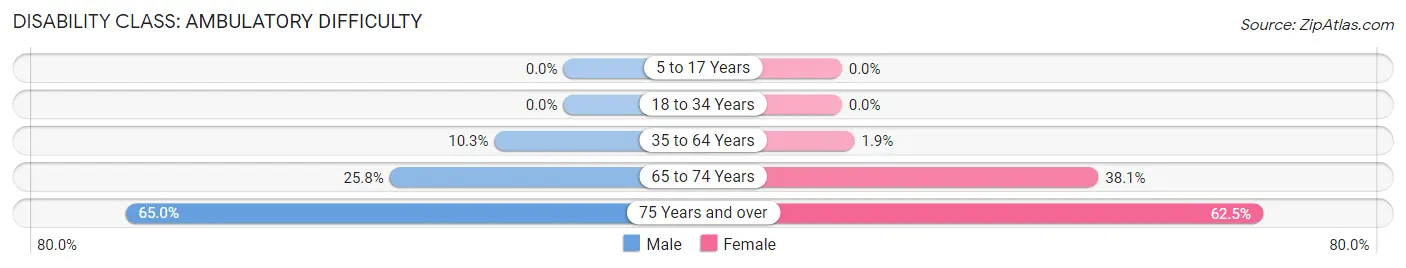
| Age Bracket | Male | Female |
| 5 to 17 Years | 0 (0.0%) | 0 (0.0%) |
| 18 to 34 Years | 0 (0.0%) | 0 (0.0%) |
| 35 to 64 Years | 8 (10.3%) | 2 (1.9%) |
| 65 to 74 Years | 8 (25.8%) | 8 (38.1%) |
| 75 Years and over | 13 (65.0%) | 5 (62.5%) |
Disability Class: Self-Care Difficulty
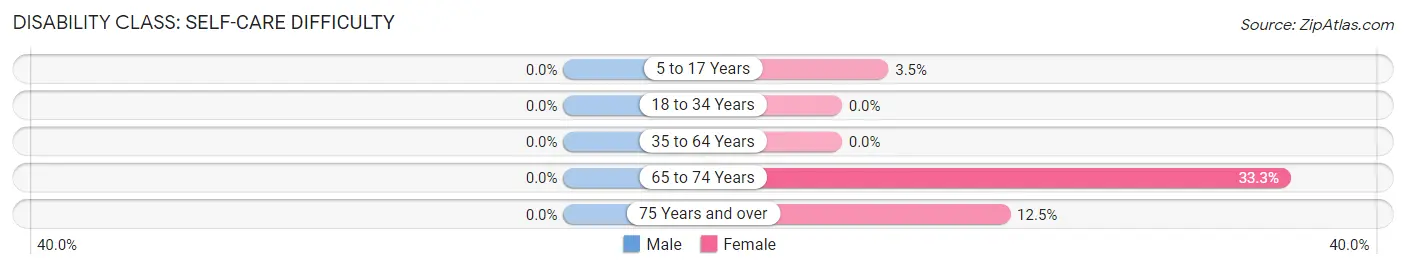
| Age Bracket | Male | Female |
| 5 to 17 Years | 0 (0.0%) | 1 (3.5%) |
| 18 to 34 Years | 0 (0.0%) | 0 (0.0%) |
| 35 to 64 Years | 0 (0.0%) | 0 (0.0%) |
| 65 to 74 Years | 0 (0.0%) | 7 (33.3%) |
| 75 Years and over | 0 (0.0%) | 1 (12.5%) |
Technology Access in Glendon borough
Computing Device Access in Glendon borough
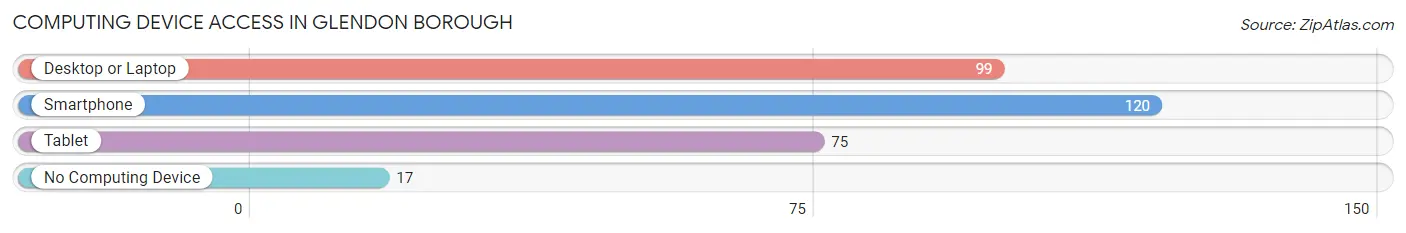
| Device Type | # Households | % Households |
| Desktop or Laptop | 99 | 66.4% |
| Smartphone | 120 | 80.5% |
| Tablet | 75 | 50.3% |
| No Computing Device | 17 | 11.4% |
| Total | 149 | 100.0% |
Internet Access in Glendon borough
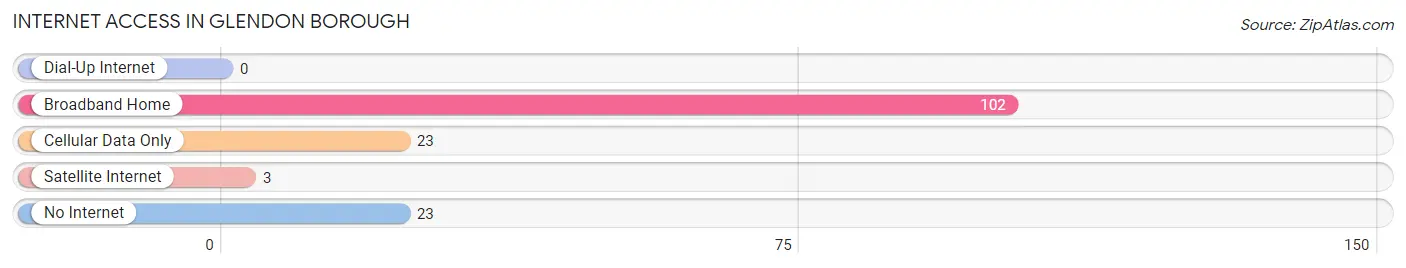
| Internet Type | # Households | % Households |
| Dial-Up Internet | 0 | 0.0% |
| Broadband Home | 102 | 68.5% |
| Cellular Data Only | 23 | 15.4% |
| Satellite Internet | 3 | 2.0% |
| No Internet | 23 | 15.4% |
| Total | 149 | 100.0% |
Glendon borough Summary
Glendon Borough is a small borough located in Northampton County, Pennsylvania. It is situated in the Lehigh Valley region of the state, and is part of the Easton Metropolitan Statistical Area. The borough has a population of 1,845 as of the 2010 census, and is home to a variety of businesses, including a small industrial park.
History
Glendon Borough was founded in 1867, when a group of local farmers petitioned the Northampton County Court to incorporate the area. The borough was named after Glendon, a small village in England. The first mayor of Glendon was William H. Kline, who served from 1867 to 1871.
The borough was originally a rural farming community, but in the early 20th century, it began to experience rapid growth due to the development of the nearby Lehigh Valley Railroad. This allowed for the transportation of goods and people to and from the borough, and helped to spur the growth of local businesses.
Geography
Glendon Borough is located in Northampton County, Pennsylvania, in the Lehigh Valley region of the state. It is situated along the Lehigh River, and is bordered by the boroughs of Easton, Wilson, and West Easton. The borough has a total area of 0.7 square miles, all of which is land.
The borough is located in a hilly region, with elevations ranging from 500 to 800 feet above sea level. The climate is humid continental, with hot summers and cold winters. The average annual temperature is around 50 degrees Fahrenheit, and the average annual precipitation is around 40 inches.
Economy
Glendon Borough has a diverse economy, with a variety of businesses located in the area. The largest employer in the borough is the Lehigh Valley Railroad, which employs over 1,000 people. Other major employers include the Glendon Industrial Park, which is home to a variety of manufacturing and industrial businesses, and the Glendon Shopping Center, which is home to a variety of retail stores.
The borough also has a number of small businesses, including restaurants, bars, and other retail stores. The borough is also home to a number of professional services, such as lawyers, accountants, and doctors.
Demographics
As of the 2010 census, Glendon Borough had a population of 1,845. The racial makeup of the borough was 94.3% White, 2.2% African American, 0.3% Native American, 0.7% Asian, 0.1% Pacific Islander, and 2.4% from other races. Hispanic or Latino of any race were 3.2% of the population.
The median household income in Glendon Borough was $45,938, and the median family income was $54,938. The per capita income was $21,938. About 8.3% of families and 10.2% of the population were below the poverty line, including 14.2% of those under age 18 and 5.2% of those age 65 or over.
Common Questions
What is Per Capita Income in Glendon borough?
Per Capita income in Glendon borough is $43,265.
What is the Median Family Income in Glendon borough?
Median Family Income in Glendon borough is $105,208.
What is the Median Household income in Glendon borough?
Median Household Income in Glendon borough is $91,250.
What is Income or Wage Gap in Glendon borough?
Income or Wage Gap in Glendon borough is 30.6%.
Women in Glendon borough earn 69.4 cents for every dollar earned by a man.
What is Inequality or Gini Index in Glendon borough?
Inequality or Gini Index in Glendon borough is 0.42.
What is the Total Population of Glendon borough?
Total Population of Glendon borough is 384.
What is the Total Male Population of Glendon borough?
Total Male Population of Glendon borough is 179.
What is the Total Female Population of Glendon borough?
Total Female Population of Glendon borough is 205.
What is the Ratio of Males per 100 Females in Glendon borough?
There are 87.32 Males per 100 Females in Glendon borough.
What is the Ratio of Females per 100 Males in Glendon borough?
There are 114.53 Females per 100 Males in Glendon borough.
What is the Median Population Age in Glendon borough?
Median Population Age in Glendon borough is 53.6 Years.
What is the Average Family Size in Glendon borough
Average Family Size in Glendon borough is 2.9 People.
What is the Average Household Size in Glendon borough
Average Household Size in Glendon borough is 2.6 People.
How Large is the Labor Force in Glendon borough?
There are 219 People in the Labor Forcein in Glendon borough.
What is the Percentage of People in the Labor Force in Glendon borough?
63.8% of People are in the Labor Force in Glendon borough.
What is the Unemployment Rate in Glendon borough?
Unemployment Rate in Glendon borough is 5.5%.