Mount Gretna borough, PA Map & Demographics
Mount Gretna borough Overview
$72,213
PER CAPITA INCOME
$106,875
AVG FAMILY INCOME
$105,313
AVG HOUSEHOLD INCOME
10.2%
WAGE / INCOME GAP [ % ]
89.8¢/ $1
WAGE / INCOME GAP [ $ ]
0.43
INEQUALITY / GINI INDEX
197
TOTAL POPULATION
101
MALE POPULATION
96
FEMALE POPULATION
105.21
MALES / 100 FEMALES
95.05
FEMALES / 100 MALES
67.2
MEDIAN AGE
2.5
AVG FAMILY SIZE
2.2
AVG HOUSEHOLD SIZE
71
LABOR FORCE [ PEOPLE ]
40.1%
PERCENT IN LABOR FORCE
Income in Mount Gretna borough
Income Overview in Mount Gretna borough
Per Capita Income in Mount Gretna borough is $72,213, while median incomes of families and households are $106,875 and $105,313 respectively.
| Characteristic | Number | Measure |
| Per Capita Income | 197 | $72,213 |
| Median Family Income | 66 | $106,875 |
| Mean Family Income | 66 | $157,303 |
| Median Household Income | 91 | $105,313 |
| Mean Household Income | 91 | $148,976 |
| Income Deficit | 66 | $0 |
| Wage / Income Gap (%) | 197 | 10.19% |
| Wage / Income Gap ($) | 197 | 89.81¢ per $1 |
| Gini / Inequality Index | 197 | 0.43 |
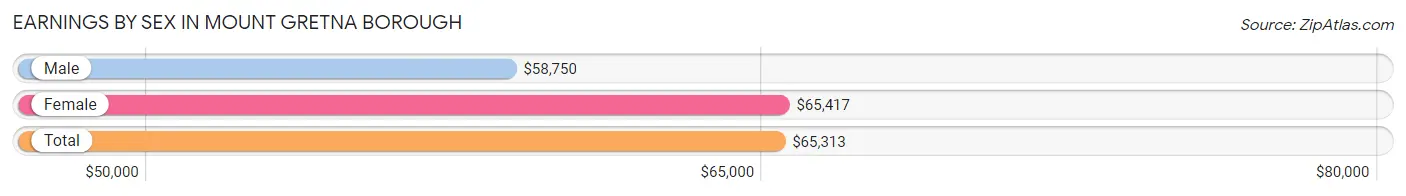
Earnings by Sex in Mount Gretna borough
Average Earnings in Mount Gretna borough are $65,313, $58,750 for men and $65,417 for women, a difference of 10.2%.
| Sex | Number | Average Earnings |
| Male | 52 (55.9%) | $58,750 |
| Female | 41 (44.1%) | $65,417 |
| Total | 93 (100.0%) | $65,313 |
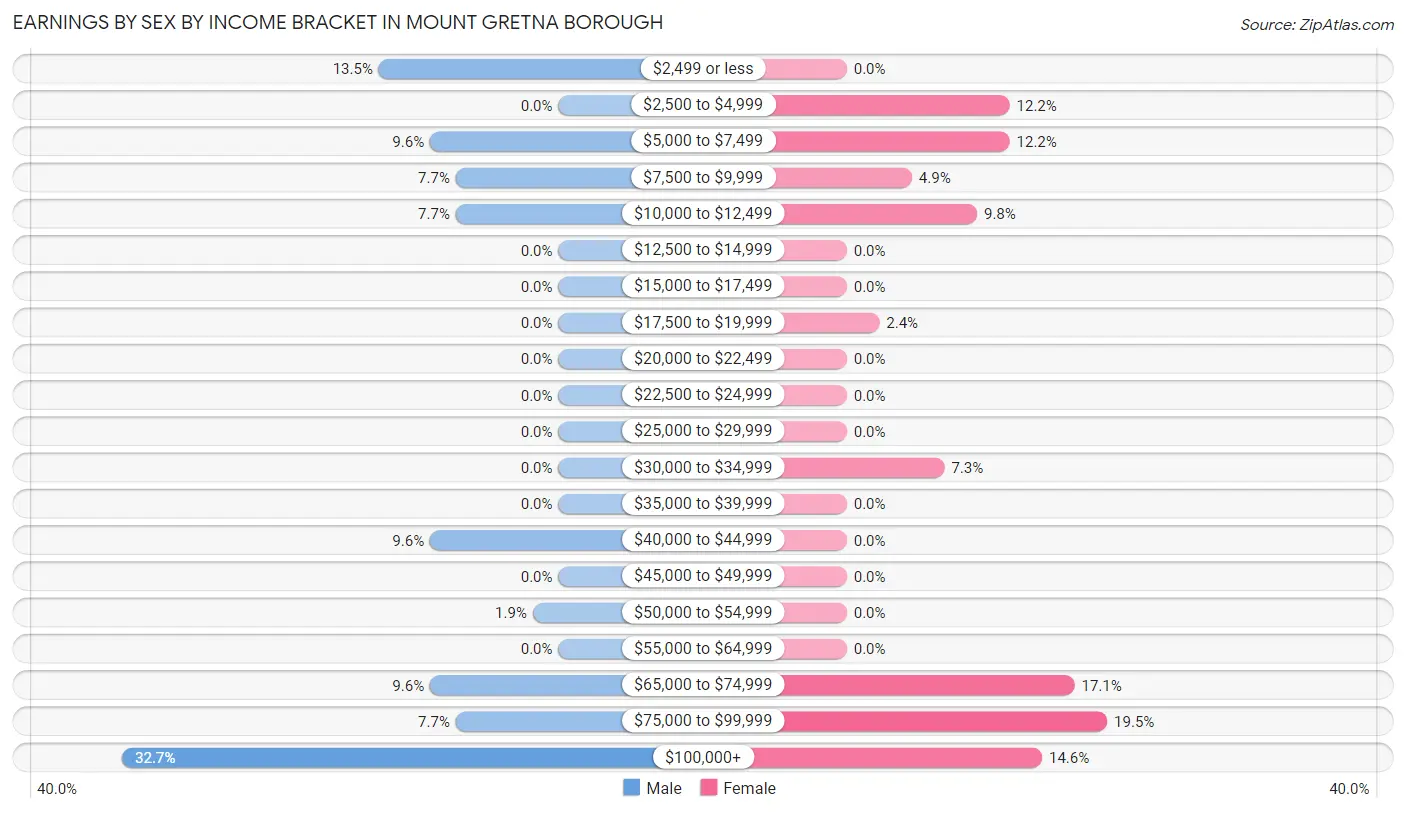
Earnings by Sex by Income Bracket in Mount Gretna borough
The most common earnings brackets in Mount Gretna borough are $100,000+ for men (17 | 32.7%) and $75,000 to $99,999 for women (8 | 19.5%).
| Income | Male | Female |
| $2,499 or less | 7 (13.5%) | 0 (0.0%) |
| $2,500 to $4,999 | 0 (0.0%) | 5 (12.2%) |
| $5,000 to $7,499 | 5 (9.6%) | 5 (12.2%) |
| $7,500 to $9,999 | 4 (7.7%) | 2 (4.9%) |
| $10,000 to $12,499 | 4 (7.7%) | 4 (9.8%) |
| $12,500 to $14,999 | 0 (0.0%) | 0 (0.0%) |
| $15,000 to $17,499 | 0 (0.0%) | 0 (0.0%) |
| $17,500 to $19,999 | 0 (0.0%) | 1 (2.4%) |
| $20,000 to $22,499 | 0 (0.0%) | 0 (0.0%) |
| $22,500 to $24,999 | 0 (0.0%) | 0 (0.0%) |
| $25,000 to $29,999 | 0 (0.0%) | 0 (0.0%) |
| $30,000 to $34,999 | 0 (0.0%) | 3 (7.3%) |
| $35,000 to $39,999 | 0 (0.0%) | 0 (0.0%) |
| $40,000 to $44,999 | 5 (9.6%) | 0 (0.0%) |
| $45,000 to $49,999 | 0 (0.0%) | 0 (0.0%) |
| $50,000 to $54,999 | 1 (1.9%) | 0 (0.0%) |
| $55,000 to $64,999 | 0 (0.0%) | 0 (0.0%) |
| $65,000 to $74,999 | 5 (9.6%) | 7 (17.1%) |
| $75,000 to $99,999 | 4 (7.7%) | 8 (19.5%) |
| $100,000+ | 17 (32.7%) | 6 (14.6%) |
| Total | 52 (100.0%) | 41 (100.0%) |
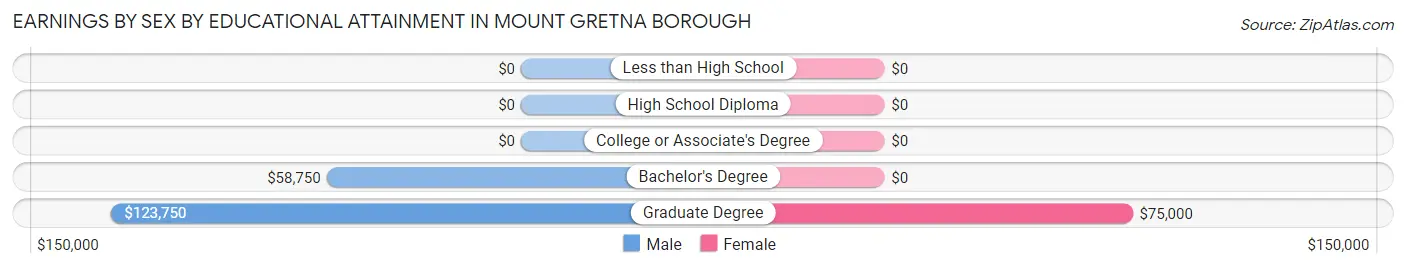
Earnings by Sex by Educational Attainment in Mount Gretna borough
Average earnings in Mount Gretna borough are $58,750 for men and $65,417 for women, a difference of 10.2%. Men with an educational attainment of graduate degree enjoy the highest average annual earnings of $123,750, while those with bachelor's degree education earn the least with $58,750. Women with an educational attainment of graduate degree earn the most with the average annual earnings of $75,000, while those with graduate degree education have the smallest earnings of $75,000.
| Educational Attainment | Male Income | Female Income |
| Less than High School | - | - |
| High School Diploma | - | - |
| College or Associate's Degree | - | - |
| Bachelor's Degree | $58,750 | $0 |
| Graduate Degree | $123,750 | $75,000 |
| Total | $58,750 | $65,417 |
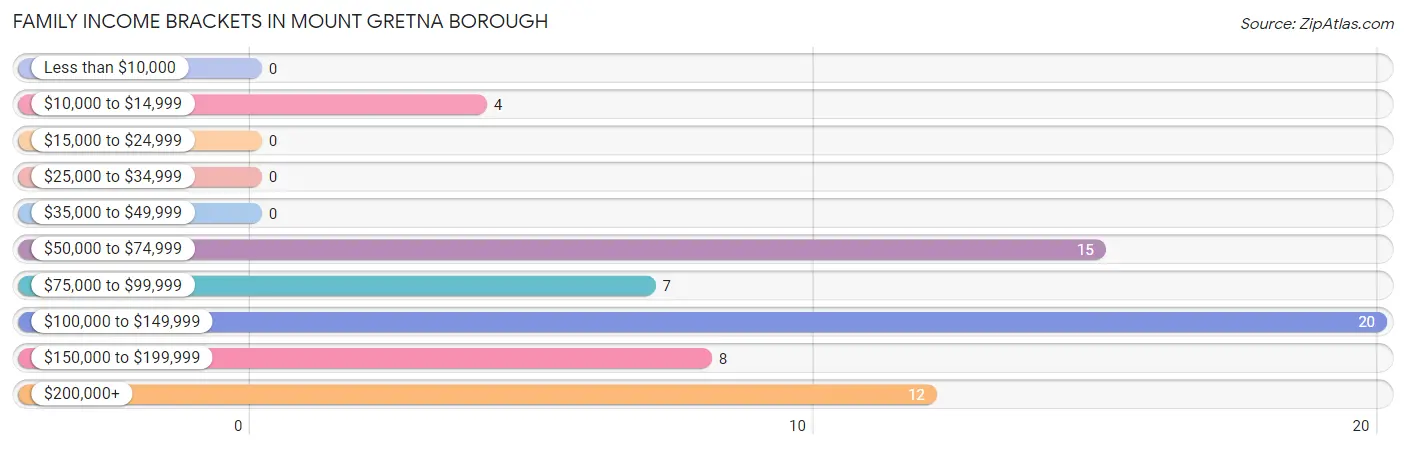
Family Income in Mount Gretna borough
Family Income Brackets in Mount Gretna borough
According to the Mount Gretna borough family income data, there are 20 families falling into the $100,000 to $149,999 income range, which is the most common income bracket and makes up 30.3% of all families.
| Income Bracket | # Families | % Families |
| Less than $10,000 | 0 | 0.0% |
| $10,000 to $14,999 | 4 | 6.1% |
| $15,000 to $24,999 | 0 | 0.0% |
| $25,000 to $34,999 | 0 | 0.0% |
| $35,000 to $49,999 | 0 | 0.0% |
| $50,000 to $74,999 | 15 | 22.7% |
| $75,000 to $99,999 | 7 | 10.6% |
| $100,000 to $149,999 | 20 | 30.3% |
| $150,000 to $199,999 | 8 | 12.1% |
| $200,000+ | 12 | 18.2% |
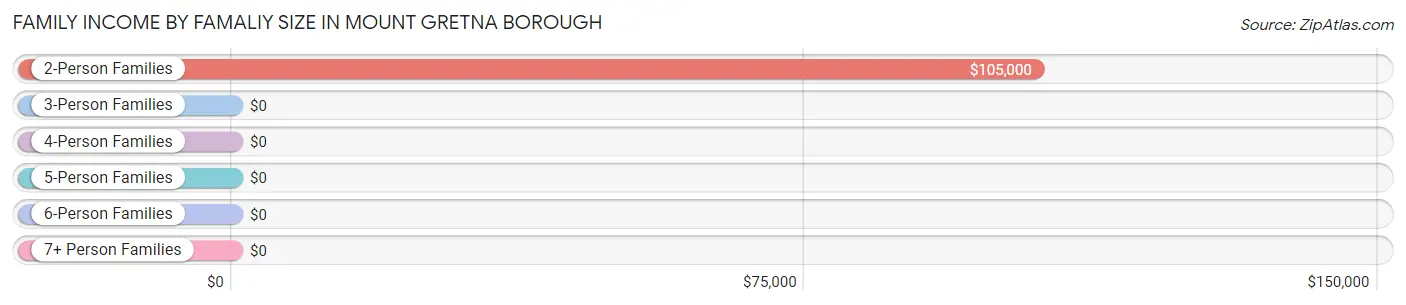
Family Income by Famaliy Size in Mount Gretna borough
2-person families (52 | 78.8%) account for the highest median family income in Mount Gretna borough with $105,000 per family, while 2-person families (52 | 78.8%) have the highest median income of $52,500 per family member.
| Income Bracket | # Families | Median Income |
| 2-Person Families | 52 (78.8%) | $105,000 |
| 3-Person Families | 10 (15.1%) | $0 |
| 4-Person Families | 3 (4.5%) | $0 |
| 5-Person Families | 1 (1.5%) | $0 |
| 6-Person Families | 0 (0.0%) | $0 |
| 7+ Person Families | 0 (0.0%) | $0 |
| Total | 66 (100.0%) | $106,875 |
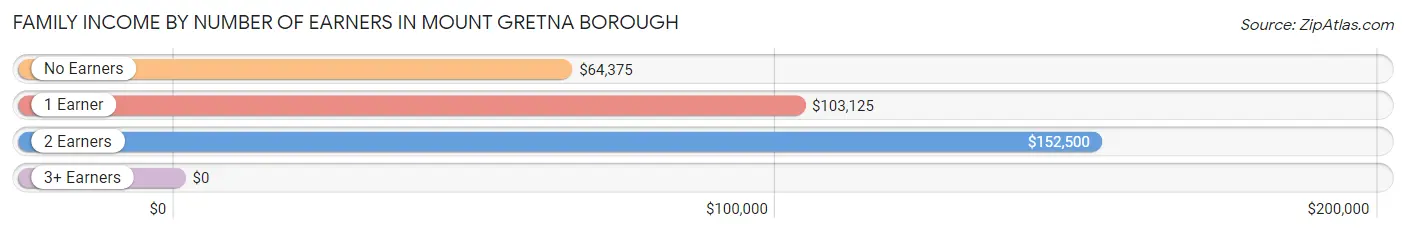
Family Income by Number of Earners in Mount Gretna borough
| Number of Earners | # Families | Median Income |
| No Earners | 22 (33.3%) | $64,375 |
| 1 Earner | 20 (30.3%) | $103,125 |
| 2 Earners | 24 (36.4%) | $152,500 |
| 3+ Earners | 0 (0.0%) | $0 |
| Total | 66 (100.0%) | $106,875 |
Household Income in Mount Gretna borough
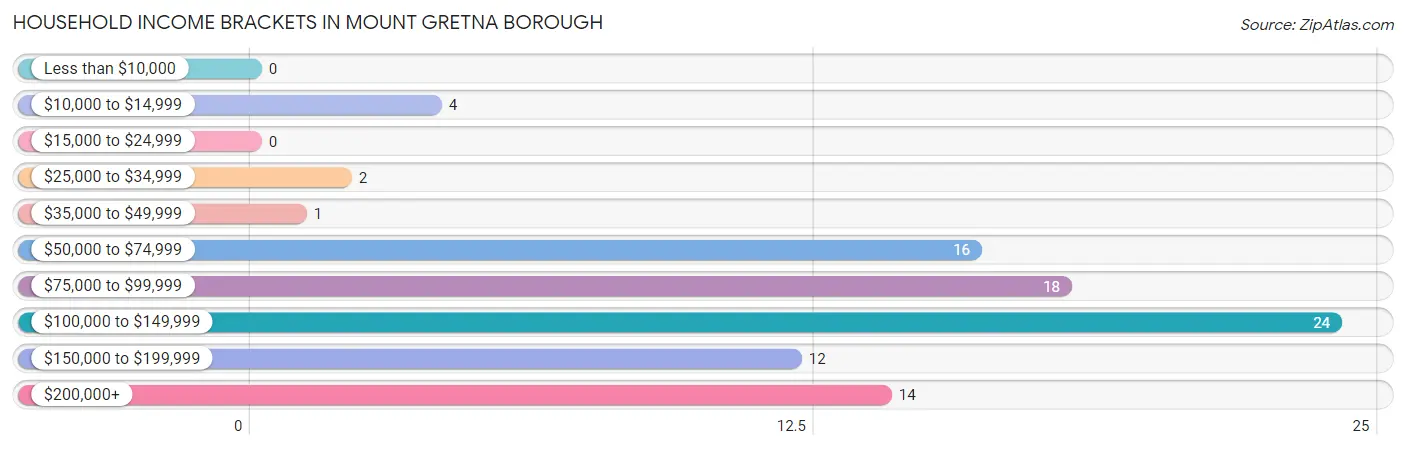
Household Income Brackets in Mount Gretna borough
With 24 households falling in the category, the $100,000 to $149,999 income range is the most frequent in Mount Gretna borough, accounting for 26.4% of all households.
| Income Bracket | # Households | % Households |
| Less than $10,000 | 0 | 0.0% |
| $10,000 to $14,999 | 4 | 4.4% |
| $15,000 to $24,999 | 0 | 0.0% |
| $25,000 to $34,999 | 2 | 2.2% |
| $35,000 to $49,999 | 1 | 1.1% |
| $50,000 to $74,999 | 16 | 17.6% |
| $75,000 to $99,999 | 18 | 19.8% |
| $100,000 to $149,999 | 24 | 26.4% |
| $150,000 to $199,999 | 12 | 13.2% |
| $200,000+ | 14 | 15.4% |
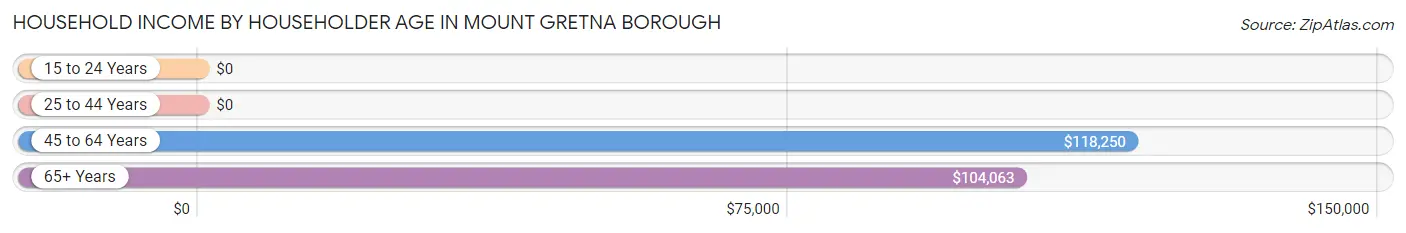
Household Income by Householder Age in Mount Gretna borough
The median household income in Mount Gretna borough is $105,313, with the highest median household income of $118,250 found in the 45 to 64 years age bracket for the primary householder. A total of 33 households (36.3%) fall into this category.
| Income Bracket | # Households | Median Income |
| 15 to 24 Years | 0 (0.0%) | $0 |
| 25 to 44 Years | 1 (1.1%) | $0 |
| 45 to 64 Years | 33 (36.3%) | $118,250 |
| 65+ Years | 57 (62.6%) | $104,063 |
| Total | 91 (100.0%) | $105,313 |
Poverty in Mount Gretna borough
Income Below Poverty by Sex and Age in Mount Gretna borough
With 7.9% poverty level for males and 4.2% for females among the residents of Mount Gretna borough, 12 to 14 year old males and 12 to 14 year old females are the most vulnerable to poverty, with 4 males (66.7%) and 4 females (80.0%) in their respective age groups living below the poverty level.
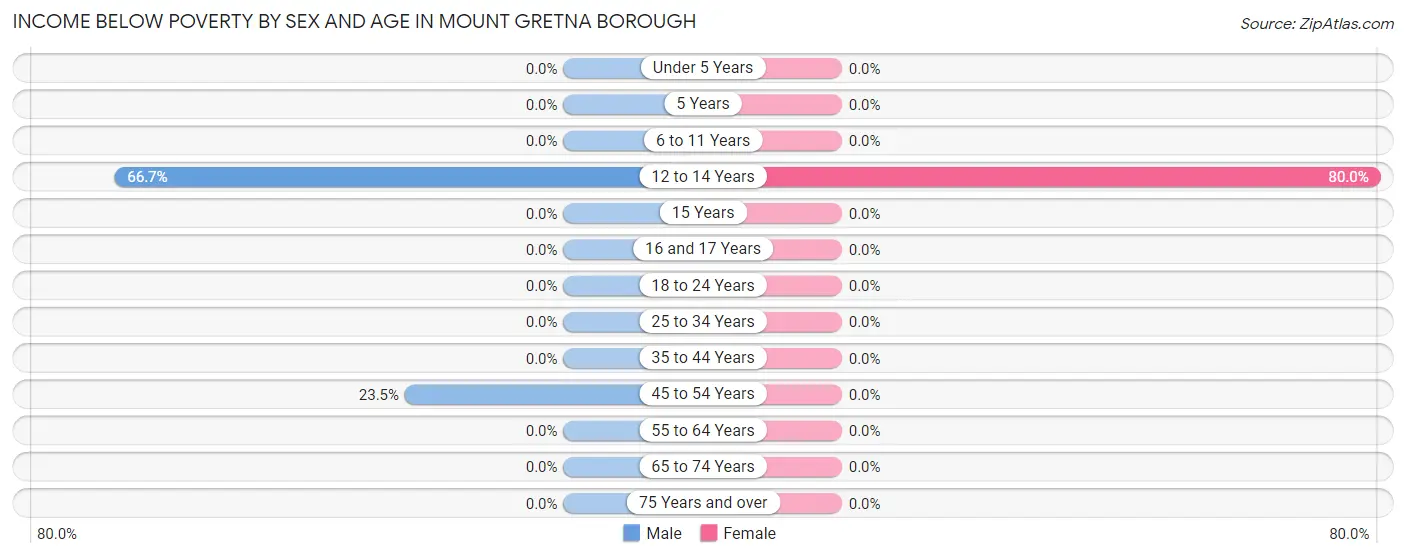
| Age Bracket | Male | Female |
| Under 5 Years | 0 (0.0%) | 0 (0.0%) |
| 5 Years | 0 (0.0%) | 0 (0.0%) |
| 6 to 11 Years | 0 (0.0%) | 0 (0.0%) |
| 12 to 14 Years | 4 (66.7%) | 4 (80.0%) |
| 15 Years | 0 (0.0%) | 0 (0.0%) |
| 16 and 17 Years | 0 (0.0%) | 0 (0.0%) |
| 18 to 24 Years | 0 (0.0%) | 0 (0.0%) |
| 25 to 34 Years | 0 (0.0%) | 0 (0.0%) |
| 35 to 44 Years | 0 (0.0%) | 0 (0.0%) |
| 45 to 54 Years | 4 (23.5%) | 0 (0.0%) |
| 55 to 64 Years | 0 (0.0%) | 0 (0.0%) |
| 65 to 74 Years | 0 (0.0%) | 0 (0.0%) |
| 75 Years and over | 0 (0.0%) | 0 (0.0%) |
| Total | 8 (7.9%) | 4 (4.2%) |
Income Above Poverty by Sex and Age in Mount Gretna borough
According to the poverty statistics in Mount Gretna borough, males aged 5 years and females aged 6 to 11 years are the age groups that are most secure financially, with 100.0% of males and 100.0% of females in these age groups living above the poverty line.
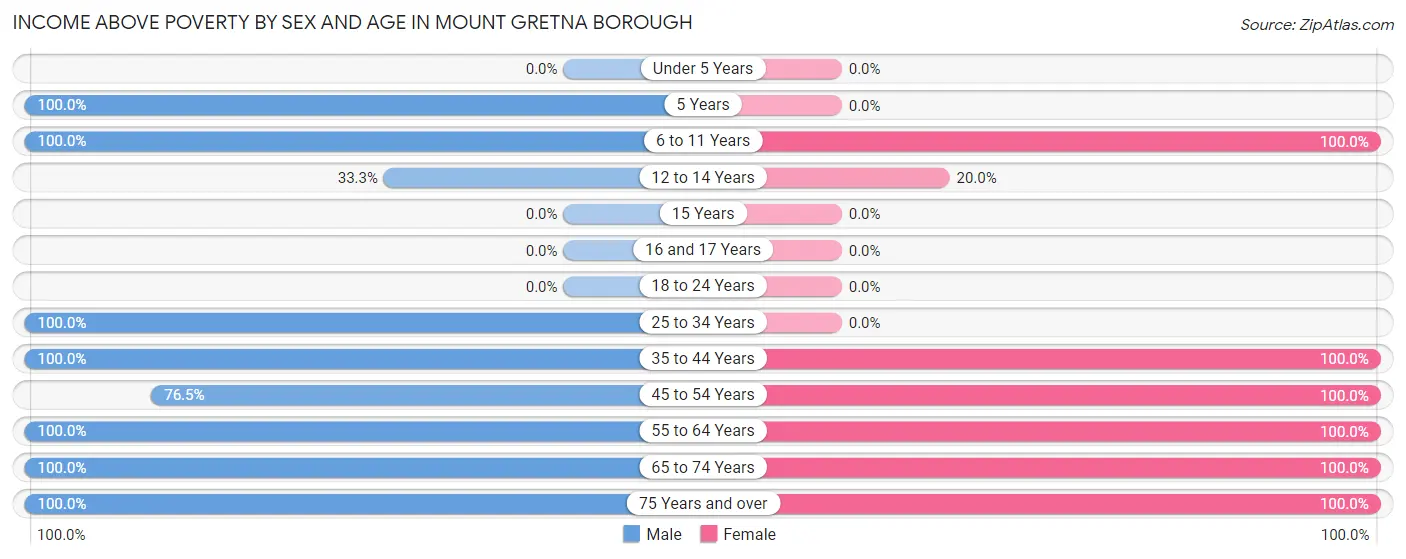
| Age Bracket | Male | Female |
| Under 5 Years | 0 (0.0%) | 0 (0.0%) |
| 5 Years | 4 (100.0%) | 0 (0.0%) |
| 6 to 11 Years | 1 (100.0%) | 4 (100.0%) |
| 12 to 14 Years | 2 (33.3%) | 1 (20.0%) |
| 15 Years | 0 (0.0%) | 0 (0.0%) |
| 16 and 17 Years | 0 (0.0%) | 0 (0.0%) |
| 18 to 24 Years | 0 (0.0%) | 0 (0.0%) |
| 25 to 34 Years | 7 (100.0%) | 0 (0.0%) |
| 35 to 44 Years | 1 (100.0%) | 3 (100.0%) |
| 45 to 54 Years | 13 (76.5%) | 4 (100.0%) |
| 55 to 64 Years | 18 (100.0%) | 20 (100.0%) |
| 65 to 74 Years | 25 (100.0%) | 46 (100.0%) |
| 75 Years and over | 22 (100.0%) | 14 (100.0%) |
| Total | 93 (92.1%) | 92 (95.8%) |
Income Below Poverty Among Married-Couple Families in Mount Gretna borough
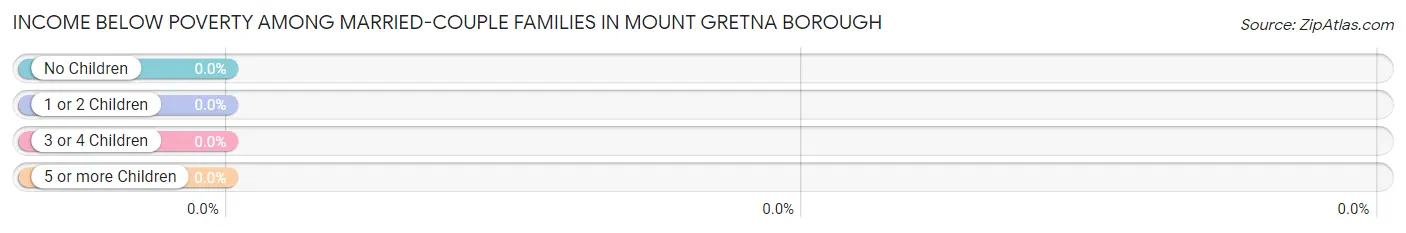
| Children | Above Poverty | Below Poverty |
| No Children | 57 (100.0%) | 0 (0.0%) |
| 1 or 2 Children | 3 (100.0%) | 0 (0.0%) |
| 3 or 4 Children | 1 (100.0%) | 0 (0.0%) |
| 5 or more Children | 0 (0.0%) | 0 (0.0%) |
| Total | 61 (100.0%) | 0 (0.0%) |
Income Below Poverty Among Single-Parent Households in Mount Gretna borough
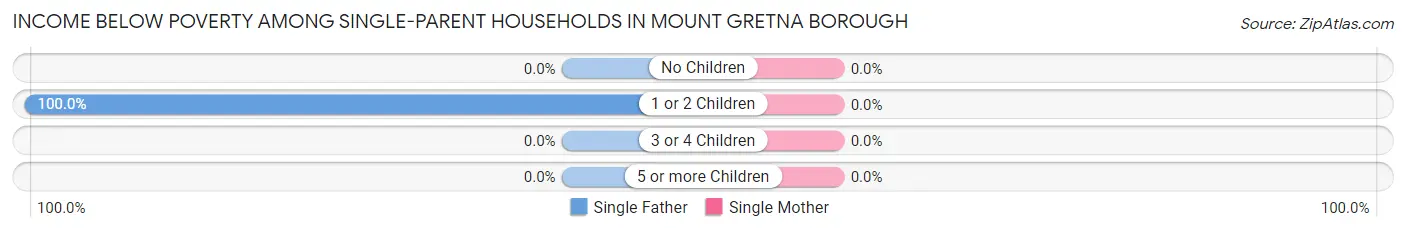
| Children | Single Father | Single Mother |
| No Children | 0 (0.0%) | 0 (0.0%) |
| 1 or 2 Children | 4 (100.0%) | 0 (0.0%) |
| 3 or 4 Children | 0 (0.0%) | 0 (0.0%) |
| 5 or more Children | 0 (0.0%) | 0 (0.0%) |
| Total | 4 (100.0%) | 0 (0.0%) |
Income Below Poverty Among Married-Couple vs Single-Parent Households in Mount Gretna borough
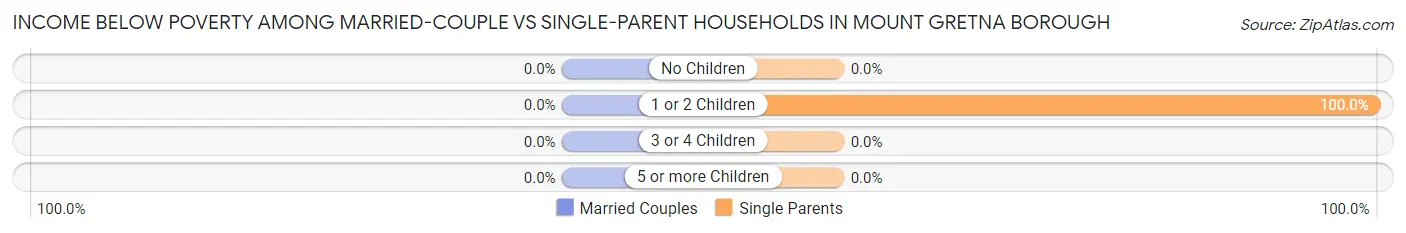
| Children | Married-Couple Families | Single-Parent Households |
| No Children | 0 (0.0%) | 0 (0.0%) |
| 1 or 2 Children | 0 (0.0%) | 4 (100.0%) |
| 3 or 4 Children | 0 (0.0%) | 0 (0.0%) |
| 5 or more Children | 0 (0.0%) | 0 (0.0%) |
| Total | 0 (0.0%) | 4 (80.0%) |
Race in Mount Gretna borough
The most populous races in Mount Gretna borough are White / Caucasian (196 | 99.5%), and Two or more Races (1 | 0.5%).
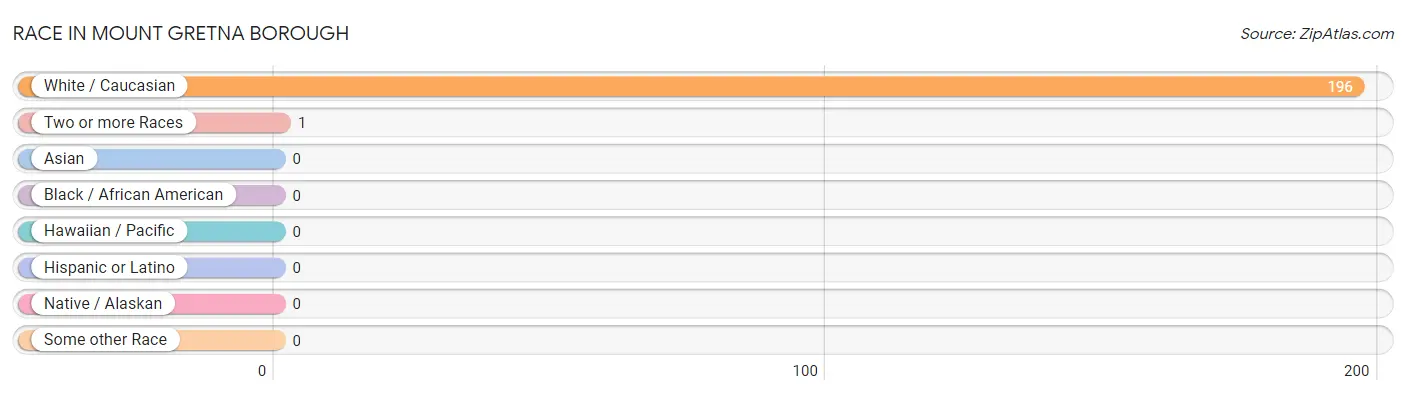
| Race | # Population | % Population |
| Asian | 0 | 0.0% |
| Black / African American | 0 | 0.0% |
| Hawaiian / Pacific | 0 | 0.0% |
| Hispanic or Latino | 0 | 0.0% |
| Native / Alaskan | 0 | 0.0% |
| White / Caucasian | 196 | 99.5% |
| Two or more Races | 1 | 0.5% |
| Some other Race | 0 | 0.0% |
| Total | 197 | 100.0% |
Ancestry in Mount Gretna borough
The most populous ancestries reported in Mount Gretna borough are German (98 | 49.7%), English (21 | 10.7%), Irish (21 | 10.7%), French (10 | 5.1%), and Polish (8 | 4.1%), together accounting for 80.2% of all Mount Gretna borough residents.
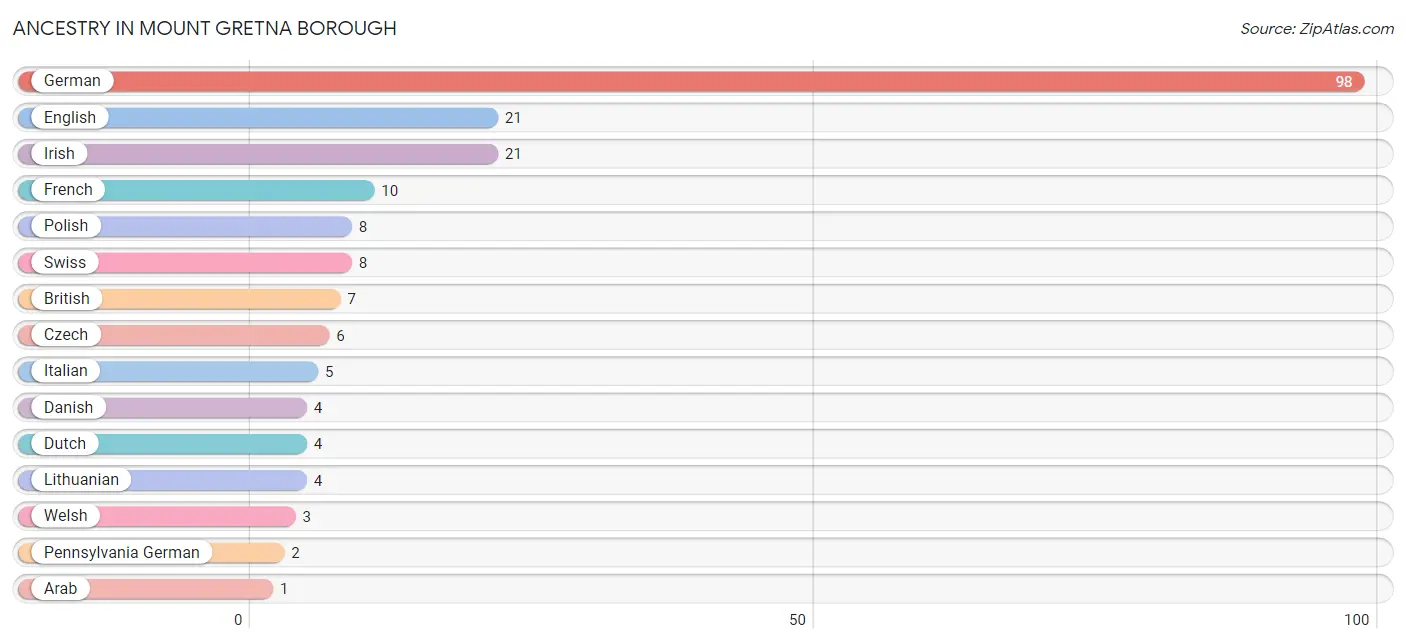
| Ancestry | # Population | % Population |
| Arab | 1 | 0.5% |
| British | 7 | 3.5% |
| Czech | 6 | 3.0% |
| Danish | 4 | 2.0% |
| Dutch | 4 | 2.0% |
| English | 21 | 10.7% |
| European | 1 | 0.5% |
| French | 10 | 5.1% |
| German | 98 | 49.7% |
| Irish | 21 | 10.7% |
| Italian | 5 | 2.5% |
| Lithuanian | 4 | 2.0% |
| Pennsylvania German | 2 | 1.0% |
| Polish | 8 | 4.1% |
| Scandinavian | 1 | 0.5% |
| Scottish | 1 | 0.5% |
| Swiss | 8 | 4.1% |
| Welsh | 3 | 1.5% | View All 18 Rows |
Immigrants in Mount Gretna borough
The most numerous immigrant groups reported in Mount Gretna borough came from Africa (5 | 2.5%), Eastern Africa (5 | 2.5%), Zimbabwe (5 | 2.5%), England (4 | 2.0%), and Europe (4 | 2.0%), together accounting for 11.7% of all Mount Gretna borough residents.
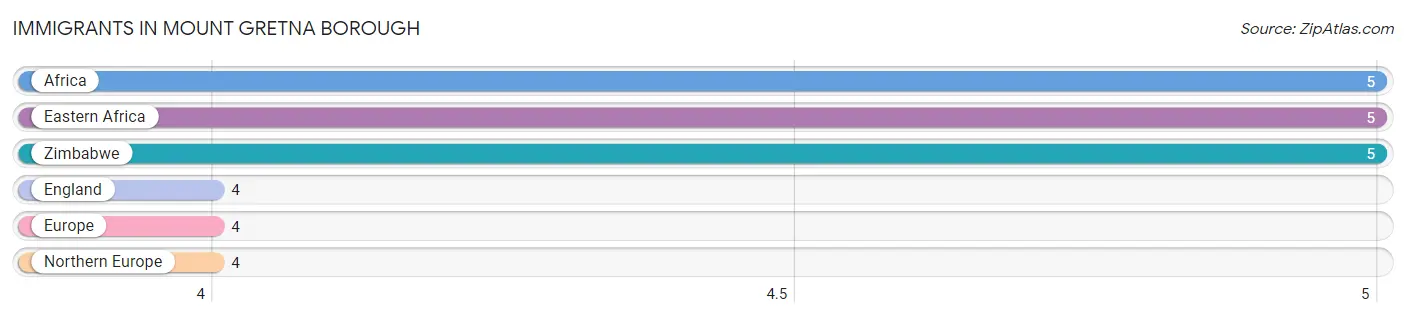
| Immigration Origin | # Population | % Population |
| Africa | 5 | 2.5% |
| Eastern Africa | 5 | 2.5% |
| England | 4 | 2.0% |
| Europe | 4 | 2.0% |
| Northern Europe | 4 | 2.0% |
| Zimbabwe | 5 | 2.5% | View All 6 Rows |
Sex and Age in Mount Gretna borough
Sex and Age in Mount Gretna borough
The most populous age groups in Mount Gretna borough are 70 to 74 Years (19 | 18.8%) for men and 65 to 69 Years (26 | 27.1%) for women.
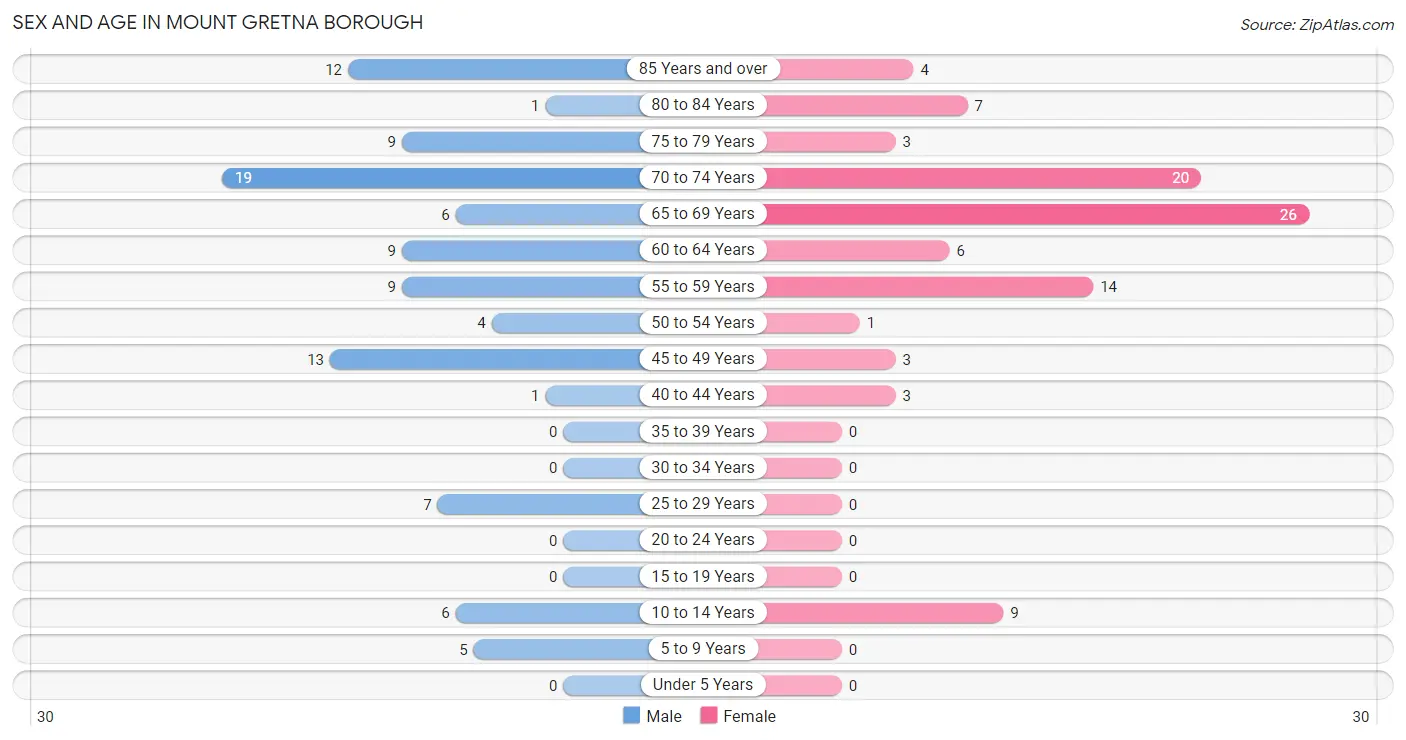
| Age Bracket | Male | Female |
| Under 5 Years | 0 (0.0%) | 0 (0.0%) |
| 5 to 9 Years | 5 (5.0%) | 0 (0.0%) |
| 10 to 14 Years | 6 (5.9%) | 9 (9.4%) |
| 15 to 19 Years | 0 (0.0%) | 0 (0.0%) |
| 20 to 24 Years | 0 (0.0%) | 0 (0.0%) |
| 25 to 29 Years | 7 (6.9%) | 0 (0.0%) |
| 30 to 34 Years | 0 (0.0%) | 0 (0.0%) |
| 35 to 39 Years | 0 (0.0%) | 0 (0.0%) |
| 40 to 44 Years | 1 (1.0%) | 3 (3.1%) |
| 45 to 49 Years | 13 (12.9%) | 3 (3.1%) |
| 50 to 54 Years | 4 (4.0%) | 1 (1.0%) |
| 55 to 59 Years | 9 (8.9%) | 14 (14.6%) |
| 60 to 64 Years | 9 (8.9%) | 6 (6.2%) |
| 65 to 69 Years | 6 (5.9%) | 26 (27.1%) |
| 70 to 74 Years | 19 (18.8%) | 20 (20.8%) |
| 75 to 79 Years | 9 (8.9%) | 3 (3.1%) |
| 80 to 84 Years | 1 (1.0%) | 7 (7.3%) |
| 85 Years and over | 12 (11.9%) | 4 (4.2%) |
| Total | 101 (100.0%) | 96 (100.0%) |
Families and Households in Mount Gretna borough
Median Family Size in Mount Gretna borough
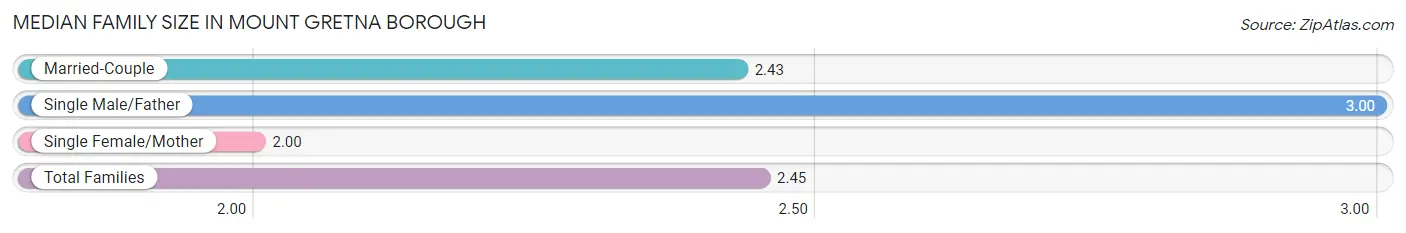
The median family size in Mount Gretna borough is 2.45 persons per family, with single male/father families (4 | 6.1%) accounting for the largest median family size of 3 persons per family. On the other hand, single female/mother families (1 | 1.5%) represent the smallest median family size with 2.00 persons per family.
| Family Type | # Families | Family Size |
| Married-Couple | 61 (92.4%) | 2.43 |
| Single Male/Father | 4 (6.1%) | 3.00 |
| Single Female/Mother | 1 (1.5%) | 2.00 |
| Total Families | 66 (100.0%) | 2.45 |
Median Household Size in Mount Gretna borough
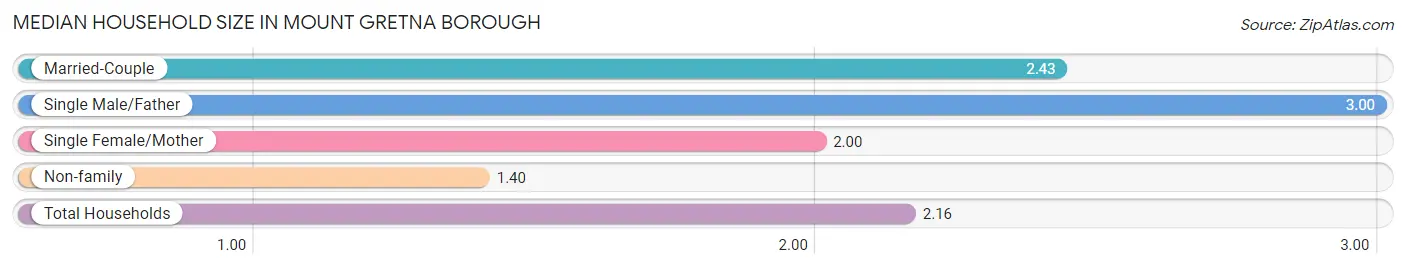
The median household size in Mount Gretna borough is 2.16 persons per household, with single male/father households (4 | 4.4%) accounting for the largest median household size of 3 persons per household. non-family households (25 | 27.5%) represent the smallest median household size with 1.40 persons per household.
| Household Type | # Households | Household Size |
| Married-Couple | 61 (67.0%) | 2.43 |
| Single Male/Father | 4 (4.4%) | 3.00 |
| Single Female/Mother | 1 (1.1%) | 2.00 |
| Non-family | 25 (27.5%) | 1.40 |
| Total Households | 91 (100.0%) | 2.16 |
Household Size by Marriage Status in Mount Gretna borough
Out of a total of 91 households in Mount Gretna borough, 66 (72.5%) are family households, while 25 (27.5%) are nonfamily households. The most numerous type of family households are 2-person households, comprising 52, and the most common type of nonfamily households are 1-person households, comprising 16.
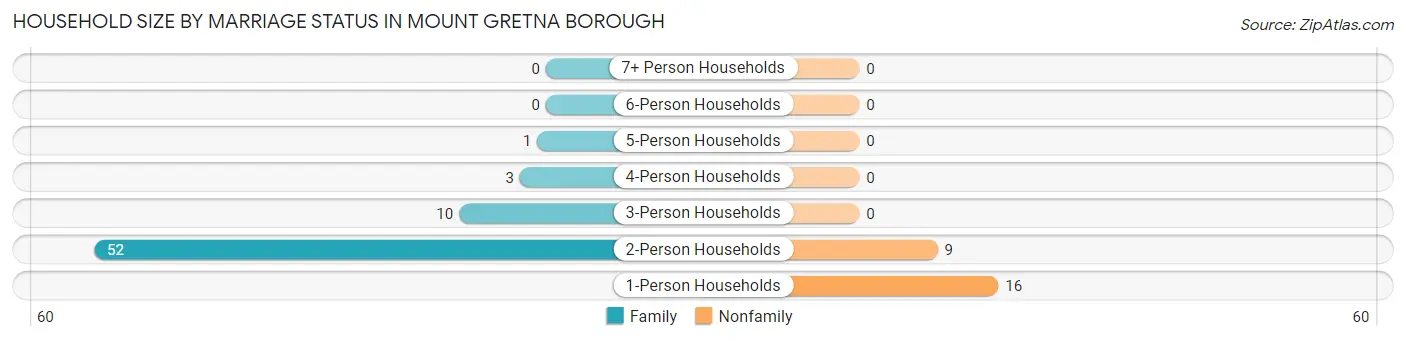
| Household Size | Family Households | Nonfamily Households |
| 1-Person Households | - | 16 (17.6%) |
| 2-Person Households | 52 (57.1%) | 9 (9.9%) |
| 3-Person Households | 10 (11.0%) | 0 (0.0%) |
| 4-Person Households | 3 (3.3%) | 0 (0.0%) |
| 5-Person Households | 1 (1.1%) | 0 (0.0%) |
| 6-Person Households | 0 (0.0%) | 0 (0.0%) |
| 7+ Person Households | 0 (0.0%) | 0 (0.0%) |
| Total | 66 (72.5%) | 25 (27.5%) |
Female Fertility in Mount Gretna borough
Fertility by Age in Mount Gretna borough
| Age Bracket | Women with Births | Births / 1,000 Women |
| 15 to 19 years | 0 (0.0%) | 0.0 |
| 20 to 34 years | 0 (0.0%) | 0.0 |
| 35 to 50 years | 0 (0.0%) | 0.0 |
| Total | 0 (0.0%) | 0.0 |
Fertility by Age by Marriage Status in Mount Gretna borough
| Age Bracket | Married | Unmarried |
| 15 to 19 years | 0 (0.0%) | 0 (0.0%) |
| 20 to 34 years | 0 (0.0%) | 0 (0.0%) |
| 35 to 50 years | 0 (0.0%) | 0 (0.0%) |
| Total | 0 (0.0%) | 0 (0.0%) |
Fertility by Education in Mount Gretna borough
| Educational Attainment | Women with Births | Births / 1,000 Women |
| Less than High School | 0 (0.0%) | 0.0 |
| High School Diploma | 0 (0.0%) | 0.0 |
| College or Associate's Degree | 0 (0.0%) | 0.0 |
| Bachelor's Degree | 0 (0.0%) | 0.0 |
| Graduate Degree | 0 (0.0%) | 0.0 |
| Total | 0 (0.0%) | 0.0 |
Fertility by Education by Marriage Status in Mount Gretna borough
| Educational Attainment | Married | Unmarried |
| Less than High School | 0 (0.0%) | 0 (0.0%) |
| High School Diploma | 0 (0.0%) | 0 (0.0%) |
| College or Associate's Degree | 0 (0.0%) | 0 (0.0%) |
| Bachelor's Degree | 0 (0.0%) | 0 (0.0%) |
| Graduate Degree | 0 (0.0%) | 0 (0.0%) |
| Total | 0 (0.0%) | 0 (0.0%) |
Employment Characteristics in Mount Gretna borough
Employment by Class of Employer in Mount Gretna borough
Among the 71 employed individuals in Mount Gretna borough, private company employees (35 | 49.3%), not-for-profit organizations (13 | 18.3%), and self-employed (incorporated) (9 | 12.7%) make up the most common classes of employment.
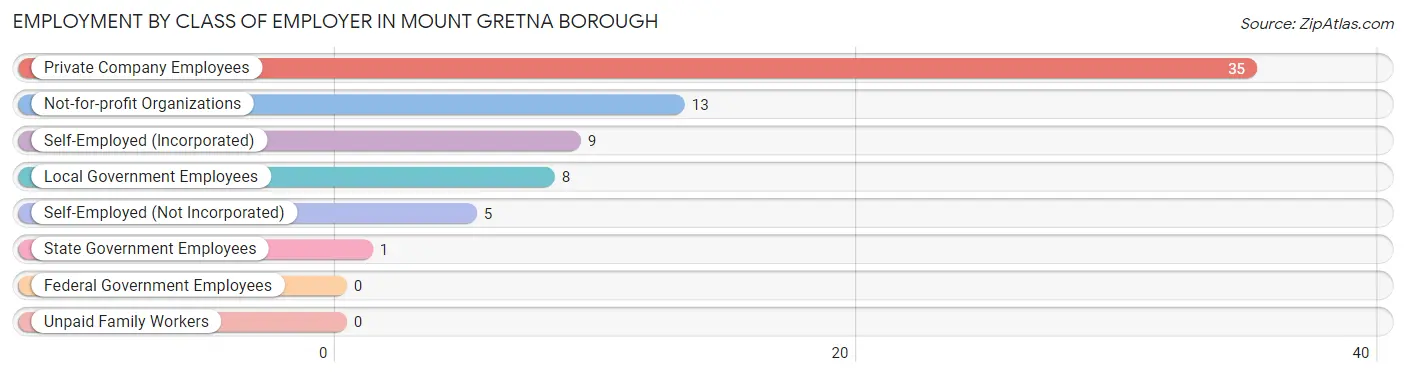
| Employer Class | # Employees | % Employees |
| Private Company Employees | 35 | 49.3% |
| Self-Employed (Incorporated) | 9 | 12.7% |
| Self-Employed (Not Incorporated) | 5 | 7.0% |
| Not-for-profit Organizations | 13 | 18.3% |
| Local Government Employees | 8 | 11.3% |
| State Government Employees | 1 | 1.4% |
| Federal Government Employees | 0 | 0.0% |
| Unpaid Family Workers | 0 | 0.0% |
| Total | 71 | 100.0% |
Employment Status by Age in Mount Gretna borough
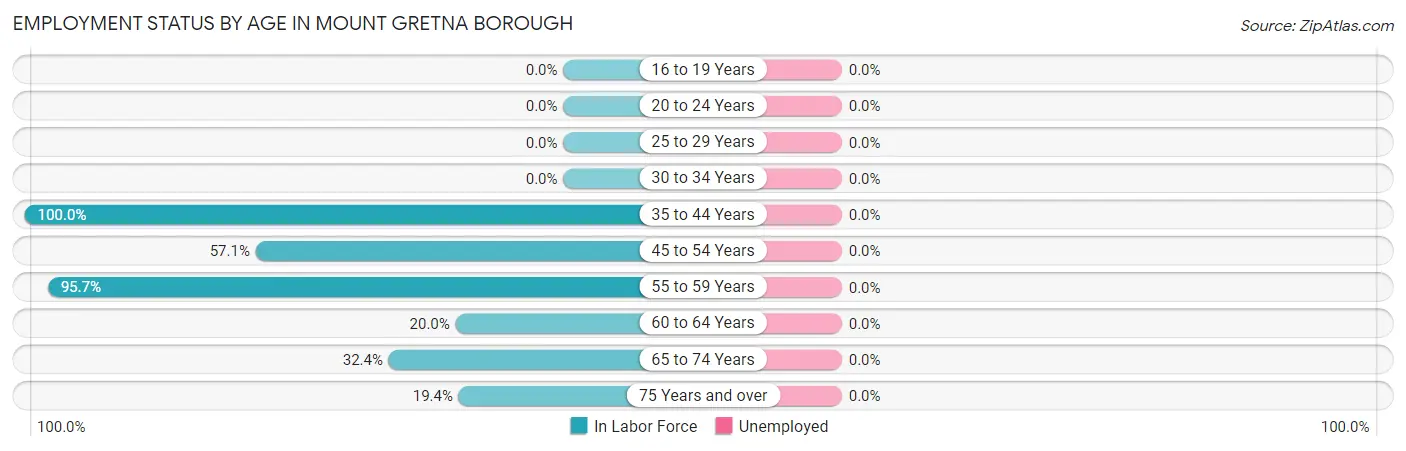
| Age Bracket | In Labor Force | Unemployed |
| 16 to 19 Years | 0 (0.0%) | 0 (0.0%) |
| 20 to 24 Years | 0 (0.0%) | 0 (0.0%) |
| 25 to 29 Years | 0 (0.0%) | 0 (0.0%) |
| 30 to 34 Years | 0 (0.0%) | 0 (0.0%) |
| 35 to 44 Years | 4 (100.0%) | 0 (0.0%) |
| 45 to 54 Years | 12 (57.1%) | 0 (0.0%) |
| 55 to 59 Years | 22 (95.7%) | 0 (0.0%) |
| 60 to 64 Years | 3 (20.0%) | 0 (0.0%) |
| 65 to 74 Years | 23 (32.4%) | 0 (0.0%) |
| 75 Years and over | 7 (19.4%) | 0 (0.0%) |
| Total | 71 (40.1%) | 0 (0.0%) |
Employment Status by Educational Attainment in Mount Gretna borough
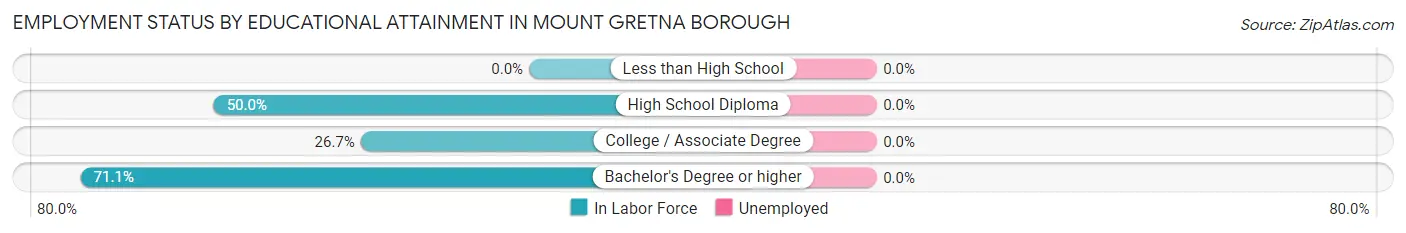
| Educational Attainment | In Labor Force | Unemployed |
| Less than High School | 0 (0.0%) | 0 (0.0%) |
| High School Diploma | 5 (50.0%) | 0 (0.0%) |
| College / Associate Degree | 4 (26.7%) | 0 (0.0%) |
| Bachelor's Degree or higher | 32 (71.1%) | 0 (0.0%) |
| Total | 41 (58.6%) | 0 (0.0%) |
Employment Occupations by Sex in Mount Gretna borough
Management, Business, Science and Arts Occupations
The most common Management, Business, Science and Arts occupations in Mount Gretna borough are Business & Financial (17 | 23.9%), Management (14 | 19.7%), Community & Social Service (8 | 11.3%), Computers, Engineering & Science (7 | 9.9%), and Computers & Mathematics (4 | 5.6%).
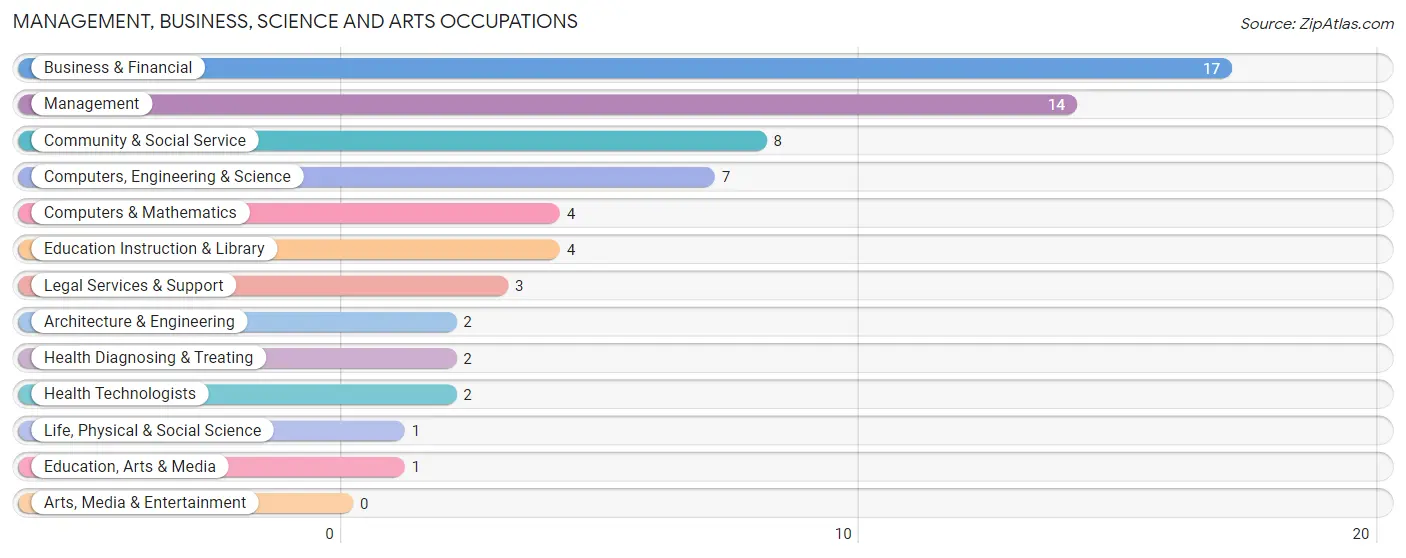
Management, Business, Science and Arts Occupations by Sex
Within the Management, Business, Science and Arts occupations in Mount Gretna borough, the most male-oriented occupations are Computers & Mathematics (100.0%), Life, Physical & Social Science (100.0%), and Education, Arts & Media (100.0%), while the most female-oriented occupations are Education Instruction & Library (100.0%), Health Diagnosing & Treating (100.0%), and Health Technologists (100.0%).
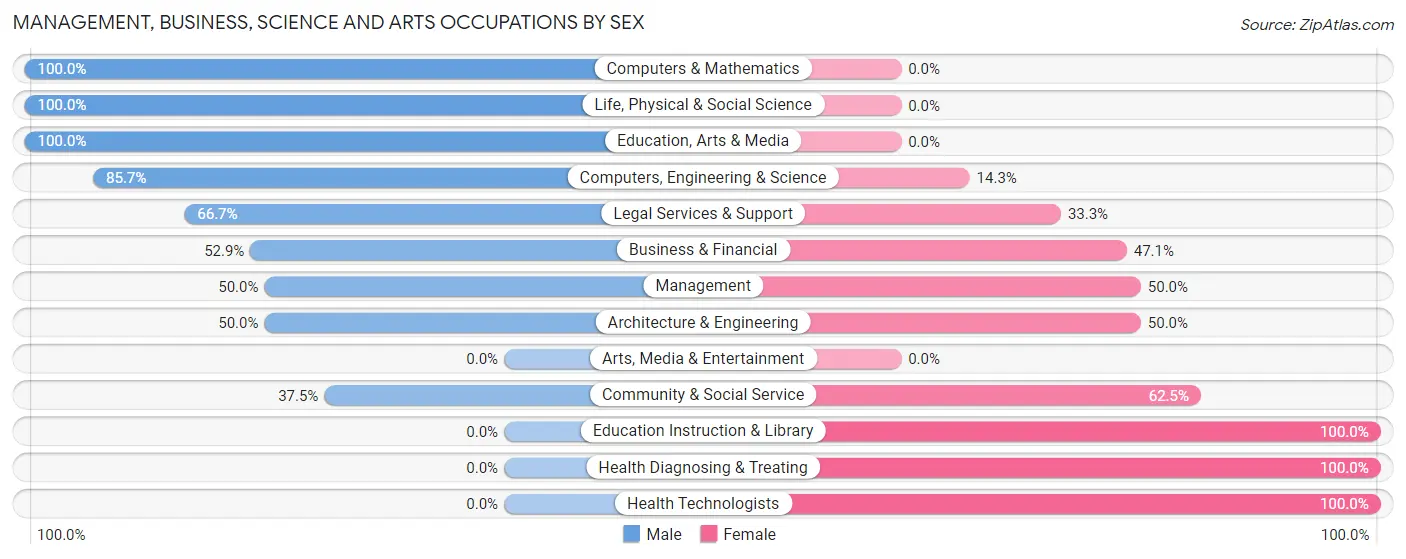
| Occupation | Male | Female |
| Management | 7 (50.0%) | 7 (50.0%) |
| Business & Financial | 9 (52.9%) | 8 (47.1%) |
| Computers, Engineering & Science | 6 (85.7%) | 1 (14.3%) |
| Computers & Mathematics | 4 (100.0%) | 0 (0.0%) |
| Architecture & Engineering | 1 (50.0%) | 1 (50.0%) |
| Life, Physical & Social Science | 1 (100.0%) | 0 (0.0%) |
| Community & Social Service | 3 (37.5%) | 5 (62.5%) |
| Education, Arts & Media | 1 (100.0%) | 0 (0.0%) |
| Legal Services & Support | 2 (66.7%) | 1 (33.3%) |
| Education Instruction & Library | 0 (0.0%) | 4 (100.0%) |
| Arts, Media & Entertainment | 0 (0.0%) | 0 (0.0%) |
| Health Diagnosing & Treating | 0 (0.0%) | 2 (100.0%) |
| Health Technologists | 0 (0.0%) | 2 (100.0%) |
| Total (Category) | 25 (52.1%) | 23 (47.9%) |
| Total (Overall) | 34 (47.9%) | 37 (52.1%) |
Services Occupations
The most common Services occupations in Mount Gretna borough are , and Cleaning & Maintenance (4 | 5.6%).
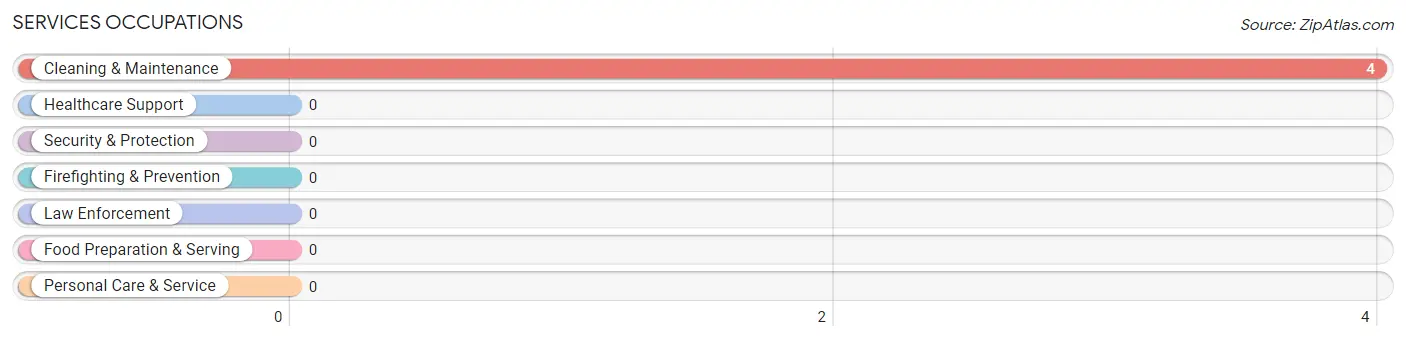
Services Occupations by Sex
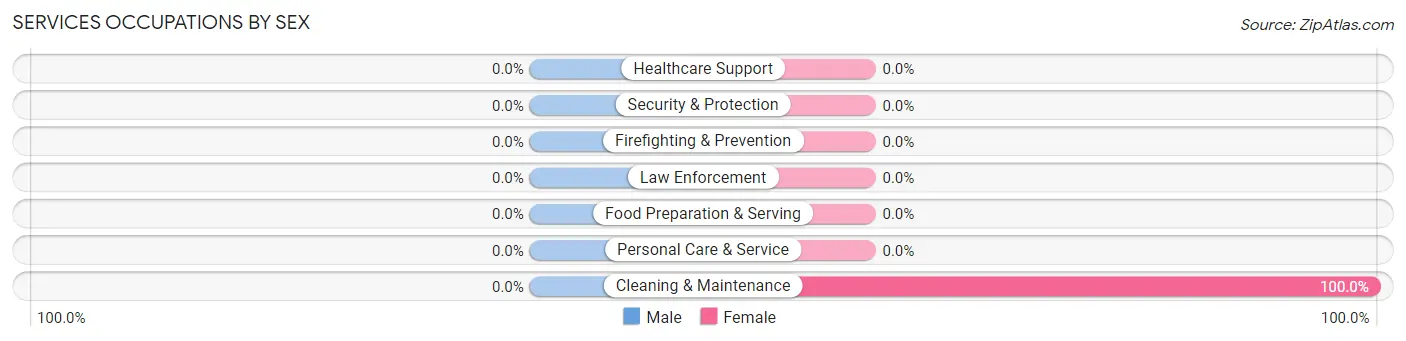
| Occupation | Male | Female |
| Healthcare Support | 0 (0.0%) | 0 (0.0%) |
| Security & Protection | 0 (0.0%) | 0 (0.0%) |
| Firefighting & Prevention | 0 (0.0%) | 0 (0.0%) |
| Law Enforcement | 0 (0.0%) | 0 (0.0%) |
| Food Preparation & Serving | 0 (0.0%) | 0 (0.0%) |
| Cleaning & Maintenance | 0 (0.0%) | 4 (100.0%) |
| Personal Care & Service | 0 (0.0%) | 0 (0.0%) |
| Total (Category) | 0 (0.0%) | 4 (100.0%) |
| Total (Overall) | 34 (47.9%) | 37 (52.1%) |
Sales and Office Occupations
The most common Sales and Office occupations in Mount Gretna borough are Sales & Related (9 | 12.7%), and Office & Administration (6 | 8.5%).
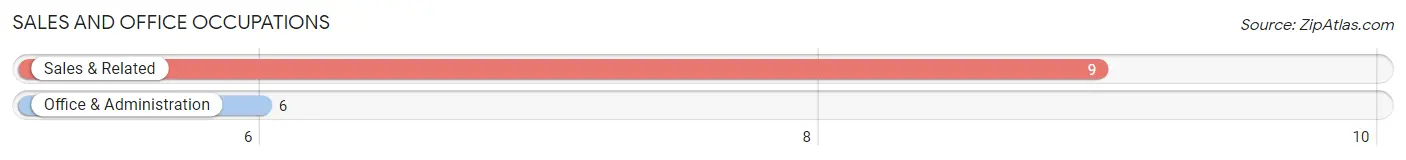
Sales and Office Occupations by Sex
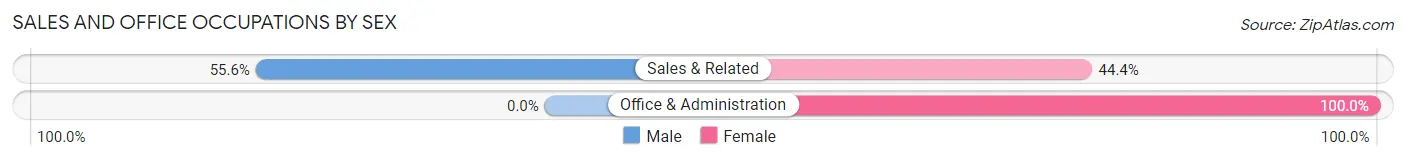
| Occupation | Male | Female |
| Sales & Related | 5 (55.6%) | 4 (44.4%) |
| Office & Administration | 0 (0.0%) | 6 (100.0%) |
| Total (Category) | 5 (33.3%) | 10 (66.7%) |
| Total (Overall) | 34 (47.9%) | 37 (52.1%) |
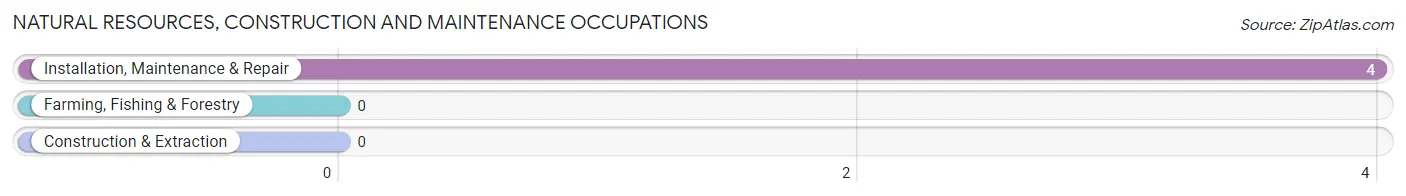
Natural Resources, Construction and Maintenance Occupations
The most common Natural Resources, Construction and Maintenance occupations in Mount Gretna borough are , and Installation, Maintenance & Repair (4 | 5.6%).
Natural Resources, Construction and Maintenance Occupations by Sex
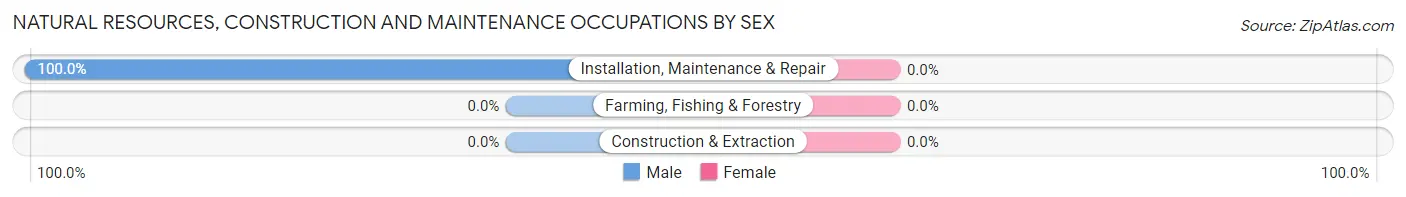
| Occupation | Male | Female |
| Farming, Fishing & Forestry | 0 (0.0%) | 0 (0.0%) |
| Construction & Extraction | 0 (0.0%) | 0 (0.0%) |
| Installation, Maintenance & Repair | 4 (100.0%) | 0 (0.0%) |
| Total (Category) | 4 (100.0%) | 0 (0.0%) |
| Total (Overall) | 34 (47.9%) | 37 (52.1%) |
Production, Transportation and Moving Occupations
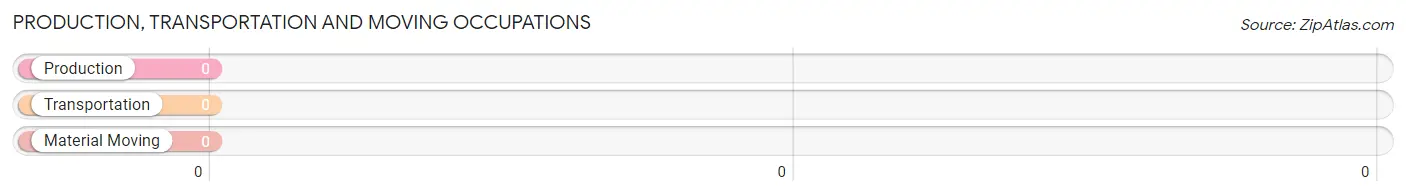
Production, Transportation and Moving Occupations by Sex
| Occupation | Male | Female |
| Production | 0 (0.0%) | 0 (0.0%) |
| Transportation | 0 (0.0%) | 0 (0.0%) |
| Material Moving | 0 (0.0%) | 0 (0.0%) |
| Total (Category) | 0 (0.0%) | 0 (0.0%) |
| Total (Overall) | 34 (47.9%) | 37 (52.1%) |
Employment Industries by Sex in Mount Gretna borough
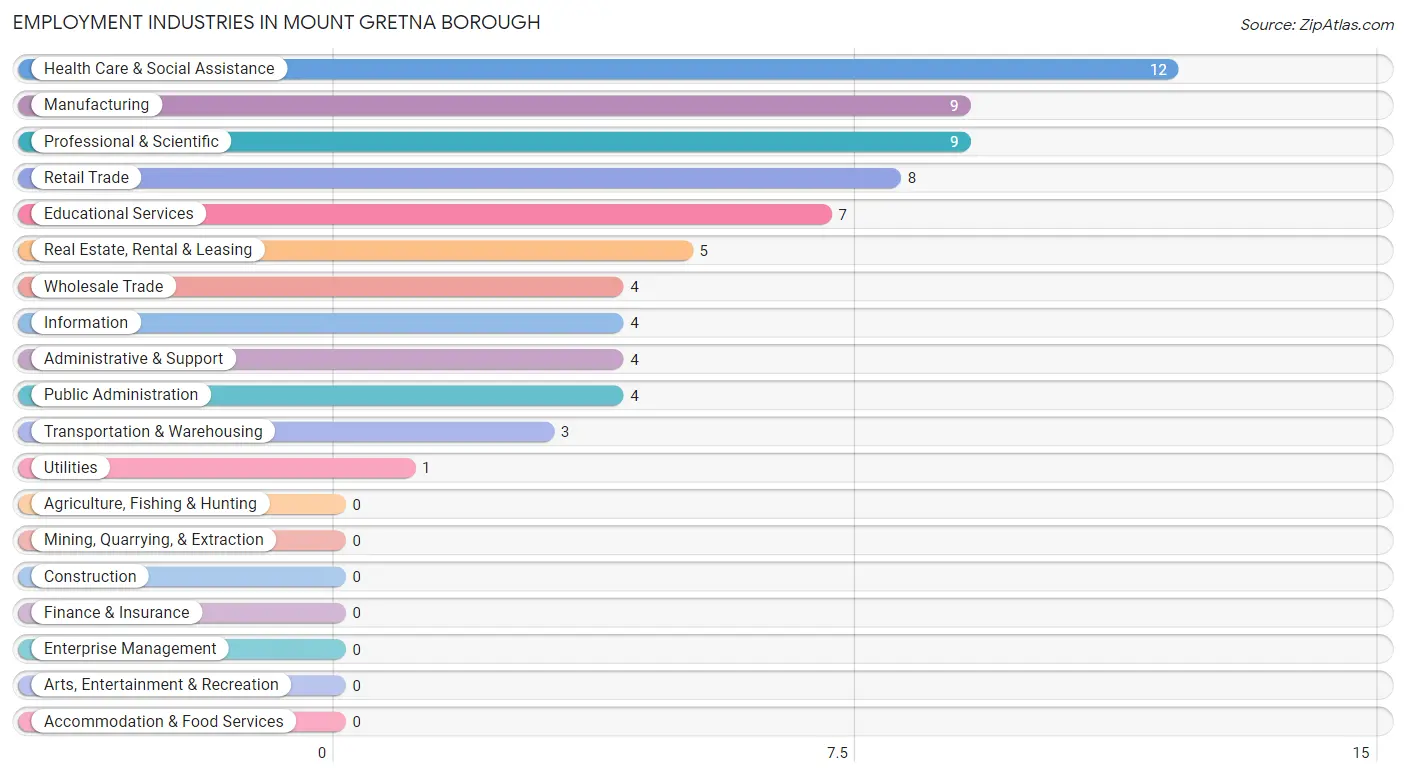
Employment Industries in Mount Gretna borough
The major employment industries in Mount Gretna borough include Health Care & Social Assistance (12 | 16.9%), Manufacturing (9 | 12.7%), Professional & Scientific (9 | 12.7%), Retail Trade (8 | 11.3%), and Educational Services (7 | 9.9%).
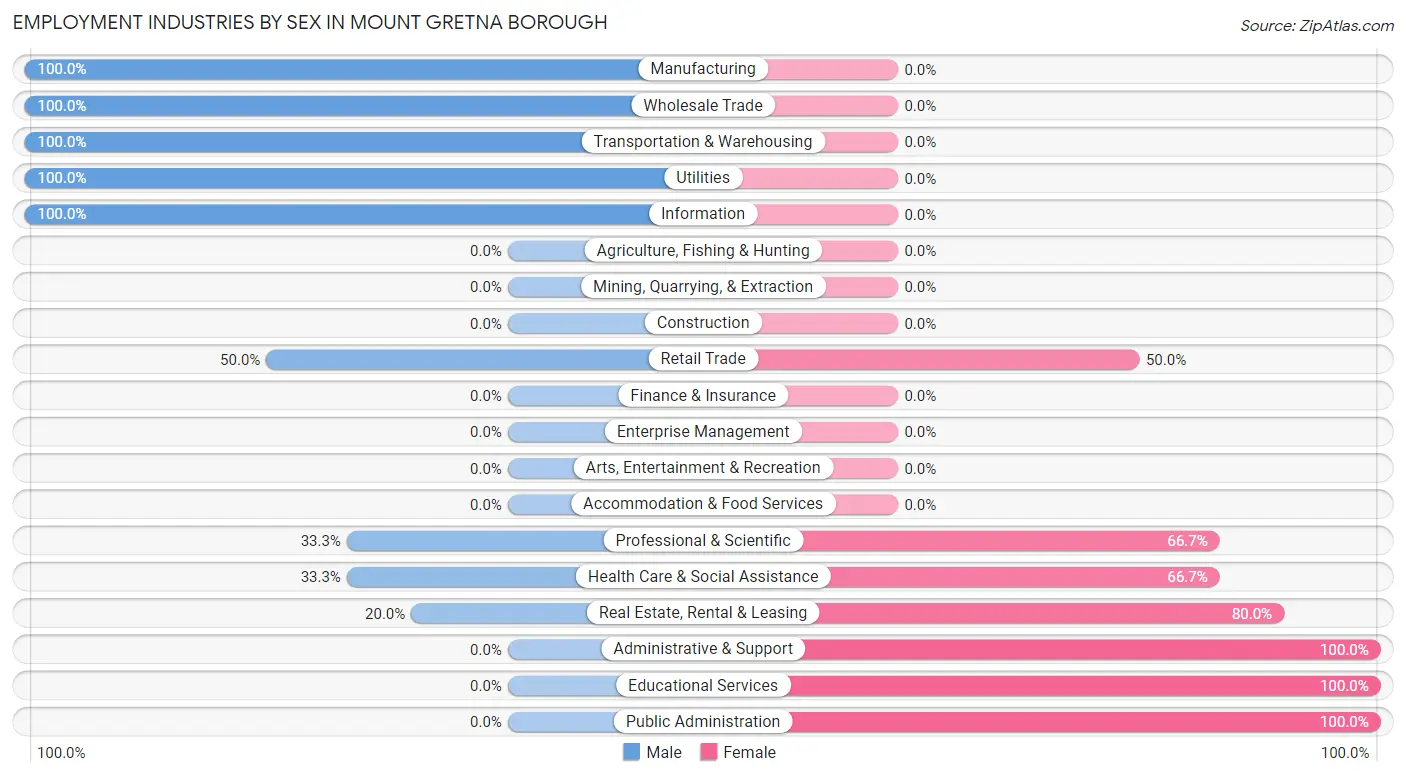
Employment Industries by Sex in Mount Gretna borough
The Mount Gretna borough industries that see more men than women are Manufacturing (100.0%), Wholesale Trade (100.0%), and Transportation & Warehousing (100.0%), whereas the industries that tend to have a higher number of women are Administrative & Support (100.0%), Educational Services (100.0%), and Public Administration (100.0%).
| Industry | Male | Female |
| Agriculture, Fishing & Hunting | 0 (0.0%) | 0 (0.0%) |
| Mining, Quarrying, & Extraction | 0 (0.0%) | 0 (0.0%) |
| Construction | 0 (0.0%) | 0 (0.0%) |
| Manufacturing | 9 (100.0%) | 0 (0.0%) |
| Wholesale Trade | 4 (100.0%) | 0 (0.0%) |
| Retail Trade | 4 (50.0%) | 4 (50.0%) |
| Transportation & Warehousing | 3 (100.0%) | 0 (0.0%) |
| Utilities | 1 (100.0%) | 0 (0.0%) |
| Information | 4 (100.0%) | 0 (0.0%) |
| Finance & Insurance | 0 (0.0%) | 0 (0.0%) |
| Real Estate, Rental & Leasing | 1 (20.0%) | 4 (80.0%) |
| Professional & Scientific | 3 (33.3%) | 6 (66.7%) |
| Enterprise Management | 0 (0.0%) | 0 (0.0%) |
| Administrative & Support | 0 (0.0%) | 4 (100.0%) |
| Educational Services | 0 (0.0%) | 7 (100.0%) |
| Health Care & Social Assistance | 4 (33.3%) | 8 (66.7%) |
| Arts, Entertainment & Recreation | 0 (0.0%) | 0 (0.0%) |
| Accommodation & Food Services | 0 (0.0%) | 0 (0.0%) |
| Public Administration | 0 (0.0%) | 4 (100.0%) |
| Total | 34 (47.9%) | 37 (52.1%) |
Education in Mount Gretna borough
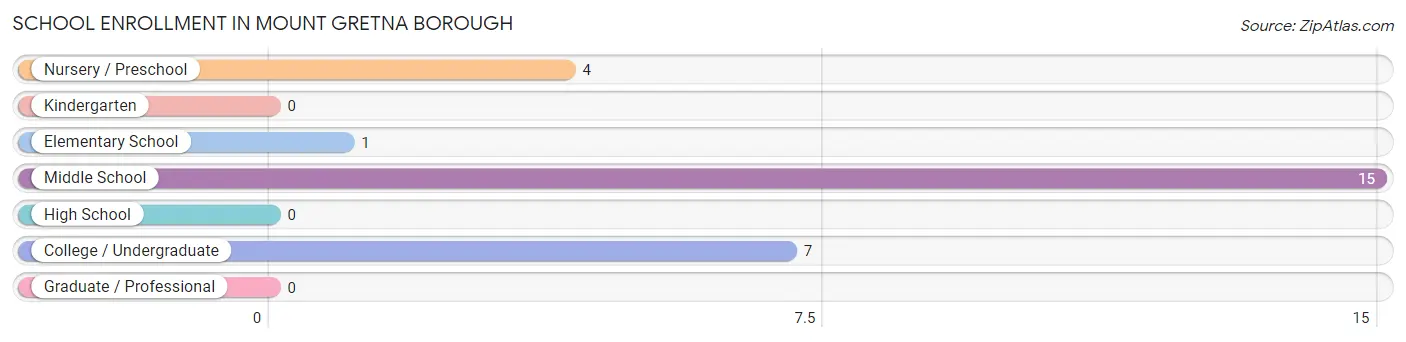
School Enrollment in Mount Gretna borough
The most common levels of schooling among the 27 students in Mount Gretna borough are middle school (15 | 55.6%), college / undergraduate (7 | 25.9%), and nursery / preschool (4 | 14.8%).
| School Level | # Students | % Students |
| Nursery / Preschool | 4 | 14.8% |
| Kindergarten | 0 | 0.0% |
| Elementary School | 1 | 3.7% |
| Middle School | 15 | 55.6% |
| High School | 0 | 0.0% |
| College / Undergraduate | 7 | 25.9% |
| Graduate / Professional | 0 | 0.0% |
| Total | 27 | 100.0% |
School Enrollment by Age by Funding Source in Mount Gretna borough
Out of a total of 27 students who are enrolled in schools in Mount Gretna borough, 10 (37.0%) attend a private institution, while the remaining 17 (63.0%) are enrolled in public schools. The age group of 5 to 9 year old has the highest likelihood of being enrolled in private schools, with 4 (80.0% in the age bracket) enrolled. Conversely, the age group of 25 to 34 year olds has the lowest likelihood of being enrolled in a private school, with 7 (100.0% in the age bracket) attending a public institution.
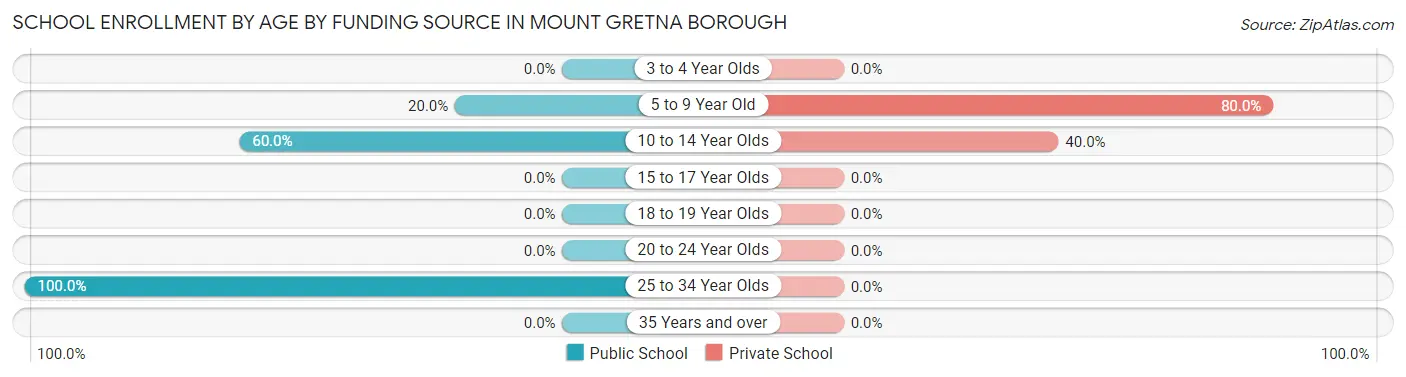
| Age Bracket | Public School | Private School |
| 3 to 4 Year Olds | 0 (0.0%) | 0 (0.0%) |
| 5 to 9 Year Old | 1 (20.0%) | 4 (80.0%) |
| 10 to 14 Year Olds | 9 (60.0%) | 6 (40.0%) |
| 15 to 17 Year Olds | 0 (0.0%) | 0 (0.0%) |
| 18 to 19 Year Olds | 0 (0.0%) | 0 (0.0%) |
| 20 to 24 Year Olds | 0 (0.0%) | 0 (0.0%) |
| 25 to 34 Year Olds | 7 (100.0%) | 0 (0.0%) |
| 35 Years and over | 0 (0.0%) | 0 (0.0%) |
| Total | 17 (63.0%) | 10 (37.0%) |
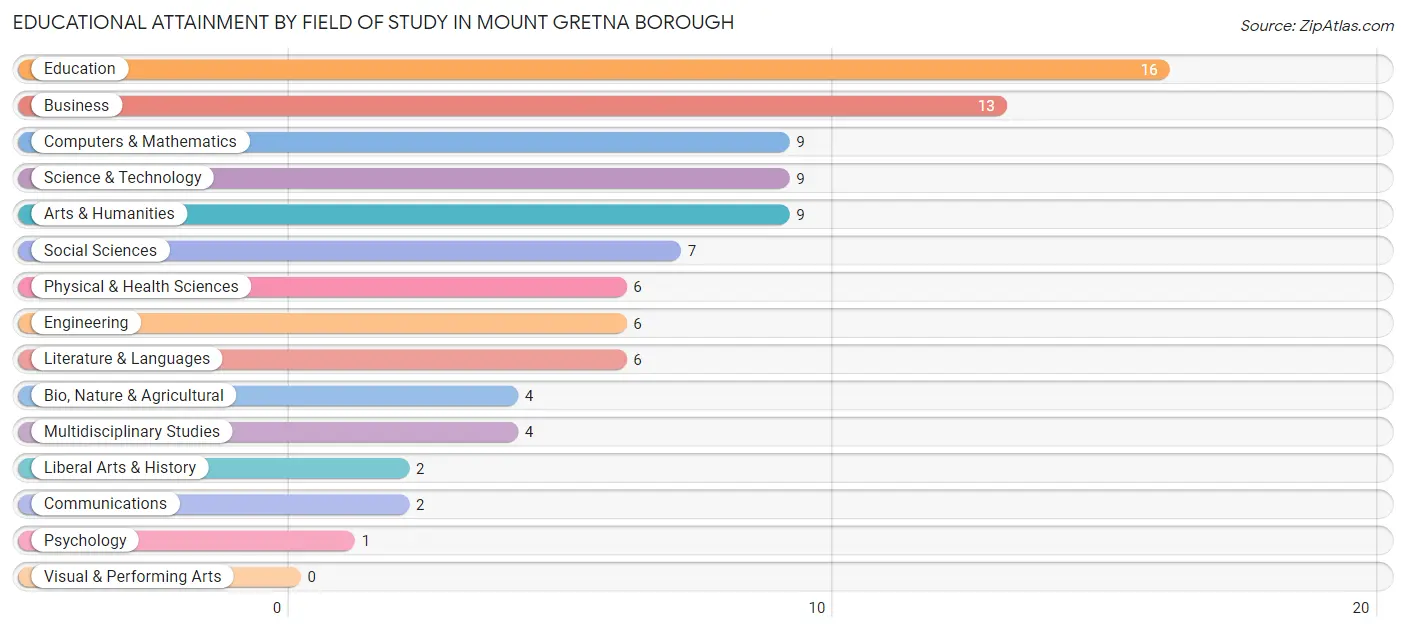
Educational Attainment by Field of Study in Mount Gretna borough
Education (16 | 17.0%), business (13 | 13.8%), computers & mathematics (9 | 9.6%), science & technology (9 | 9.6%), and arts & humanities (9 | 9.6%) are the most common fields of study among 94 individuals in Mount Gretna borough who have obtained a bachelor's degree or higher.
| Field of Study | # Graduates | % Graduates |
| Computers & Mathematics | 9 | 9.6% |
| Bio, Nature & Agricultural | 4 | 4.3% |
| Physical & Health Sciences | 6 | 6.4% |
| Psychology | 1 | 1.1% |
| Social Sciences | 7 | 7.4% |
| Engineering | 6 | 6.4% |
| Multidisciplinary Studies | 4 | 4.3% |
| Science & Technology | 9 | 9.6% |
| Business | 13 | 13.8% |
| Education | 16 | 17.0% |
| Literature & Languages | 6 | 6.4% |
| Liberal Arts & History | 2 | 2.1% |
| Visual & Performing Arts | 0 | 0.0% |
| Communications | 2 | 2.1% |
| Arts & Humanities | 9 | 9.6% |
| Total | 94 | 100.0% |
Transportation & Commute in Mount Gretna borough
Vehicle Availability by Sex in Mount Gretna borough
The most prevalent vehicle ownership categories in Mount Gretna borough are males with 2 vehicles (15, accounting for 44.1%) and females with 2 vehicles (19, making up 40.5%).
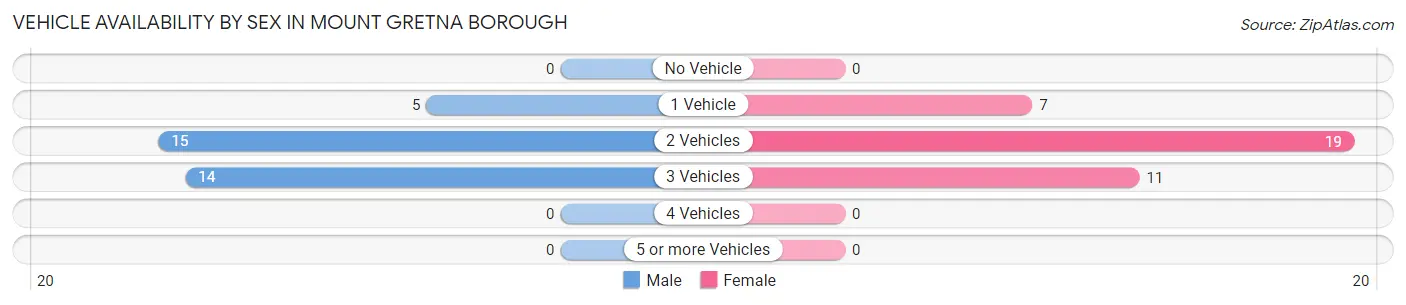
| Vehicles Available | Male | Female |
| No Vehicle | 0 (0.0%) | 0 (0.0%) |
| 1 Vehicle | 5 (14.7%) | 7 (18.9%) |
| 2 Vehicles | 15 (44.1%) | 19 (51.3%) |
| 3 Vehicles | 14 (41.2%) | 11 (29.7%) |
| 4 Vehicles | 0 (0.0%) | 0 (0.0%) |
| 5 or more Vehicles | 0 (0.0%) | 0 (0.0%) |
| Total | 34 (100.0%) | 37 (100.0%) |
Commute Time in Mount Gretna borough
The most frequently occuring commute durations in Mount Gretna borough are 25 to 29 minutes (12 commuters, 18.8%), 15 to 19 minutes (11 commuters, 17.2%), and 45 to 59 minutes (11 commuters, 17.2%).
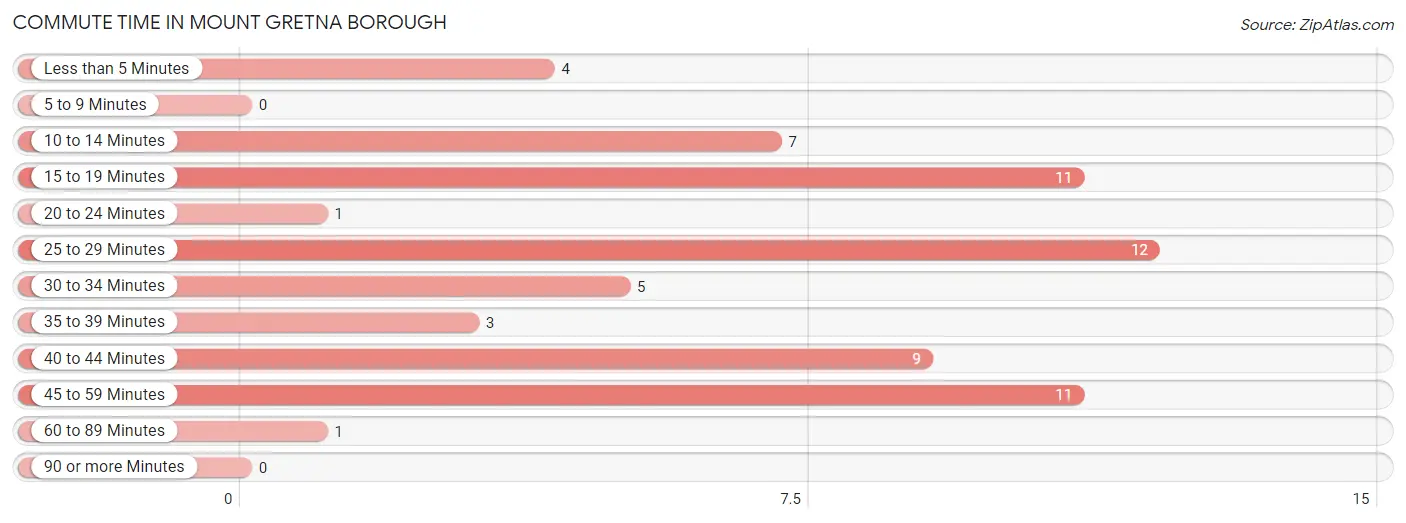
| Commute Time | # Commuters | % Commuters |
| Less than 5 Minutes | 4 | 6.2% |
| 5 to 9 Minutes | 0 | 0.0% |
| 10 to 14 Minutes | 7 | 10.9% |
| 15 to 19 Minutes | 11 | 17.2% |
| 20 to 24 Minutes | 1 | 1.6% |
| 25 to 29 Minutes | 12 | 18.8% |
| 30 to 34 Minutes | 5 | 7.8% |
| 35 to 39 Minutes | 3 | 4.7% |
| 40 to 44 Minutes | 9 | 14.1% |
| 45 to 59 Minutes | 11 | 17.2% |
| 60 to 89 Minutes | 1 | 1.6% |
| 90 or more Minutes | 0 | 0.0% |
Commute Time by Sex in Mount Gretna borough
The most common commute times in Mount Gretna borough are 45 to 59 minutes (11 commuters, 36.7%) for males and 25 to 29 minutes (12 commuters, 35.3%) for females.
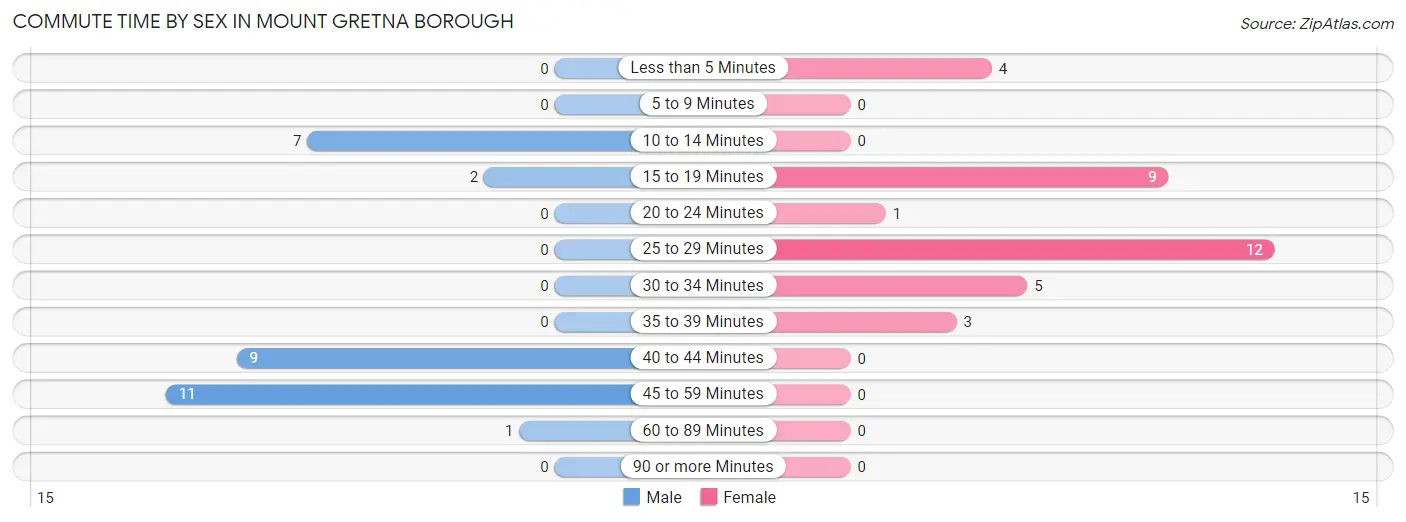
| Commute Time | Male | Female |
| Less than 5 Minutes | 0 (0.0%) | 4 (11.8%) |
| 5 to 9 Minutes | 0 (0.0%) | 0 (0.0%) |
| 10 to 14 Minutes | 7 (23.3%) | 0 (0.0%) |
| 15 to 19 Minutes | 2 (6.7%) | 9 (26.5%) |
| 20 to 24 Minutes | 0 (0.0%) | 1 (2.9%) |
| 25 to 29 Minutes | 0 (0.0%) | 12 (35.3%) |
| 30 to 34 Minutes | 0 (0.0%) | 5 (14.7%) |
| 35 to 39 Minutes | 0 (0.0%) | 3 (8.8%) |
| 40 to 44 Minutes | 9 (30.0%) | 0 (0.0%) |
| 45 to 59 Minutes | 11 (36.7%) | 0 (0.0%) |
| 60 to 89 Minutes | 1 (3.3%) | 0 (0.0%) |
| 90 or more Minutes | 0 (0.0%) | 0 (0.0%) |
Time of Departure to Work by Sex in Mount Gretna borough
The most frequent times of departure to work in Mount Gretna borough are 6:00 AM to 6:29 AM (11, 36.7%) for males and 7:30 AM to 7:59 AM (12, 35.3%) for females.
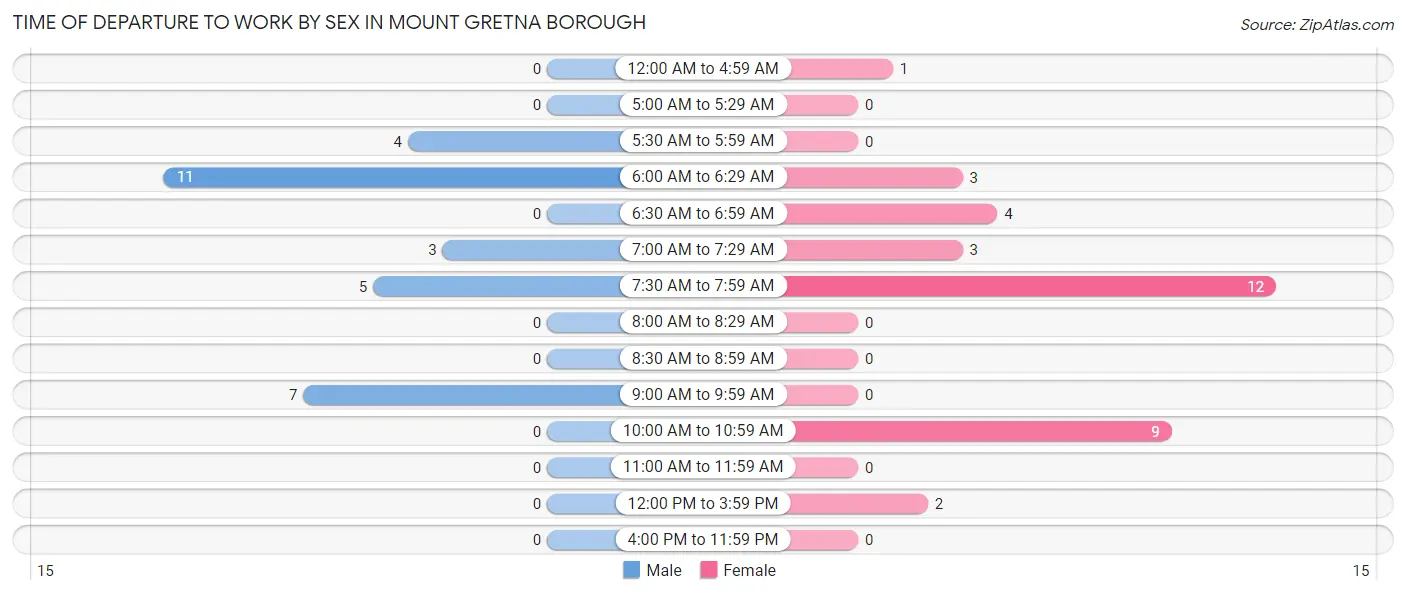
| Time of Departure | Male | Female |
| 12:00 AM to 4:59 AM | 0 (0.0%) | 1 (2.9%) |
| 5:00 AM to 5:29 AM | 0 (0.0%) | 0 (0.0%) |
| 5:30 AM to 5:59 AM | 4 (13.3%) | 0 (0.0%) |
| 6:00 AM to 6:29 AM | 11 (36.7%) | 3 (8.8%) |
| 6:30 AM to 6:59 AM | 0 (0.0%) | 4 (11.8%) |
| 7:00 AM to 7:29 AM | 3 (10.0%) | 3 (8.8%) |
| 7:30 AM to 7:59 AM | 5 (16.7%) | 12 (35.3%) |
| 8:00 AM to 8:29 AM | 0 (0.0%) | 0 (0.0%) |
| 8:30 AM to 8:59 AM | 0 (0.0%) | 0 (0.0%) |
| 9:00 AM to 9:59 AM | 7 (23.3%) | 0 (0.0%) |
| 10:00 AM to 10:59 AM | 0 (0.0%) | 9 (26.5%) |
| 11:00 AM to 11:59 AM | 0 (0.0%) | 0 (0.0%) |
| 12:00 PM to 3:59 PM | 0 (0.0%) | 2 (5.9%) |
| 4:00 PM to 11:59 PM | 0 (0.0%) | 0 (0.0%) |
| Total | 30 (100.0%) | 34 (100.0%) |
Housing Occupancy in Mount Gretna borough
Occupancy by Ownership in Mount Gretna borough
Of the total 91 dwellings in Mount Gretna borough, owner-occupied units account for 85 (93.4%), while renter-occupied units make up 6 (6.6%).
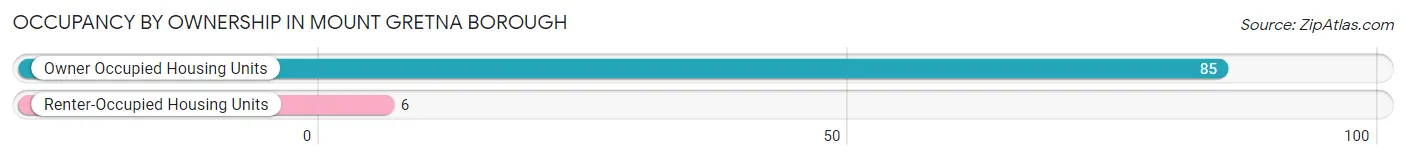
| Occupancy | # Housing Units | % Housing Units |
| Owner Occupied Housing Units | 85 | 93.4% |
| Renter-Occupied Housing Units | 6 | 6.6% |
| Total Occupied Housing Units | 91 | 100.0% |
Occupancy by Household Size in Mount Gretna borough
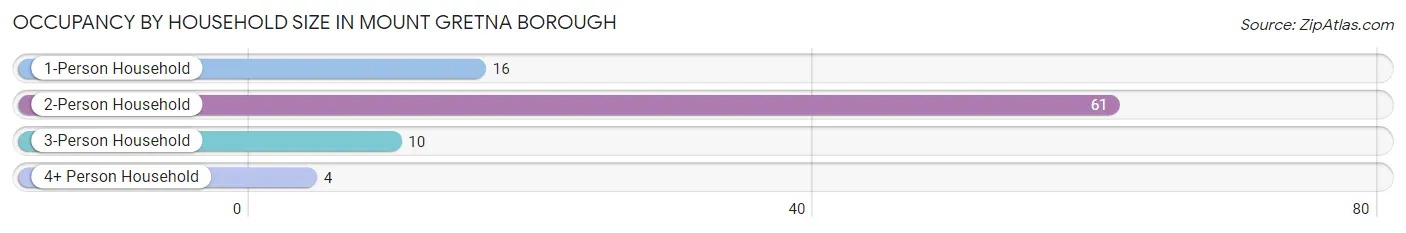
| Household Size | # Housing Units | % Housing Units |
| 1-Person Household | 16 | 17.6% |
| 2-Person Household | 61 | 67.0% |
| 3-Person Household | 10 | 11.0% |
| 4+ Person Household | 4 | 4.4% |
| Total Housing Units | 91 | 100.0% |
Occupancy by Ownership by Household Size in Mount Gretna borough
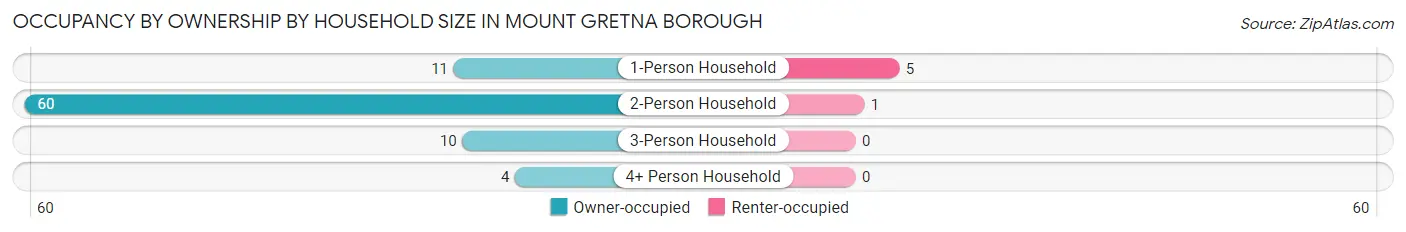
| Household Size | Owner-occupied | Renter-occupied |
| 1-Person Household | 11 (68.8%) | 5 (31.2%) |
| 2-Person Household | 60 (98.4%) | 1 (1.6%) |
| 3-Person Household | 10 (100.0%) | 0 (0.0%) |
| 4+ Person Household | 4 (100.0%) | 0 (0.0%) |
| Total Housing Units | 85 (93.4%) | 6 (6.6%) |
Occupancy by Educational Attainment in Mount Gretna borough
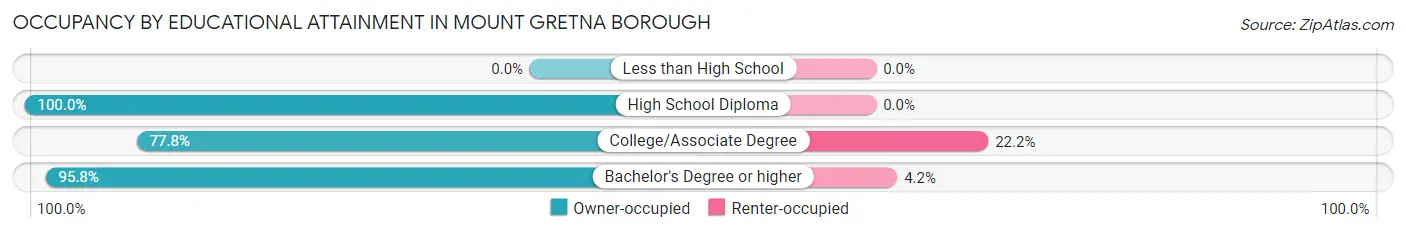
| Household Size | Owner-occupied | Renter-occupied |
| Less than High School | 0 (0.0%) | 0 (0.0%) |
| High School Diploma | 25 (100.0%) | 0 (0.0%) |
| College/Associate Degree | 14 (77.8%) | 4 (22.2%) |
| Bachelor's Degree or higher | 46 (95.8%) | 2 (4.2%) |
Occupancy by Age of Householder in Mount Gretna borough
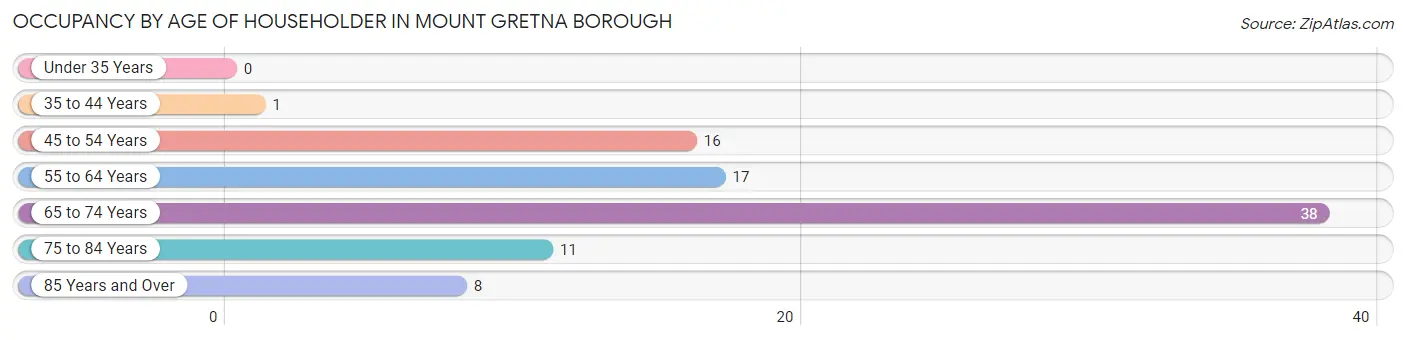
| Age Bracket | # Households | % Households |
| Under 35 Years | 0 | 0.0% |
| 35 to 44 Years | 1 | 1.1% |
| 45 to 54 Years | 16 | 17.6% |
| 55 to 64 Years | 17 | 18.7% |
| 65 to 74 Years | 38 | 41.8% |
| 75 to 84 Years | 11 | 12.1% |
| 85 Years and Over | 8 | 8.8% |
| Total | 91 | 100.0% |
Housing Finances in Mount Gretna borough
Median Income by Occupancy in Mount Gretna borough
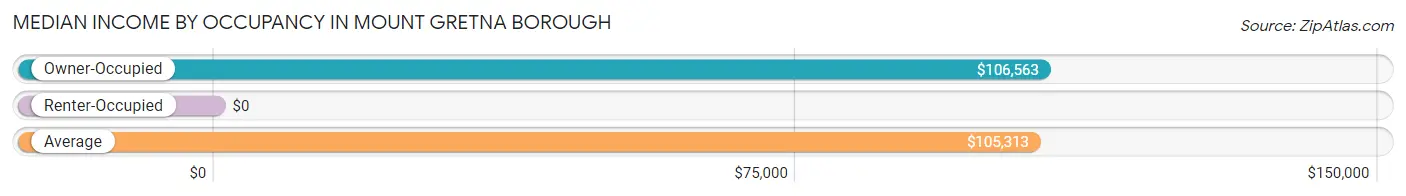
| Occupancy Type | # Households | Median Income |
| Owner-Occupied | 85 (93.4%) | $106,563 |
| Renter-Occupied | 6 (6.6%) | $0 |
| Average | 91 (100.0%) | $105,313 |
Occupancy by Householder Income Bracket in Mount Gretna borough
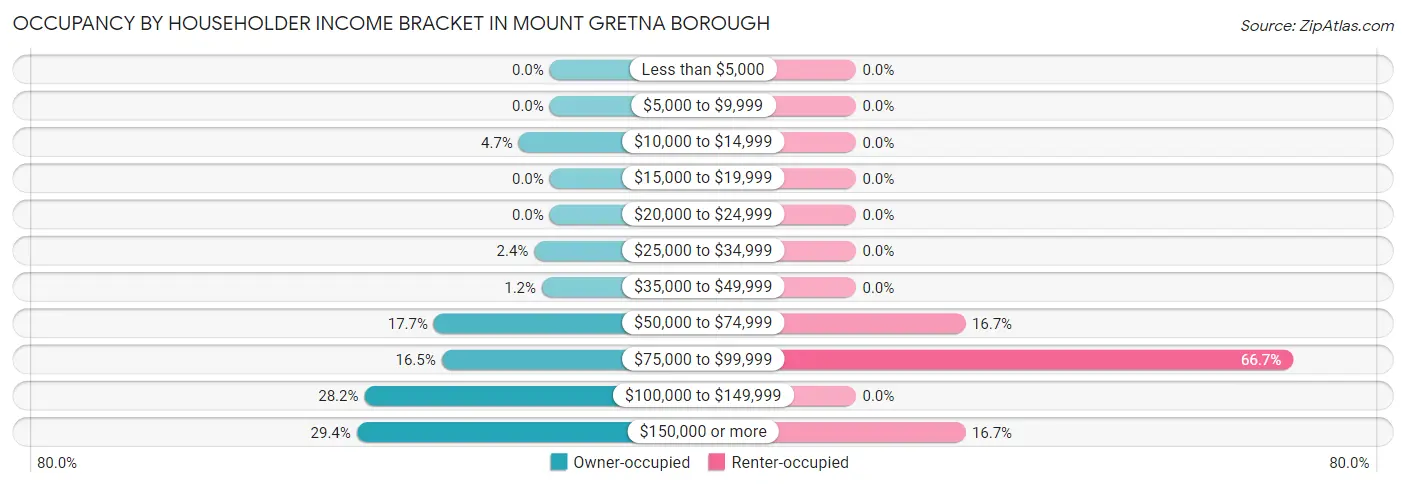
| Income Bracket | Owner-occupied | Renter-occupied |
| Less than $5,000 | 0 (0.0%) | 0 (0.0%) |
| $5,000 to $9,999 | 0 (0.0%) | 0 (0.0%) |
| $10,000 to $14,999 | 4 (4.7%) | 0 (0.0%) |
| $15,000 to $19,999 | 0 (0.0%) | 0 (0.0%) |
| $20,000 to $24,999 | 0 (0.0%) | 0 (0.0%) |
| $25,000 to $34,999 | 2 (2.4%) | 0 (0.0%) |
| $35,000 to $49,999 | 1 (1.2%) | 0 (0.0%) |
| $50,000 to $74,999 | 15 (17.6%) | 1 (16.7%) |
| $75,000 to $99,999 | 14 (16.5%) | 4 (66.7%) |
| $100,000 to $149,999 | 24 (28.2%) | 0 (0.0%) |
| $150,000 or more | 25 (29.4%) | 1 (16.7%) |
| Total | 85 (100.0%) | 6 (100.0%) |
Monthly Housing Cost Tiers in Mount Gretna borough
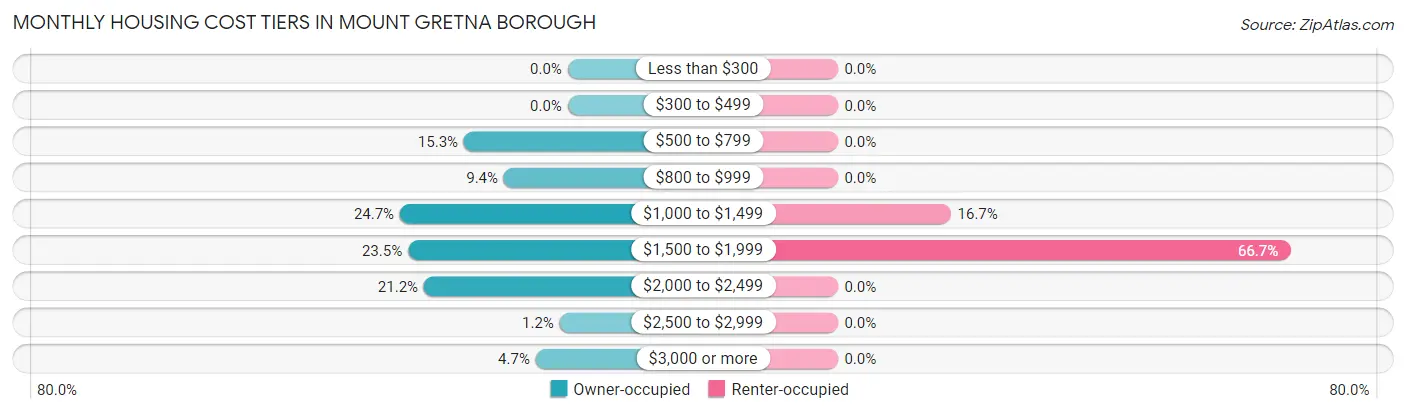
| Monthly Cost | Owner-occupied | Renter-occupied |
| Less than $300 | 0 (0.0%) | 0 (0.0%) |
| $300 to $499 | 0 (0.0%) | 0 (0.0%) |
| $500 to $799 | 13 (15.3%) | 0 (0.0%) |
| $800 to $999 | 8 (9.4%) | 0 (0.0%) |
| $1,000 to $1,499 | 21 (24.7%) | 1 (16.7%) |
| $1,500 to $1,999 | 20 (23.5%) | 4 (66.7%) |
| $2,000 to $2,499 | 18 (21.2%) | 0 (0.0%) |
| $2,500 to $2,999 | 1 (1.2%) | 0 (0.0%) |
| $3,000 or more | 4 (4.7%) | 0 (0.0%) |
| Total | 85 (100.0%) | 6 (100.0%) |
Physical Housing Characteristics in Mount Gretna borough
Housing Structures in Mount Gretna borough
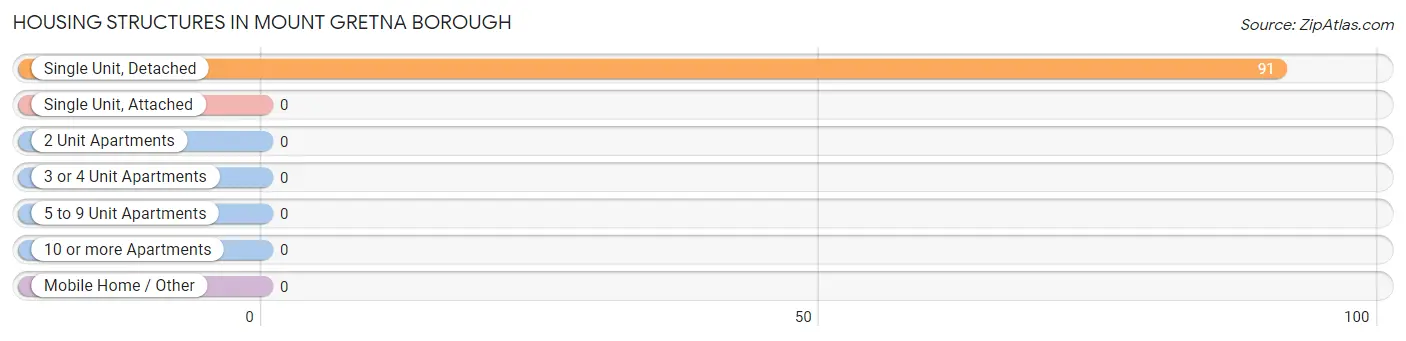
| Structure Type | # Housing Units | % Housing Units |
| Single Unit, Detached | 91 | 100.0% |
| Single Unit, Attached | 0 | 0.0% |
| 2 Unit Apartments | 0 | 0.0% |
| 3 or 4 Unit Apartments | 0 | 0.0% |
| 5 to 9 Unit Apartments | 0 | 0.0% |
| 10 or more Apartments | 0 | 0.0% |
| Mobile Home / Other | 0 | 0.0% |
| Total | 91 | 100.0% |
Housing Structures by Occupancy in Mount Gretna borough
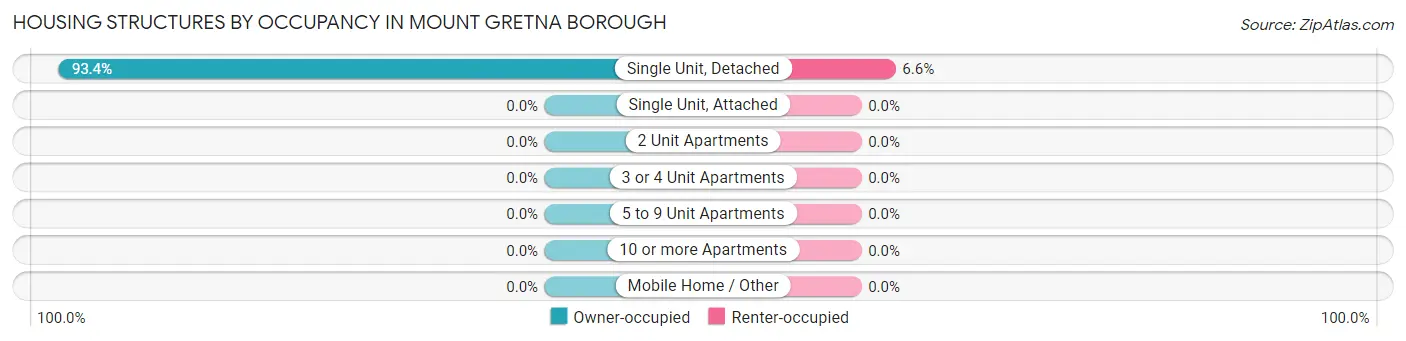
| Structure Type | Owner-occupied | Renter-occupied |
| Single Unit, Detached | 85 (93.4%) | 6 (6.6%) |
| Single Unit, Attached | 0 (0.0%) | 0 (0.0%) |
| 2 Unit Apartments | 0 (0.0%) | 0 (0.0%) |
| 3 or 4 Unit Apartments | 0 (0.0%) | 0 (0.0%) |
| 5 to 9 Unit Apartments | 0 (0.0%) | 0 (0.0%) |
| 10 or more Apartments | 0 (0.0%) | 0 (0.0%) |
| Mobile Home / Other | 0 (0.0%) | 0 (0.0%) |
| Total | 85 (93.4%) | 6 (6.6%) |
Housing Structures by Number of Rooms in Mount Gretna borough
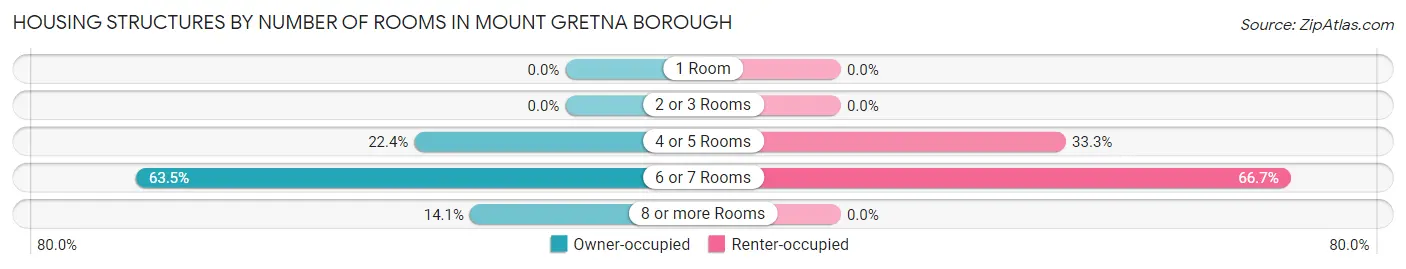
| Number of Rooms | Owner-occupied | Renter-occupied |
| 1 Room | 0 (0.0%) | 0 (0.0%) |
| 2 or 3 Rooms | 0 (0.0%) | 0 (0.0%) |
| 4 or 5 Rooms | 19 (22.4%) | 2 (33.3%) |
| 6 or 7 Rooms | 54 (63.5%) | 4 (66.7%) |
| 8 or more Rooms | 12 (14.1%) | 0 (0.0%) |
| Total | 85 (100.0%) | 6 (100.0%) |
Housing Structure by Heating Type in Mount Gretna borough
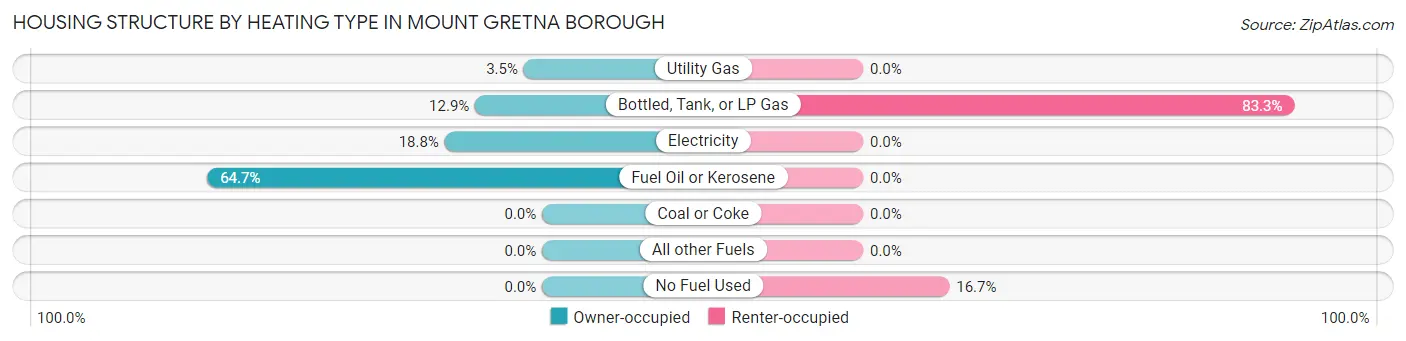
| Heating Type | Owner-occupied | Renter-occupied |
| Utility Gas | 3 (3.5%) | 0 (0.0%) |
| Bottled, Tank, or LP Gas | 11 (12.9%) | 5 (83.3%) |
| Electricity | 16 (18.8%) | 0 (0.0%) |
| Fuel Oil or Kerosene | 55 (64.7%) | 0 (0.0%) |
| Coal or Coke | 0 (0.0%) | 0 (0.0%) |
| All other Fuels | 0 (0.0%) | 0 (0.0%) |
| No Fuel Used | 0 (0.0%) | 1 (16.7%) |
| Total | 85 (100.0%) | 6 (100.0%) |
Household Vehicle Usage in Mount Gretna borough
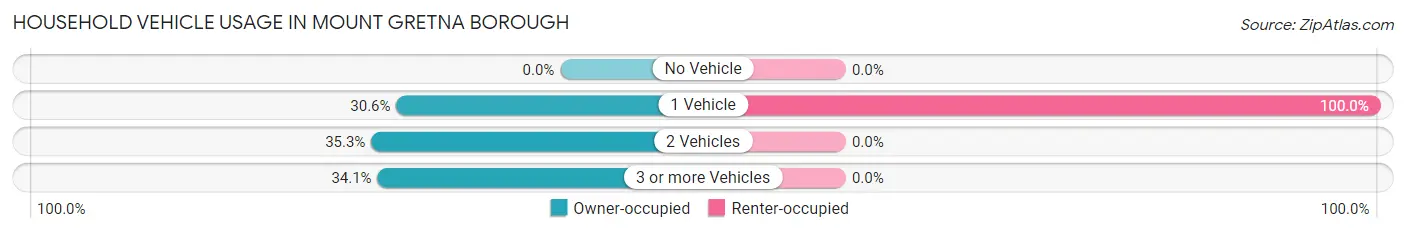
| Vehicles per Household | Owner-occupied | Renter-occupied |
| No Vehicle | 0 (0.0%) | 0 (0.0%) |
| 1 Vehicle | 26 (30.6%) | 6 (100.0%) |
| 2 Vehicles | 30 (35.3%) | 0 (0.0%) |
| 3 or more Vehicles | 29 (34.1%) | 0 (0.0%) |
| Total | 85 (100.0%) | 6 (100.0%) |
Real Estate & Mortgages in Mount Gretna borough
Real Estate and Mortgage Overview in Mount Gretna borough
| Characteristic | Without Mortgage | With Mortgage |
| Housing Units | 38 | 47 |
| Median Property Value | $359,100 | $341,700 |
| Median Household Income | $127,500 | $10 |
| Monthly Housing Costs | $900 | $4 |
| Real Estate Taxes | $6,750 | $0 |
Property Value by Mortgage Status in Mount Gretna borough
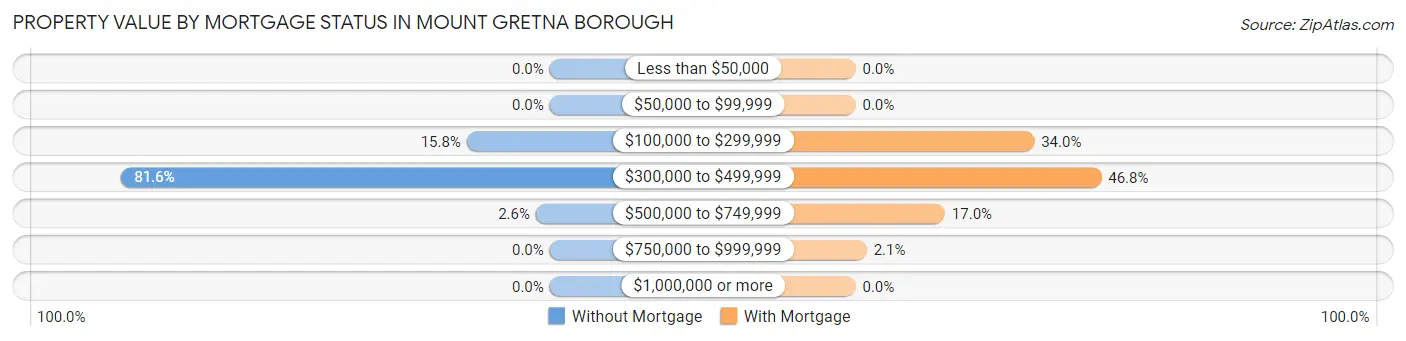
| Property Value | Without Mortgage | With Mortgage |
| Less than $50,000 | 0 (0.0%) | 0 (0.0%) |
| $50,000 to $99,999 | 0 (0.0%) | 0 (0.0%) |
| $100,000 to $299,999 | 6 (15.8%) | 16 (34.0%) |
| $300,000 to $499,999 | 31 (81.6%) | 22 (46.8%) |
| $500,000 to $749,999 | 1 (2.6%) | 8 (17.0%) |
| $750,000 to $999,999 | 0 (0.0%) | 1 (2.1%) |
| $1,000,000 or more | 0 (0.0%) | 0 (0.0%) |
| Total | 38 (100.0%) | 47 (100.0%) |
Household Income by Mortgage Status in Mount Gretna borough
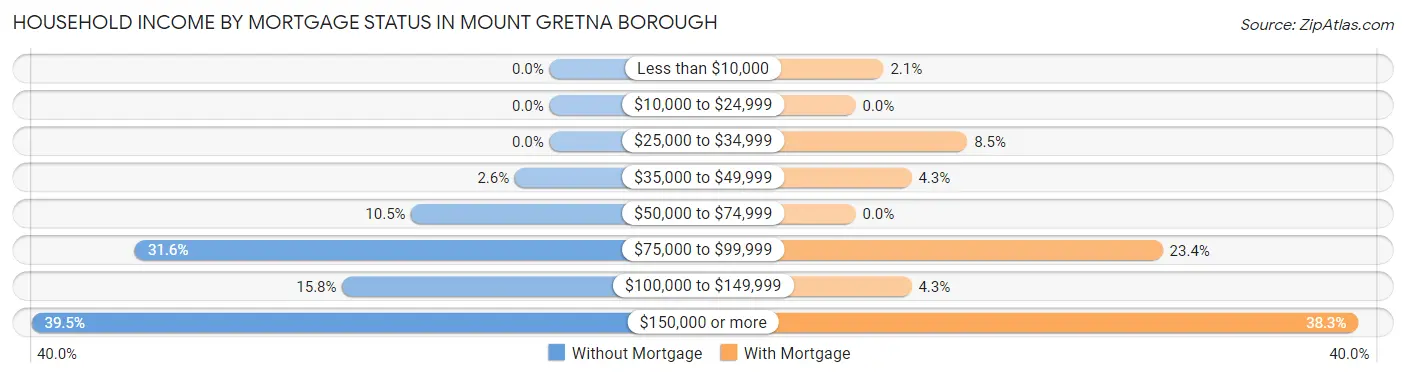
| Household Income | Without Mortgage | With Mortgage |
| Less than $10,000 | 0 (0.0%) | 1 (2.1%) |
| $10,000 to $24,999 | 0 (0.0%) | 0 (0.0%) |
| $25,000 to $34,999 | 0 (0.0%) | 4 (8.5%) |
| $35,000 to $49,999 | 1 (2.6%) | 2 (4.3%) |
| $50,000 to $74,999 | 4 (10.5%) | 0 (0.0%) |
| $75,000 to $99,999 | 12 (31.6%) | 11 (23.4%) |
| $100,000 to $149,999 | 6 (15.8%) | 2 (4.3%) |
| $150,000 or more | 15 (39.5%) | 18 (38.3%) |
| Total | 38 (100.0%) | 47 (100.0%) |
Property Value to Household Income Ratio in Mount Gretna borough
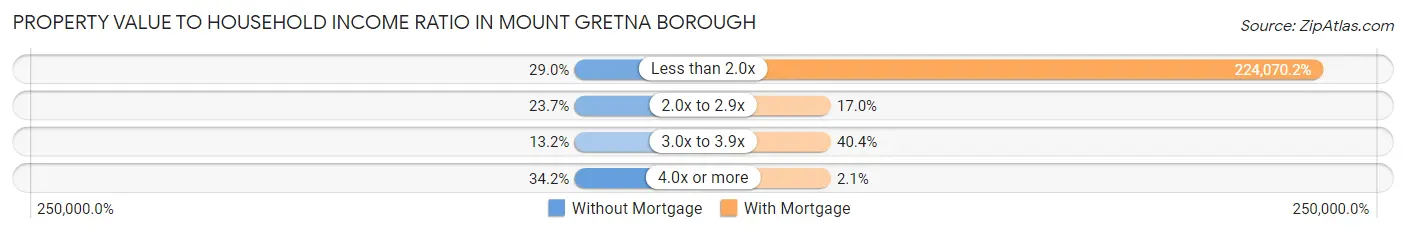
| Value-to-Income Ratio | Without Mortgage | With Mortgage |
| Less than 2.0x | 11 (28.9%) | 105,313 (224,070.2%) |
| 2.0x to 2.9x | 9 (23.7%) | 8 (17.0%) |
| 3.0x to 3.9x | 5 (13.2%) | 19 (40.4%) |
| 4.0x or more | 13 (34.2%) | 1 (2.1%) |
| Total | 38 (100.0%) | 47 (100.0%) |
Real Estate Taxes by Mortgage Status in Mount Gretna borough
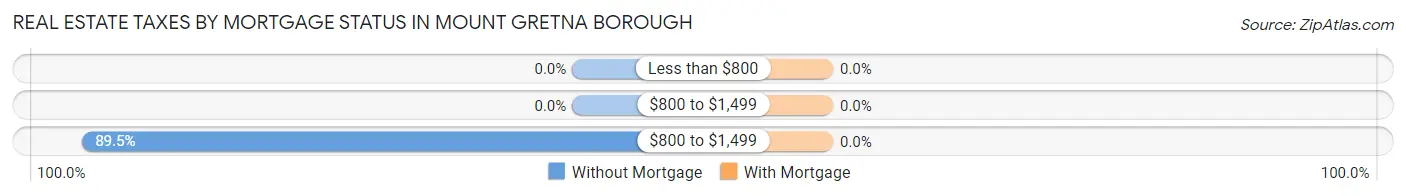
| Property Taxes | Without Mortgage | With Mortgage |
| Less than $800 | 0 (0.0%) | 0 (0.0%) |
| $800 to $1,499 | 0 (0.0%) | 0 (0.0%) |
| $800 to $1,499 | 34 (89.5%) | 0 (0.0%) |
| Total | 38 (100.0%) | 47 (100.0%) |
Health & Disability in Mount Gretna borough
Health Insurance Coverage by Age in Mount Gretna borough
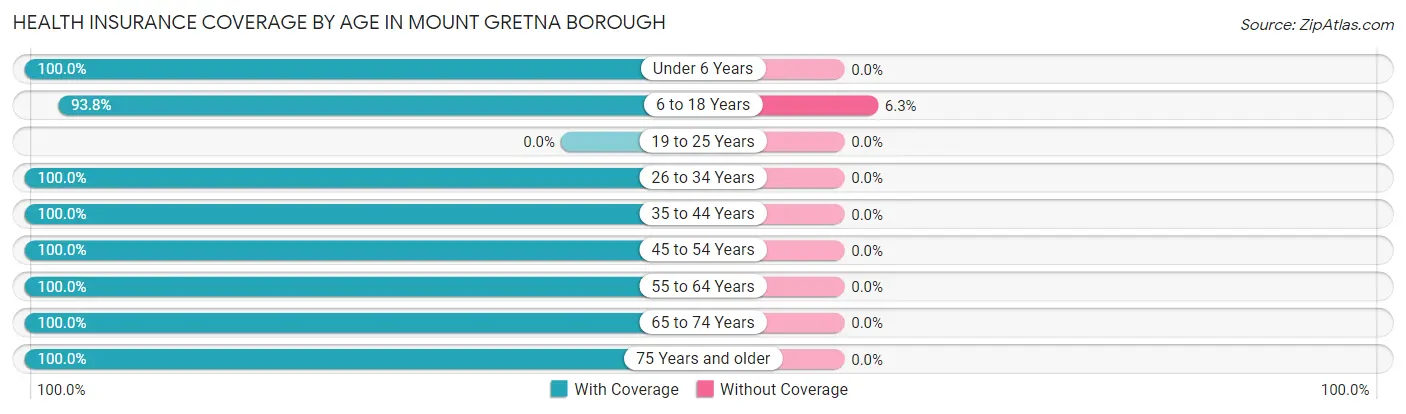
| Age Bracket | With Coverage | Without Coverage |
| Under 6 Years | 4 (100.0%) | 0 (0.0%) |
| 6 to 18 Years | 15 (93.8%) | 1 (6.2%) |
| 19 to 25 Years | 0 (0.0%) | 0 (0.0%) |
| 26 to 34 Years | 7 (100.0%) | 0 (0.0%) |
| 35 to 44 Years | 4 (100.0%) | 0 (0.0%) |
| 45 to 54 Years | 21 (100.0%) | 0 (0.0%) |
| 55 to 64 Years | 38 (100.0%) | 0 (0.0%) |
| 65 to 74 Years | 71 (100.0%) | 0 (0.0%) |
| 75 Years and older | 36 (100.0%) | 0 (0.0%) |
| Total | 196 (99.5%) | 1 (0.5%) |
Health Insurance Coverage by Citizenship Status in Mount Gretna borough
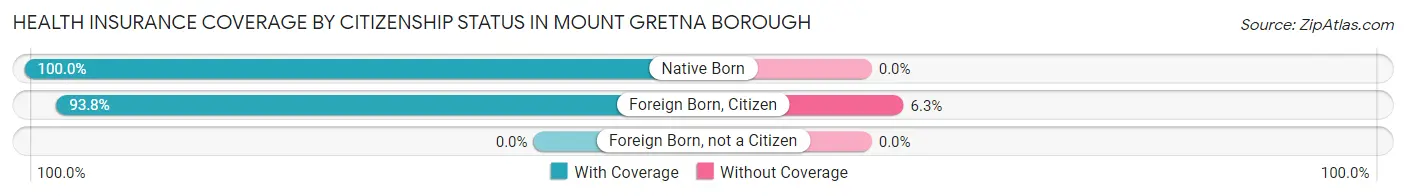
| Citizenship Status | With Coverage | Without Coverage |
| Native Born | 4 (100.0%) | 0 (0.0%) |
| Foreign Born, Citizen | 15 (93.8%) | 1 (6.2%) |
| Foreign Born, not a Citizen | 0 (0.0%) | 0 (0.0%) |
Health Insurance Coverage by Household Income in Mount Gretna borough
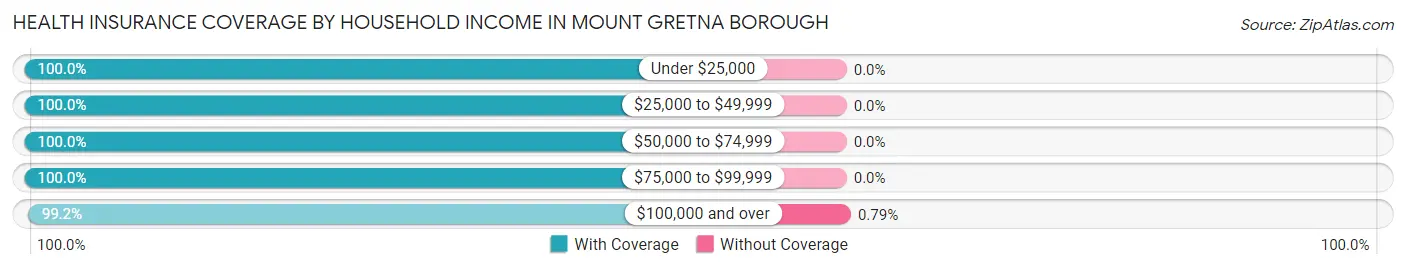
| Household Income | With Coverage | Without Coverage |
| Under $25,000 | 12 (100.0%) | 0 (0.0%) |
| $25,000 to $49,999 | 3 (100.0%) | 0 (0.0%) |
| $50,000 to $74,999 | 32 (100.0%) | 0 (0.0%) |
| $75,000 to $99,999 | 24 (100.0%) | 0 (0.0%) |
| $100,000 and over | 125 (99.2%) | 1 (0.8%) |
Public vs Private Health Insurance Coverage by Age in Mount Gretna borough
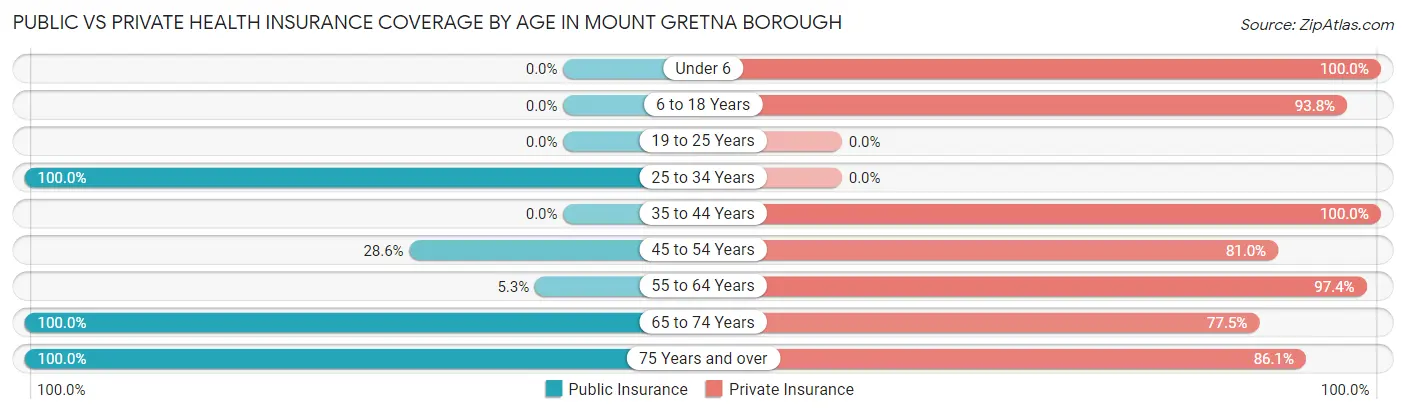
| Age Bracket | Public Insurance | Private Insurance |
| Under 6 | 0 (0.0%) | 4 (100.0%) |
| 6 to 18 Years | 0 (0.0%) | 15 (93.8%) |
| 19 to 25 Years | 0 (0.0%) | 0 (0.0%) |
| 25 to 34 Years | 7 (100.0%) | 0 (0.0%) |
| 35 to 44 Years | 0 (0.0%) | 4 (100.0%) |
| 45 to 54 Years | 6 (28.6%) | 17 (80.9%) |
| 55 to 64 Years | 2 (5.3%) | 37 (97.4%) |
| 65 to 74 Years | 71 (100.0%) | 55 (77.5%) |
| 75 Years and over | 36 (100.0%) | 31 (86.1%) |
| Total | 122 (61.9%) | 163 (82.7%) |
Disability Status by Sex by Age in Mount Gretna borough
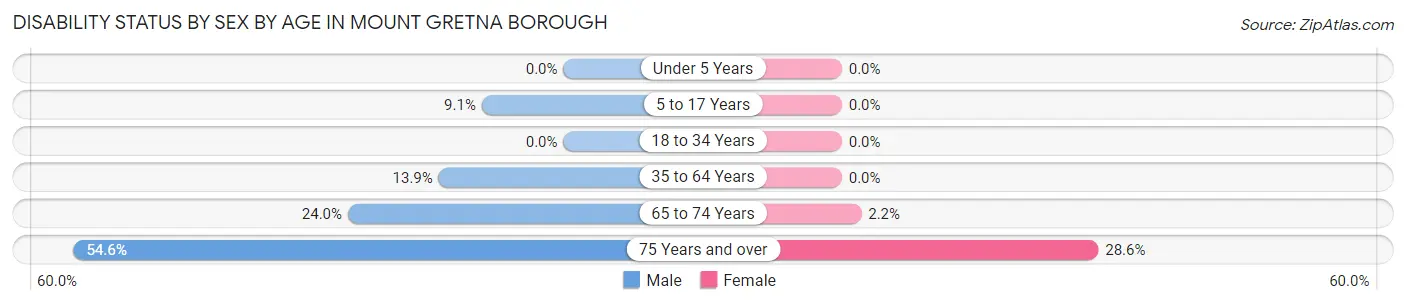
| Age Bracket | Male | Female |
| Under 5 Years | 0 (0.0%) | 0 (0.0%) |
| 5 to 17 Years | 1 (9.1%) | 0 (0.0%) |
| 18 to 34 Years | 0 (0.0%) | 0 (0.0%) |
| 35 to 64 Years | 5 (13.9%) | 0 (0.0%) |
| 65 to 74 Years | 6 (24.0%) | 1 (2.2%) |
| 75 Years and over | 12 (54.5%) | 4 (28.6%) |
Disability Class by Sex by Age in Mount Gretna borough
Disability Class: Hearing Difficulty
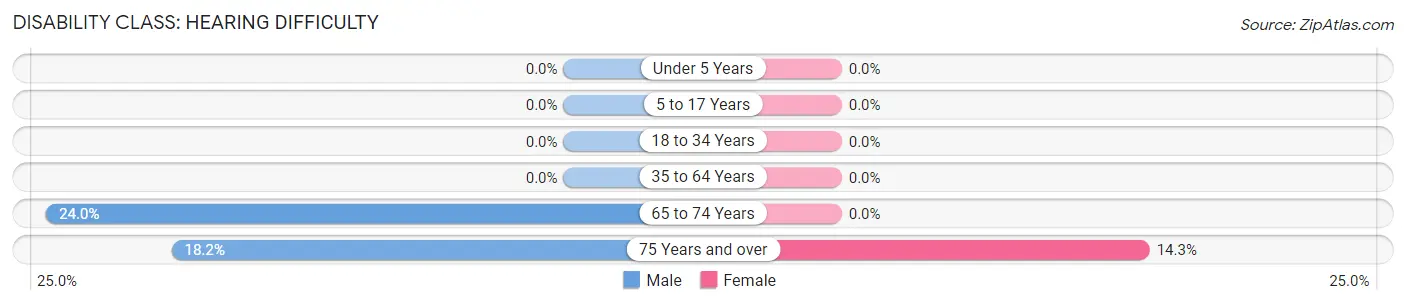
| Age Bracket | Male | Female |
| Under 5 Years | 0 (0.0%) | 0 (0.0%) |
| 5 to 17 Years | 0 (0.0%) | 0 (0.0%) |
| 18 to 34 Years | 0 (0.0%) | 0 (0.0%) |
| 35 to 64 Years | 0 (0.0%) | 0 (0.0%) |
| 65 to 74 Years | 6 (24.0%) | 0 (0.0%) |
| 75 Years and over | 4 (18.2%) | 2 (14.3%) |
Disability Class: Vision Difficulty
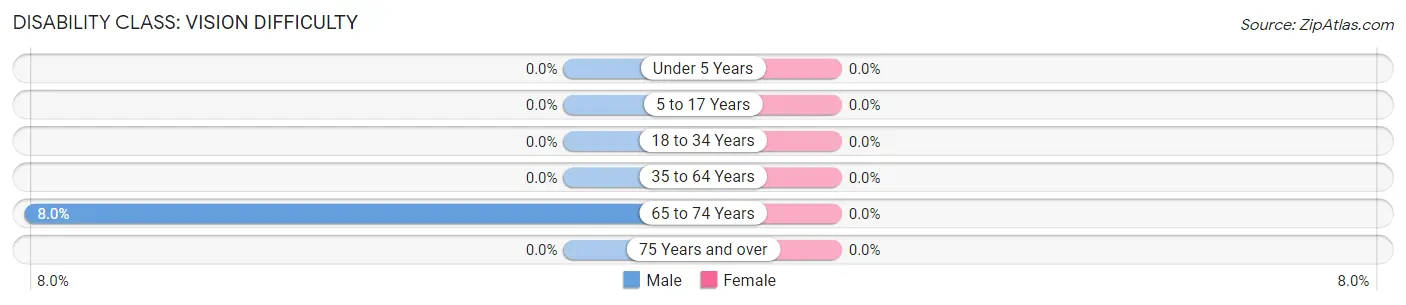
| Age Bracket | Male | Female |
| Under 5 Years | 0 (0.0%) | 0 (0.0%) |
| 5 to 17 Years | 0 (0.0%) | 0 (0.0%) |
| 18 to 34 Years | 0 (0.0%) | 0 (0.0%) |
| 35 to 64 Years | 0 (0.0%) | 0 (0.0%) |
| 65 to 74 Years | 2 (8.0%) | 0 (0.0%) |
| 75 Years and over | 0 (0.0%) | 0 (0.0%) |
Disability Class: Cognitive Difficulty
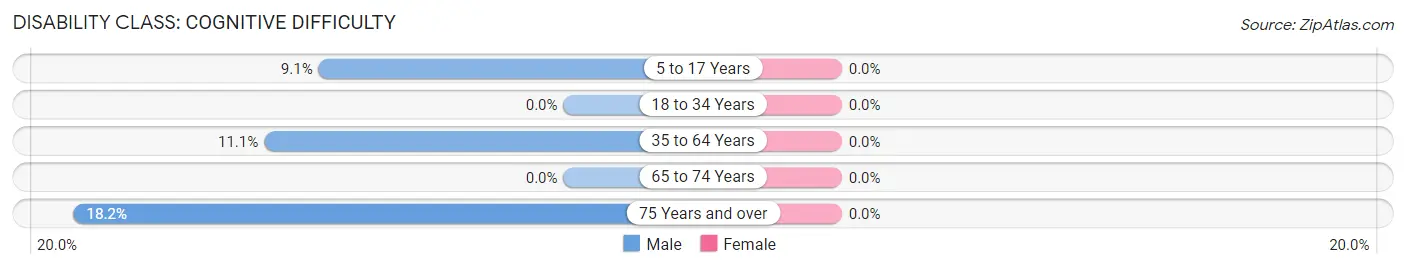
| Age Bracket | Male | Female |
| 5 to 17 Years | 1 (9.1%) | 0 (0.0%) |
| 18 to 34 Years | 0 (0.0%) | 0 (0.0%) |
| 35 to 64 Years | 4 (11.1%) | 0 (0.0%) |
| 65 to 74 Years | 0 (0.0%) | 0 (0.0%) |
| 75 Years and over | 4 (18.2%) | 0 (0.0%) |
Disability Class: Ambulatory Difficulty
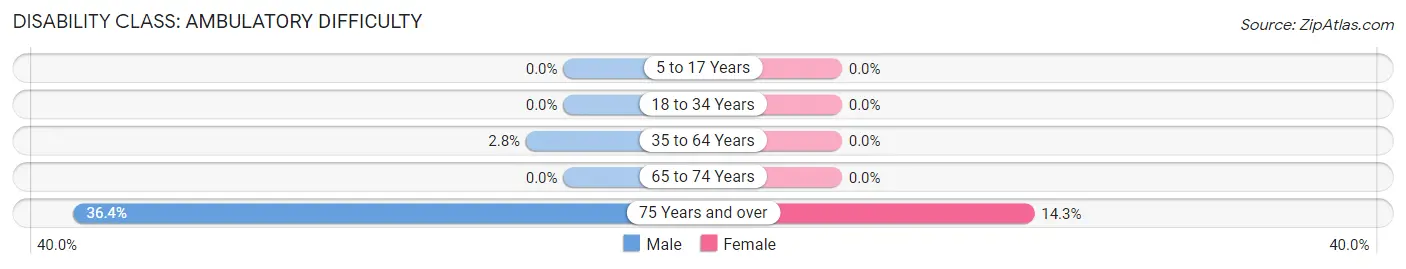
| Age Bracket | Male | Female |
| 5 to 17 Years | 0 (0.0%) | 0 (0.0%) |
| 18 to 34 Years | 0 (0.0%) | 0 (0.0%) |
| 35 to 64 Years | 1 (2.8%) | 0 (0.0%) |
| 65 to 74 Years | 0 (0.0%) | 0 (0.0%) |
| 75 Years and over | 8 (36.4%) | 2 (14.3%) |
Disability Class: Self-Care Difficulty
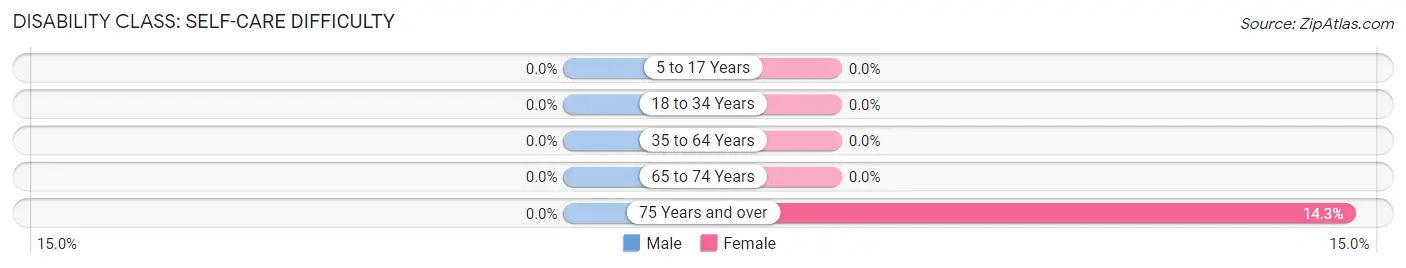
| Age Bracket | Male | Female |
| 5 to 17 Years | 0 (0.0%) | 0 (0.0%) |
| 18 to 34 Years | 0 (0.0%) | 0 (0.0%) |
| 35 to 64 Years | 0 (0.0%) | 0 (0.0%) |
| 65 to 74 Years | 0 (0.0%) | 0 (0.0%) |
| 75 Years and over | 0 (0.0%) | 2 (14.3%) |
Technology Access in Mount Gretna borough
Computing Device Access in Mount Gretna borough
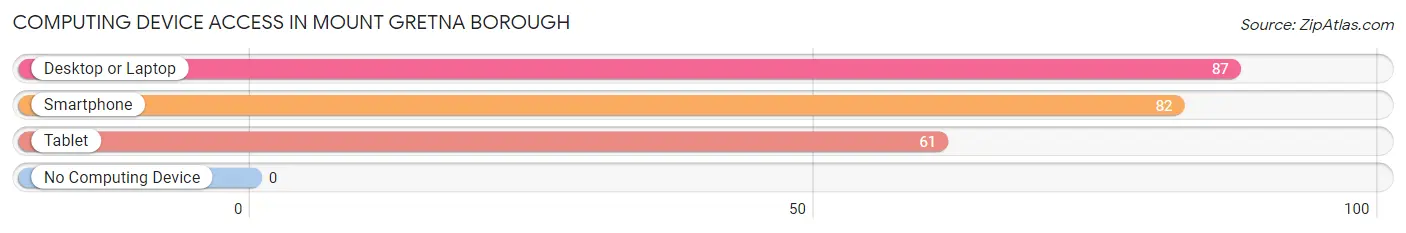
| Device Type | # Households | % Households |
| Desktop or Laptop | 87 | 95.6% |
| Smartphone | 82 | 90.1% |
| Tablet | 61 | 67.0% |
| No Computing Device | 0 | 0.0% |
| Total | 91 | 100.0% |
Internet Access in Mount Gretna borough
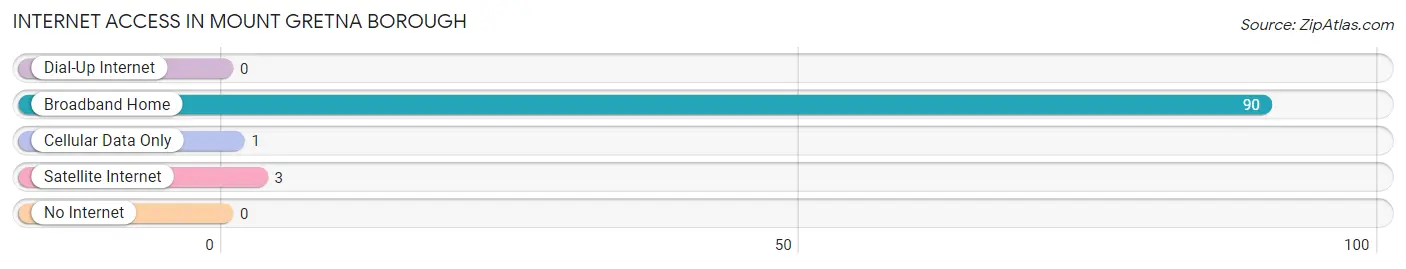
| Internet Type | # Households | % Households |
| Dial-Up Internet | 0 | 0.0% |
| Broadband Home | 90 | 98.9% |
| Cellular Data Only | 1 | 1.1% |
| Satellite Internet | 3 | 3.3% |
| No Internet | 0 | 0.0% |
| Total | 91 | 100.0% |
Mount Gretna borough Summary
Gretna Borough is a small borough located in Lebanon County, Pennsylvania. It is situated in the southeastern corner of the county, and is bordered by Cornwall, South Londonderry, and Mount Joy Townships. The borough is home to a population of approximately 500 people, and is known for its quaint atmosphere and picturesque scenery.
History
Gretna Borough was founded in 1891, and was named after the nearby mountain, Mount Gretna. The area was originally inhabited by the Susquehannock Indians, who were later displaced by European settlers. The first settlers in the area were mostly of German descent, and the area was known as “Gretna” due to its proximity to the mountain.
In the late 19th century, the area began to develop as a summer resort destination. The Chautauqua Assembly of Pennsylvania was established in 1892, and the area quickly became a popular destination for vacationers. The Chautauqua Assembly was a popular destination for lectures, concerts, and other cultural events.
In the early 20th century, the area began to develop as a residential community. The borough was officially incorporated in 1921, and the population began to grow steadily. The borough was home to a variety of businesses, including a hotel, a general store, and a post office.
Geography
Gretna Borough is located in the southeastern corner of Lebanon County, Pennsylvania. It is bordered by Cornwall, South Londonderry, and Mount Joy Townships. The borough is situated in a rural area, and is surrounded by rolling hills and farmland. The borough is located approximately 10 miles from the city of Lebanon, and is approximately 30 miles from the state capital of Harrisburg.
The borough is home to a variety of natural features, including Mount Gretna, which is the highest point in the borough. The mountain is a popular destination for hikers and outdoor enthusiasts. The borough is also home to a variety of streams and creeks, including the Conewago Creek, which runs through the borough.
Economy
Gretna Borough is a small, rural community, and the economy is largely based on agriculture and tourism. The borough is home to a variety of small businesses, including restaurants, retail stores, and bed and breakfasts. The borough is also home to a variety of recreational activities, including hiking, fishing, and camping.
The borough is also home to a variety of cultural attractions, including the Chautauqua Assembly of Pennsylvania, which is a popular destination for lectures, concerts, and other cultural events. The borough is also home to a variety of art galleries, museums, and theaters.
Demographics
Gretna Borough is home to a population of approximately 500 people. The population is largely white, with a small percentage of African Americans and Hispanics. The median household income in the borough is approximately $50,000, and the median home value is approximately $200,000. The borough is home to a variety of religious denominations, including Catholic, Lutheran, and Methodist.
Conclusion
Gretna Borough is a small borough located in Lebanon County, Pennsylvania. It is situated in the southeastern corner of the county, and is bordered by Cornwall, South Londonderry, and Mount Joy Townships. The borough is home to a population of approximately 500 people, and is known for its quaint atmosphere and picturesque scenery. The economy of the borough is largely based on agriculture and tourism, and the borough is home to a variety of small businesses, recreational activities, and cultural attractions.
Common Questions
What is Per Capita Income in Mount Gretna borough?
Per Capita income in Mount Gretna borough is $72,213.
What is the Median Family Income in Mount Gretna borough?
Median Family Income in Mount Gretna borough is $106,875.
What is the Median Household income in Mount Gretna borough?
Median Household Income in Mount Gretna borough is $105,313.
What is Income or Wage Gap in Mount Gretna borough?
Income or Wage Gap in Mount Gretna borough is 10.2%.
Women in Mount Gretna borough earn 89.8 cents for every dollar earned by a man.
What is Inequality or Gini Index in Mount Gretna borough?
Inequality or Gini Index in Mount Gretna borough is 0.43.
What is the Total Population of Mount Gretna borough?
Total Population of Mount Gretna borough is 197.
What is the Total Male Population of Mount Gretna borough?
Total Male Population of Mount Gretna borough is 101.
What is the Total Female Population of Mount Gretna borough?
Total Female Population of Mount Gretna borough is 96.
What is the Ratio of Males per 100 Females in Mount Gretna borough?
There are 105.21 Males per 100 Females in Mount Gretna borough.
What is the Ratio of Females per 100 Males in Mount Gretna borough?
There are 95.05 Females per 100 Males in Mount Gretna borough.
What is the Median Population Age in Mount Gretna borough?
Median Population Age in Mount Gretna borough is 67.2 Years.
What is the Average Family Size in Mount Gretna borough
Average Family Size in Mount Gretna borough is 2.5 People.
What is the Average Household Size in Mount Gretna borough
Average Household Size in Mount Gretna borough is 2.2 People.
How Large is the Labor Force in Mount Gretna borough?
There are 71 People in the Labor Forcein in Mount Gretna borough.
What is the Percentage of People in the Labor Force in Mount Gretna borough?
40.1% of People are in the Labor Force in Mount Gretna borough.