Green Lane borough, PA Map & Demographics
Green Lane borough Overview
$88,105
PER CAPITA INCOME
$74,583
AVG FAMILY INCOME
$74,167
AVG HOUSEHOLD INCOME
51.2%
WAGE / INCOME GAP [ % ]
48.8¢/ $1
WAGE / INCOME GAP [ $ ]
0.70
INEQUALITY / GINI INDEX
375
TOTAL POPULATION
154
MALE POPULATION
221
FEMALE POPULATION
69.68
MALES / 100 FEMALES
143.51
FEMALES / 100 MALES
44.5
MEDIAN AGE
3.2
AVG FAMILY SIZE
2.3
AVG HOUSEHOLD SIZE
205
LABOR FORCE [ PEOPLE ]
66.6%
PERCENT IN LABOR FORCE
3.4%
UNEMPLOYMENT RATE
Income in Green Lane borough
Income Overview in Green Lane borough
Per Capita Income in Green Lane borough is $88,105, while median incomes of families and households are $74,583 and $74,167 respectively.
| Characteristic | Number | Measure |
| Per Capita Income | 375 | $88,105 |
| Median Family Income | 81 | $74,583 |
| Mean Family Income | 81 | $100,307 |
| Median Household Income | 160 | $74,167 |
| Mean Household Income | 160 | $213,320 |
| Income Deficit | 81 | $0 |
| Wage / Income Gap (%) | 375 | 51.19% |
| Wage / Income Gap ($) | 375 | 48.81¢ per $1 |
| Gini / Inequality Index | 375 | 0.70 |
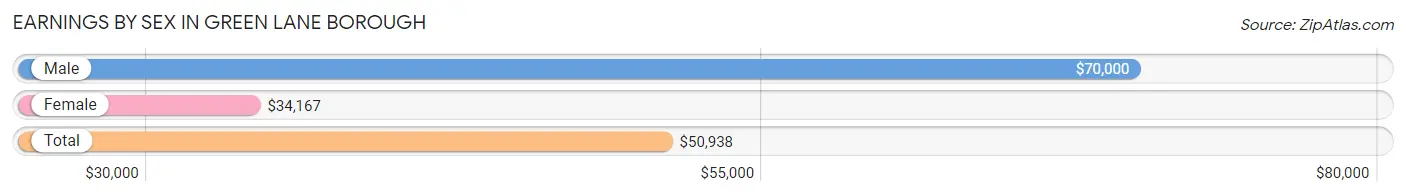
Earnings by Sex in Green Lane borough
Average Earnings in Green Lane borough are $50,938, $70,000 for men and $34,167 for women, a difference of 51.2%.
| Sex | Number | Average Earnings |
| Male | 92 (42.2%) | $70,000 |
| Female | 126 (57.8%) | $34,167 |
| Total | 218 (100.0%) | $50,938 |
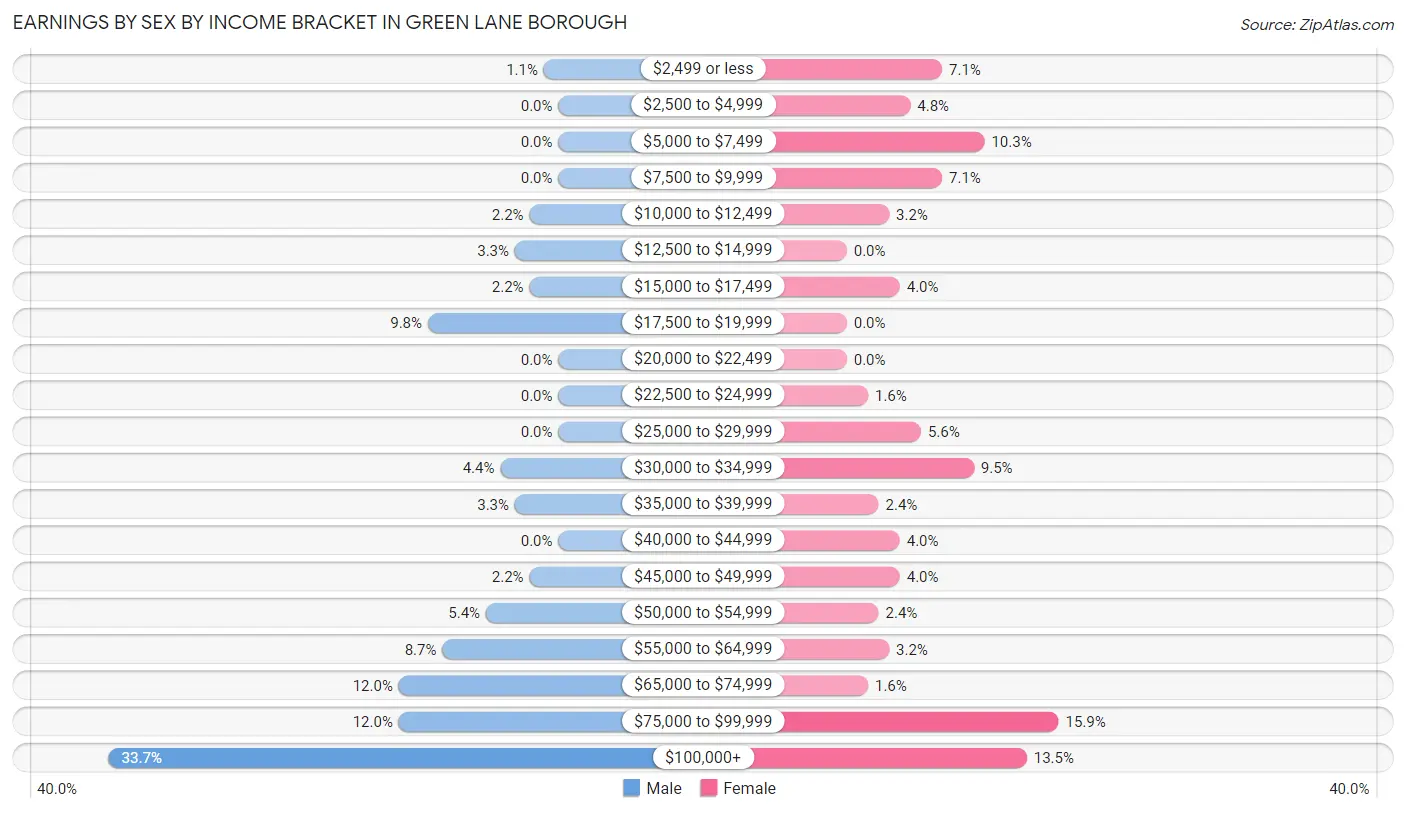
Earnings by Sex by Income Bracket in Green Lane borough
The most common earnings brackets in Green Lane borough are $100,000+ for men (31 | 33.7%) and $75,000 to $99,999 for women (20 | 15.9%).
| Income | Male | Female |
| $2,499 or less | 1 (1.1%) | 9 (7.1%) |
| $2,500 to $4,999 | 0 (0.0%) | 6 (4.8%) |
| $5,000 to $7,499 | 0 (0.0%) | 13 (10.3%) |
| $7,500 to $9,999 | 0 (0.0%) | 9 (7.1%) |
| $10,000 to $12,499 | 2 (2.2%) | 4 (3.2%) |
| $12,500 to $14,999 | 3 (3.3%) | 0 (0.0%) |
| $15,000 to $17,499 | 2 (2.2%) | 5 (4.0%) |
| $17,500 to $19,999 | 9 (9.8%) | 0 (0.0%) |
| $20,000 to $22,499 | 0 (0.0%) | 0 (0.0%) |
| $22,500 to $24,999 | 0 (0.0%) | 2 (1.6%) |
| $25,000 to $29,999 | 0 (0.0%) | 7 (5.6%) |
| $30,000 to $34,999 | 4 (4.3%) | 12 (9.5%) |
| $35,000 to $39,999 | 3 (3.3%) | 3 (2.4%) |
| $40,000 to $44,999 | 0 (0.0%) | 5 (4.0%) |
| $45,000 to $49,999 | 2 (2.2%) | 5 (4.0%) |
| $50,000 to $54,999 | 5 (5.4%) | 3 (2.4%) |
| $55,000 to $64,999 | 8 (8.7%) | 4 (3.2%) |
| $65,000 to $74,999 | 11 (12.0%) | 2 (1.6%) |
| $75,000 to $99,999 | 11 (12.0%) | 20 (15.9%) |
| $100,000+ | 31 (33.7%) | 17 (13.5%) |
| Total | 92 (100.0%) | 126 (100.0%) |
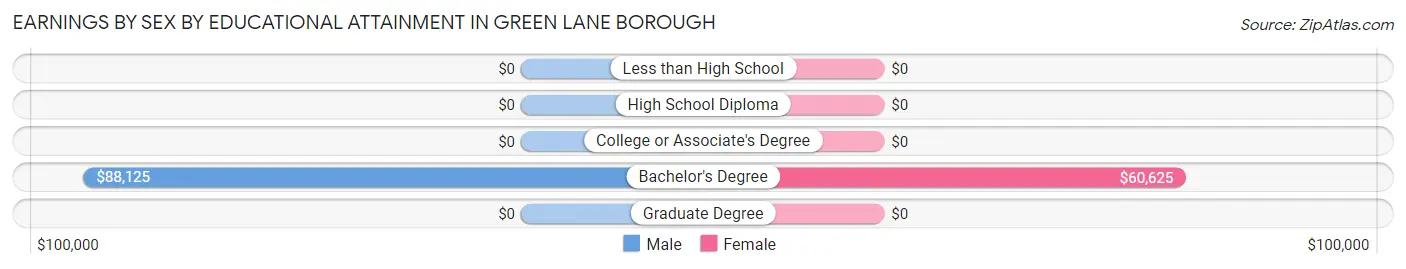
Earnings by Sex by Educational Attainment in Green Lane borough
Average earnings in Green Lane borough are $70,000 for men and $45,500 for women, a difference of 35.0%. Men with an educational attainment of bachelor's degree enjoy the highest average annual earnings of $88,125, while those with bachelor's degree education earn the least with $88,125. Women with an educational attainment of bachelor's degree earn the most with the average annual earnings of $60,625, while those with bachelor's degree education have the smallest earnings of $60,625.
| Educational Attainment | Male Income | Female Income |
| Less than High School | - | - |
| High School Diploma | - | - |
| College or Associate's Degree | - | - |
| Bachelor's Degree | $88,125 | $60,625 |
| Graduate Degree | - | - |
| Total | $70,000 | $45,500 |
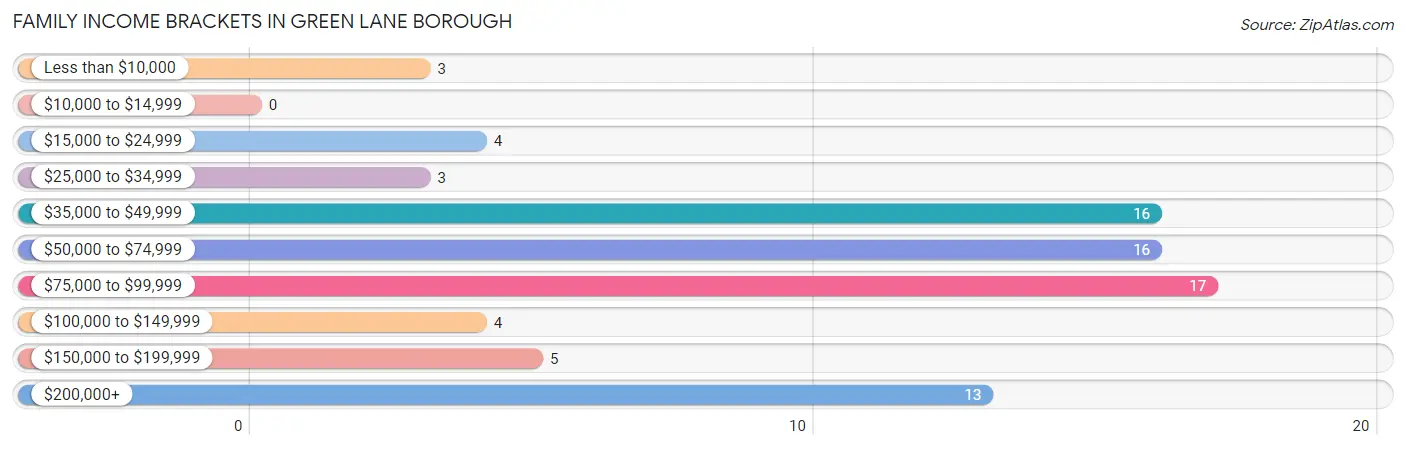
Family Income in Green Lane borough
Family Income Brackets in Green Lane borough
According to the Green Lane borough family income data, there are 17 families falling into the $75,000 to $99,999 income range, which is the most common income bracket and makes up 21.0% of all families.
| Income Bracket | # Families | % Families |
| Less than $10,000 | 3 | 3.7% |
| $10,000 to $14,999 | 0 | 0.0% |
| $15,000 to $24,999 | 4 | 4.9% |
| $25,000 to $34,999 | 3 | 3.7% |
| $35,000 to $49,999 | 16 | 19.8% |
| $50,000 to $74,999 | 16 | 19.8% |
| $75,000 to $99,999 | 17 | 21.0% |
| $100,000 to $149,999 | 4 | 4.9% |
| $150,000 to $199,999 | 5 | 6.2% |
| $200,000+ | 13 | 16.0% |
Family Income by Famaliy Size in Green Lane borough
4-person families (13 | 16.1%) account for the highest median family income in Green Lane borough with $250,001 per family, while 4-person families (13 | 16.1%) have the highest median income of $62,500 per family member.
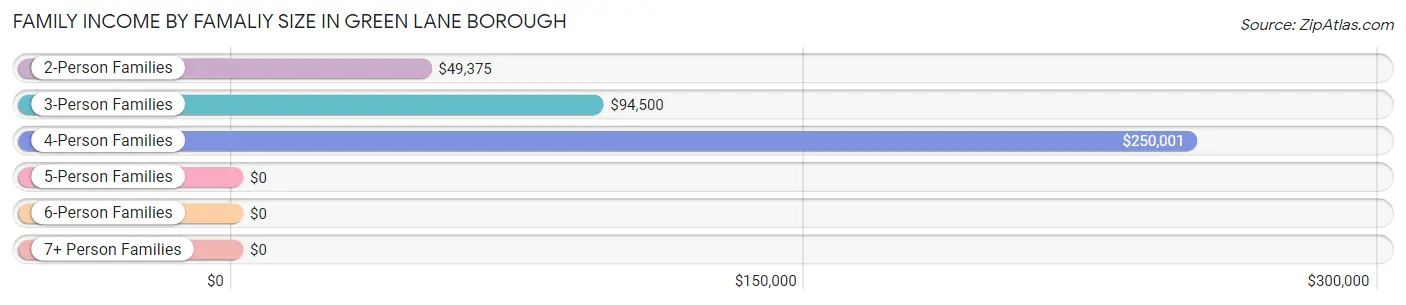
| Income Bracket | # Families | Median Income |
| 2-Person Families | 31 (38.3%) | $49,375 |
| 3-Person Families | 26 (32.1%) | $94,500 |
| 4-Person Families | 13 (16.1%) | $250,001 |
| 5-Person Families | 5 (6.2%) | $0 |
| 6-Person Families | 6 (7.4%) | $0 |
| 7+ Person Families | 0 (0.0%) | $0 |
| Total | 81 (100.0%) | $74,583 |
Family Income by Number of Earners in Green Lane borough
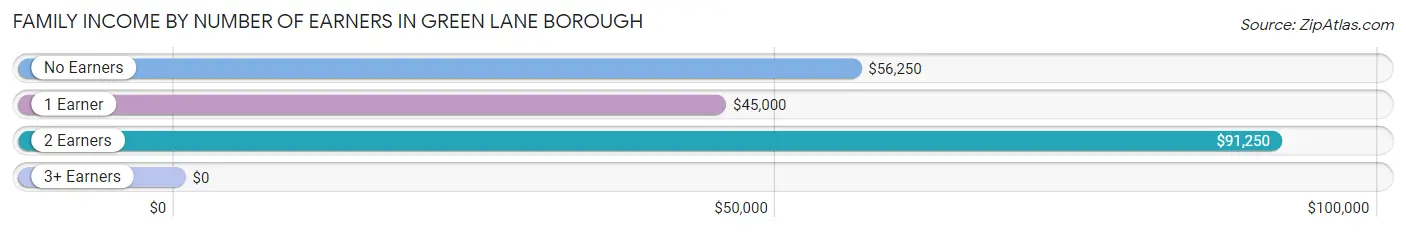
| Number of Earners | # Families | Median Income |
| No Earners | 15 (18.5%) | $56,250 |
| 1 Earner | 14 (17.3%) | $45,000 |
| 2 Earners | 30 (37.0%) | $91,250 |
| 3+ Earners | 22 (27.2%) | $0 |
| Total | 81 (100.0%) | $74,583 |
Household Income in Green Lane borough
Household Income Brackets in Green Lane borough
With 43 households falling in the category, the $35,000 to $49,999 income range is the most frequent in Green Lane borough, accounting for 26.9% of all households.
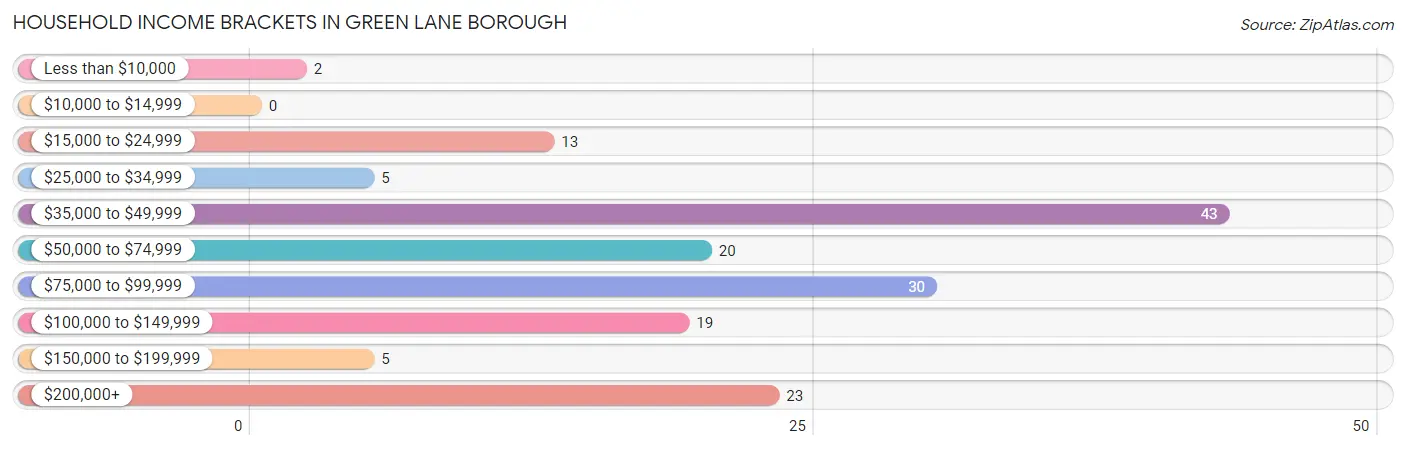
| Income Bracket | # Households | % Households |
| Less than $10,000 | 2 | 1.3% |
| $10,000 to $14,999 | 0 | 0.0% |
| $15,000 to $24,999 | 13 | 8.1% |
| $25,000 to $34,999 | 5 | 3.1% |
| $35,000 to $49,999 | 43 | 26.9% |
| $50,000 to $74,999 | 20 | 12.5% |
| $75,000 to $99,999 | 30 | 18.8% |
| $100,000 to $149,999 | 19 | 11.9% |
| $150,000 to $199,999 | 5 | 3.1% |
| $200,000+ | 23 | 14.4% |
Household Income by Householder Age in Green Lane borough
The median household income in Green Lane borough is $74,167, with the highest median household income of $100,313 found in the 45 to 64 years age bracket for the primary householder. A total of 61 households (38.1%) fall into this category.
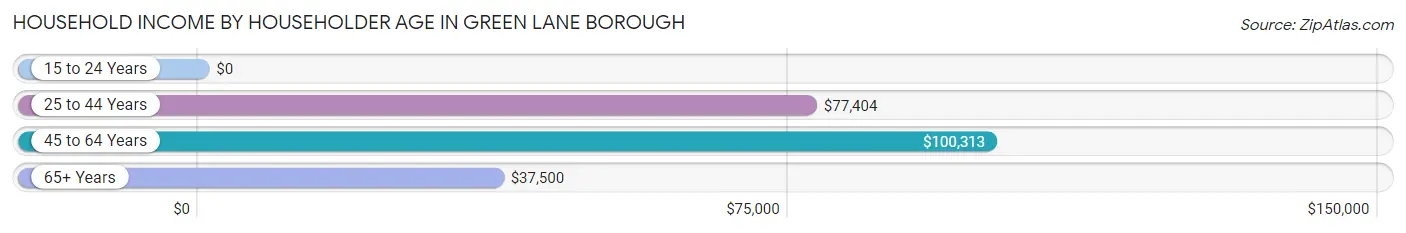
| Income Bracket | # Households | Median Income |
| 15 to 24 Years | 0 (0.0%) | $0 |
| 25 to 44 Years | 41 (25.6%) | $77,404 |
| 45 to 64 Years | 61 (38.1%) | $100,313 |
| 65+ Years | 58 (36.2%) | $37,500 |
| Total | 160 (100.0%) | $74,167 |
Poverty in Green Lane borough
Income Below Poverty by Sex and Age in Green Lane borough
With 1.9% poverty level for males and 5.6% for females among the residents of Green Lane borough, 35 to 44 year old males and 15 year old females are the most vulnerable to poverty, with 3 males (21.4%) and 3 females (42.9%) in their respective age groups living below the poverty level.
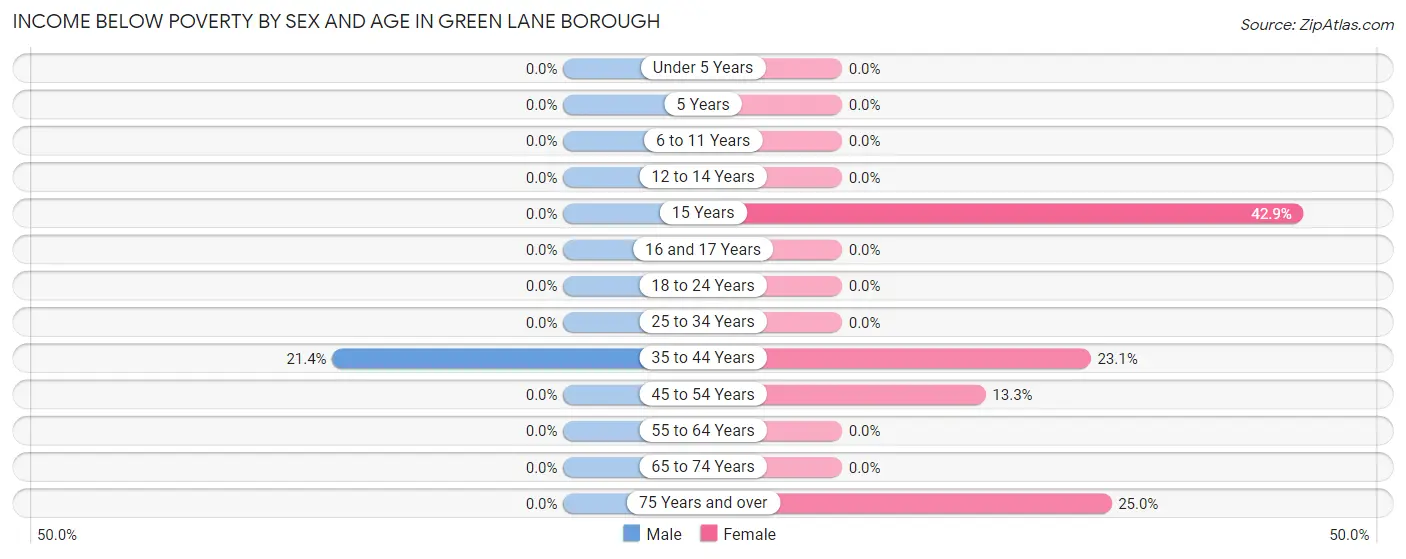
| Age Bracket | Male | Female |
| Under 5 Years | 0 (0.0%) | 0 (0.0%) |
| 5 Years | 0 (0.0%) | 0 (0.0%) |
| 6 to 11 Years | 0 (0.0%) | 0 (0.0%) |
| 12 to 14 Years | 0 (0.0%) | 0 (0.0%) |
| 15 Years | 0 (0.0%) | 3 (42.9%) |
| 16 and 17 Years | 0 (0.0%) | 0 (0.0%) |
| 18 to 24 Years | 0 (0.0%) | 0 (0.0%) |
| 25 to 34 Years | 0 (0.0%) | 0 (0.0%) |
| 35 to 44 Years | 3 (21.4%) | 3 (23.1%) |
| 45 to 54 Years | 0 (0.0%) | 4 (13.3%) |
| 55 to 64 Years | 0 (0.0%) | 0 (0.0%) |
| 65 to 74 Years | 0 (0.0%) | 0 (0.0%) |
| 75 Years and over | 0 (0.0%) | 2 (25.0%) |
| Total | 3 (1.9%) | 12 (5.6%) |
Income Above Poverty by Sex and Age in Green Lane borough
According to the poverty statistics in Green Lane borough, males aged under 5 years and females aged under 5 years are the age groups that are most secure financially, with 100.0% of males and 100.0% of females in these age groups living above the poverty line.
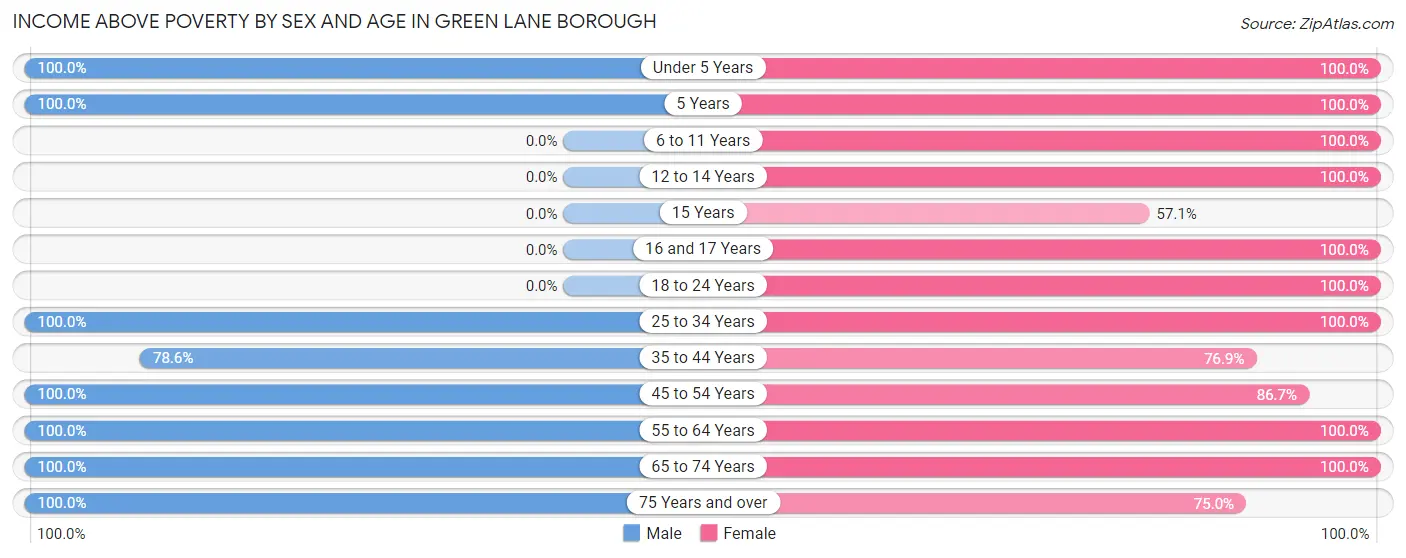
| Age Bracket | Male | Female |
| Under 5 Years | 24 (100.0%) | 7 (100.0%) |
| 5 Years | 8 (100.0%) | 3 (100.0%) |
| 6 to 11 Years | 0 (0.0%) | 5 (100.0%) |
| 12 to 14 Years | 0 (0.0%) | 5 (100.0%) |
| 15 Years | 0 (0.0%) | 4 (57.1%) |
| 16 and 17 Years | 0 (0.0%) | 6 (100.0%) |
| 18 to 24 Years | 0 (0.0%) | 23 (100.0%) |
| 25 to 34 Years | 29 (100.0%) | 36 (100.0%) |
| 35 to 44 Years | 11 (78.6%) | 10 (76.9%) |
| 45 to 54 Years | 16 (100.0%) | 26 (86.7%) |
| 55 to 64 Years | 30 (100.0%) | 39 (100.0%) |
| 65 to 74 Years | 25 (100.0%) | 31 (100.0%) |
| 75 Years and over | 8 (100.0%) | 6 (75.0%) |
| Total | 151 (98.1%) | 201 (94.4%) |
Income Below Poverty Among Married-Couple Families in Green Lane borough
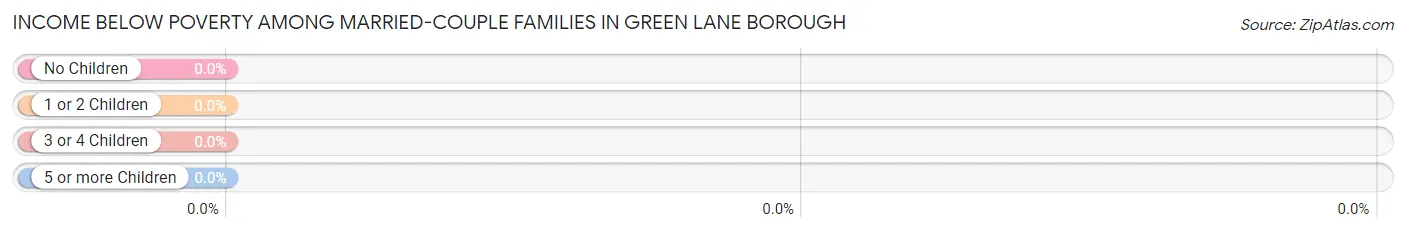
| Children | Above Poverty | Below Poverty |
| No Children | 44 (100.0%) | 0 (0.0%) |
| 1 or 2 Children | 18 (100.0%) | 0 (0.0%) |
| 3 or 4 Children | 11 (100.0%) | 0 (0.0%) |
| 5 or more Children | 0 (0.0%) | 0 (0.0%) |
| Total | 73 (100.0%) | 0 (0.0%) |
Income Below Poverty Among Single-Parent Households in Green Lane borough
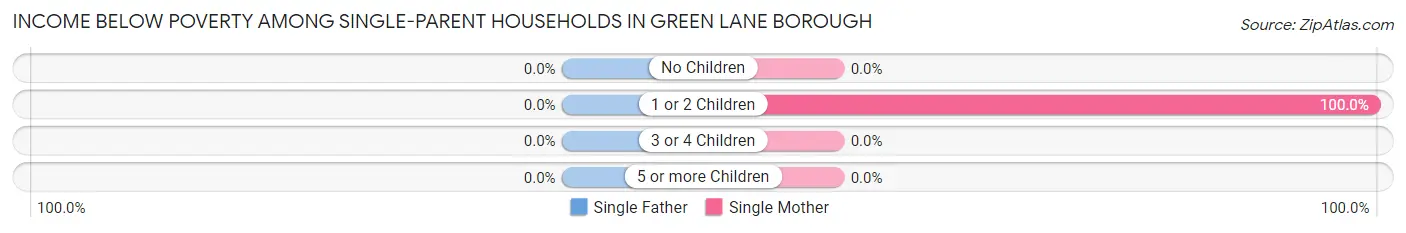
| Children | Single Father | Single Mother |
| No Children | 0 (0.0%) | 0 (0.0%) |
| 1 or 2 Children | 0 (0.0%) | 3 (100.0%) |
| 3 or 4 Children | 0 (0.0%) | 0 (0.0%) |
| 5 or more Children | 0 (0.0%) | 0 (0.0%) |
| Total | 0 (0.0%) | 3 (37.5%) |
Income Below Poverty Among Married-Couple vs Single-Parent Households in Green Lane borough
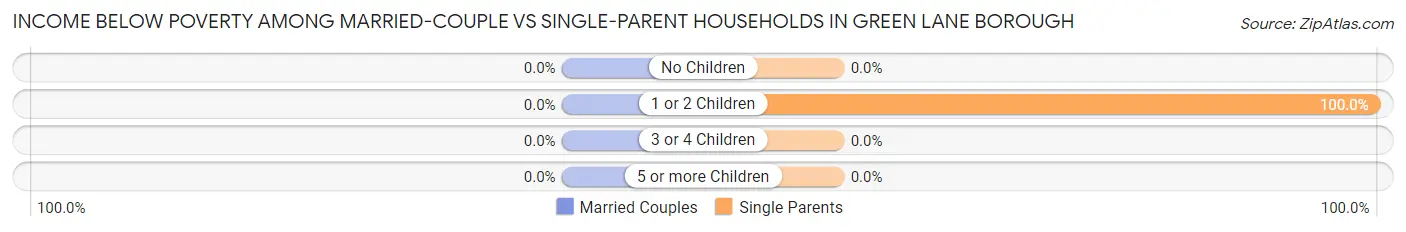
| Children | Married-Couple Families | Single-Parent Households |
| No Children | 0 (0.0%) | 0 (0.0%) |
| 1 or 2 Children | 0 (0.0%) | 3 (100.0%) |
| 3 or 4 Children | 0 (0.0%) | 0 (0.0%) |
| 5 or more Children | 0 (0.0%) | 0 (0.0%) |
| Total | 0 (0.0%) | 3 (37.5%) |
Race in Green Lane borough
The most populous races in Green Lane borough are White / Caucasian (346 | 92.3%), Black / African American (21 | 5.6%), and Hispanic or Latino (9 | 2.4%).
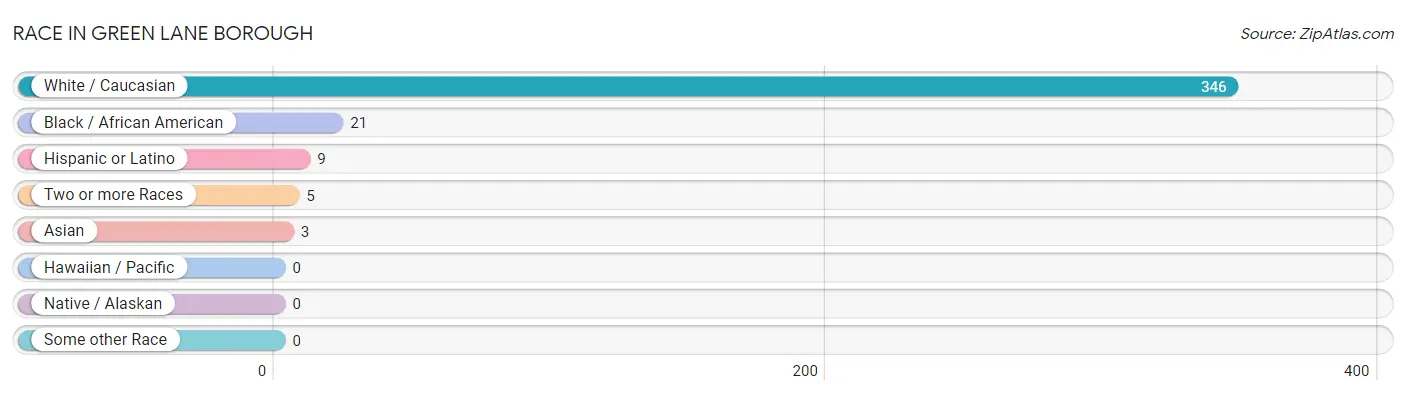
| Race | # Population | % Population |
| Asian | 3 | 0.8% |
| Black / African American | 21 | 5.6% |
| Hawaiian / Pacific | 0 | 0.0% |
| Hispanic or Latino | 9 | 2.4% |
| Native / Alaskan | 0 | 0.0% |
| White / Caucasian | 346 | 92.3% |
| Two or more Races | 5 | 1.3% |
| Some other Race | 0 | 0.0% |
| Total | 375 | 100.0% |
Ancestry in Green Lane borough
The most populous ancestries reported in Green Lane borough are German (113 | 30.1%), Irish (39 | 10.4%), Polish (36 | 9.6%), European (23 | 6.1%), and Italian (22 | 5.9%), together accounting for 62.1% of all Green Lane borough residents.
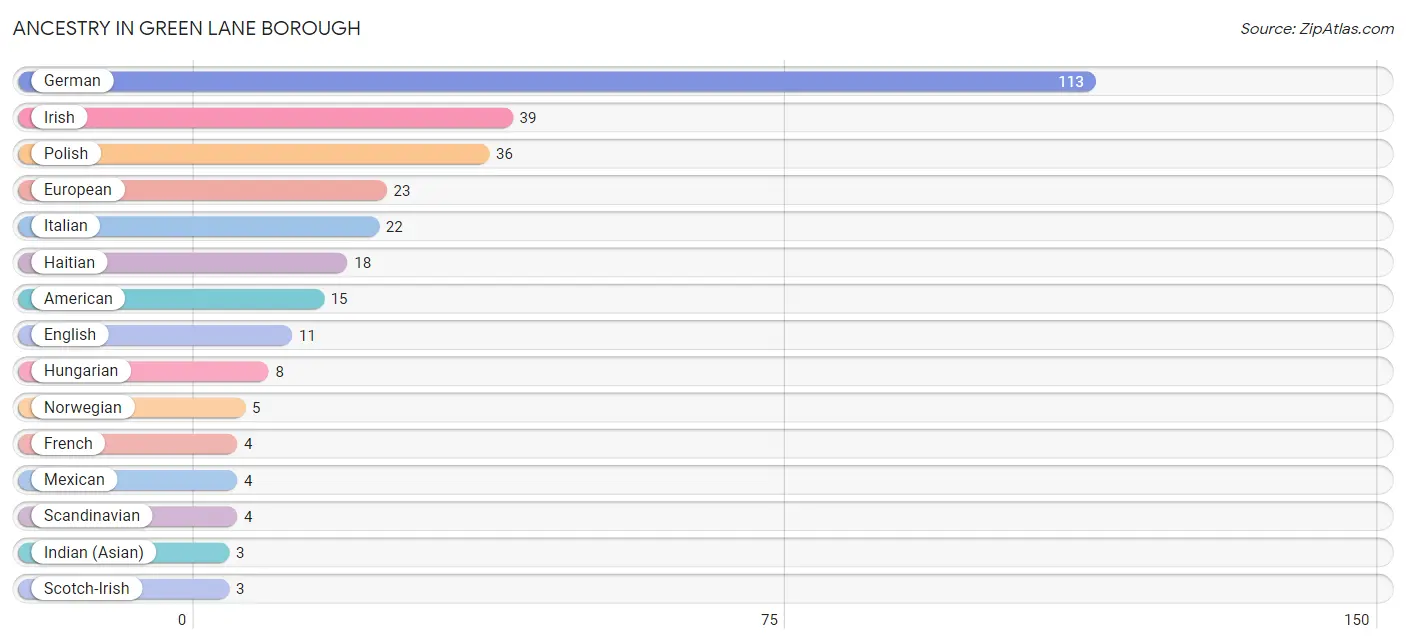
| Ancestry | # Population | % Population |
| American | 15 | 4.0% |
| Argentinean | 2 | 0.5% |
| Austrian | 1 | 0.3% |
| Eastern European | 2 | 0.5% |
| English | 11 | 2.9% |
| European | 23 | 6.1% |
| French | 4 | 1.1% |
| German | 113 | 30.1% |
| Haitian | 18 | 4.8% |
| Hungarian | 8 | 2.1% |
| Indian (Asian) | 3 | 0.8% |
| Irish | 39 | 10.4% |
| Italian | 22 | 5.9% |
| Mexican | 4 | 1.1% |
| Norwegian | 5 | 1.3% |
| Polish | 36 | 9.6% |
| Portuguese | 2 | 0.5% |
| Scandinavian | 4 | 1.1% |
| Scotch-Irish | 3 | 0.8% |
| Scottish | 3 | 0.8% |
| South American | 2 | 0.5% |
| Spanish | 3 | 0.8% |
| Welsh | 2 | 0.5% | View All 23 Rows |
Immigrants in Green Lane borough
The most numerous immigrant groups reported in Green Lane borough came from Latin America (12 | 3.2%), Caribbean (10 | 2.7%), Haiti (10 | 2.7%), Eastern Europe (6 | 1.6%), and Europe (6 | 1.6%), together accounting for 11.7% of all Green Lane borough residents.
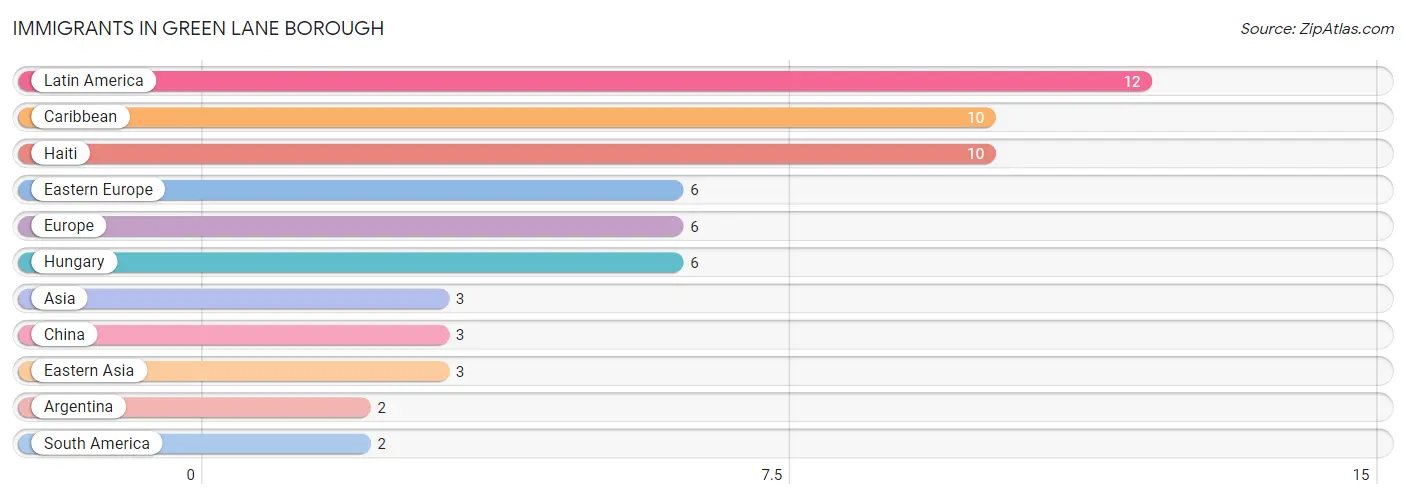
| Immigration Origin | # Population | % Population |
| Argentina | 2 | 0.5% |
| Asia | 3 | 0.8% |
| Caribbean | 10 | 2.7% |
| China | 3 | 0.8% |
| Eastern Asia | 3 | 0.8% |
| Eastern Europe | 6 | 1.6% |
| Europe | 6 | 1.6% |
| Haiti | 10 | 2.7% |
| Hungary | 6 | 1.6% |
| Latin America | 12 | 3.2% |
| South America | 2 | 0.5% | View All 11 Rows |
Sex and Age in Green Lane borough
Sex and Age in Green Lane borough
The most populous age groups in Green Lane borough are Under 5 Years (24 | 15.6%) for men and 15 to 19 Years (27 | 12.2%) for women.
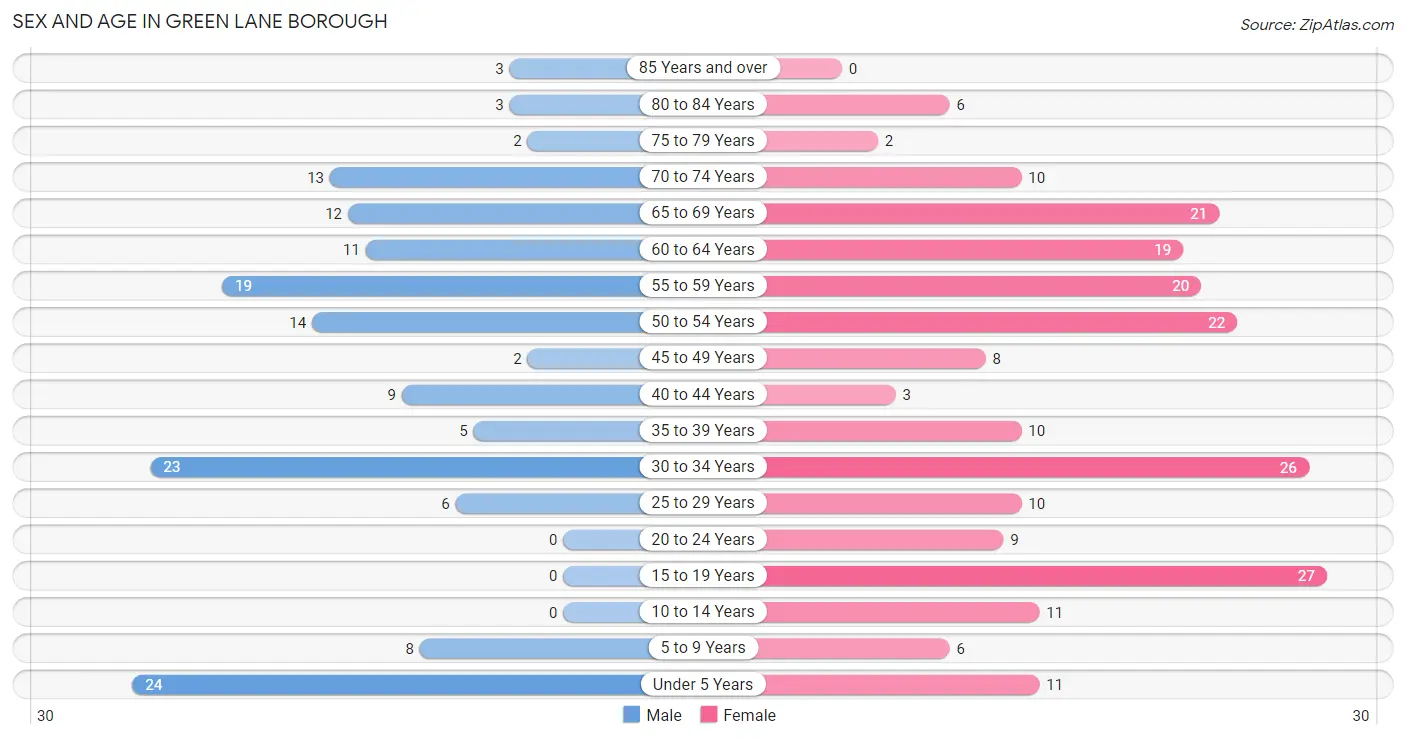
| Age Bracket | Male | Female |
| Under 5 Years | 24 (15.6%) | 11 (5.0%) |
| 5 to 9 Years | 8 (5.2%) | 6 (2.7%) |
| 10 to 14 Years | 0 (0.0%) | 11 (5.0%) |
| 15 to 19 Years | 0 (0.0%) | 27 (12.2%) |
| 20 to 24 Years | 0 (0.0%) | 9 (4.1%) |
| 25 to 29 Years | 6 (3.9%) | 10 (4.5%) |
| 30 to 34 Years | 23 (14.9%) | 26 (11.8%) |
| 35 to 39 Years | 5 (3.3%) | 10 (4.5%) |
| 40 to 44 Years | 9 (5.8%) | 3 (1.4%) |
| 45 to 49 Years | 2 (1.3%) | 8 (3.6%) |
| 50 to 54 Years | 14 (9.1%) | 22 (10.0%) |
| 55 to 59 Years | 19 (12.3%) | 20 (9.0%) |
| 60 to 64 Years | 11 (7.1%) | 19 (8.6%) |
| 65 to 69 Years | 12 (7.8%) | 21 (9.5%) |
| 70 to 74 Years | 13 (8.4%) | 10 (4.5%) |
| 75 to 79 Years | 2 (1.3%) | 2 (0.9%) |
| 80 to 84 Years | 3 (1.9%) | 6 (2.7%) |
| 85 Years and over | 3 (1.9%) | 0 (0.0%) |
| Total | 154 (100.0%) | 221 (100.0%) |
Families and Households in Green Lane borough
Median Family Size in Green Lane borough
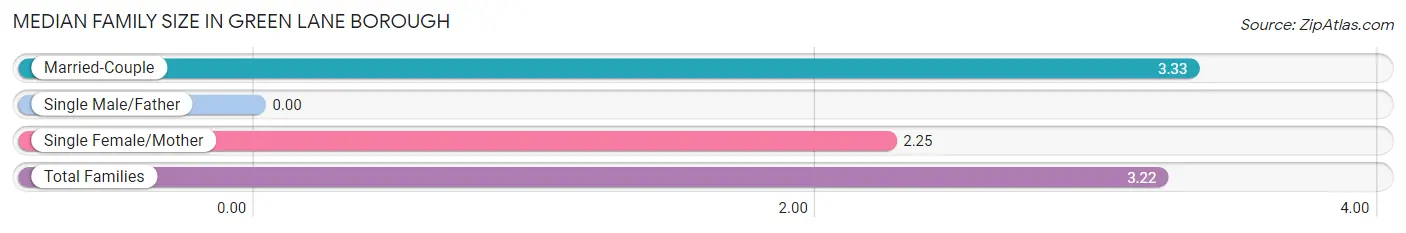
| Family Type | # Families | Family Size |
| Married-Couple | 73 (90.1%) | 3.33 |
| Single Male/Father | 0 (0.0%) | - |
| Single Female/Mother | 8 (9.9%) | 2.25 |
| Total Families | 81 (100.0%) | 3.22 |
Median Household Size in Green Lane borough
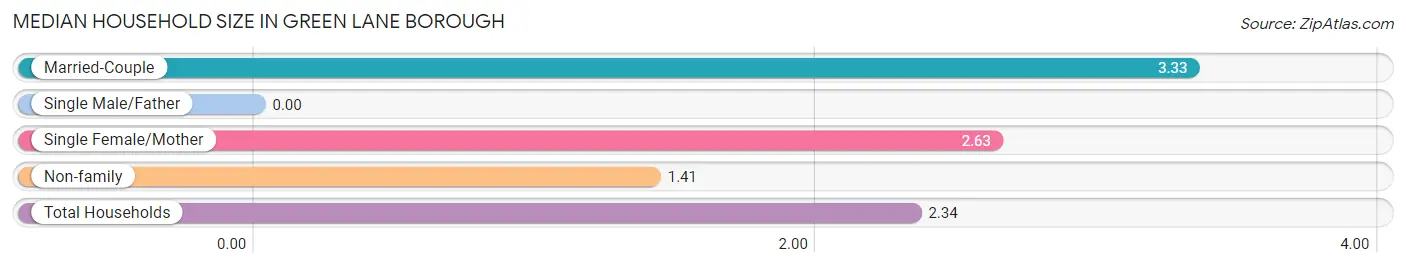
| Household Type | # Households | Household Size |
| Married-Couple | 73 (45.6%) | 3.33 |
| Single Male/Father | 0 (0.0%) | - |
| Single Female/Mother | 8 (5.0%) | 2.63 |
| Non-family | 79 (49.4%) | 1.41 |
| Total Households | 160 (100.0%) | 2.34 |
Household Size by Marriage Status in Green Lane borough
Out of a total of 160 households in Green Lane borough, 81 (50.6%) are family households, while 79 (49.4%) are nonfamily households. The most numerous type of family households are 3-person households, comprising 29, and the most common type of nonfamily households are 1-person households, comprising 60.
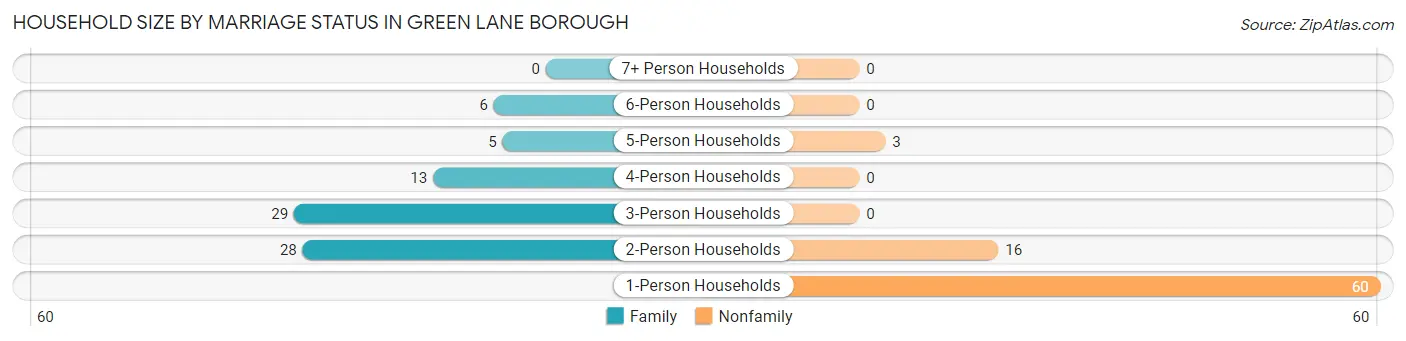
| Household Size | Family Households | Nonfamily Households |
| 1-Person Households | - | 60 (37.5%) |
| 2-Person Households | 28 (17.5%) | 16 (10.0%) |
| 3-Person Households | 29 (18.1%) | 0 (0.0%) |
| 4-Person Households | 13 (8.1%) | 0 (0.0%) |
| 5-Person Households | 5 (3.1%) | 3 (1.9%) |
| 6-Person Households | 6 (3.7%) | 0 (0.0%) |
| 7+ Person Households | 0 (0.0%) | 0 (0.0%) |
| Total | 81 (50.6%) | 79 (49.4%) |
Female Fertility in Green Lane borough
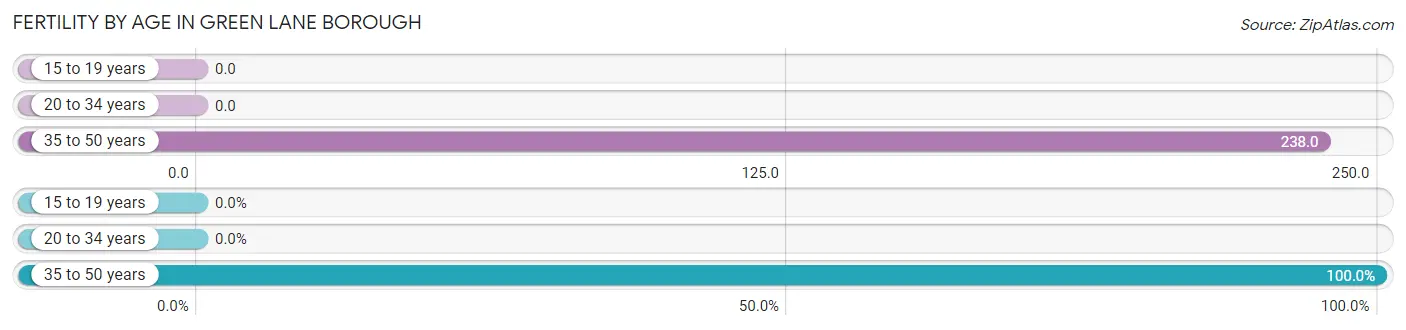
Fertility by Age in Green Lane borough
Average fertility rate in Green Lane borough is 54.0 births per 1,000 women. Women in the age bracket of 35 to 50 years have the highest fertility rate with 238.0 births per 1,000 women. Women in the age bracket of 35 to 50 years acount for 100.0% of all women with births.
| Age Bracket | Women with Births | Births / 1,000 Women |
| 15 to 19 years | 0 (0.0%) | 0.0 |
| 20 to 34 years | 0 (0.0%) | 0.0 |
| 35 to 50 years | 5 (100.0%) | 238.0 |
| Total | 5 (100.0%) | 54.0 |
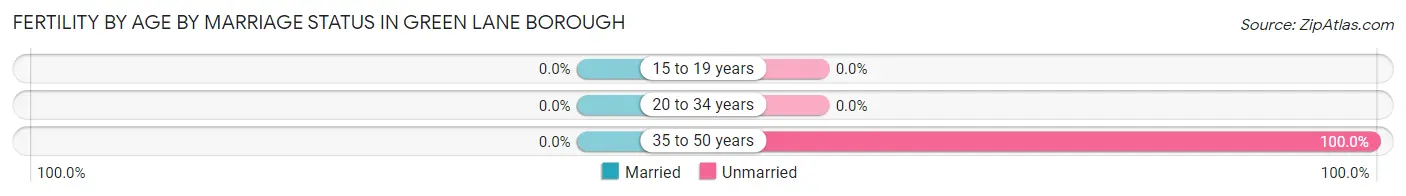
Fertility by Age by Marriage Status in Green Lane borough
| Age Bracket | Married | Unmarried |
| 15 to 19 years | 0 (0.0%) | 0 (0.0%) |
| 20 to 34 years | 0 (0.0%) | 0 (0.0%) |
| 35 to 50 years | 0 (0.0%) | 5 (100.0%) |
| Total | 0 (0.0%) | 5 (100.0%) |
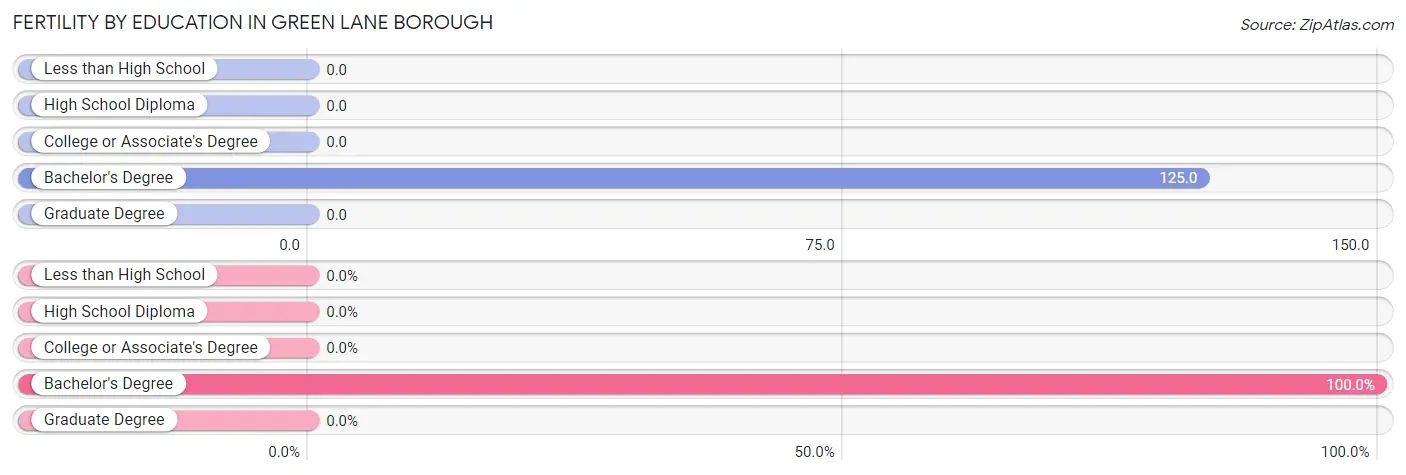
Fertility by Education in Green Lane borough
| Educational Attainment | Women with Births | Births / 1,000 Women |
| Less than High School | 0 (0.0%) | 0.0 |
| High School Diploma | 0 (0.0%) | 0.0 |
| College or Associate's Degree | 0 (0.0%) | 0.0 |
| Bachelor's Degree | 5 (100.0%) | 125.0 |
| Graduate Degree | 0 (0.0%) | 0.0 |
| Total | 5 (100.0%) | 54.0 |
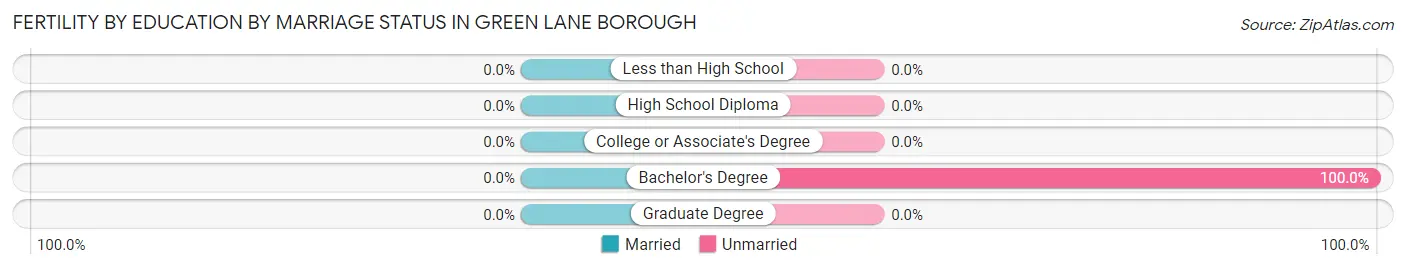
Fertility by Education by Marriage Status in Green Lane borough
| Educational Attainment | Married | Unmarried |
| Less than High School | 0 (0.0%) | 0 (0.0%) |
| High School Diploma | 0 (0.0%) | 0 (0.0%) |
| College or Associate's Degree | 0 (0.0%) | 0 (0.0%) |
| Bachelor's Degree | 0 (0.0%) | 5 (100.0%) |
| Graduate Degree | 0 (0.0%) | 0 (0.0%) |
| Total | 0 (0.0%) | 5 (100.0%) |
Employment Characteristics in Green Lane borough
Employment by Class of Employer in Green Lane borough
Among the 198 employed individuals in Green Lane borough, private company employees (169 | 85.4%), not-for-profit organizations (17 | 8.6%), and self-employed (not incorporated) (7 | 3.5%) make up the most common classes of employment.
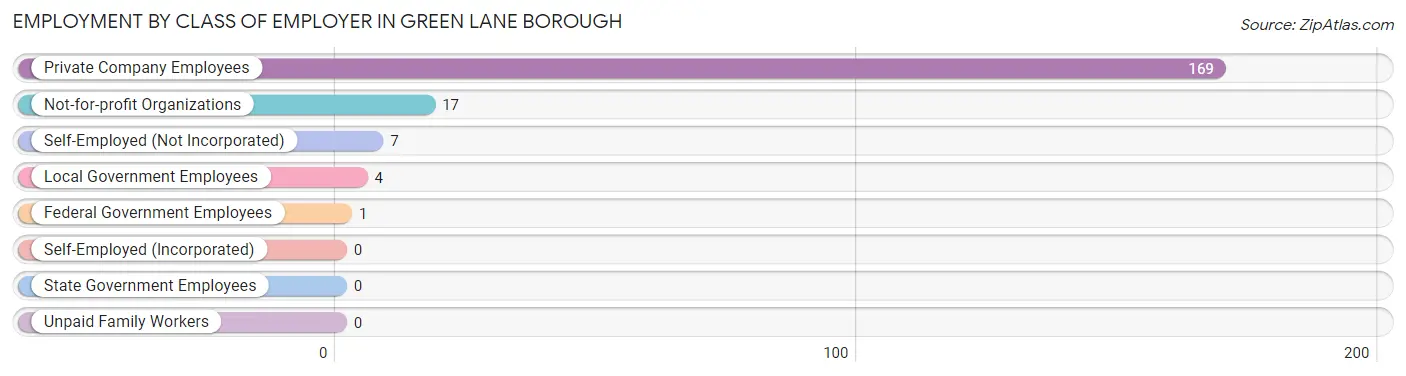
| Employer Class | # Employees | % Employees |
| Private Company Employees | 169 | 85.4% |
| Self-Employed (Incorporated) | 0 | 0.0% |
| Self-Employed (Not Incorporated) | 7 | 3.5% |
| Not-for-profit Organizations | 17 | 8.6% |
| Local Government Employees | 4 | 2.0% |
| State Government Employees | 0 | 0.0% |
| Federal Government Employees | 1 | 0.5% |
| Unpaid Family Workers | 0 | 0.0% |
| Total | 198 | 100.0% |
Employment Status by Age in Green Lane borough
According to the labor force statistics for Green Lane borough, out of the total population over 16 years of age (308), 66.6% or 205 individuals are in the labor force, with 3.4% or 7 of them unemployed. The age group with the highest labor force participation rate is 25 to 29 years, with 100.0% or 16 individuals in the labor force. Within the labor force, the 35 to 44 years age range has the highest percentage of unemployed individuals, with 11.1% or 3 of them being unemployed.
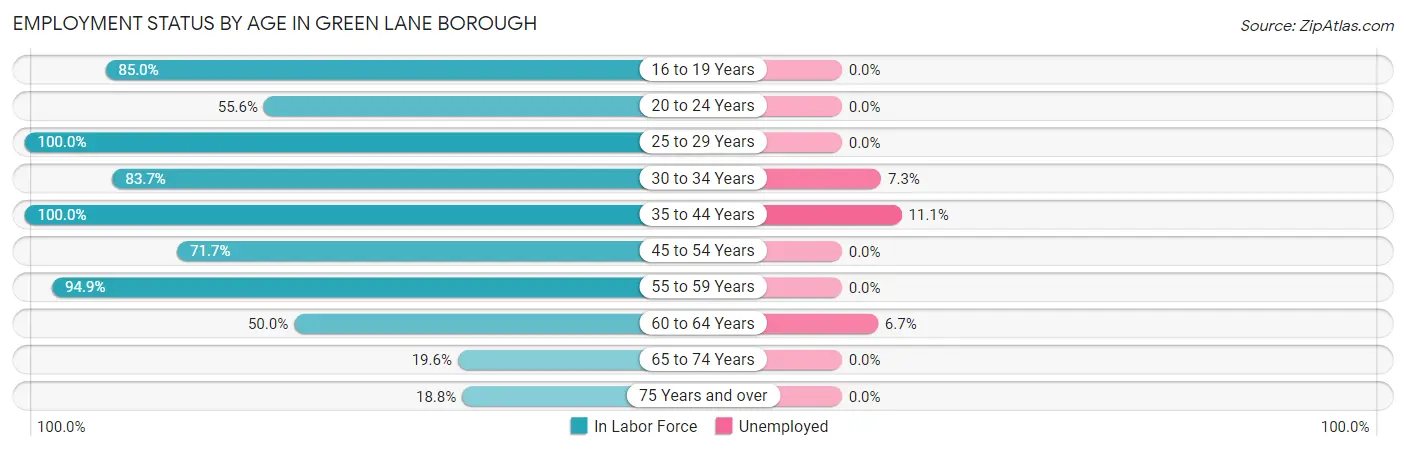
| Age Bracket | In Labor Force | Unemployed |
| 16 to 19 Years | 17 (85.0%) | 0 (0.0%) |
| 20 to 24 Years | 5 (55.6%) | 0 (0.0%) |
| 25 to 29 Years | 16 (100.0%) | 0 (0.0%) |
| 30 to 34 Years | 41 (83.7%) | 3 (7.3%) |
| 35 to 44 Years | 27 (100.0%) | 3 (11.1%) |
| 45 to 54 Years | 33 (71.7%) | 0 (0.0%) |
| 55 to 59 Years | 37 (94.9%) | 0 (0.0%) |
| 60 to 64 Years | 15 (50.0%) | 1 (6.7%) |
| 65 to 74 Years | 11 (19.6%) | 0 (0.0%) |
| 75 Years and over | 3 (18.8%) | 0 (0.0%) |
| Total | 205 (66.6%) | 7 (3.4%) |
Employment Status by Educational Attainment in Green Lane borough
According to labor force statistics for Green Lane borough, 81.6% of individuals (169) out of the total population between 25 and 64 years of age (207) are in the labor force, with 4.1% or 7 of them being unemployed. The group with the highest labor force participation rate are those with the educational attainment of less than high school, with 100.0% or 4 individuals in the labor force. Within the labor force, individuals with less than high school education have the highest percentage of unemployment, with 25.0% or 1 of them being unemployed.
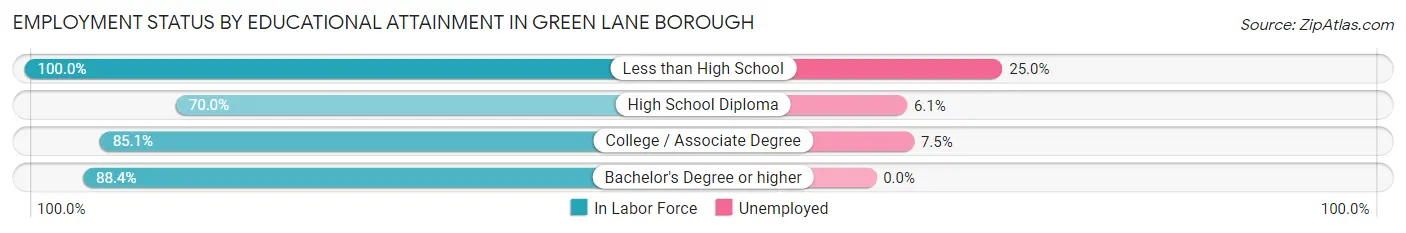
| Educational Attainment | In Labor Force | Unemployed |
| Less than High School | 4 (100.0%) | 1 (25.0%) |
| High School Diploma | 49 (70.0%) | 4 (6.1%) |
| College / Associate Degree | 40 (85.1%) | 4 (7.5%) |
| Bachelor's Degree or higher | 76 (88.4%) | 0 (0.0%) |
| Total | 169 (81.6%) | 8 (4.1%) |
Employment Occupations by Sex in Green Lane borough
Management, Business, Science and Arts Occupations
The most common Management, Business, Science and Arts occupations in Green Lane borough are Business & Financial (27 | 13.6%), Community & Social Service (23 | 11.6%), Education Instruction & Library (19 | 9.6%), Computers, Engineering & Science (17 | 8.6%), and Health Diagnosing & Treating (11 | 5.6%).
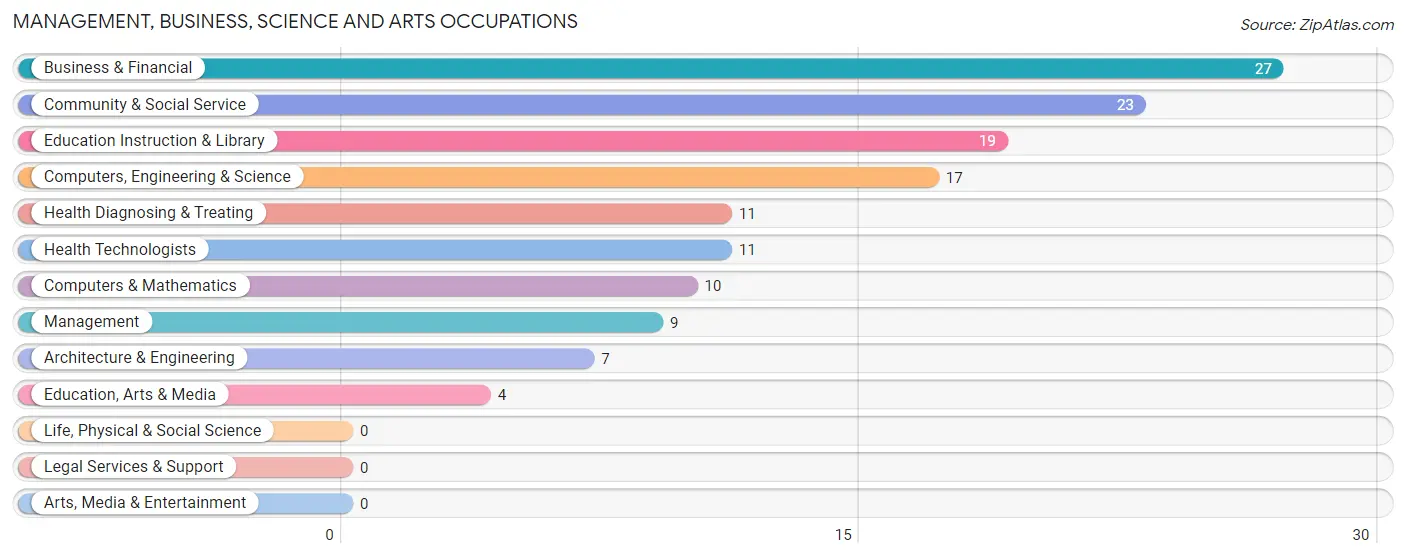
Management, Business, Science and Arts Occupations by Sex
Within the Management, Business, Science and Arts occupations in Green Lane borough, the most male-oriented occupations are Architecture & Engineering (100.0%), Computers, Engineering & Science (82.4%), and Education, Arts & Media (75.0%), while the most female-oriented occupations are Education Instruction & Library (100.0%), Health Diagnosing & Treating (100.0%), and Health Technologists (100.0%).
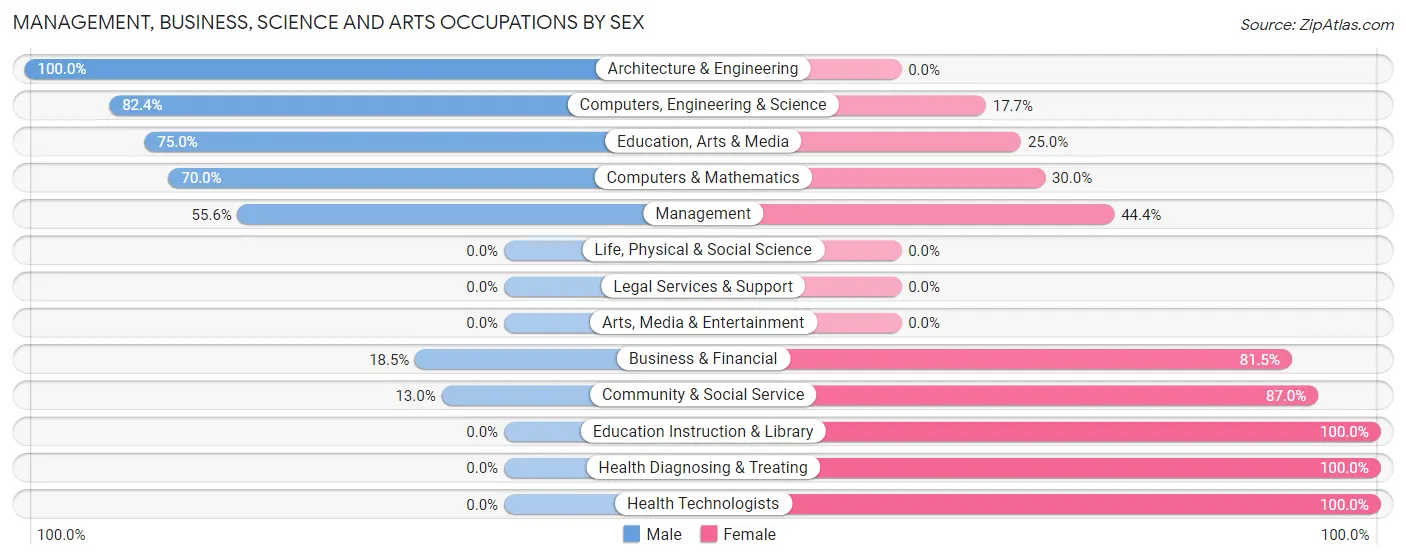
| Occupation | Male | Female |
| Management | 5 (55.6%) | 4 (44.4%) |
| Business & Financial | 5 (18.5%) | 22 (81.5%) |
| Computers, Engineering & Science | 14 (82.4%) | 3 (17.6%) |
| Computers & Mathematics | 7 (70.0%) | 3 (30.0%) |
| Architecture & Engineering | 7 (100.0%) | 0 (0.0%) |
| Life, Physical & Social Science | 0 (0.0%) | 0 (0.0%) |
| Community & Social Service | 3 (13.0%) | 20 (87.0%) |
| Education, Arts & Media | 3 (75.0%) | 1 (25.0%) |
| Legal Services & Support | 0 (0.0%) | 0 (0.0%) |
| Education Instruction & Library | 0 (0.0%) | 19 (100.0%) |
| Arts, Media & Entertainment | 0 (0.0%) | 0 (0.0%) |
| Health Diagnosing & Treating | 0 (0.0%) | 11 (100.0%) |
| Health Technologists | 0 (0.0%) | 11 (100.0%) |
| Total (Category) | 27 (31.0%) | 60 (69.0%) |
| Total (Overall) | 92 (46.5%) | 106 (53.5%) |
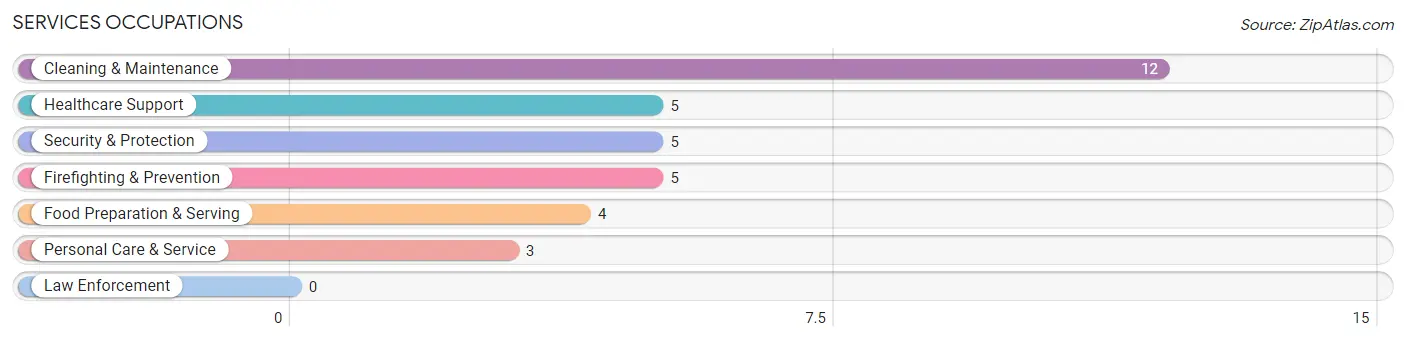
Services Occupations
The most common Services occupations in Green Lane borough are Cleaning & Maintenance (12 | 6.1%), Healthcare Support (5 | 2.5%), Security & Protection (5 | 2.5%), Firefighting & Prevention (5 | 2.5%), and Food Preparation & Serving (4 | 2.0%).
Services Occupations by Sex
Within the Services occupations in Green Lane borough, the most male-oriented occupations are Security & Protection (100.0%), Firefighting & Prevention (100.0%), and Healthcare Support (60.0%), while the most female-oriented occupations are Personal Care & Service (100.0%), Food Preparation & Serving (50.0%), and Cleaning & Maintenance (41.7%).
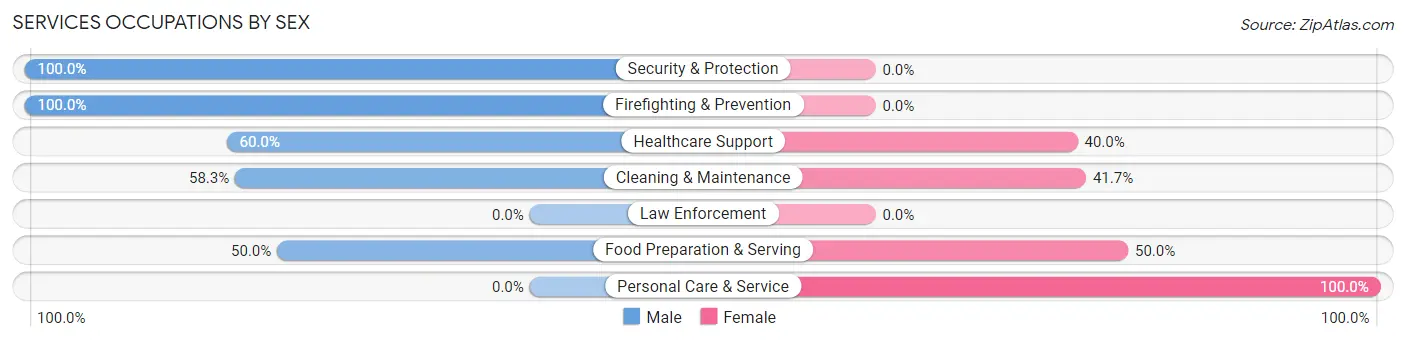
| Occupation | Male | Female |
| Healthcare Support | 3 (60.0%) | 2 (40.0%) |
| Security & Protection | 5 (100.0%) | 0 (0.0%) |
| Firefighting & Prevention | 5 (100.0%) | 0 (0.0%) |
| Law Enforcement | 0 (0.0%) | 0 (0.0%) |
| Food Preparation & Serving | 2 (50.0%) | 2 (50.0%) |
| Cleaning & Maintenance | 7 (58.3%) | 5 (41.7%) |
| Personal Care & Service | 0 (0.0%) | 3 (100.0%) |
| Total (Category) | 17 (58.6%) | 12 (41.4%) |
| Total (Overall) | 92 (46.5%) | 106 (53.5%) |
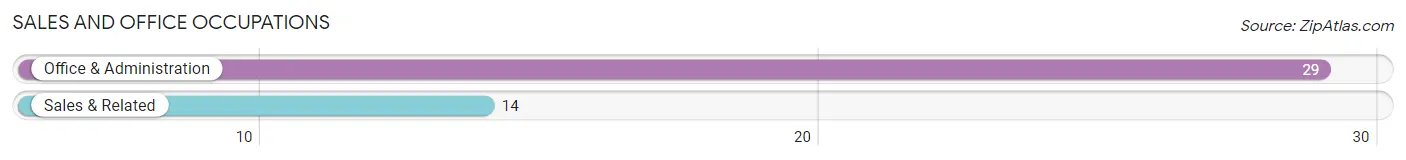
Sales and Office Occupations
The most common Sales and Office occupations in Green Lane borough are Office & Administration (29 | 14.6%), and Sales & Related (14 | 7.1%).
Sales and Office Occupations by Sex
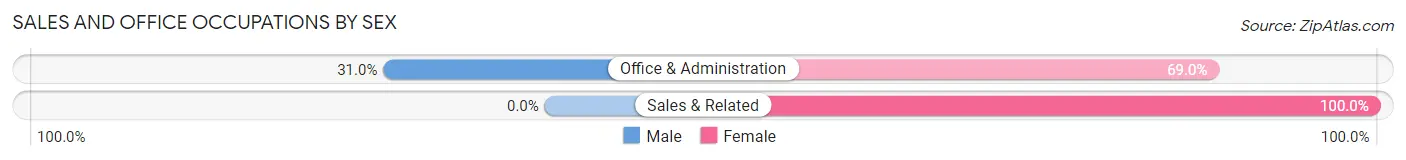
| Occupation | Male | Female |
| Sales & Related | 0 (0.0%) | 14 (100.0%) |
| Office & Administration | 9 (31.0%) | 20 (69.0%) |
| Total (Category) | 9 (20.9%) | 34 (79.1%) |
| Total (Overall) | 92 (46.5%) | 106 (53.5%) |
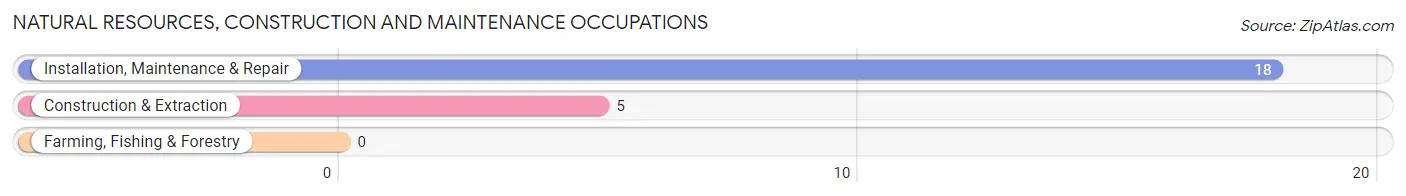
Natural Resources, Construction and Maintenance Occupations
The most common Natural Resources, Construction and Maintenance occupations in Green Lane borough are Installation, Maintenance & Repair (18 | 9.1%), and Construction & Extraction (5 | 2.5%).
Natural Resources, Construction and Maintenance Occupations by Sex
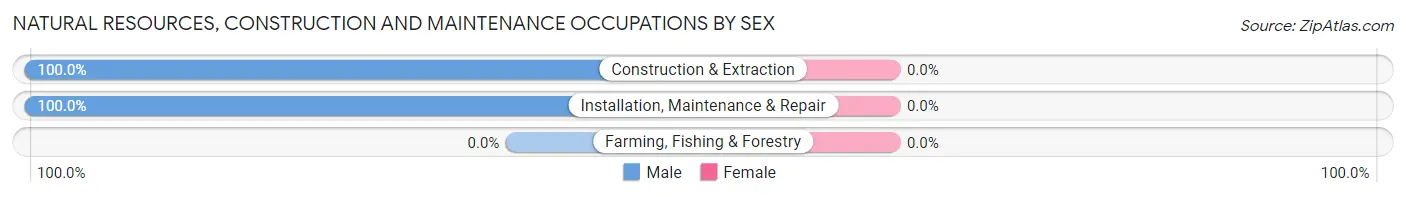
| Occupation | Male | Female |
| Farming, Fishing & Forestry | 0 (0.0%) | 0 (0.0%) |
| Construction & Extraction | 5 (100.0%) | 0 (0.0%) |
| Installation, Maintenance & Repair | 18 (100.0%) | 0 (0.0%) |
| Total (Category) | 23 (100.0%) | 0 (0.0%) |
| Total (Overall) | 92 (46.5%) | 106 (53.5%) |
Production, Transportation and Moving Occupations
The most common Production, Transportation and Moving occupations in Green Lane borough are Production (13 | 6.6%), and Material Moving (3 | 1.5%).
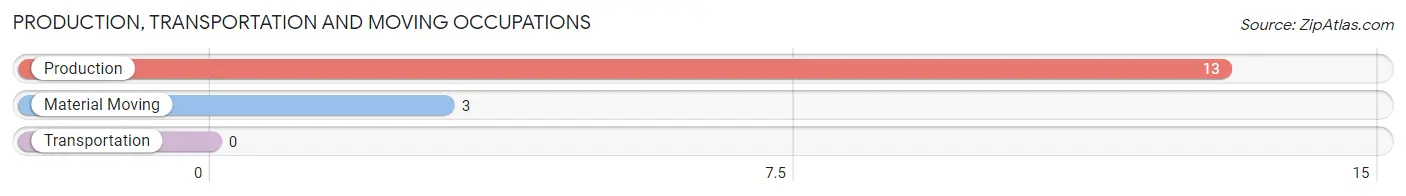
Production, Transportation and Moving Occupations by Sex
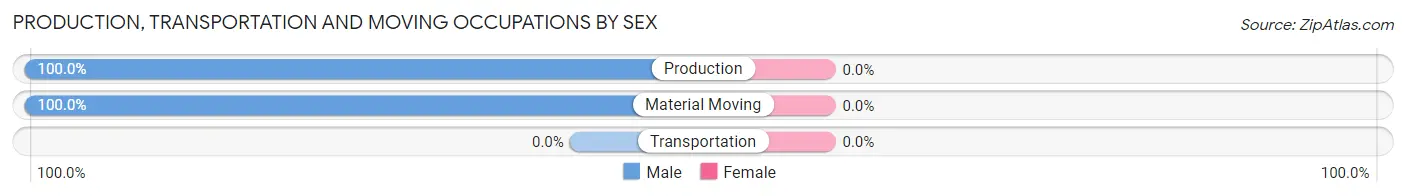
| Occupation | Male | Female |
| Production | 13 (100.0%) | 0 (0.0%) |
| Transportation | 0 (0.0%) | 0 (0.0%) |
| Material Moving | 3 (100.0%) | 0 (0.0%) |
| Total (Category) | 16 (100.0%) | 0 (0.0%) |
| Total (Overall) | 92 (46.5%) | 106 (53.5%) |
Employment Industries by Sex in Green Lane borough
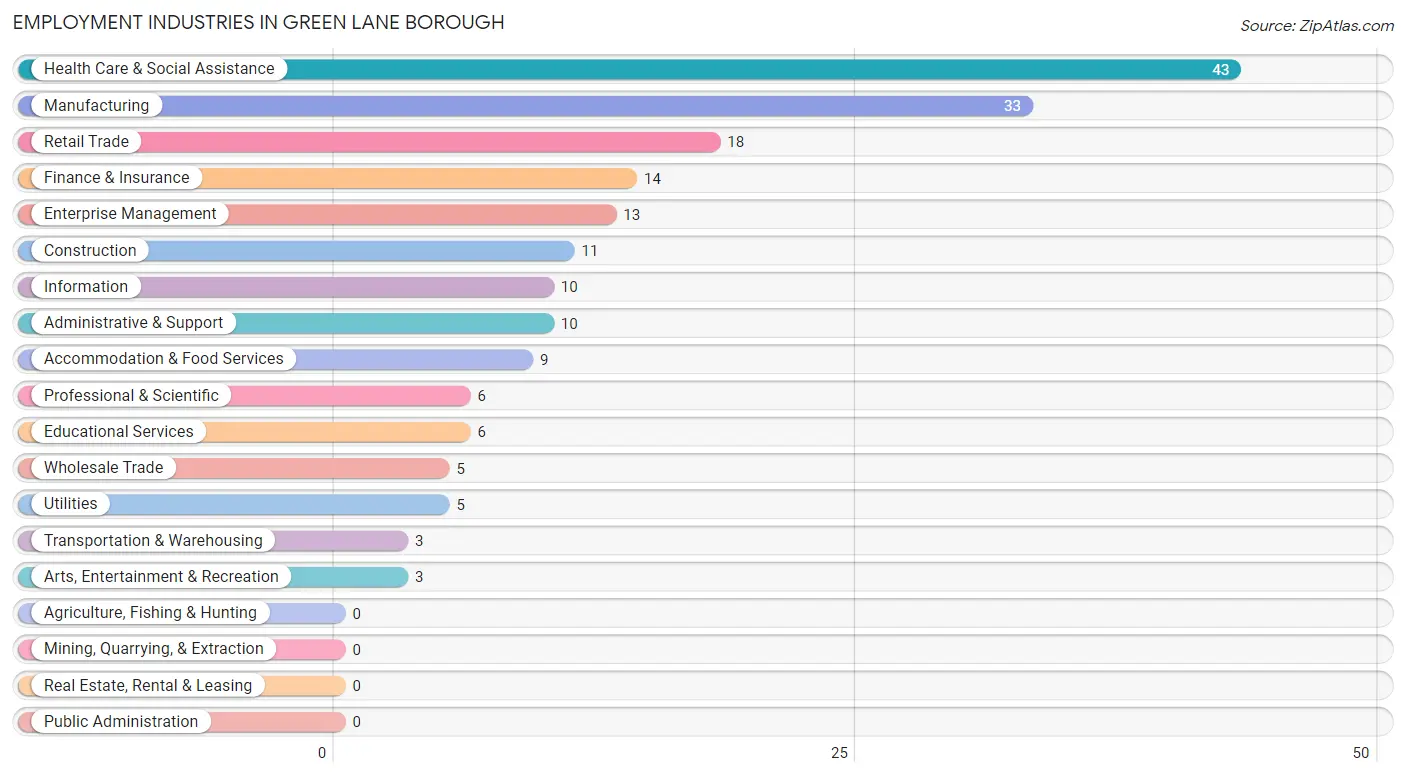
Employment Industries in Green Lane borough
The major employment industries in Green Lane borough include Health Care & Social Assistance (43 | 21.7%), Manufacturing (33 | 16.7%), Retail Trade (18 | 9.1%), Finance & Insurance (14 | 7.1%), and Enterprise Management (13 | 6.6%).
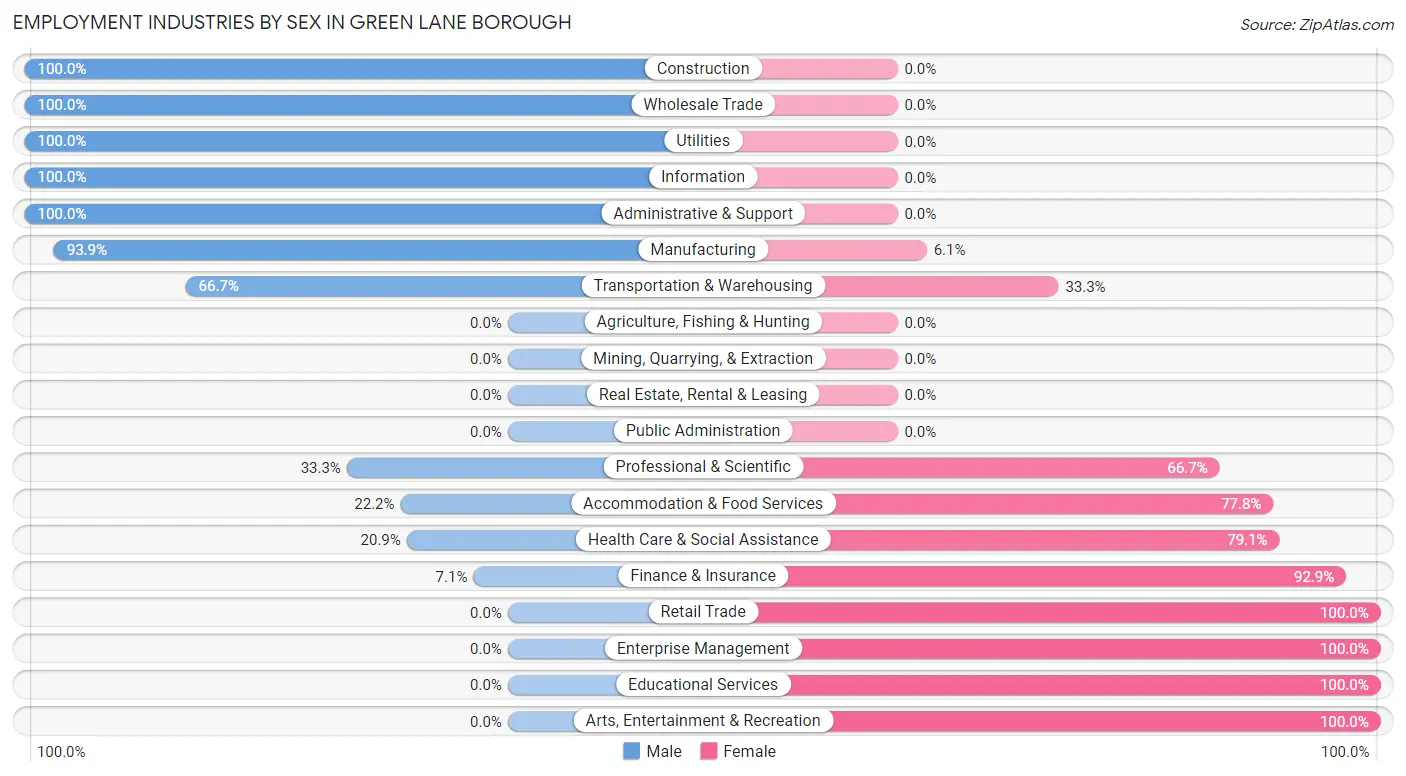
Employment Industries by Sex in Green Lane borough
The Green Lane borough industries that see more men than women are Construction (100.0%), Wholesale Trade (100.0%), and Utilities (100.0%), whereas the industries that tend to have a higher number of women are Retail Trade (100.0%), Enterprise Management (100.0%), and Educational Services (100.0%).
| Industry | Male | Female |
| Agriculture, Fishing & Hunting | 0 (0.0%) | 0 (0.0%) |
| Mining, Quarrying, & Extraction | 0 (0.0%) | 0 (0.0%) |
| Construction | 11 (100.0%) | 0 (0.0%) |
| Manufacturing | 31 (93.9%) | 2 (6.1%) |
| Wholesale Trade | 5 (100.0%) | 0 (0.0%) |
| Retail Trade | 0 (0.0%) | 18 (100.0%) |
| Transportation & Warehousing | 2 (66.7%) | 1 (33.3%) |
| Utilities | 5 (100.0%) | 0 (0.0%) |
| Information | 10 (100.0%) | 0 (0.0%) |
| Finance & Insurance | 1 (7.1%) | 13 (92.9%) |
| Real Estate, Rental & Leasing | 0 (0.0%) | 0 (0.0%) |
| Professional & Scientific | 2 (33.3%) | 4 (66.7%) |
| Enterprise Management | 0 (0.0%) | 13 (100.0%) |
| Administrative & Support | 10 (100.0%) | 0 (0.0%) |
| Educational Services | 0 (0.0%) | 6 (100.0%) |
| Health Care & Social Assistance | 9 (20.9%) | 34 (79.1%) |
| Arts, Entertainment & Recreation | 0 (0.0%) | 3 (100.0%) |
| Accommodation & Food Services | 2 (22.2%) | 7 (77.8%) |
| Public Administration | 0 (0.0%) | 0 (0.0%) |
| Total | 92 (46.5%) | 106 (53.5%) |
Education in Green Lane borough
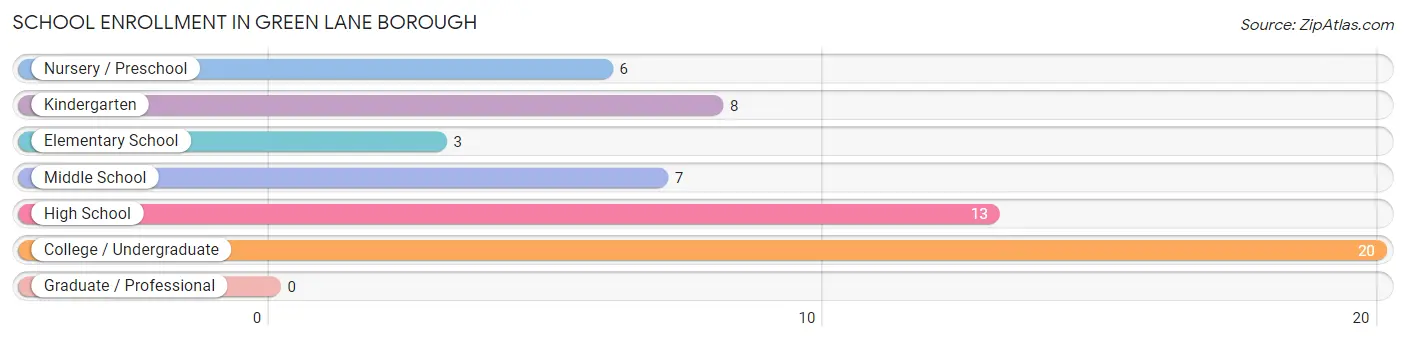
School Enrollment in Green Lane borough
The most common levels of schooling among the 57 students in Green Lane borough are college / undergraduate (20 | 35.1%), high school (13 | 22.8%), and kindergarten (8 | 14.0%).
| School Level | # Students | % Students |
| Nursery / Preschool | 6 | 10.5% |
| Kindergarten | 8 | 14.0% |
| Elementary School | 3 | 5.3% |
| Middle School | 7 | 12.3% |
| High School | 13 | 22.8% |
| College / Undergraduate | 20 | 35.1% |
| Graduate / Professional | 0 | 0.0% |
| Total | 57 | 100.0% |
School Enrollment by Age by Funding Source in Green Lane borough
Out of a total of 57 students who are enrolled in schools in Green Lane borough, 25 (43.9%) attend a private institution, while the remaining 32 (56.1%) are enrolled in public schools. The age group of 3 to 4 year olds has the highest likelihood of being enrolled in private schools, with 6 (100.0% in the age bracket) enrolled. Conversely, the age group of 18 to 19 year olds has the lowest likelihood of being enrolled in a private school, with 14 (100.0% in the age bracket) attending a public institution.
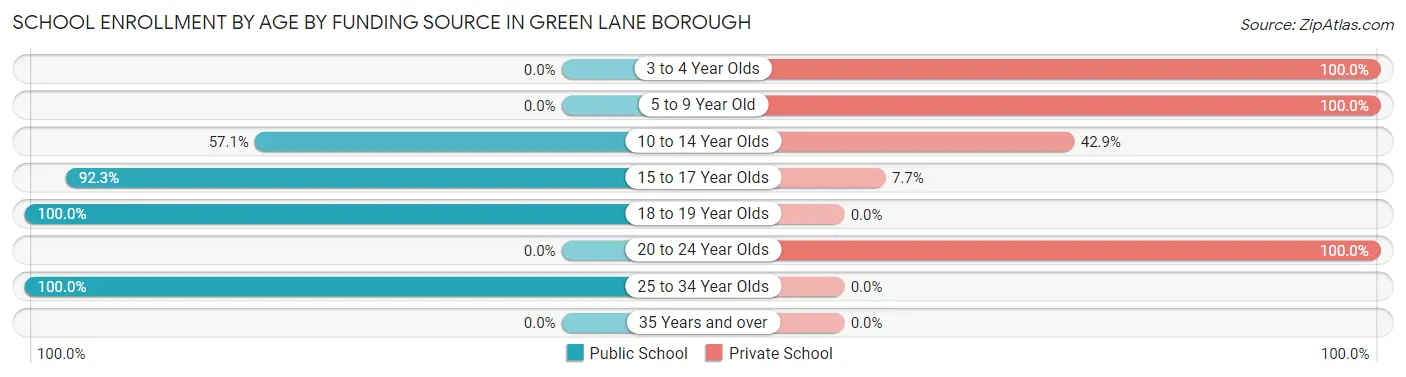
| Age Bracket | Public School | Private School |
| 3 to 4 Year Olds | 0 (0.0%) | 6 (100.0%) |
| 5 to 9 Year Old | 0 (0.0%) | 11 (100.0%) |
| 10 to 14 Year Olds | 4 (57.1%) | 3 (42.9%) |
| 15 to 17 Year Olds | 12 (92.3%) | 1 (7.7%) |
| 18 to 19 Year Olds | 14 (100.0%) | 0 (0.0%) |
| 20 to 24 Year Olds | 0 (0.0%) | 4 (100.0%) |
| 25 to 34 Year Olds | 2 (100.0%) | 0 (0.0%) |
| 35 Years and over | 0 (0.0%) | 0 (0.0%) |
| Total | 32 (56.1%) | 25 (43.9%) |
Educational Attainment by Field of Study in Green Lane borough
Business (23 | 22.1%), liberal arts & history (17 | 16.4%), bio, nature & agricultural (16 | 15.4%), science & technology (13 | 12.5%), and education (8 | 7.7%) are the most common fields of study among 104 individuals in Green Lane borough who have obtained a bachelor's degree or higher.
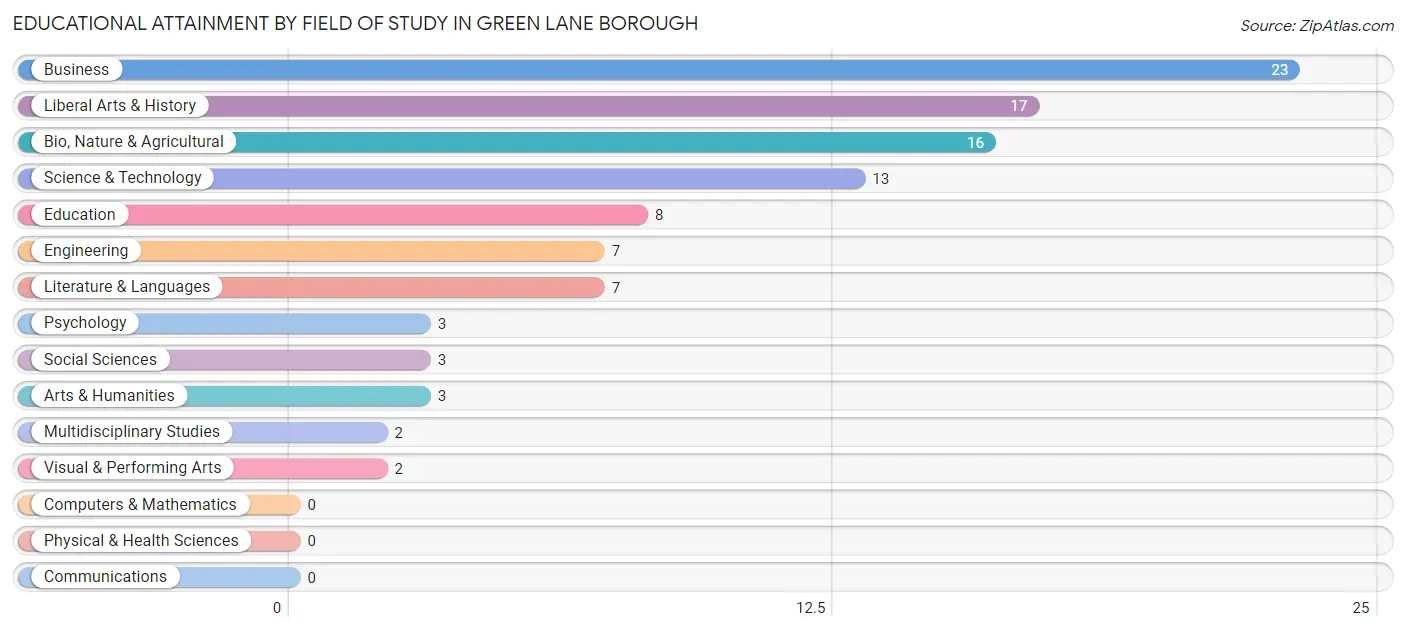
| Field of Study | # Graduates | % Graduates |
| Computers & Mathematics | 0 | 0.0% |
| Bio, Nature & Agricultural | 16 | 15.4% |
| Physical & Health Sciences | 0 | 0.0% |
| Psychology | 3 | 2.9% |
| Social Sciences | 3 | 2.9% |
| Engineering | 7 | 6.7% |
| Multidisciplinary Studies | 2 | 1.9% |
| Science & Technology | 13 | 12.5% |
| Business | 23 | 22.1% |
| Education | 8 | 7.7% |
| Literature & Languages | 7 | 6.7% |
| Liberal Arts & History | 17 | 16.4% |
| Visual & Performing Arts | 2 | 1.9% |
| Communications | 0 | 0.0% |
| Arts & Humanities | 3 | 2.9% |
| Total | 104 | 100.0% |
Transportation & Commute in Green Lane borough
Vehicle Availability by Sex in Green Lane borough
The most prevalent vehicle ownership categories in Green Lane borough are males with 2 vehicles (48, accounting for 52.2%) and females with 2 vehicles (35, making up 45.3%).
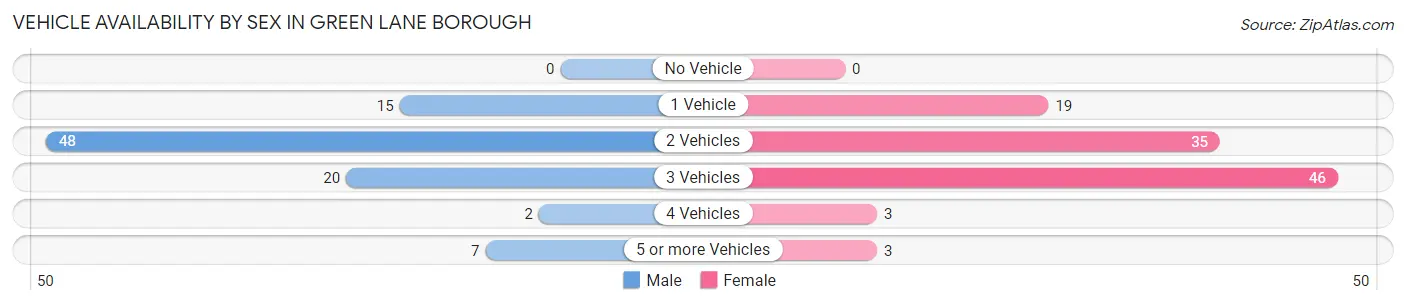
| Vehicles Available | Male | Female |
| No Vehicle | 0 (0.0%) | 0 (0.0%) |
| 1 Vehicle | 15 (16.3%) | 19 (17.9%) |
| 2 Vehicles | 48 (52.2%) | 35 (33.0%) |
| 3 Vehicles | 20 (21.7%) | 46 (43.4%) |
| 4 Vehicles | 2 (2.2%) | 3 (2.8%) |
| 5 or more Vehicles | 7 (7.6%) | 3 (2.8%) |
| Total | 92 (100.0%) | 106 (100.0%) |
Commute Time in Green Lane borough
The most frequently occuring commute durations in Green Lane borough are 20 to 24 minutes (44 commuters, 25.9%), 15 to 19 minutes (33 commuters, 19.4%), and 30 to 34 minutes (23 commuters, 13.5%).
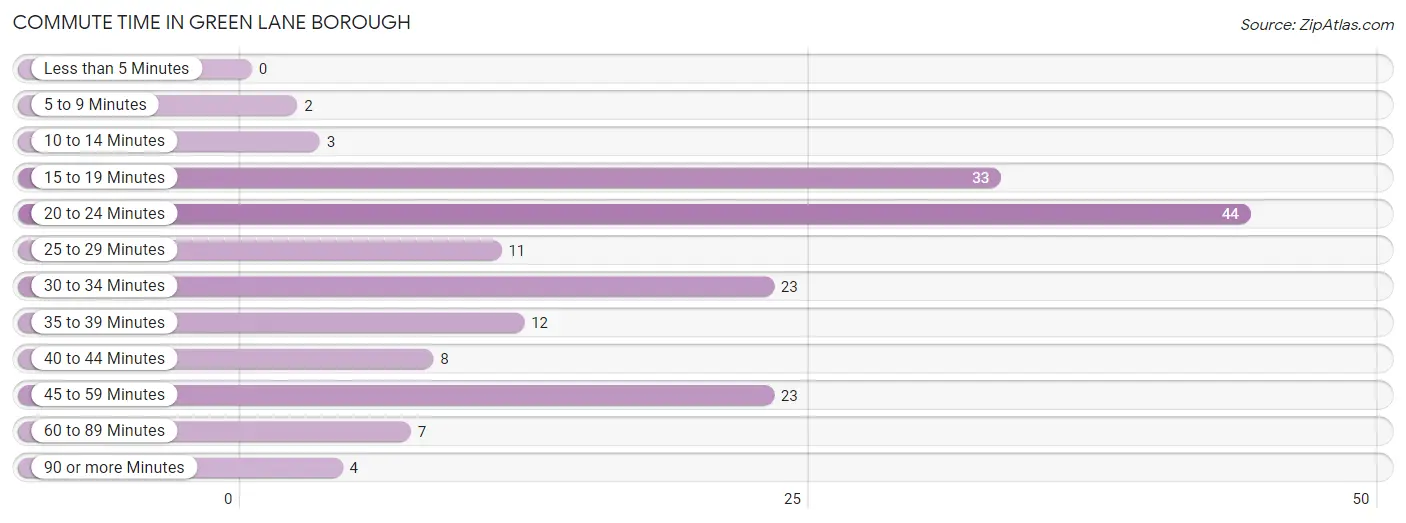
| Commute Time | # Commuters | % Commuters |
| Less than 5 Minutes | 0 | 0.0% |
| 5 to 9 Minutes | 2 | 1.2% |
| 10 to 14 Minutes | 3 | 1.8% |
| 15 to 19 Minutes | 33 | 19.4% |
| 20 to 24 Minutes | 44 | 25.9% |
| 25 to 29 Minutes | 11 | 6.5% |
| 30 to 34 Minutes | 23 | 13.5% |
| 35 to 39 Minutes | 12 | 7.1% |
| 40 to 44 Minutes | 8 | 4.7% |
| 45 to 59 Minutes | 23 | 13.5% |
| 60 to 89 Minutes | 7 | 4.1% |
| 90 or more Minutes | 4 | 2.4% |
Commute Time by Sex in Green Lane borough
The most common commute times in Green Lane borough are 20 to 24 minutes (29 commuters, 33.3%) for males and 15 to 19 minutes (19 commuters, 22.9%) for females.
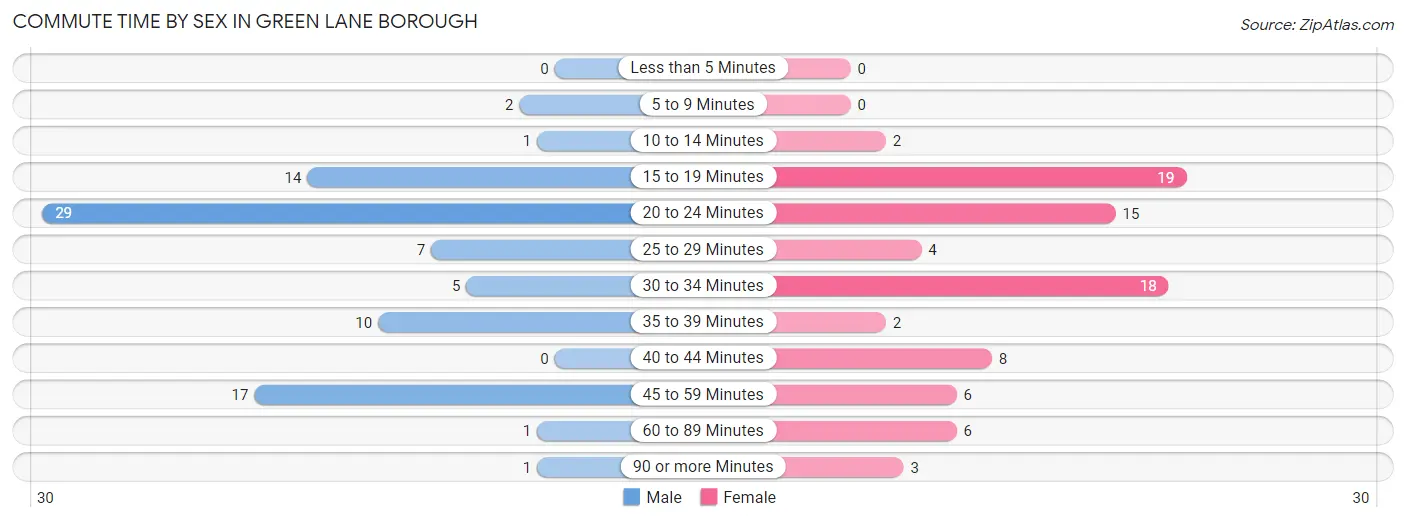
| Commute Time | Male | Female |
| Less than 5 Minutes | 0 (0.0%) | 0 (0.0%) |
| 5 to 9 Minutes | 2 (2.3%) | 0 (0.0%) |
| 10 to 14 Minutes | 1 (1.1%) | 2 (2.4%) |
| 15 to 19 Minutes | 14 (16.1%) | 19 (22.9%) |
| 20 to 24 Minutes | 29 (33.3%) | 15 (18.1%) |
| 25 to 29 Minutes | 7 (8.1%) | 4 (4.8%) |
| 30 to 34 Minutes | 5 (5.8%) | 18 (21.7%) |
| 35 to 39 Minutes | 10 (11.5%) | 2 (2.4%) |
| 40 to 44 Minutes | 0 (0.0%) | 8 (9.6%) |
| 45 to 59 Minutes | 17 (19.5%) | 6 (7.2%) |
| 60 to 89 Minutes | 1 (1.1%) | 6 (7.2%) |
| 90 or more Minutes | 1 (1.1%) | 3 (3.6%) |
Time of Departure to Work by Sex in Green Lane borough
The most frequent times of departure to work in Green Lane borough are 6:00 AM to 6:29 AM (31, 35.6%) for males and 7:30 AM to 7:59 AM (22, 26.5%) for females.
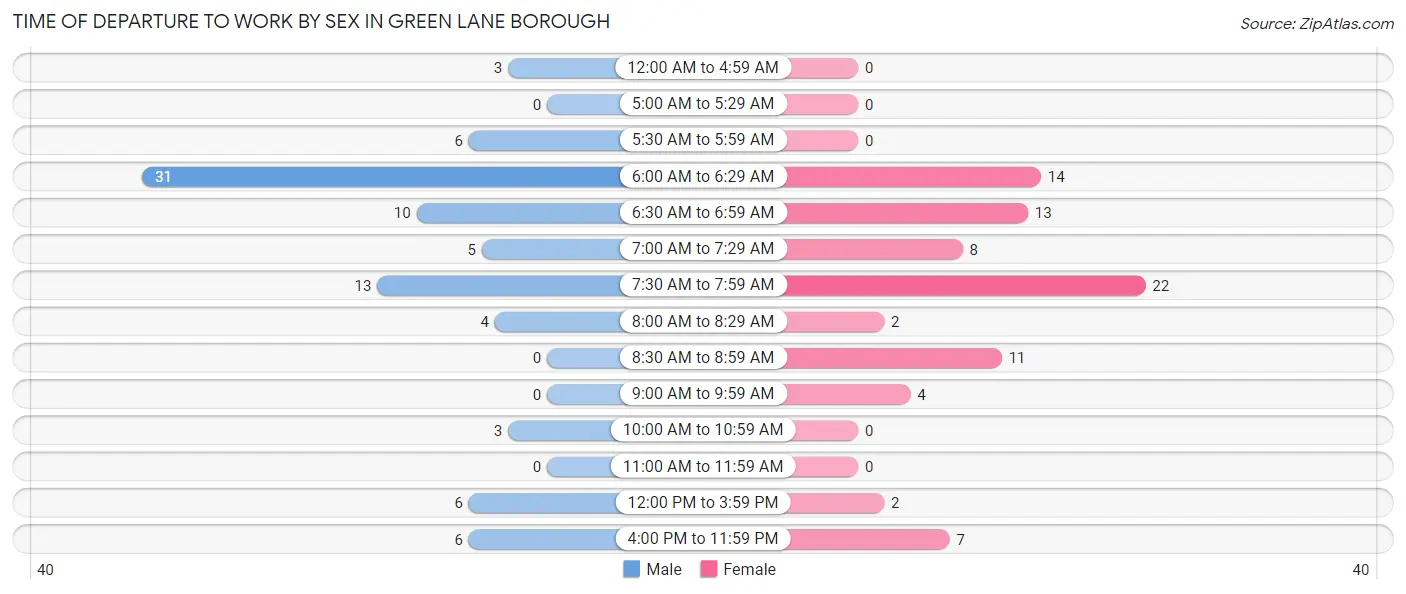
| Time of Departure | Male | Female |
| 12:00 AM to 4:59 AM | 3 (3.5%) | 0 (0.0%) |
| 5:00 AM to 5:29 AM | 0 (0.0%) | 0 (0.0%) |
| 5:30 AM to 5:59 AM | 6 (6.9%) | 0 (0.0%) |
| 6:00 AM to 6:29 AM | 31 (35.6%) | 14 (16.9%) |
| 6:30 AM to 6:59 AM | 10 (11.5%) | 13 (15.7%) |
| 7:00 AM to 7:29 AM | 5 (5.8%) | 8 (9.6%) |
| 7:30 AM to 7:59 AM | 13 (14.9%) | 22 (26.5%) |
| 8:00 AM to 8:29 AM | 4 (4.6%) | 2 (2.4%) |
| 8:30 AM to 8:59 AM | 0 (0.0%) | 11 (13.3%) |
| 9:00 AM to 9:59 AM | 0 (0.0%) | 4 (4.8%) |
| 10:00 AM to 10:59 AM | 3 (3.5%) | 0 (0.0%) |
| 11:00 AM to 11:59 AM | 0 (0.0%) | 0 (0.0%) |
| 12:00 PM to 3:59 PM | 6 (6.9%) | 2 (2.4%) |
| 4:00 PM to 11:59 PM | 6 (6.9%) | 7 (8.4%) |
| Total | 87 (100.0%) | 83 (100.0%) |
Housing Occupancy in Green Lane borough
Occupancy by Ownership in Green Lane borough
Of the total 160 dwellings in Green Lane borough, owner-occupied units account for 100 (62.5%), while renter-occupied units make up 60 (37.5%).
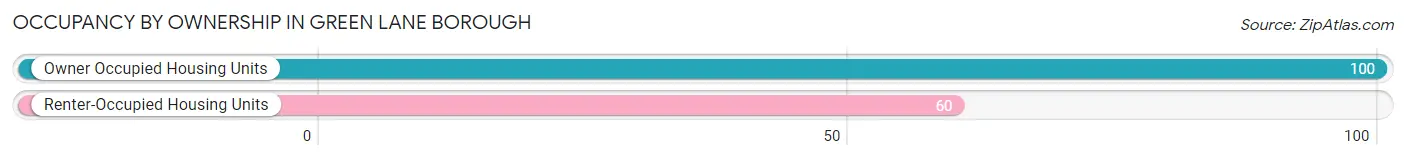
| Occupancy | # Housing Units | % Housing Units |
| Owner Occupied Housing Units | 100 | 62.5% |
| Renter-Occupied Housing Units | 60 | 37.5% |
| Total Occupied Housing Units | 160 | 100.0% |
Occupancy by Household Size in Green Lane borough
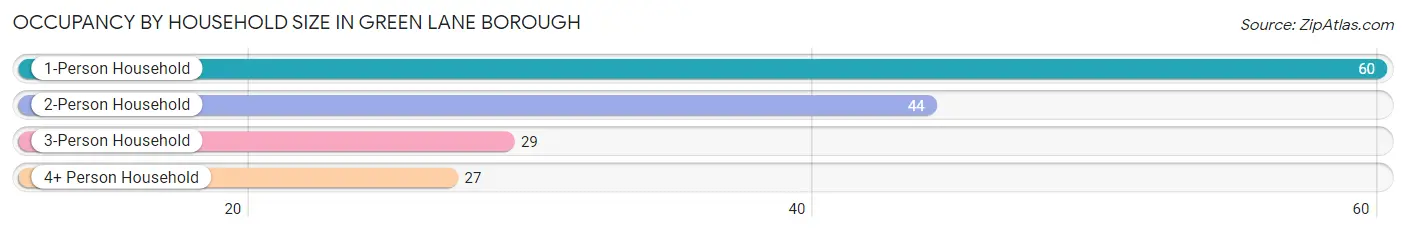
| Household Size | # Housing Units | % Housing Units |
| 1-Person Household | 60 | 37.5% |
| 2-Person Household | 44 | 27.5% |
| 3-Person Household | 29 | 18.1% |
| 4+ Person Household | 27 | 16.9% |
| Total Housing Units | 160 | 100.0% |
Occupancy by Ownership by Household Size in Green Lane borough
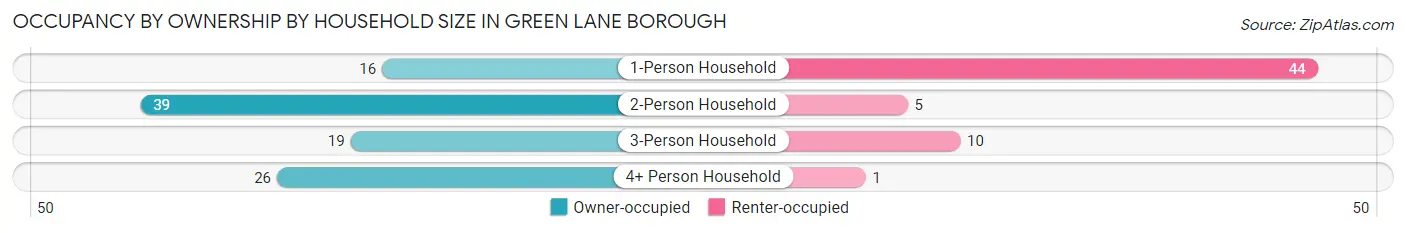
| Household Size | Owner-occupied | Renter-occupied |
| 1-Person Household | 16 (26.7%) | 44 (73.3%) |
| 2-Person Household | 39 (88.6%) | 5 (11.4%) |
| 3-Person Household | 19 (65.5%) | 10 (34.5%) |
| 4+ Person Household | 26 (96.3%) | 1 (3.7%) |
| Total Housing Units | 100 (62.5%) | 60 (37.5%) |
Occupancy by Educational Attainment in Green Lane borough
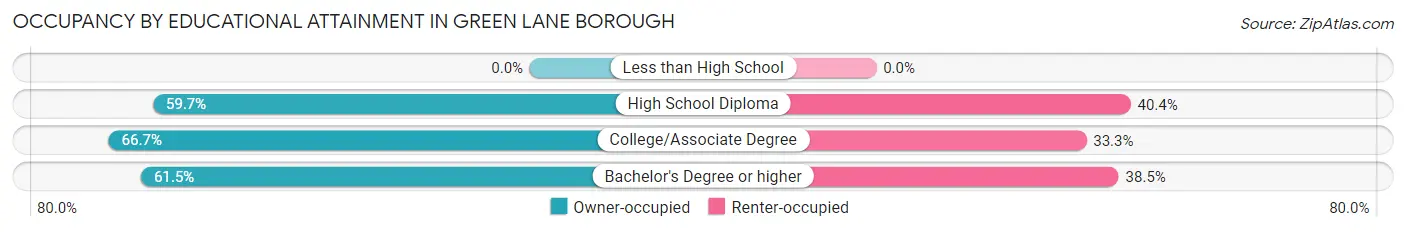
| Household Size | Owner-occupied | Renter-occupied |
| Less than High School | 0 (0.0%) | 0 (0.0%) |
| High School Diploma | 34 (59.7%) | 23 (40.4%) |
| College/Associate Degree | 34 (66.7%) | 17 (33.3%) |
| Bachelor's Degree or higher | 32 (61.5%) | 20 (38.5%) |
Occupancy by Age of Householder in Green Lane borough
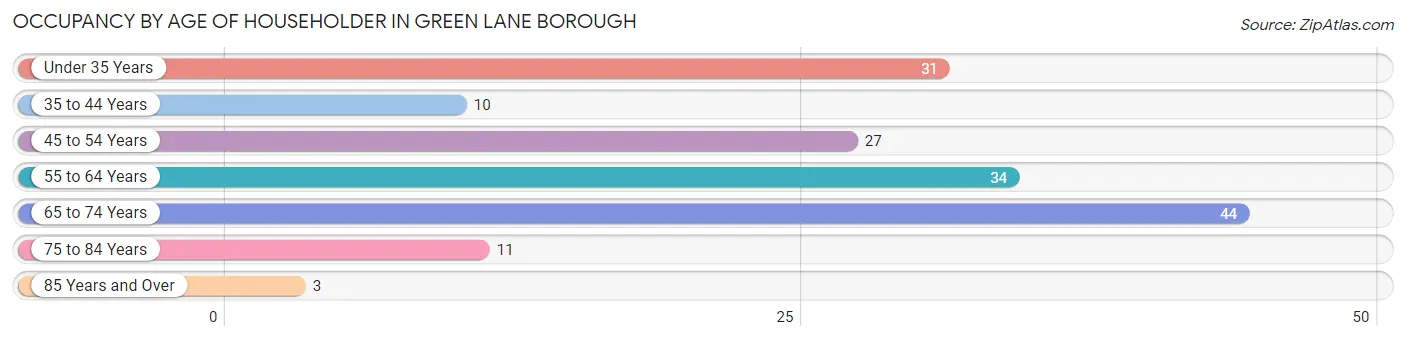
| Age Bracket | # Households | % Households |
| Under 35 Years | 31 | 19.4% |
| 35 to 44 Years | 10 | 6.2% |
| 45 to 54 Years | 27 | 16.9% |
| 55 to 64 Years | 34 | 21.2% |
| 65 to 74 Years | 44 | 27.5% |
| 75 to 84 Years | 11 | 6.9% |
| 85 Years and Over | 3 | 1.9% |
| Total | 160 | 100.0% |
Housing Finances in Green Lane borough
Median Income by Occupancy in Green Lane borough
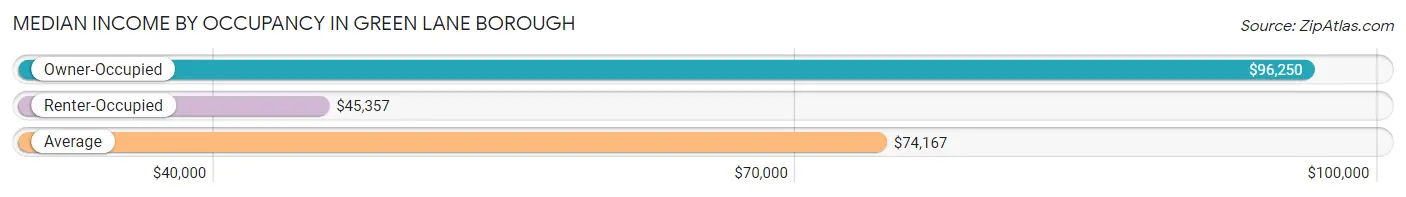
| Occupancy Type | # Households | Median Income |
| Owner-Occupied | 100 (62.5%) | $96,250 |
| Renter-Occupied | 60 (37.5%) | $45,357 |
| Average | 160 (100.0%) | $74,167 |
Occupancy by Householder Income Bracket in Green Lane borough
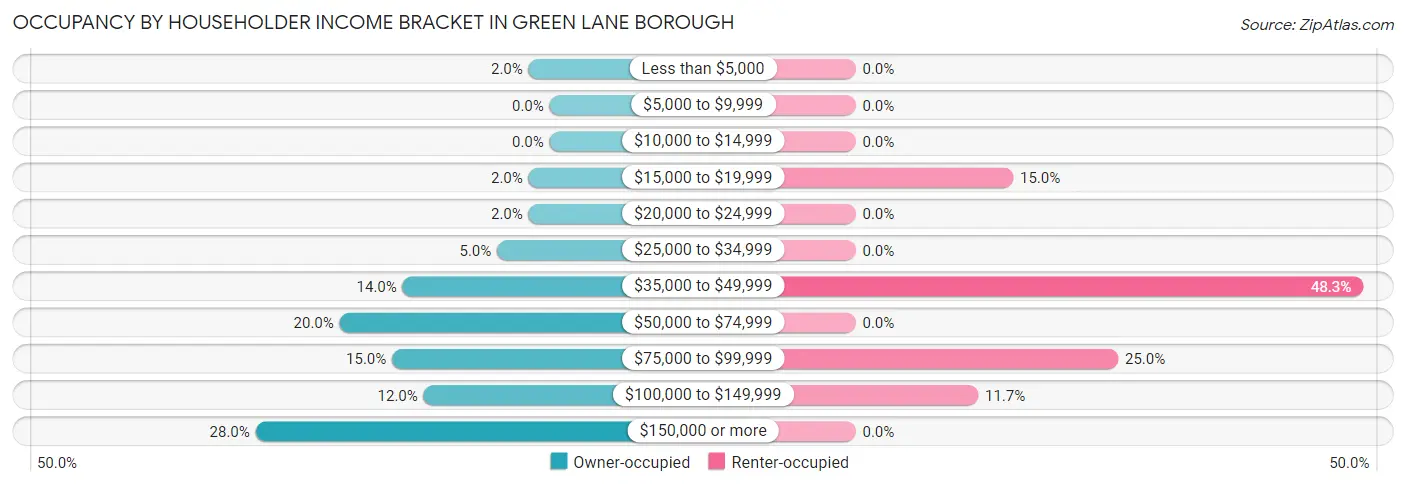
| Income Bracket | Owner-occupied | Renter-occupied |
| Less than $5,000 | 2 (2.0%) | 0 (0.0%) |
| $5,000 to $9,999 | 0 (0.0%) | 0 (0.0%) |
| $10,000 to $14,999 | 0 (0.0%) | 0 (0.0%) |
| $15,000 to $19,999 | 2 (2.0%) | 9 (15.0%) |
| $20,000 to $24,999 | 2 (2.0%) | 0 (0.0%) |
| $25,000 to $34,999 | 5 (5.0%) | 0 (0.0%) |
| $35,000 to $49,999 | 14 (14.0%) | 29 (48.3%) |
| $50,000 to $74,999 | 20 (20.0%) | 0 (0.0%) |
| $75,000 to $99,999 | 15 (15.0%) | 15 (25.0%) |
| $100,000 to $149,999 | 12 (12.0%) | 7 (11.7%) |
| $150,000 or more | 28 (28.0%) | 0 (0.0%) |
| Total | 100 (100.0%) | 60 (100.0%) |
Monthly Housing Cost Tiers in Green Lane borough
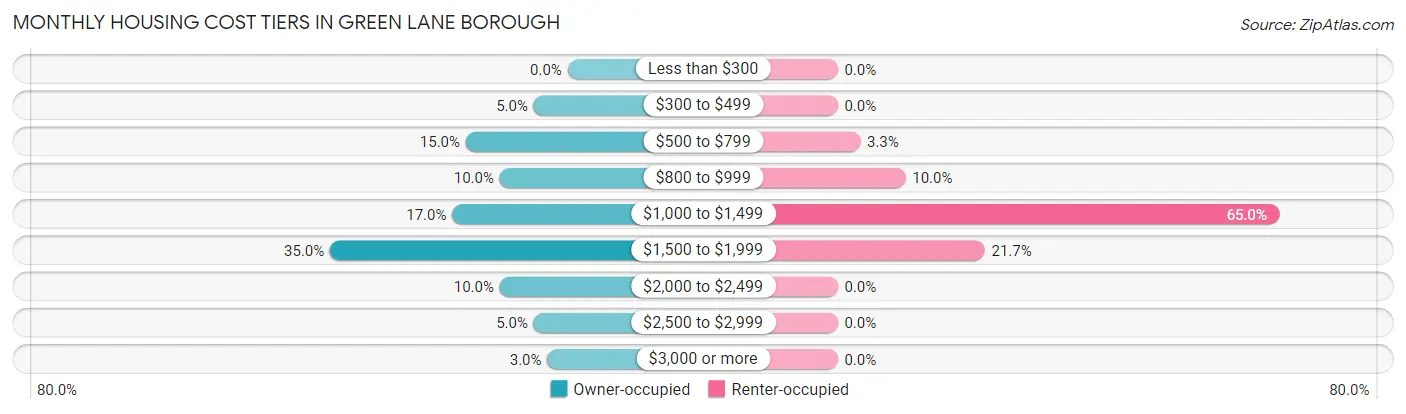
| Monthly Cost | Owner-occupied | Renter-occupied |
| Less than $300 | 0 (0.0%) | 0 (0.0%) |
| $300 to $499 | 5 (5.0%) | 0 (0.0%) |
| $500 to $799 | 15 (15.0%) | 2 (3.3%) |
| $800 to $999 | 10 (10.0%) | 6 (10.0%) |
| $1,000 to $1,499 | 17 (17.0%) | 39 (65.0%) |
| $1,500 to $1,999 | 35 (35.0%) | 13 (21.7%) |
| $2,000 to $2,499 | 10 (10.0%) | 0 (0.0%) |
| $2,500 to $2,999 | 5 (5.0%) | 0 (0.0%) |
| $3,000 or more | 3 (3.0%) | 0 (0.0%) |
| Total | 100 (100.0%) | 60 (100.0%) |
Physical Housing Characteristics in Green Lane borough
Housing Structures in Green Lane borough
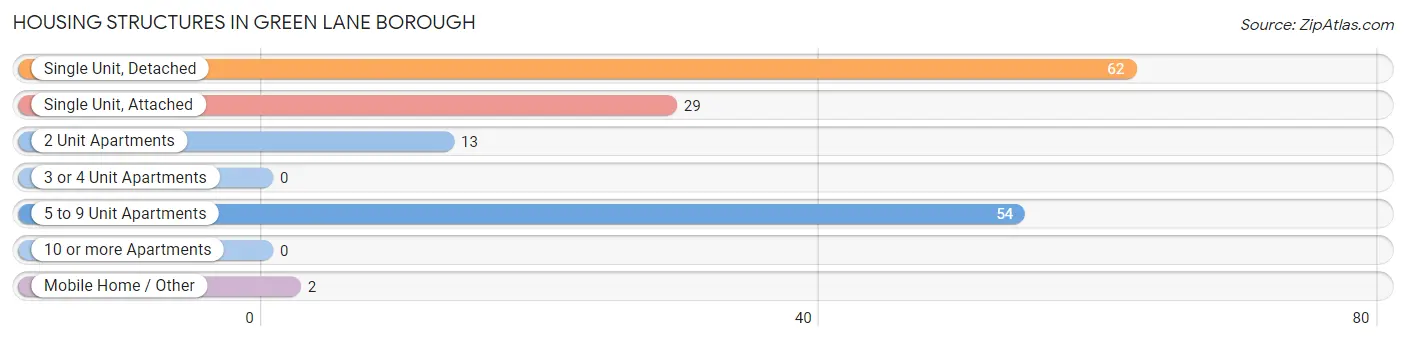
| Structure Type | # Housing Units | % Housing Units |
| Single Unit, Detached | 62 | 38.8% |
| Single Unit, Attached | 29 | 18.1% |
| 2 Unit Apartments | 13 | 8.1% |
| 3 or 4 Unit Apartments | 0 | 0.0% |
| 5 to 9 Unit Apartments | 54 | 33.8% |
| 10 or more Apartments | 0 | 0.0% |
| Mobile Home / Other | 2 | 1.3% |
| Total | 160 | 100.0% |
Housing Structures by Occupancy in Green Lane borough
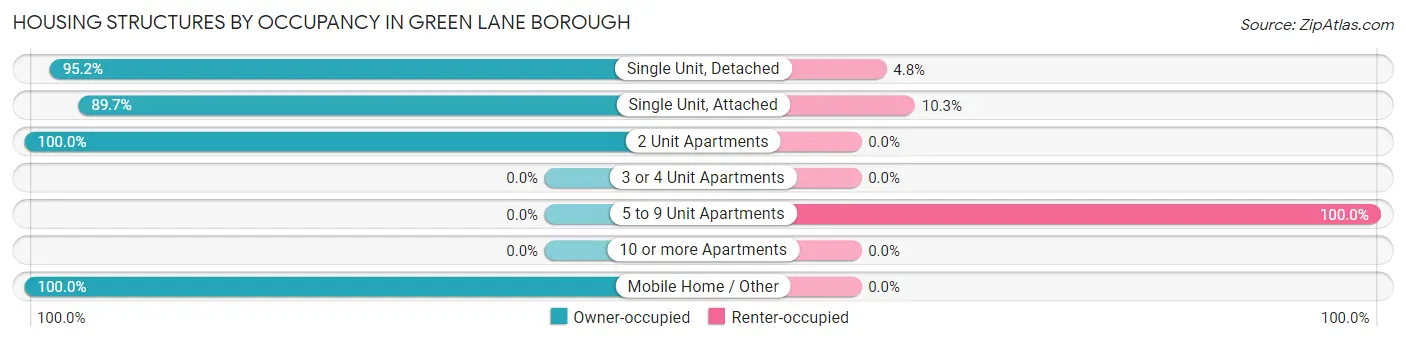
| Structure Type | Owner-occupied | Renter-occupied |
| Single Unit, Detached | 59 (95.2%) | 3 (4.8%) |
| Single Unit, Attached | 26 (89.7%) | 3 (10.3%) |
| 2 Unit Apartments | 13 (100.0%) | 0 (0.0%) |
| 3 or 4 Unit Apartments | 0 (0.0%) | 0 (0.0%) |
| 5 to 9 Unit Apartments | 0 (0.0%) | 54 (100.0%) |
| 10 or more Apartments | 0 (0.0%) | 0 (0.0%) |
| Mobile Home / Other | 2 (100.0%) | 0 (0.0%) |
| Total | 100 (62.5%) | 60 (37.5%) |
Housing Structures by Number of Rooms in Green Lane borough
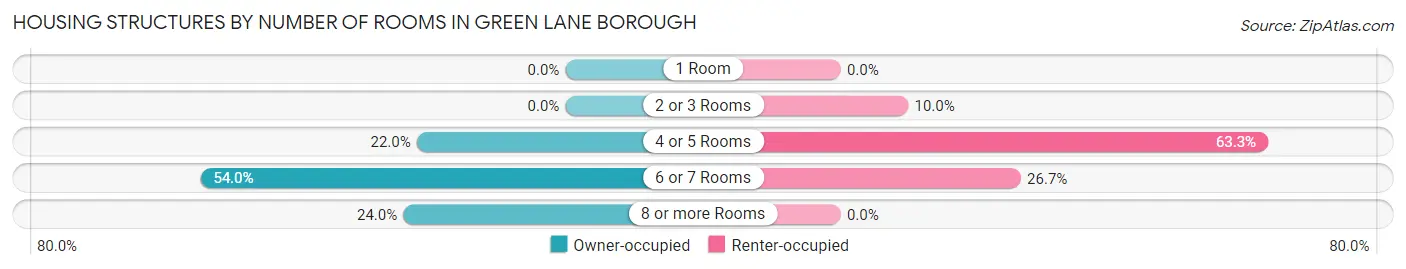
| Number of Rooms | Owner-occupied | Renter-occupied |
| 1 Room | 0 (0.0%) | 0 (0.0%) |
| 2 or 3 Rooms | 0 (0.0%) | 6 (10.0%) |
| 4 or 5 Rooms | 22 (22.0%) | 38 (63.3%) |
| 6 or 7 Rooms | 54 (54.0%) | 16 (26.7%) |
| 8 or more Rooms | 24 (24.0%) | 0 (0.0%) |
| Total | 100 (100.0%) | 60 (100.0%) |
Housing Structure by Heating Type in Green Lane borough
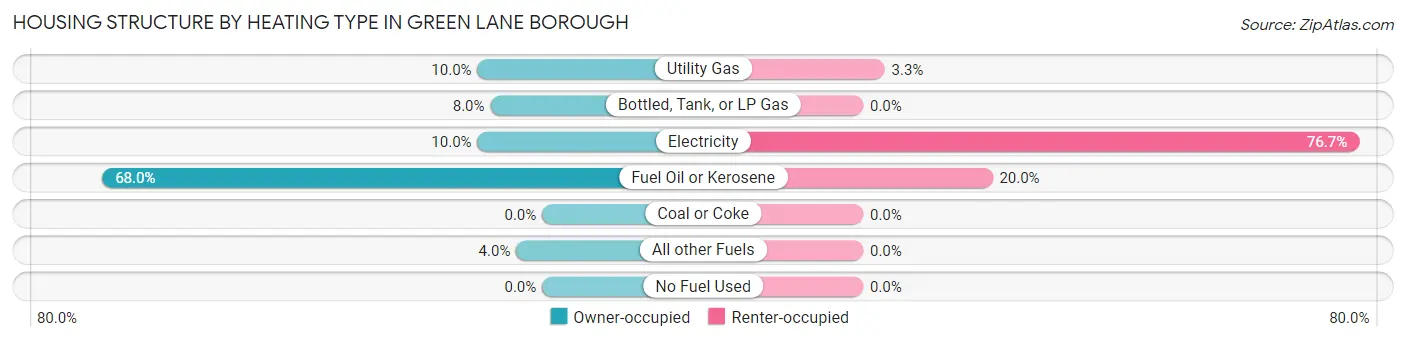
| Heating Type | Owner-occupied | Renter-occupied |
| Utility Gas | 10 (10.0%) | 2 (3.3%) |
| Bottled, Tank, or LP Gas | 8 (8.0%) | 0 (0.0%) |
| Electricity | 10 (10.0%) | 46 (76.7%) |
| Fuel Oil or Kerosene | 68 (68.0%) | 12 (20.0%) |
| Coal or Coke | 0 (0.0%) | 0 (0.0%) |
| All other Fuels | 4 (4.0%) | 0 (0.0%) |
| No Fuel Used | 0 (0.0%) | 0 (0.0%) |
| Total | 100 (100.0%) | 60 (100.0%) |
Household Vehicle Usage in Green Lane borough
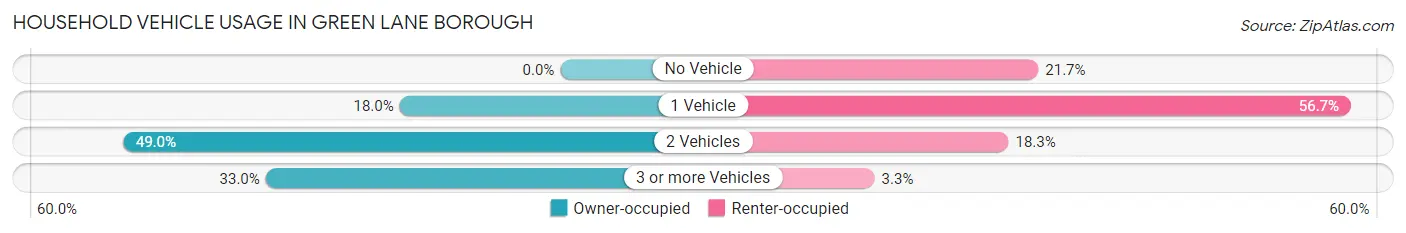
| Vehicles per Household | Owner-occupied | Renter-occupied |
| No Vehicle | 0 (0.0%) | 13 (21.7%) |
| 1 Vehicle | 18 (18.0%) | 34 (56.7%) |
| 2 Vehicles | 49 (49.0%) | 11 (18.3%) |
| 3 or more Vehicles | 33 (33.0%) | 2 (3.3%) |
| Total | 100 (100.0%) | 60 (100.0%) |
Real Estate & Mortgages in Green Lane borough
Real Estate and Mortgage Overview in Green Lane borough
| Characteristic | Without Mortgage | With Mortgage |
| Housing Units | 28 | 72 |
| Median Property Value | $193,800 | $258,000 |
| Median Household Income | $45,625 | $28 |
| Monthly Housing Costs | $656 | $3 |
| Real Estate Taxes | $2,933 | $0 |
Property Value by Mortgage Status in Green Lane borough
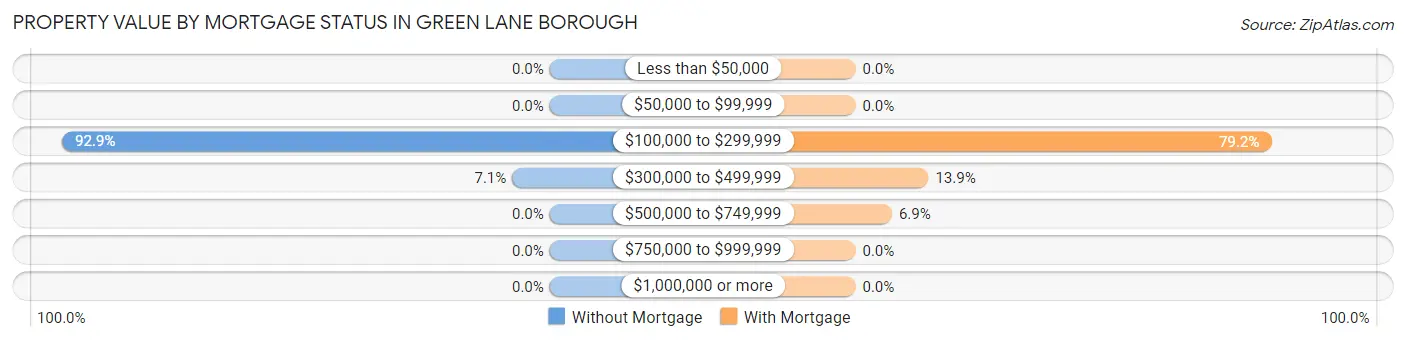
| Property Value | Without Mortgage | With Mortgage |
| Less than $50,000 | 0 (0.0%) | 0 (0.0%) |
| $50,000 to $99,999 | 0 (0.0%) | 0 (0.0%) |
| $100,000 to $299,999 | 26 (92.9%) | 57 (79.2%) |
| $300,000 to $499,999 | 2 (7.1%) | 10 (13.9%) |
| $500,000 to $749,999 | 0 (0.0%) | 5 (6.9%) |
| $750,000 to $999,999 | 0 (0.0%) | 0 (0.0%) |
| $1,000,000 or more | 0 (0.0%) | 0 (0.0%) |
| Total | 28 (100.0%) | 72 (100.0%) |
Household Income by Mortgage Status in Green Lane borough
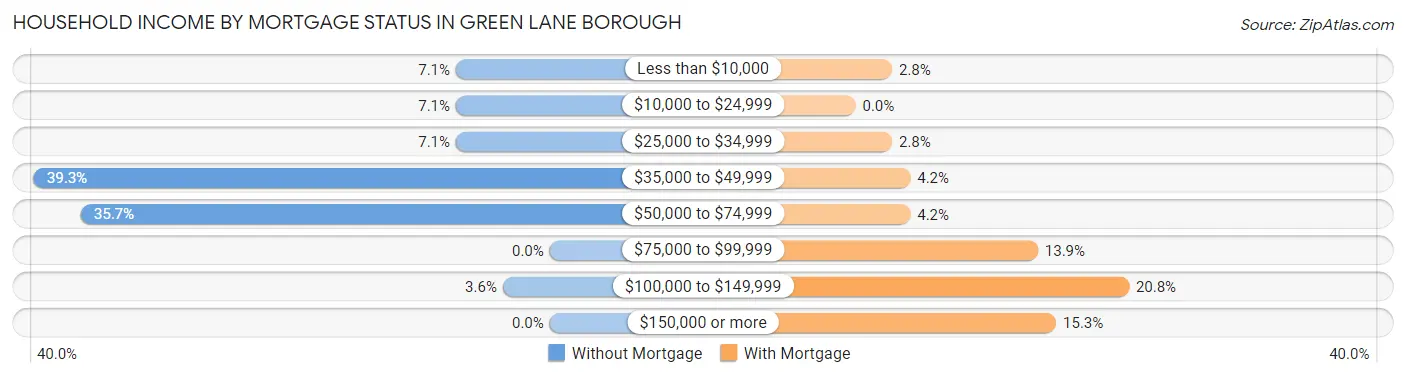
| Household Income | Without Mortgage | With Mortgage |
| Less than $10,000 | 2 (7.1%) | 2 (2.8%) |
| $10,000 to $24,999 | 2 (7.1%) | 0 (0.0%) |
| $25,000 to $34,999 | 2 (7.1%) | 2 (2.8%) |
| $35,000 to $49,999 | 11 (39.3%) | 3 (4.2%) |
| $50,000 to $74,999 | 10 (35.7%) | 3 (4.2%) |
| $75,000 to $99,999 | 0 (0.0%) | 10 (13.9%) |
| $100,000 to $149,999 | 1 (3.6%) | 15 (20.8%) |
| $150,000 or more | 0 (0.0%) | 11 (15.3%) |
| Total | 28 (100.0%) | 72 (100.0%) |
Property Value to Household Income Ratio in Green Lane borough
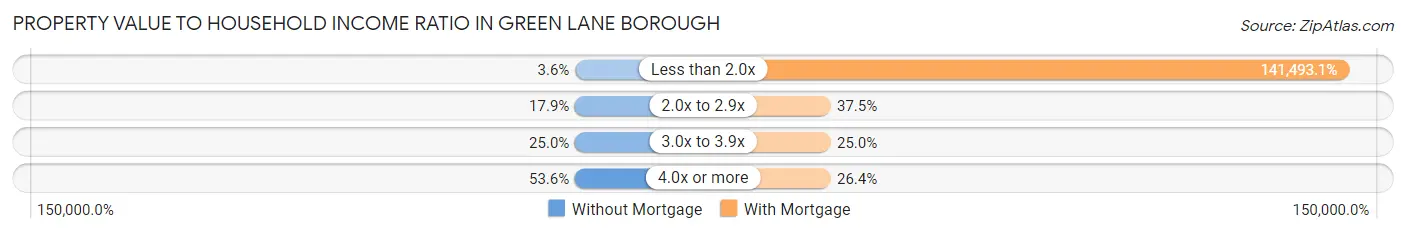
| Value-to-Income Ratio | Without Mortgage | With Mortgage |
| Less than 2.0x | 1 (3.6%) | 101,875 (141,493.1%) |
| 2.0x to 2.9x | 5 (17.9%) | 27 (37.5%) |
| 3.0x to 3.9x | 7 (25.0%) | 18 (25.0%) |
| 4.0x or more | 15 (53.6%) | 19 (26.4%) |
| Total | 28 (100.0%) | 72 (100.0%) |
Real Estate Taxes by Mortgage Status in Green Lane borough
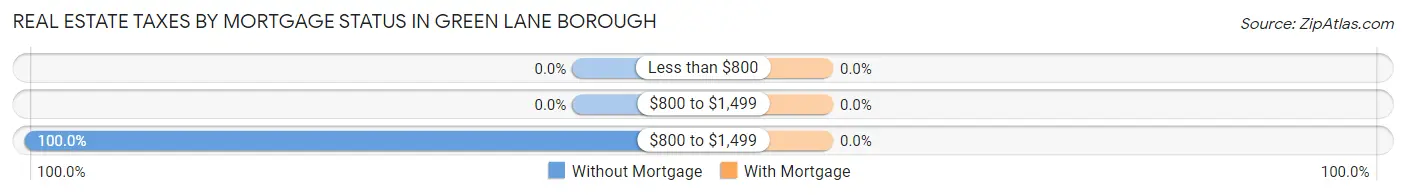
| Property Taxes | Without Mortgage | With Mortgage |
| Less than $800 | 0 (0.0%) | 0 (0.0%) |
| $800 to $1,499 | 0 (0.0%) | 0 (0.0%) |
| $800 to $1,499 | 28 (100.0%) | 0 (0.0%) |
| Total | 28 (100.0%) | 72 (100.0%) |
Health & Disability in Green Lane borough
Health Insurance Coverage by Age in Green Lane borough
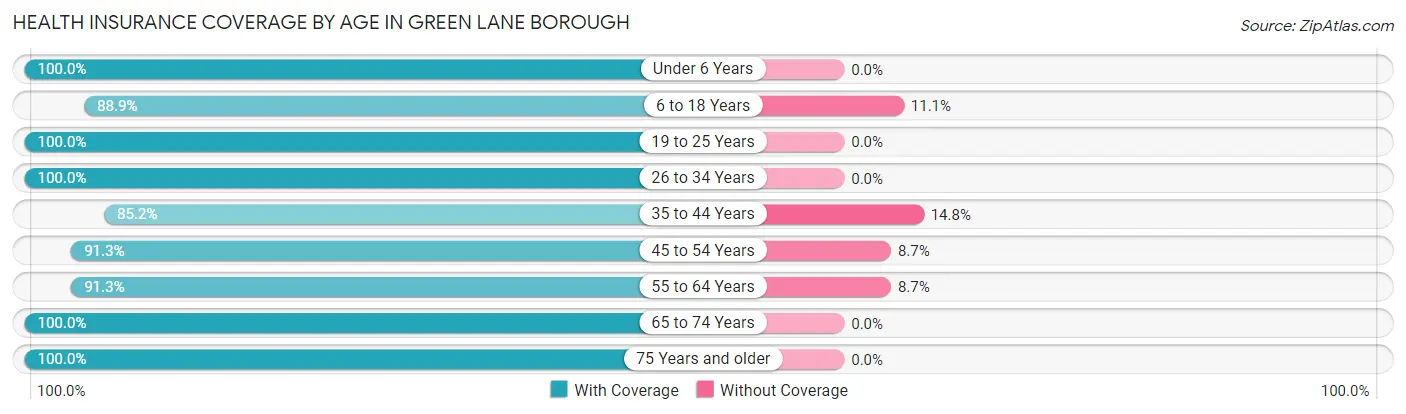
| Age Bracket | With Coverage | Without Coverage |
| Under 6 Years | 46 (100.0%) | 0 (0.0%) |
| 6 to 18 Years | 24 (88.9%) | 3 (11.1%) |
| 19 to 25 Years | 27 (100.0%) | 0 (0.0%) |
| 26 to 34 Years | 61 (100.0%) | 0 (0.0%) |
| 35 to 44 Years | 23 (85.2%) | 4 (14.8%) |
| 45 to 54 Years | 42 (91.3%) | 4 (8.7%) |
| 55 to 64 Years | 63 (91.3%) | 6 (8.7%) |
| 65 to 74 Years | 56 (100.0%) | 0 (0.0%) |
| 75 Years and older | 16 (100.0%) | 0 (0.0%) |
| Total | 358 (95.5%) | 17 (4.5%) |
Health Insurance Coverage by Citizenship Status in Green Lane borough
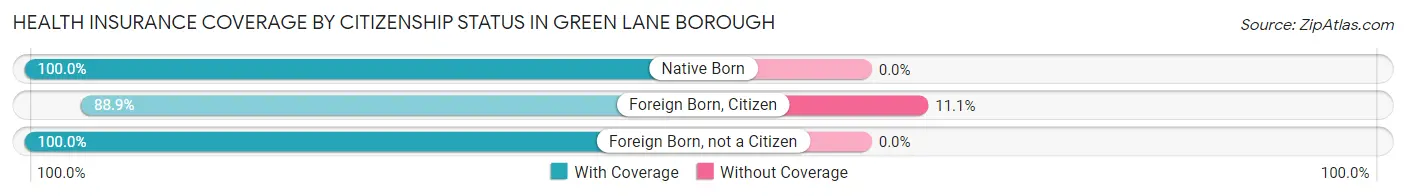
| Citizenship Status | With Coverage | Without Coverage |
| Native Born | 46 (100.0%) | 0 (0.0%) |
| Foreign Born, Citizen | 24 (88.9%) | 3 (11.1%) |
| Foreign Born, not a Citizen | 27 (100.0%) | 0 (0.0%) |
Health Insurance Coverage by Household Income in Green Lane borough
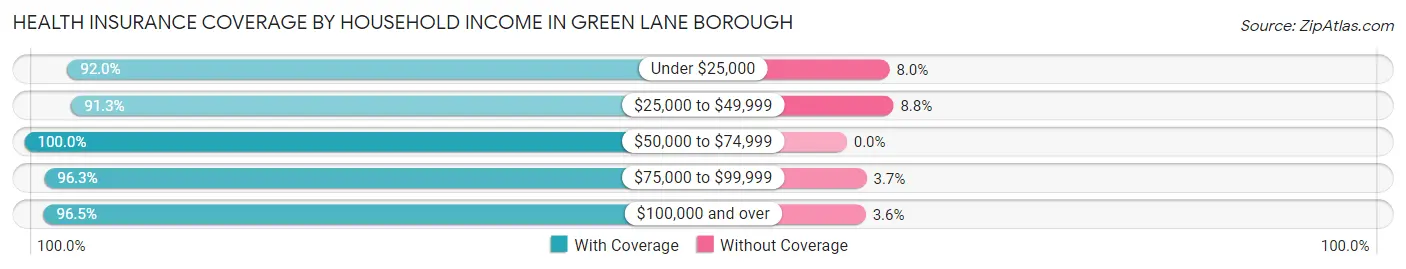
| Household Income | With Coverage | Without Coverage |
| Under $25,000 | 23 (92.0%) | 2 (8.0%) |
| $25,000 to $49,999 | 73 (91.2%) | 7 (8.7%) |
| $50,000 to $74,999 | 48 (100.0%) | 0 (0.0%) |
| $75,000 to $99,999 | 78 (96.3%) | 3 (3.7%) |
| $100,000 and over | 136 (96.5%) | 5 (3.5%) |
Public vs Private Health Insurance Coverage by Age in Green Lane borough
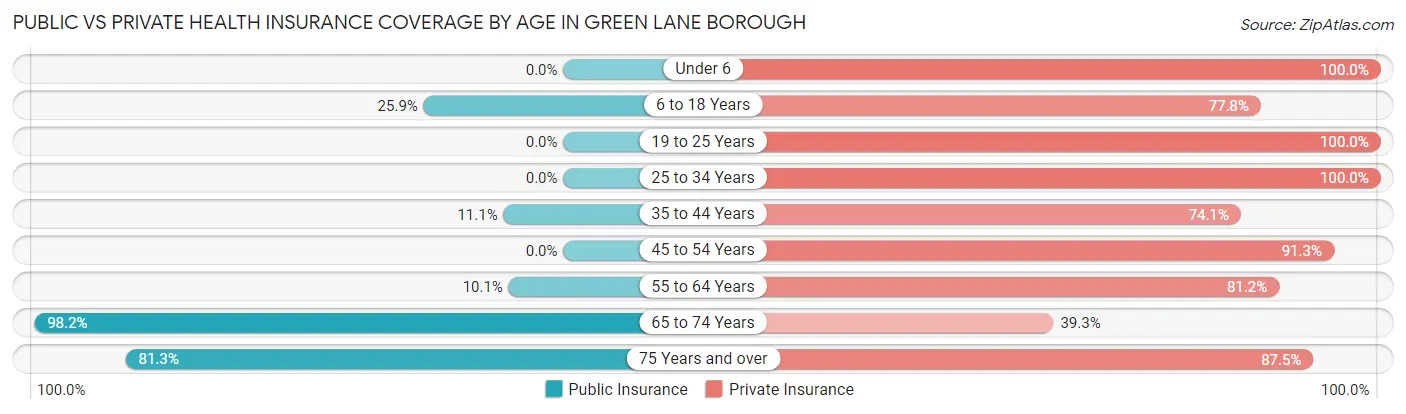
| Age Bracket | Public Insurance | Private Insurance |
| Under 6 | 0 (0.0%) | 46 (100.0%) |
| 6 to 18 Years | 7 (25.9%) | 21 (77.8%) |
| 19 to 25 Years | 0 (0.0%) | 27 (100.0%) |
| 25 to 34 Years | 0 (0.0%) | 61 (100.0%) |
| 35 to 44 Years | 3 (11.1%) | 20 (74.1%) |
| 45 to 54 Years | 0 (0.0%) | 42 (91.3%) |
| 55 to 64 Years | 7 (10.1%) | 56 (81.2%) |
| 65 to 74 Years | 55 (98.2%) | 22 (39.3%) |
| 75 Years and over | 13 (81.2%) | 14 (87.5%) |
| Total | 85 (22.7%) | 309 (82.4%) |
Disability Status by Sex by Age in Green Lane borough
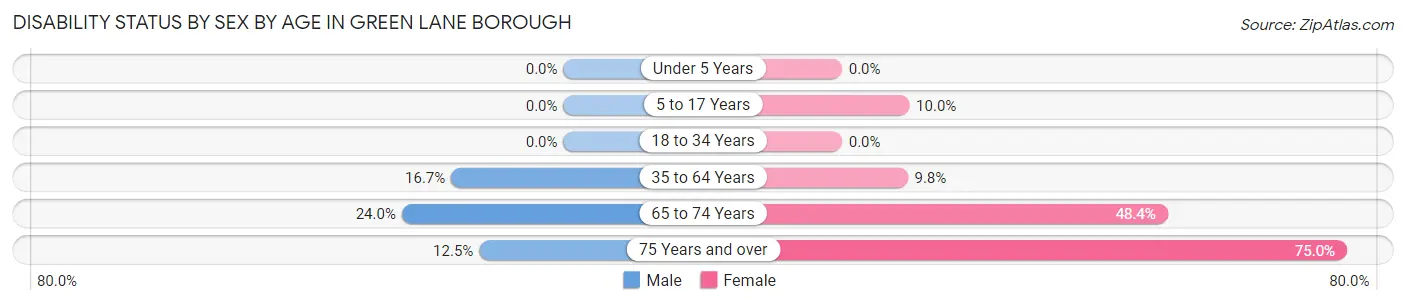
| Age Bracket | Male | Female |
| Under 5 Years | 0 (0.0%) | 0 (0.0%) |
| 5 to 17 Years | 0 (0.0%) | 3 (10.0%) |
| 18 to 34 Years | 0 (0.0%) | 0 (0.0%) |
| 35 to 64 Years | 10 (16.7%) | 8 (9.8%) |
| 65 to 74 Years | 6 (24.0%) | 15 (48.4%) |
| 75 Years and over | 1 (12.5%) | 6 (75.0%) |
Disability Class by Sex by Age in Green Lane borough
Disability Class: Hearing Difficulty
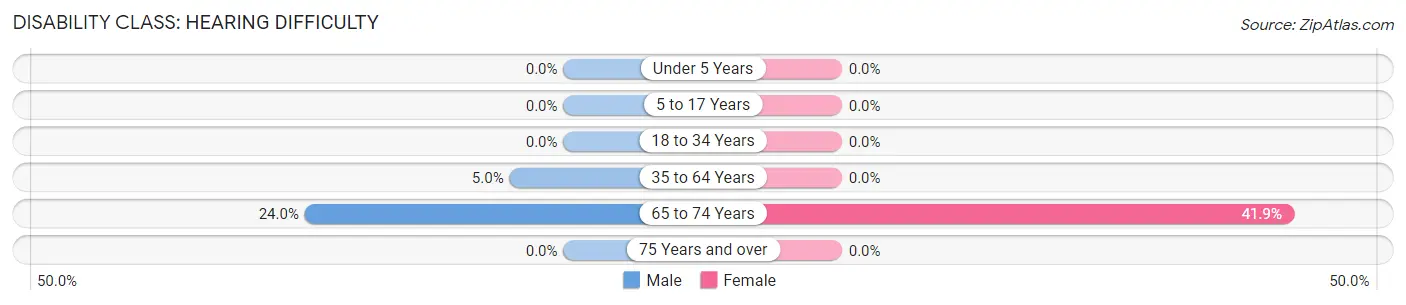
| Age Bracket | Male | Female |
| Under 5 Years | 0 (0.0%) | 0 (0.0%) |
| 5 to 17 Years | 0 (0.0%) | 0 (0.0%) |
| 18 to 34 Years | 0 (0.0%) | 0 (0.0%) |
| 35 to 64 Years | 3 (5.0%) | 0 (0.0%) |
| 65 to 74 Years | 6 (24.0%) | 13 (41.9%) |
| 75 Years and over | 0 (0.0%) | 0 (0.0%) |
Disability Class: Vision Difficulty
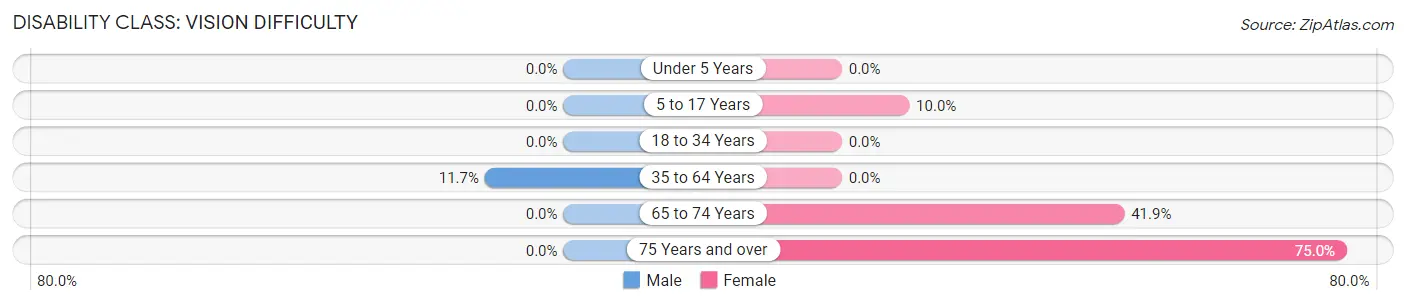
| Age Bracket | Male | Female |
| Under 5 Years | 0 (0.0%) | 0 (0.0%) |
| 5 to 17 Years | 0 (0.0%) | 3 (10.0%) |
| 18 to 34 Years | 0 (0.0%) | 0 (0.0%) |
| 35 to 64 Years | 7 (11.7%) | 0 (0.0%) |
| 65 to 74 Years | 0 (0.0%) | 13 (41.9%) |
| 75 Years and over | 0 (0.0%) | 6 (75.0%) |
Disability Class: Cognitive Difficulty
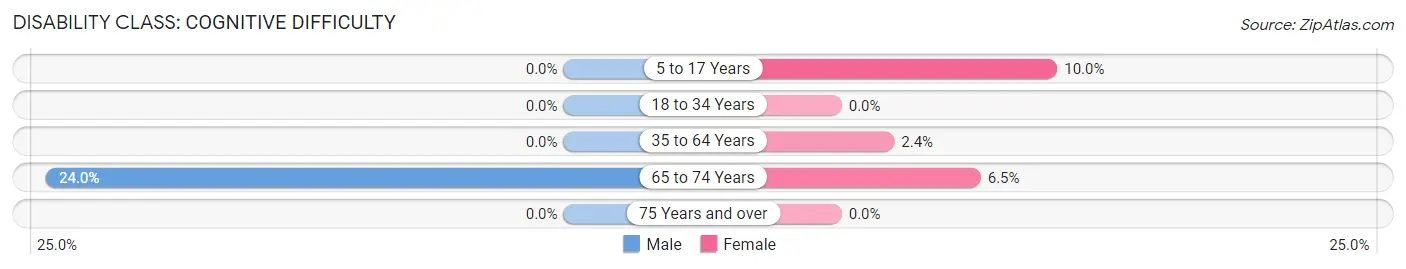
| Age Bracket | Male | Female |
| 5 to 17 Years | 0 (0.0%) | 3 (10.0%) |
| 18 to 34 Years | 0 (0.0%) | 0 (0.0%) |
| 35 to 64 Years | 0 (0.0%) | 2 (2.4%) |
| 65 to 74 Years | 6 (24.0%) | 2 (6.5%) |
| 75 Years and over | 0 (0.0%) | 0 (0.0%) |
Disability Class: Ambulatory Difficulty
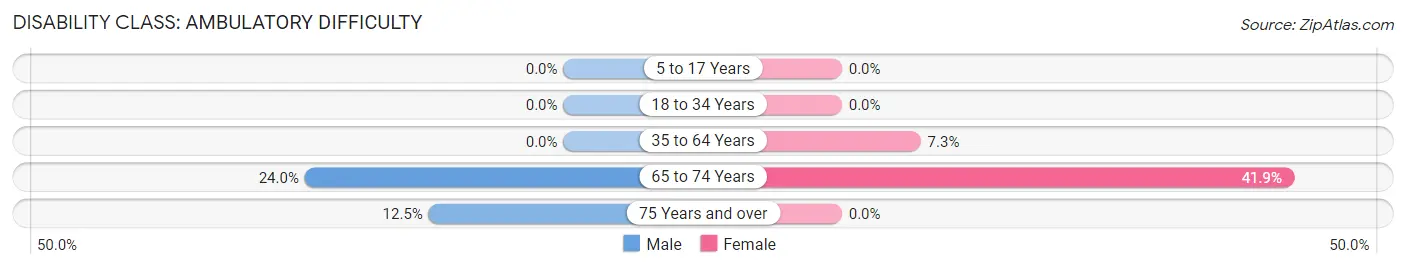
| Age Bracket | Male | Female |
| 5 to 17 Years | 0 (0.0%) | 0 (0.0%) |
| 18 to 34 Years | 0 (0.0%) | 0 (0.0%) |
| 35 to 64 Years | 0 (0.0%) | 6 (7.3%) |
| 65 to 74 Years | 6 (24.0%) | 13 (41.9%) |
| 75 Years and over | 1 (12.5%) | 0 (0.0%) |
Disability Class: Self-Care Difficulty
| Age Bracket | Male | Female |
| 5 to 17 Years | 0 (0.0%) | 0 (0.0%) |
| 18 to 34 Years | 0 (0.0%) | 0 (0.0%) |
| 35 to 64 Years | 0 (0.0%) | 0 (0.0%) |
| 65 to 74 Years | 0 (0.0%) | 0 (0.0%) |
| 75 Years and over | 0 (0.0%) | 0 (0.0%) |
Technology Access in Green Lane borough
Computing Device Access in Green Lane borough
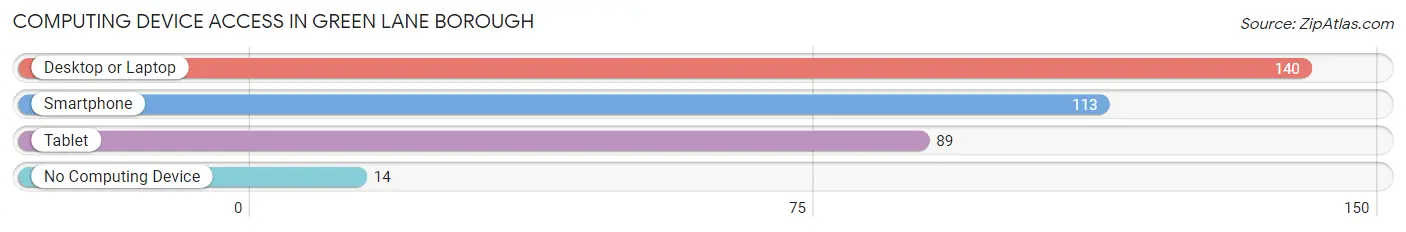
| Device Type | # Households | % Households |
| Desktop or Laptop | 140 | 87.5% |
| Smartphone | 113 | 70.6% |
| Tablet | 89 | 55.6% |
| No Computing Device | 14 | 8.7% |
| Total | 160 | 100.0% |
Internet Access in Green Lane borough
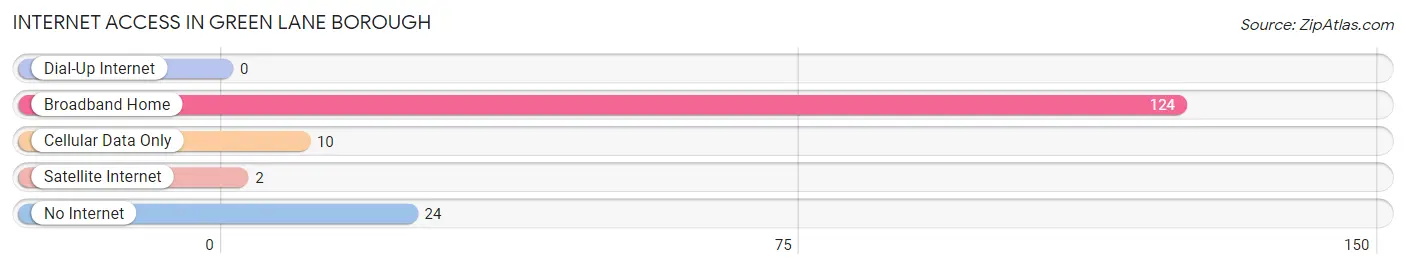
| Internet Type | # Households | % Households |
| Dial-Up Internet | 0 | 0.0% |
| Broadband Home | 124 | 77.5% |
| Cellular Data Only | 10 | 6.2% |
| Satellite Internet | 2 | 1.3% |
| No Internet | 24 | 15.0% |
| Total | 160 | 100.0% |
Green Lane borough Summary
Green Lane Borough is a small borough located in Montgomery County, Pennsylvania. It is situated in the southeastern part of the county, approximately 25 miles northwest of Philadelphia. The borough is bordered by Marlborough Township to the north, Upper Salford Township to the east, Lower Salford Township to the south, and Upper Hanover Township to the west. As of the 2010 census, the population of Green Lane Borough was 1,845.
History
Green Lane Borough was originally part of Marlborough Township, which was established in 1717. In 1854, the area that is now Green Lane Borough was separated from Marlborough Township and incorporated as a borough. The borough was named after the Green Lane, a road that ran through the area. The road was named after the Green Lane Tavern, which was located at the intersection of the road and the Perkiomen Creek.
The borough was primarily an agricultural community until the early 20th century, when the population began to grow due to the influx of new residents. The borough was home to several small businesses, including a sawmill, a gristmill, a blacksmith shop, and a general store.
Geography
Green Lane Borough is located at 40°17'45"N 75°25'45"W (40.295833, -75.429167). It has a total area of 1.2 square miles, all of which is land. The borough is situated in the southeastern part of Montgomery County, approximately 25 miles northwest of Philadelphia. It is bordered by Marlborough Township to the north, Upper Salford Township to the east, Lower Salford Township to the south, and Upper Hanover Township to the west.
The borough is located in the Perkiomen Valley, which is a part of the Great Valley region of southeastern Pennsylvania. The Perkiomen Creek runs through the borough, and the borough is home to several small lakes, including Green Lane Reservoir, which is the largest lake in the borough.
Economy
Green Lane Borough is primarily a residential community, and the majority of its residents are employed in the nearby cities of Philadelphia and Allentown. The borough is home to several small businesses, including a sawmill, a gristmill, a blacksmith shop, and a general store.
The borough is also home to several parks and recreational areas, including Green Lane Park, which is the largest park in the borough. The park offers a variety of activities, including fishing, boating, camping, and hiking.
Demographics
As of the 2010 census, the population of Green Lane Borough was 1,845. The racial makeup of the borough was 94.3% White, 2.2% African American, 0.3% Native American, 0.7% Asian, 0.1% Pacific Islander, 0.9% from other races, and 1.5% from two or more races. Hispanic or Latino of any race were 2.2% of the population.
The median household income in the borough was $60,938, and the median family income was $68,750. The per capita income in the borough was $27,945. About 4.3% of families and 5.3% of the population were below the poverty line, including 6.2% of those under age 18 and 4.2% of those age 65 or over.
Common Questions
What is Per Capita Income in Green Lane borough?
Per Capita income in Green Lane borough is $88,105.
What is the Median Family Income in Green Lane borough?
Median Family Income in Green Lane borough is $74,583.
What is the Median Household income in Green Lane borough?
Median Household Income in Green Lane borough is $74,167.
What is Income or Wage Gap in Green Lane borough?
Income or Wage Gap in Green Lane borough is 51.2%.
Women in Green Lane borough earn 48.8 cents for every dollar earned by a man.
What is Inequality or Gini Index in Green Lane borough?
Inequality or Gini Index in Green Lane borough is 0.70.
What is the Total Population of Green Lane borough?
Total Population of Green Lane borough is 375.
What is the Total Male Population of Green Lane borough?
Total Male Population of Green Lane borough is 154.
What is the Total Female Population of Green Lane borough?
Total Female Population of Green Lane borough is 221.
What is the Ratio of Males per 100 Females in Green Lane borough?
There are 69.68 Males per 100 Females in Green Lane borough.
What is the Ratio of Females per 100 Males in Green Lane borough?
There are 143.51 Females per 100 Males in Green Lane borough.
What is the Median Population Age in Green Lane borough?
Median Population Age in Green Lane borough is 44.5 Years.
What is the Average Family Size in Green Lane borough
Average Family Size in Green Lane borough is 3.2 People.
What is the Average Household Size in Green Lane borough
Average Household Size in Green Lane borough is 2.3 People.
How Large is the Labor Force in Green Lane borough?
There are 205 People in the Labor Forcein in Green Lane borough.
What is the Percentage of People in the Labor Force in Green Lane borough?
66.6% of People are in the Labor Force in Green Lane borough.
What is the Unemployment Rate in Green Lane borough?
Unemployment Rate in Green Lane borough is 3.4%.