Kenmar, PA Map & Demographics
Kenmar Map
Kenmar Overview
$37,283
PER CAPITA INCOME
$69,583
AVG FAMILY INCOME
$59,160
AVG HOUSEHOLD INCOME
24.5%
WAGE / INCOME GAP [ % ]
75.5¢/ $1
WAGE / INCOME GAP [ $ ]
0.42
INEQUALITY / GINI INDEX
4,705
TOTAL POPULATION
2,211
MALE POPULATION
2,494
FEMALE POPULATION
88.65
MALES / 100 FEMALES
112.80
FEMALES / 100 MALES
51.4
MEDIAN AGE
2.7
AVG FAMILY SIZE
2.2
AVG HOUSEHOLD SIZE
2,012
LABOR FORCE [ PEOPLE ]
53.8%
PERCENT IN LABOR FORCE
15.6%
UNEMPLOYMENT RATE
Income in Kenmar
Income Overview in Kenmar
Per Capita Income in Kenmar is $37,283, while median incomes of families and households are $69,583 and $59,160 respectively.
| Characteristic | Number | Measure |
| Per Capita Income | 4,705 | $37,283 |
| Median Family Income | 1,293 | $69,583 |
| Mean Family Income | 1,293 | $94,317 |
| Median Household Income | 2,053 | $59,160 |
| Mean Household Income | 2,053 | $85,087 |
| Income Deficit | 1,293 | $0 |
| Wage / Income Gap (%) | 4,705 | 24.48% |
| Wage / Income Gap ($) | 4,705 | 75.52¢ per $1 |
| Gini / Inequality Index | 4,705 | 0.42 |
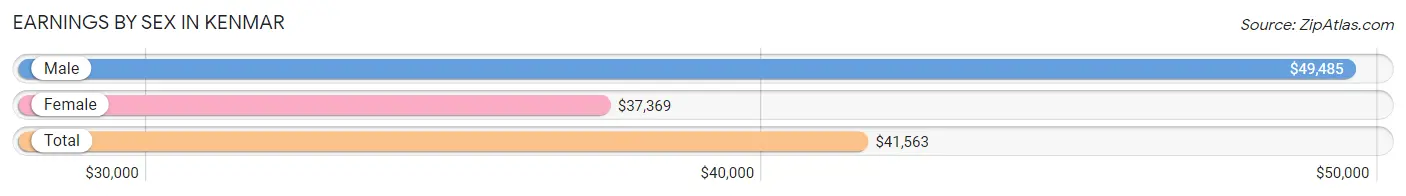
Earnings by Sex in Kenmar
Average Earnings in Kenmar are $41,563, $49,485 for men and $37,369 for women, a difference of 24.5%.
| Sex | Number | Average Earnings |
| Male | 948 (45.2%) | $49,485 |
| Female | 1,151 (54.8%) | $37,369 |
| Total | 2,099 (100.0%) | $41,563 |
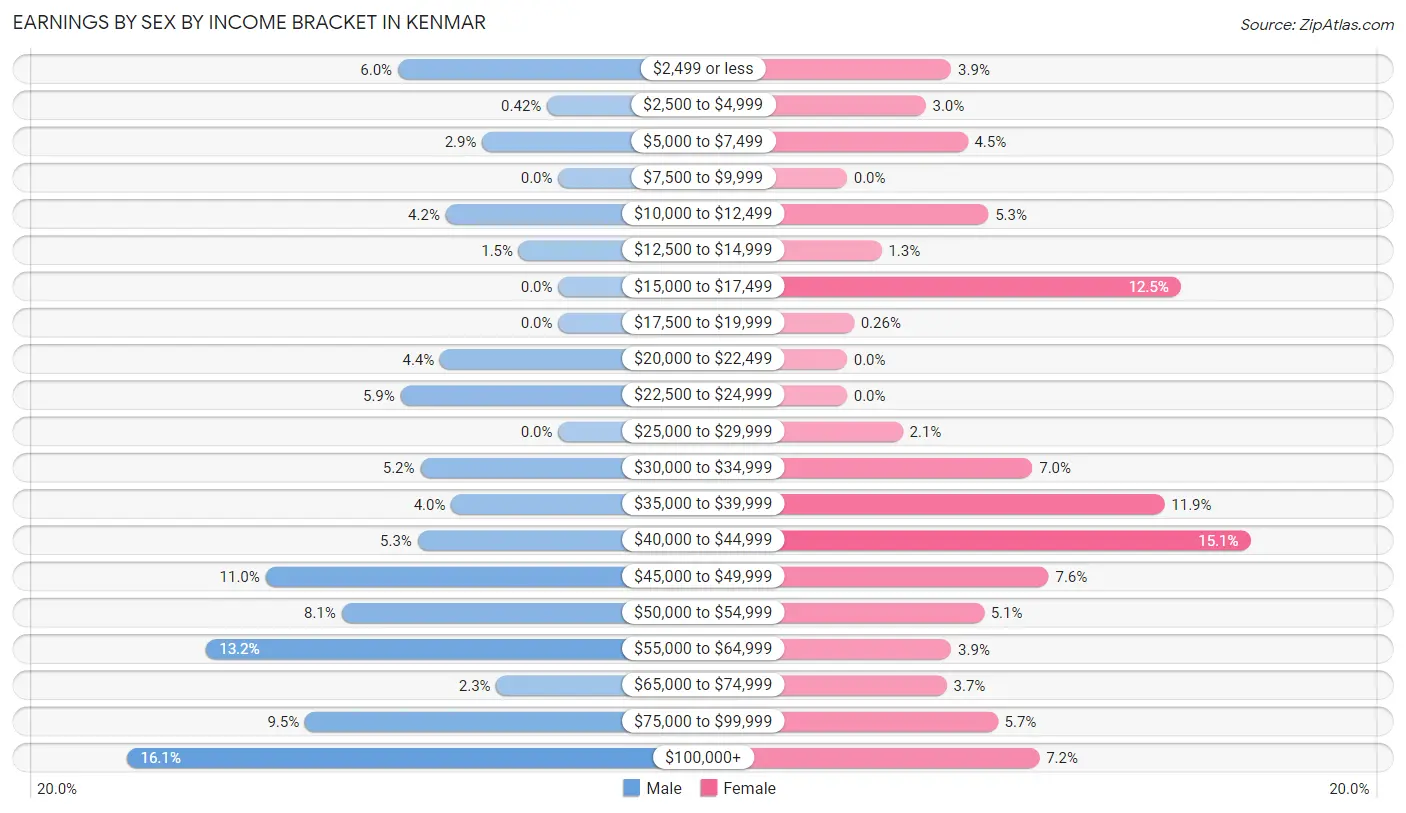
Earnings by Sex by Income Bracket in Kenmar
The most common earnings brackets in Kenmar are $100,000+ for men (153 | 16.1%) and $40,000 to $44,999 for women (174 | 15.1%).
| Income | Male | Female |
| $2,499 or less | 57 (6.0%) | 45 (3.9%) |
| $2,500 to $4,999 | 4 (0.4%) | 34 (2.9%) |
| $5,000 to $7,499 | 27 (2.9%) | 52 (4.5%) |
| $7,500 to $9,999 | 0 (0.0%) | 0 (0.0%) |
| $10,000 to $12,499 | 40 (4.2%) | 61 (5.3%) |
| $12,500 to $14,999 | 14 (1.5%) | 15 (1.3%) |
| $15,000 to $17,499 | 0 (0.0%) | 144 (12.5%) |
| $17,500 to $19,999 | 0 (0.0%) | 3 (0.3%) |
| $20,000 to $22,499 | 42 (4.4%) | 0 (0.0%) |
| $22,500 to $24,999 | 56 (5.9%) | 0 (0.0%) |
| $25,000 to $29,999 | 0 (0.0%) | 24 (2.1%) |
| $30,000 to $34,999 | 49 (5.2%) | 80 (7.0%) |
| $35,000 to $39,999 | 38 (4.0%) | 137 (11.9%) |
| $40,000 to $44,999 | 50 (5.3%) | 174 (15.1%) |
| $45,000 to $49,999 | 104 (11.0%) | 87 (7.6%) |
| $50,000 to $54,999 | 77 (8.1%) | 59 (5.1%) |
| $55,000 to $64,999 | 125 (13.2%) | 45 (3.9%) |
| $65,000 to $74,999 | 22 (2.3%) | 43 (3.7%) |
| $75,000 to $99,999 | 90 (9.5%) | 65 (5.7%) |
| $100,000+ | 153 (16.1%) | 83 (7.2%) |
| Total | 948 (100.0%) | 1,151 (100.0%) |
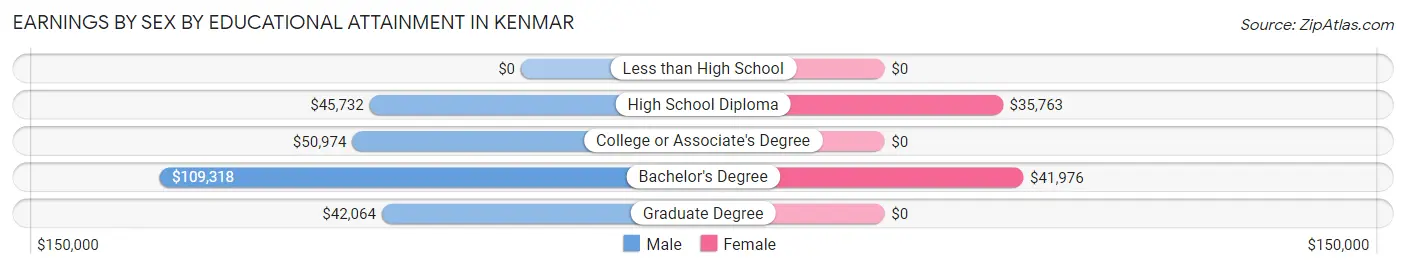
Earnings by Sex by Educational Attainment in Kenmar
Average earnings in Kenmar are $51,039 for men and $39,327 for women, a difference of 23.0%. Men with an educational attainment of bachelor's degree enjoy the highest average annual earnings of $109,318, while those with graduate degree education earn the least with $42,064. Women with an educational attainment of bachelor's degree earn the most with the average annual earnings of $41,976, while those with high school diploma education have the smallest earnings of $35,763.
| Educational Attainment | Male Income | Female Income |
| Less than High School | - | - |
| High School Diploma | $45,732 | $35,763 |
| College or Associate's Degree | $50,974 | $0 |
| Bachelor's Degree | $109,318 | $41,976 |
| Graduate Degree | $42,064 | $0 |
| Total | $51,039 | $39,327 |
Family Income in Kenmar
Family Income Brackets in Kenmar
According to the Kenmar family income data, there are 357 families falling into the $50,000 to $74,999 income range, which is the most common income bracket and makes up 27.6% of all families.
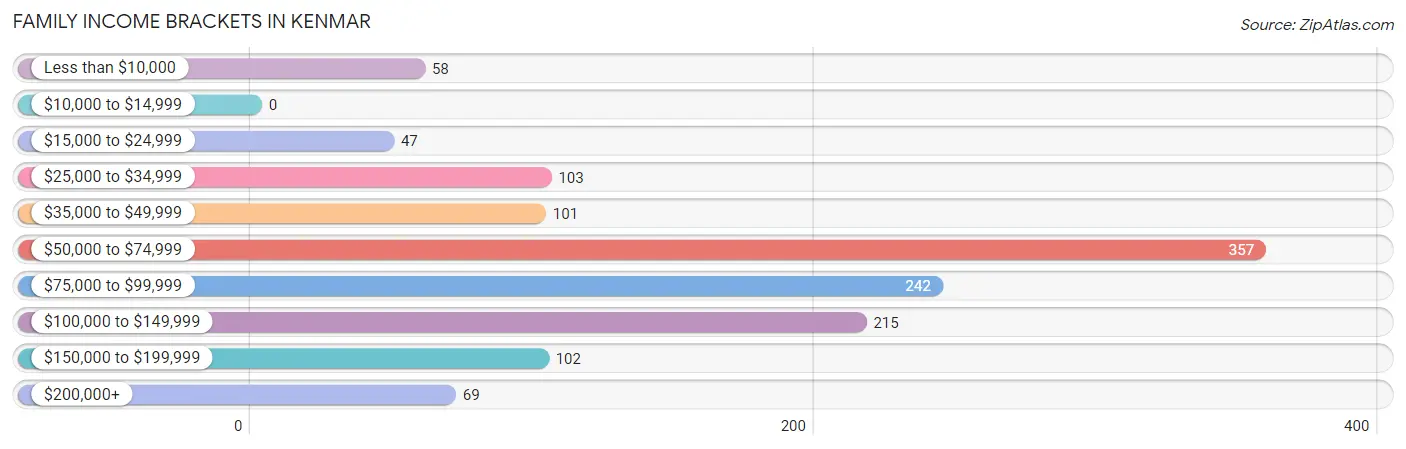
| Income Bracket | # Families | % Families |
| Less than $10,000 | 58 | 4.5% |
| $10,000 to $14,999 | 0 | 0.0% |
| $15,000 to $24,999 | 47 | 3.6% |
| $25,000 to $34,999 | 103 | 8.0% |
| $35,000 to $49,999 | 101 | 7.8% |
| $50,000 to $74,999 | 357 | 27.6% |
| $75,000 to $99,999 | 242 | 18.7% |
| $100,000 to $149,999 | 215 | 16.6% |
| $150,000 to $199,999 | 102 | 7.9% |
| $200,000+ | 69 | 5.3% |
Family Income by Famaliy Size in Kenmar
3-person families (204 | 15.8%) account for the highest median family income in Kenmar with $138,286 per family, while 3-person families (204 | 15.8%) have the highest median income of $46,095 per family member.
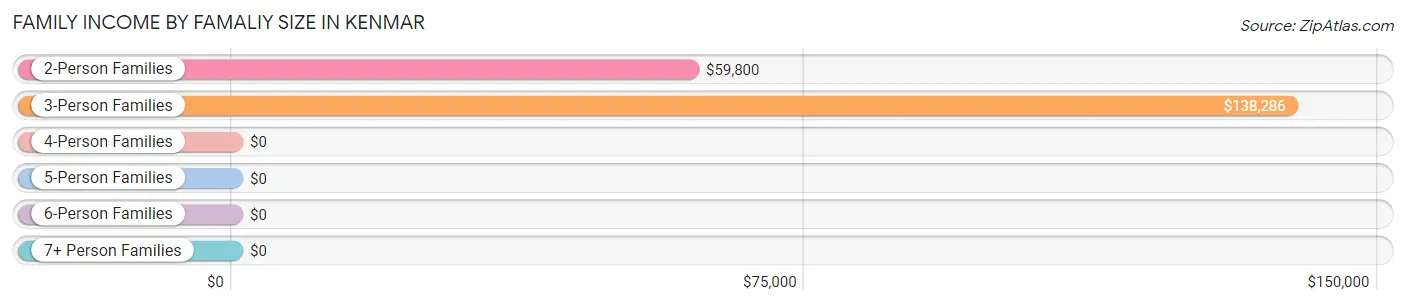
| Income Bracket | # Families | Median Income |
| 2-Person Families | 822 (63.6%) | $59,800 |
| 3-Person Families | 204 (15.8%) | $138,286 |
| 4-Person Families | 176 (13.6%) | $0 |
| 5-Person Families | 23 (1.8%) | $0 |
| 6-Person Families | 23 (1.8%) | $0 |
| 7+ Person Families | 45 (3.5%) | $0 |
| Total | 1,293 (100.0%) | $69,583 |
Family Income by Number of Earners in Kenmar
The median family income in Kenmar is $69,583, with families comprising 3+ earners (124) having the highest median family income of $193,000, while families with no earners (285) have the lowest median family income of $39,555, accounting for 9.6% and 22.0% of families, respectively.
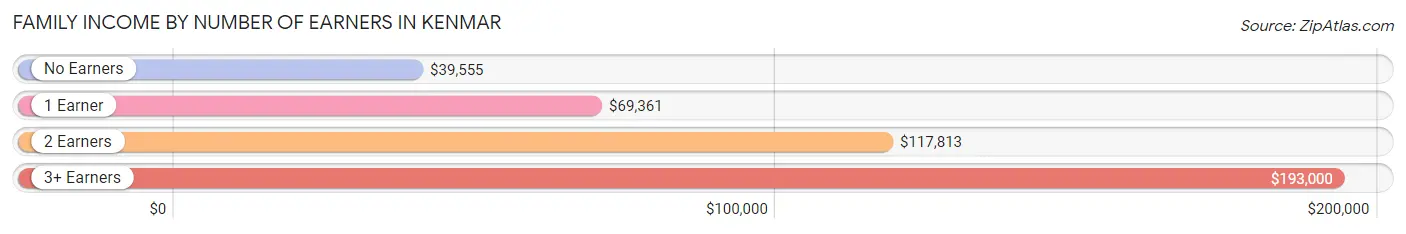
| Number of Earners | # Families | Median Income |
| No Earners | 285 (22.0%) | $39,555 |
| 1 Earner | 589 (45.6%) | $69,361 |
| 2 Earners | 295 (22.8%) | $117,813 |
| 3+ Earners | 124 (9.6%) | $193,000 |
| Total | 1,293 (100.0%) | $69,583 |
Household Income in Kenmar
Household Income Brackets in Kenmar
With 507 households falling in the category, the $50,000 to $74,999 income range is the most frequent in Kenmar, accounting for 24.7% of all households. In contrast, only 14 households (0.7%) fall into the $10,000 to $14,999 income bracket, making it the least populous group.
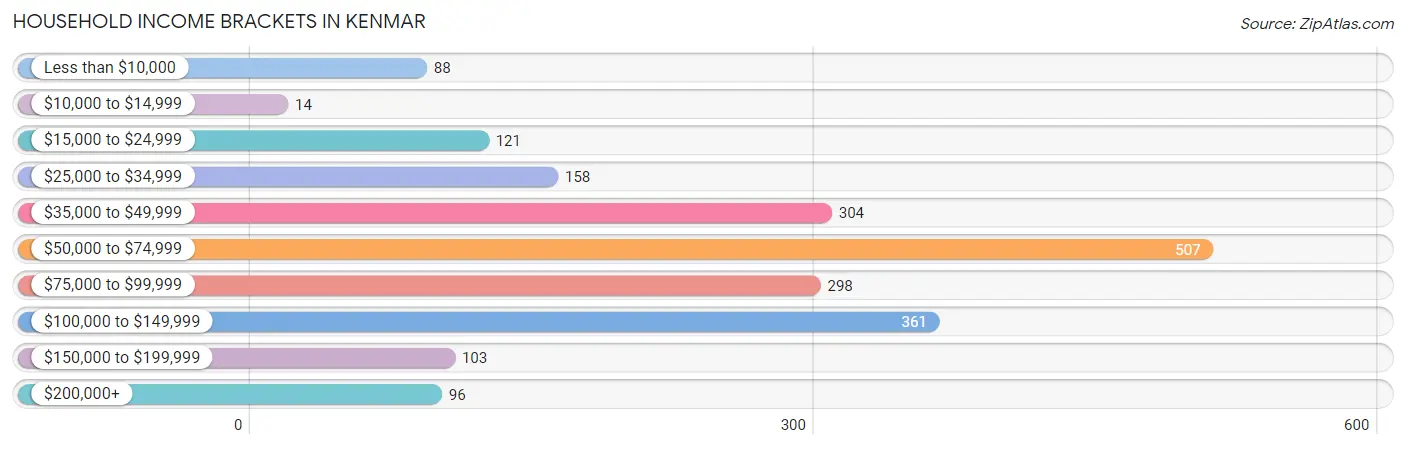
| Income Bracket | # Households | % Households |
| Less than $10,000 | 88 | 4.3% |
| $10,000 to $14,999 | 14 | 0.7% |
| $15,000 to $24,999 | 121 | 5.9% |
| $25,000 to $34,999 | 158 | 7.7% |
| $35,000 to $49,999 | 304 | 14.8% |
| $50,000 to $74,999 | 507 | 24.7% |
| $75,000 to $99,999 | 298 | 14.5% |
| $100,000 to $149,999 | 361 | 17.6% |
| $150,000 to $199,999 | 103 | 5.0% |
| $200,000+ | 96 | 4.7% |
Household Income by Householder Age in Kenmar
The median household income in Kenmar is $59,160, with the highest median household income of $111,758 found in the 25 to 44 years age bracket for the primary householder. A total of 408 households (19.9%) fall into this category.
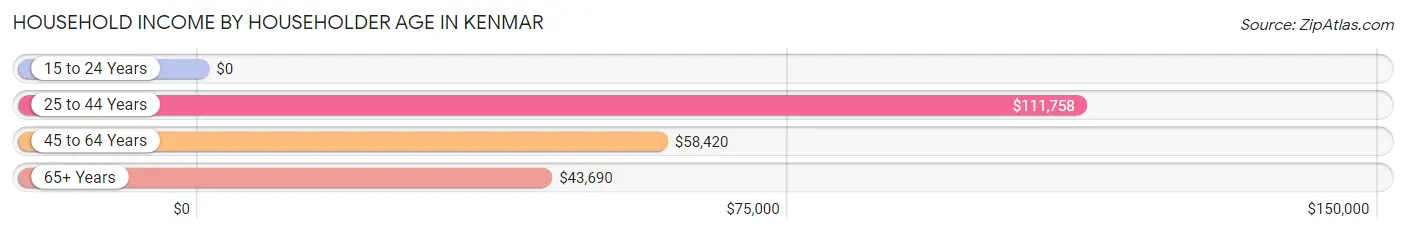
| Income Bracket | # Households | Median Income |
| 15 to 24 Years | 0 (0.0%) | $0 |
| 25 to 44 Years | 408 (19.9%) | $111,758 |
| 45 to 64 Years | 905 (44.1%) | $58,420 |
| 65+ Years | 740 (36.0%) | $43,690 |
| Total | 2,053 (100.0%) | $59,160 |
Poverty in Kenmar
Income Below Poverty by Sex and Age in Kenmar
With 5.1% poverty level for males and 13.3% for females among the residents of Kenmar, 55 to 64 year old males and 16 and 17 year old females are the most vulnerable to poverty, with 52 males (17.2%) and 75 females (71.4%) in their respective age groups living below the poverty level.
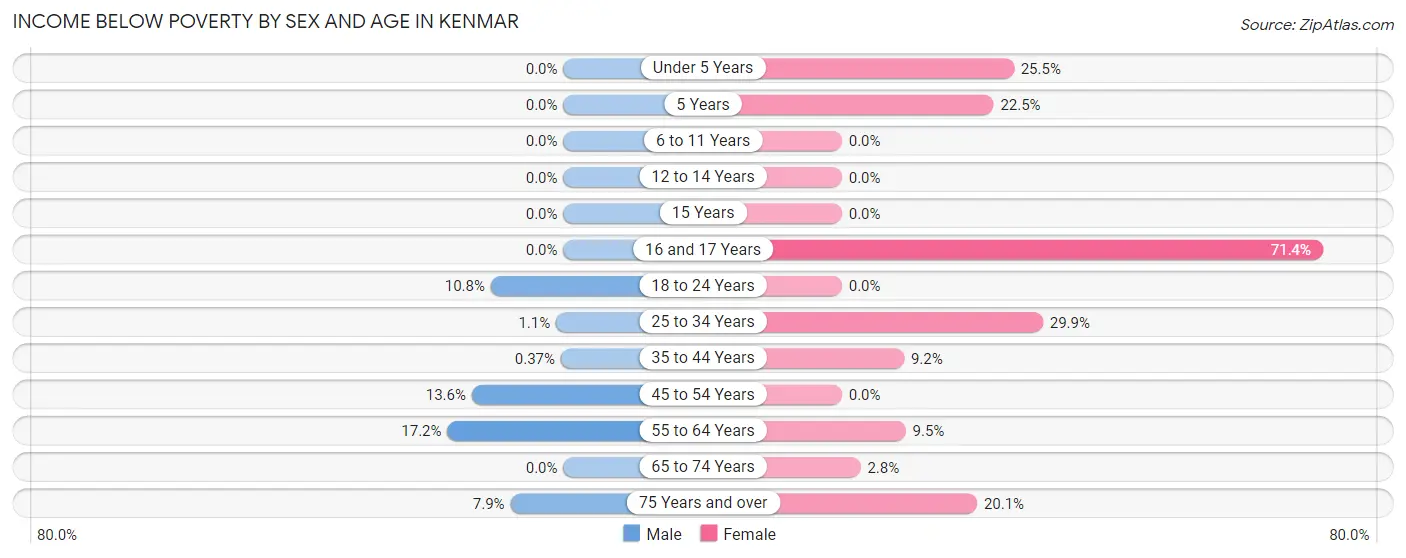
| Age Bracket | Male | Female |
| Under 5 Years | 0 (0.0%) | 24 (25.5%) |
| 5 Years | 0 (0.0%) | 25 (22.5%) |
| 6 to 11 Years | 0 (0.0%) | 0 (0.0%) |
| 12 to 14 Years | 0 (0.0%) | 0 (0.0%) |
| 15 Years | 0 (0.0%) | 0 (0.0%) |
| 16 and 17 Years | 0 (0.0%) | 75 (71.4%) |
| 18 to 24 Years | 11 (10.8%) | 0 (0.0%) |
| 25 to 34 Years | 2 (1.1%) | 40 (29.8%) |
| 35 to 44 Years | 1 (0.4%) | 31 (9.2%) |
| 45 to 54 Years | 31 (13.6%) | 0 (0.0%) |
| 55 to 64 Years | 52 (17.2%) | 50 (9.5%) |
| 65 to 74 Years | 0 (0.0%) | 11 (2.8%) |
| 75 Years and over | 11 (7.9%) | 56 (20.1%) |
| Total | 108 (5.1%) | 312 (13.3%) |
Income Above Poverty by Sex and Age in Kenmar
According to the poverty statistics in Kenmar, males aged under 5 years and females aged 6 to 11 years are the age groups that are most secure financially, with 100.0% of males and 100.0% of females in these age groups living above the poverty line.
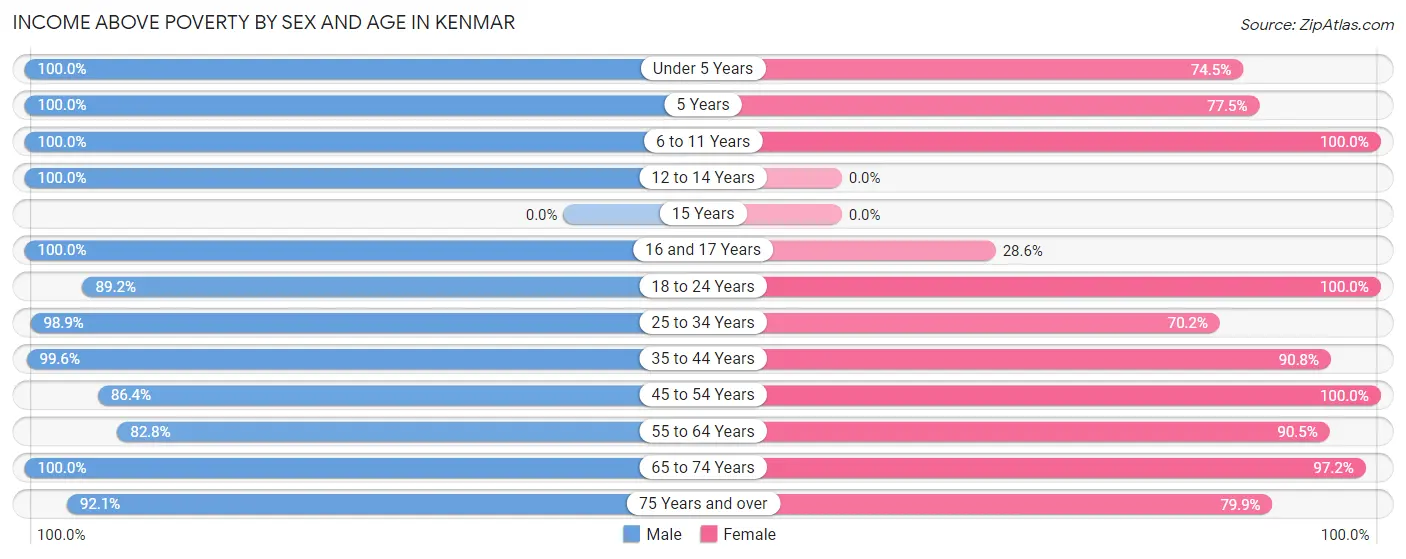
| Age Bracket | Male | Female |
| Under 5 Years | 176 (100.0%) | 70 (74.5%) |
| 5 Years | 31 (100.0%) | 86 (77.5%) |
| 6 to 11 Years | 159 (100.0%) | 181 (100.0%) |
| 12 to 14 Years | 130 (100.0%) | 0 (0.0%) |
| 15 Years | 0 (0.0%) | 0 (0.0%) |
| 16 and 17 Years | 18 (100.0%) | 30 (28.6%) |
| 18 to 24 Years | 91 (89.2%) | 37 (100.0%) |
| 25 to 34 Years | 181 (98.9%) | 94 (70.2%) |
| 35 to 44 Years | 270 (99.6%) | 305 (90.8%) |
| 45 to 54 Years | 197 (86.4%) | 139 (100.0%) |
| 55 to 64 Years | 250 (82.8%) | 478 (90.5%) |
| 65 to 74 Years | 393 (100.0%) | 386 (97.2%) |
| 75 Years and over | 129 (92.1%) | 223 (79.9%) |
| Total | 2,025 (94.9%) | 2,029 (86.7%) |
Income Below Poverty Among Married-Couple Families in Kenmar
The poverty statistics for married-couple families in Kenmar show that 1.2% or 11 of the total 944 families live below the poverty line. Families with no children have the highest poverty rate of 1.5%, comprising of 11 families. On the other hand, families with 1 or 2 children have the lowest poverty rate of 0.0%, which includes 0 families.
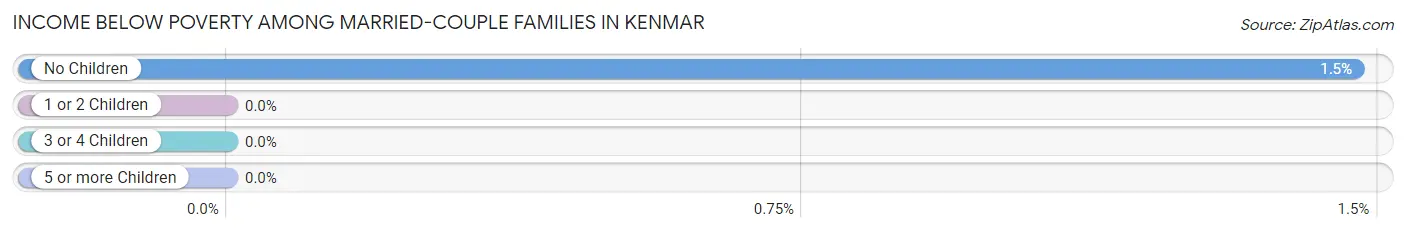
| Children | Above Poverty | Below Poverty |
| No Children | 736 (98.5%) | 11 (1.5%) |
| 1 or 2 Children | 106 (100.0%) | 0 (0.0%) |
| 3 or 4 Children | 46 (100.0%) | 0 (0.0%) |
| 5 or more Children | 45 (100.0%) | 0 (0.0%) |
| Total | 933 (98.8%) | 11 (1.2%) |
Income Below Poverty Among Single-Parent Households in Kenmar
According to the poverty data in Kenmar, 17.2% or 23 single-father households and 33.0% or 71 single-mother households are living below the poverty line. Among single-father households, those with no children have the highest poverty rate, with 23 households (25.6%) experiencing poverty. Likewise, among single-mother households, those with 1 or 2 children have the highest poverty rate, with 56 households (35.9%) falling below the poverty line.
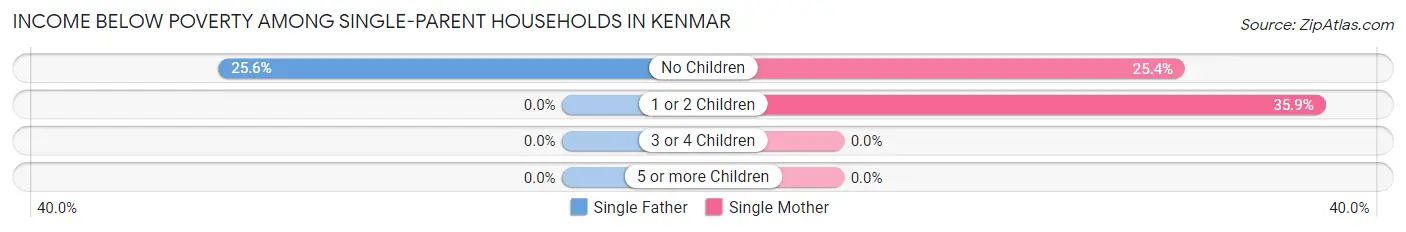
| Children | Single Father | Single Mother |
| No Children | 23 (25.6%) | 15 (25.4%) |
| 1 or 2 Children | 0 (0.0%) | 56 (35.9%) |
| 3 or 4 Children | 0 (0.0%) | 0 (0.0%) |
| 5 or more Children | 0 (0.0%) | 0 (0.0%) |
| Total | 23 (17.2%) | 71 (33.0%) |
Income Below Poverty Among Married-Couple vs Single-Parent Households in Kenmar
The poverty data for Kenmar shows that 11 of the married-couple family households (1.2%) and 94 of the single-parent households (26.9%) are living below the poverty level. Within the married-couple family households, those with no children have the highest poverty rate, with 11 households (1.5%) falling below the poverty line. Among the single-parent households, those with 1 or 2 children have the highest poverty rate, with 56 household (28.0%) living below poverty.
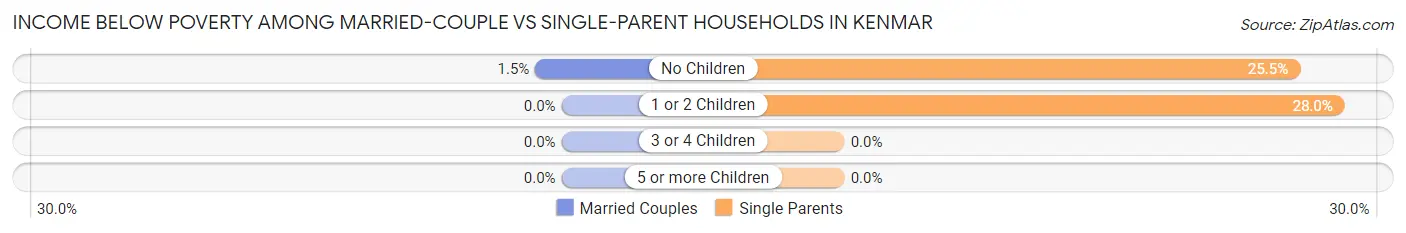
| Children | Married-Couple Families | Single-Parent Households |
| No Children | 11 (1.5%) | 38 (25.5%) |
| 1 or 2 Children | 0 (0.0%) | 56 (28.0%) |
| 3 or 4 Children | 0 (0.0%) | 0 (0.0%) |
| 5 or more Children | 0 (0.0%) | 0 (0.0%) |
| Total | 11 (1.2%) | 94 (26.9%) |
Race in Kenmar
The most populous races in Kenmar are White / Caucasian (3,878 | 82.4%), Black / African American (493 | 10.5%), and Two or more Races (334 | 7.1%).
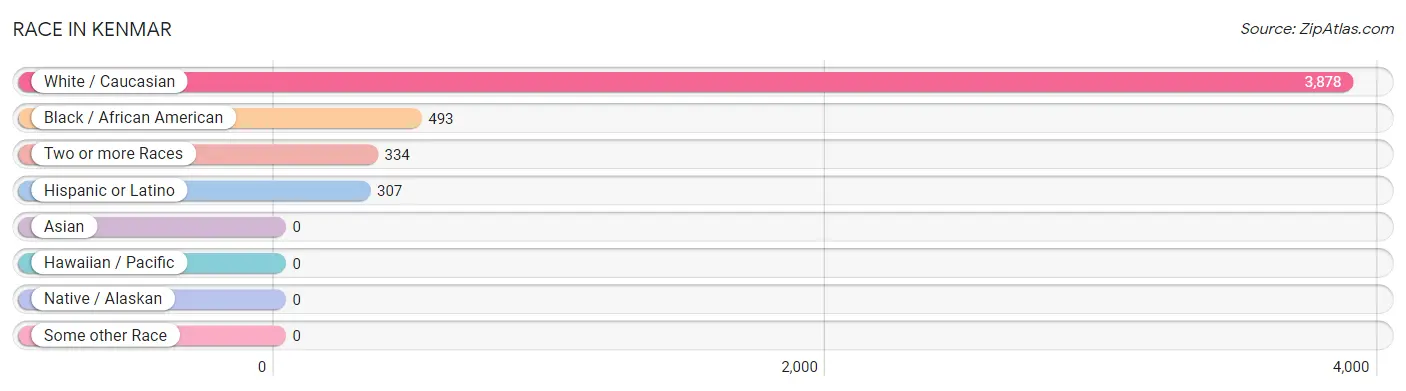
| Race | # Population | % Population |
| Asian | 0 | 0.0% |
| Black / African American | 493 | 10.5% |
| Hawaiian / Pacific | 0 | 0.0% |
| Hispanic or Latino | 307 | 6.5% |
| Native / Alaskan | 0 | 0.0% |
| White / Caucasian | 3,878 | 82.4% |
| Two or more Races | 334 | 7.1% |
| Some other Race | 0 | 0.0% |
| Total | 4,705 | 100.0% |
Ancestry in Kenmar
The most populous ancestries reported in Kenmar are German (1,144 | 24.3%), Irish (639 | 13.6%), Italian (495 | 10.5%), English (323 | 6.9%), and Polish (246 | 5.2%), together accounting for 60.5% of all Kenmar residents.
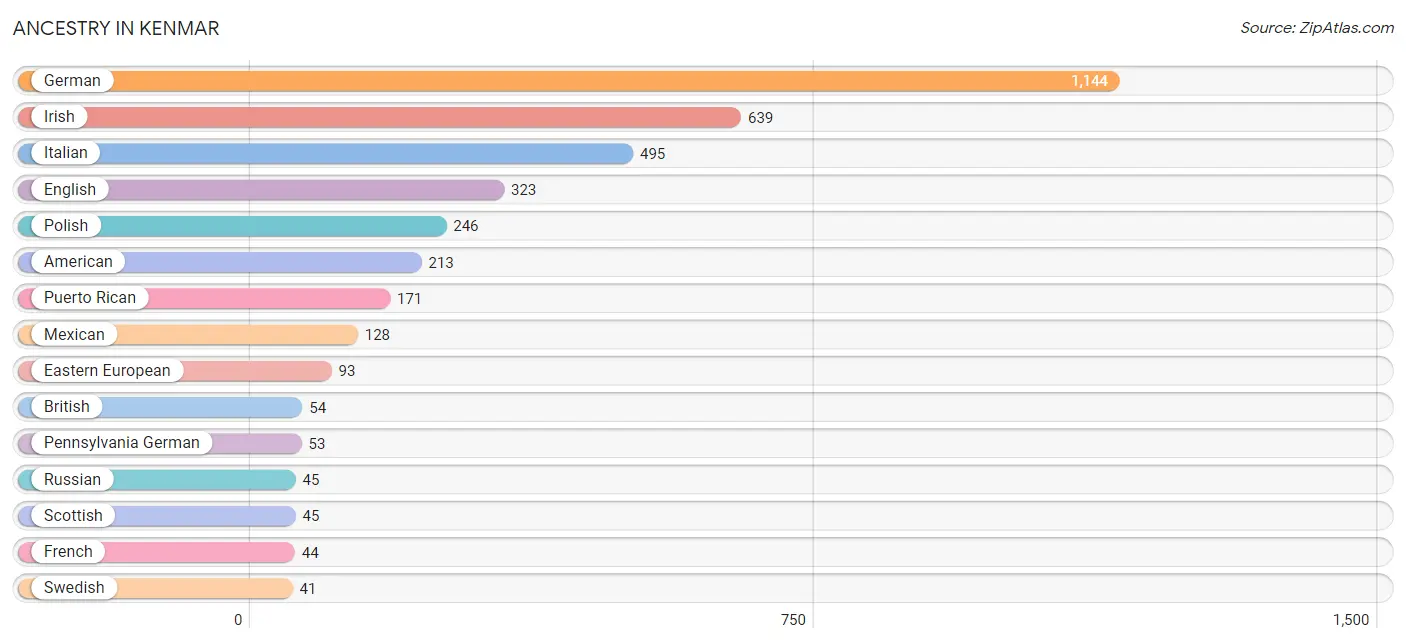
| Ancestry | # Population | % Population |
| African | 1 | 0.0% |
| American | 213 | 4.5% |
| British | 54 | 1.1% |
| Central American Indian | 2 | 0.0% |
| Croatian | 21 | 0.4% |
| Dutch | 39 | 0.8% |
| Eastern European | 93 | 2.0% |
| English | 323 | 6.9% |
| European | 29 | 0.6% |
| French | 44 | 0.9% |
| German | 1,144 | 24.3% |
| Hungarian | 9 | 0.2% |
| Irish | 639 | 13.6% |
| Italian | 495 | 10.5% |
| Lithuanian | 15 | 0.3% |
| Mexican | 128 | 2.7% |
| Northern European | 11 | 0.2% |
| Norwegian | 17 | 0.4% |
| Pennsylvania German | 53 | 1.1% |
| Polish | 246 | 5.2% |
| Puerto Rican | 171 | 3.6% |
| Russian | 45 | 1.0% |
| Scotch-Irish | 36 | 0.8% |
| Scottish | 45 | 1.0% |
| Slavic | 8 | 0.2% |
| Slovak | 13 | 0.3% |
| Spanish | 8 | 0.2% |
| Subsaharan African | 1 | 0.0% |
| Swedish | 41 | 0.9% |
| Swiss | 33 | 0.7% | View All 30 Rows |
Immigrants in Kenmar
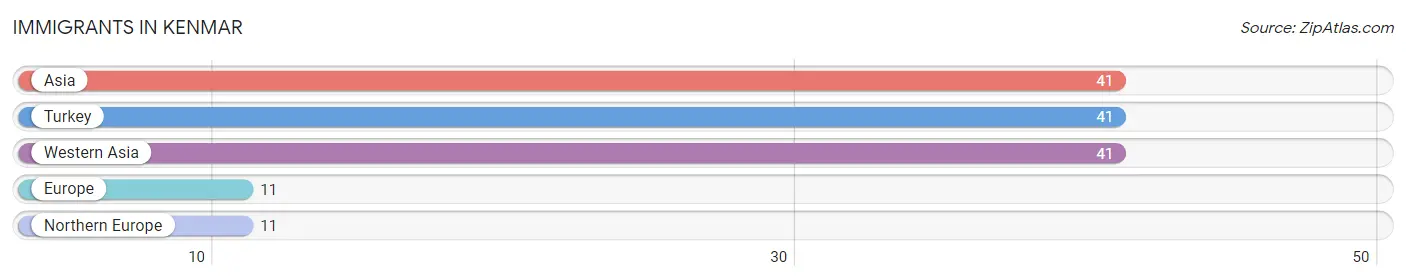
The most numerous immigrant groups reported in Kenmar came from Asia (41 | 0.9%), Turkey (41 | 0.9%), Western Asia (41 | 0.9%), Europe (11 | 0.2%), and Northern Europe (11 | 0.2%), together accounting for 3.1% of all Kenmar residents.
| Immigration Origin | # Population | % Population |
| Asia | 41 | 0.9% |
| Europe | 11 | 0.2% |
| Northern Europe | 11 | 0.2% |
| Turkey | 41 | 0.9% |
| Western Asia | 41 | 0.9% | View All 5 Rows |
Sex and Age in Kenmar
Sex and Age in Kenmar
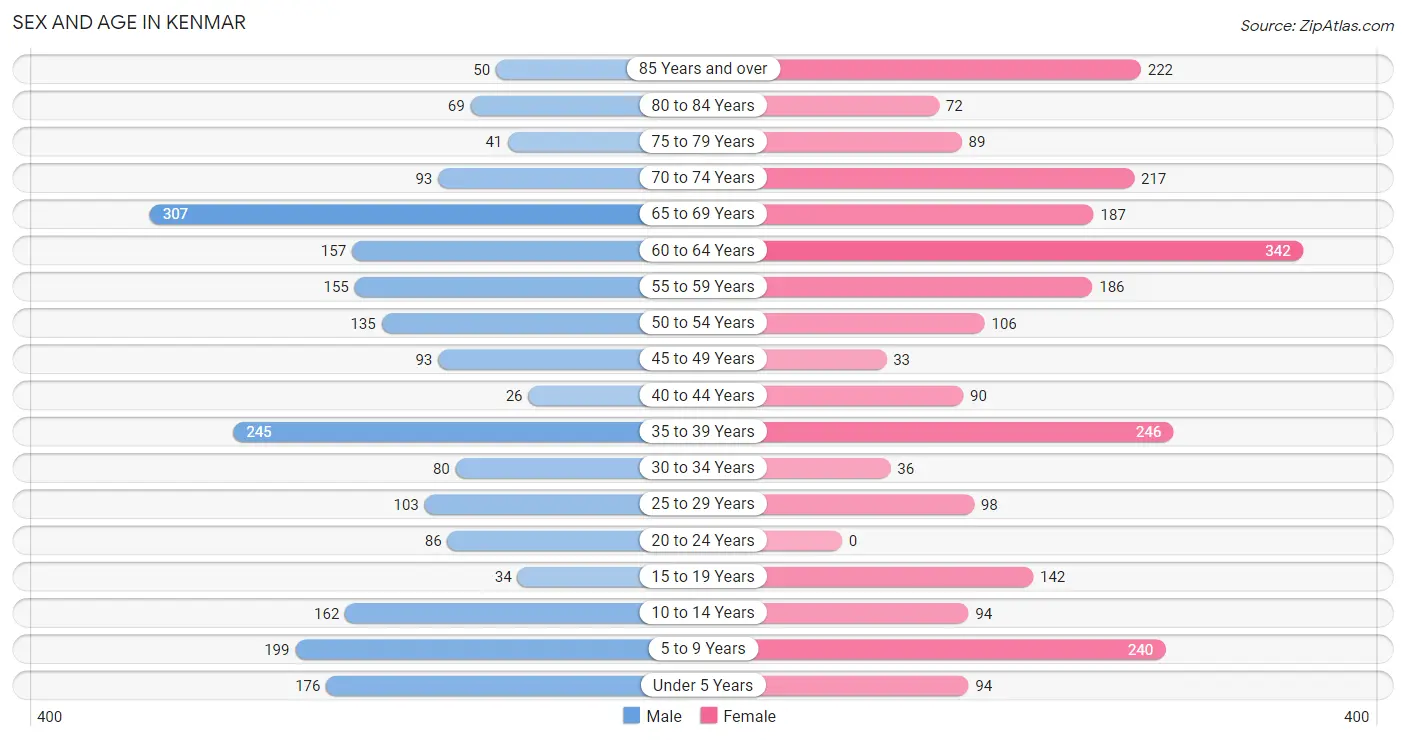
The most populous age groups in Kenmar are 65 to 69 Years (307 | 13.9%) for men and 60 to 64 Years (342 | 13.7%) for women.
| Age Bracket | Male | Female |
| Under 5 Years | 176 (8.0%) | 94 (3.8%) |
| 5 to 9 Years | 199 (9.0%) | 240 (9.6%) |
| 10 to 14 Years | 162 (7.3%) | 94 (3.8%) |
| 15 to 19 Years | 34 (1.5%) | 142 (5.7%) |
| 20 to 24 Years | 86 (3.9%) | 0 (0.0%) |
| 25 to 29 Years | 103 (4.7%) | 98 (3.9%) |
| 30 to 34 Years | 80 (3.6%) | 36 (1.4%) |
| 35 to 39 Years | 245 (11.1%) | 246 (9.9%) |
| 40 to 44 Years | 26 (1.2%) | 90 (3.6%) |
| 45 to 49 Years | 93 (4.2%) | 33 (1.3%) |
| 50 to 54 Years | 135 (6.1%) | 106 (4.3%) |
| 55 to 59 Years | 155 (7.0%) | 186 (7.5%) |
| 60 to 64 Years | 157 (7.1%) | 342 (13.7%) |
| 65 to 69 Years | 307 (13.9%) | 187 (7.5%) |
| 70 to 74 Years | 93 (4.2%) | 217 (8.7%) |
| 75 to 79 Years | 41 (1.8%) | 89 (3.6%) |
| 80 to 84 Years | 69 (3.1%) | 72 (2.9%) |
| 85 Years and over | 50 (2.3%) | 222 (8.9%) |
| Total | 2,211 (100.0%) | 2,494 (100.0%) |
Families and Households in Kenmar
Median Family Size in Kenmar
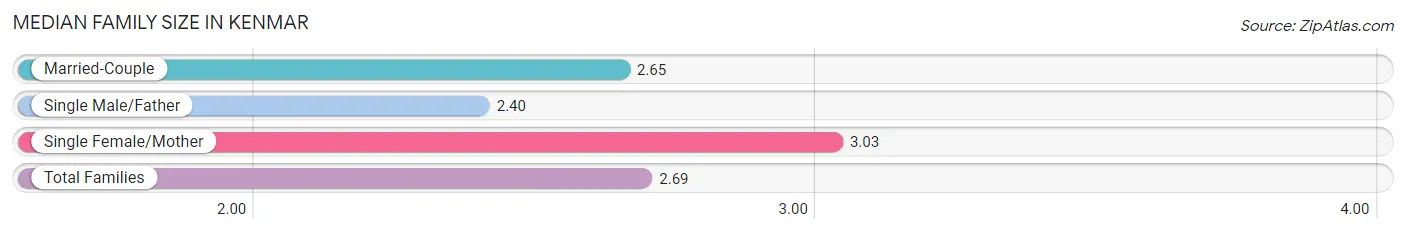
The median family size in Kenmar is 2.69 persons per family, with single female/mother families (215 | 16.6%) accounting for the largest median family size of 3.03 persons per family. On the other hand, single male/father families (134 | 10.4%) represent the smallest median family size with 2.40 persons per family.
| Family Type | # Families | Family Size |
| Married-Couple | 944 (73.0%) | 2.65 |
| Single Male/Father | 134 (10.4%) | 2.40 |
| Single Female/Mother | 215 (16.6%) | 3.03 |
| Total Families | 1,293 (100.0%) | 2.69 |
Median Household Size in Kenmar
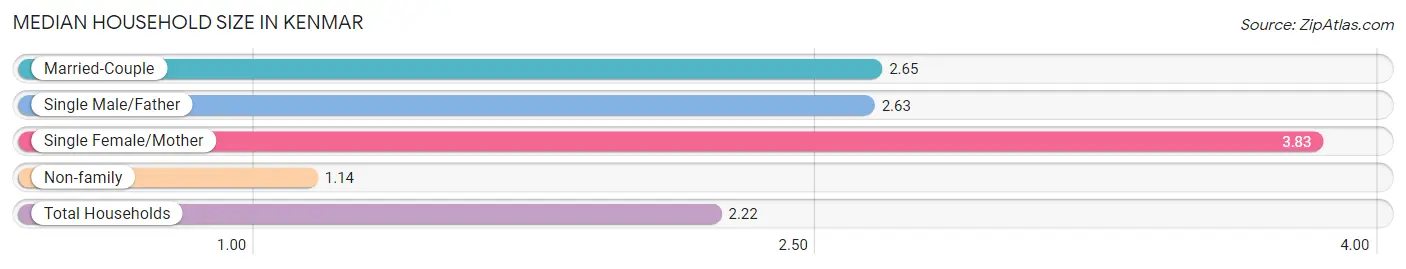
The median household size in Kenmar is 2.22 persons per household, with single female/mother households (215 | 10.5%) accounting for the largest median household size of 3.83 persons per household. non-family households (760 | 37.0%) represent the smallest median household size with 1.14 persons per household.
| Household Type | # Households | Household Size |
| Married-Couple | 944 (46.0%) | 2.65 |
| Single Male/Father | 134 (6.5%) | 2.63 |
| Single Female/Mother | 215 (10.5%) | 3.83 |
| Non-family | 760 (37.0%) | 1.14 |
| Total Households | 2,053 (100.0%) | 2.22 |
Household Size by Marriage Status in Kenmar
Out of a total of 2,053 households in Kenmar, 1,293 (63.0%) are family households, while 760 (37.0%) are nonfamily households. The most numerous type of family households are 2-person households, comprising 783, and the most common type of nonfamily households are 1-person households, comprising 647.
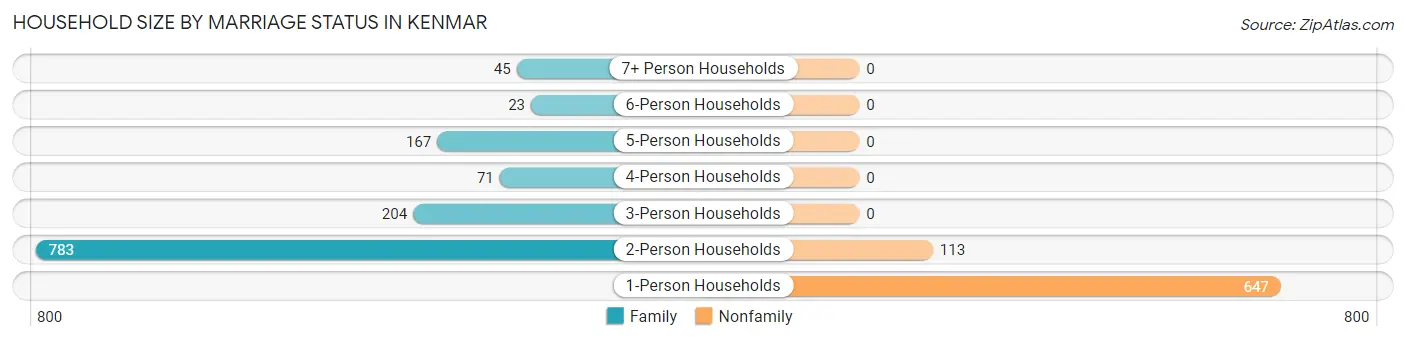
| Household Size | Family Households | Nonfamily Households |
| 1-Person Households | - | 647 (31.5%) |
| 2-Person Households | 783 (38.1%) | 113 (5.5%) |
| 3-Person Households | 204 (9.9%) | 0 (0.0%) |
| 4-Person Households | 71 (3.5%) | 0 (0.0%) |
| 5-Person Households | 167 (8.1%) | 0 (0.0%) |
| 6-Person Households | 23 (1.1%) | 0 (0.0%) |
| 7+ Person Households | 45 (2.2%) | 0 (0.0%) |
| Total | 1,293 (63.0%) | 760 (37.0%) |
Female Fertility in Kenmar
Fertility by Age in Kenmar
Average fertility rate in Kenmar is 64.0 births per 1,000 women. Women in the age bracket of 35 to 50 years have the highest fertility rate with 111.0 births per 1,000 women. Women in the age bracket of 35 to 50 years acount for 100.0% of all women with births.
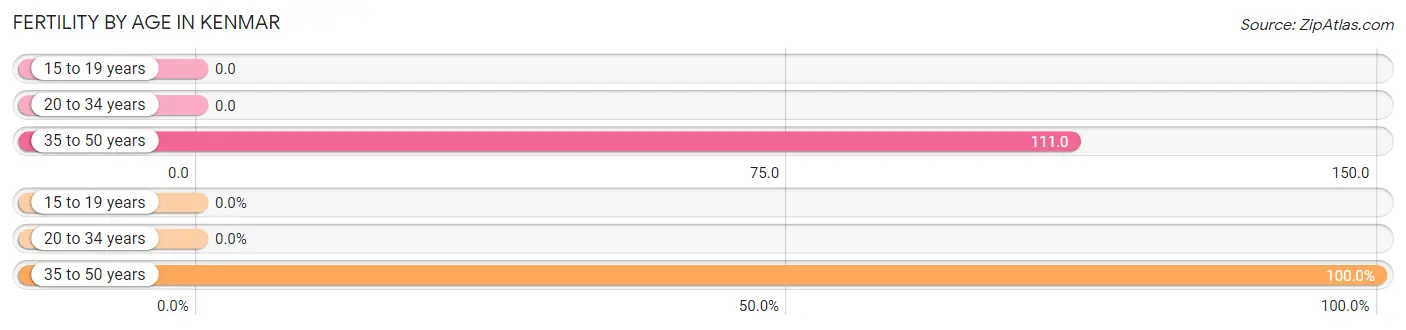
| Age Bracket | Women with Births | Births / 1,000 Women |
| 15 to 19 years | 0 (0.0%) | 0.0 |
| 20 to 34 years | 0 (0.0%) | 0.0 |
| 35 to 50 years | 41 (100.0%) | 111.0 |
| Total | 41 (100.0%) | 64.0 |
Fertility by Age by Marriage Status in Kenmar
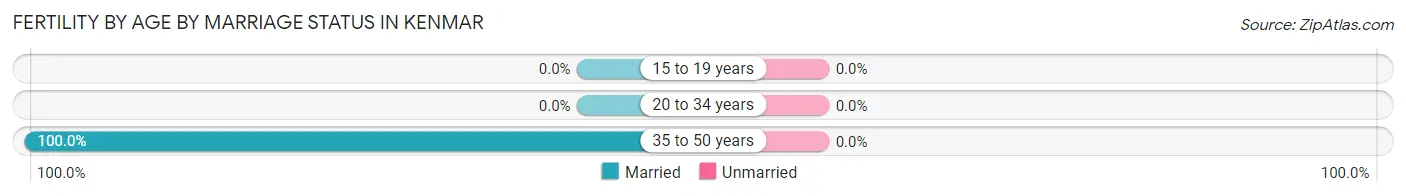
| Age Bracket | Married | Unmarried |
| 15 to 19 years | 0 (0.0%) | 0 (0.0%) |
| 20 to 34 years | 0 (0.0%) | 0 (0.0%) |
| 35 to 50 years | 41 (100.0%) | 0 (0.0%) |
| Total | 41 (100.0%) | 0 (0.0%) |
Fertility by Education in Kenmar
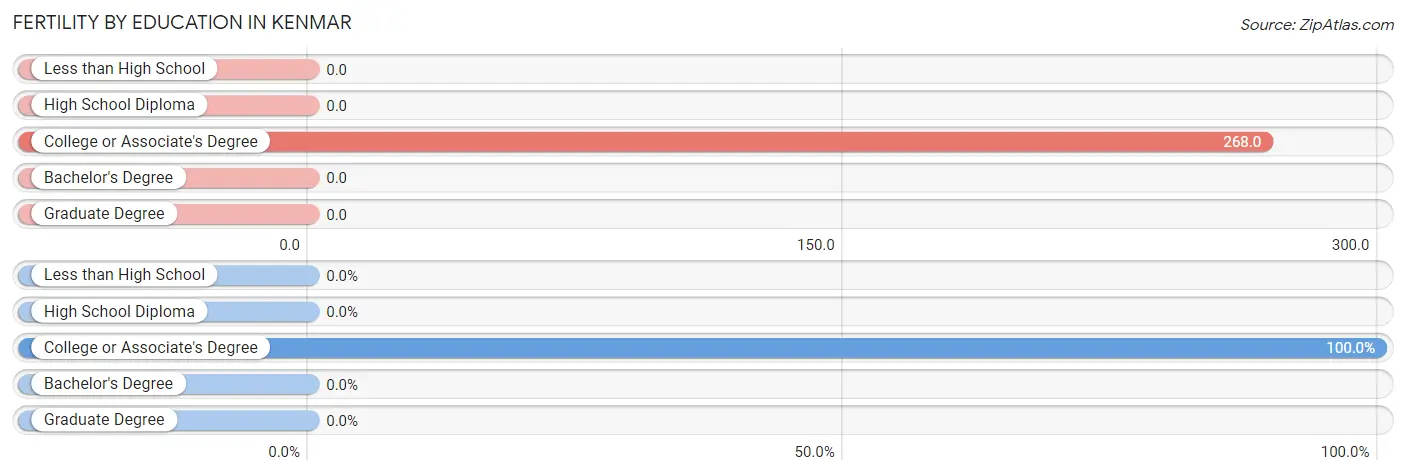
| Educational Attainment | Women with Births | Births / 1,000 Women |
| Less than High School | 0 (0.0%) | 0.0 |
| High School Diploma | 0 (0.0%) | 0.0 |
| College or Associate's Degree | 41 (100.0%) | 268.0 |
| Bachelor's Degree | 0 (0.0%) | 0.0 |
| Graduate Degree | 0 (0.0%) | 0.0 |
| Total | 41 (100.0%) | 64.0 |
Fertility by Education by Marriage Status in Kenmar
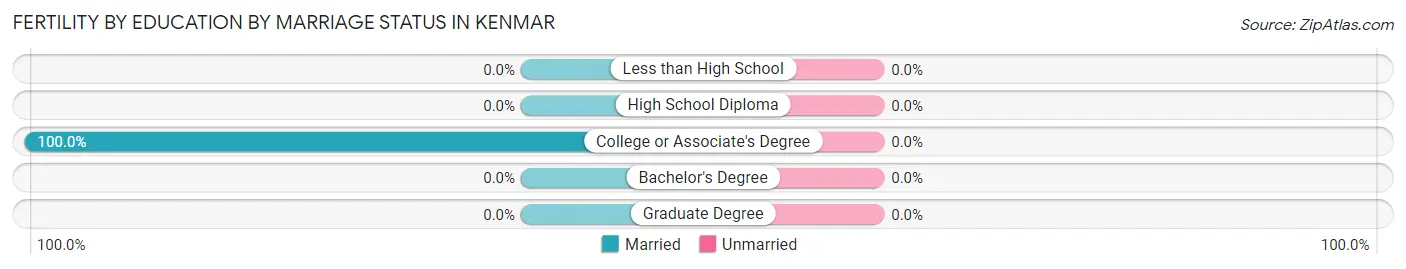
| Educational Attainment | Married | Unmarried |
| Less than High School | 0 (0.0%) | 0 (0.0%) |
| High School Diploma | 0 (0.0%) | 0 (0.0%) |
| College or Associate's Degree | 41 (100.0%) | 0 (0.0%) |
| Bachelor's Degree | 0 (0.0%) | 0 (0.0%) |
| Graduate Degree | 0 (0.0%) | 0 (0.0%) |
| Total | 41 (100.0%) | 0 (0.0%) |
Employment Characteristics in Kenmar
Employment by Class of Employer in Kenmar
Among the 1,698 employed individuals in Kenmar, private company employees (1,229 | 72.4%), state government employees (155 | 9.1%), and not-for-profit organizations (147 | 8.7%) make up the most common classes of employment.
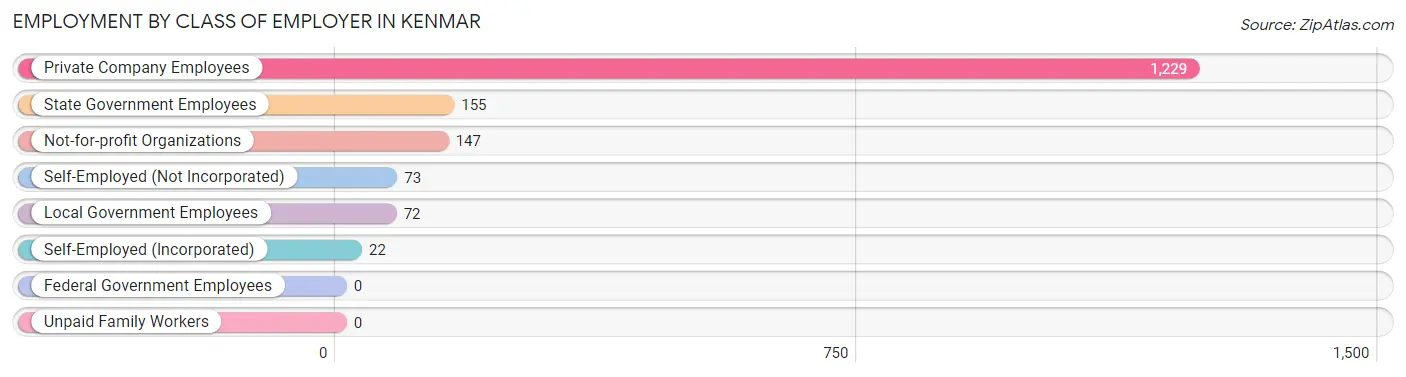
| Employer Class | # Employees | % Employees |
| Private Company Employees | 1,229 | 72.4% |
| Self-Employed (Incorporated) | 22 | 1.3% |
| Self-Employed (Not Incorporated) | 73 | 4.3% |
| Not-for-profit Organizations | 147 | 8.7% |
| Local Government Employees | 72 | 4.2% |
| State Government Employees | 155 | 9.1% |
| Federal Government Employees | 0 | 0.0% |
| Unpaid Family Workers | 0 | 0.0% |
| Total | 1,698 | 100.0% |
Employment Status by Age in Kenmar
According to the labor force statistics for Kenmar, out of the total population over 16 years of age (3,740), 53.8% or 2,012 individuals are in the labor force, with 15.6% or 314 of them unemployed. The age group with the highest labor force participation rate is 30 to 34 years, with 99.1% or 115 individuals in the labor force. Within the labor force, the 60 to 64 years age range has the highest percentage of unemployed individuals, with 68.3% or 241 of them being unemployed.
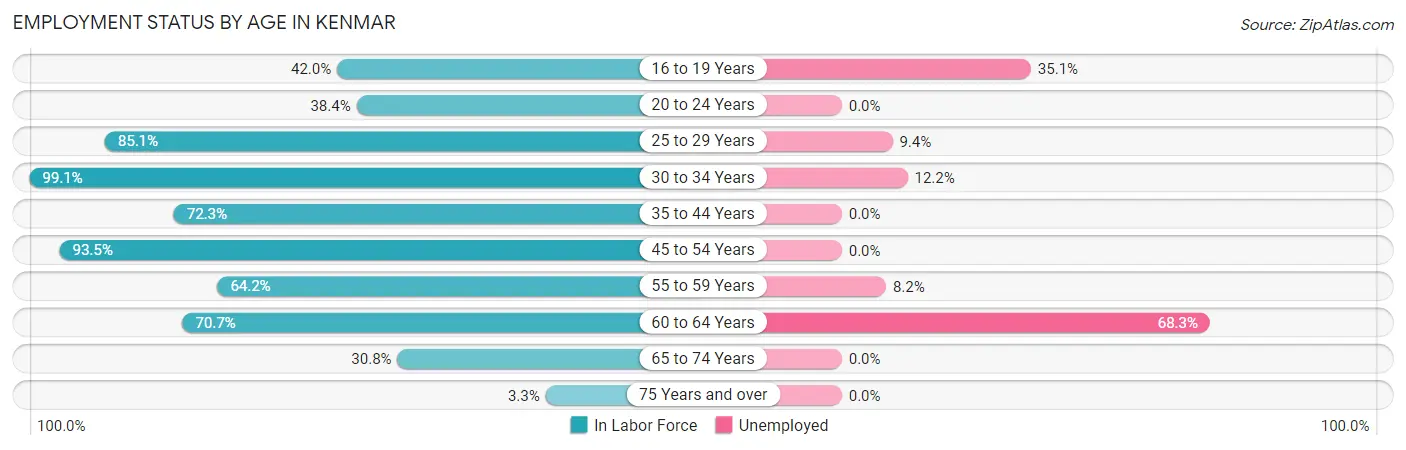
| Age Bracket | In Labor Force | Unemployed |
| 16 to 19 Years | 74 (42.0%) | 26 (35.1%) |
| 20 to 24 Years | 33 (38.4%) | 0 (0.0%) |
| 25 to 29 Years | 171 (85.1%) | 16 (9.4%) |
| 30 to 34 Years | 115 (99.1%) | 14 (12.2%) |
| 35 to 44 Years | 439 (72.3%) | 0 (0.0%) |
| 45 to 54 Years | 343 (93.5%) | 0 (0.0%) |
| 55 to 59 Years | 219 (64.2%) | 18 (8.2%) |
| 60 to 64 Years | 353 (70.7%) | 241 (68.3%) |
| 65 to 74 Years | 248 (30.8%) | 0 (0.0%) |
| 75 Years and over | 18 (3.3%) | 0 (0.0%) |
| Total | 2,012 (53.8%) | 314 (15.6%) |
Employment Status by Educational Attainment in Kenmar
According to labor force statistics for Kenmar, 77.0% of individuals (1,641) out of the total population between 25 and 64 years of age (2,131) are in the labor force, with 17.6% or 289 of them being unemployed. The group with the highest labor force participation rate are those with the educational attainment of bachelor's degree or higher, with 85.1% or 627 individuals in the labor force. Within the labor force, individuals with college / associate degree education have the highest percentage of unemployment, with 31.2% or 149 of them being unemployed.
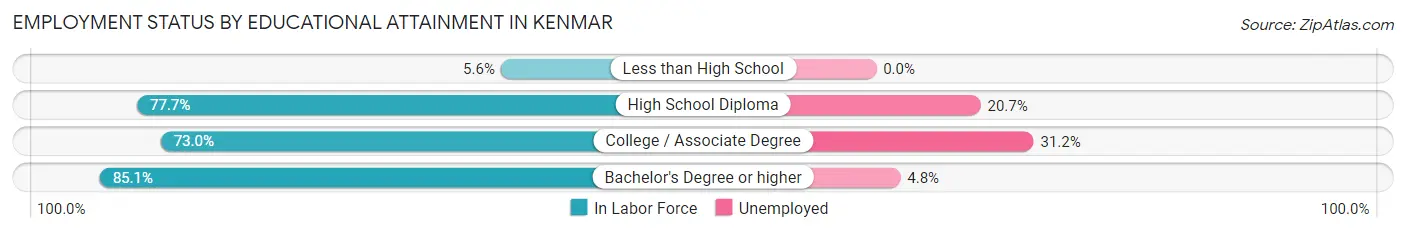
| Educational Attainment | In Labor Force | Unemployed |
| Less than High School | 3 (5.6%) | 0 (0.0%) |
| High School Diploma | 532 (77.7%) | 142 (20.7%) |
| College / Associate Degree | 478 (73.0%) | 204 (31.2%) |
| Bachelor's Degree or higher | 627 (85.1%) | 35 (4.8%) |
| Total | 1,641 (77.0%) | 375 (17.6%) |
Employment Occupations by Sex in Kenmar
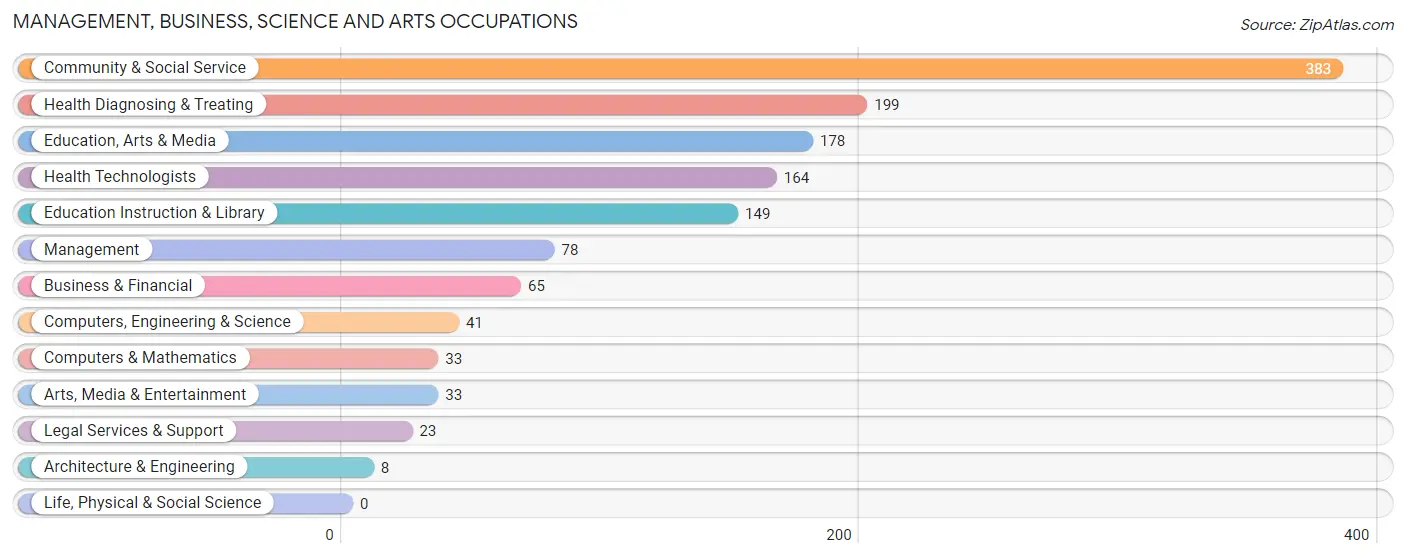
Management, Business, Science and Arts Occupations
The most common Management, Business, Science and Arts occupations in Kenmar are Community & Social Service (383 | 22.6%), Health Diagnosing & Treating (199 | 11.7%), Education, Arts & Media (178 | 10.5%), Health Technologists (164 | 9.7%), and Education Instruction & Library (149 | 8.8%).
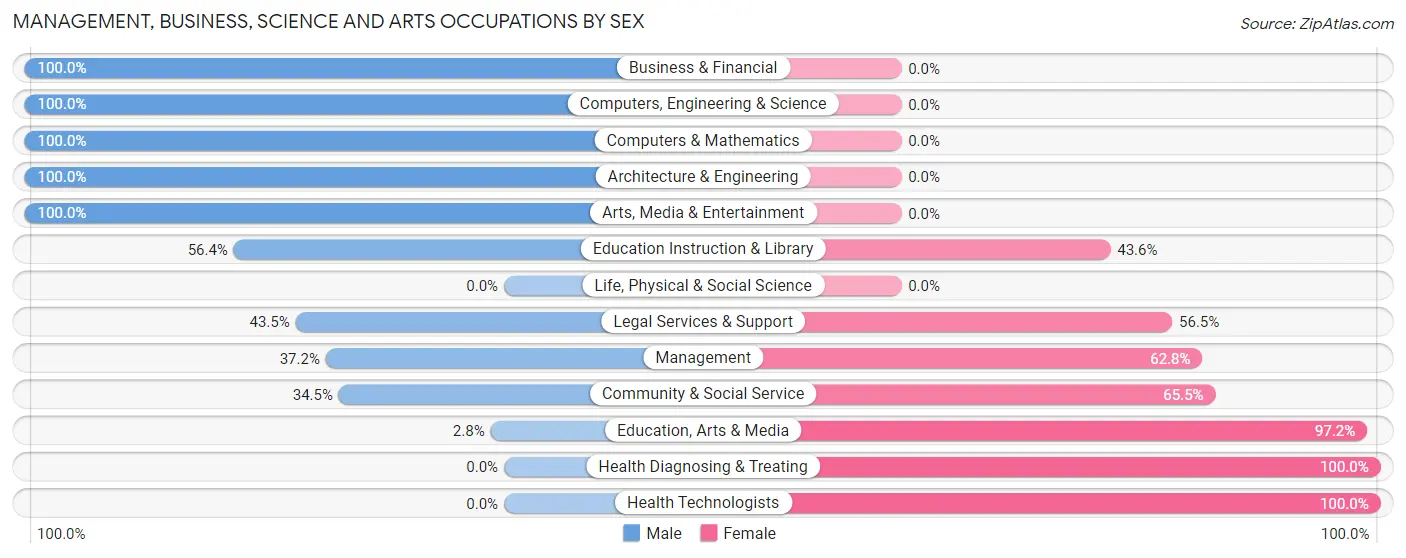
Management, Business, Science and Arts Occupations by Sex
Within the Management, Business, Science and Arts occupations in Kenmar, the most male-oriented occupations are Business & Financial (100.0%), Computers, Engineering & Science (100.0%), and Computers & Mathematics (100.0%), while the most female-oriented occupations are Health Diagnosing & Treating (100.0%), Health Technologists (100.0%), and Education, Arts & Media (97.2%).
| Occupation | Male | Female |
| Management | 29 (37.2%) | 49 (62.8%) |
| Business & Financial | 65 (100.0%) | 0 (0.0%) |
| Computers, Engineering & Science | 41 (100.0%) | 0 (0.0%) |
| Computers & Mathematics | 33 (100.0%) | 0 (0.0%) |
| Architecture & Engineering | 8 (100.0%) | 0 (0.0%) |
| Life, Physical & Social Science | 0 (0.0%) | 0 (0.0%) |
| Community & Social Service | 132 (34.5%) | 251 (65.5%) |
| Education, Arts & Media | 5 (2.8%) | 173 (97.2%) |
| Legal Services & Support | 10 (43.5%) | 13 (56.5%) |
| Education Instruction & Library | 84 (56.4%) | 65 (43.6%) |
| Arts, Media & Entertainment | 33 (100.0%) | 0 (0.0%) |
| Health Diagnosing & Treating | 0 (0.0%) | 199 (100.0%) |
| Health Technologists | 0 (0.0%) | 164 (100.0%) |
| Total (Category) | 267 (34.9%) | 499 (65.1%) |
| Total (Overall) | 842 (49.6%) | 856 (50.4%) |
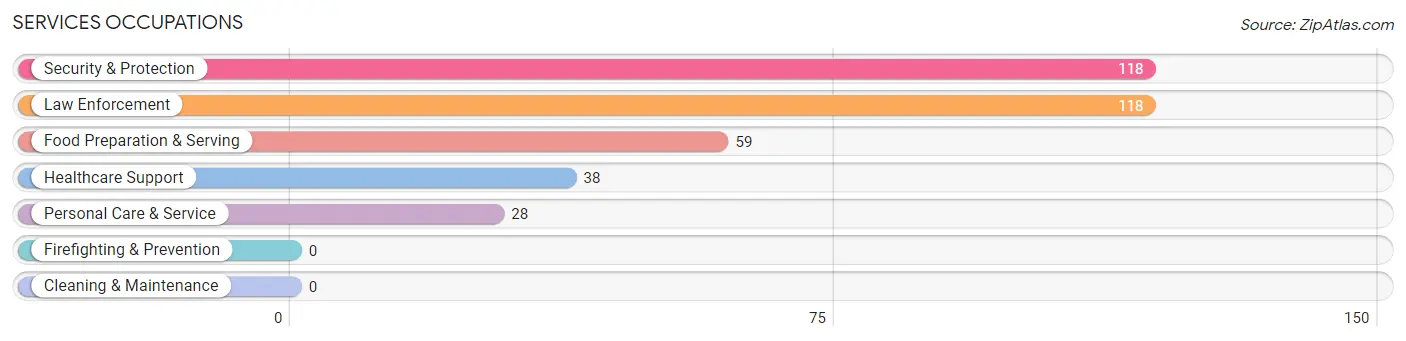
Services Occupations
The most common Services occupations in Kenmar are Security & Protection (118 | 7.0%), Law Enforcement (118 | 7.0%), Food Preparation & Serving (59 | 3.5%), Healthcare Support (38 | 2.2%), and Personal Care & Service (28 | 1.7%).
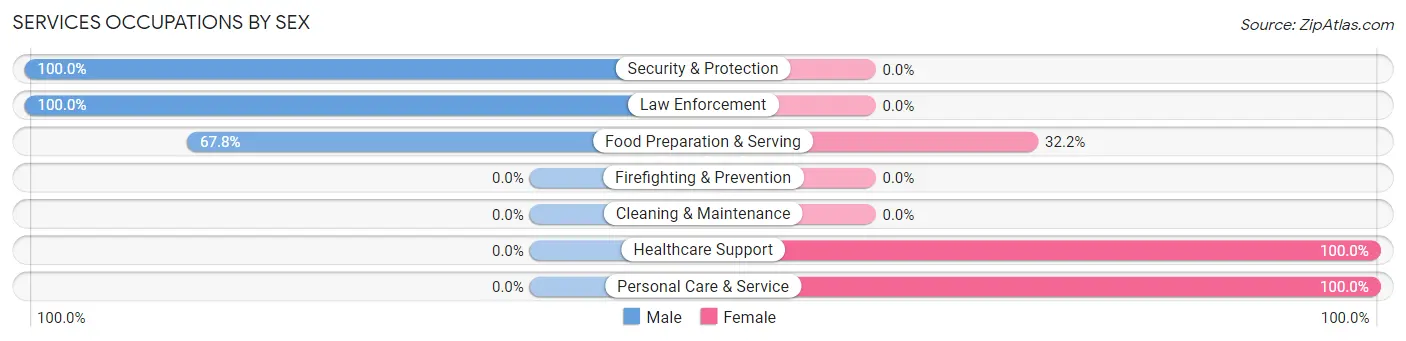
Services Occupations by Sex
Within the Services occupations in Kenmar, the most male-oriented occupations are Security & Protection (100.0%), Law Enforcement (100.0%), and Food Preparation & Serving (67.8%), while the most female-oriented occupations are Healthcare Support (100.0%), Personal Care & Service (100.0%), and Food Preparation & Serving (32.2%).
| Occupation | Male | Female |
| Healthcare Support | 0 (0.0%) | 38 (100.0%) |
| Security & Protection | 118 (100.0%) | 0 (0.0%) |
| Firefighting & Prevention | 0 (0.0%) | 0 (0.0%) |
| Law Enforcement | 118 (100.0%) | 0 (0.0%) |
| Food Preparation & Serving | 40 (67.8%) | 19 (32.2%) |
| Cleaning & Maintenance | 0 (0.0%) | 0 (0.0%) |
| Personal Care & Service | 0 (0.0%) | 28 (100.0%) |
| Total (Category) | 158 (65.0%) | 85 (35.0%) |
| Total (Overall) | 842 (49.6%) | 856 (50.4%) |
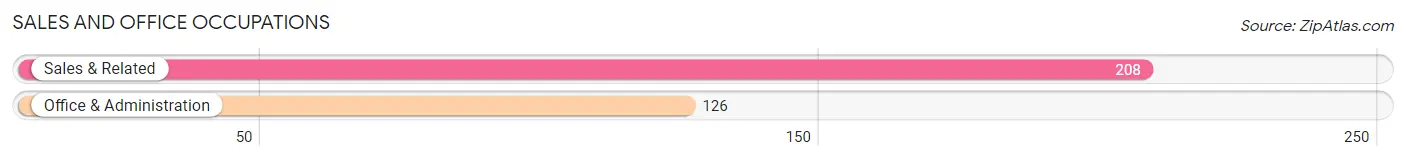
Sales and Office Occupations
The most common Sales and Office occupations in Kenmar are Sales & Related (208 | 12.2%), and Office & Administration (126 | 7.4%).
Sales and Office Occupations by Sex
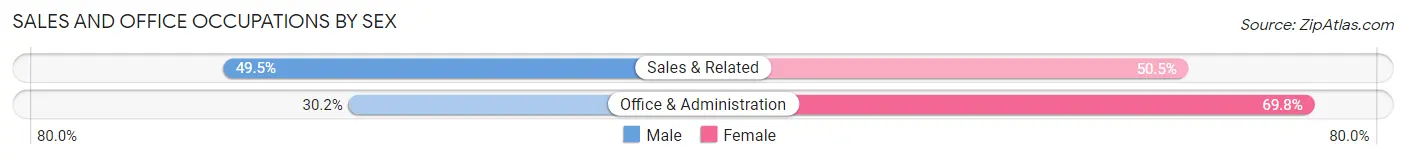
| Occupation | Male | Female |
| Sales & Related | 103 (49.5%) | 105 (50.5%) |
| Office & Administration | 38 (30.2%) | 88 (69.8%) |
| Total (Category) | 141 (42.2%) | 193 (57.8%) |
| Total (Overall) | 842 (49.6%) | 856 (50.4%) |
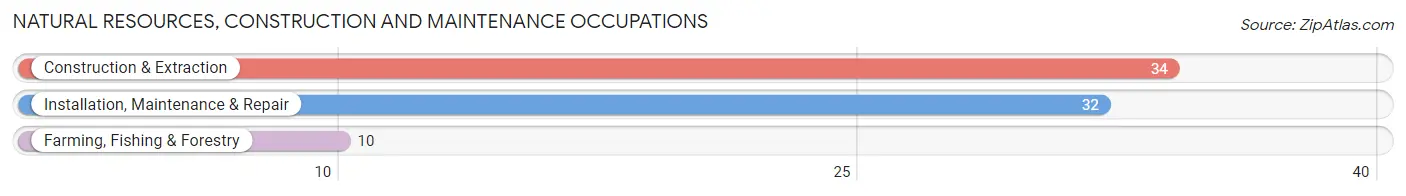
Natural Resources, Construction and Maintenance Occupations
The most common Natural Resources, Construction and Maintenance occupations in Kenmar are Construction & Extraction (34 | 2.0%), Installation, Maintenance & Repair (32 | 1.9%), and Farming, Fishing & Forestry (10 | 0.6%).
Natural Resources, Construction and Maintenance Occupations by Sex
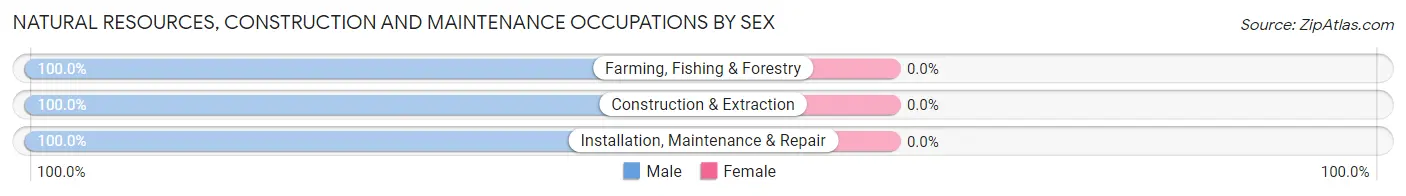
| Occupation | Male | Female |
| Farming, Fishing & Forestry | 10 (100.0%) | 0 (0.0%) |
| Construction & Extraction | 34 (100.0%) | 0 (0.0%) |
| Installation, Maintenance & Repair | 32 (100.0%) | 0 (0.0%) |
| Total (Category) | 76 (100.0%) | 0 (0.0%) |
| Total (Overall) | 842 (49.6%) | 856 (50.4%) |
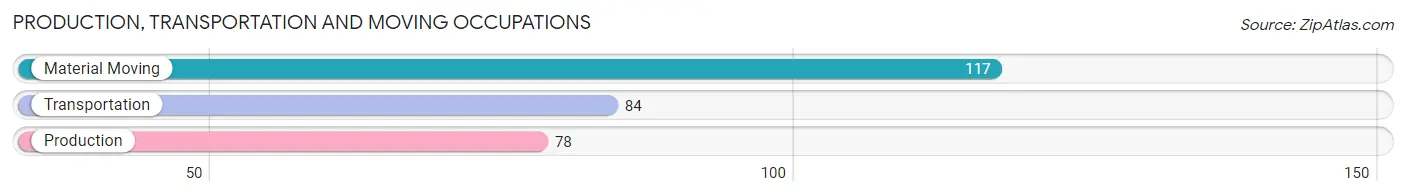
Production, Transportation and Moving Occupations
The most common Production, Transportation and Moving occupations in Kenmar are Material Moving (117 | 6.9%), Transportation (84 | 5.0%), and Production (78 | 4.6%).
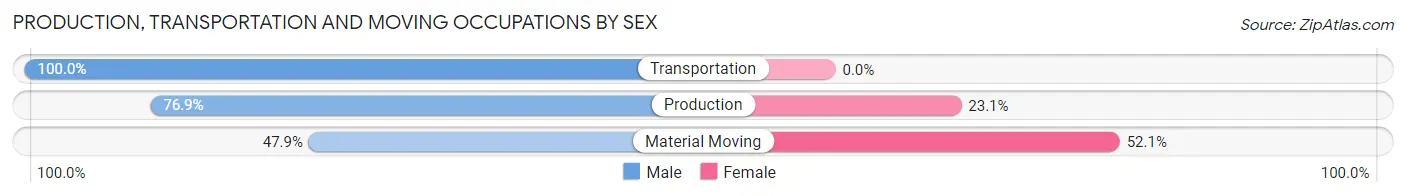
Production, Transportation and Moving Occupations by Sex
| Occupation | Male | Female |
| Production | 60 (76.9%) | 18 (23.1%) |
| Transportation | 84 (100.0%) | 0 (0.0%) |
| Material Moving | 56 (47.9%) | 61 (52.1%) |
| Total (Category) | 200 (71.7%) | 79 (28.3%) |
| Total (Overall) | 842 (49.6%) | 856 (50.4%) |
Employment Industries by Sex in Kenmar
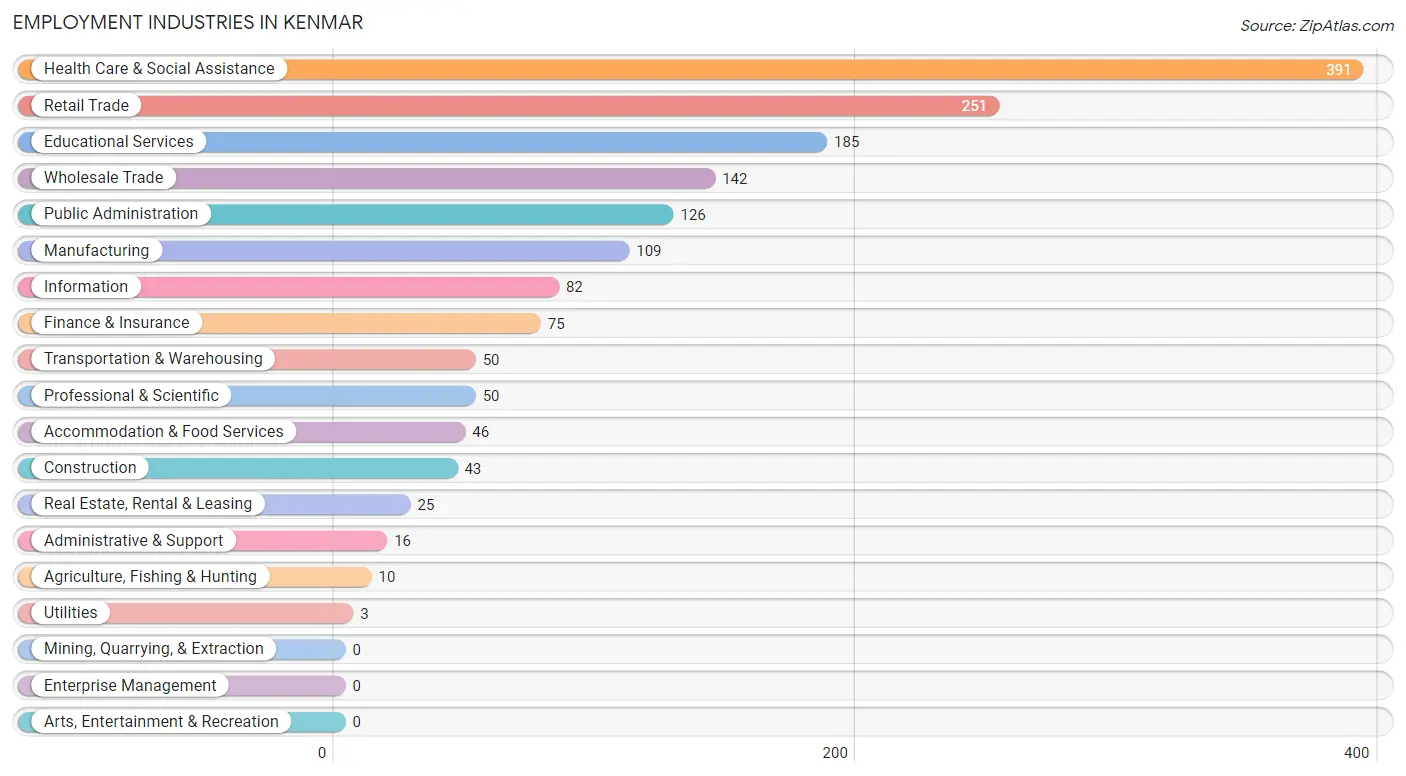
Employment Industries in Kenmar
The major employment industries in Kenmar include Health Care & Social Assistance (391 | 23.0%), Retail Trade (251 | 14.8%), Educational Services (185 | 10.9%), Wholesale Trade (142 | 8.4%), and Public Administration (126 | 7.4%).
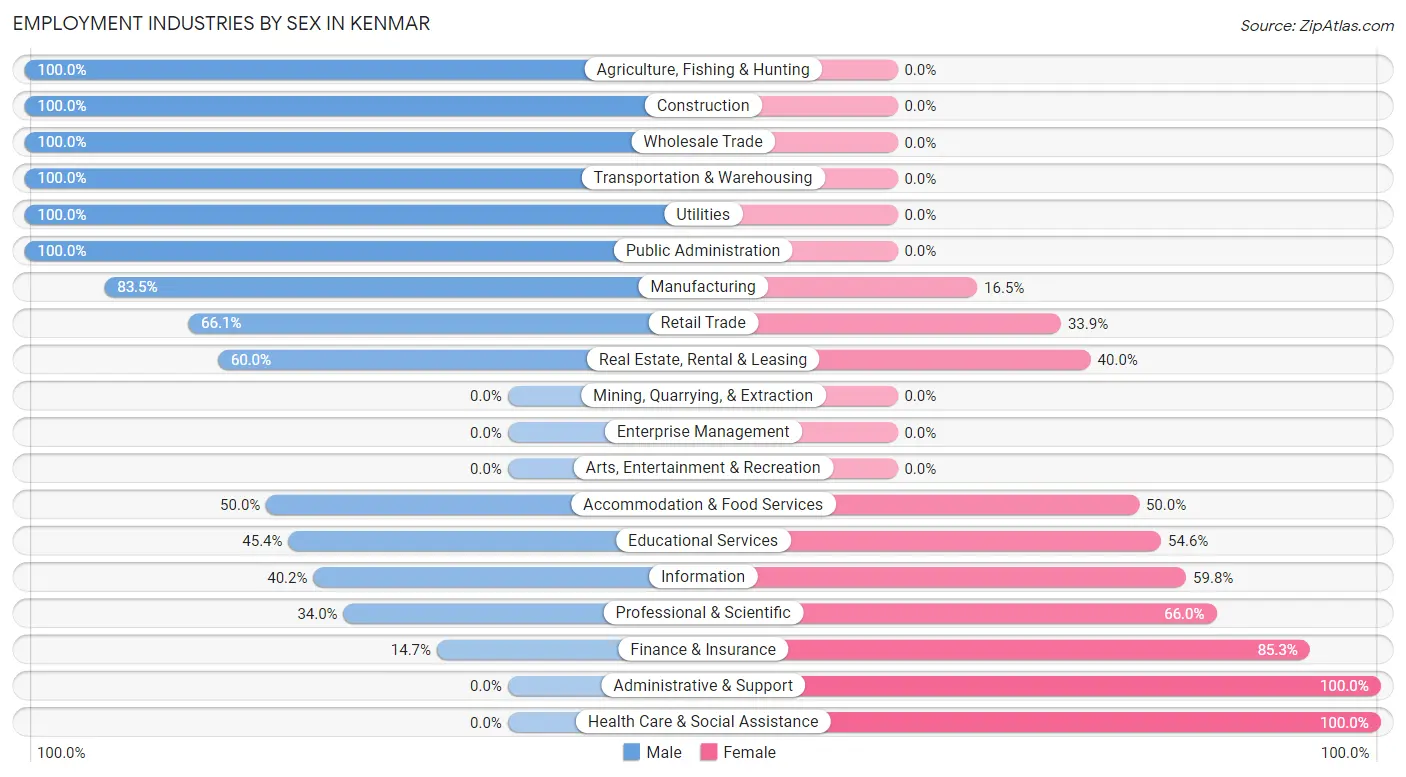
Employment Industries by Sex in Kenmar
The Kenmar industries that see more men than women are Agriculture, Fishing & Hunting (100.0%), Construction (100.0%), and Wholesale Trade (100.0%), whereas the industries that tend to have a higher number of women are Administrative & Support (100.0%), Health Care & Social Assistance (100.0%), and Finance & Insurance (85.3%).
| Industry | Male | Female |
| Agriculture, Fishing & Hunting | 10 (100.0%) | 0 (0.0%) |
| Mining, Quarrying, & Extraction | 0 (0.0%) | 0 (0.0%) |
| Construction | 43 (100.0%) | 0 (0.0%) |
| Manufacturing | 91 (83.5%) | 18 (16.5%) |
| Wholesale Trade | 142 (100.0%) | 0 (0.0%) |
| Retail Trade | 166 (66.1%) | 85 (33.9%) |
| Transportation & Warehousing | 50 (100.0%) | 0 (0.0%) |
| Utilities | 3 (100.0%) | 0 (0.0%) |
| Information | 33 (40.2%) | 49 (59.8%) |
| Finance & Insurance | 11 (14.7%) | 64 (85.3%) |
| Real Estate, Rental & Leasing | 15 (60.0%) | 10 (40.0%) |
| Professional & Scientific | 17 (34.0%) | 33 (66.0%) |
| Enterprise Management | 0 (0.0%) | 0 (0.0%) |
| Administrative & Support | 0 (0.0%) | 16 (100.0%) |
| Educational Services | 84 (45.4%) | 101 (54.6%) |
| Health Care & Social Assistance | 0 (0.0%) | 391 (100.0%) |
| Arts, Entertainment & Recreation | 0 (0.0%) | 0 (0.0%) |
| Accommodation & Food Services | 23 (50.0%) | 23 (50.0%) |
| Public Administration | 126 (100.0%) | 0 (0.0%) |
| Total | 842 (49.6%) | 856 (50.4%) |
Education in Kenmar
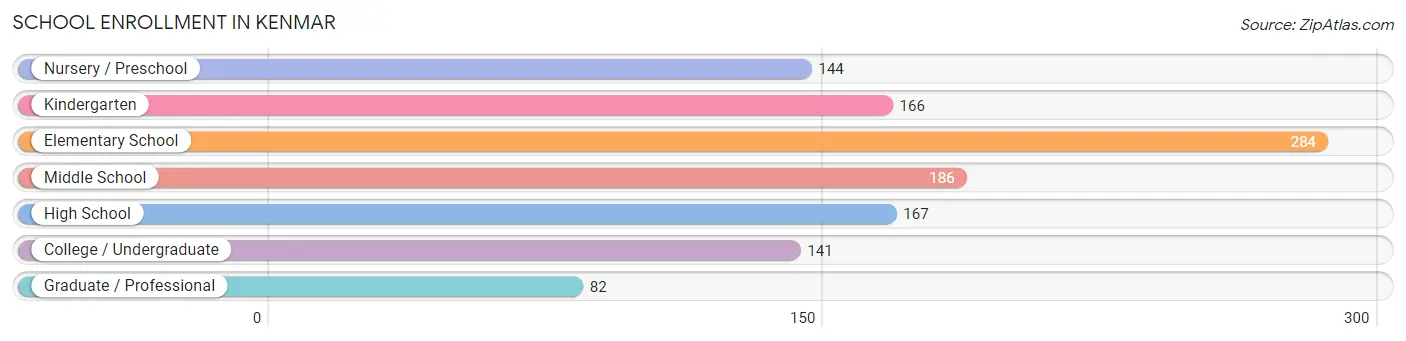
School Enrollment in Kenmar
The most common levels of schooling among the 1,170 students in Kenmar are elementary school (284 | 24.3%), middle school (186 | 15.9%), and high school (167 | 14.3%).
| School Level | # Students | % Students |
| Nursery / Preschool | 144 | 12.3% |
| Kindergarten | 166 | 14.2% |
| Elementary School | 284 | 24.3% |
| Middle School | 186 | 15.9% |
| High School | 167 | 14.3% |
| College / Undergraduate | 141 | 12.0% |
| Graduate / Professional | 82 | 7.0% |
| Total | 1,170 | 100.0% |
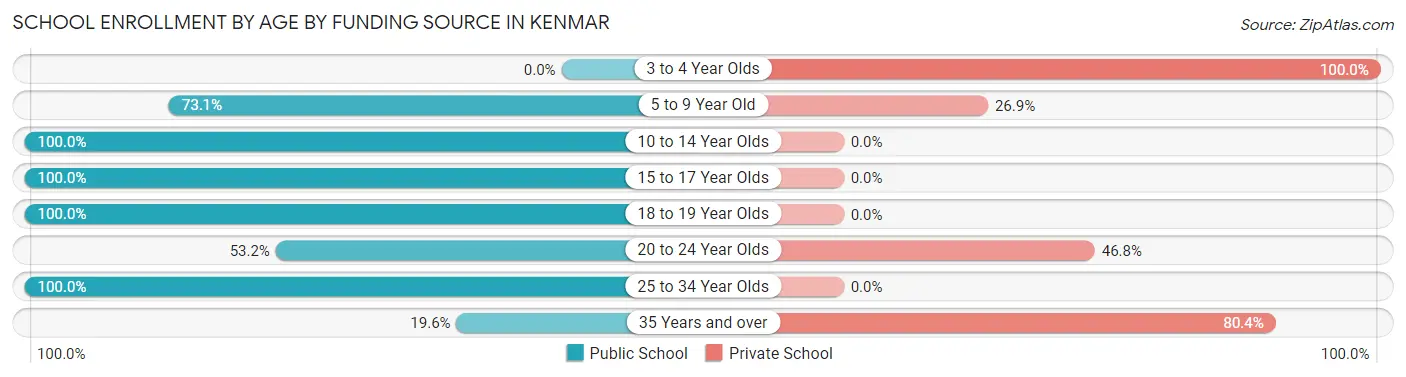
School Enrollment by Age by Funding Source in Kenmar
Out of a total of 1,170 students who are enrolled in schools in Kenmar, 333 (28.5%) attend a private institution, while the remaining 837 (71.5%) are enrolled in public schools. The age group of 3 to 4 year olds has the highest likelihood of being enrolled in private schools, with 113 (100.0% in the age bracket) enrolled. Conversely, the age group of 10 to 14 year olds has the lowest likelihood of being enrolled in a private school, with 256 (100.0% in the age bracket) attending a public institution.
| Age Bracket | Public School | Private School |
| 3 to 4 Year Olds | 0 (0.0%) | 113 (100.0%) |
| 5 to 9 Year Old | 321 (73.1%) | 118 (26.9%) |
| 10 to 14 Year Olds | 256 (100.0%) | 0 (0.0%) |
| 15 to 17 Year Olds | 123 (100.0%) | 0 (0.0%) |
| 18 to 19 Year Olds | 16 (100.0%) | 0 (0.0%) |
| 20 to 24 Year Olds | 33 (53.2%) | 29 (46.8%) |
| 25 to 34 Year Olds | 69 (100.0%) | 0 (0.0%) |
| 35 Years and over | 18 (19.6%) | 74 (80.4%) |
| Total | 837 (71.5%) | 333 (28.5%) |
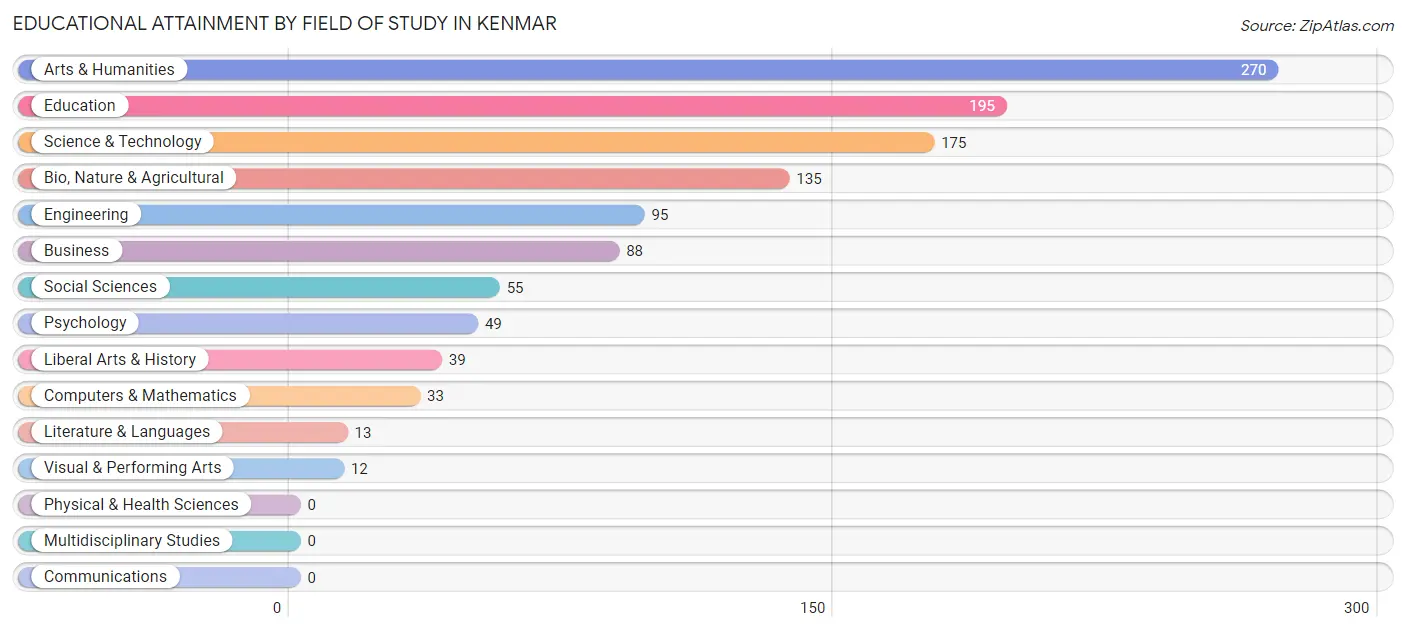
Educational Attainment by Field of Study in Kenmar
Arts & humanities (270 | 23.3%), education (195 | 16.8%), science & technology (175 | 15.1%), bio, nature & agricultural (135 | 11.7%), and engineering (95 | 8.2%) are the most common fields of study among 1,159 individuals in Kenmar who have obtained a bachelor's degree or higher.
| Field of Study | # Graduates | % Graduates |
| Computers & Mathematics | 33 | 2.9% |
| Bio, Nature & Agricultural | 135 | 11.7% |
| Physical & Health Sciences | 0 | 0.0% |
| Psychology | 49 | 4.2% |
| Social Sciences | 55 | 4.8% |
| Engineering | 95 | 8.2% |
| Multidisciplinary Studies | 0 | 0.0% |
| Science & Technology | 175 | 15.1% |
| Business | 88 | 7.6% |
| Education | 195 | 16.8% |
| Literature & Languages | 13 | 1.1% |
| Liberal Arts & History | 39 | 3.4% |
| Visual & Performing Arts | 12 | 1.0% |
| Communications | 0 | 0.0% |
| Arts & Humanities | 270 | 23.3% |
| Total | 1,159 | 100.0% |
Transportation & Commute in Kenmar
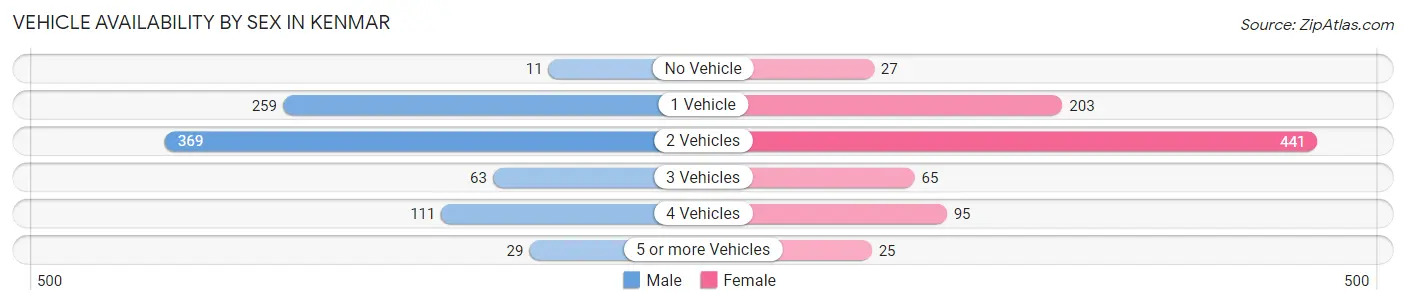
Vehicle Availability by Sex in Kenmar
The most prevalent vehicle ownership categories in Kenmar are males with 2 vehicles (369, accounting for 43.8%) and females with 2 vehicles (441, making up 43.1%).
| Vehicles Available | Male | Female |
| No Vehicle | 11 (1.3%) | 27 (3.2%) |
| 1 Vehicle | 259 (30.8%) | 203 (23.7%) |
| 2 Vehicles | 369 (43.8%) | 441 (51.5%) |
| 3 Vehicles | 63 (7.5%) | 65 (7.6%) |
| 4 Vehicles | 111 (13.2%) | 95 (11.1%) |
| 5 or more Vehicles | 29 (3.4%) | 25 (2.9%) |
| Total | 842 (100.0%) | 856 (100.0%) |
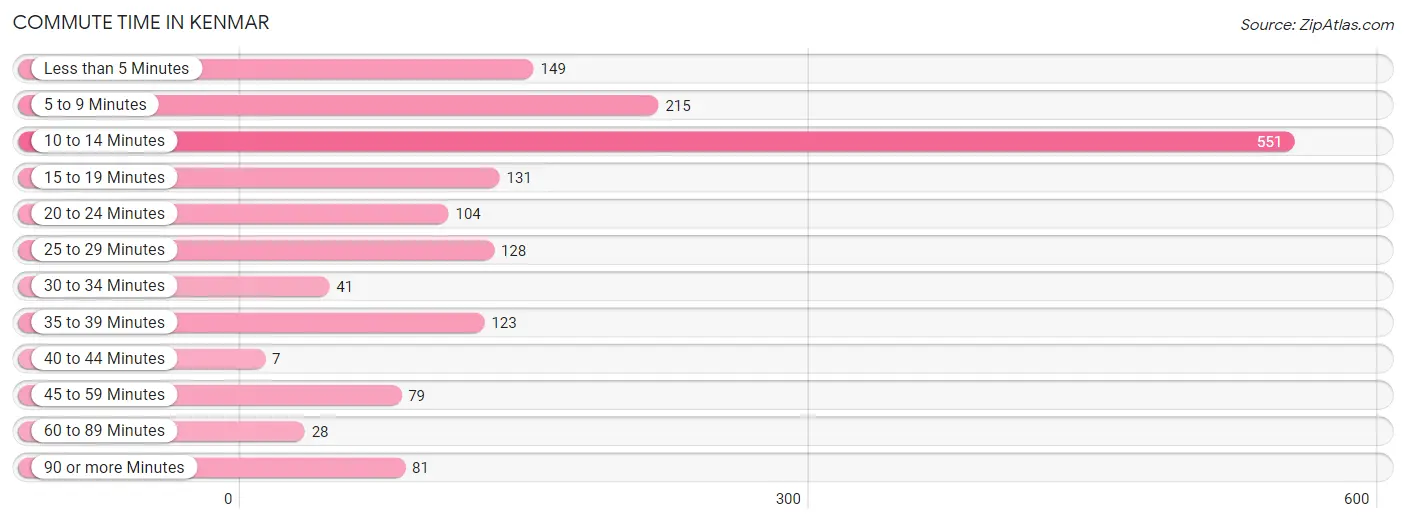
Commute Time in Kenmar
The most frequently occuring commute durations in Kenmar are 10 to 14 minutes (551 commuters, 33.7%), 5 to 9 minutes (215 commuters, 13.1%), and less than 5 minutes (149 commuters, 9.1%).
| Commute Time | # Commuters | % Commuters |
| Less than 5 Minutes | 149 | 9.1% |
| 5 to 9 Minutes | 215 | 13.1% |
| 10 to 14 Minutes | 551 | 33.7% |
| 15 to 19 Minutes | 131 | 8.0% |
| 20 to 24 Minutes | 104 | 6.4% |
| 25 to 29 Minutes | 128 | 7.8% |
| 30 to 34 Minutes | 41 | 2.5% |
| 35 to 39 Minutes | 123 | 7.5% |
| 40 to 44 Minutes | 7 | 0.4% |
| 45 to 59 Minutes | 79 | 4.8% |
| 60 to 89 Minutes | 28 | 1.7% |
| 90 or more Minutes | 81 | 5.0% |
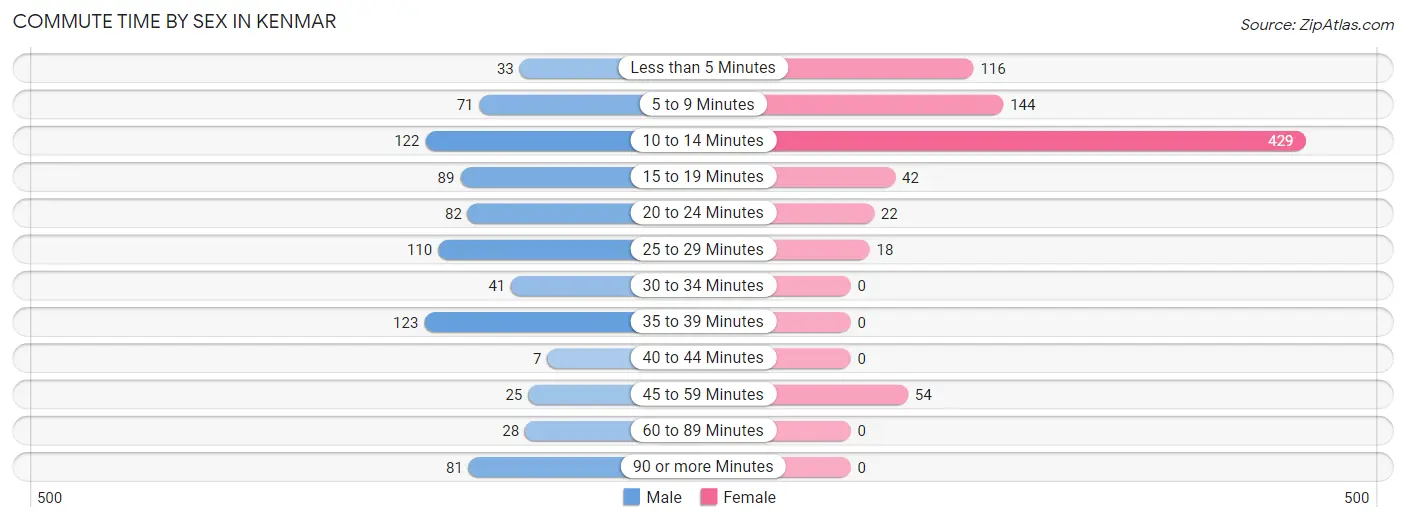
Commute Time by Sex in Kenmar
The most common commute times in Kenmar are 35 to 39 minutes (123 commuters, 15.1%) for males and 10 to 14 minutes (429 commuters, 52.0%) for females.
| Commute Time | Male | Female |
| Less than 5 Minutes | 33 (4.1%) | 116 (14.1%) |
| 5 to 9 Minutes | 71 (8.7%) | 144 (17.4%) |
| 10 to 14 Minutes | 122 (15.0%) | 429 (52.0%) |
| 15 to 19 Minutes | 89 (11.0%) | 42 (5.1%) |
| 20 to 24 Minutes | 82 (10.1%) | 22 (2.7%) |
| 25 to 29 Minutes | 110 (13.6%) | 18 (2.2%) |
| 30 to 34 Minutes | 41 (5.1%) | 0 (0.0%) |
| 35 to 39 Minutes | 123 (15.1%) | 0 (0.0%) |
| 40 to 44 Minutes | 7 (0.9%) | 0 (0.0%) |
| 45 to 59 Minutes | 25 (3.1%) | 54 (6.6%) |
| 60 to 89 Minutes | 28 (3.5%) | 0 (0.0%) |
| 90 or more Minutes | 81 (10.0%) | 0 (0.0%) |
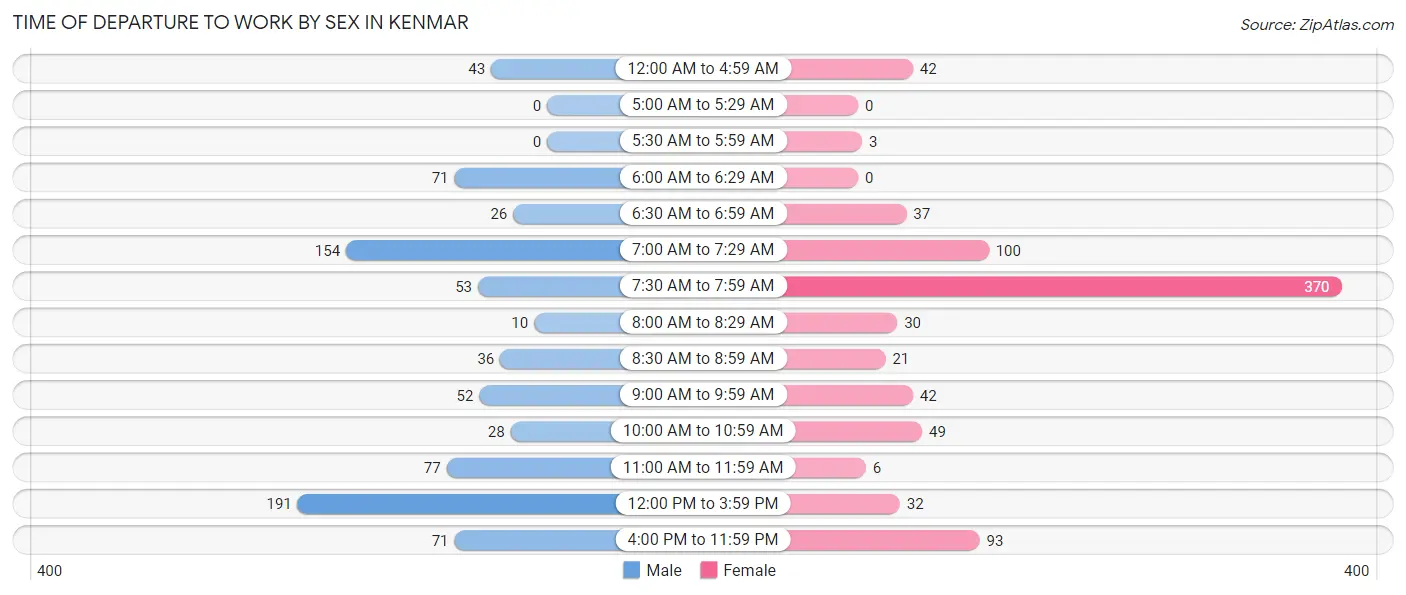
Time of Departure to Work by Sex in Kenmar
The most frequent times of departure to work in Kenmar are 12:00 PM to 3:59 PM (191, 23.5%) for males and 7:30 AM to 7:59 AM (370, 44.9%) for females.
| Time of Departure | Male | Female |
| 12:00 AM to 4:59 AM | 43 (5.3%) | 42 (5.1%) |
| 5:00 AM to 5:29 AM | 0 (0.0%) | 0 (0.0%) |
| 5:30 AM to 5:59 AM | 0 (0.0%) | 3 (0.4%) |
| 6:00 AM to 6:29 AM | 71 (8.7%) | 0 (0.0%) |
| 6:30 AM to 6:59 AM | 26 (3.2%) | 37 (4.5%) |
| 7:00 AM to 7:29 AM | 154 (19.0%) | 100 (12.1%) |
| 7:30 AM to 7:59 AM | 53 (6.5%) | 370 (44.9%) |
| 8:00 AM to 8:29 AM | 10 (1.2%) | 30 (3.6%) |
| 8:30 AM to 8:59 AM | 36 (4.4%) | 21 (2.5%) |
| 9:00 AM to 9:59 AM | 52 (6.4%) | 42 (5.1%) |
| 10:00 AM to 10:59 AM | 28 (3.5%) | 49 (5.9%) |
| 11:00 AM to 11:59 AM | 77 (9.5%) | 6 (0.7%) |
| 12:00 PM to 3:59 PM | 191 (23.5%) | 32 (3.9%) |
| 4:00 PM to 11:59 PM | 71 (8.7%) | 93 (11.3%) |
| Total | 812 (100.0%) | 825 (100.0%) |
Housing Occupancy in Kenmar
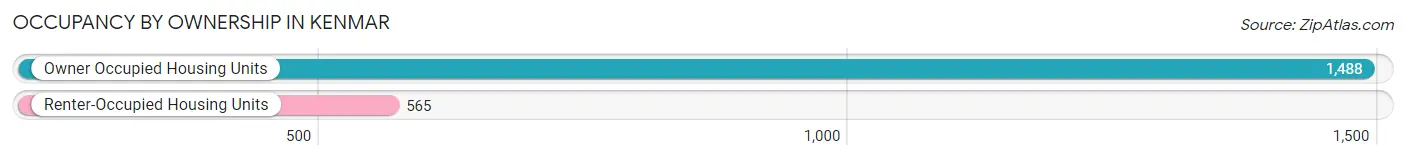
Occupancy by Ownership in Kenmar
Of the total 2,053 dwellings in Kenmar, owner-occupied units account for 1,488 (72.5%), while renter-occupied units make up 565 (27.5%).
| Occupancy | # Housing Units | % Housing Units |
| Owner Occupied Housing Units | 1,488 | 72.5% |
| Renter-Occupied Housing Units | 565 | 27.5% |
| Total Occupied Housing Units | 2,053 | 100.0% |
Occupancy by Household Size in Kenmar
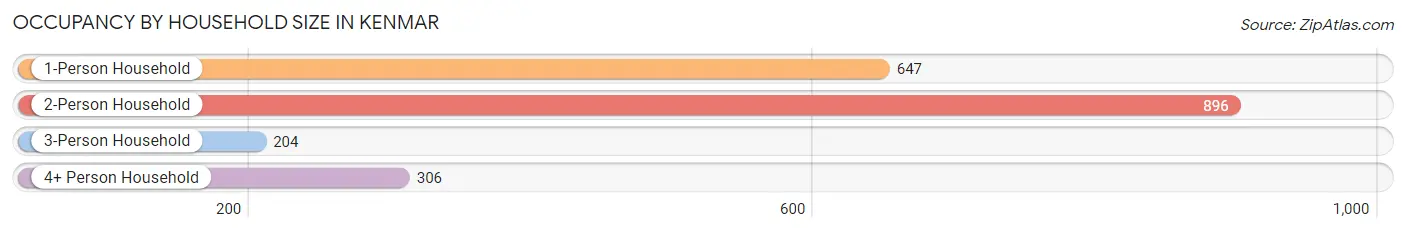
| Household Size | # Housing Units | % Housing Units |
| 1-Person Household | 647 | 31.5% |
| 2-Person Household | 896 | 43.6% |
| 3-Person Household | 204 | 9.9% |
| 4+ Person Household | 306 | 14.9% |
| Total Housing Units | 2,053 | 100.0% |
Occupancy by Ownership by Household Size in Kenmar
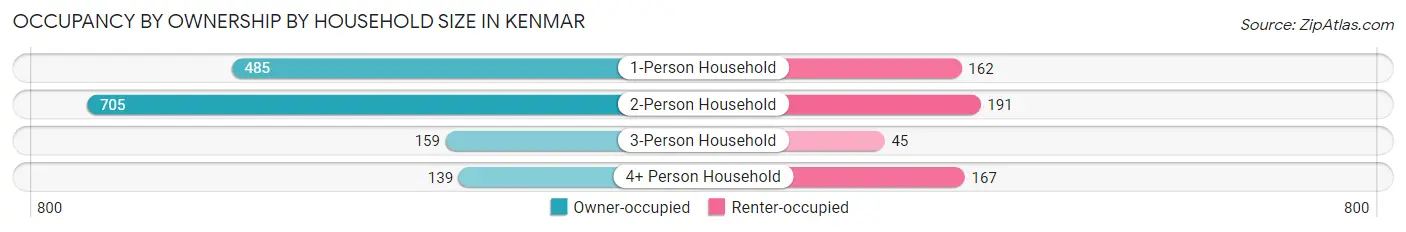
| Household Size | Owner-occupied | Renter-occupied |
| 1-Person Household | 485 (75.0%) | 162 (25.0%) |
| 2-Person Household | 705 (78.7%) | 191 (21.3%) |
| 3-Person Household | 159 (77.9%) | 45 (22.1%) |
| 4+ Person Household | 139 (45.4%) | 167 (54.6%) |
| Total Housing Units | 1,488 (72.5%) | 565 (27.5%) |
Occupancy by Educational Attainment in Kenmar
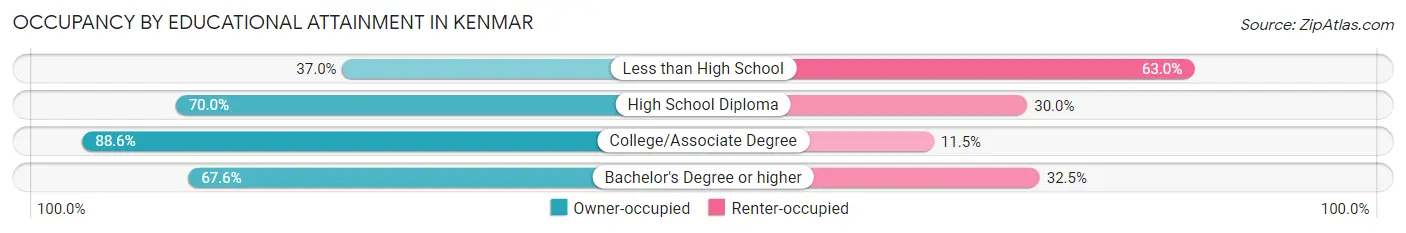
| Household Size | Owner-occupied | Renter-occupied |
| Less than High School | 27 (37.0%) | 46 (63.0%) |
| High School Diploma | 535 (70.0%) | 229 (30.0%) |
| College/Associate Degree | 441 (88.5%) | 57 (11.5%) |
| Bachelor's Degree or higher | 485 (67.5%) | 233 (32.5%) |
Occupancy by Age of Householder in Kenmar
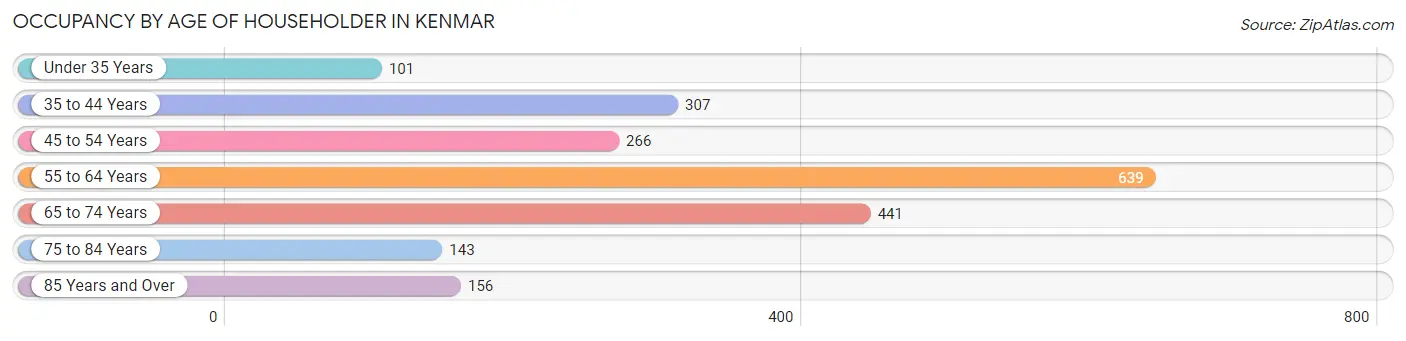
| Age Bracket | # Households | % Households |
| Under 35 Years | 101 | 4.9% |
| 35 to 44 Years | 307 | 14.9% |
| 45 to 54 Years | 266 | 13.0% |
| 55 to 64 Years | 639 | 31.1% |
| 65 to 74 Years | 441 | 21.5% |
| 75 to 84 Years | 143 | 7.0% |
| 85 Years and Over | 156 | 7.6% |
| Total | 2,053 | 100.0% |
Housing Finances in Kenmar
Median Income by Occupancy in Kenmar
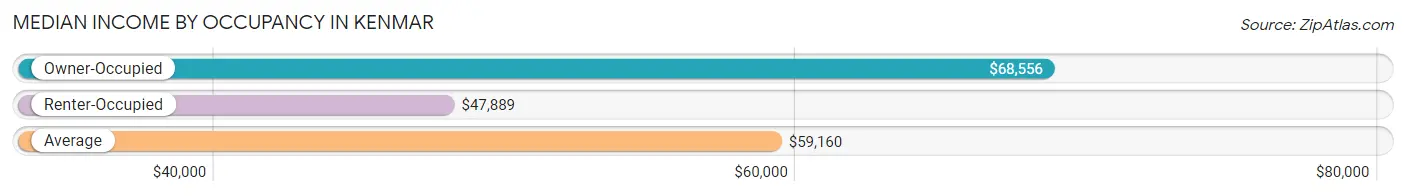
| Occupancy Type | # Households | Median Income |
| Owner-Occupied | 1,488 (72.5%) | $68,556 |
| Renter-Occupied | 565 (27.5%) | $47,889 |
| Average | 2,053 (100.0%) | $59,160 |
Occupancy by Householder Income Bracket in Kenmar
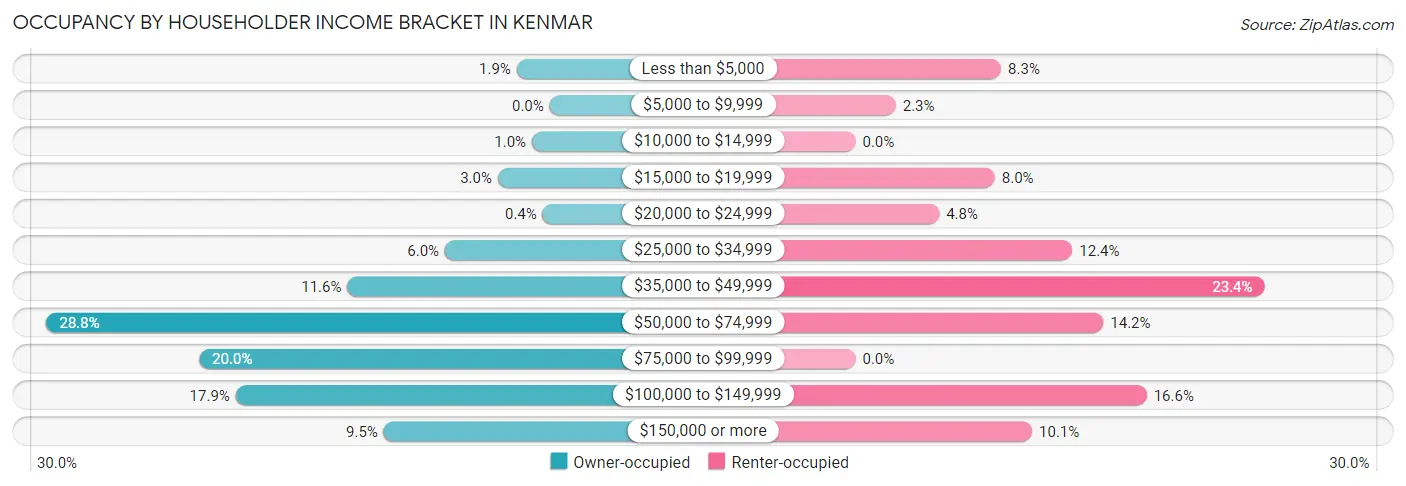
| Income Bracket | Owner-occupied | Renter-occupied |
| Less than $5,000 | 28 (1.9%) | 47 (8.3%) |
| $5,000 to $9,999 | 0 (0.0%) | 13 (2.3%) |
| $10,000 to $14,999 | 15 (1.0%) | 0 (0.0%) |
| $15,000 to $19,999 | 44 (3.0%) | 45 (8.0%) |
| $20,000 to $24,999 | 6 (0.4%) | 27 (4.8%) |
| $25,000 to $34,999 | 89 (6.0%) | 70 (12.4%) |
| $35,000 to $49,999 | 172 (11.6%) | 132 (23.4%) |
| $50,000 to $74,999 | 428 (28.8%) | 80 (14.2%) |
| $75,000 to $99,999 | 298 (20.0%) | 0 (0.0%) |
| $100,000 to $149,999 | 267 (17.9%) | 94 (16.6%) |
| $150,000 or more | 141 (9.5%) | 57 (10.1%) |
| Total | 1,488 (100.0%) | 565 (100.0%) |
Monthly Housing Cost Tiers in Kenmar
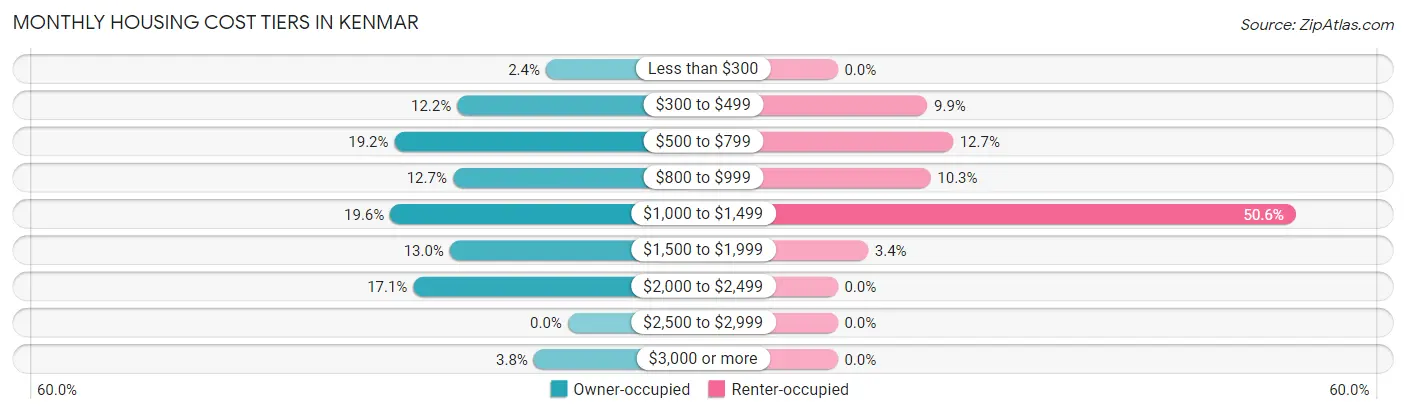
| Monthly Cost | Owner-occupied | Renter-occupied |
| Less than $300 | 36 (2.4%) | 0 (0.0%) |
| $300 to $499 | 182 (12.2%) | 56 (9.9%) |
| $500 to $799 | 285 (19.2%) | 72 (12.7%) |
| $800 to $999 | 189 (12.7%) | 58 (10.3%) |
| $1,000 to $1,499 | 292 (19.6%) | 286 (50.6%) |
| $1,500 to $1,999 | 194 (13.0%) | 19 (3.4%) |
| $2,000 to $2,499 | 254 (17.1%) | 0 (0.0%) |
| $2,500 to $2,999 | 0 (0.0%) | 0 (0.0%) |
| $3,000 or more | 56 (3.8%) | 0 (0.0%) |
| Total | 1,488 (100.0%) | 565 (100.0%) |
Physical Housing Characteristics in Kenmar
Housing Structures in Kenmar
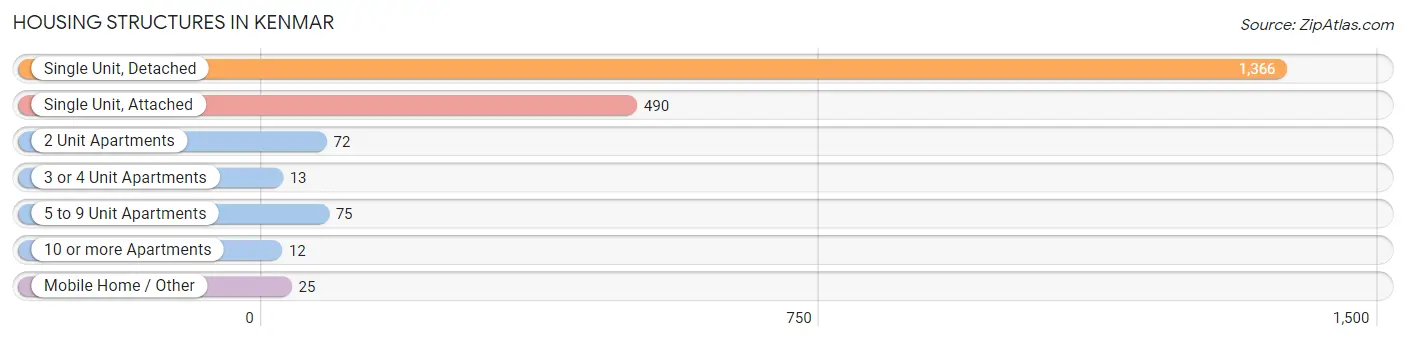
| Structure Type | # Housing Units | % Housing Units |
| Single Unit, Detached | 1,366 | 66.5% |
| Single Unit, Attached | 490 | 23.9% |
| 2 Unit Apartments | 72 | 3.5% |
| 3 or 4 Unit Apartments | 13 | 0.6% |
| 5 to 9 Unit Apartments | 75 | 3.6% |
| 10 or more Apartments | 12 | 0.6% |
| Mobile Home / Other | 25 | 1.2% |
| Total | 2,053 | 100.0% |
Housing Structures by Occupancy in Kenmar
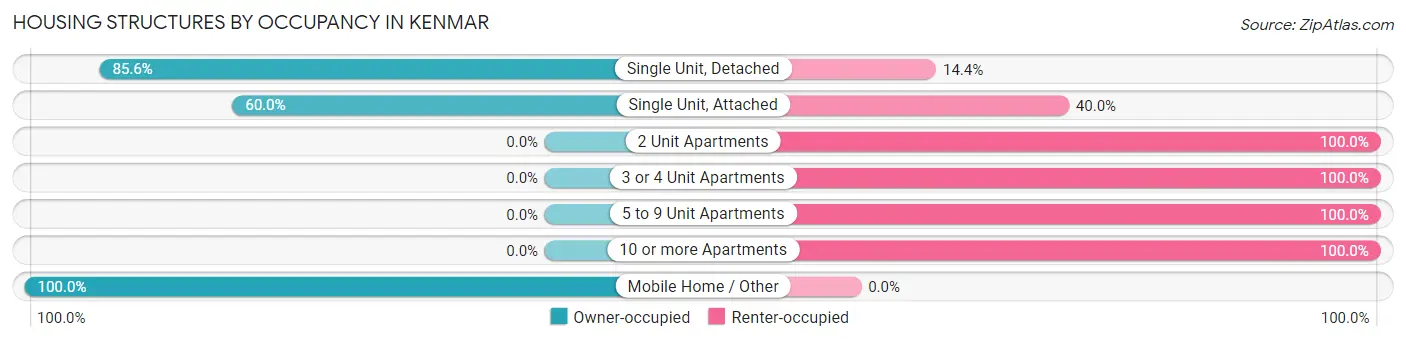
| Structure Type | Owner-occupied | Renter-occupied |
| Single Unit, Detached | 1,169 (85.6%) | 197 (14.4%) |
| Single Unit, Attached | 294 (60.0%) | 196 (40.0%) |
| 2 Unit Apartments | 0 (0.0%) | 72 (100.0%) |
| 3 or 4 Unit Apartments | 0 (0.0%) | 13 (100.0%) |
| 5 to 9 Unit Apartments | 0 (0.0%) | 75 (100.0%) |
| 10 or more Apartments | 0 (0.0%) | 12 (100.0%) |
| Mobile Home / Other | 25 (100.0%) | 0 (0.0%) |
| Total | 1,488 (72.5%) | 565 (27.5%) |
Housing Structures by Number of Rooms in Kenmar
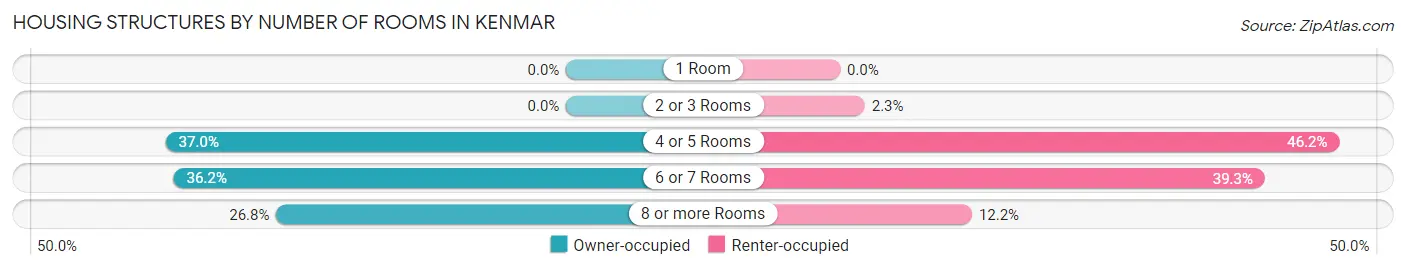
| Number of Rooms | Owner-occupied | Renter-occupied |
| 1 Room | 0 (0.0%) | 0 (0.0%) |
| 2 or 3 Rooms | 0 (0.0%) | 13 (2.3%) |
| 4 or 5 Rooms | 550 (37.0%) | 261 (46.2%) |
| 6 or 7 Rooms | 539 (36.2%) | 222 (39.3%) |
| 8 or more Rooms | 399 (26.8%) | 69 (12.2%) |
| Total | 1,488 (100.0%) | 565 (100.0%) |
Housing Structure by Heating Type in Kenmar
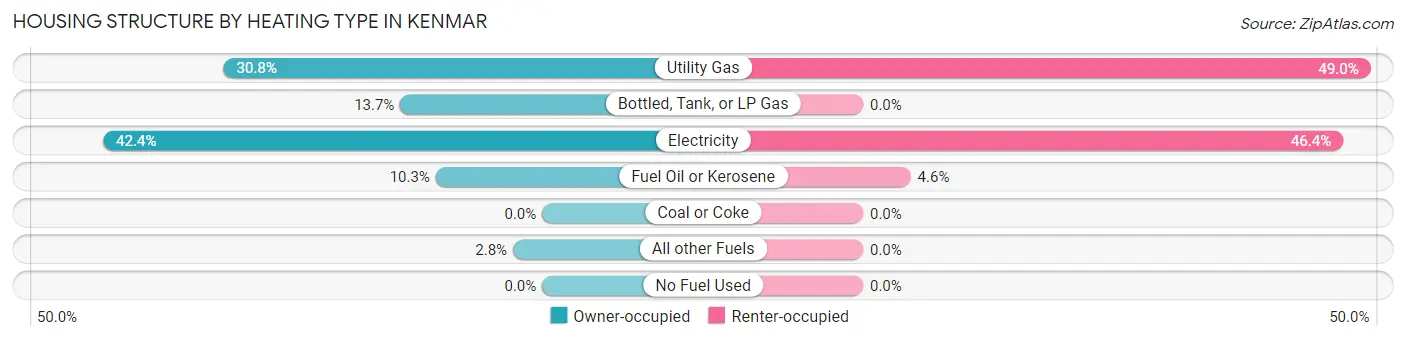
| Heating Type | Owner-occupied | Renter-occupied |
| Utility Gas | 458 (30.8%) | 277 (49.0%) |
| Bottled, Tank, or LP Gas | 204 (13.7%) | 0 (0.0%) |
| Electricity | 631 (42.4%) | 262 (46.4%) |
| Fuel Oil or Kerosene | 153 (10.3%) | 26 (4.6%) |
| Coal or Coke | 0 (0.0%) | 0 (0.0%) |
| All other Fuels | 42 (2.8%) | 0 (0.0%) |
| No Fuel Used | 0 (0.0%) | 0 (0.0%) |
| Total | 1,488 (100.0%) | 565 (100.0%) |
Household Vehicle Usage in Kenmar
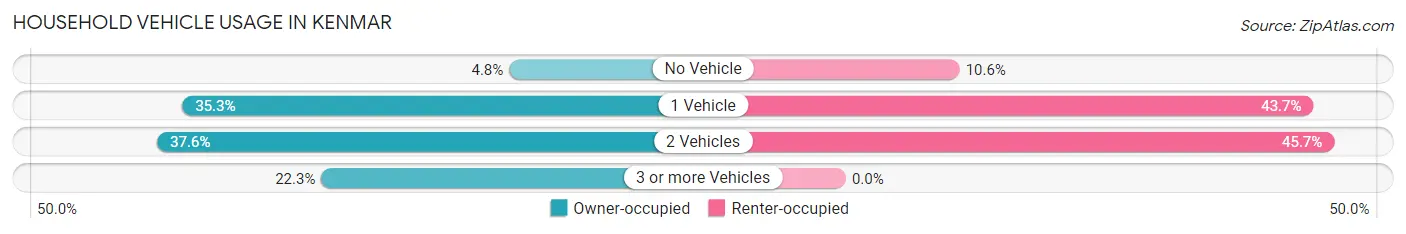
| Vehicles per Household | Owner-occupied | Renter-occupied |
| No Vehicle | 71 (4.8%) | 60 (10.6%) |
| 1 Vehicle | 525 (35.3%) | 247 (43.7%) |
| 2 Vehicles | 560 (37.6%) | 258 (45.7%) |
| 3 or more Vehicles | 332 (22.3%) | 0 (0.0%) |
| Total | 1,488 (100.0%) | 565 (100.0%) |
Real Estate & Mortgages in Kenmar
Real Estate and Mortgage Overview in Kenmar
| Characteristic | Without Mortgage | With Mortgage |
| Housing Units | 494 | 994 |
| Median Property Value | $219,000 | $189,800 |
| Median Household Income | $57,024 | $108 |
| Monthly Housing Costs | $551 | $56 |
| Real Estate Taxes | $2,736 | $0 |
Property Value by Mortgage Status in Kenmar
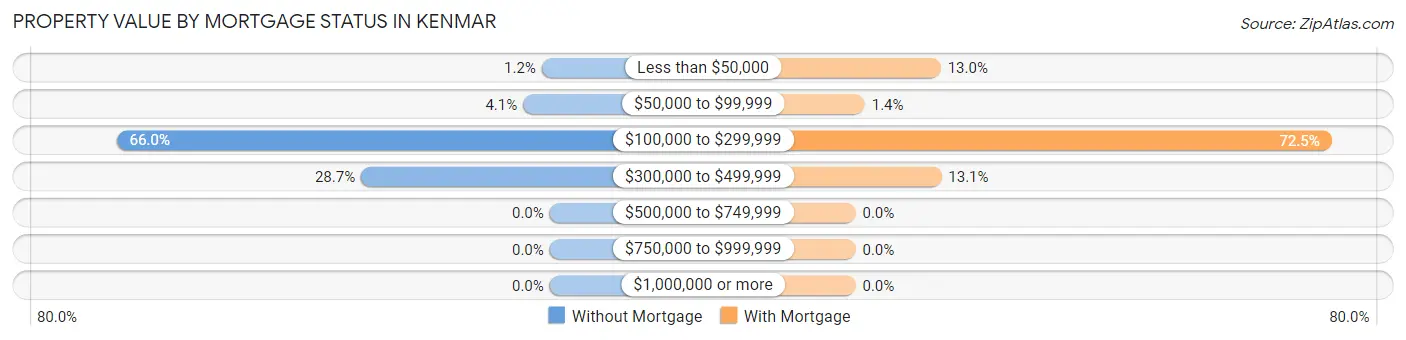
| Property Value | Without Mortgage | With Mortgage |
| Less than $50,000 | 6 (1.2%) | 129 (13.0%) |
| $50,000 to $99,999 | 20 (4.1%) | 14 (1.4%) |
| $100,000 to $299,999 | 326 (66.0%) | 721 (72.5%) |
| $300,000 to $499,999 | 142 (28.7%) | 130 (13.1%) |
| $500,000 to $749,999 | 0 (0.0%) | 0 (0.0%) |
| $750,000 to $999,999 | 0 (0.0%) | 0 (0.0%) |
| $1,000,000 or more | 0 (0.0%) | 0 (0.0%) |
| Total | 494 (100.0%) | 994 (100.0%) |
Household Income by Mortgage Status in Kenmar
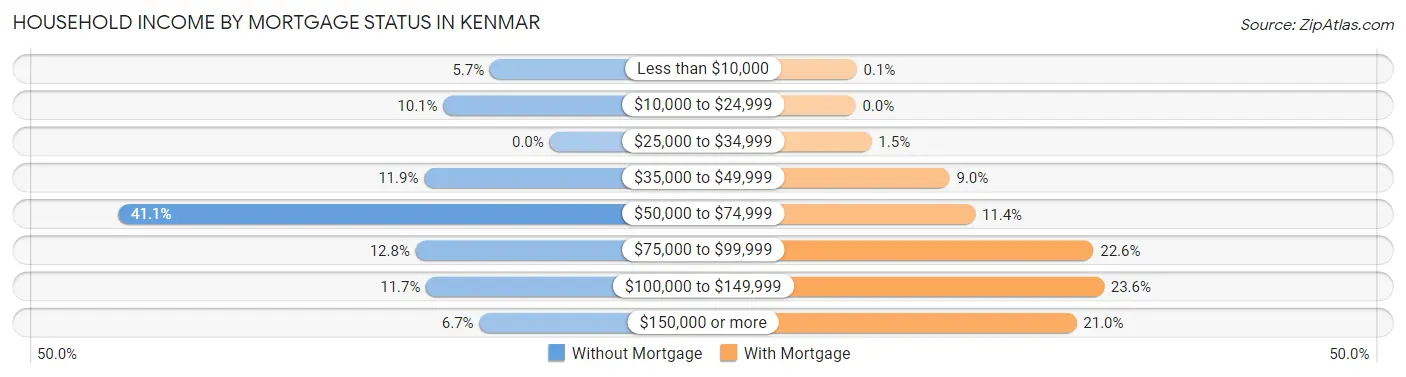
| Household Income | Without Mortgage | With Mortgage |
| Less than $10,000 | 28 (5.7%) | 1 (0.1%) |
| $10,000 to $24,999 | 50 (10.1%) | 0 (0.0%) |
| $25,000 to $34,999 | 0 (0.0%) | 15 (1.5%) |
| $35,000 to $49,999 | 59 (11.9%) | 89 (8.9%) |
| $50,000 to $74,999 | 203 (41.1%) | 113 (11.4%) |
| $75,000 to $99,999 | 63 (12.8%) | 225 (22.6%) |
| $100,000 to $149,999 | 58 (11.7%) | 235 (23.6%) |
| $150,000 or more | 33 (6.7%) | 209 (21.0%) |
| Total | 494 (100.0%) | 994 (100.0%) |
Property Value to Household Income Ratio in Kenmar
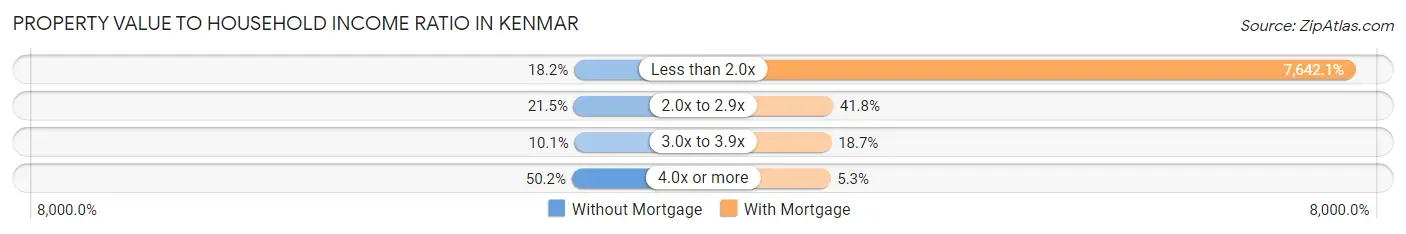
| Value-to-Income Ratio | Without Mortgage | With Mortgage |
| Less than 2.0x | 90 (18.2%) | 75,962 (7,642.1%) |
| 2.0x to 2.9x | 106 (21.5%) | 415 (41.7%) |
| 3.0x to 3.9x | 50 (10.1%) | 186 (18.7%) |
| 4.0x or more | 248 (50.2%) | 53 (5.3%) |
| Total | 494 (100.0%) | 994 (100.0%) |
Real Estate Taxes by Mortgage Status in Kenmar
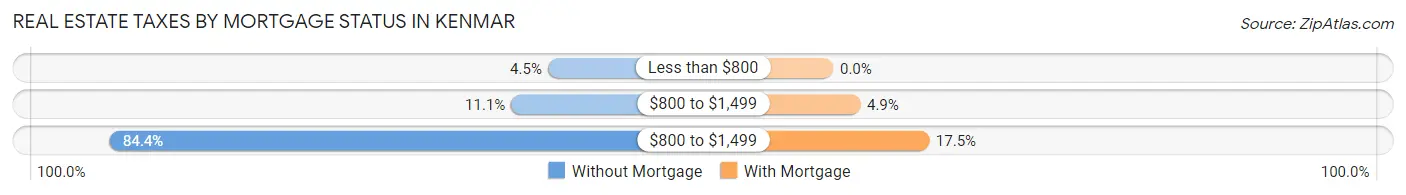
| Property Taxes | Without Mortgage | With Mortgage |
| Less than $800 | 22 (4.4%) | 0 (0.0%) |
| $800 to $1,499 | 55 (11.1%) | 49 (4.9%) |
| $800 to $1,499 | 417 (84.4%) | 174 (17.5%) |
| Total | 494 (100.0%) | 994 (100.0%) |
Health & Disability in Kenmar
Health Insurance Coverage by Age in Kenmar
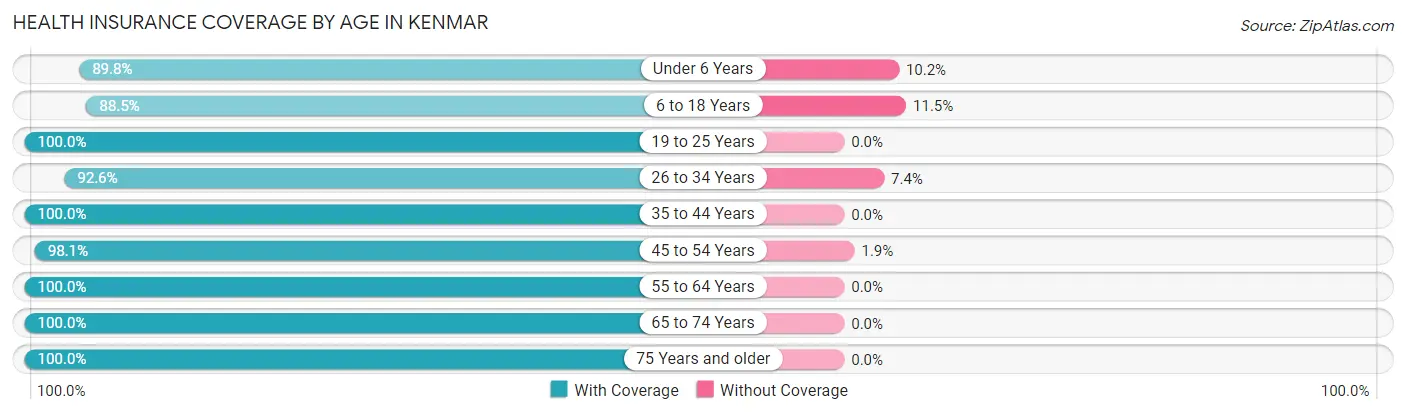
| Age Bracket | With Coverage | Without Coverage |
| Under 6 Years | 370 (89.8%) | 42 (10.2%) |
| 6 to 18 Years | 637 (88.5%) | 83 (11.5%) |
| 19 to 25 Years | 183 (100.0%) | 0 (0.0%) |
| 26 to 34 Years | 212 (92.6%) | 17 (7.4%) |
| 35 to 44 Years | 607 (100.0%) | 0 (0.0%) |
| 45 to 54 Years | 360 (98.1%) | 7 (1.9%) |
| 55 to 64 Years | 830 (100.0%) | 0 (0.0%) |
| 65 to 74 Years | 790 (100.0%) | 0 (0.0%) |
| 75 Years and older | 419 (100.0%) | 0 (0.0%) |
| Total | 4,408 (96.7%) | 149 (3.3%) |
Health Insurance Coverage by Citizenship Status in Kenmar
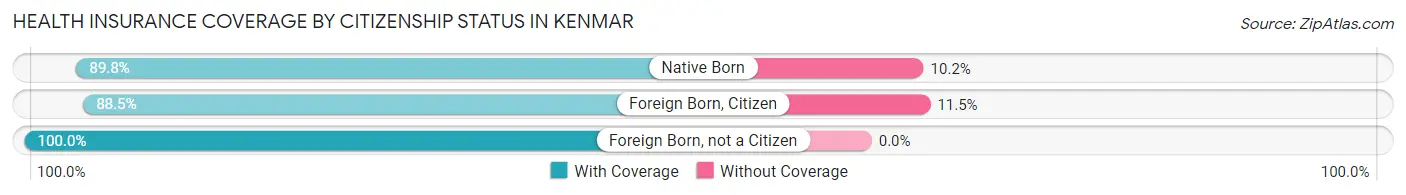
| Citizenship Status | With Coverage | Without Coverage |
| Native Born | 370 (89.8%) | 42 (10.2%) |
| Foreign Born, Citizen | 637 (88.5%) | 83 (11.5%) |
| Foreign Born, not a Citizen | 183 (100.0%) | 0 (0.0%) |
Health Insurance Coverage by Household Income in Kenmar
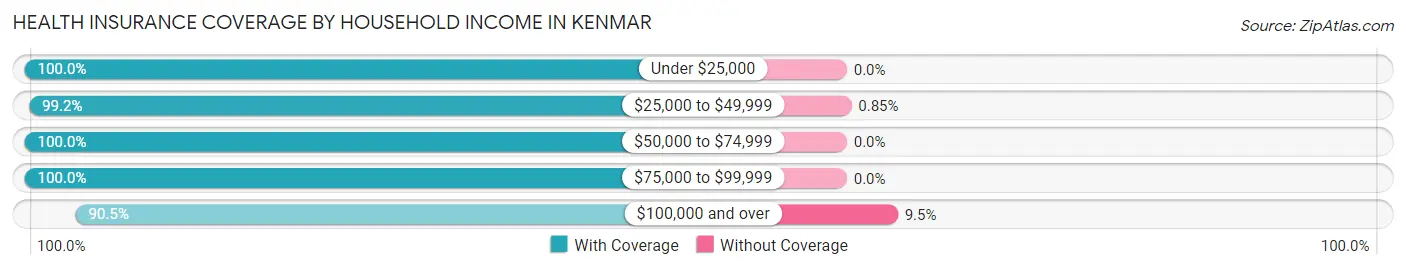
| Household Income | With Coverage | Without Coverage |
| Under $25,000 | 388 (100.0%) | 0 (0.0%) |
| $25,000 to $49,999 | 820 (99.2%) | 7 (0.9%) |
| $50,000 to $74,999 | 1,206 (100.0%) | 0 (0.0%) |
| $75,000 to $99,999 | 640 (100.0%) | 0 (0.0%) |
| $100,000 and over | 1,347 (90.5%) | 142 (9.5%) |
Public vs Private Health Insurance Coverage by Age in Kenmar
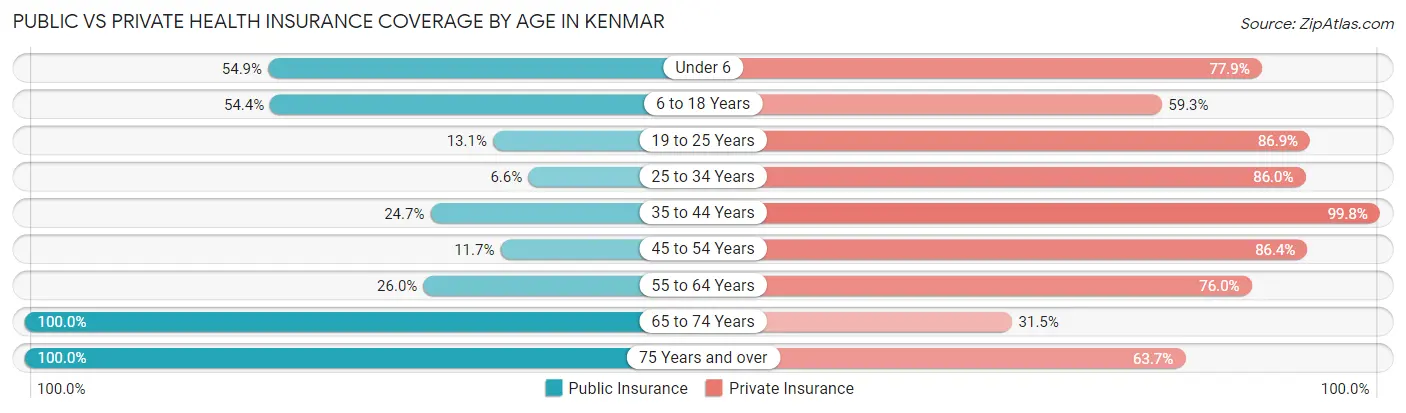
| Age Bracket | Public Insurance | Private Insurance |
| Under 6 | 226 (54.8%) | 321 (77.9%) |
| 6 to 18 Years | 392 (54.4%) | 427 (59.3%) |
| 19 to 25 Years | 24 (13.1%) | 159 (86.9%) |
| 25 to 34 Years | 15 (6.6%) | 197 (86.0%) |
| 35 to 44 Years | 150 (24.7%) | 606 (99.8%) |
| 45 to 54 Years | 43 (11.7%) | 317 (86.4%) |
| 55 to 64 Years | 216 (26.0%) | 631 (76.0%) |
| 65 to 74 Years | 790 (100.0%) | 249 (31.5%) |
| 75 Years and over | 419 (100.0%) | 267 (63.7%) |
| Total | 2,275 (49.9%) | 3,174 (69.7%) |
Disability Status by Sex by Age in Kenmar
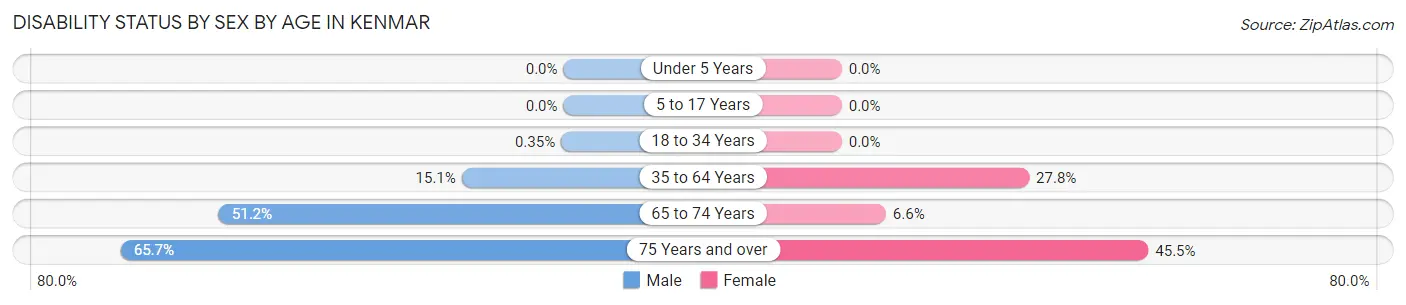
| Age Bracket | Male | Female |
| Under 5 Years | 0 (0.0%) | 0 (0.0%) |
| 5 to 17 Years | 0 (0.0%) | 0 (0.0%) |
| 18 to 34 Years | 1 (0.4%) | 0 (0.0%) |
| 35 to 64 Years | 121 (15.1%) | 279 (27.8%) |
| 65 to 74 Years | 201 (51.1%) | 26 (6.6%) |
| 75 Years and over | 92 (65.7%) | 127 (45.5%) |
Disability Class by Sex by Age in Kenmar
Disability Class: Hearing Difficulty
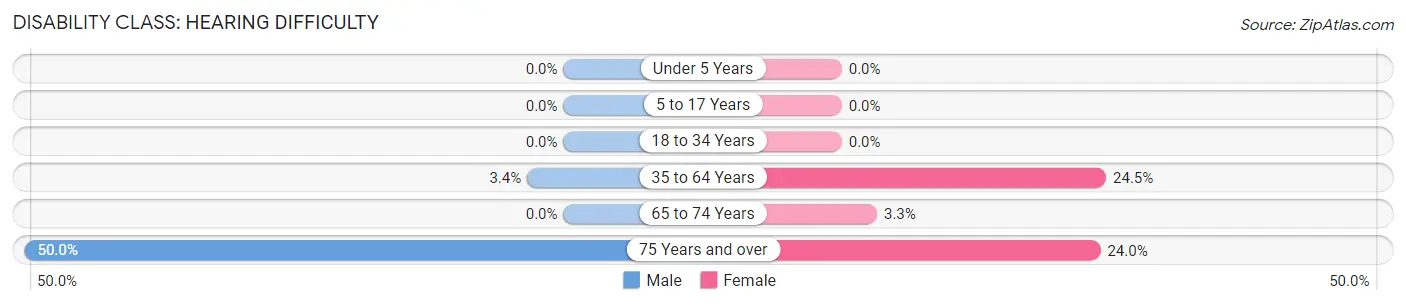
| Age Bracket | Male | Female |
| Under 5 Years | 0 (0.0%) | 0 (0.0%) |
| 5 to 17 Years | 0 (0.0%) | 0 (0.0%) |
| 18 to 34 Years | 0 (0.0%) | 0 (0.0%) |
| 35 to 64 Years | 27 (3.4%) | 246 (24.5%) |
| 65 to 74 Years | 0 (0.0%) | 13 (3.3%) |
| 75 Years and over | 70 (50.0%) | 67 (24.0%) |
Disability Class: Vision Difficulty
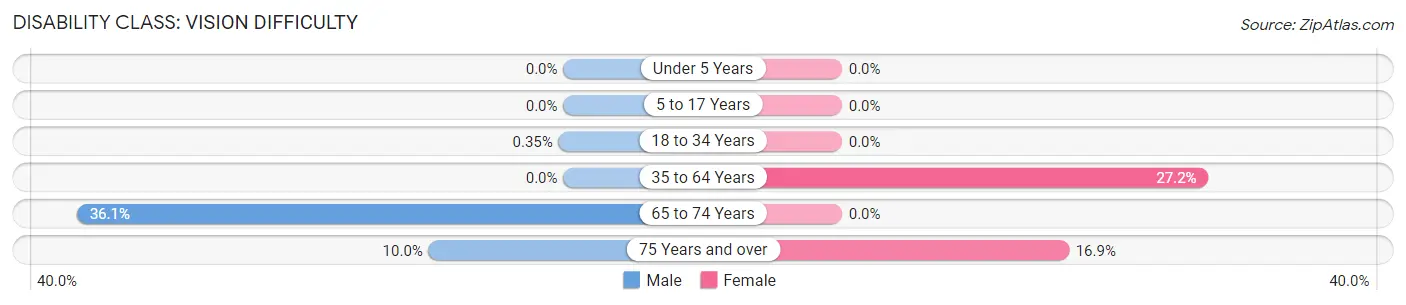
| Age Bracket | Male | Female |
| Under 5 Years | 0 (0.0%) | 0 (0.0%) |
| 5 to 17 Years | 0 (0.0%) | 0 (0.0%) |
| 18 to 34 Years | 1 (0.4%) | 0 (0.0%) |
| 35 to 64 Years | 0 (0.0%) | 273 (27.2%) |
| 65 to 74 Years | 142 (36.1%) | 0 (0.0%) |
| 75 Years and over | 14 (10.0%) | 47 (16.9%) |
Disability Class: Cognitive Difficulty
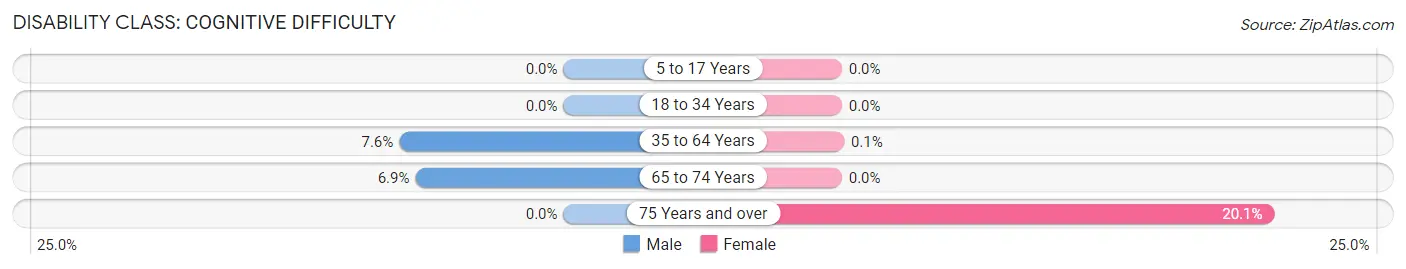
| Age Bracket | Male | Female |
| 5 to 17 Years | 0 (0.0%) | 0 (0.0%) |
| 18 to 34 Years | 0 (0.0%) | 0 (0.0%) |
| 35 to 64 Years | 61 (7.6%) | 1 (0.1%) |
| 65 to 74 Years | 27 (6.9%) | 0 (0.0%) |
| 75 Years and over | 0 (0.0%) | 56 (20.1%) |
Disability Class: Ambulatory Difficulty
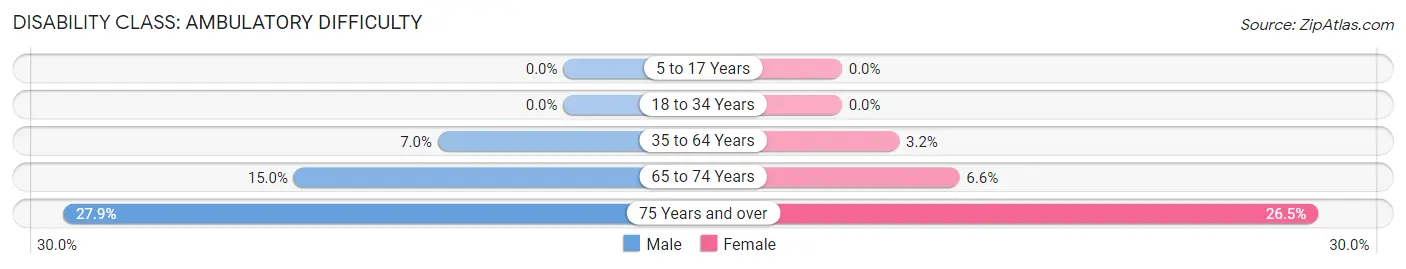
| Age Bracket | Male | Female |
| 5 to 17 Years | 0 (0.0%) | 0 (0.0%) |
| 18 to 34 Years | 0 (0.0%) | 0 (0.0%) |
| 35 to 64 Years | 56 (7.0%) | 32 (3.2%) |
| 65 to 74 Years | 59 (15.0%) | 26 (6.6%) |
| 75 Years and over | 39 (27.9%) | 74 (26.5%) |
Disability Class: Self-Care Difficulty
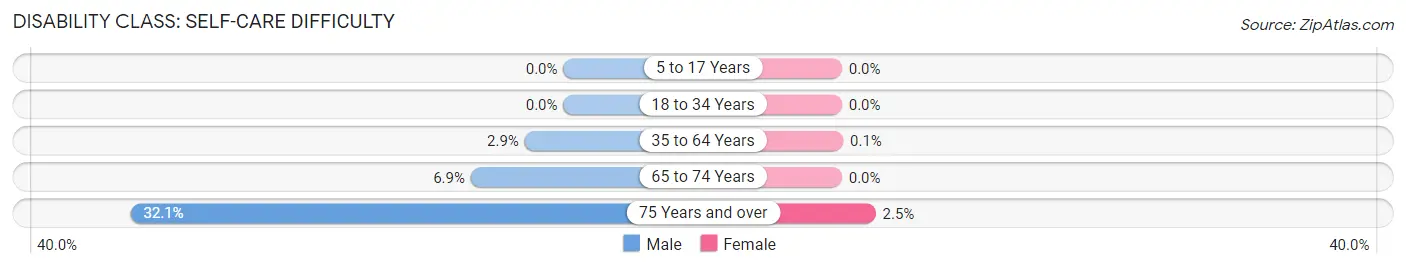
| Age Bracket | Male | Female |
| 5 to 17 Years | 0 (0.0%) | 0 (0.0%) |
| 18 to 34 Years | 0 (0.0%) | 0 (0.0%) |
| 35 to 64 Years | 23 (2.9%) | 1 (0.1%) |
| 65 to 74 Years | 27 (6.9%) | 0 (0.0%) |
| 75 Years and over | 45 (32.1%) | 7 (2.5%) |
Technology Access in Kenmar
Computing Device Access in Kenmar
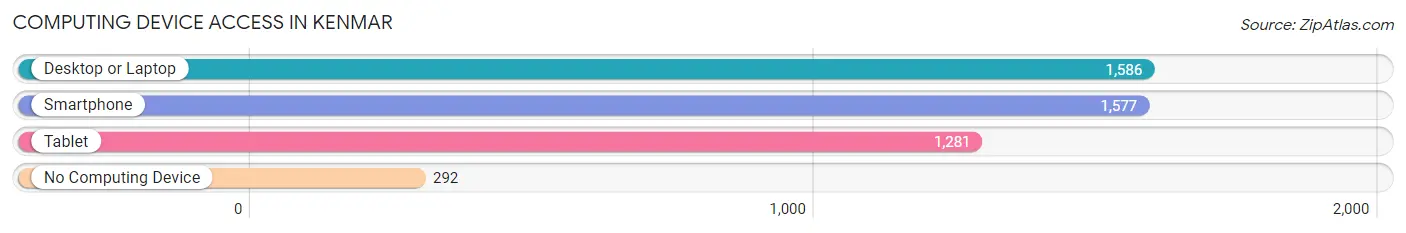
| Device Type | # Households | % Households |
| Desktop or Laptop | 1,586 | 77.2% |
| Smartphone | 1,577 | 76.8% |
| Tablet | 1,281 | 62.4% |
| No Computing Device | 292 | 14.2% |
| Total | 2,053 | 100.0% |
Internet Access in Kenmar
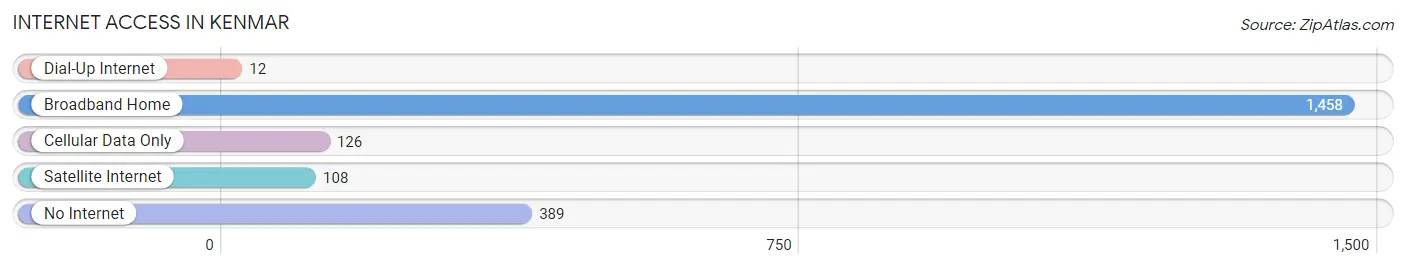
| Internet Type | # Households | % Households |
| Dial-Up Internet | 12 | 0.6% |
| Broadband Home | 1,458 | 71.0% |
| Cellular Data Only | 126 | 6.1% |
| Satellite Internet | 108 | 5.3% |
| No Internet | 389 | 19.0% |
| Total | 2,053 | 100.0% |
Kenmar Summary
Kenmar is a small borough located in the state of Pennsylvania. It is situated in the northern part of the state, in the county of Northumberland. The borough is located in the Susquehanna Valley, and is bordered by the Susquehanna River to the east and the West Branch Susquehanna River to the west. The population of Kenmar was 1,845 as of the 2010 census.
History
Kenmar was founded in 1845 by a group of settlers from the nearby town of Milton. The settlers named the town after their leader, Kenneth Marr. The town was originally a farming community, and the settlers built a grist mill and a saw mill to help support the local economy. The town grew slowly over the years, and by the early 1900s, it had become a small industrial center. The town was home to several factories, including a paper mill, a brickyard, and a tannery.
Geography
Kenmar is located in the northern part of Pennsylvania, in the county of Northumberland. The borough is situated in the Susquehanna Valley, and is bordered by the Susquehanna River to the east and the West Branch Susquehanna River to the west. The borough is located at an elevation of 545 feet above sea level. The total area of the borough is 0.7 square miles, all of which is land.
Economy
The economy of Kenmar is largely based on agriculture and manufacturing. The town is home to several small businesses, including a grocery store, a hardware store, and a few restaurants. The town is also home to a paper mill, a brickyard, and a tannery. The town is served by the Susquehanna Valley Railroad, which provides freight service to the area.
Demographics
As of the 2010 census, the population of Kenmar was 1,845. The racial makeup of the borough was 97.3% White, 0.7% African American, 0.2% Native American, 0.2% Asian, 0.2% from other races, and 1.6% from two or more races. Hispanic or Latino of any race were 0.9% of the population.
The median income for a household in the borough was $37,917, and the median income for a family was $45,625. The per capita income for the borough was $18,945. About 8.3% of families and 10.2% of the population were below the poverty line, including 14.2% of those under age 18 and 8.2% of those age 65 or over.
Common Questions
What is Per Capita Income in Kenmar?
Per Capita income in Kenmar is $37,283.
What is the Median Family Income in Kenmar?
Median Family Income in Kenmar is $69,583.
What is the Median Household income in Kenmar?
Median Household Income in Kenmar is $59,160.
What is Income or Wage Gap in Kenmar?
Income or Wage Gap in Kenmar is 24.5%.
Women in Kenmar earn 75.5 cents for every dollar earned by a man.
What is Inequality or Gini Index in Kenmar?
Inequality or Gini Index in Kenmar is 0.42.
What is the Total Population of Kenmar?
Total Population of Kenmar is 4,705.
What is the Total Male Population of Kenmar?
Total Male Population of Kenmar is 2,211.
What is the Total Female Population of Kenmar?
Total Female Population of Kenmar is 2,494.
What is the Ratio of Males per 100 Females in Kenmar?
There are 88.65 Males per 100 Females in Kenmar.
What is the Ratio of Females per 100 Males in Kenmar?
There are 112.80 Females per 100 Males in Kenmar.
What is the Median Population Age in Kenmar?
Median Population Age in Kenmar is 51.4 Years.
What is the Average Family Size in Kenmar
Average Family Size in Kenmar is 2.7 People.
What is the Average Household Size in Kenmar
Average Household Size in Kenmar is 2.2 People.
How Large is the Labor Force in Kenmar?
There are 2,012 People in the Labor Forcein in Kenmar.
What is the Percentage of People in the Labor Force in Kenmar?
53.8% of People are in the Labor Force in Kenmar.
What is the Unemployment Rate in Kenmar?
Unemployment Rate in Kenmar is 15.6%.