Homewood borough, PA Map & Demographics
Homewood borough Overview
$30,177
PER CAPITA INCOME
$58,750
AVG FAMILY INCOME
$57,917
AVG HOUSEHOLD INCOME
0.35
INEQUALITY / GINI INDEX
96
TOTAL POPULATION
50
MALE POPULATION
46
FEMALE POPULATION
108.70
MALES / 100 FEMALES
92.00
FEMALES / 100 MALES
46.8
MEDIAN AGE
2.2
AVG FAMILY SIZE
2.0
AVG HOUSEHOLD SIZE
44
LABOR FORCE [ PEOPLE ]
48.9%
PERCENT IN LABOR FORCE
6.8%
UNEMPLOYMENT RATE
Income in Homewood borough
Income Overview in Homewood borough
Per Capita Income in Homewood borough is $30,177, while median incomes of families and households are $58,750 and $57,917 respectively.
| Characteristic | Number | Measure |
| Per Capita Income | 96 | $30,177 |
| Median Family Income | 31 | $58,750 |
| Mean Family Income | 31 | $73,152 |
| Median Household Income | 47 | $57,917 |
| Mean Household Income | 47 | $62,051 |
| Income Deficit | 31 | $0 |
| Wage / Income Gap (%) | 96 | 0.00% |
| Wage / Income Gap ($) | 96 | 100.00¢ per $1 |
| Gini / Inequality Index | 96 | 0.35 |
Earnings by Sex in Homewood borough
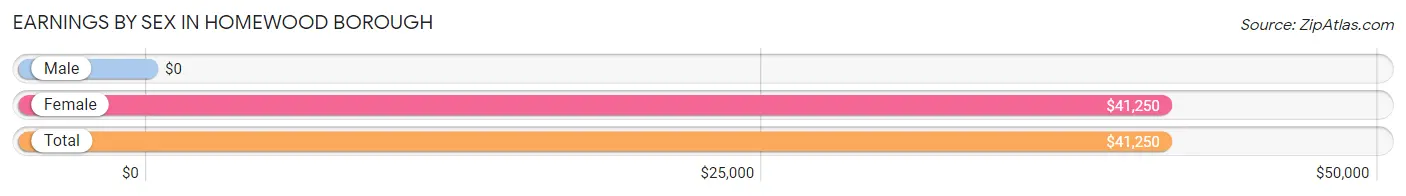
| Sex | Number | Average Earnings |
| Male | 26 (56.5%) | $0 |
| Female | 20 (43.5%) | $41,250 |
| Total | 46 (100.0%) | $41,250 |
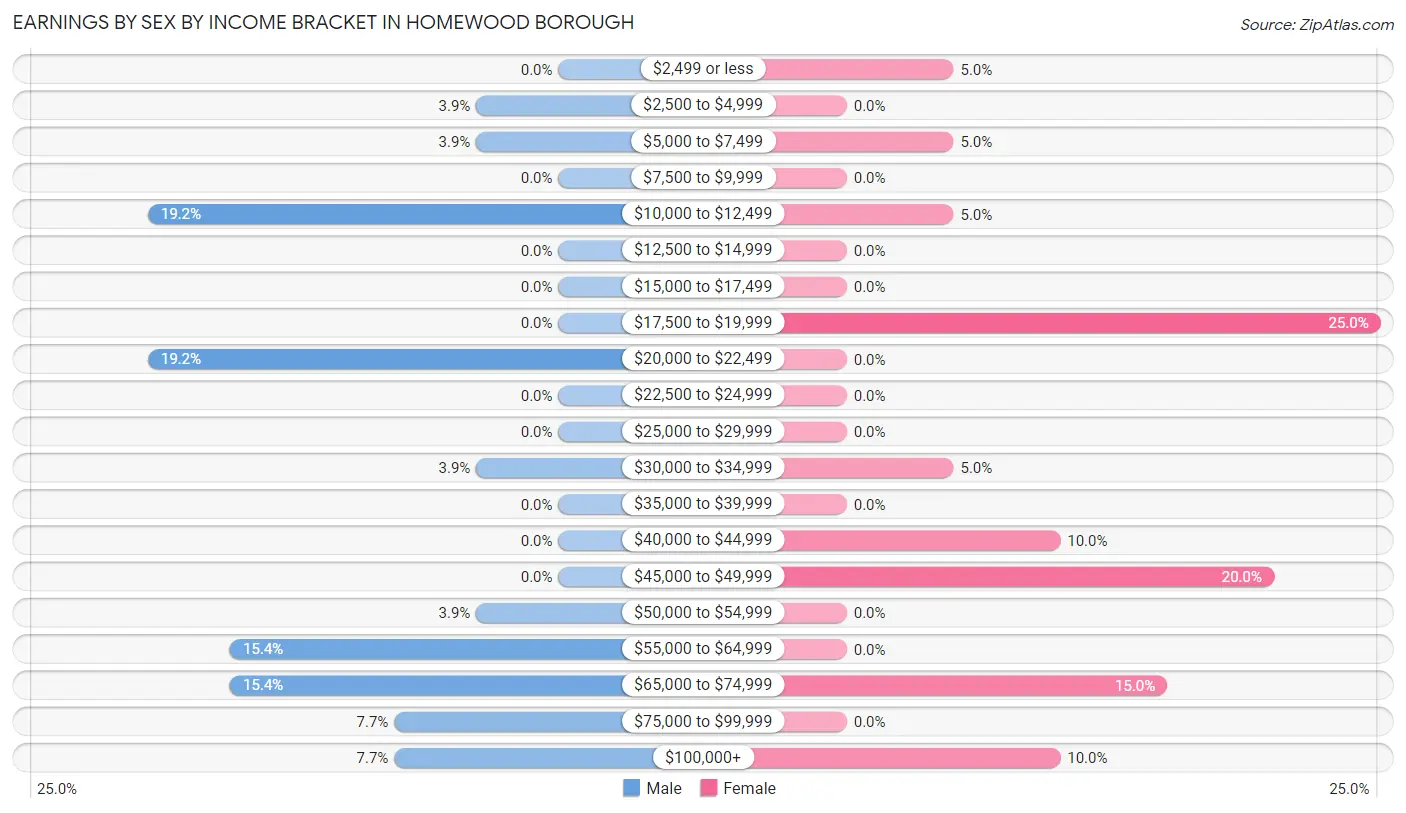
Earnings by Sex by Income Bracket in Homewood borough
The most common earnings brackets in Homewood borough are $10,000 to $12,499 for men (5 | 19.2%) and $17,500 to $19,999 for women (5 | 25.0%).
| Income | Male | Female |
| $2,499 or less | 0 (0.0%) | 1 (5.0%) |
| $2,500 to $4,999 | 1 (3.8%) | 0 (0.0%) |
| $5,000 to $7,499 | 1 (3.8%) | 1 (5.0%) |
| $7,500 to $9,999 | 0 (0.0%) | 0 (0.0%) |
| $10,000 to $12,499 | 5 (19.2%) | 1 (5.0%) |
| $12,500 to $14,999 | 0 (0.0%) | 0 (0.0%) |
| $15,000 to $17,499 | 0 (0.0%) | 0 (0.0%) |
| $17,500 to $19,999 | 0 (0.0%) | 5 (25.0%) |
| $20,000 to $22,499 | 5 (19.2%) | 0 (0.0%) |
| $22,500 to $24,999 | 0 (0.0%) | 0 (0.0%) |
| $25,000 to $29,999 | 0 (0.0%) | 0 (0.0%) |
| $30,000 to $34,999 | 1 (3.8%) | 1 (5.0%) |
| $35,000 to $39,999 | 0 (0.0%) | 0 (0.0%) |
| $40,000 to $44,999 | 0 (0.0%) | 2 (10.0%) |
| $45,000 to $49,999 | 0 (0.0%) | 4 (20.0%) |
| $50,000 to $54,999 | 1 (3.8%) | 0 (0.0%) |
| $55,000 to $64,999 | 4 (15.4%) | 0 (0.0%) |
| $65,000 to $74,999 | 4 (15.4%) | 3 (15.0%) |
| $75,000 to $99,999 | 2 (7.7%) | 0 (0.0%) |
| $100,000+ | 2 (7.7%) | 2 (10.0%) |
| Total | 26 (100.0%) | 20 (100.0%) |
Earnings by Sex by Educational Attainment in Homewood borough
| Educational Attainment | Male Income | Female Income |
| Less than High School | - | - |
| High School Diploma | - | - |
| College or Associate's Degree | - | - |
| Bachelor's Degree | - | - |
| Graduate Degree | - | - |
| Total | $60,000 | $45,938 |
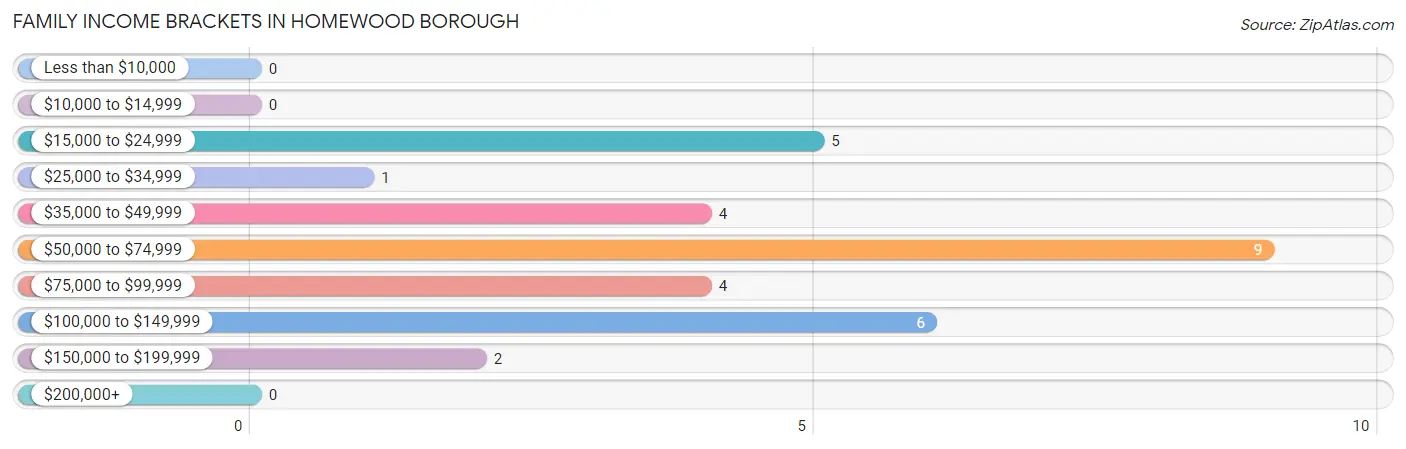
Family Income in Homewood borough
Family Income Brackets in Homewood borough
According to the Homewood borough family income data, there are 9 families falling into the $50,000 to $74,999 income range, which is the most common income bracket and makes up 29.0% of all families.
| Income Bracket | # Families | % Families |
| Less than $10,000 | 0 | 0.0% |
| $10,000 to $14,999 | 0 | 0.0% |
| $15,000 to $24,999 | 5 | 16.1% |
| $25,000 to $34,999 | 1 | 3.2% |
| $35,000 to $49,999 | 4 | 12.9% |
| $50,000 to $74,999 | 9 | 29.0% |
| $75,000 to $99,999 | 4 | 12.9% |
| $100,000 to $149,999 | 6 | 19.4% |
| $150,000 to $199,999 | 2 | 6.5% |
| $200,000+ | 0 | 0.0% |
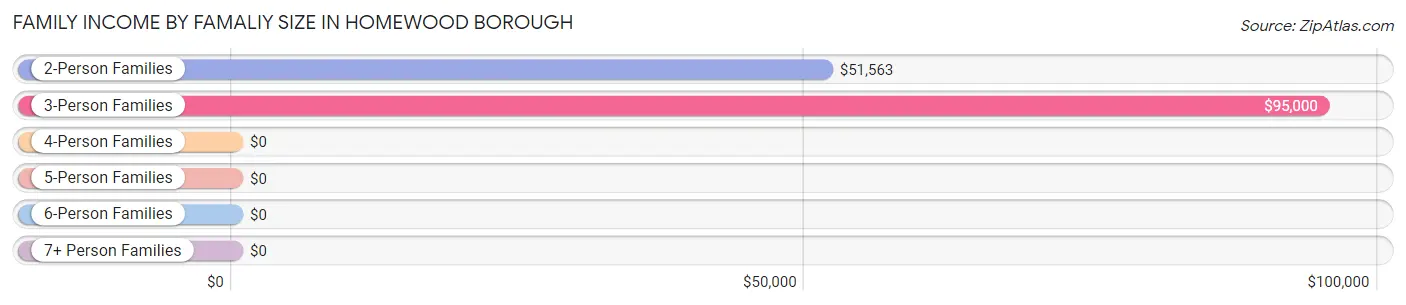
Family Income by Famaliy Size in Homewood borough
3-person families (6 | 19.4%) account for the highest median family income in Homewood borough with $95,000 per family, while 3-person families (6 | 19.4%) have the highest median income of $31,667 per family member.
| Income Bracket | # Families | Median Income |
| 2-Person Families | 25 (80.6%) | $51,563 |
| 3-Person Families | 6 (19.4%) | $95,000 |
| 4-Person Families | 0 (0.0%) | $0 |
| 5-Person Families | 0 (0.0%) | $0 |
| 6-Person Families | 0 (0.0%) | $0 |
| 7+ Person Families | 0 (0.0%) | $0 |
| Total | 31 (100.0%) | $58,750 |
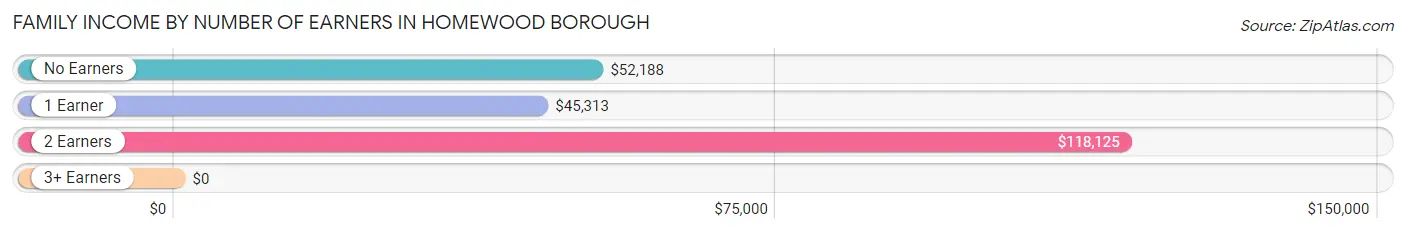
Family Income by Number of Earners in Homewood borough
| Number of Earners | # Families | Median Income |
| No Earners | 9 (29.0%) | $52,188 |
| 1 Earner | 11 (35.5%) | $45,313 |
| 2 Earners | 11 (35.5%) | $118,125 |
| 3+ Earners | 0 (0.0%) | $0 |
| Total | 31 (100.0%) | $58,750 |
Household Income in Homewood borough
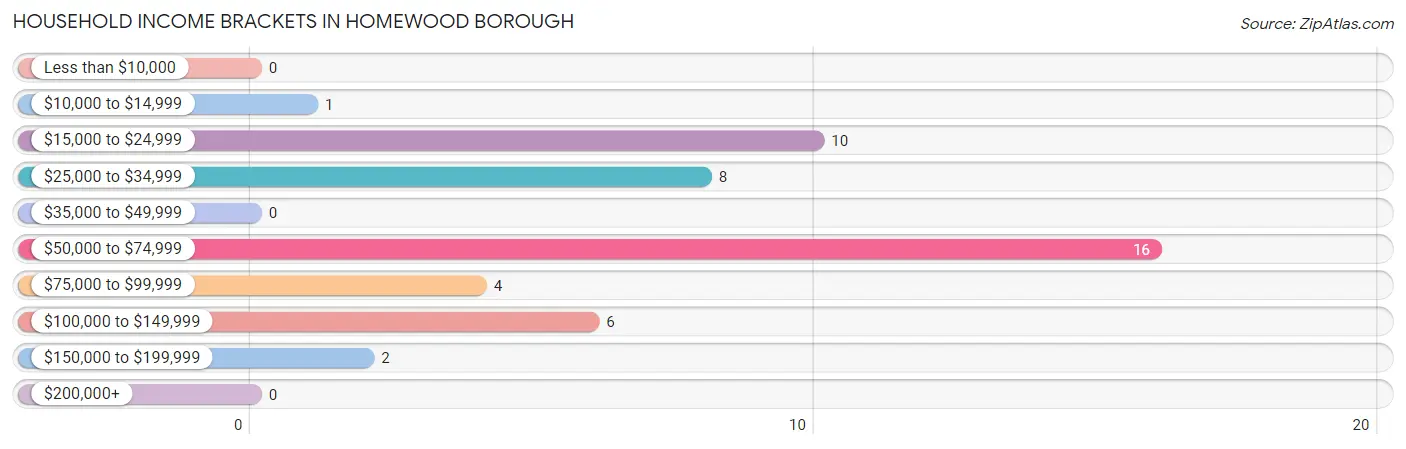
Household Income Brackets in Homewood borough
With 16 households falling in the category, the $50,000 to $74,999 income range is the most frequent in Homewood borough, accounting for 34.0% of all households.
| Income Bracket | # Households | % Households |
| Less than $10,000 | 0 | 0.0% |
| $10,000 to $14,999 | 1 | 2.1% |
| $15,000 to $24,999 | 10 | 21.3% |
| $25,000 to $34,999 | 8 | 17.0% |
| $35,000 to $49,999 | 0 | 0.0% |
| $50,000 to $74,999 | 16 | 34.0% |
| $75,000 to $99,999 | 4 | 8.5% |
| $100,000 to $149,999 | 6 | 12.8% |
| $150,000 to $199,999 | 2 | 4.3% |
| $200,000+ | 0 | 0.0% |
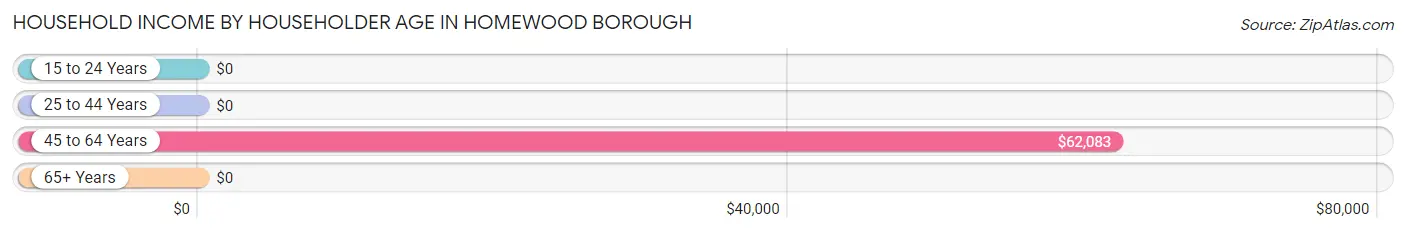
Household Income by Householder Age in Homewood borough
The median household income in Homewood borough is $57,917, with the highest median household income of $62,083 found in the 45 to 64 years age bracket for the primary householder. A total of 23 households (48.9%) fall into this category. Meanwhile, the 15 to 24 years age bracket for the primary householder has the lowest median household income of $0, with 5 households (10.6%) in this group.
| Income Bracket | # Households | Median Income |
| 15 to 24 Years | 5 (10.6%) | $0 |
| 25 to 44 Years | 4 (8.5%) | $0 |
| 45 to 64 Years | 23 (48.9%) | $62,083 |
| 65+ Years | 15 (31.9%) | $0 |
| Total | 47 (100.0%) | $57,917 |
Poverty in Homewood borough
Income Below Poverty by Sex and Age in Homewood borough
With 8.0% poverty level for males and 4.3% for females among the residents of Homewood borough, 35 to 44 year old males and 25 to 34 year old females are the most vulnerable to poverty, with 4 males (33.3%) and 1 females (12.5%) in their respective age groups living below the poverty level.
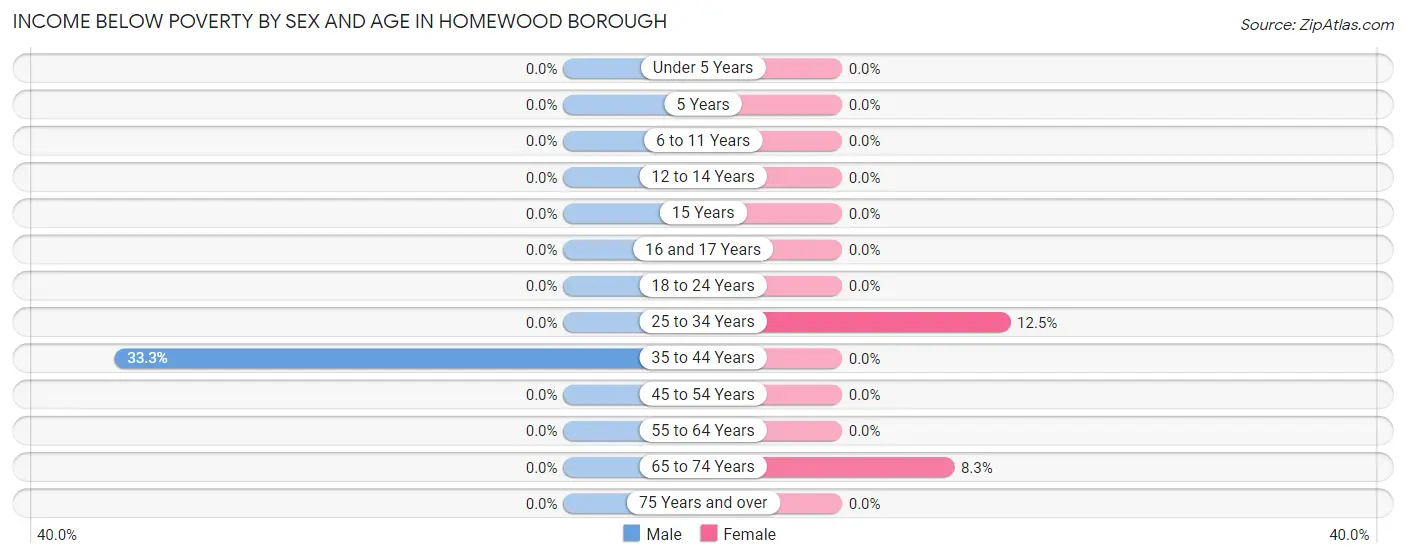
| Age Bracket | Male | Female |
| Under 5 Years | 0 (0.0%) | 0 (0.0%) |
| 5 Years | 0 (0.0%) | 0 (0.0%) |
| 6 to 11 Years | 0 (0.0%) | 0 (0.0%) |
| 12 to 14 Years | 0 (0.0%) | 0 (0.0%) |
| 15 Years | 0 (0.0%) | 0 (0.0%) |
| 16 and 17 Years | 0 (0.0%) | 0 (0.0%) |
| 18 to 24 Years | 0 (0.0%) | 0 (0.0%) |
| 25 to 34 Years | 0 (0.0%) | 1 (12.5%) |
| 35 to 44 Years | 4 (33.3%) | 0 (0.0%) |
| 45 to 54 Years | 0 (0.0%) | 0 (0.0%) |
| 55 to 64 Years | 0 (0.0%) | 0 (0.0%) |
| 65 to 74 Years | 0 (0.0%) | 1 (8.3%) |
| 75 Years and over | 0 (0.0%) | 0 (0.0%) |
| Total | 4 (8.0%) | 2 (4.3%) |
Income Above Poverty by Sex and Age in Homewood borough
According to the poverty statistics in Homewood borough, males aged 18 to 24 years and females aged under 5 years are the age groups that are most secure financially, with 100.0% of males and 100.0% of females in these age groups living above the poverty line.
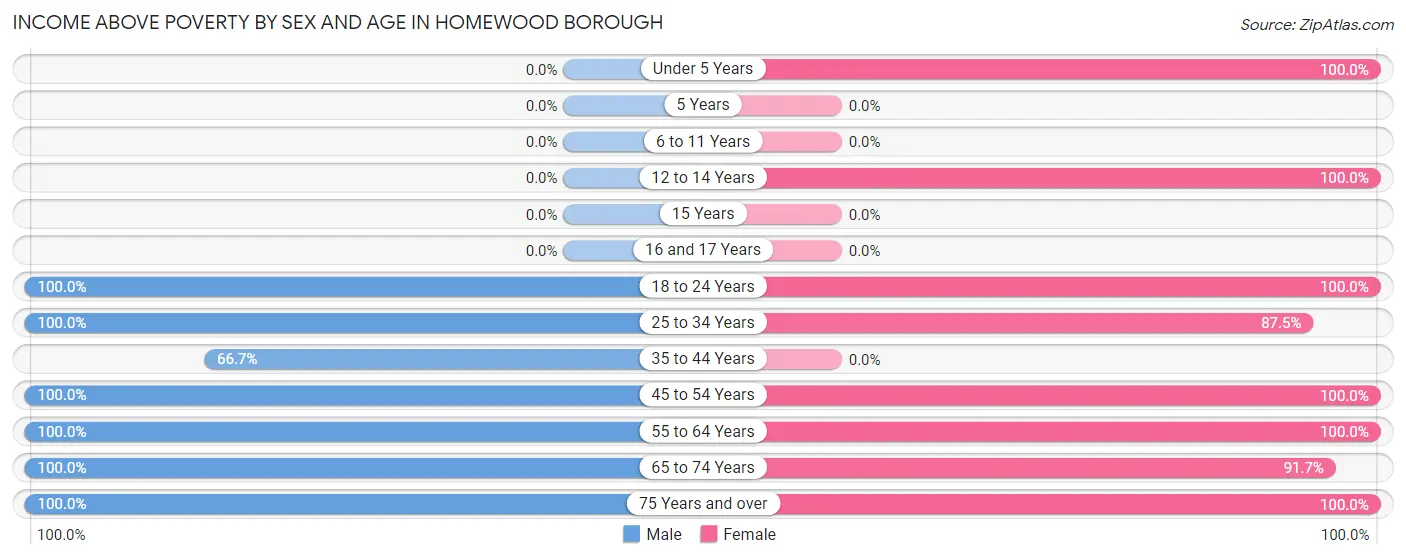
| Age Bracket | Male | Female |
| Under 5 Years | 0 (0.0%) | 2 (100.0%) |
| 5 Years | 0 (0.0%) | 0 (0.0%) |
| 6 to 11 Years | 0 (0.0%) | 0 (0.0%) |
| 12 to 14 Years | 0 (0.0%) | 4 (100.0%) |
| 15 Years | 0 (0.0%) | 0 (0.0%) |
| 16 and 17 Years | 0 (0.0%) | 0 (0.0%) |
| 18 to 24 Years | 6 (100.0%) | 5 (100.0%) |
| 25 to 34 Years | 4 (100.0%) | 7 (87.5%) |
| 35 to 44 Years | 8 (66.7%) | 0 (0.0%) |
| 45 to 54 Years | 9 (100.0%) | 7 (100.0%) |
| 55 to 64 Years | 9 (100.0%) | 3 (100.0%) |
| 65 to 74 Years | 7 (100.0%) | 11 (91.7%) |
| 75 Years and over | 3 (100.0%) | 5 (100.0%) |
| Total | 46 (92.0%) | 44 (95.7%) |
Income Below Poverty Among Married-Couple Families in Homewood borough
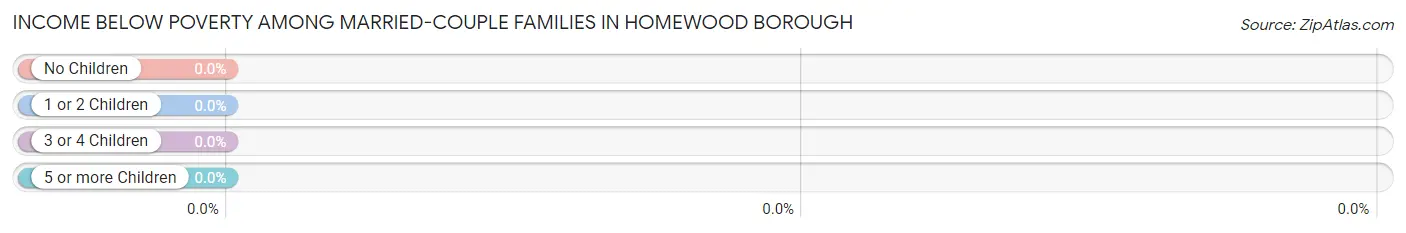
| Children | Above Poverty | Below Poverty |
| No Children | 16 (100.0%) | 0 (0.0%) |
| 1 or 2 Children | 2 (100.0%) | 0 (0.0%) |
| 3 or 4 Children | 0 (0.0%) | 0 (0.0%) |
| 5 or more Children | 0 (0.0%) | 0 (0.0%) |
| Total | 18 (100.0%) | 0 (0.0%) |
Income Below Poverty Among Single-Parent Households in Homewood borough
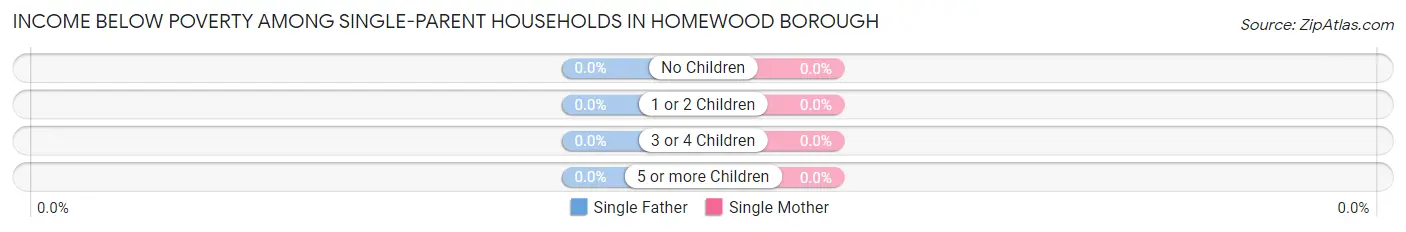
| Children | Single Father | Single Mother |
| No Children | 0 (0.0%) | 0 (0.0%) |
| 1 or 2 Children | 0 (0.0%) | 0 (0.0%) |
| 3 or 4 Children | 0 (0.0%) | 0 (0.0%) |
| 5 or more Children | 0 (0.0%) | 0 (0.0%) |
| Total | 0 (0.0%) | 0 (0.0%) |
Income Below Poverty Among Married-Couple vs Single-Parent Households in Homewood borough
| Children | Married-Couple Families | Single-Parent Households |
| No Children | 0 (0.0%) | 0 (0.0%) |
| 1 or 2 Children | 0 (0.0%) | 0 (0.0%) |
| 3 or 4 Children | 0 (0.0%) | 0 (0.0%) |
| 5 or more Children | 0 (0.0%) | 0 (0.0%) |
| Total | 0 (0.0%) | 0 (0.0%) |
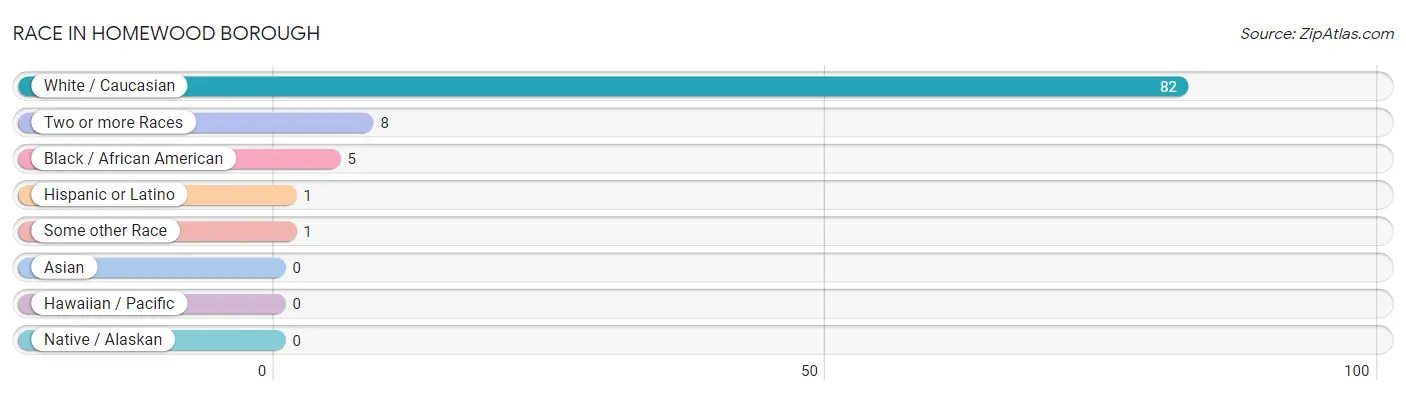
Race in Homewood borough
The most populous races in Homewood borough are White / Caucasian (82 | 85.4%), Two or more Races (8 | 8.3%), and Black / African American (5 | 5.2%).
| Race | # Population | % Population |
| Asian | 0 | 0.0% |
| Black / African American | 5 | 5.2% |
| Hawaiian / Pacific | 0 | 0.0% |
| Hispanic or Latino | 1 | 1.0% |
| Native / Alaskan | 0 | 0.0% |
| White / Caucasian | 82 | 85.4% |
| Two or more Races | 8 | 8.3% |
| Some other Race | 1 | 1.0% |
| Total | 96 | 100.0% |
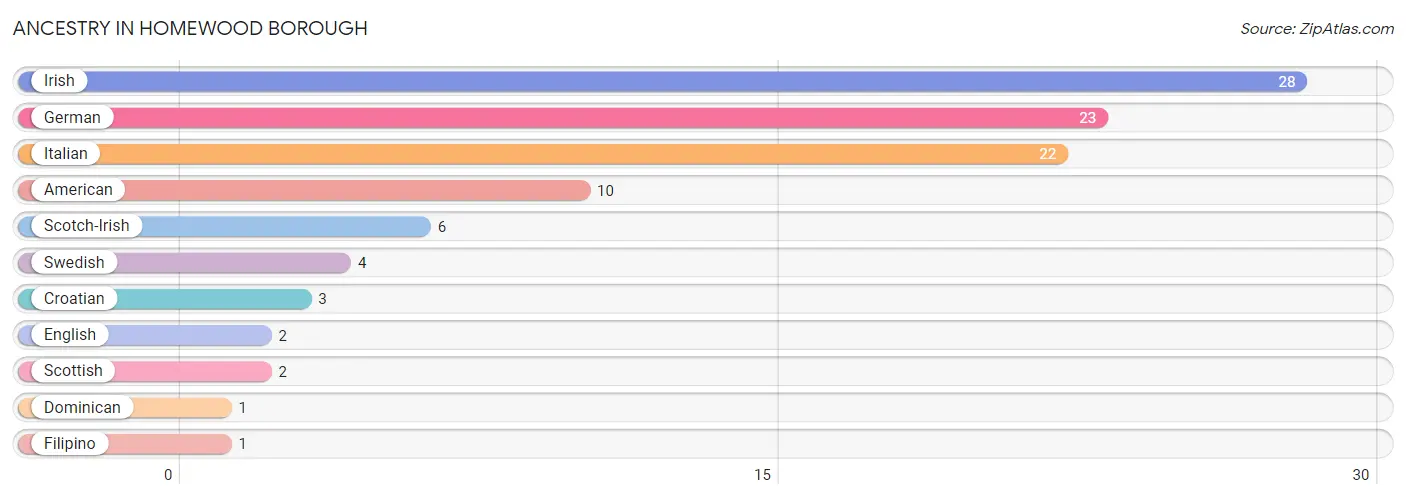
Ancestry in Homewood borough
The most populous ancestries reported in Homewood borough are Irish (28 | 29.2%), German (23 | 24.0%), Italian (22 | 22.9%), American (10 | 10.4%), and Scotch-Irish (6 | 6.2%), together accounting for 92.7% of all Homewood borough residents.
| Ancestry | # Population | % Population |
| American | 10 | 10.4% |
| Croatian | 3 | 3.1% |
| Dominican | 1 | 1.0% |
| English | 2 | 2.1% |
| Filipino | 1 | 1.0% |
| German | 23 | 24.0% |
| Irish | 28 | 29.2% |
| Italian | 22 | 22.9% |
| Scotch-Irish | 6 | 6.2% |
| Scottish | 2 | 2.1% |
| Swedish | 4 | 4.2% | View All 11 Rows |
Immigrants in Homewood borough
The most numerous immigrant groups reported in Homewood borough came from Caribbean (1 | 1.0%), Dominican Republic (1 | 1.0%), and Latin America (1 | 1.0%), together accounting for 3.1% of all Homewood borough residents.
| Immigration Origin | # Population | % Population |
| Caribbean | 1 | 1.0% |
| Dominican Republic | 1 | 1.0% |
| Latin America | 1 | 1.0% | View All 3 Rows |
Sex and Age in Homewood borough
Sex and Age in Homewood borough
The most populous age groups in Homewood borough are 35 to 39 Years (7 | 14.0%) for men and 65 to 69 Years (10 | 21.7%) for women.
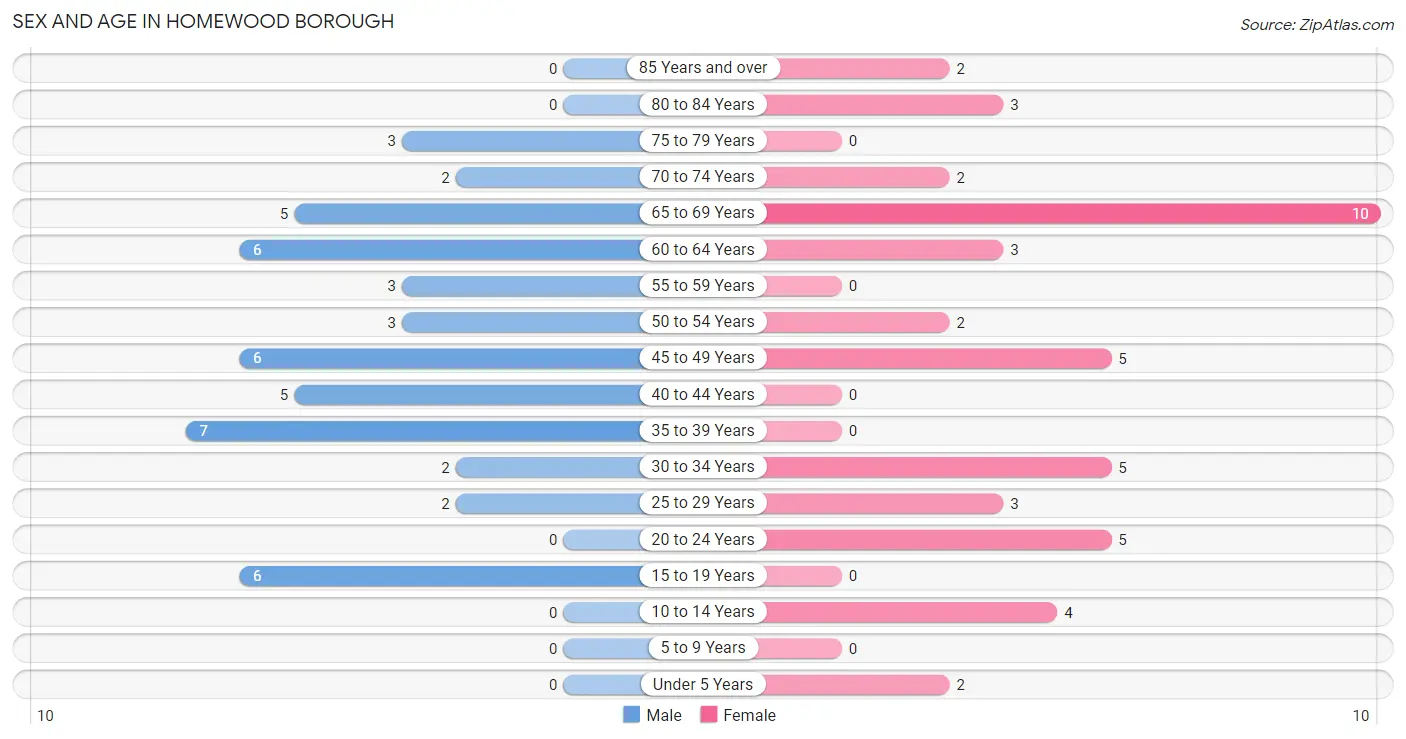
| Age Bracket | Male | Female |
| Under 5 Years | 0 (0.0%) | 2 (4.3%) |
| 5 to 9 Years | 0 (0.0%) | 0 (0.0%) |
| 10 to 14 Years | 0 (0.0%) | 4 (8.7%) |
| 15 to 19 Years | 6 (12.0%) | 0 (0.0%) |
| 20 to 24 Years | 0 (0.0%) | 5 (10.9%) |
| 25 to 29 Years | 2 (4.0%) | 3 (6.5%) |
| 30 to 34 Years | 2 (4.0%) | 5 (10.9%) |
| 35 to 39 Years | 7 (14.0%) | 0 (0.0%) |
| 40 to 44 Years | 5 (10.0%) | 0 (0.0%) |
| 45 to 49 Years | 6 (12.0%) | 5 (10.9%) |
| 50 to 54 Years | 3 (6.0%) | 2 (4.3%) |
| 55 to 59 Years | 3 (6.0%) | 0 (0.0%) |
| 60 to 64 Years | 6 (12.0%) | 3 (6.5%) |
| 65 to 69 Years | 5 (10.0%) | 10 (21.7%) |
| 70 to 74 Years | 2 (4.0%) | 2 (4.3%) |
| 75 to 79 Years | 3 (6.0%) | 0 (0.0%) |
| 80 to 84 Years | 0 (0.0%) | 3 (6.5%) |
| 85 Years and over | 0 (0.0%) | 2 (4.3%) |
| Total | 50 (100.0%) | 46 (100.0%) |
Families and Households in Homewood borough
Median Family Size in Homewood borough
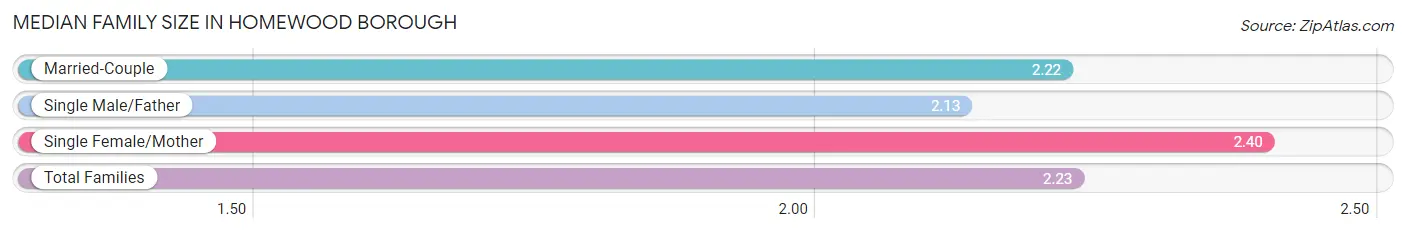
The median family size in Homewood borough is 2.23 persons per family, with single female/mother families (5 | 16.1%) accounting for the largest median family size of 2.4 persons per family. On the other hand, single male/father families (8 | 25.8%) represent the smallest median family size with 2.13 persons per family.
| Family Type | # Families | Family Size |
| Married-Couple | 18 (58.1%) | 2.22 |
| Single Male/Father | 8 (25.8%) | 2.13 |
| Single Female/Mother | 5 (16.1%) | 2.40 |
| Total Families | 31 (100.0%) | 2.23 |
Median Household Size in Homewood borough
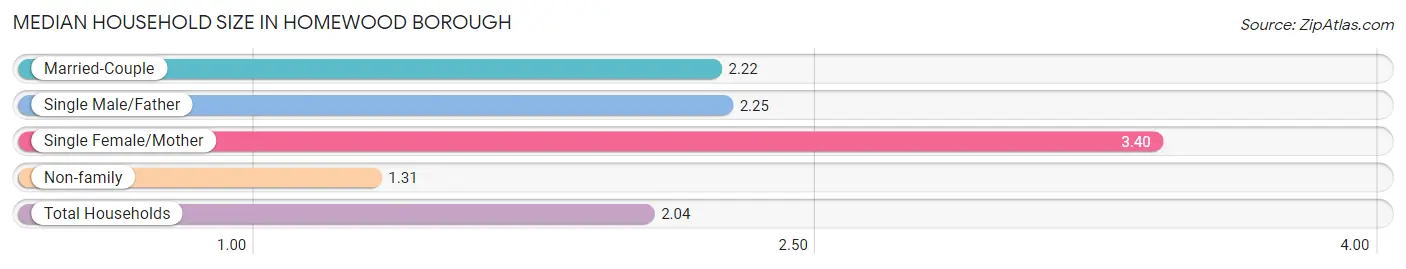
The median household size in Homewood borough is 2.04 persons per household, with single female/mother households (5 | 10.6%) accounting for the largest median household size of 3.4 persons per household. non-family households (16 | 34.0%) represent the smallest median household size with 1.31 persons per household.
| Household Type | # Households | Household Size |
| Married-Couple | 18 (38.3%) | 2.22 |
| Single Male/Father | 8 (17.0%) | 2.25 |
| Single Female/Mother | 5 (10.6%) | 3.40 |
| Non-family | 16 (34.0%) | 1.31 |
| Total Households | 47 (100.0%) | 2.04 |
Household Size by Marriage Status in Homewood borough
Out of a total of 47 households in Homewood borough, 31 (66.0%) are family households, while 16 (34.0%) are nonfamily households. The most numerous type of family households are 2-person households, comprising 21, and the most common type of nonfamily households are 1-person households, comprising 10.
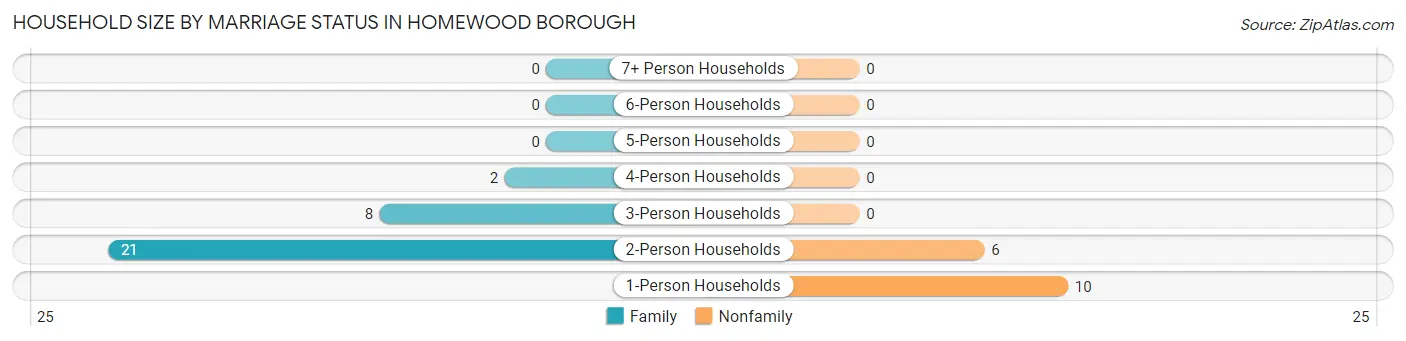
| Household Size | Family Households | Nonfamily Households |
| 1-Person Households | - | 10 (21.3%) |
| 2-Person Households | 21 (44.7%) | 6 (12.8%) |
| 3-Person Households | 8 (17.0%) | 0 (0.0%) |
| 4-Person Households | 2 (4.3%) | 0 (0.0%) |
| 5-Person Households | 0 (0.0%) | 0 (0.0%) |
| 6-Person Households | 0 (0.0%) | 0 (0.0%) |
| 7+ Person Households | 0 (0.0%) | 0 (0.0%) |
| Total | 31 (66.0%) | 16 (34.0%) |
Female Fertility in Homewood borough
Fertility by Age in Homewood borough
| Age Bracket | Women with Births | Births / 1,000 Women |
| 15 to 19 years | 0 (0.0%) | 0.0 |
| 20 to 34 years | 0 (0.0%) | 0.0 |
| 35 to 50 years | 0 (0.0%) | 0.0 |
| Total | 0 (0.0%) | 0.0 |
Fertility by Age by Marriage Status in Homewood borough
| Age Bracket | Married | Unmarried |
| 15 to 19 years | 0 (0.0%) | 0 (0.0%) |
| 20 to 34 years | 0 (0.0%) | 0 (0.0%) |
| 35 to 50 years | 0 (0.0%) | 0 (0.0%) |
| Total | 0 (0.0%) | 0 (0.0%) |
Fertility by Education in Homewood borough
| Educational Attainment | Women with Births | Births / 1,000 Women |
| Less than High School | 0 (0.0%) | 0.0 |
| High School Diploma | 0 (0.0%) | 0.0 |
| College or Associate's Degree | 0 (0.0%) | 0.0 |
| Bachelor's Degree | 0 (0.0%) | 0.0 |
| Graduate Degree | 0 (0.0%) | 0.0 |
| Total | 0 (0.0%) | 0.0 |
Fertility by Education by Marriage Status in Homewood borough
| Educational Attainment | Married | Unmarried |
| Less than High School | 0 (0.0%) | 0 (0.0%) |
| High School Diploma | 0 (0.0%) | 0 (0.0%) |
| College or Associate's Degree | 0 (0.0%) | 0 (0.0%) |
| Bachelor's Degree | 0 (0.0%) | 0 (0.0%) |
| Graduate Degree | 0 (0.0%) | 0 (0.0%) |
| Total | 0 (0.0%) | 0 (0.0%) |
Employment Characteristics in Homewood borough
Employment by Class of Employer in Homewood borough
Among the 41 employed individuals in Homewood borough, private company employees (35 | 85.4%), self-employed (not incorporated) (2 | 4.9%), and local government employees (2 | 4.9%) make up the most common classes of employment.
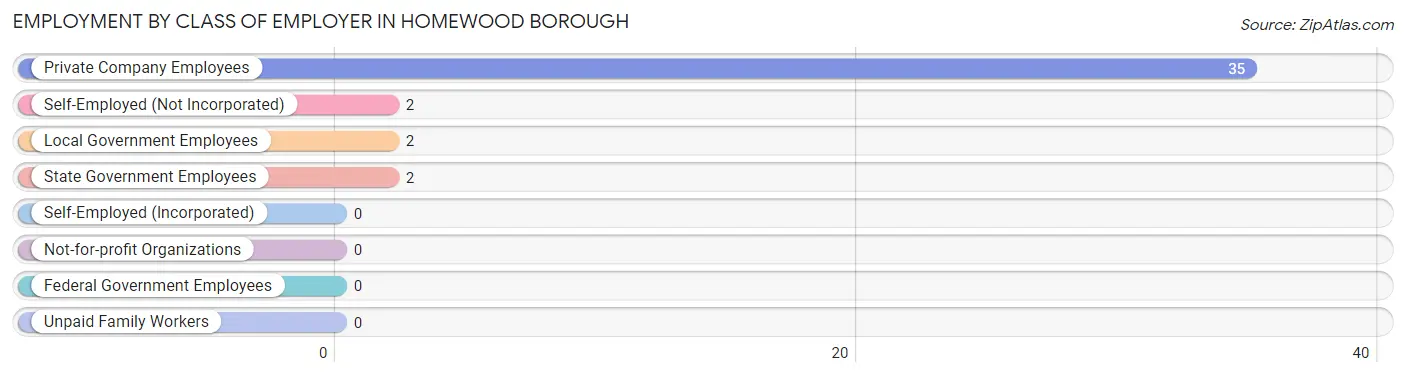
| Employer Class | # Employees | % Employees |
| Private Company Employees | 35 | 85.4% |
| Self-Employed (Incorporated) | 0 | 0.0% |
| Self-Employed (Not Incorporated) | 2 | 4.9% |
| Not-for-profit Organizations | 0 | 0.0% |
| Local Government Employees | 2 | 4.9% |
| State Government Employees | 2 | 4.9% |
| Federal Government Employees | 0 | 0.0% |
| Unpaid Family Workers | 0 | 0.0% |
| Total | 41 | 100.0% |
Employment Status by Age in Homewood borough
According to the labor force statistics for Homewood borough, out of the total population over 16 years of age (90), 48.9% or 44 individuals are in the labor force, with 6.8% or 3 of them unemployed. The age group with the highest labor force participation rate is 16 to 19 years, with 100.0% or 6 individuals in the labor force. Within the labor force, the 65 to 74 years age range has the highest percentage of unemployed individuals, with 100.0% or 1 of them being unemployed.
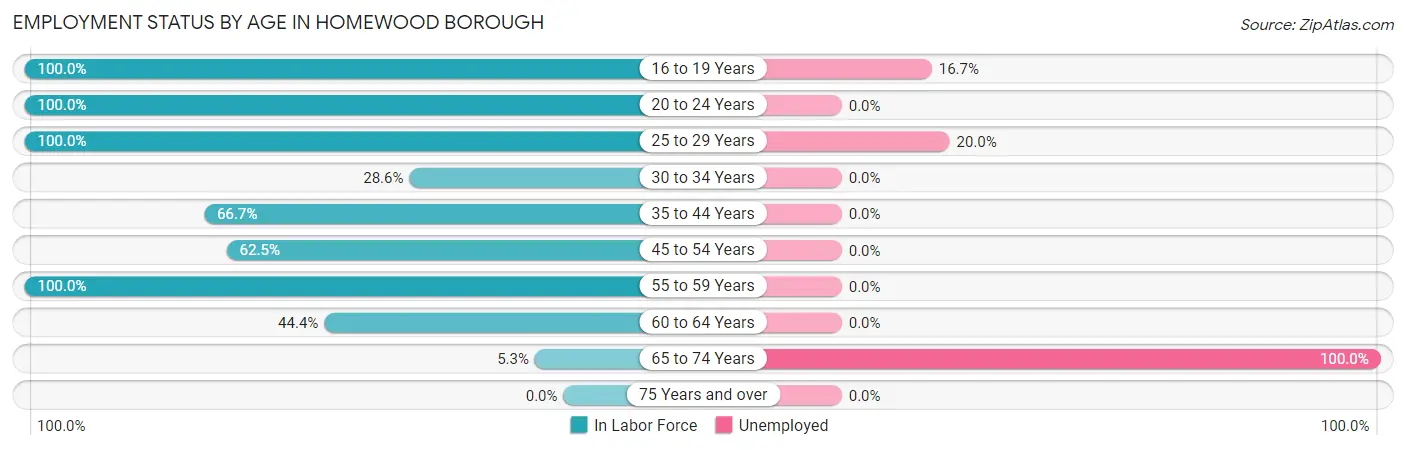
| Age Bracket | In Labor Force | Unemployed |
| 16 to 19 Years | 6 (100.0%) | 1 (16.7%) |
| 20 to 24 Years | 5 (100.0%) | 0 (0.0%) |
| 25 to 29 Years | 5 (100.0%) | 1 (20.0%) |
| 30 to 34 Years | 2 (28.6%) | 0 (0.0%) |
| 35 to 44 Years | 8 (66.7%) | 0 (0.0%) |
| 45 to 54 Years | 10 (62.5%) | 0 (0.0%) |
| 55 to 59 Years | 3 (100.0%) | 0 (0.0%) |
| 60 to 64 Years | 4 (44.4%) | 0 (0.0%) |
| 65 to 74 Years | 1 (5.3%) | 1 (100.0%) |
| 75 Years and over | 0 (0.0%) | 0 (0.0%) |
| Total | 44 (48.9%) | 3 (6.8%) |
Employment Status by Educational Attainment in Homewood borough
According to labor force statistics for Homewood borough, 61.5% of individuals (32) out of the total population between 25 and 64 years of age (52) are in the labor force, with 3.1% or 1 of them being unemployed. The group with the highest labor force participation rate are those with the educational attainment of college / associate degree, with 100.0% or 16 individuals in the labor force. Within the labor force, individuals with less than high school education have the highest percentage of unemployment, with 50.0% or 1 of them being unemployed.
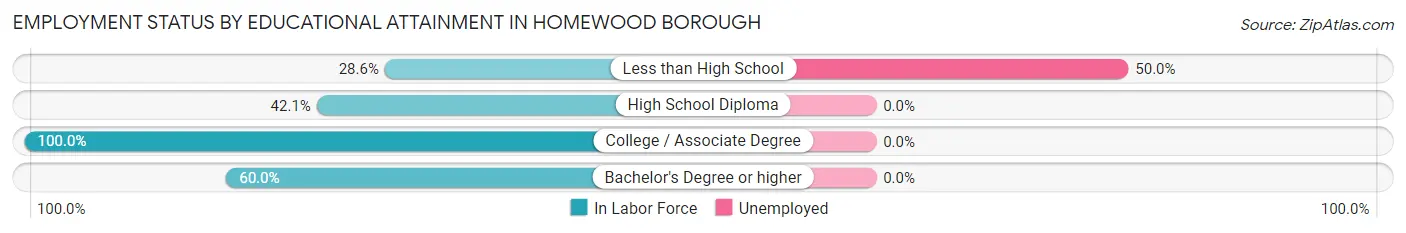
| Educational Attainment | In Labor Force | Unemployed |
| Less than High School | 2 (28.6%) | 4 (50.0%) |
| High School Diploma | 8 (42.1%) | 0 (0.0%) |
| College / Associate Degree | 16 (100.0%) | 0 (0.0%) |
| Bachelor's Degree or higher | 6 (60.0%) | 0 (0.0%) |
| Total | 32 (61.5%) | 2 (3.1%) |
Employment Occupations by Sex in Homewood borough
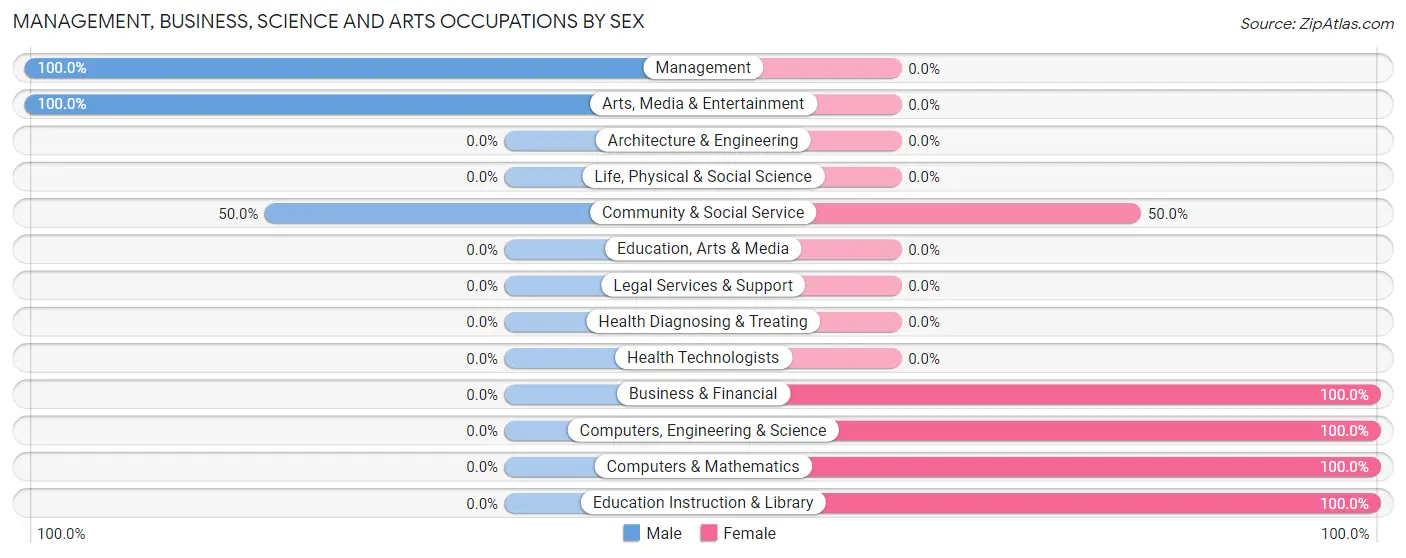
Management, Business, Science and Arts Occupations
The most common Management, Business, Science and Arts occupations in Homewood borough are Community & Social Service (4 | 9.8%), Business & Financial (2 | 4.9%), Education Instruction & Library (2 | 4.9%), Arts, Media & Entertainment (2 | 4.9%), and Management (1 | 2.4%).
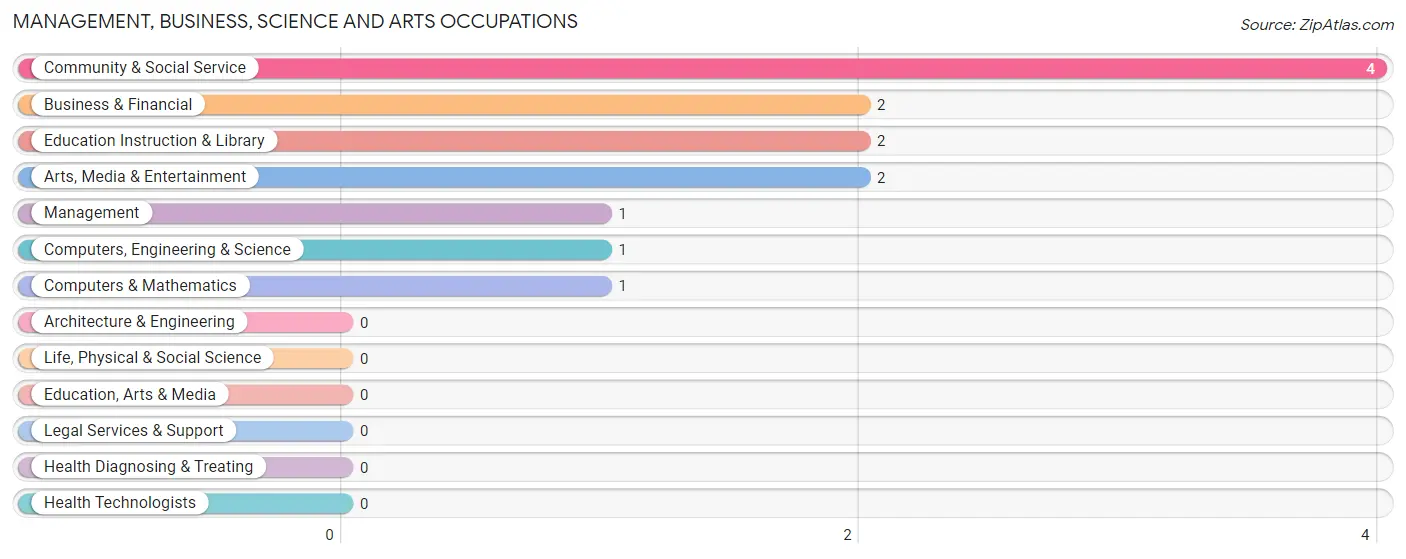
Management, Business, Science and Arts Occupations by Sex
Within the Management, Business, Science and Arts occupations in Homewood borough, the most male-oriented occupations are Management (100.0%), Arts, Media & Entertainment (100.0%), and Community & Social Service (50.0%), while the most female-oriented occupations are Business & Financial (100.0%), Computers, Engineering & Science (100.0%), and Computers & Mathematics (100.0%).
| Occupation | Male | Female |
| Management | 1 (100.0%) | 0 (0.0%) |
| Business & Financial | 0 (0.0%) | 2 (100.0%) |
| Computers, Engineering & Science | 0 (0.0%) | 1 (100.0%) |
| Computers & Mathematics | 0 (0.0%) | 1 (100.0%) |
| Architecture & Engineering | 0 (0.0%) | 0 (0.0%) |
| Life, Physical & Social Science | 0 (0.0%) | 0 (0.0%) |
| Community & Social Service | 2 (50.0%) | 2 (50.0%) |
| Education, Arts & Media | 0 (0.0%) | 0 (0.0%) |
| Legal Services & Support | 0 (0.0%) | 0 (0.0%) |
| Education Instruction & Library | 0 (0.0%) | 2 (100.0%) |
| Arts, Media & Entertainment | 2 (100.0%) | 0 (0.0%) |
| Health Diagnosing & Treating | 0 (0.0%) | 0 (0.0%) |
| Health Technologists | 0 (0.0%) | 0 (0.0%) |
| Total (Category) | 3 (37.5%) | 5 (62.5%) |
| Total (Overall) | 24 (58.5%) | 17 (41.5%) |
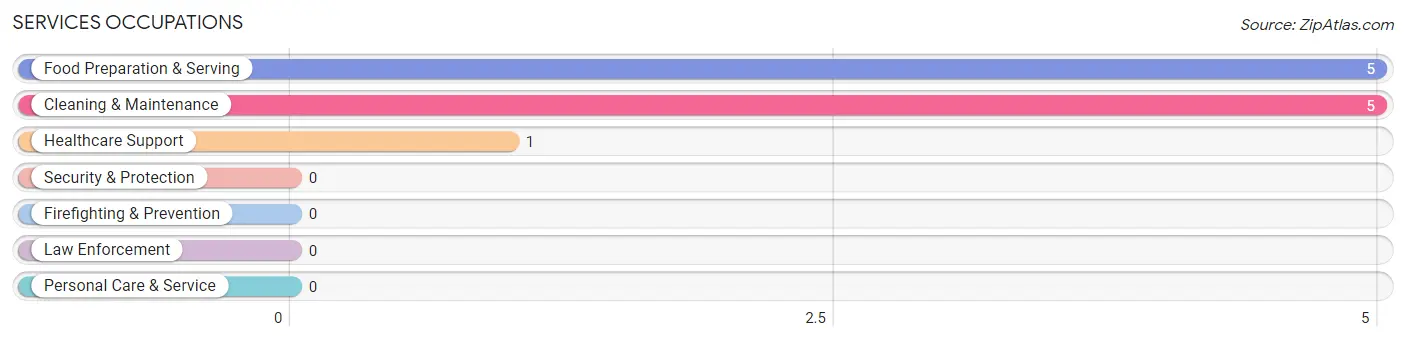
Services Occupations
The most common Services occupations in Homewood borough are Food Preparation & Serving (5 | 12.2%), Cleaning & Maintenance (5 | 12.2%), and Healthcare Support (1 | 2.4%).
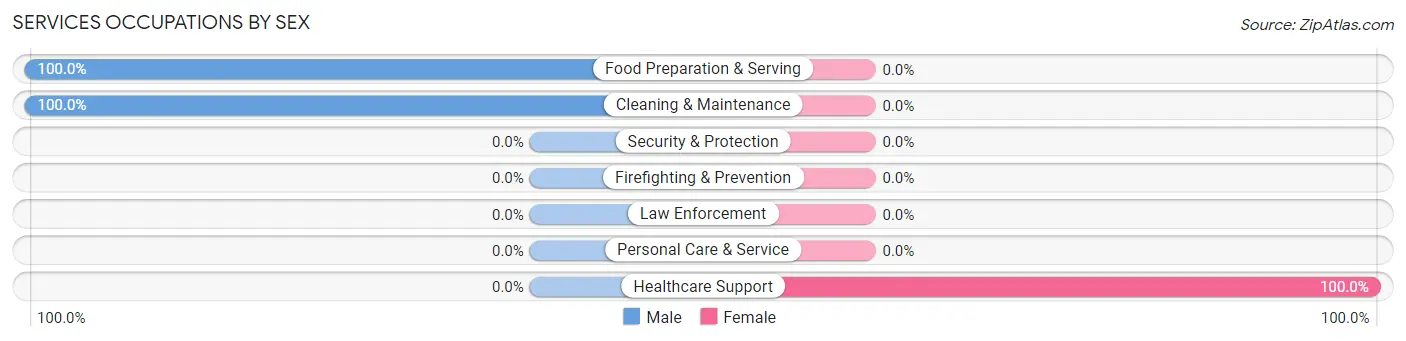
Services Occupations by Sex
| Occupation | Male | Female |
| Healthcare Support | 0 (0.0%) | 1 (100.0%) |
| Security & Protection | 0 (0.0%) | 0 (0.0%) |
| Firefighting & Prevention | 0 (0.0%) | 0 (0.0%) |
| Law Enforcement | 0 (0.0%) | 0 (0.0%) |
| Food Preparation & Serving | 5 (100.0%) | 0 (0.0%) |
| Cleaning & Maintenance | 5 (100.0%) | 0 (0.0%) |
| Personal Care & Service | 0 (0.0%) | 0 (0.0%) |
| Total (Category) | 10 (90.9%) | 1 (9.1%) |
| Total (Overall) | 24 (58.5%) | 17 (41.5%) |
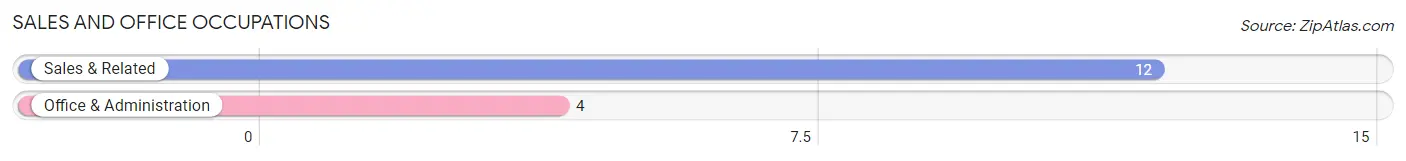
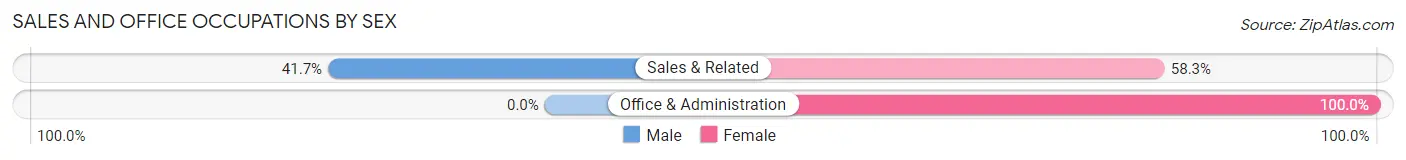
Sales and Office Occupations
The most common Sales and Office occupations in Homewood borough are Sales & Related (12 | 29.3%), and Office & Administration (4 | 9.8%).
Sales and Office Occupations by Sex
| Occupation | Male | Female |
| Sales & Related | 5 (41.7%) | 7 (58.3%) |
| Office & Administration | 0 (0.0%) | 4 (100.0%) |
| Total (Category) | 5 (31.2%) | 11 (68.8%) |
| Total (Overall) | 24 (58.5%) | 17 (41.5%) |
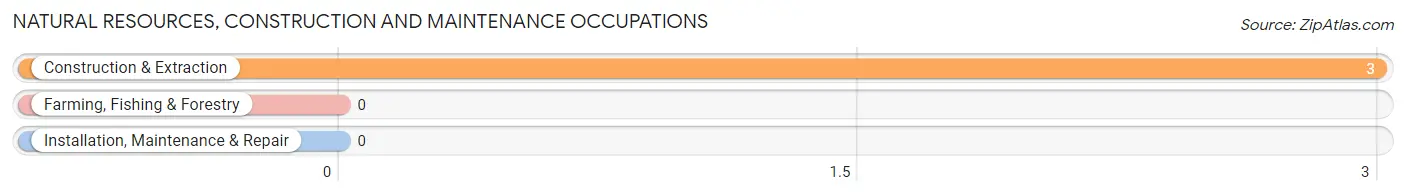
Natural Resources, Construction and Maintenance Occupations
The most common Natural Resources, Construction and Maintenance occupations in Homewood borough are , and Construction & Extraction (3 | 7.3%).
Natural Resources, Construction and Maintenance Occupations by Sex
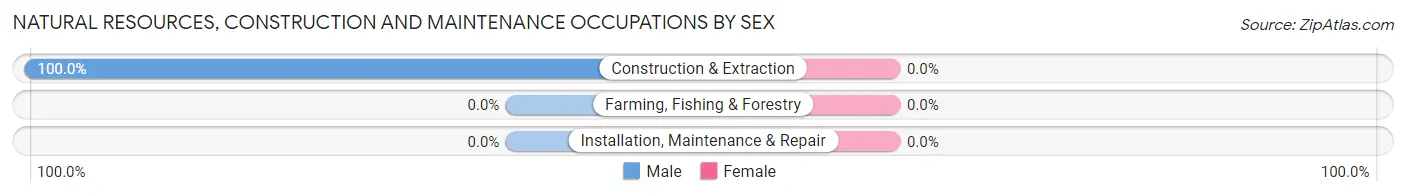
| Occupation | Male | Female |
| Farming, Fishing & Forestry | 0 (0.0%) | 0 (0.0%) |
| Construction & Extraction | 3 (100.0%) | 0 (0.0%) |
| Installation, Maintenance & Repair | 0 (0.0%) | 0 (0.0%) |
| Total (Category) | 3 (100.0%) | 0 (0.0%) |
| Total (Overall) | 24 (58.5%) | 17 (41.5%) |
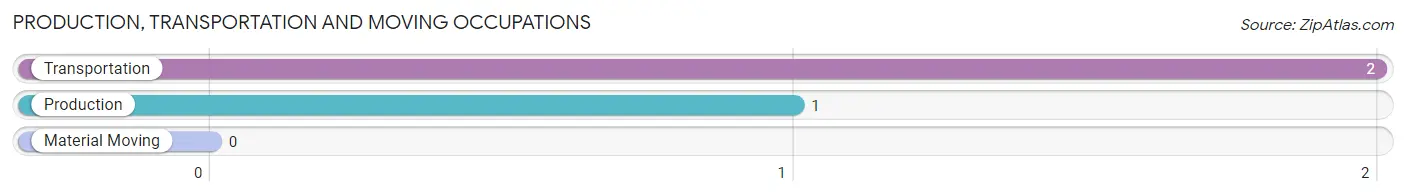
Production, Transportation and Moving Occupations
The most common Production, Transportation and Moving occupations in Homewood borough are Transportation (2 | 4.9%), and Production (1 | 2.4%).
Production, Transportation and Moving Occupations by Sex
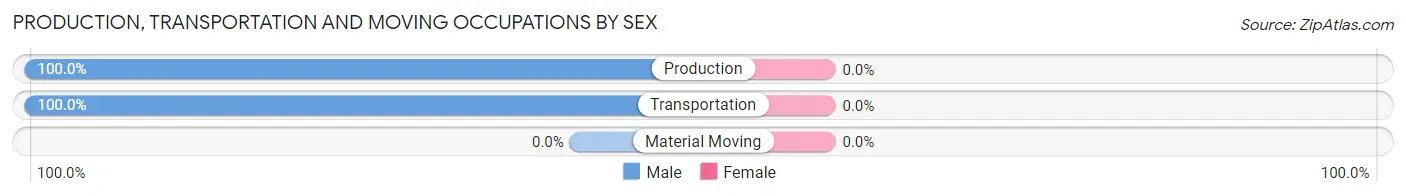
| Occupation | Male | Female |
| Production | 1 (100.0%) | 0 (0.0%) |
| Transportation | 2 (100.0%) | 0 (0.0%) |
| Material Moving | 0 (0.0%) | 0 (0.0%) |
| Total (Category) | 3 (100.0%) | 0 (0.0%) |
| Total (Overall) | 24 (58.5%) | 17 (41.5%) |
Employment Industries by Sex in Homewood borough
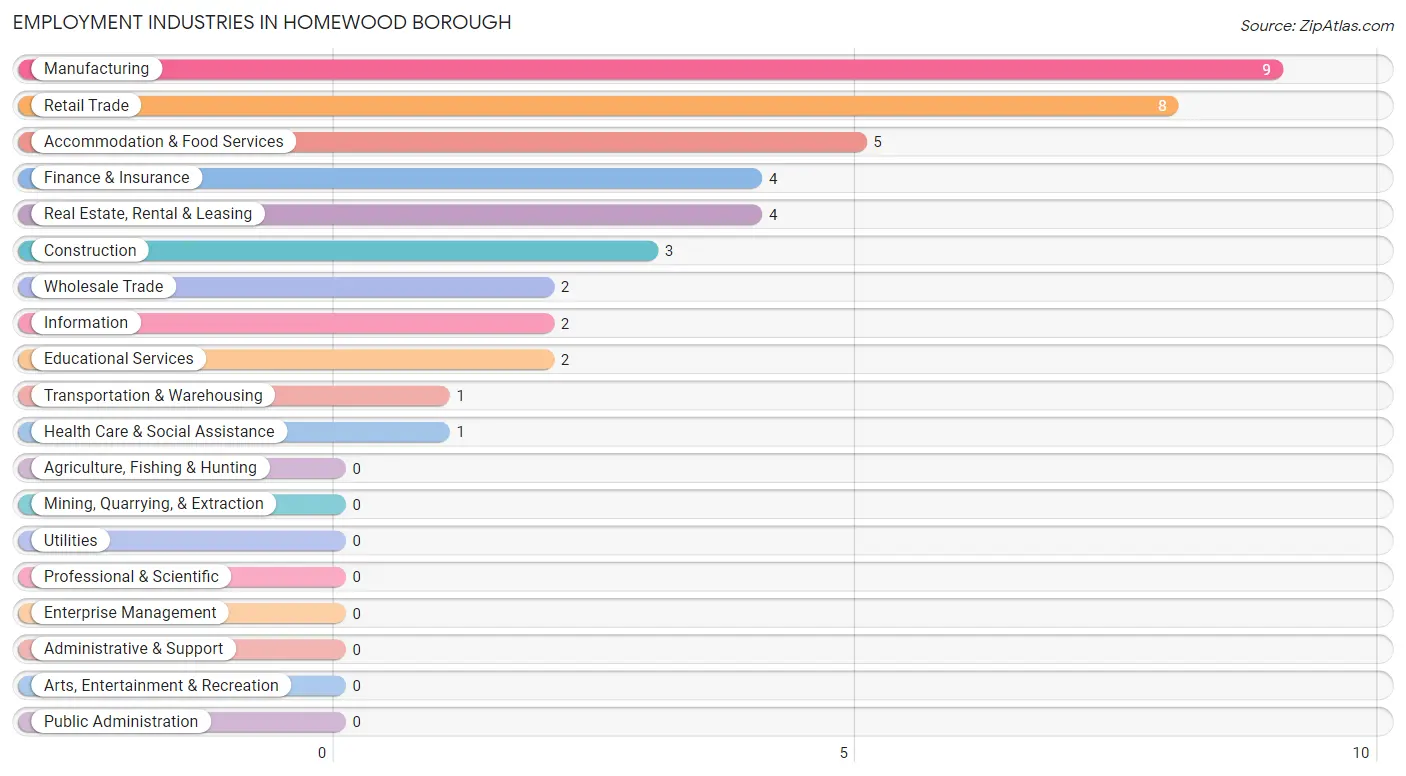
Employment Industries in Homewood borough
The major employment industries in Homewood borough include Manufacturing (9 | 22.0%), Retail Trade (8 | 19.5%), Accommodation & Food Services (5 | 12.2%), Finance & Insurance (4 | 9.8%), and Real Estate, Rental & Leasing (4 | 9.8%).
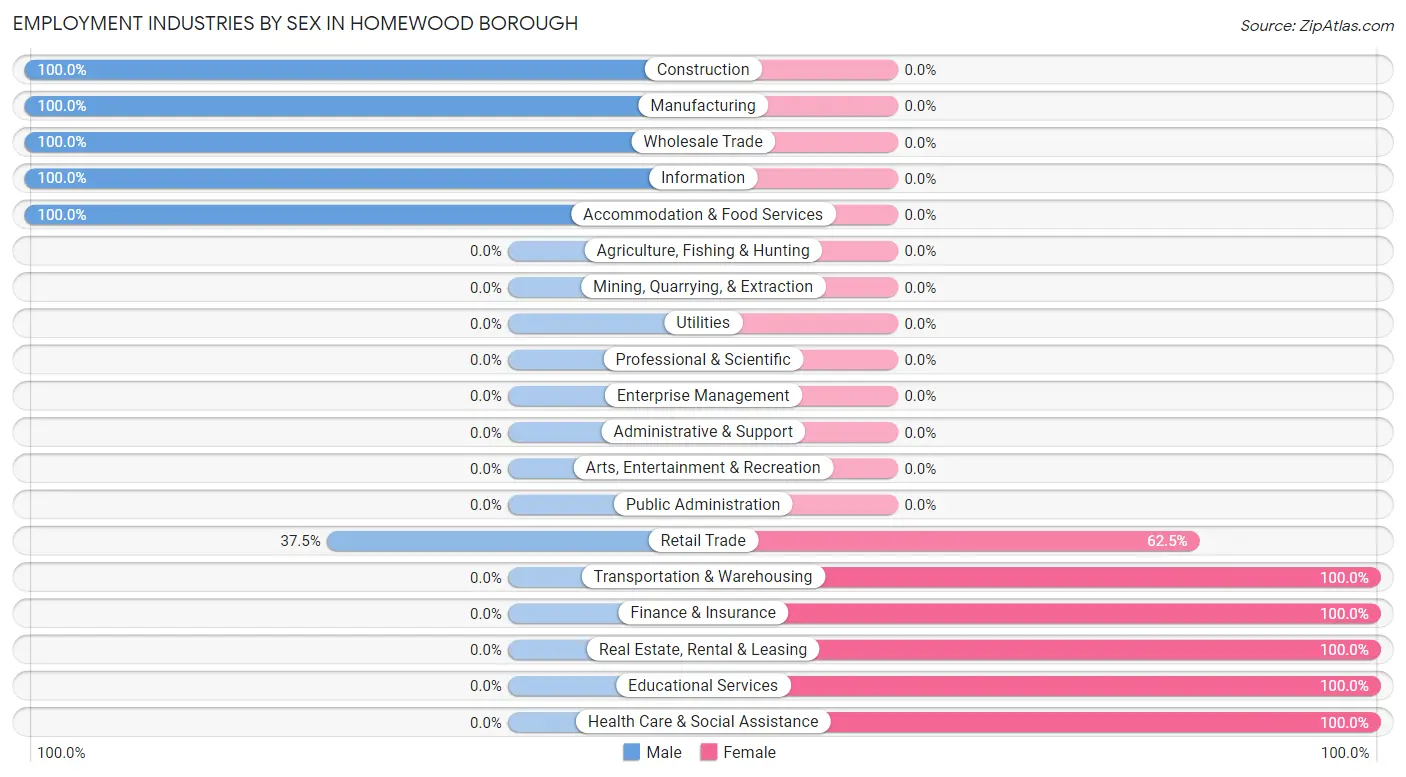
Employment Industries by Sex in Homewood borough
The Homewood borough industries that see more men than women are Construction (100.0%), Manufacturing (100.0%), and Wholesale Trade (100.0%), whereas the industries that tend to have a higher number of women are Transportation & Warehousing (100.0%), Finance & Insurance (100.0%), and Real Estate, Rental & Leasing (100.0%).
| Industry | Male | Female |
| Agriculture, Fishing & Hunting | 0 (0.0%) | 0 (0.0%) |
| Mining, Quarrying, & Extraction | 0 (0.0%) | 0 (0.0%) |
| Construction | 3 (100.0%) | 0 (0.0%) |
| Manufacturing | 9 (100.0%) | 0 (0.0%) |
| Wholesale Trade | 2 (100.0%) | 0 (0.0%) |
| Retail Trade | 3 (37.5%) | 5 (62.5%) |
| Transportation & Warehousing | 0 (0.0%) | 1 (100.0%) |
| Utilities | 0 (0.0%) | 0 (0.0%) |
| Information | 2 (100.0%) | 0 (0.0%) |
| Finance & Insurance | 0 (0.0%) | 4 (100.0%) |
| Real Estate, Rental & Leasing | 0 (0.0%) | 4 (100.0%) |
| Professional & Scientific | 0 (0.0%) | 0 (0.0%) |
| Enterprise Management | 0 (0.0%) | 0 (0.0%) |
| Administrative & Support | 0 (0.0%) | 0 (0.0%) |
| Educational Services | 0 (0.0%) | 2 (100.0%) |
| Health Care & Social Assistance | 0 (0.0%) | 1 (100.0%) |
| Arts, Entertainment & Recreation | 0 (0.0%) | 0 (0.0%) |
| Accommodation & Food Services | 5 (100.0%) | 0 (0.0%) |
| Public Administration | 0 (0.0%) | 0 (0.0%) |
| Total | 24 (58.5%) | 17 (41.5%) |
Education in Homewood borough
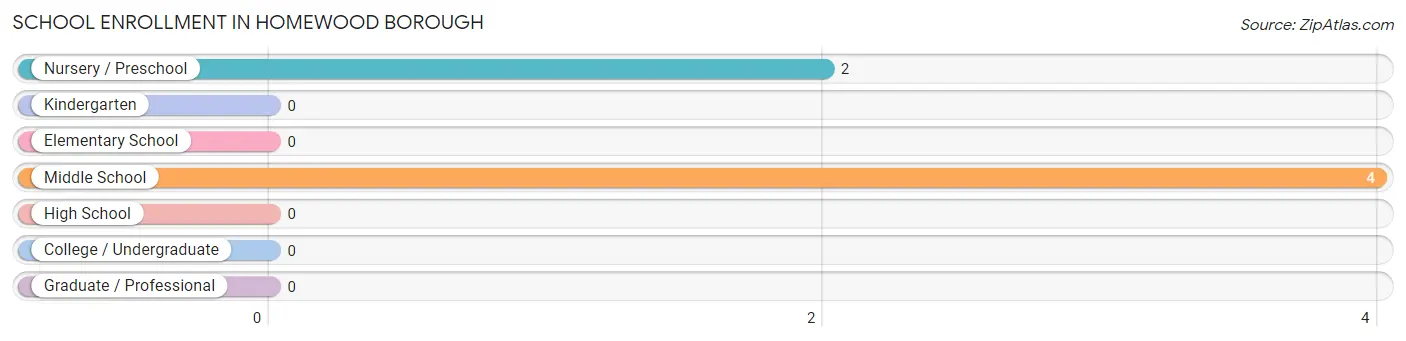
School Enrollment in Homewood borough
The most common levels of schooling among the 6 students in Homewood borough are middle school (4 | 66.7%), and nursery / preschool (2 | 33.3%).
| School Level | # Students | % Students |
| Nursery / Preschool | 2 | 33.3% |
| Kindergarten | 0 | 0.0% |
| Elementary School | 0 | 0.0% |
| Middle School | 4 | 66.7% |
| High School | 0 | 0.0% |
| College / Undergraduate | 0 | 0.0% |
| Graduate / Professional | 0 | 0.0% |
| Total | 6 | 100.0% |
School Enrollment by Age by Funding Source in Homewood borough
Out of a total of 6 students who are enrolled in schools in Homewood borough, 2 (33.3%) attend a private institution, while the remaining 4 (66.7%) are enrolled in public schools. The age group of 3 to 4 year olds has the highest likelihood of being enrolled in private schools, with 2 (100.0% in the age bracket) enrolled. Conversely, the age group of 10 to 14 year olds has the lowest likelihood of being enrolled in a private school, with 4 (100.0% in the age bracket) attending a public institution.
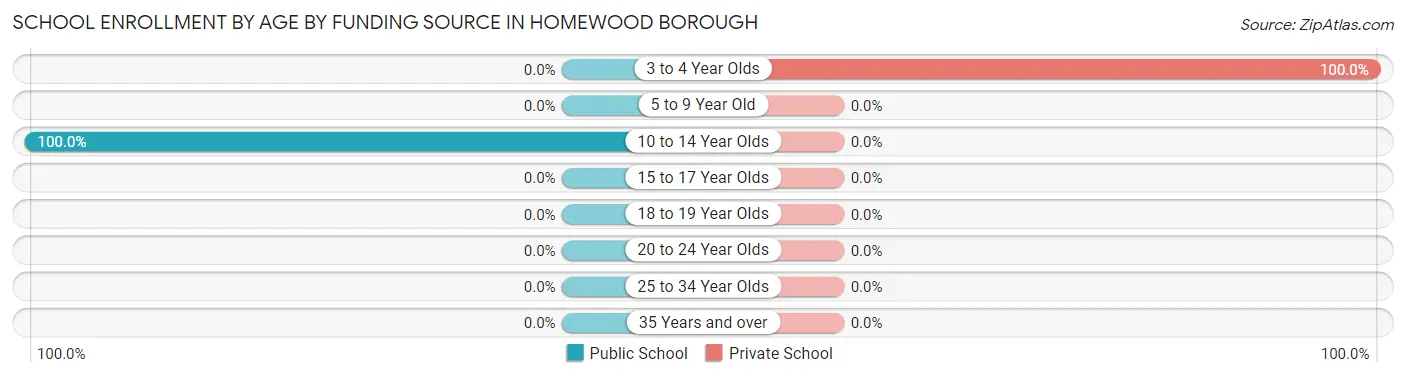
| Age Bracket | Public School | Private School |
| 3 to 4 Year Olds | 0 (0.0%) | 2 (100.0%) |
| 5 to 9 Year Old | 0 (0.0%) | 0 (0.0%) |
| 10 to 14 Year Olds | 4 (100.0%) | 0 (0.0%) |
| 15 to 17 Year Olds | 0 (0.0%) | 0 (0.0%) |
| 18 to 19 Year Olds | 0 (0.0%) | 0 (0.0%) |
| 20 to 24 Year Olds | 0 (0.0%) | 0 (0.0%) |
| 25 to 34 Year Olds | 0 (0.0%) | 0 (0.0%) |
| 35 Years and over | 0 (0.0%) | 0 (0.0%) |
| Total | 4 (66.7%) | 2 (33.3%) |
Educational Attainment by Field of Study in Homewood borough
Bio, nature & agricultural (4 | 30.8%), education (3 | 23.1%), science & technology (2 | 15.4%), business (2 | 15.4%), and arts & humanities (2 | 15.4%) are the most common fields of study among 13 individuals in Homewood borough who have obtained a bachelor's degree or higher.
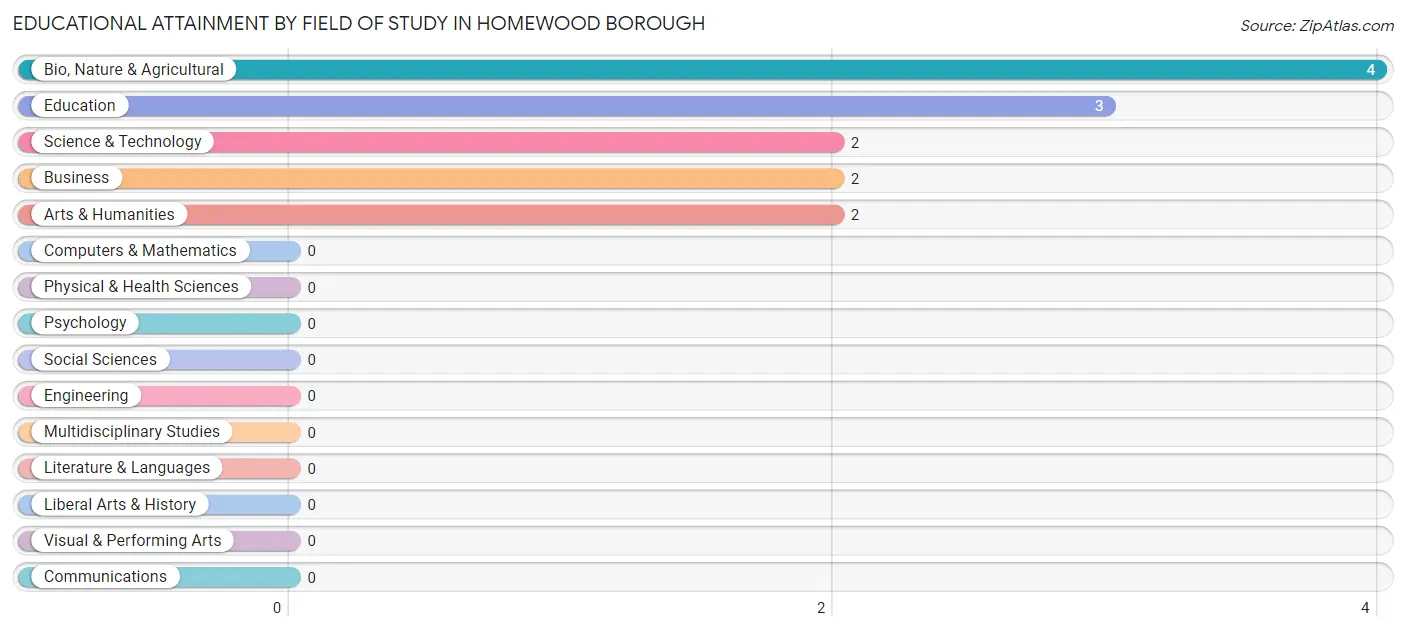
| Field of Study | # Graduates | % Graduates |
| Computers & Mathematics | 0 | 0.0% |
| Bio, Nature & Agricultural | 4 | 30.8% |
| Physical & Health Sciences | 0 | 0.0% |
| Psychology | 0 | 0.0% |
| Social Sciences | 0 | 0.0% |
| Engineering | 0 | 0.0% |
| Multidisciplinary Studies | 0 | 0.0% |
| Science & Technology | 2 | 15.4% |
| Business | 2 | 15.4% |
| Education | 3 | 23.1% |
| Literature & Languages | 0 | 0.0% |
| Liberal Arts & History | 0 | 0.0% |
| Visual & Performing Arts | 0 | 0.0% |
| Communications | 0 | 0.0% |
| Arts & Humanities | 2 | 15.4% |
| Total | 13 | 100.0% |
Transportation & Commute in Homewood borough
Vehicle Availability by Sex in Homewood borough
The most prevalent vehicle ownership categories in Homewood borough are males with 2 vehicles (10, accounting for 41.7%) and females with 2 vehicles (12, making up 58.8%).
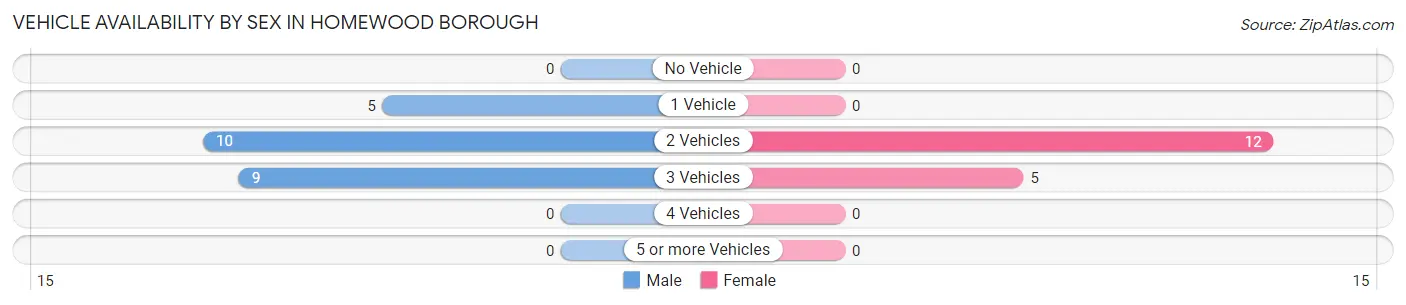
| Vehicles Available | Male | Female |
| No Vehicle | 0 (0.0%) | 0 (0.0%) |
| 1 Vehicle | 5 (20.8%) | 0 (0.0%) |
| 2 Vehicles | 10 (41.7%) | 12 (70.6%) |
| 3 Vehicles | 9 (37.5%) | 5 (29.4%) |
| 4 Vehicles | 0 (0.0%) | 0 (0.0%) |
| 5 or more Vehicles | 0 (0.0%) | 0 (0.0%) |
| Total | 24 (100.0%) | 17 (100.0%) |
Commute Time in Homewood borough
The most frequently occuring commute durations in Homewood borough are 30 to 34 minutes (15 commuters, 36.6%), 25 to 29 minutes (8 commuters, 19.5%), and 10 to 14 minutes (4 commuters, 9.8%).
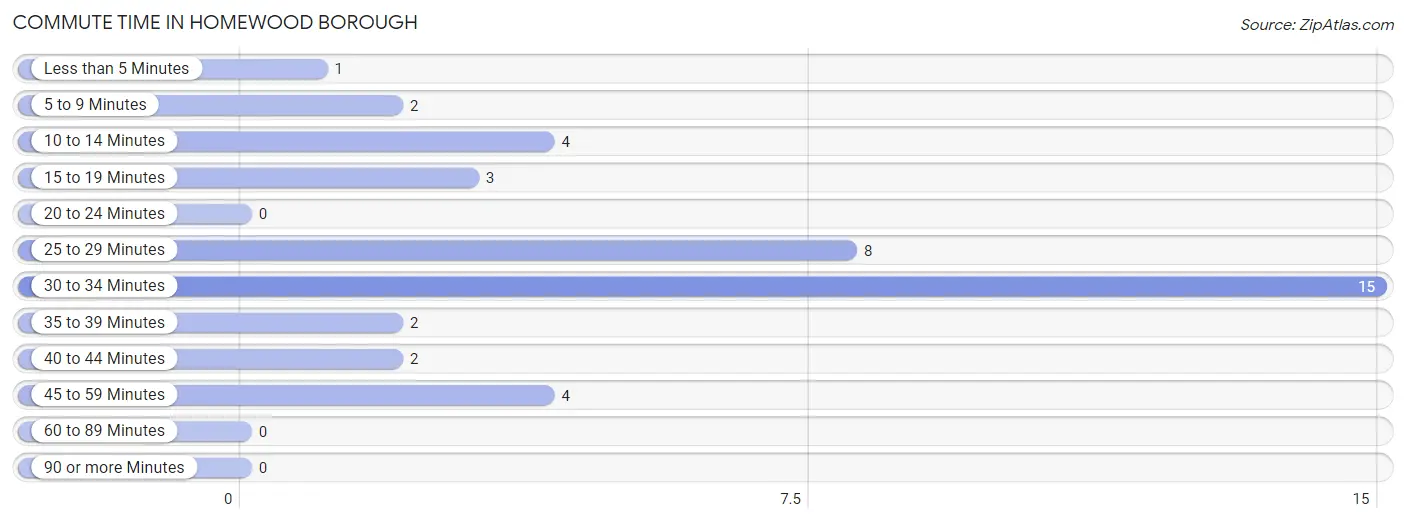
| Commute Time | # Commuters | % Commuters |
| Less than 5 Minutes | 1 | 2.4% |
| 5 to 9 Minutes | 2 | 4.9% |
| 10 to 14 Minutes | 4 | 9.8% |
| 15 to 19 Minutes | 3 | 7.3% |
| 20 to 24 Minutes | 0 | 0.0% |
| 25 to 29 Minutes | 8 | 19.5% |
| 30 to 34 Minutes | 15 | 36.6% |
| 35 to 39 Minutes | 2 | 4.9% |
| 40 to 44 Minutes | 2 | 4.9% |
| 45 to 59 Minutes | 4 | 9.8% |
| 60 to 89 Minutes | 0 | 0.0% |
| 90 or more Minutes | 0 | 0.0% |
Commute Time by Sex in Homewood borough
The most common commute times in Homewood borough are 25 to 29 minutes (8 commuters, 33.3%) for males and 30 to 34 minutes (7 commuters, 41.2%) for females.
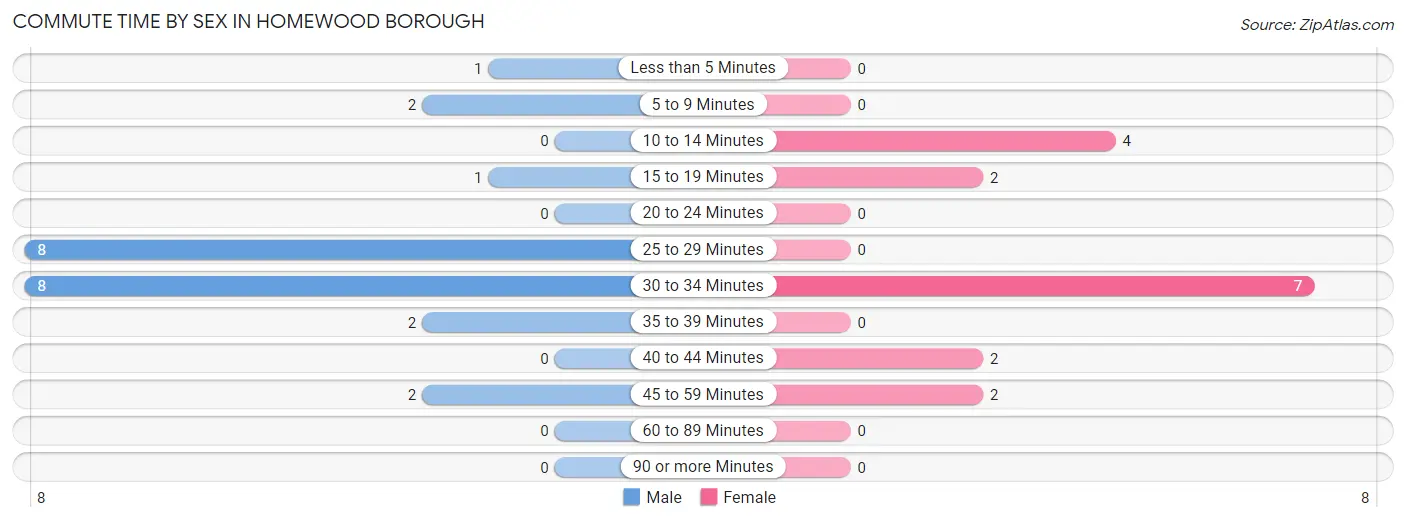
| Commute Time | Male | Female |
| Less than 5 Minutes | 1 (4.2%) | 0 (0.0%) |
| 5 to 9 Minutes | 2 (8.3%) | 0 (0.0%) |
| 10 to 14 Minutes | 0 (0.0%) | 4 (23.5%) |
| 15 to 19 Minutes | 1 (4.2%) | 2 (11.8%) |
| 20 to 24 Minutes | 0 (0.0%) | 0 (0.0%) |
| 25 to 29 Minutes | 8 (33.3%) | 0 (0.0%) |
| 30 to 34 Minutes | 8 (33.3%) | 7 (41.2%) |
| 35 to 39 Minutes | 2 (8.3%) | 0 (0.0%) |
| 40 to 44 Minutes | 0 (0.0%) | 2 (11.8%) |
| 45 to 59 Minutes | 2 (8.3%) | 2 (11.8%) |
| 60 to 89 Minutes | 0 (0.0%) | 0 (0.0%) |
| 90 or more Minutes | 0 (0.0%) | 0 (0.0%) |
Time of Departure to Work by Sex in Homewood borough
The most frequent times of departure to work in Homewood borough are 7:00 AM to 7:29 AM (8, 33.3%) for males and 8:00 AM to 8:29 AM (11, 64.7%) for females.
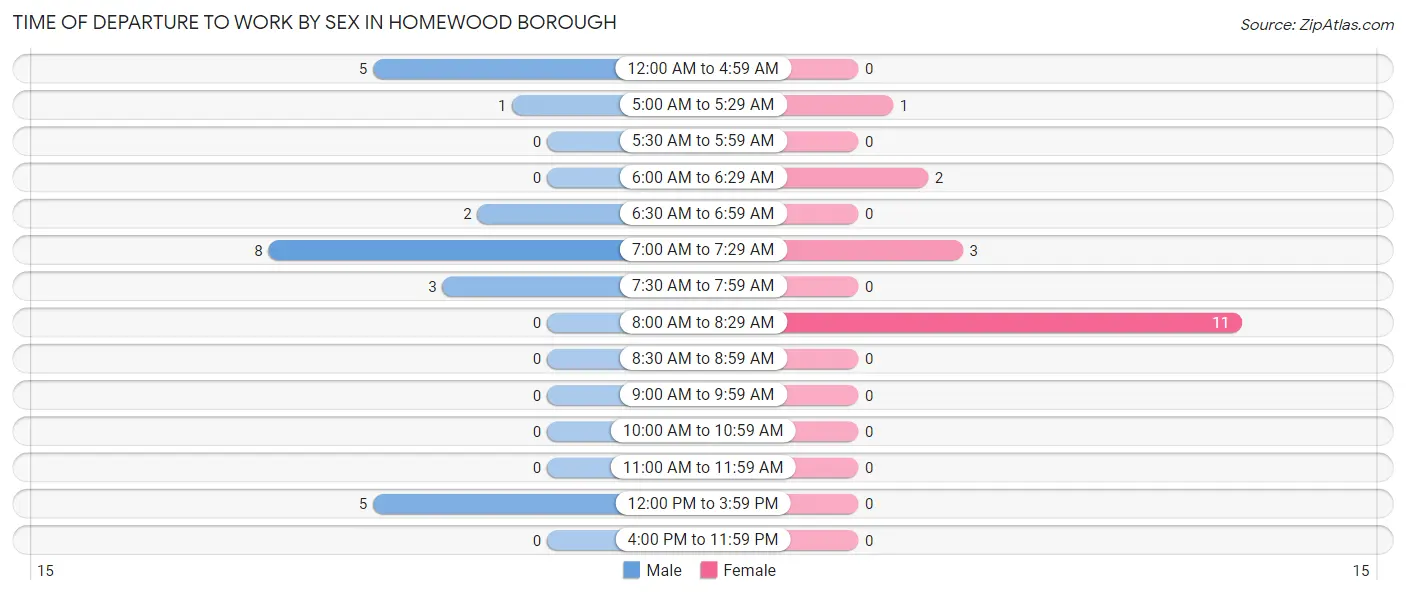
| Time of Departure | Male | Female |
| 12:00 AM to 4:59 AM | 5 (20.8%) | 0 (0.0%) |
| 5:00 AM to 5:29 AM | 1 (4.2%) | 1 (5.9%) |
| 5:30 AM to 5:59 AM | 0 (0.0%) | 0 (0.0%) |
| 6:00 AM to 6:29 AM | 0 (0.0%) | 2 (11.8%) |
| 6:30 AM to 6:59 AM | 2 (8.3%) | 0 (0.0%) |
| 7:00 AM to 7:29 AM | 8 (33.3%) | 3 (17.6%) |
| 7:30 AM to 7:59 AM | 3 (12.5%) | 0 (0.0%) |
| 8:00 AM to 8:29 AM | 0 (0.0%) | 11 (64.7%) |
| 8:30 AM to 8:59 AM | 0 (0.0%) | 0 (0.0%) |
| 9:00 AM to 9:59 AM | 0 (0.0%) | 0 (0.0%) |
| 10:00 AM to 10:59 AM | 0 (0.0%) | 0 (0.0%) |
| 11:00 AM to 11:59 AM | 0 (0.0%) | 0 (0.0%) |
| 12:00 PM to 3:59 PM | 5 (20.8%) | 0 (0.0%) |
| 4:00 PM to 11:59 PM | 0 (0.0%) | 0 (0.0%) |
| Total | 24 (100.0%) | 17 (100.0%) |
Housing Occupancy in Homewood borough
Occupancy by Ownership in Homewood borough
Of the total 47 dwellings in Homewood borough, owner-occupied units account for 34 (72.3%), while renter-occupied units make up 13 (27.7%).
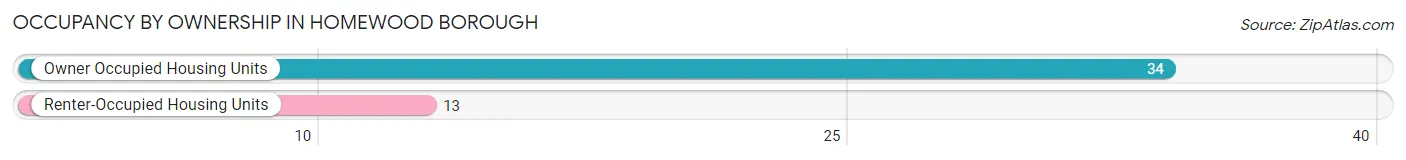
| Occupancy | # Housing Units | % Housing Units |
| Owner Occupied Housing Units | 34 | 72.3% |
| Renter-Occupied Housing Units | 13 | 27.7% |
| Total Occupied Housing Units | 47 | 100.0% |
Occupancy by Household Size in Homewood borough
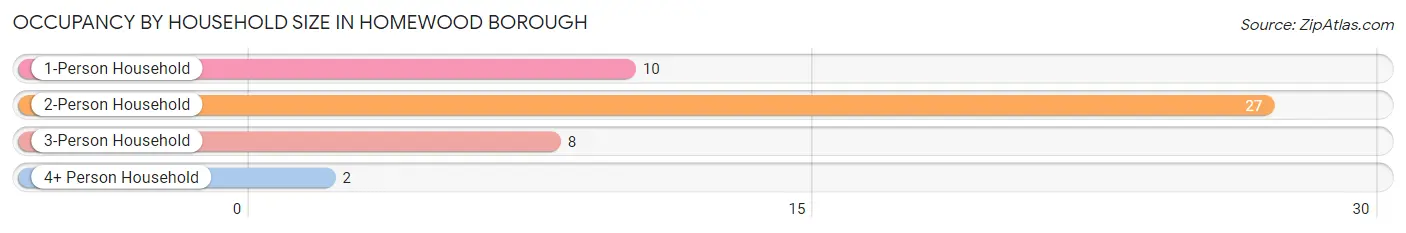
| Household Size | # Housing Units | % Housing Units |
| 1-Person Household | 10 | 21.3% |
| 2-Person Household | 27 | 57.5% |
| 3-Person Household | 8 | 17.0% |
| 4+ Person Household | 2 | 4.3% |
| Total Housing Units | 47 | 100.0% |
Occupancy by Ownership by Household Size in Homewood borough
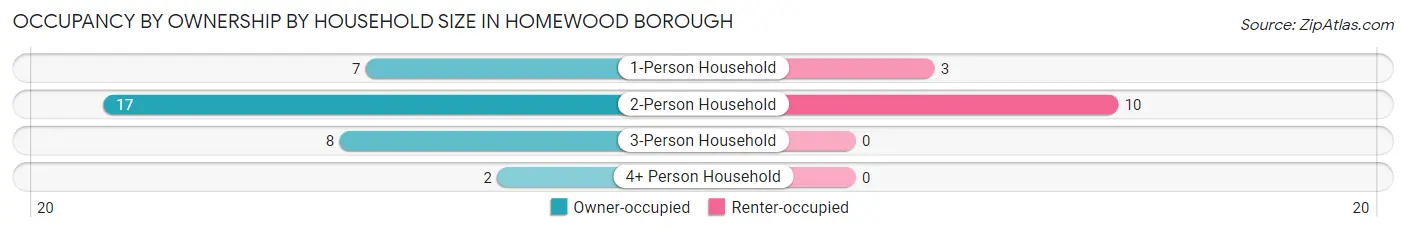
| Household Size | Owner-occupied | Renter-occupied |
| 1-Person Household | 7 (70.0%) | 3 (30.0%) |
| 2-Person Household | 17 (63.0%) | 10 (37.0%) |
| 3-Person Household | 8 (100.0%) | 0 (0.0%) |
| 4+ Person Household | 2 (100.0%) | 0 (0.0%) |
| Total Housing Units | 34 (72.3%) | 13 (27.7%) |
Occupancy by Educational Attainment in Homewood borough
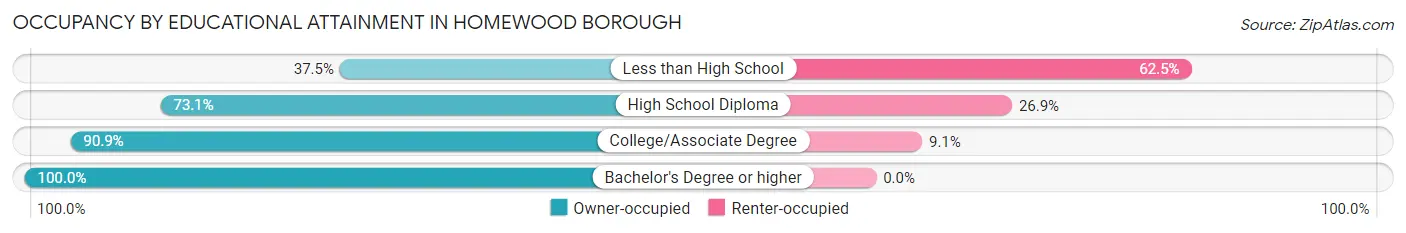
| Household Size | Owner-occupied | Renter-occupied |
| Less than High School | 3 (37.5%) | 5 (62.5%) |
| High School Diploma | 19 (73.1%) | 7 (26.9%) |
| College/Associate Degree | 10 (90.9%) | 1 (9.1%) |
| Bachelor's Degree or higher | 2 (100.0%) | 0 (0.0%) |
Occupancy by Age of Householder in Homewood borough
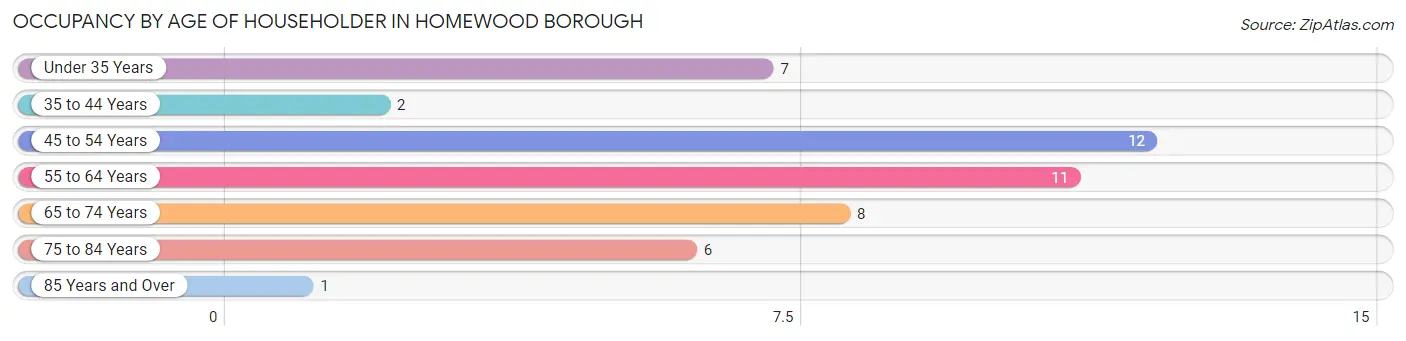
| Age Bracket | # Households | % Households |
| Under 35 Years | 7 | 14.9% |
| 35 to 44 Years | 2 | 4.3% |
| 45 to 54 Years | 12 | 25.5% |
| 55 to 64 Years | 11 | 23.4% |
| 65 to 74 Years | 8 | 17.0% |
| 75 to 84 Years | 6 | 12.8% |
| 85 Years and Over | 1 | 2.1% |
| Total | 47 | 100.0% |
Housing Finances in Homewood borough
Median Income by Occupancy in Homewood borough
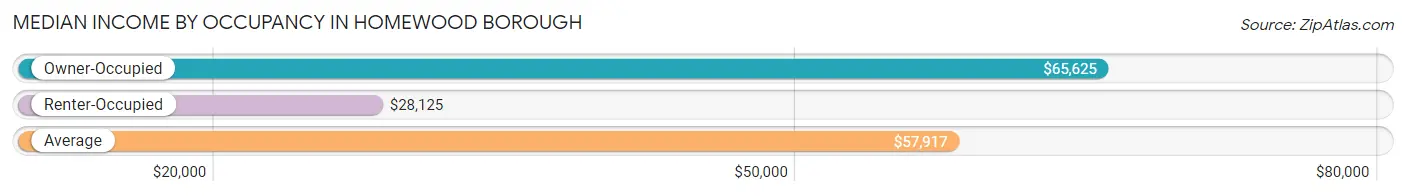
| Occupancy Type | # Households | Median Income |
| Owner-Occupied | 34 (72.3%) | $65,625 |
| Renter-Occupied | 13 (27.7%) | $28,125 |
| Average | 47 (100.0%) | $57,917 |
Occupancy by Householder Income Bracket in Homewood borough
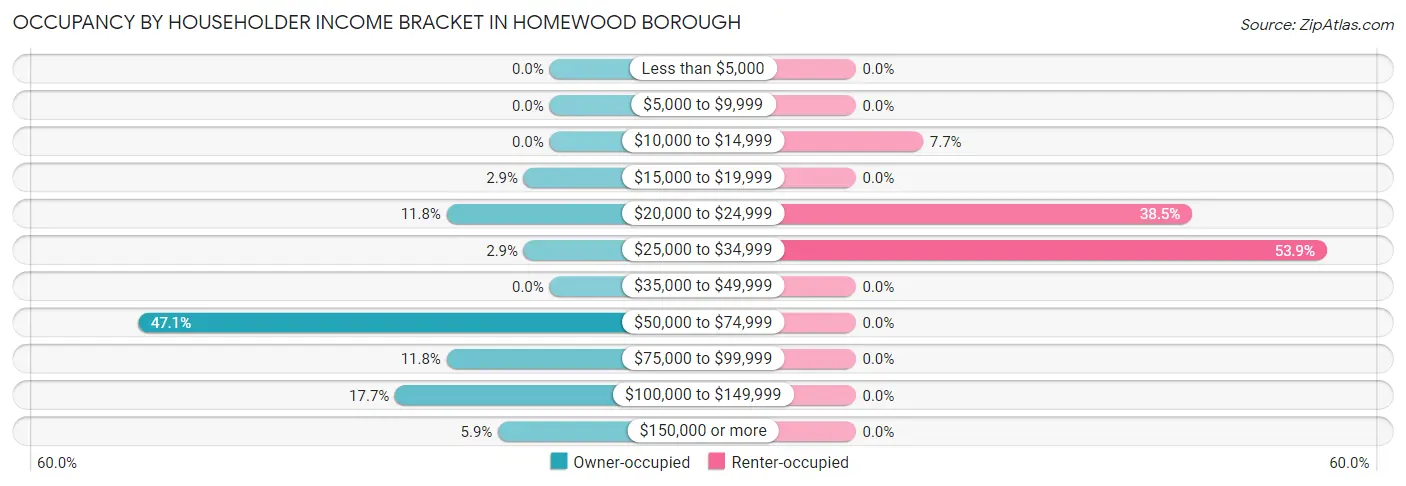
| Income Bracket | Owner-occupied | Renter-occupied |
| Less than $5,000 | 0 (0.0%) | 0 (0.0%) |
| $5,000 to $9,999 | 0 (0.0%) | 0 (0.0%) |
| $10,000 to $14,999 | 0 (0.0%) | 1 (7.7%) |
| $15,000 to $19,999 | 1 (2.9%) | 0 (0.0%) |
| $20,000 to $24,999 | 4 (11.8%) | 5 (38.5%) |
| $25,000 to $34,999 | 1 (2.9%) | 7 (53.8%) |
| $35,000 to $49,999 | 0 (0.0%) | 0 (0.0%) |
| $50,000 to $74,999 | 16 (47.1%) | 0 (0.0%) |
| $75,000 to $99,999 | 4 (11.8%) | 0 (0.0%) |
| $100,000 to $149,999 | 6 (17.6%) | 0 (0.0%) |
| $150,000 or more | 2 (5.9%) | 0 (0.0%) |
| Total | 34 (100.0%) | 13 (100.0%) |
Monthly Housing Cost Tiers in Homewood borough
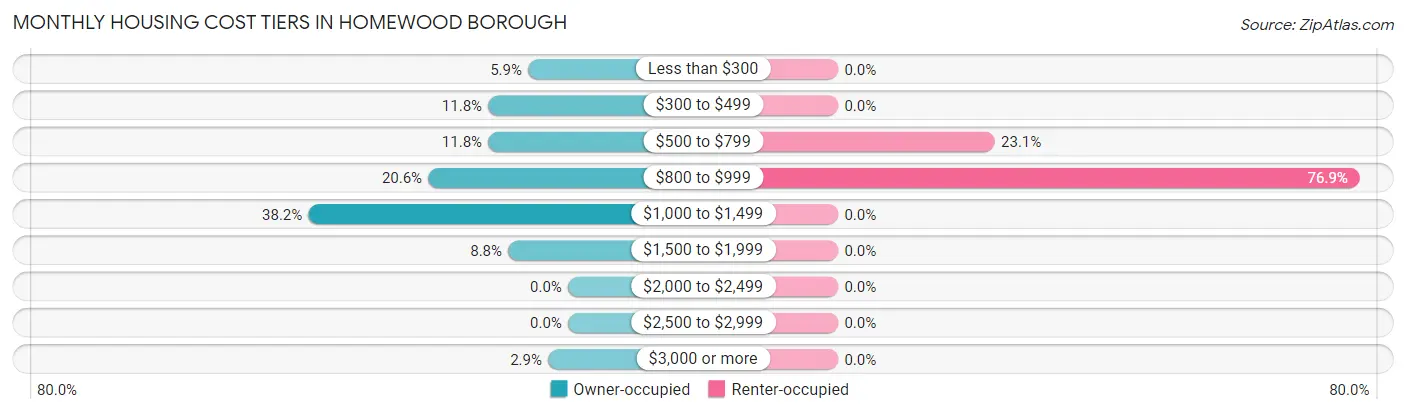
| Monthly Cost | Owner-occupied | Renter-occupied |
| Less than $300 | 2 (5.9%) | 0 (0.0%) |
| $300 to $499 | 4 (11.8%) | 0 (0.0%) |
| $500 to $799 | 4 (11.8%) | 3 (23.1%) |
| $800 to $999 | 7 (20.6%) | 10 (76.9%) |
| $1,000 to $1,499 | 13 (38.2%) | 0 (0.0%) |
| $1,500 to $1,999 | 3 (8.8%) | 0 (0.0%) |
| $2,000 to $2,499 | 0 (0.0%) | 0 (0.0%) |
| $2,500 to $2,999 | 0 (0.0%) | 0 (0.0%) |
| $3,000 or more | 1 (2.9%) | 0 (0.0%) |
| Total | 34 (100.0%) | 13 (100.0%) |
Physical Housing Characteristics in Homewood borough
Housing Structures in Homewood borough
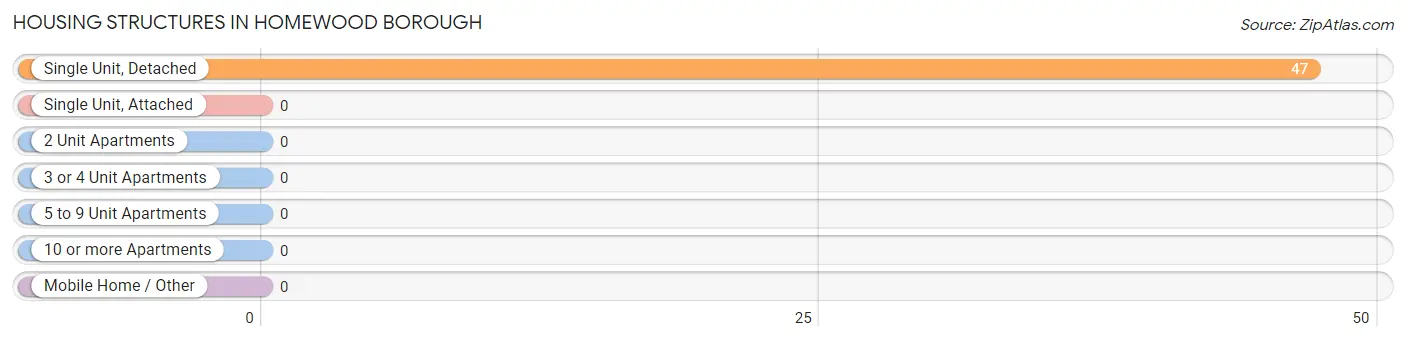
| Structure Type | # Housing Units | % Housing Units |
| Single Unit, Detached | 47 | 100.0% |
| Single Unit, Attached | 0 | 0.0% |
| 2 Unit Apartments | 0 | 0.0% |
| 3 or 4 Unit Apartments | 0 | 0.0% |
| 5 to 9 Unit Apartments | 0 | 0.0% |
| 10 or more Apartments | 0 | 0.0% |
| Mobile Home / Other | 0 | 0.0% |
| Total | 47 | 100.0% |
Housing Structures by Occupancy in Homewood borough
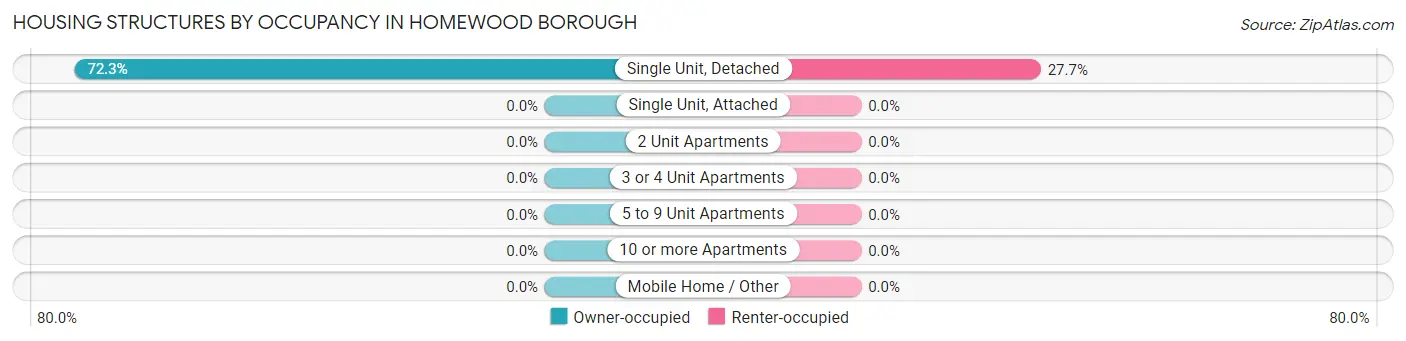
| Structure Type | Owner-occupied | Renter-occupied |
| Single Unit, Detached | 34 (72.3%) | 13 (27.7%) |
| Single Unit, Attached | 0 (0.0%) | 0 (0.0%) |
| 2 Unit Apartments | 0 (0.0%) | 0 (0.0%) |
| 3 or 4 Unit Apartments | 0 (0.0%) | 0 (0.0%) |
| 5 to 9 Unit Apartments | 0 (0.0%) | 0 (0.0%) |
| 10 or more Apartments | 0 (0.0%) | 0 (0.0%) |
| Mobile Home / Other | 0 (0.0%) | 0 (0.0%) |
| Total | 34 (72.3%) | 13 (27.7%) |
Housing Structures by Number of Rooms in Homewood borough
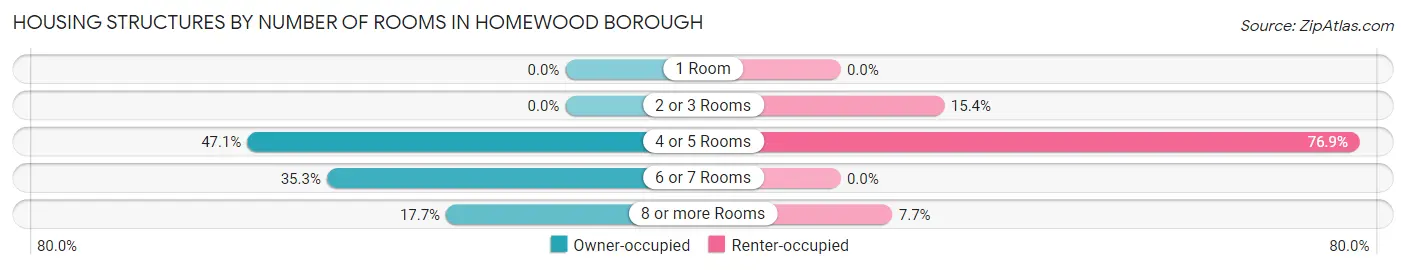
| Number of Rooms | Owner-occupied | Renter-occupied |
| 1 Room | 0 (0.0%) | 0 (0.0%) |
| 2 or 3 Rooms | 0 (0.0%) | 2 (15.4%) |
| 4 or 5 Rooms | 16 (47.1%) | 10 (76.9%) |
| 6 or 7 Rooms | 12 (35.3%) | 0 (0.0%) |
| 8 or more Rooms | 6 (17.6%) | 1 (7.7%) |
| Total | 34 (100.0%) | 13 (100.0%) |
Housing Structure by Heating Type in Homewood borough

| Heating Type | Owner-occupied | Renter-occupied |
| Utility Gas | 25 (73.5%) | 8 (61.5%) |
| Bottled, Tank, or LP Gas | 0 (0.0%) | 0 (0.0%) |
| Electricity | 8 (23.5%) | 5 (38.5%) |
| Fuel Oil or Kerosene | 1 (2.9%) | 0 (0.0%) |
| Coal or Coke | 0 (0.0%) | 0 (0.0%) |
| All other Fuels | 0 (0.0%) | 0 (0.0%) |
| No Fuel Used | 0 (0.0%) | 0 (0.0%) |
| Total | 34 (100.0%) | 13 (100.0%) |
Household Vehicle Usage in Homewood borough
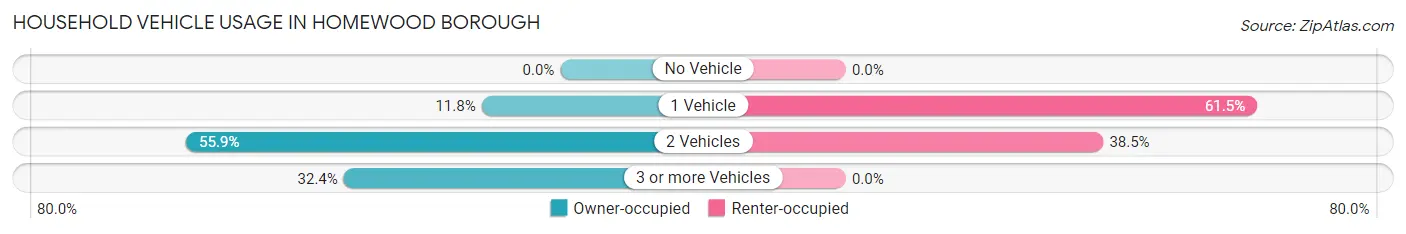
| Vehicles per Household | Owner-occupied | Renter-occupied |
| No Vehicle | 0 (0.0%) | 0 (0.0%) |
| 1 Vehicle | 4 (11.8%) | 8 (61.5%) |
| 2 Vehicles | 19 (55.9%) | 5 (38.5%) |
| 3 or more Vehicles | 11 (32.4%) | 0 (0.0%) |
| Total | 34 (100.0%) | 13 (100.0%) |
Real Estate & Mortgages in Homewood borough
Real Estate and Mortgage Overview in Homewood borough
| Characteristic | Without Mortgage | With Mortgage |
| Housing Units | 9 | 25 |
| Median Property Value | $106,300 | $121,900 |
| Median Household Income | $73,750 | $2 |
| Monthly Housing Costs | $425 | $1 |
| Real Estate Taxes | $1,083 | $3 |
Property Value by Mortgage Status in Homewood borough
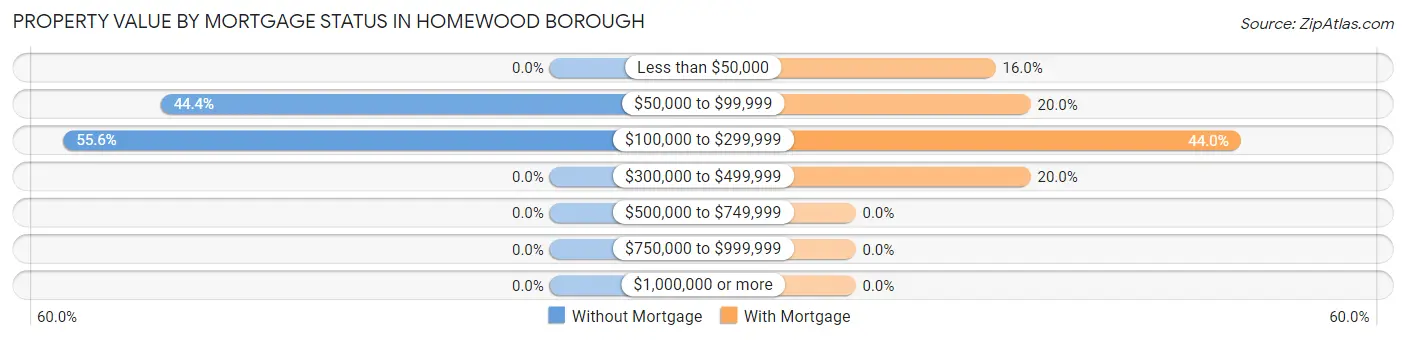
| Property Value | Without Mortgage | With Mortgage |
| Less than $50,000 | 0 (0.0%) | 4 (16.0%) |
| $50,000 to $99,999 | 4 (44.4%) | 5 (20.0%) |
| $100,000 to $299,999 | 5 (55.6%) | 11 (44.0%) |
| $300,000 to $499,999 | 0 (0.0%) | 5 (20.0%) |
| $500,000 to $749,999 | 0 (0.0%) | 0 (0.0%) |
| $750,000 to $999,999 | 0 (0.0%) | 0 (0.0%) |
| $1,000,000 or more | 0 (0.0%) | 0 (0.0%) |
| Total | 9 (100.0%) | 25 (100.0%) |
Household Income by Mortgage Status in Homewood borough
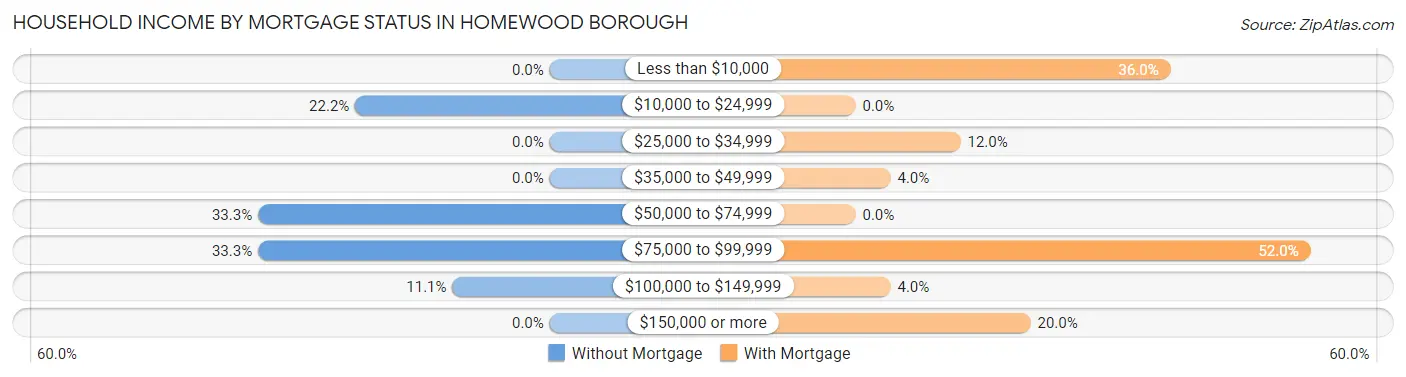
| Household Income | Without Mortgage | With Mortgage |
| Less than $10,000 | 0 (0.0%) | 9 (36.0%) |
| $10,000 to $24,999 | 2 (22.2%) | 0 (0.0%) |
| $25,000 to $34,999 | 0 (0.0%) | 3 (12.0%) |
| $35,000 to $49,999 | 0 (0.0%) | 1 (4.0%) |
| $50,000 to $74,999 | 3 (33.3%) | 0 (0.0%) |
| $75,000 to $99,999 | 3 (33.3%) | 13 (52.0%) |
| $100,000 to $149,999 | 1 (11.1%) | 1 (4.0%) |
| $150,000 or more | 0 (0.0%) | 5 (20.0%) |
| Total | 9 (100.0%) | 25 (100.0%) |
Property Value to Household Income Ratio in Homewood borough
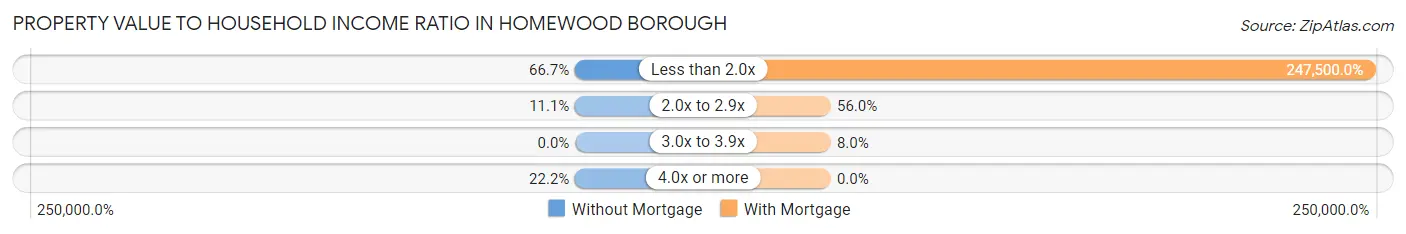
| Value-to-Income Ratio | Without Mortgage | With Mortgage |
| Less than 2.0x | 6 (66.7%) | 61,875 (247,500.0%) |
| 2.0x to 2.9x | 1 (11.1%) | 14 (56.0%) |
| 3.0x to 3.9x | 0 (0.0%) | 2 (8.0%) |
| 4.0x or more | 2 (22.2%) | 0 (0.0%) |
| Total | 9 (100.0%) | 25 (100.0%) |
Real Estate Taxes by Mortgage Status in Homewood borough
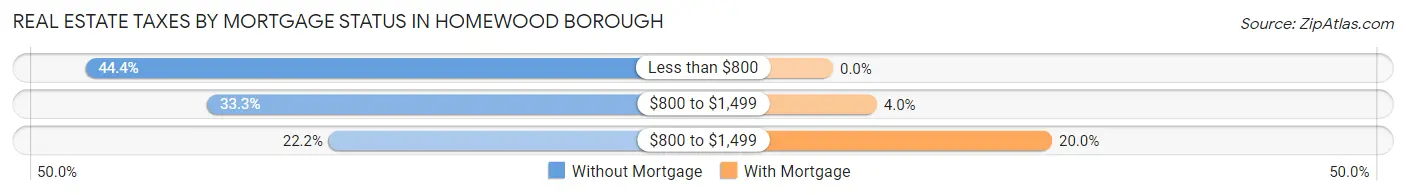
| Property Taxes | Without Mortgage | With Mortgage |
| Less than $800 | 4 (44.4%) | 0 (0.0%) |
| $800 to $1,499 | 3 (33.3%) | 1 (4.0%) |
| $800 to $1,499 | 2 (22.2%) | 5 (20.0%) |
| Total | 9 (100.0%) | 25 (100.0%) |
Health & Disability in Homewood borough
Health Insurance Coverage by Age in Homewood borough
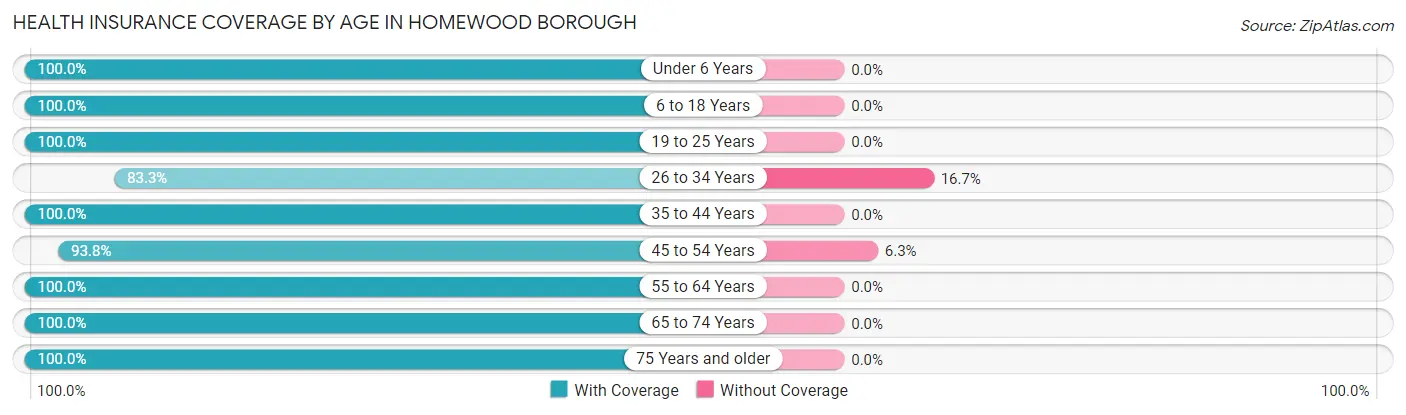
| Age Bracket | With Coverage | Without Coverage |
| Under 6 Years | 2 (100.0%) | 0 (0.0%) |
| 6 to 18 Years | 9 (100.0%) | 0 (0.0%) |
| 19 to 25 Years | 6 (100.0%) | 0 (0.0%) |
| 26 to 34 Years | 10 (83.3%) | 2 (16.7%) |
| 35 to 44 Years | 12 (100.0%) | 0 (0.0%) |
| 45 to 54 Years | 15 (93.8%) | 1 (6.2%) |
| 55 to 64 Years | 12 (100.0%) | 0 (0.0%) |
| 65 to 74 Years | 19 (100.0%) | 0 (0.0%) |
| 75 Years and older | 8 (100.0%) | 0 (0.0%) |
| Total | 93 (96.9%) | 3 (3.1%) |
Health Insurance Coverage by Citizenship Status in Homewood borough
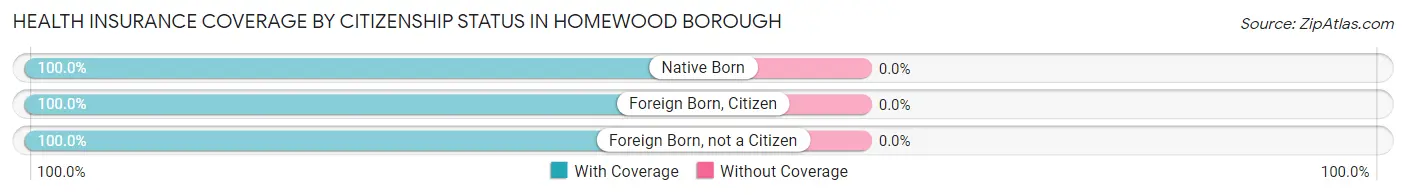
| Citizenship Status | With Coverage | Without Coverage |
| Native Born | 2 (100.0%) | 0 (0.0%) |
| Foreign Born, Citizen | 9 (100.0%) | 0 (0.0%) |
| Foreign Born, not a Citizen | 6 (100.0%) | 0 (0.0%) |
Health Insurance Coverage by Household Income in Homewood borough
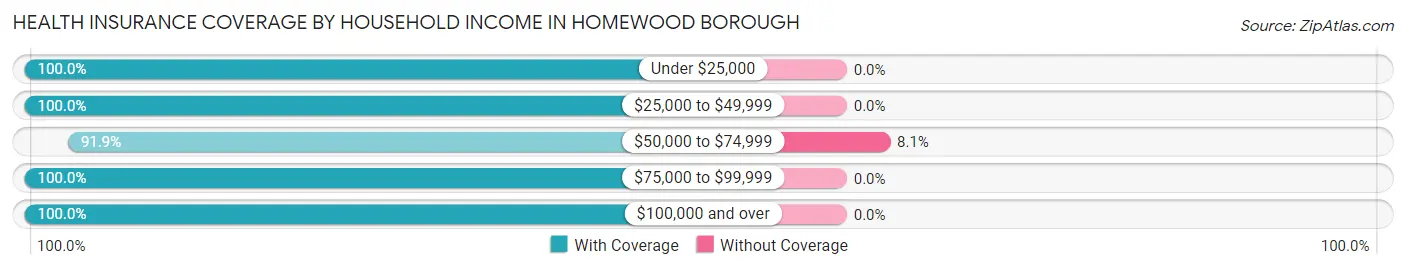
| Household Income | With Coverage | Without Coverage |
| Under $25,000 | 16 (100.0%) | 0 (0.0%) |
| $25,000 to $49,999 | 13 (100.0%) | 0 (0.0%) |
| $50,000 to $74,999 | 34 (91.9%) | 3 (8.1%) |
| $75,000 to $99,999 | 10 (100.0%) | 0 (0.0%) |
| $100,000 and over | 20 (100.0%) | 0 (0.0%) |
Public vs Private Health Insurance Coverage by Age in Homewood borough
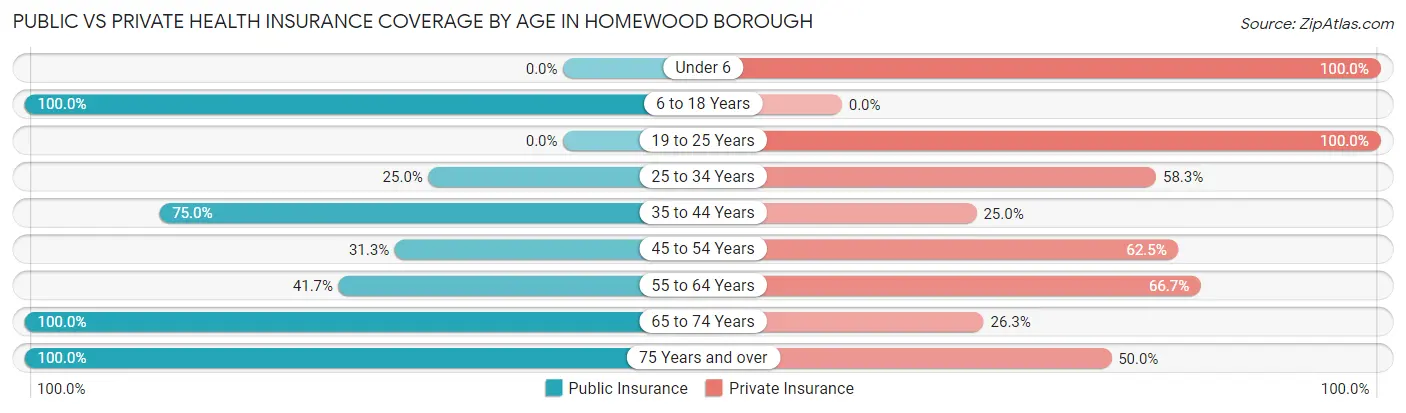
| Age Bracket | Public Insurance | Private Insurance |
| Under 6 | 0 (0.0%) | 2 (100.0%) |
| 6 to 18 Years | 9 (100.0%) | 0 (0.0%) |
| 19 to 25 Years | 0 (0.0%) | 6 (100.0%) |
| 25 to 34 Years | 3 (25.0%) | 7 (58.3%) |
| 35 to 44 Years | 9 (75.0%) | 3 (25.0%) |
| 45 to 54 Years | 5 (31.2%) | 10 (62.5%) |
| 55 to 64 Years | 5 (41.7%) | 8 (66.7%) |
| 65 to 74 Years | 19 (100.0%) | 5 (26.3%) |
| 75 Years and over | 8 (100.0%) | 4 (50.0%) |
| Total | 58 (60.4%) | 45 (46.9%) |
Disability Status by Sex by Age in Homewood borough
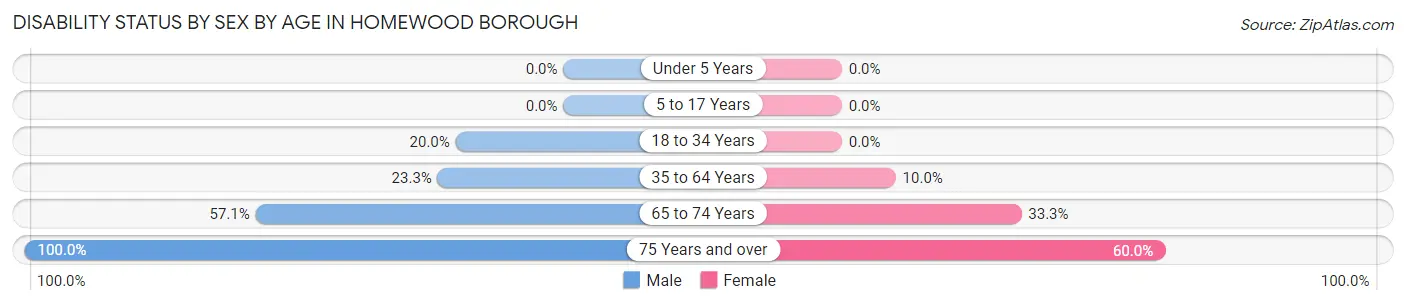
| Age Bracket | Male | Female |
| Under 5 Years | 0 (0.0%) | 0 (0.0%) |
| 5 to 17 Years | 0 (0.0%) | 0 (0.0%) |
| 18 to 34 Years | 2 (20.0%) | 0 (0.0%) |
| 35 to 64 Years | 7 (23.3%) | 1 (10.0%) |
| 65 to 74 Years | 4 (57.1%) | 4 (33.3%) |
| 75 Years and over | 3 (100.0%) | 3 (60.0%) |
Disability Class by Sex by Age in Homewood borough
Disability Class: Hearing Difficulty
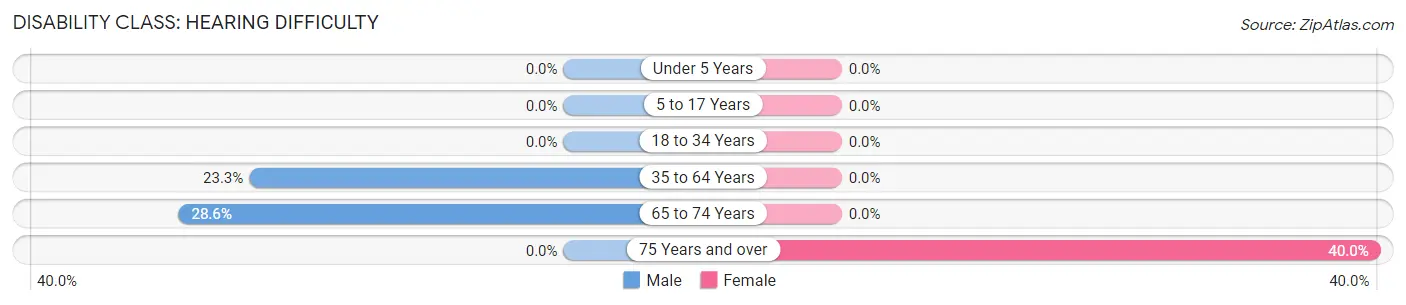
| Age Bracket | Male | Female |
| Under 5 Years | 0 (0.0%) | 0 (0.0%) |
| 5 to 17 Years | 0 (0.0%) | 0 (0.0%) |
| 18 to 34 Years | 0 (0.0%) | 0 (0.0%) |
| 35 to 64 Years | 7 (23.3%) | 0 (0.0%) |
| 65 to 74 Years | 2 (28.6%) | 0 (0.0%) |
| 75 Years and over | 0 (0.0%) | 2 (40.0%) |
Disability Class: Vision Difficulty
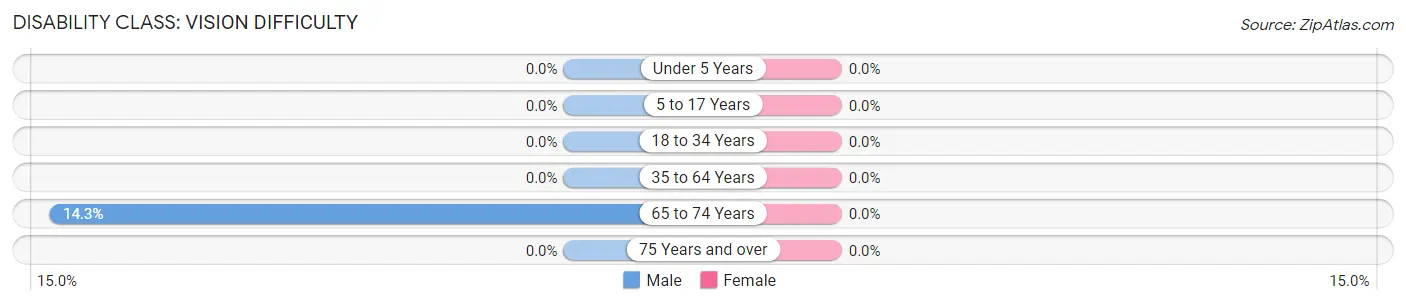
| Age Bracket | Male | Female |
| Under 5 Years | 0 (0.0%) | 0 (0.0%) |
| 5 to 17 Years | 0 (0.0%) | 0 (0.0%) |
| 18 to 34 Years | 0 (0.0%) | 0 (0.0%) |
| 35 to 64 Years | 0 (0.0%) | 0 (0.0%) |
| 65 to 74 Years | 1 (14.3%) | 0 (0.0%) |
| 75 Years and over | 0 (0.0%) | 0 (0.0%) |
Disability Class: Cognitive Difficulty
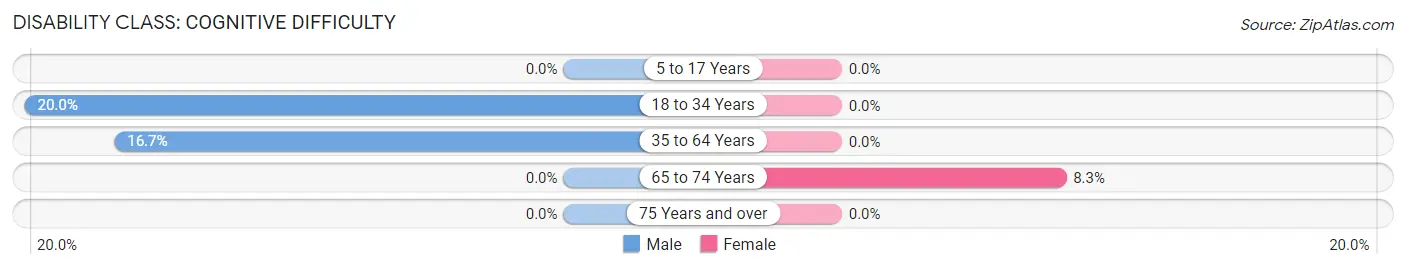
| Age Bracket | Male | Female |
| 5 to 17 Years | 0 (0.0%) | 0 (0.0%) |
| 18 to 34 Years | 2 (20.0%) | 0 (0.0%) |
| 35 to 64 Years | 5 (16.7%) | 0 (0.0%) |
| 65 to 74 Years | 0 (0.0%) | 1 (8.3%) |
| 75 Years and over | 0 (0.0%) | 0 (0.0%) |
Disability Class: Ambulatory Difficulty
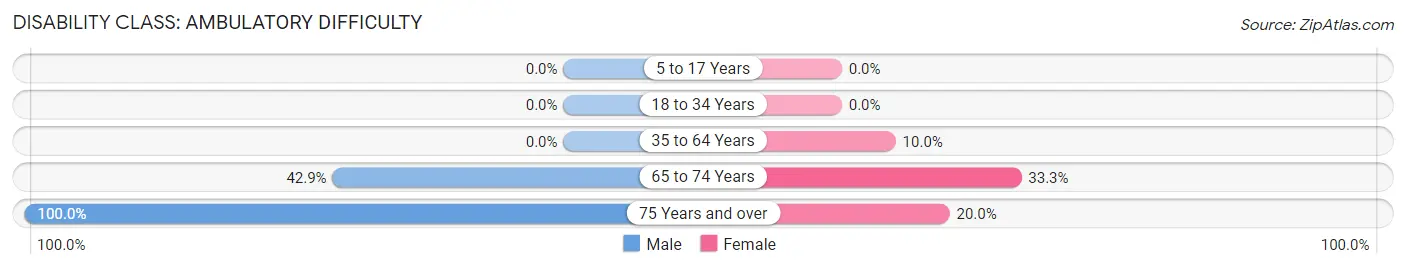
| Age Bracket | Male | Female |
| 5 to 17 Years | 0 (0.0%) | 0 (0.0%) |
| 18 to 34 Years | 0 (0.0%) | 0 (0.0%) |
| 35 to 64 Years | 0 (0.0%) | 1 (10.0%) |
| 65 to 74 Years | 3 (42.9%) | 4 (33.3%) |
| 75 Years and over | 3 (100.0%) | 1 (20.0%) |
Disability Class: Self-Care Difficulty
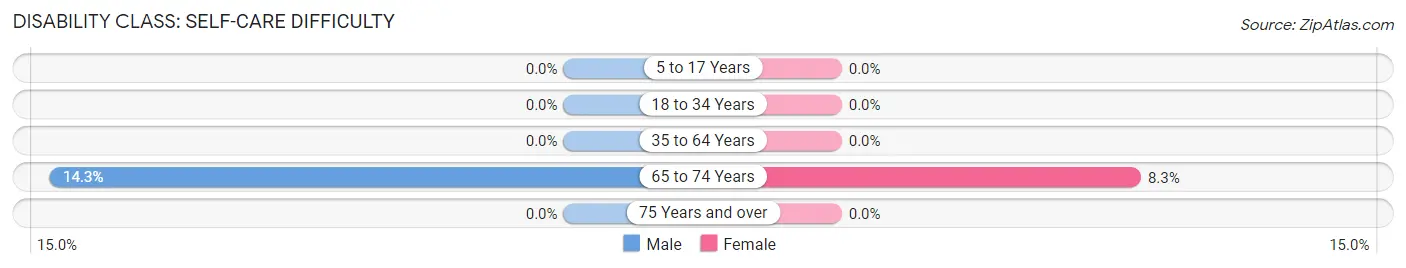
| Age Bracket | Male | Female |
| 5 to 17 Years | 0 (0.0%) | 0 (0.0%) |
| 18 to 34 Years | 0 (0.0%) | 0 (0.0%) |
| 35 to 64 Years | 0 (0.0%) | 0 (0.0%) |
| 65 to 74 Years | 1 (14.3%) | 1 (8.3%) |
| 75 Years and over | 0 (0.0%) | 0 (0.0%) |
Technology Access in Homewood borough
Computing Device Access in Homewood borough
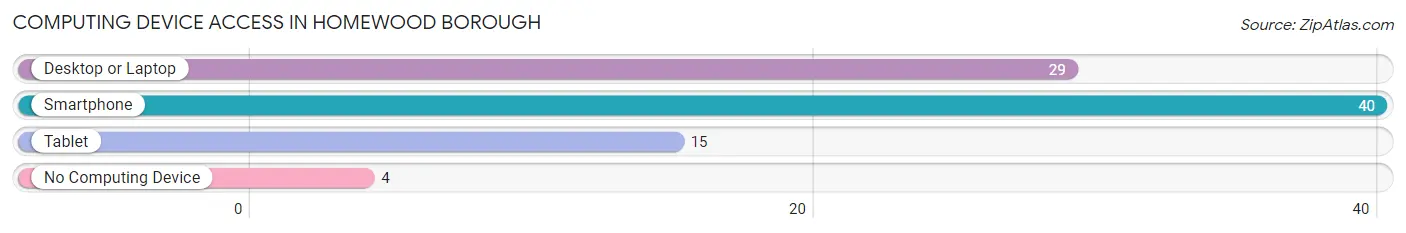
| Device Type | # Households | % Households |
| Desktop or Laptop | 29 | 61.7% |
| Smartphone | 40 | 85.1% |
| Tablet | 15 | 31.9% |
| No Computing Device | 4 | 8.5% |
| Total | 47 | 100.0% |
Internet Access in Homewood borough
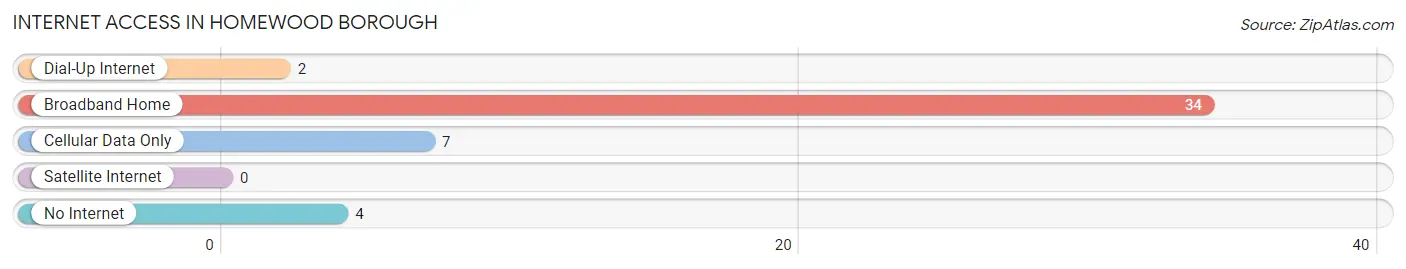
| Internet Type | # Households | % Households |
| Dial-Up Internet | 2 | 4.3% |
| Broadband Home | 34 | 72.3% |
| Cellular Data Only | 7 | 14.9% |
| Satellite Internet | 0 | 0.0% |
| No Internet | 4 | 8.5% |
| Total | 47 | 100.0% |
Homewood borough Summary
Homewood Borough is a small borough located in Allegheny County, Pennsylvania. It is situated in the eastern suburbs of Pittsburgh, and is part of the Pittsburgh Metropolitan Statistical Area. The borough was incorporated in 1868, and is home to a population of approximately 1,400 people.
Geography
Homewood Borough is located in the eastern suburbs of Pittsburgh, and is situated in the Allegheny Plateau region of Pennsylvania. The borough is bordered by Wilkinsburg to the north, Edgewood to the east, Swissvale to the south, and Point Breeze to the west. The borough is situated on a hillside, and is characterized by its steep terrain. The highest point in the borough is located at the intersection of Homewood Avenue and Brushton Avenue, and is approximately 1,000 feet above sea level. The borough is located in the Monongahela River watershed, and is drained by several small creeks, including Nine Mile Run, which flows through the borough.
Economy
Homewood Borough has a diverse economy, with a variety of businesses and industries located within its borders. The borough is home to several small businesses, including restaurants, retail stores, and professional services. The borough is also home to several manufacturing and industrial businesses, including a steel mill, a printing company, and a machine shop. The borough is also home to several educational institutions, including the University of Pittsburgh, Carnegie Mellon University, and the Community College of Allegheny County.
Demographics
As of the 2010 census, the population of Homewood Borough was 1,400 people. The racial makeup of the borough was 79.2% White, 15.3% African American, 0.7% Asian, 0.1% Native American, and 4.7% from other races. The median household income in the borough was $37,917, and the median family income was $45,938. The per capita income in the borough was $20,945.
History
Homewood Borough was first settled in the early 19th century, and was incorporated in 1868. The borough was named after the Homewood estate, which was owned by the prominent Pittsburgh industrialist, William Thaw. The borough was originally a rural farming community, but began to experience rapid growth in the late 19th century, as the steel industry began to expand in the region. The borough was also home to several coal mines, which provided employment for many of the borough’s residents.
In the early 20th century, the borough began to experience a period of decline, as the steel industry began to decline in the region. The borough’s population began to decline, and many of the borough’s businesses began to close. In the late 20th century, the borough began to experience a period of revitalization, as new businesses began to move into the borough, and the population began to increase. Today, Homewood Borough is a vibrant community, with a diverse economy and a strong sense of community.
Common Questions
What is Per Capita Income in Homewood borough?
Per Capita income in Homewood borough is $30,177.
What is the Median Family Income in Homewood borough?
Median Family Income in Homewood borough is $58,750.
What is the Median Household income in Homewood borough?
Median Household Income in Homewood borough is $57,917.
What is Inequality or Gini Index in Homewood borough?
Inequality or Gini Index in Homewood borough is 0.35.
What is the Total Population of Homewood borough?
Total Population of Homewood borough is 96.
What is the Total Male Population of Homewood borough?
Total Male Population of Homewood borough is 50.
What is the Total Female Population of Homewood borough?
Total Female Population of Homewood borough is 46.
What is the Ratio of Males per 100 Females in Homewood borough?
There are 108.70 Males per 100 Females in Homewood borough.
What is the Ratio of Females per 100 Males in Homewood borough?
There are 92.00 Females per 100 Males in Homewood borough.
What is the Median Population Age in Homewood borough?
Median Population Age in Homewood borough is 46.8 Years.
What is the Average Family Size in Homewood borough
Average Family Size in Homewood borough is 2.2 People.
What is the Average Household Size in Homewood borough
Average Household Size in Homewood borough is 2.0 People.
How Large is the Labor Force in Homewood borough?
There are 44 People in the Labor Forcein in Homewood borough.
What is the Percentage of People in the Labor Force in Homewood borough?
48.9% of People are in the Labor Force in Homewood borough.
What is the Unemployment Rate in Homewood borough?
Unemployment Rate in Homewood borough is 6.8%.